Key Economic Indicators - Treasury
95
PROTECTED Latest data Value General Trend Real GDP Jun-qtr n 445.8 $b 1.7 -7.0 -6.3 Contracting Nominal GDP Jun-qtr n 468.4 $b 3.3 -7.6 -5.9 Contracting Household Consumption Real household consumption Jun-qtr n 233.5 $b 0.9 -12.1 -12.7 Weak Real retail sales Jun-qtr 78 $b 1.9 -3.4 -2.4 Weak Nominal retail sales Jun-mth 29.8 $b 3.9 2.7 8.5 Increasing Motor vehicle sales (VFACTS, original) Jul-mth 72,505 -1.3 -34.2 -12.8 Declining ANZ-Roy Morgan Weekly Consumer Confidence 30-Aug n 90.2 113.6*# -2.5^^ -24.2^^ Weak Westpac-MI Consumer Sentiment (index) Aug-mth 79.5 99.5* -8.4^^ -20.4^^ Weak Household saving ratio (per cent) Jun-qtr n 19.8 6.7* 13.8^ 17.3^ Increasing Dwelling investment Real dwelling investment Jun-qtr n 23.2 $b 0.8 -6.8 -11.2 Declining Dwelling finance (number owner occupier loans ex. refinancing) Jun-mth 25,105 0.4 7.1 -2.3 Weak Building approvals (number) Jul-mth n 13,840 -1.1 12.0 6.3 Subdued CoreLogic RP Data Daily Hedonic Home Value Index Aug-mth n n/a 3.0 -0.5 6.3 Declining Business investment Real new business investment Jun-qtr n 53.8 $b 0.6 -3.5 -5.5 Declining Capital Expenditure Survey Jun-qtr n 26.1 $b -0.8 -5.9 -11.5 Declining Nominal corporate GOS (profits) Jun-qtr n 147 $b 5.1 11.1 12.7 Increasing Construction Work Done Jun-qtr n 50.1 $b -0.0 -0.7 -2.2 Declining NAB Business Survey - Conditions (net balance) Jul-mth +0 +4* +8^^ -4^^ Weak NAB Business Survey - Confidence (net balance) Jul-mth -14 +3* -14 -18^^ Weak AIG Performance of Business Index Jul-mth 44.7 n/a 11.1^^ n/a Contracting Public final demand (new) Jun-qtr n 123.2 $b 3.1 2.0 6.1 Increasing Balance of Payments and External Sector Exports volumes Jun-qtr n 95.7 $b 3.1 -6.7 -10.6 Decreasing Import volumes Jun-qtr n 80.0 $b 0.4 -12.9 -19.1 Decreasing Trade balance Jun-mth 8202 $m 549.1* 861.0^^ 360.0^^ Surplus Current account balance (% of GDP) Jun-qtr n 3.8 -2.6* 2.0^ 2.9^ Surplus Terms of trade (index) Jun-qtr n 107.1 105.3* 0.2 -1.8 Increasing Prices Headline Consumer Price Index Jun-qtr 114.4 1.8 -1.9 -0.3 Weak Trimmed mean - Consumer Price Index Jun-qtr 117.1 2.0 -0.1 1.2 Weak GDP deflator (index) Jun-qtr n 105.1 1.5 -0.6 0.3 Weak Wages Wage Price Index (index) Jun-qtr 134.4 2.6 0.2 1.8 Weak Average Weekly Earnings (AWE series, bi-annual) May-20 $1,304.7 2.9 3.8 5.4 Increasing Labour Market Employment (LFS, number) Jul-mth 12.5m 1.2 0.9 -3.2 Weak Unemployment rate (%) Jul-mth 7.5 5.6* 0.0^ 2.2^ Increasing Participation rate (%) Jul-mth 64.7 65.2* 0.6^ -1.4^ Weak Productivity: GVA per hour worked, mkt sector (index) Jun-qtr n 107.3 2.2 5.9 7.3 Increasing ANZ Job Ads (number) Jul-mth 104,916 -4.4 16.7 -34.0 Weak Interest rates Cash Rate Target (%) Sep-mth n 0.25 2.30* 0.00^ -0.75^ Historic low Standard Variable Housing Rate - Owner occupied (%) Jul-mth 4.52 5.92* 0.00^ -0.42^ Low Standard Variable Housing Rate - Investor (%) Jul-mth 5.10 n/a† 0.00^ -0.42 Low Small Business Variable Rate, residential-secured, term (%) Jul-mth 5.03 7.07* 0.00^ -1.17^ Low * 10-yr average value ** 10-yr average share of growth n New release (past week) ~ Preliminary ratio based on previous quarter's GDP ^ Percentage point difference † Data only goes back to August 2015 # Monthly average due to frequency of historical series ^^ Level difference ABS reference year is 2017-18. 10-yr average annual growth (%) Change from previous period (%) Change from previous year (%) Key Economic Indicators Macroeconomic Conditions Division PROTECTED
Transcript of Key Economic Indicators - Treasury

PROTECTED
Latest
data Value General Trend
Real GDP Jun-qtr n 445.8 $b 1.7 -7.0 -6.3 Contracting
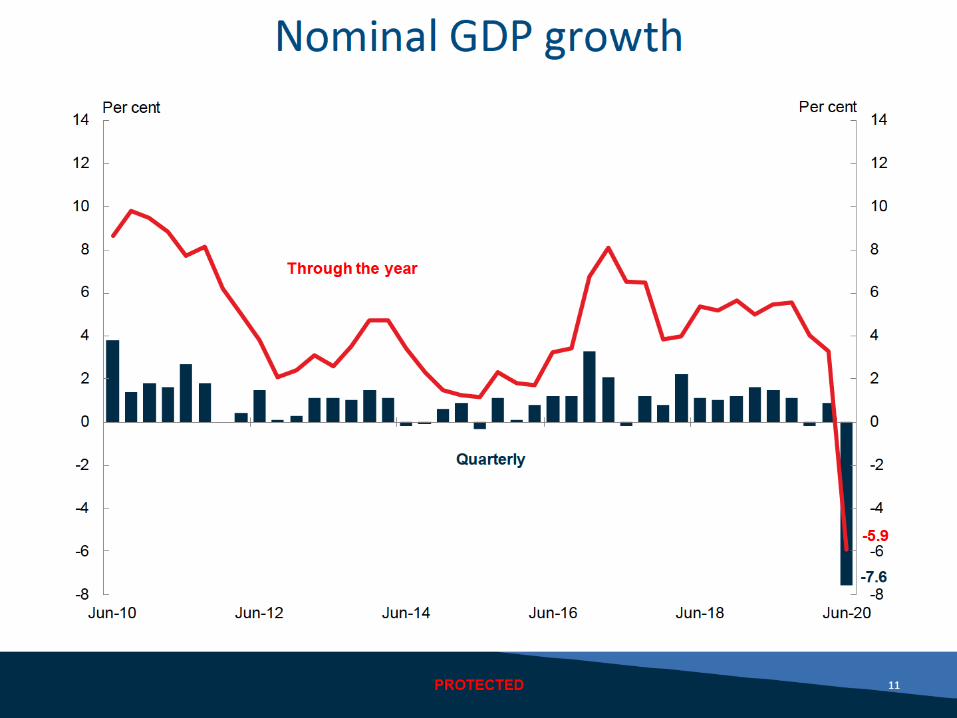
Nominal GDP Jun-qtr n 468.4 $b 3.3 -7.6 -5.9 Contracting
Household Consumption
Real household consumption Jun-qtr n 233.5 $b 0.9 -12.1 -12.7 Weak
Real retail sales Jun-qtr 78 $b 1.9 -3.4 -2.4 Weak
Nominal retail sales Jun-mth 29.8 $b 3.9 2.7 8.5 Increasing
Motor vehicle sales (VFACTS, original) Jul-mth 72,505 -1.3 -34.2 -12.8 Declining
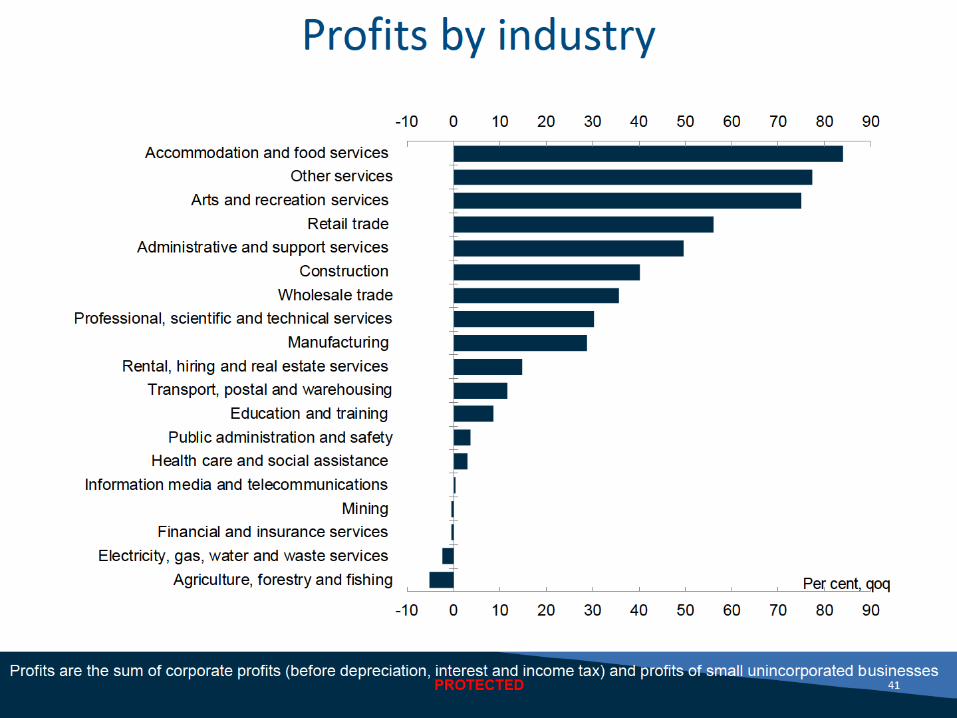
ANZ-Roy Morgan Weekly Consumer Confidence 30-Aug n 90.2 113.6*# -2.5^^ -24.2^^ Weak
Westpac-MI Consumer Sentiment (index) Aug-mth 79.5 99.5* -8.4^^ -20.4^^ Weak
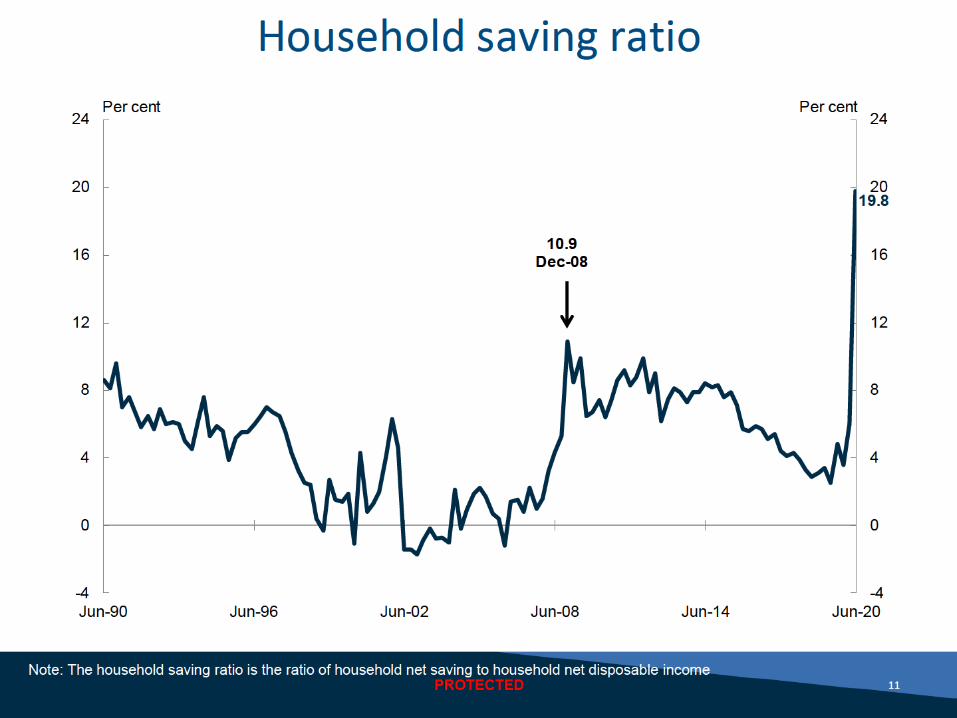
Household saving ratio (per cent) Jun-qtr n 19.8 6.7* 13.8^ 17.3^ Increasing
Dwelling investment
Real dwelling investment Jun-qtr n 23.2 $b 0.8 -6.8 -11.2 Declining
Dwelling finance (number owner occupier loans ex. refinancing) Jun-mth 25,105 0.4 7.1 -2.3 Weak
Building approvals (number) Jul-mth n 13,840 -1.1 12.0 6.3 Subdued
CoreLogic RP Data Daily Hedonic Home Value Index Aug-mth n n/a 3.0 -0.5 6.3 Declining
Business investment
Real new business investment Jun-qtr n 53.8 $b 0.6 -3.5 -5.5 Declining
Capital Expenditure Survey Jun-qtr n 26.1 $b -0.8 -5.9 -11.5 Declining
Nominal corporate GOS (profits) Jun-qtr n 147 $b 5.1 11.1 12.7 Increasing
Construction Work Done Jun-qtr n 50.1 $b -0.0 -0.7 -2.2 Declining
NAB Business Survey - Conditions (net balance) Jul-mth +0 +4* +8^^ -4^^ Weak
NAB Business Survey - Confidence (net balance) Jul-mth -14 +3* -14 -18^^ Weak
AIG Performance of Business Index Jul-mth 44.7 n/a 11.1^^ n/a Contracting
Public final demand (new) Jun-qtr n 123.2 $b 3.1 2.0 6.1 Increasing
Balance of Payments and External Sector
Exports volumes Jun-qtr n 95.7 $b 3.1 -6.7 -10.6 Decreasing
Import volumes Jun-qtr n 80.0 $b 0.4 -12.9 -19.1 Decreasing
Trade balance Jun-mth 8202 $m 549.1* 861.0^^ 360.0^^ Surplus
Current account balance (% of GDP) Jun-qtr n 3.8 -2.6* 2.0^ 2.9^ Surplus
Terms of trade (index) Jun-qtr n 107.1 105.3* 0.2 -1.8 Increasing
Prices
Headline Consumer Price Index Jun-qtr 114.4 1.8 -1.9 -0.3 Weak
Trimmed mean - Consumer Price Index Jun-qtr 117.1 2.0 -0.1 1.2 Weak
GDP deflator (index) Jun-qtr n 105.1 1.5 -0.6 0.3 Weak
Wages
Wage Price Index (index) Jun-qtr 134.4 2.6 0.2 1.8 Weak
Average Weekly Earnings (AWE series, bi-annual) May-20 $1,304.7 2.9 3.8 5.4 Increasing
Labour Market
Employment (LFS, number) Jul-mth 12.5m 1.2 0.9 -3.2 Weak
Unemployment rate (%) Jul-mth 7.5 5.6* 0.0^ 2.2^ Increasing
Participation rate (%) Jul-mth 64.7 65.2* 0.6^ -1.4^ Weak
Productivity: GVA per hour worked, mkt sector (index) Jun-qtr n 107.3 2.2 5.9 7.3 Increasing
ANZ Job Ads (number) Jul-mth 104,916 -4.4 16.7 -34.0 Weak
Interest rates
Cash Rate Target (%) Sep-mth n 0.25 2.30* 0.00^ -0.75^ Historic low
Standard Variable Housing Rate - Owner occupied (%) Jul-mth 4.52 5.92* 0.00^ -0.42^ Low
Standard Variable Housing Rate - Investor (%) Jul-mth 5.10 n/a† 0.00^ -0.42 Low
Small Business Variable Rate, residential-secured, term (%) Jul-mth 5.03 7.07* 0.00^ -1.17^ Low
* 10-yr average value ** 10-yr average share of growth n New release (past week)
~ Preliminary ratio based on previous quarter's GDP Percentage point difference † Data only goes back to August 2015
# Monthly average due to frequency of historical series ^ Level difference ABS reference year is 2017-18.
10-yr average
annual
growth (%)
Change from
previous
period (%)
Change from
previous
year (%)
Key Economic Indicators
Macroeconomic Conditions Division
PROTECTED
HYE
Text Box
FOI 2779 Document 1

PROTECTED
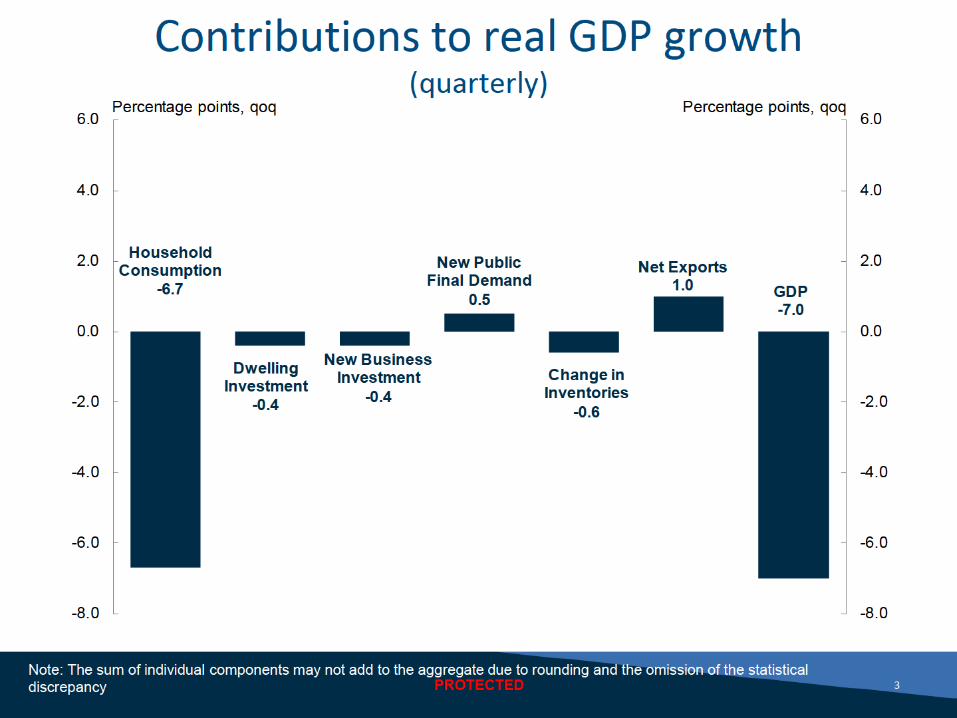
Public final demand - June 2020 quarter
cvm, sa QoQ TTY 2019-20 *
Contribution to
new public final
demand growth
(quarterly)
Contr bution to
new public final
demand growth
(TTY)
Contribution to
new public final
demand growth
*
Final consumption expenditure 2.9 7.5 6.6 2.3 6.0 5.3
National 1.3 8.6 9.8 0.5 2.9 3.3
State and Local 4.2 6.8 4.3 1.9 3.1 2.0
New public gross fixed capital
formation -1.8 0.4 1.8 -0.4 0.1 0.4
National -7.7 -13.3 -2.1 -0.4 -0.8 -0.1
State and Local 0.4 6.4 3.4 0.1 0.9 0.5
New public final demand 2.0 6.1 5.6 2.0 6.1 5.6
National 0.1 5.2 7.9 0.0 2.1 3.1
State and Local 3.3 6.7 4.1 1.9 4.0 2.5
* Year-average growth calculated using original data
PROTECTED
HYE
Text Box
FOI 2779 Document 2

PROTECTED
Growth in components of state final demand (per cent, qoq) - June 2020 quarter
Public Consumption Household Consumption Private Investment Public Investment State Final Demand
New South Wales 2.9 -13.3 -7.8 0.0 -8.6
Victoria 1.6 -13.7 -7.3 9.9 -8.5
Queensland 4.6 -9.6 -7.6 -4.0 -5.9
South Australia 0.9 -9.9 -3.1 3.0 -5.8
Western Australia 3.5 -10.6 -4.2 -1.7 -6.0
Tasmania 3.1 -12.5 -3.3 -8.4 -7.4
Northern Territory -0.3 -7.5 -6.2 -9.3 -4.9
Australian Capital Territory 4.4 -11.6 2.7 -5.0 -2.2
Growth in components of state final demand (per cent, tty) - June 2020 quarter
Public Consumption Household Consumption Private Investment Public Investment State Final Demand
New South Wales 10.0 -14.3 -13.0 1.5 -9.1
Victoria 5.5 -14.4 -5.9 3.8 -8.3
Queensland 7.2 -9.3 -8.3 0.4 -5.2
South Australia 3.0 -11.3 -6.9 7.7 -6.7
Western Australia 7.8 -11.0 0.8 4.7 -4.0
Tasmania 7.4 -12.2 -6.4 -9.4 -6.8
Northern Territory 2.5 -7.7 -14.7 -23.3 -6.3
Australian Capital Territory 10.9 -10.9 10.4 1.7 2.0
Growth in components of state final demand (per cent, year average) - 2019-20 *
Public Consumption Household Consumption Private Investment Public Investment State Final Demand
New South Wales 8.6 -3.4 -7.5 3.2 -1.8
Victoria 6.8 -2.9 -2.8 1.8 -1.0
Queensland 6.2 -1.2 -5.7 6.9 -0.1
South Australia 2.6 -2.8 -3.0 -1.8 -1.6
Western Australia 5.2 -2.0 4.8 3.2 1.1
Tasmania 7.1 -2.0 -1.9 -4.0 -0.1
Northern Territory 3.9 -3.3 -20.4 -14.7 -4.5
Australian Capital Territory 6.4 -2.0 8.6 -0.9 3.0
* Year-average growth calculated using original data
PROTECTED
HYE
Text Box
FOI 2779 Document 3

PROTECTED
Acronyms Term Simple definitionJun-20 Qtr
on Qtr
Through
the year to
Jun-20
AENAAverage earnings on a
national accounts basis
A measure of wage growth. Total compensation of employees divided by
wage and salary earners. Does not include self-employed.3.1 4.6
5.4
(May-20)
4.8(May-20)
COECompensation of
employees
Sum of total remuneration paid to employees. Accounts for both
employment and wage changes.-2.5 0.4
CPI Consumer Price Index Measures price level based on a basket of goods and services -1.9 -0.3
DFD Domestic final demand Sum of household consumption, investment and government spending -7.4 -7.0
GDI Gross disposable income All after-tax income available to households to spend or save 2.2 6.4
GDP Gross domestic product See nominal GDP and real GDP
GFCFGross fixed capital
formation
Another term for investment - includes dwelling, business and public
investment-4.9 -5.5
GMI Gross mixed income Profits of small unincorporated businesses 21.9 19.6
GNEGross national
expenditure
Total expenditure by Australian residents on final goods and services.
Includes imports but excludes exports.-8.0 -7.7
GNI Gross national income Total income earned by Australian factors of production (labour and capital) -7.0 -4.3
GOS Gross operating surplus All sectors profits before depreciation, interest and tax 8.2 9.9
GVA Gross value addedValue of goods and services sales by industry less cost of non-wage inputs
used to produce them-6.5 -5.7
HFCEHousehold final
consumption expenditureEveryday spending by households on goods and services -12.1 -12.7
4.2
(May-20)
Nominal
GDP
Nominal gross domestic
product
Total dollar value of goods and services produced, equal to real GDP times
prices-7.6 -5.9
Real GDPReal gross domestic
productTotal volume of output in an economy, adjusts GDP for prices -7.0 -6.3
Real GDIReal gross domestic
incomeAdjusts real GDP for the terms of trade -7.0 -6.7
Real GNIReal gross national
incomeAdjusts real GDI for net income payable overseas -6.2 -5.1
Real NNDIReal net national
disposable incomeAdjusts real GNI for depreciation -7.8 -6.9
SFD State Final DemandTotal value of goods and services sold in a state. It includes consumption,
investment and government expenditure. It does not include exports.- -
Two or more consecutive quarters of negative economic growth
TFI Total factor income Gross payments to factors of production (labour and capital) 3.8 5.8
ToT Terms of trade Ratio of export prices to import prices 0.2 -1.8
-0.1 1.2
0.2 1.8
(Jun-20) (Jun-20)WPI
MTAWEMale total average
weekly earnings
(Jun-20)
Measures increases in general price level, removing effect of one-off or
volatile price movementsUnderlying inflation
NID Net income deficit-1.2 per cent of GDP
(Jun-20)
Technical recession -
Regular wages and salaries for male employee jobs -
Measures wage inflation. Measures wage growth for a fixed basket of jobs.Wage Price Index
Net income flows between Australia and the rest of the world
(trimmed mean)
CAD/CASCurrent account
deficit/surplus
Records trade flows, transfer payments and income flows between Australia
and the rest of the world (Jun-20)
-
+ 3.8 per cent of GDP
AWE
AWOTEAverage weekly ordinary
time earningsEarnings of full-time workers in standard hours of work. Excludes overtime. -
-Regular wages and salaries for employee jobsAverage weekly earnings
PROTECTED
HYE
Text Box
FOi 2779 Document 4

1
OFFICIAL
OFFICIAL
National Accounts – Key concepts, definitions and acronyms
Concepts
Gross domestic product (GDP)
Gross domestic product (GDP) measures the goods and services produced in Australia.
There are three ways of measuring GDP: an expenditure approach, an income approach and a
production approach. If measured accurately, each method should produce the same value of GDP.
In practice, differences show up as statistical discrepancies in the National Accounts.
The headline GDP measure, GDP(A), is the average of the three approaches.
Real versus Nominal
Real (chain volume) GDP is the volume of goods and services produced in Australia. Movements in
real GDP reflect changes in the quantity of Australia’s output, not price changes.
Nominal (current price) GDP is the dollar value of goods and services produced in Australia.
Movements in nominal GDP reflect changes in both the volume and price of Australia’s output.
GDP deflator is a measure of the price of Australia’s output where the relationship is:
Growth rates
Through-the-year growth is how much the GDP level in one quarter has grown compared to the level
in the same quarter in the previous year. For example, through-the-year growth to the June quarter
2020 refers to how much higher this quarter’s GDP level is compared to the June quarter 2019.
Year-average growth is the sum of the quarterly GDP levels across one year (e.g. 2019-20), relative to
the sum of the quarterly GDP levels across the previous year (e.g. 2018-19).
Contributions to growth show how a component has contributed to growth in an aggregate. The
contribution to growth depends on both the component’s relative size and growth in the period. For
example, the percentage point contribution of household consumption to aggregate GDP growth.
Seasonal adjustment
Seasonal adjustment is where raw or original data is adjusted to remove seasonal patterns in
variables. This makes it easier to identify underlying changes that can be obscured by regular seasonal
movements in the data. Treasury usually reports the main outcomes from the National Accounts as
seasonally-adjusted data.
Nominal GDP = GDP deflator x Real GDP
value price volume
HYE
Text Box
FOI 2779 Document 5

2
OFFICIAL
OFFICIAL
Definitions
Gross Domestic Product (GDP)
Gross domestic product (GDP)
Gross domestic product (GDP) measures the goods and services produced in Australia. There are three ways of measuring GDP: an expenditure approach, an income approach and a production approach. If measured accurately, each method should produce the same value of GDP. In practice, differences show up as statistical discrepancies in the National Accounts.
GDP Average GDP(A)
The headline GDP measure, GDP(A), is the average of the three approaches.
Statistical discrepancy
The statistical discrepancy is the difference between GDP(A) and each measurement approach.
Gross Domestic Product – Expenditure measure
Expenditure measure of GDP GDP(E)
Expenditure measure of GDP (GDP(E)) is the expenditure on all goods and services produced. GDP(E) = Household consumption + Investment + Government expenditure + Exports – Imports + changes in inventories
Household consumption
Household consumption, officially called Household Final Consumption Expenditure (HFCE), is the everyday spending by households on goods and services. Household consumption is separated into 17 main categories such as food, clothing, rent, electricity and gas, motor vehicles, health, education and recreation. These main categories can then also be grouped under essential and discretionary spending.
Investment or Gross fixed capital formation
Investment, officially called gross fixed capital formation, includes dwelling investment and business investment.
Dwelling investment
Dwelling investment measures private residential building activity. Around two thirds of total dwelling investment is comprised of the construction of new dwellings. Alterations and additions account for the remaining one third of investment activity.
New business investment
New business investment is the acquisition of new assets to aid in the production of goods and services in future periods. It includes investment in commercial buildings, engineering construction, machinery and equipment, intellectual property, and cultivated biological resources. New business investment includes only new activity, so it excludes businesses’ exchanges of existing assets with other sectors, such as the public sector.
Ownership transfer costs
Ownership transfer costs is a component of investment that isn’t referred to often. It consists of stamp duty, conveyancing costs and other costs associated with transferring ownership of an asset such as a house.
Government expenditure or Public final demand
Government expenditure, officially called new public final demand, measures government consumption and investment for all levels of government. This includes expenditure on wages, office supplies, health and social services assistance, defence and IT. It also includes spending by public corporations. New public final demand includes only new activity, so it excludes government’s exchanges of existing assets with the private sector.
Net exports Net exports is the value of exports to other countries minus the value of imports into Australia from other countries.
Changes in inventories
Changes in inventories captures the change in the stock of goods produced or purchased for re-sale, but which have not yet been sold.

3
OFFICIAL
OFFICIAL
Domestic final demand
The sum of household consumption, investment and government expenditure.
Gross national expenditure
The total expenditure within a given period by Australian residents on final goods and services. It is equal to domestic final demand plus changes in inventories. It includes expenditure on imports but excludes exports.
Gross Domestic Product – Income measure
Income measure of GDP GDP(I)
Income measure of GDP (GDP(I)) is the value of income generated from Australia’s production. The income measure of GDP is usually presented in nominal terms, as opposed to real. GDP(I) = Compensation of employees (COE) + Gross operating surplus (GOS) + Gross mixed income (GMI) + (Taxes – Subsidies on production and imports)
Compensation of employees (COE)
Compensation of employees (COE) is the wages, salaries, bonuses and other remuneration paid to employees. This differs to wage measures, such as the Wage Price Index, as it accounts for changes in employment and wages.
Gross operating surplus (GOS)
Gross operating surplus (GOS) is corporate profits before depreciation, interest and income tax.
Gross mixed income (GMI)
Gross mixed income (GMI) is the profits of small unincorporated businesses - it is a mix of profits and wages given the owners of the firm are also its employees.
Taxes less subsidies on production and imports
Taxes less subsidies on production and imports is government revenue from indirect taxes (such as GST) minus expenditure on industry assistance measures (such as for manufacturing).
Gross Domestic Product – Production measure
Production measure of GDP GDP(P)
Production measure of GDP (GDP(P)) is the production of all goods and services in Australia. GDP(P) = Gross value added for all industries + (Taxes – Subsidies on products)
Gross value added (GVA)
Gross value added (GVA) is the value of goods and services sales by an industry less the cost of any non-wage inputs (materials and supplies) used to produce those goods and services (these are known as intermediate inputs).
Taxes less subsidies on products
Taxes on products include taxes on goods and services (e.g. sales tax), excises, taxes on international trade, taxes on gambling, etc. Subsidies on products are payments by government to producers.
Market sector GVA Market sector GVA is a subset of aggregate GVA that aims to identify primarily private sector goods and services for which there is a market. It is calculated as total GVA less certain public sector industries such as public administration, education and health as well as ownership of dwellings which is largely modelled.
Labour Productivity Labour productivity is the ratio of economic output per unit of labour. The unit of labour can be hours worked or number of employed persons.

4
OFFICIAL
OFFICIAL
Alternative measures of income
Average compensation of employees (AENA)
Average compensation of employees (AENA) is the national accounts measure of wages. It is calculated as compensation of employees divided by wage and salary earning employees. This is different to Labour Force employees which also includes self-employed persons.
Household gross disposable income
Household gross disposable income is all after-tax income available to households to spend or save. It includes income earned from production as well as income earned from interest, dividends and social assistances benefits (such as pensions and unemployment benefits).
Household saving ratio
The household saving ratio is the ratio of household net saving to household net disposable income.
Household net saving is gross disposable income less household consumption and depreciation. Household net disposable income is household gross disposable income less the depreciation of assets.
Gross national income (GNI)
Gross national income (GNI) measures the amount of nominal income that Australian residents get from production. It also includes net incomes payable overseas (e.g. dividends paid to foreign companies).
Real gross domestic income (Real GDI)
Real gross domestic income (Real GDI) measures the purchasing power of the total incomes generated by domestic production. It is a measure of real GDP adjusted for the effect on real incomes of changes in Australia's terms of trade.
Real gross national income (Real GNI)
Real gross national income (Real GNI) is like real GDI but also accounts for net incomes payable overseas (e.g. dividends paid to foreign companies). It measures the amount of real income that Australian residents get from production.
Real net national disposable income (Real NNDI)
Real net national disposable income (Real NNDI) is like real GNI but also accounts for income lost to capital depreciation and net transfers of income overseas (e.g. foreign aid). It measures the amount of real income in Australia that is available to spend or save.
Measures of living standards
Real GDP per capita Real GDP per capita is the ratio of real GDP to the Australian population. It adjusts growth in real GDP for growth in the population and is considered to be a measure of living standards.
Real gross domestic income per capita
Real gross domestic income (Real GDI) per capita measures the purchasing power of the total incomes generated by domestic production per person. It is a measure of real GDP per capita adjusted for the effect on real incomes of changes in Australia's terms of trade.
Real gross national income per capita
Real gross national income (Real GNI) per capita is like real GDI per capita but also accounts for net incomes payable overseas (e.g. dividends paid to foreign companies). It measures the amount of real income that Australian residents get from production per person.
Real net national disposable income per capita
Real net national disposable income (Real NNDI) per capita is like real GNI per capita but also accounts for income lost to capital depreciation and net transfers of income overseas (e.g. foreign aid). It measures the amount of real income per person in Australia that is available to spend or save.

5
OFFICIAL
OFFICIAL
Prices
Consumer Price Index (CPI)
The Consumer Price Index (CPI) is a measure of inflation. It measures the change in the price of a fixed basket of goods and services, consumed by households in capital cities.
Inflation Inflation is an increase in prices. Typically, prices rise over time, but prices can also fall (deflation).
Underlying inflation Measures of underlying inflation exclude items that have particularly large price changes. This is because large price changes can sometimes be due to one-off factors which are unrelated to broader economic conditions. Common measures of underlying inflation are:
Trimmed mean: The average rate of inflation after ‘trimming’ away the items with the largest price changes (positive or negative). It is the weighted average of the middle 70 per cent of items. Weighted median: Calculated by ordering the basket of goods from slowest to fastest growing, and taking the price growth of the item in the middle.
Wages
Wage Price Index (WPI)
The Wage Price Index (WPI) is a measure of wage inflation. It measures changes in the price employers pay for labour due to market forces. It is not affected by changes in the quality or quantity of work performed. It is measured through a fixed basket of jobs to which employers pay wages and salaries each quarter. The WPI is only published as an index and not as a dollar level.
Average Earnings on a National Accounts basis (AENA)
Average Earnings on a National Accounts basis (AENA) is a measure of wages. It is calculated as compensation of employees divided by wage and salary earning employees. This is different to Labour Force employees which also includes self-employed persons. Unlike the WPI, it is affected by the composition of employment (e.g. AENA will increase if a higher-wage industry attracts workers from a lower-wage industry, even if the wage rates within the industries do not change). It is also affected by changes in average hours worked.
Average Weekly Ordinary Time Earnings (AWOTE)
Average Weekly Ordinary Time Earnings (AWOTE) captures earnings of full-time workers attributable to award, standard or agreed hours of work. It excludes overtime earnings.
Average Weekly Earnings (AWE)
Average Weekly Earnings (AWE) measures the level of average gross weekly earnings of employees. Earnings in AWE are broadly defined as current and regular payments in cash to employees for work done. Similar to AENA, it will be affected by the composition of employment and changes in average hours worked.
Male Total Average Weekly Earnings (MTAWE)
Male Total Average Weekly Earnings (MTAWE) measures the level of average earnings for Males. This is higher than the average for both Males and Females.

6
OFFICIAL
OFFICIAL
Labour Market
Labour Force Survey The Labour Force Survey is a monthly survey that provides data on the labour market characteristics of Australians aged 15 and above, except members of the defence force. Sampling around 25,000 dwellings (approximately 50,000 persons), the survey gathers data on persons who are employed, underemployed, unemployed and not in the labour force. It also collects information on the age, sex, hours worked and the State or Territory these persons live in.
Participation Those who are employed or looking for employment are participating in the labour force. For a given group, the participation rate is the labour force expressed as a share of the civilian population aged 15 years and over.
Employment The Labour Force Survey measure of employment counts the number of employed persons. Note that this is not the number of jobs in the economy since people can hold more than one job. Employed persons, according to the Labour Force Survey, are those aged 15 years and over who worked for one hour or more during the survey reference week. Those employed persons who worked 35 hours or more during the week are employed full-time, while those employed part-time worked between one and 34 hours in the week.
Unemployment Unemployment captures people who are not employed and are available and actively looking for work. The unemployment rate for any group is the number of unemployed persons expressed as a percentage of the labour force for that group.
Underemployment Employed persons aged 15 years and over who want, and are available for, more hours of work than they currently have.
Labour productivity Labour productivity is the ratio of economic output per unit of labour. The unit of labour can be hours worked or number of employed persons.
Hours worked The hours worked by all employed persons.
External Account
Terms of trade (ToT)
The terms of trade reflects the relative price of exports compared to imports. It is calculated as export prices divided by import prices.
Current account balance
The current account balance equals the sum of the trade balance, the net income balance and net current transfers (such as debt forgiveness and foreign aid).
Trade balance The trade balance, also known as net exports, is the value of exports to other countries minus the value of imports into Australia from other countries.
Net income balance
The value of payments to non-residents less income from non-residents. It is largely comprised of investment income and also includes compensation of employees paid to foreigners.

7
OFFICIAL
OFFICIAL
Acronyms AENA Average earnings on a national accounts basis
AWOTE Average weekly ordinary time earnings
AWE Average weekly earnings
CAD Current account deficit
COE Compensation of employees
CPI Consumer Price Index
DFD Domestic final demand
GDI Gross disposable income
GDP Gross domestic product
GFCF Gross fixed capital formation
GMI Gross mixed income
GNE Gross national expenditure
GNI Gross national income
GOS Gross operating surplus
GVA Gross value added
HFCE Household final consumption expenditure
MTAWE Male total average weekly earnings
NID Net income deficit
Real GDI Real gross domestic income
Real GNI Real gross national income
Real NNDI Real net national disposable income
ToT Terms of trade
WPI Wage Price Index

PROTECTED
June quarter 2020 Through the year 2019-20
Real GDP -7.0 -6.3 -0.2
Nominal GDP -7.6 -5.9 1.7
June quarter 2020 Through the year 2019-20
Household final consumption (51%) -12.1 -12.7 -2.6
Dwelling investment (5%) -6.8 -11.2 -8.8
New business investment (12%) -3.5 -5.5 -1.8
New public final demand (27%) 2.0 6.1 5.6
Domestic Final Demand -7.4 -7.0 -0.8
Gross National Expenditure -8.0 -7.7 -1.2
Net exports
Exports (23%) -6.7 -10.6 -1.6
Imports (18%) -12.9 -19.1 -7.1
Real GDP -7.0 -6.3 -0.2
June quarter 2020 Through the year 2019-20
Labour productivity (market sector) 5.9 7.3 2.4
Terms of Trade 0.2 -1.8 1.0
June quarter 2020 Through the year 2019-20
Compensation of Employees (50%) -2.5 0.4 3.7
Gross Operating Surplus (41%) 8.2 9.9 6.5
Gross Mixed Income (10%) 21.9 19.6 2.3
Total Factor Income (101%) 3.8 5.8 4.6
Taxes less subsidies (-1%) -111.9 -112.1 -26.1
Nominal GDP -7.6 -5.9 1.7
GDP deflator -0.6 0.3 1.9
June quarter 2020 Through the year 2019-20
Real GDP -7.0 -6.3 -0.2
The volume of goods and services produced in Australia
Real GDP per capita -7.2 -7.4 -1.6The ratio of real GDP to the Australian population
Real Gross Domestic Income -7.0 -6.7 0.0
Real GDP adjusted for the real effect of changes in the terms of trade
Real Gross National Income -6.2 -5.1 1.2
Real gross domestic income adjusted for net incomes payable overseas
Real Net National Disposable Income -7.8 -6.9 0.8Real gross national income adjusted for capital depreciation
Real Net National Disposable Income Per Capita -8.0 -8.0 -0.5
Real Net Household Disposable Income 3.1 6.2 3.5
Real Net Household Disposable Income Per Capita 2.9 4.9 2.2
Household saving ratio (level) 19.8 NA 8.8
The ratio of household net saving to household net disposable income
June quarter 2020 Through the year 2019-20
Mining (11%) 0.2 1.1 4.6
Agriculture (2%) -1.9 -6.3 -6.6
Construction (8%) -8.2 -10.3 -4.7
Services (73%) -7.0 -6.0 0.1
Manufacturing (6%) -9.6 -6.1 -1.6
Real GDP -7.0 -6.3 -0.2
June quarter 2020 Through the year 2019-20
New South Wales (31%) -8.6 -9.1 -1.8
Victoria (25%) -8.5 -8.3 -1.0
Queensland (19%) -5.9 -5.2 -0.1
South Australia (6%) -5.8 -6.7 -1.6
Western Australia (11%) -6.0 -4.0 1.1
Tasmania (2%) -7.4 -6.8 -0.1
Northern Territory (1%) -4.9 -6.3 -4.5
Australian Capital Territory (3%) -2.2 2.0 3.0
Domestic Final Demand -7.4 -7.0 -0.8
PRODUCTION GROSS VALUE ADDED
STATE FINAL DEMAND
REAL AND NOMINAL GDP
EXPENDITURE COMPONENTS
PRODUCTIVITY AND THE TERMS OF TRADE
TOTAL FACTOR INCOMES AND NOMINAL GDP
INCOME MEASURES
Quarterly fact sheet
NATIONAL ACCOUNTS - JUNE QUARTER 2020
The ratio of real net national disposable income to the Australian population
The real after-tax income available to households to spend or save, net of depreciation
The ratio of real net household disposable income to the Australian population
PROTECTED
HYE
Text Box
FOI 2779 Document 6

HYE
Text Box
FOI 2779 Document 7

PROTECTED
JEFU and RBA forecasts
Table 1. 2020 JEFU and RBA forecast comparison(a)2019-20
Outcome JEFU RBA SMP JEFU RBA SMP
Real GDP -0.2 - 1/4 0 -2 1/2 -3
Employment(b) -4.3 -4.4 -4.4 1 0
Unemployment rate(b) 7.0 7.0 7.0 8 3/4 9
Consumer price index -0.3 - 1/4 -0.3 1 1/4 3
Wage price index 1.8 1 3/4 1 3/4 1 1/4 1 1/4
(b) 2019-20 is an outcome as at JEFU publication date.
Source: ABS cat. no.5206.0, 6202.0, 6345.0, 6401.0, RBA August 2020 SMP and Treasury.
Table 2. Major Economic Parameters – 2020 JEFU(a)
2018-19 2019-20 2019-20 2020-21
Real GDP 2.0 -0.2 - 1/4 -2 1/2
Employment(b) 2.5 -4.3 -4.4 1
Unemployment rate(b) 5.2 7.0 7.0 8 3/4
Consumer price index 1.6 -0.3 - 1/4 1 1/4
Wage price index 2.3 1.8 1 3/4 1 1/4
Nominal GDP 5.3 1.7 2 -4 3/4
(b) 2019-20 is an outcome as at JEFU publication date.
Source: ABS cat. no. 5206.0, 6202.0, 6345.0, 6401.0 and Treasury.
Table 3. International GDP growth forecasts – 2020 JEFU(a)Outcome
2019 2020 2021
China 6.1 1 3/4 8 1/4
India 4.9 -4 4 1/4
Japan 0.7 -6 1/4 2 3/4
United States 2.3 -8 4 3/4
Euro area 1.2 -8 3/4 5
Other East Asia (b) 3.6 -3 1/4 3 1/2
Major trading partners 3.6 -3 5 1/2
World 2.9 -4 3/4 5
2019-20 2020-21
(a) Percentage change on preceding year unless otherwise stated. The consumer price index, employment, and the
wage price index are through-the-year growth to the June quarter. The unemployment rate is the rate for the June quarter.
(a) Percentage change on preceding year unless otherwise stated. The consumer price index, employment, and the
wage price index are through-the-year growth to the June quarter. The unemployment rate is the rate for the June quarter.
(a) World and Other East Asia growth rates are calculated using GDP weights based on purchasing power
parity (PPP), while growth rates for major trading partners are calculated using goods and services export
trade weights.
(b) Other East Asia comprises the Association of Southeast Asian Nations group of five (ASEAN‑5),
comprising Indonesia, Malaysia, the Philippines, Thailand and Vietnam, along with Hong Kong, South
Korea, Singapore and Taiwan.
Source: National statistical agencies, Refinitiv and Treasury.
Forecasts
ForecastsOutcomes
PROTECTED
HYE
Text Box
FOI 2779 Document 8

PROTECTED
Table 4. Domestic economic forecasts – 2020 JEFU(a)
2018-19 2019-20 2019-20 2020-21
JEFU JEFU
Real gross domestic product 2.0 -0.2 - 1/4 -2 1/2
Household consumption 2.0 -2.6 -2 1/2 -1 1/4
Dwelling investment 0.0 -8.8 -10 -16
Total business investment(c) -0.9 -1.8 -6 -12 1/2
By industry
Mining investment -9.4 4.8 4 9 1/2
Non-mining investment 1.7 -3.7 -9 -19 1/2
Private final demand(c) 1.0 -2.9 -3 1/2 -4
Public final demand(c) 4.4 5.6 5 4 1/2
Change in inventories(d) -0.2 -0.4 0 0
Gross national expenditure 1.6 -1.2 -1 1/2 -1 3/4
Exports of goods and services 4.0 -1.6 -1 1/2 -6 1/2
Imports of goods and services 0.3 -7.1 -8 -6
Net exports(d) 0.8 1.1 1 1/4 - 1/4
Nominal gross domestic product 5.3 1.7 2 -4 3/4
Prices and wages
Consumer price index(e) 1.6 -0.3 - 1/4 1 1/4
Wage price index(f) 2.3 1.8 1 3/4 1 1/4
GDP deflator 3.3 1.9 2 1/4 -2 1/4
Labour market
Participation rate (per cent)(g)(i) 66.0 63.4 63.4 64 3/4
Employment(f)(i) 2.5 -4.3 -4.4 1
Unemployment rate (per cent)(g)(i) 5.2 7.0 7.0 8 3/4
Balance of payments
Terms of trade(h) 5.6 1.0 1 3/4 -12 1/4
Current account balance (per cent of GDP) -0.7 1.8 1 3/4 -1 1/4
(c) Excluding second-hand asset sales from the public sector to the private sector.
(a) Percentage change on preceding year unless otherwise indicated.
(b) Calculated using original data unless otherwise indicated.
ForecastsOutcomes(b)
Source: ABS cat. no. 5206.0, 5302.0, 6202.0, 6345.0, 6401.0, unpublished ABS data and Treasury.
(d) Percentage point contribution to growth in GDP.
(e) Through-the-year growth rate to the June quarter.
(f) Seasonally adjusted, through-the-year growth rate to the June quarter.
(g) Seasonally adjusted rate for the June quarter.
Note: The forecasts for the domestic economy are based on several technical assumptions. The exchange
rate is assumed to remain around its recent average level — a trade-weighted index of around 60 and a
$US exchange rate of around 69 US cents. Interest rates are assumed to move broadly in line with market
expectations. World oil prices (Malaysian Tapis) are assumed to remain around US$34 per barrel.
Population growth is assumed to be 1.2 per cent in 2019-20 and 0.6 per cent in 2020-21.
(h) The forecasts are underpinned by price assumptions for key commodities: iron ore spot price assumed
to decline to US$55 per tonne free-on-board (FOB) by the end of the December quarter 2020; metallurgical
coal spot price assumed to remain at US$110 per tonne FOB; and thermal coal spot price assumed to
remain at US$54 per tonne FOB.
(i) 2019-20 is an outcome as at JEFU publication date.
PROTECTED

PROTECTED
Table 5. RBA forecast table – August SMP ‘Baseline’ Scenario(a)
Percentage change over year to quarter shown(b)
Jun-20 Dec-20 Jun-21 Dec-21 Jun-22 Dec-22
Gross domestic product −6 −6 4 5 4 4
Household consumption −11 −7 8 6 5 4
Dwelling investment −14 −14 2 8 2 5
Business investment −12 −17 −5 6 7 9
Public demand 5 3 1 2 3 3
Gross national expenditure −7 −6 5 5 4 4
Imports −18 −12 11 9 9 7
Exports −11 −9 5 8 8 5
Real household disposable income 2 −5 −6 3 6 5
Terms of trade −1 −1 −6 −2 −2 −2
Major trading partner (export-weighted) GDP −5 0 9 5 4 4
Unemployment rate (quarterly, %) 7.0 10 9 8½ 7½ 7
Employment −4.4 −6 0 3 4 3
Wage price index 1¾ 1¼ 1¼ 1¼ 1½ 1¾
Nominal (non-farm) average earnings per hour 5 1½ −3 ¼ 2½ 2½
Trimmed mean inflation 1.2 1 1¼ 1 1¼ 1½
Consumer price index −0.3 1¼ 3 1 1¼ 1½
Table 6. RBA August SMP year average forecasts(a)(b)
2019-20 2020 2020-21 2021 2021-22 2022
GDP growth 0 –4 –3 2 5 4
(previous) (–1) (–5) (–3) 4 6 (n/a)
(b) Rounding varies: GDP growth to the nearest whole number; unemployment rate to the nearest half point; inflation rates to the
nearest quarter point. Shaded regions are historical data. Figures in parentheses show the corresponding baseline scenario forecasts in
the May 2020 Statement.
Sources: ABS; RBA
Year-average
(a) Forecast assumptions: TWI at 61, A$ at US$0.72, Brent crude oil price at US$46/bbl; the cash rate remains at its current level and
other elements of the Bank's monetary stimulus package, including the 0.25 per cent target for the 3-year Australian Government bond
yield, are assumed to remain unchanged. Shaded regions are historical data.
(b) Rounding varies: economic activity variables and employment rounded to the nearest whole number; unemployment rate to the
nearest half point; wages and prices variables to the nearest quarter point.
Sources: ABS; CEIC Data; Consensus Economics; Refinitiv; RBA
(a) Forecast assumptions (May Statement in parenthesis): TWI at 61 (57), A$ at US$0.72 (US$0.64), Brent crude oil price at US$46/bbl
(US$35/bbl); the cash rate remains at its current level and other elements of the Bank's monetary stimulus package, including the 0.25
per cent target for the 3-year Australian Government bond yield, are assumed to remain unchanged.
PROTECTED


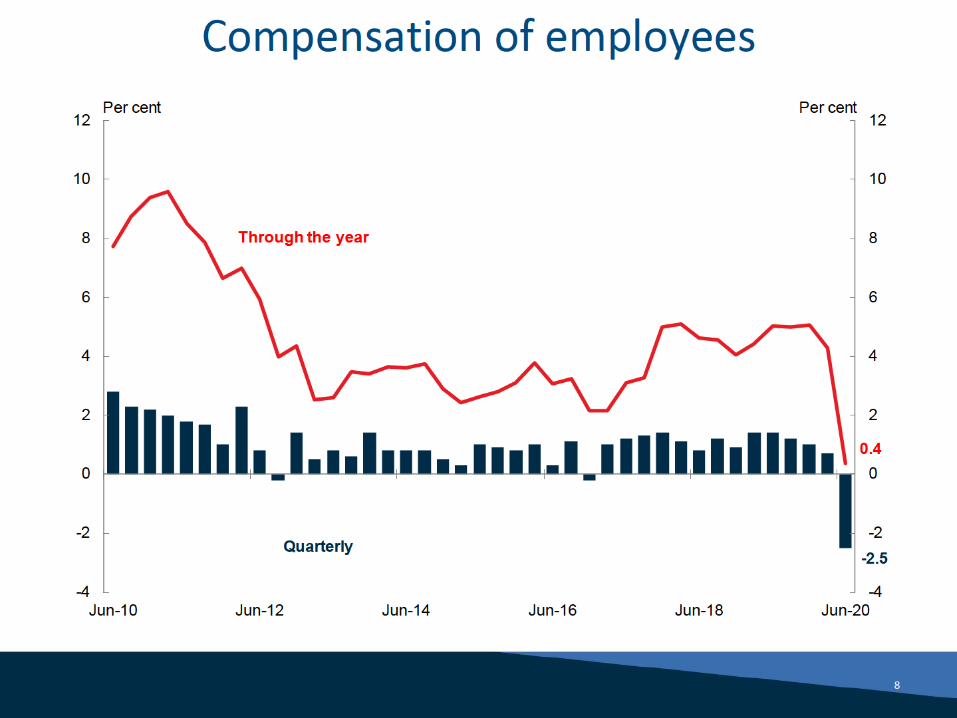
13. Compensation of employees fell by 2.5 per cent in the quarter to be 0.4 per cent higher through the year, while average
compensation per employee rose by 3.1 per cent in the quarter to be 4.6 per cent higher through the year.
14. Gross operating surplus increased by 8.2 per cent in the quarter to be 9.9 per cent higher through the year, primarily driven by
an increase in private non-financial corporations gross operating surplus (up 14.9 per cent).
15. Taxes less subsidies on production and imports fell a record 111.9 per cent, reflecting a large rise in subsidies, up $49.7 billion or 859.7 per cent. The rise in subsidies was driven by JobKeeper and the Boosting cash flow for employers policies.
16. Labour productivity (GVA per hour worked) in the market sector increased by 5.9 per cent in the quarter, to be 7.3 per cent higher
through the year.

Summary Tables
Table 1: Alternative measures of GDP (chain volume) Table 4: Income-based GDP (current prices)
Table 2: Expenditure components of GDP (chain volume) Table 5: Price measures (sa unless otherwise stated)
Table 3: Production-based GDP (chain volume)
Table 6: State final demand (chain volume)
(orig.)
Per cent change Mar Jun Mar Jun 2019-20
GDP -0.3 -7.0 1.6 -6.3 -0.2
Expenditure-based GDP -0.2 -6.8 1.7 -6.0 0.0
Income-based GDP -0.4 -7.2 1.5 -6.4 -0.4
Production-based GDP -0.2 -7.1 1.5 -6.4 -0.3
Consensus expectations* -6.0 -5.1
*Median market expectations for real GDP growth.
Source: ABS Cat No. 5206.0 Tables 1, 24, 34 and Bloomberg.
Quarter (s.a.) tty
Mar Jun tty
Compensation of employees 0.7 -2.5 0.4
Gross operating surplus 1.0 8.2 9.9
Private non-financial corporations and
Financial corporations 1.1 11.4 13.1
Gross mixed income -0.5 21.9 19.6
Average compensation per employee -0.2 3.1 4.6
Household disposable income 1.7 2.2 6.4
Real household gross disposable income 1.2 2.9 5.8
Household saving ratio* 6.0 19.8
Profits share of total factor income^ 29.0 31.1
Wages share of total factor income^ 52.5 49.4
Gross national income 1.1 -7.0 -4.3
Nominal GDP 0.9 -7.6 -5.9
Source: ABS Cat No. 5206.0, Tables 1, 7, 11, 20 and 24.
* shown as ratio, not percentage change.
shares do not sum to 100 per cent due to the exclusion of government
gross operating surplus, dwelling gross operating surplus and gross
mixed income.
(Per cent change)
Mar Jun tty Mar Jun
New private final demand -1.1 -10.5 -11.3 -0.8 -7.8
Household consumption -1.2 -12.1 -12.7 -0.7 -6.7
Dwelling investment -1.0 -6.8 -11.2 -0.1 -0.4
New business investment -0.7 -3.5 -5.5 -0.1 -0.4
New building -1.8 -2.3 0.3 0.0 -0.1
New engineering construction 1.5 1.9 -1.0 0.0 0.0
New machinery and equipment -2.1 -6.8 -13.4 -0.1 -0.3
New public final demand 1.7 2.0 6.1 0.4 0.5
Domestic final demand -0.4 -7.4 -7.0 -0.4 -7.2
Changes in inventories -0.2 -0.6
Gross national expenditure -0.6 -8.0 -7.7 -0.6 -7.8
Exports -4.4 -6.7 -10.6 -1.0 -1.4
Imports -6.7 -12.9 -19.1 1.4 2.5
Net exports 0.4 1.0
GDP (E) -0.2 -6.8 -6.0
GDP -0.3 -7.0 -6.3
Source: ABS Cat No. 5206.0 Tables 2, 24 and Treasury.
Cont. to growth
(Per cent change) (percentage pts)
(Per cent change)
Mar Jun tty
Chain price indexes (original)
GDP 1.1 -0.2 0.3
Domestic final demand 0.3 -0.2 1.3
Household consumption 0.7 -0.4 1.5
Consumer price index 0.3 -1.9 -0.3
Implicit price deflators
GDP 1.1 -0.6 0.3
Exports 2.6 -1.2 -2.4
Imports -0.5 -1.4 -0.6
Terms of trade 3.1 0.2 -1.8
Labour productivity (a) 0.9 5.9 7.3
Non-farm nominal unit labour costs 0.1 -10.6 -9.3
(a) For the market sector
Source: ABS Cat No. 5206.0, Tables 1, 4, 5 and 42 and ABS Cat No. 6401
Tables 1 and 2.
Mar Jun tty Mar Jun
Ag, forestry & fishing -1.9 -1.9 -6.3 0.0 0.0
Mining -0.6 0.2 1.1 0.0 0.0
Manufacturing 2.3 -9.6 -6.1 0.1 -0.5
Construction -0.6 -8.2 -10.3 0.0 -0.6
Total services -0.3 -7.0 -6.0 -0.2 -4.9
Rental, hiring & real estate -1.9 -15.9 -14.7 -0.1 -0.5
Transport, postal & warehousing -4.6 -21.5 -23.7 -0.2 -0.9
Retail trade 1.7 -4.5 -2.8 0.1 -0.2
Financial & insurance 1.2 0.7 3.0 0.1 0.1
Health care & social assistance -0.1 -7.9 -4.1 0.0 -0.6
Prof. scientific & technical 1.3 -6.2 -3.6 0.1 -0.4
GDP (P) -0.2 -7.1 -6.4
GDP -0.3 -7.0 -6.3
Source: ABS Cat No. 5206.0 Tables 2, 6 and 24.
(Per cent change) (percentage pts)
Cont. to growth (Per cent change)
Mar Jun tty
New South Wales -1.3 -8.6 -9.1
Victoria -0.2 -8.5 -8.3
Queensland -0.3 -5.9 -5.2
South Australia -0.9 -5.8 -6.7
Western Australia 0.9 -6.0 -4.0
Tasmania 0.8 -7.4 -6.8
Northern Territory -1.5 -4.9 -6.3
Australian Capital Territory 2.6 -2.2 2.0
Australia -0.4 -7.4 -7.0
Source: ABS Cat No. 5206.0, Tables 2 and 25.

International Comparisons
International real GDP growth comparisons1
Sep-19 Dec-19 Mar-20 Jun-20 Sep-19 Dec-19 Mar-20 Jun-20 2019 2019-20
Australia 0.5 0.6 -0.3 -7.0 1.8 2.3 1.6 -6.3 1.8 -0.2
G7
United States 0.6 0.6 -1.3 -9.1 2.1 2.3 0.3 -9.1 2.2 -1.0
Japan 0.0 -1.8 -0.6 -7.8 1.7 -0.7 -2.0 -10.0 0.7 -2.6
Germany 0.3 0.0 -2.0 -9.7 0.8 0.4 -2.2 -11.3 0.6 -2.9
France 0.2 -0.2 -5.9 -13.8 1.6 0.8 -5.7 -18.9 **1.5 **-5.6
United Kingdom 0.5 0.0 -2.2 -20.4 1.3 1.1 -1.7 -21.7 1.5 **-5.3
Italy 0.0 -0.2 -5.5 -12.8 0.5 0.1 -5.6 -17.7 0.3 -5.7
Canada 0.3 0.1 -2.1 -11.5 1.6 1.5 -0.9 -13.0 1.6 -2.4
Euro area 0.3 0.0 -3.6 -12.1 1.4 1.0 -3.1 -15.0 1.3 **-3.9
OECD 0.4 0.2 -1.8 -9.8 1.7 1.6 -0.9 -10.9 **1.6 **-2.1
Korea 0.4 1.3 -1.3 -3.2 1.9 2.4 1.4 -2.8 2.0 0.7
Taiwan 0.7 1.6 -1.0 -1.4 2.8 3.6 1.7 -0.2 2.7 2.0
Hong Kong -3.0 -0.5 -5.5 -0.1 -2.8 -3.0 -9.1 -8.9 -1.2 -5.9
Vietnam na na na na na na *3.7 *0.4 7.0 na
ASEAN-5
Indonesia na na na na *5.0 *5.0 *3.0 *-5.3 5.0 1.9
Thailand 0.0 -0.3 -2.5 -9.7 *2.6 *1.5 *-2.0 *-12.2 2.4 -2.5
Malaysia 0.8 0.6 -2.0 -16.5 *4.4 *3.6 *0.7 *-17.1 4.3 -2.1
Philippines 2.5 2.0 -5.7 -15.2 *6.3 *6.7 *-0.7 *-16.5 6.0 -1.3
Singapore 0.6 0.2 -0.8 -13.1 0.6 1.1 -0.3 -13.1 0.7 -2.9
BRICs
Brazil2 0.5 0.4 -1.5 *1.2 *1.7 *-0.3 1.1
Russia 0.4 0.5 0.3 *1.5 *2.1 *1.6 *-8.5 1.3
India na na na na *4.4 *4.1 *3.1 *-23.9 4.9 -3.1
China 1.4 1.3 -10.0 11.5 *6.0 *6.0 *-6.8 *3.2 6.1 2.3
Ireland 1.3 0.4 1.2 5.9 6.1 5.3 5.6
New Zealand20.8 0.5 -1.6 2.4 1.8 -0.2 2.3
1 Data is sourced from national statistical publications, OECD, CEIC databases, Thomson Reuters and Treasury.
** Year average growth and financial year average growth calculated using seasonally adjusted data
Financial year average data align with Australian financial year (September quarter to June quarter).
Year average growth and financial year averages calculated using original data, unless otherwise noted.
Current as at 01 Sep 2020.
2 The production measure of GDP (rather than the expenditure measure of GDP) is used, in accordance with the preference of national
statistical agencies.
Quarter-on-quarter and through-the-year data calculated using seasonally adjusted data, unless otherwise noted.
na = not available - country does not publish seasonally adjusted data
* Through the year GDP results calculated from non-seasonally adjusted data
Real GDP growth1
Quarter-on-Quarter Year-on-Year Year Average
HYE
Text Box
FOI 2779 Document 10

HYE
Text Box
FOI 2779 Document 11


HYE
Text Box
FOI 2779 Document 12


HYE
Text Box
FOI 2779 Document 13

June 2020 National Accounts TO questions
1. What would company profits have been in the absence of Government support?
• The ABS is unable to split out the impact of Government support by COE, GOS and GMI.
• The counterfactual of company profits is difficult to determine based on the data available, as
we cannot identify direct and indirect effects of Government support. For example, some
companies may not have continued trading in the absence of Government support.
2. How much of company profits reflects Jobkeeper payments vs Cashflow boost
• Please see answer to Question 1
3. What would COE have been the absence of the JobKeeper payments?
• Please see answer to Question 1
4. What would average earnings growth be in absence of Government support?
• Please see answer to Question 1
5. How much did early release of super contribute to household disposable income?
• Early release of superannuation does not form a component of Gross disposable income, as
measured in the National Accounts.
• However, ABS analysis shows that were it to be classified as gross disposable income, early
release of superannuation added $18.1 billion to GDI. For reference, GDI was $33.2 billion in
the June quarter 2020.
6. Growth in business profits without cash flow boost
• Growth in gross operating surplus and mixed income (GOSMI) was 10.6 per cent in the June
quarter 2020. Assuming the entirety of $16 billion that the ABS has incorporated for the cash
flow boost flows through to GOSMI, it contributed 7.4 percentage points to growth.
– Assuming no change in the number of businesses operating, GOSMI would have grown
by 3.2 per cent in the June quarter 2020 without the cash flow boost policy.
7. As discussed with , can you please confirm that corporate GOS and GMI minus subsidies is
17%?
• The sum of company profits (which includes private non-financial corporate GOS and financial
corporate GOS) and gross mixed income excluding subsidies contracted by 17 per cent in the
June quarter 2020.
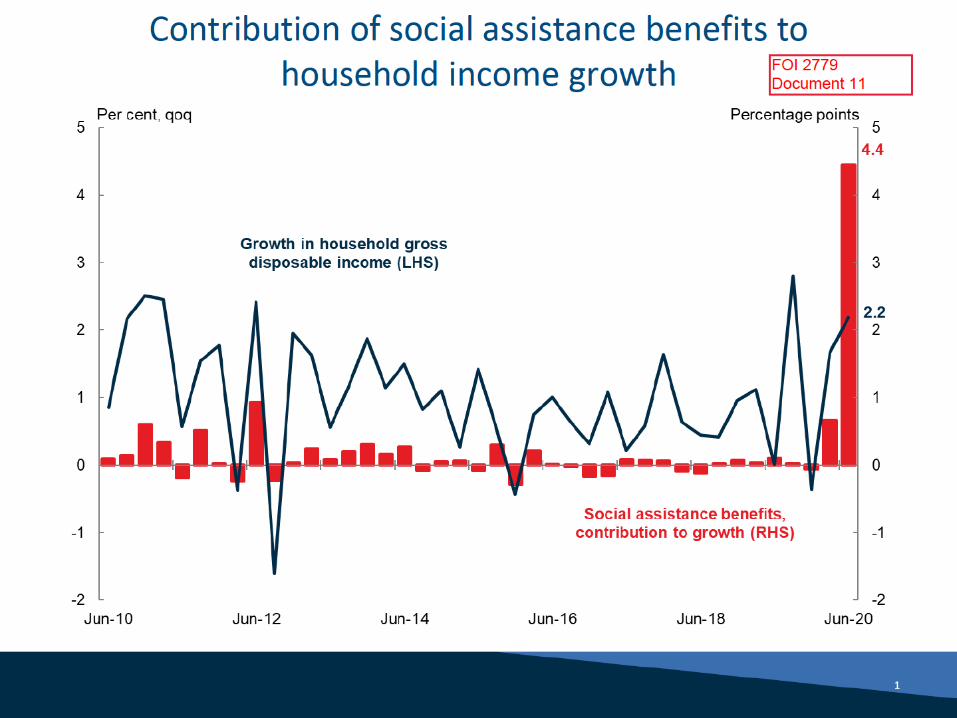
8. Social assistance benefits – June quarter 2020 number
• Social assistance benefits was $49.2 billion in the June quarter 2020, this is an increase of
$14.4 billion from the March quarter 2020.
s 22
HYE
Text Box
FOI 2779 Document 14

HYE
Text Box
FOI 2779 Document 15


From:To: ; MEG MECD International and Trade Analysis UnitCc: MEG MECD Executive; MEG MECD National Accounts Unit; Tsr DLOs; Grant, AngeliaSubject: RE: TO request for National Accounts [SEC=OFFICIAL]Date: Tuesday, 1 September 2020 1:05:34 PM
Hi Thanks for checking. It would be good if this could be incorporated into the press release. Thanks,
From: @treasury.gov.au> Sent: Tuesday, 1 September 2020 10:34 AMTo: @treasury.gov.au>; MEG MECD International andTrade Analysis Unit <[email protected]>Cc: MEG MECD Executive <[email protected]>; MEG MECD National AccountsUnit <[email protected]>; Tsr DLOs <[email protected]>;
@TREASURY.GOV.AU>; @TREASURY.GOV.AU>
Subject: RE: TO request for National Accounts [SEC=OFFICIAL] Hi Thanks for your email. We will update the text below, and include a chart with cumulative falls inGDP (since December 2019 quarter) for those select countries in the chart pack. I’ve spoken to NAU – we wanted to check whether you’d like this text incorporated into thepress release? Grateful if you could let us know, otherwise we can provide this in an email. Thanks
Team leader, International and Trade Analysis UnitMacroeconomic Conditions DivisionMacroeconomic Group( | : @treasury.gov.au* 1 Langton Crescent, Parkes ACT 2600
From: @treasury.gov.au> Sent: Tuesday, 1 September 2020 8:05 AMTo: MEG MECD International and Trade Analysis Unit <[email protected]>Cc: MEG MECD Executive <[email protected]>; MEG MECD National AccountsUnit <[email protected]>; Tsr DLOs <[email protected]>;
s 22s 22
s 22
s 22
s 22
s 22
s 22
s 22
s 22
s 22
s 22
s 22 s 22
s 22
s 22
HYE
Text Box
FOI 2779 Document 16
@TREASURY.GOV.AU>; Grant, Angelia<[email protected]>Subject: TO request for National Accounts [SEC=OFFICIAL]
OFFICIAL Hi team, Can you please add some more detail to the paragraph below and include it in the productsprovided for National Accounts tomorrow morning? It would be good if you could includecomparisons with France, Italy, Germany and Australia if possible.
The level of UK GDP is now down more than 22% since the December 2019 quarter and atits lowest since the June quarter 2003. The level of US real GDP is almost 11% below thepeak in the December quarter 2019 and at its lowest since the December quarter 2014,while the level of Eurozone real GDP is more than 15% below the peak in the Decemberquarter 2019 and at its lowest since the March quarter 2005.
Thanks,
Departmental Liaison OfficerOffice of the Hon Josh Frydenberg MP, TreasurerP +61 2 6277 7340 | M + | E @treasury.gov.au
OFFICIAL
s 22
s 22
s 22 s 22