Economic Indicators Whitepaper
13
Impact of Economic Indicators on CME Group Markets John W. Labuszewski, Managing Director Research & Product Development 312-466-7469, [email protected] Richard Co, Director Research & Product Development 312-930-3227, [email protected] Many factors impact upon the price performance and level of participation in any marketplace. But the most fundamental of factors may be found in … the fundamentals! In other words, we may look to basic supply and demand indications in our markets as generally guiding price performance and market participation. The “flagship” products offered by CME Group include Eurodollar (ticker: ED) and E-mini S&P 500 (ticker: ES) futures … representing primary benchmarks for interest rates and domestic equity values. The kinds of fundamental market indicators that drive these benchmark products may be found in a variety of economic indicators that describe the ebbs and flows of our economy. Of course, there are many economic indicators released by a variety of U.S. government agencies and various private sources. Some are more and some are less closely followed than others. But some of the m ost significant and widely followed of economic indicators include Non- Farm Payrolls (NFPs), Retail Sales, the Institute for Supply Management (ISM) Index, the Consumer Price Index (CPI), Durable Goods Orders, the Philadelphia Fed Index and Gross Domestic Product (GDP). The purpose of this study is to achieve an understanding of the impact that these most significant of economic indicators have had on CME Group flagship products in the form of volatility and trading volume. How do fundamental indicators of economic activity impact upon the performance of flagship CME Group products including Eurodollar and E- mini S&P 500 futures? This study focuses on seven key basic or fundamental economic indicators including … NFPs, Retail Sales, ISM Index, CPI, Durable Goods, Philly Fed Index and GDP. We focus on their impact on volume and volatility.
-
Upload
sharad-singhal -
Category
Documents
-
view
220 -
download
0
Transcript of Economic Indicators Whitepaper

8/3/2019 Economic Indicators Whitepaper
http://slidepdf.com/reader/full/economic-indicators-whitepaper 1/13
Impact of Economic Indicators on CME Group Markets
John W. Labuszewski, Managing Director
Research & Product Development
312-466-7469, [email protected]
Richard Co, Director
Research & Product Development312-930-3227, [email protected]
Many factors impact upon the price performance and level of
participation in any marketplace. But the most fundamental of factors
may be found in … the fundamentals! In other words, we may look tobasic supply and demand indications in our markets as generally guiding
price performance and market participation.
The “flagship” products offered by CME Group include Eurodollar
(ticker: ED) and E-mini S&P 500 (ticker: ES) futures … representing
primary benchmarks for interest rates and domestic equity values. Thekinds of fundamental market indicators that drive these benchmark
products may be found in a variety of economic indicators that describe
the ebbs and flows of our economy.
Of course, there are many economic indicators released by a variety of
U.S. government agencies and various private sources. Some are moreand some are less closely followed than others. But some of the most
significant and widely followed of economic indicators include Non-
Farm Payrolls (NFPs), Retail Sales, the Institute for Supply Management
(ISM) Index, the Consumer Price Index (CPI), Durable Goods Orders,
the Philadelphia Fed Index and Gross Domestic Product (GDP).
The purpose of this study is to achieve an understanding of the impactthat these most significant of economic indicators have had on CME
Group flagship products in the form of volatility and trading volume.
How do fundamental
indicators of
economic activity
impact upon the
performance of
flagship CME Group
products including
Eurodollar and E-
mini S&P 500futures?
This study focuses on
seven key basic or
fundamental
economic indicators
including … NFPs,
Retail Sales, ISM
Index, CPI, Durable
Goods, Philly Fed
Index and GDP. Wefocus on their impact
on volume and
volatility.

8/3/2019 Economic Indicators Whitepaper
http://slidepdf.com/reader/full/economic-indicators-whitepaper 2/13
Impact of Economic Indicators on CME Group Markets 2
Why These Indicators?
There are many indicators on which this study could have focused. Thedegree to which the marketplace focuses on one or another indicator is
subject to change over time and as a function of monetary and fiscal
policy.
Significance is Era Specific - In today’s marketplace, most analysts
agree that the Bureau of Labor Statistics’ (BLS) monthly EmploymentReport featuring Non-Farm Payroll (NFP) and Unemployment rate
statistics stands out as the single most significant economic release.
NFP is anxiously anticipated because it is followed closely by theFederal Open Market Committee (FOMC) which attempts to balance
inflationary pressures against economic growth. Further, it is released
on the first Friday of each calendar month and therefore represents the
first major release that speaks to activity in the prior month.
But in the 1980s when Paul Volcker served as Fed Chairman, the mostanxiously anticipated economic indicator was the monthly release of money supply figures, notably in the form of M1. Mr. Volcker will, of
course, be remembered for directing the Fed and the nation through an
extremely difficult period when inflation had soared into double digitfigures. Money supply targeting, as measured by M1, became the prime
tool in the Fed’s fight to control inflation. While the Fed continues to
establish target ranges for M2 and M3 growth, these numbers mean little
and the Fed is more likely to adjust its targets when it misses as to adjustmonetary policy in any significant way.
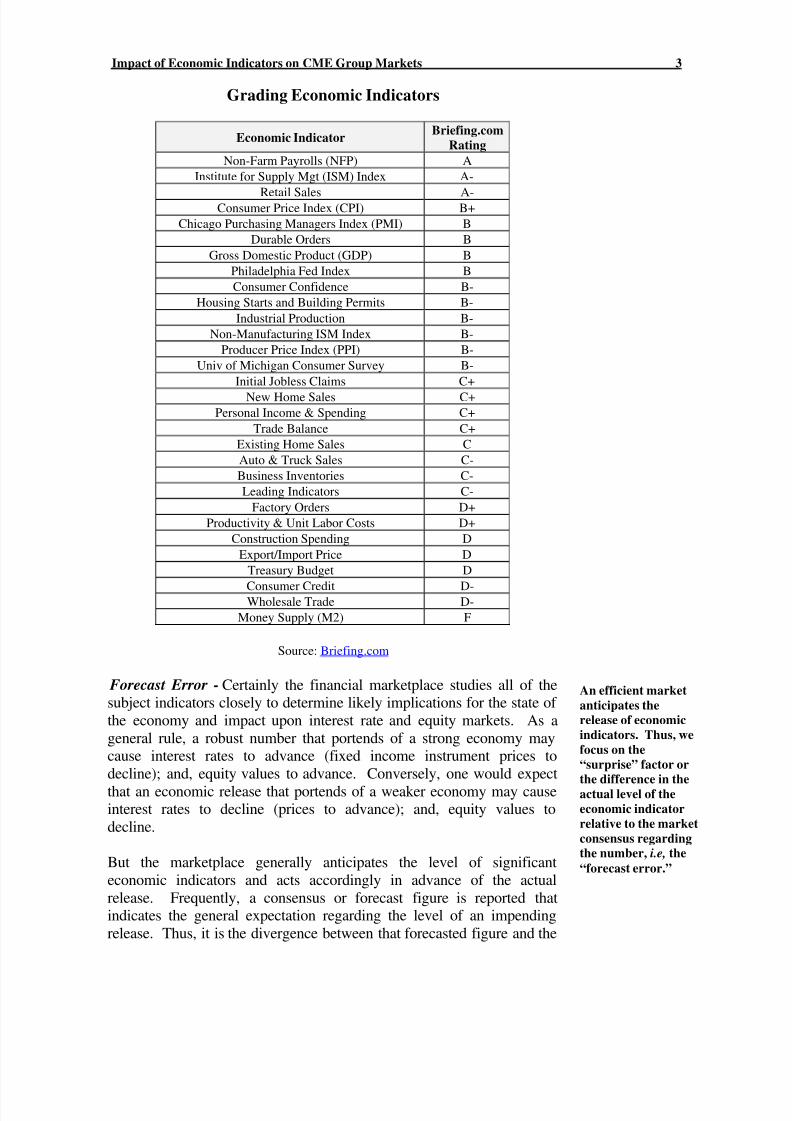
Grading the Indicators - While the popularity of various economicindicators may be dynamic, we had nonetheless consulting a popular
economic calendar service in the form of Briefing.com to get an
indication regarding the value of the various releases. Briefing.com offers ratings on a scale from A to F of the significance of each release.
Note that NFPs were according the highest grade of an “A” … while
Money Supply has fallen tremendously in significance down to thelowest possible grade of an “F.”
For purposes of this study, we did nothing more scientific than simply
select seven (7) of the most highly graded indicators including … NFPs,
ISM Index, Retail Sales, CPI, Durable Orders, GDP and the PhiladelphiaFed Index.
The significance of
economic indicators
is known to ebb and
flow. In the early
1980s, the market
focused keenly on
money supply.
Today, the focus is
more closely fixed on
the unemploymentreport including
NFPs.
We have selected the
seven fundamental
indicators by
referencing “grades”
depicting their
significance as
assigned by a popular
online economic
reporting service.
8/3/2019 Economic Indicators Whitepaper
http://slidepdf.com/reader/full/economic-indicators-whitepaper 3/13
Impact of Economic Indicators on CME Group Markets 3
Grading Economic Indicators
Economic IndicatorBriefing.com
Rating
Non-Farm Payrolls (NFP) A
Institute for Supply Mgt (ISM) Index A-
Retail Sales A-Consumer Price Index (CPI) B+
Chicago Purchasing Managers Index (PMI) B
Durable Orders B
Gross Domestic Product (GDP) B
Philadelphia Fed Index B
Consumer Confidence B-
Housing Starts and Building Permits B-
Industrial Production B-
Non-Manufacturing ISM Index B-
Producer Price Index (PPI) B-
Univ of Michigan Consumer Survey B-
Initial Jobless Claims C+
New Home Sales C+
Personal Income & Spending C+
Trade Balance C+
Existing Home Sales C
Auto & Truck Sales C-
Business Inventories C-
Leading Indicators C-
Factory Orders D+
Productivity & Unit Labor Costs D+
Construction Spending D
Export/Import Price D
Treasury Budget D
Consumer Credit D-Wholesale Trade D-
Money Supply (M2) F
Source: Briefing.com
Forecast Error - Certainly the financial marketplace studies all of thesubject indicators closely to determine likely implications for the state of
the economy and impact upon interest rate and equity markets. As a
general rule, a robust number that portends of a strong economy maycause interest rates to advance (fixed income instrument prices to
decline); and, equity values to advance. Conversely, one would expect
that an economic release that portends of a weaker economy may causeinterest rates to decline (prices to advance); and, equity values to
decline.
But the marketplace generally anticipates the level of significant
economic indicators and acts accordingly in advance of the actual
release. Frequently, a consensus or forecast figure is reported thatindicates the general expectation regarding the level of an impending
release. Thus, it is the divergence between that forecasted figure and the
An efficient market
anticipates the
release of economic
indicators. Thus, we
focus on the
“surprise” factor or
the difference in theactual level of the
economic indicator
relative to the market
consensus regarding
the number, i.e, the
“forecast error.”

8/3/2019 Economic Indicators Whitepaper
http://slidepdf.com/reader/full/economic-indicators-whitepaper 4/13
Impact of Economic Indicators on CME Group Markets 4
actual release … the “forecast error” or the “surprise” … that may bemost important in causing the marketplace to react by bidding market
prices upwards or offering them downwards.
Average Forecast Error(January 2001-August 2006)
Average Absolute
Forecast ErrorUnit
Non-Farm Payrolls (NFP) 73.63 Change in Thousands
Retail Sales 0.73% Monthly % Change
Inst Supply Mgt (ISM) Index 1.69 Index Points
Consumer Price Index (CPI) 0.10% Monthly % Change
Durable Orders 2.10% Monthly % Change
Philadelphia Fed 2.14 Index Points
Gross Domestic Product (GDP) 0.39% Quarterly % Change
Some economic indicators may be more difficult to forecast withaccuracy than others. For example, the average (absolute) forecast errorobserved between consensus expectations as reported by Briefing.com
and the actual release of Non-Farm Payrolls (NFPs) over the period
January 2001 through August 2006 was 73.63 thousand jobs. Bycontrast, the average (absolute) forecast error for the Consumer Price
Index (CPI) was only 0.10%. While these indicators are reported in very
different units of measurement, it is probably safe to conclude that CPI
releases are a bit more predictable than are NFP releases.
This study is focused on the effect that these forecast errors have upon
daily trading volume and volatility in E-mini S&P 500 (ES) and inEurodollar (ED) futures. We utilize two simple measures of volatility
for these purposes: the net change from close to close and the daily high-
low range.
Trading Volumes
Just as the significance of various economic indicators is “era-specific”
as discussed above, trading volumes likewise should not be assessed outof context. In other words, in order to differentiate “good” vs. “poor”
volume for any single day, we must compare that daily volume to
“typical” volume in the surrounding time period. Thus, we willreference daily volume in relationship to average daily volume during
the entire calendar month during which an economic indicator is
released.
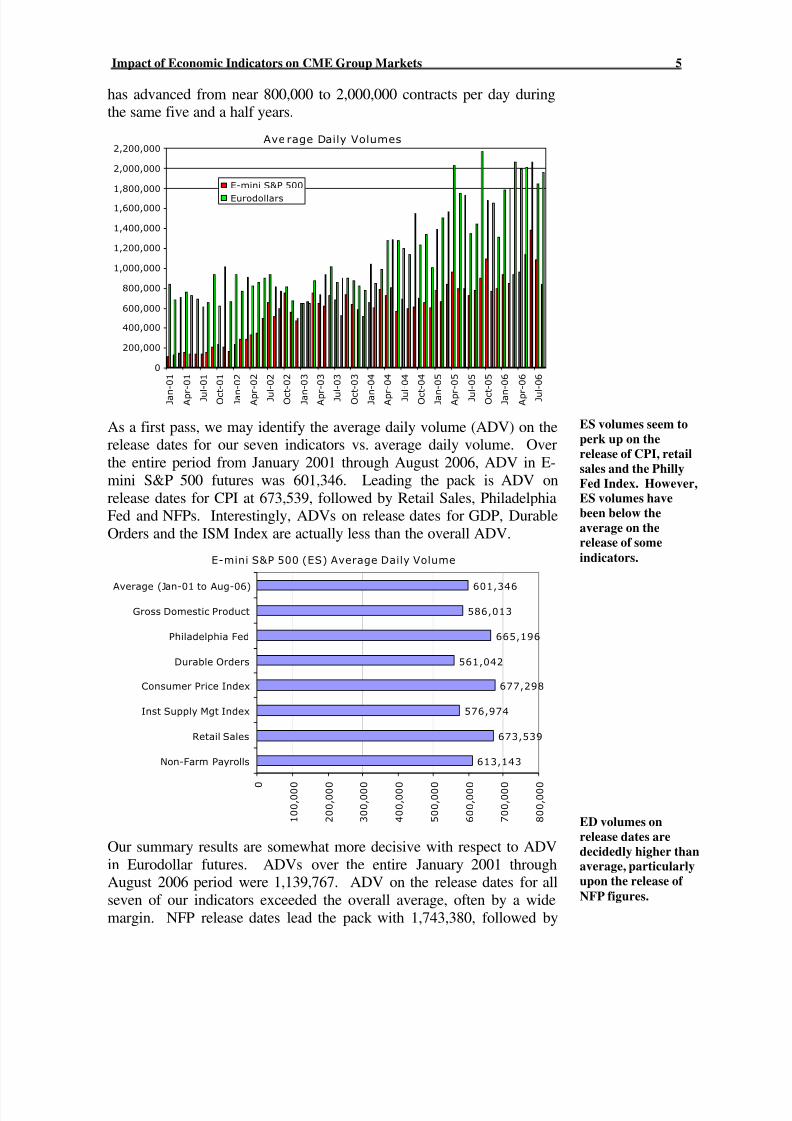
Note that volume in E-mini S&P 500 and Eurodollar futures have been
increasing on a rather dramatic basis during the period January 2001
through August 2006. Average daily volume (ADV) in E-mini S&P 500futures has advanced from below 200,000 to somewhere in the vicinity
of 1,000,000 contracts per day. Similarly, Eurodollar futures volume
Some figures are
more predictable
than others. Average
(absolute) forecast
errors tended to be
rather large for
figures such as NFPs
and GDP. Forecast
error for figures such
as CPI tended to be
relatively small.
Let’s compare
volumes in ES and
ED futures on release
dates relative toaverage monthly
volumes, noting that
volumes have
generally been
advancing sharply in
both markets over
recent years.
8/3/2019 Economic Indicators Whitepaper
http://slidepdf.com/reader/full/economic-indicators-whitepaper 5/13
Impact of Economic Indicators on CME Group Markets 5
has advanced from near 800,000 to 2,000,000 contracts per day duringthe same five and a half years.
Ave rage Daily Volumes
0
200,000
400,000
600,000
800,000
1,000,000
1,200,000
1,400,000
1,600,000
1,800,000
2,000,000
2,200,000
J a n
- 0 1
A p r
- 0 1
J u l - 0 1
O c t - 0 1
J a n
- 0 2
A p r
- 0 2
J u l - 0 2
O c t - 0 2
J a n
- 0 3
A p r
- 0 3
J u l - 0 3
O c t - 0 3
J a n
- 0 4
A p r
- 0 4
J u l - 0 4
O c t - 0 4
J a n
- 0 5
A p r
- 0 5
J u l - 0 5
O c t - 0 5
J a n
- 0 6
A p r
- 0 6
J u l - 0 6
E-mini S&P 500
Eurodollars
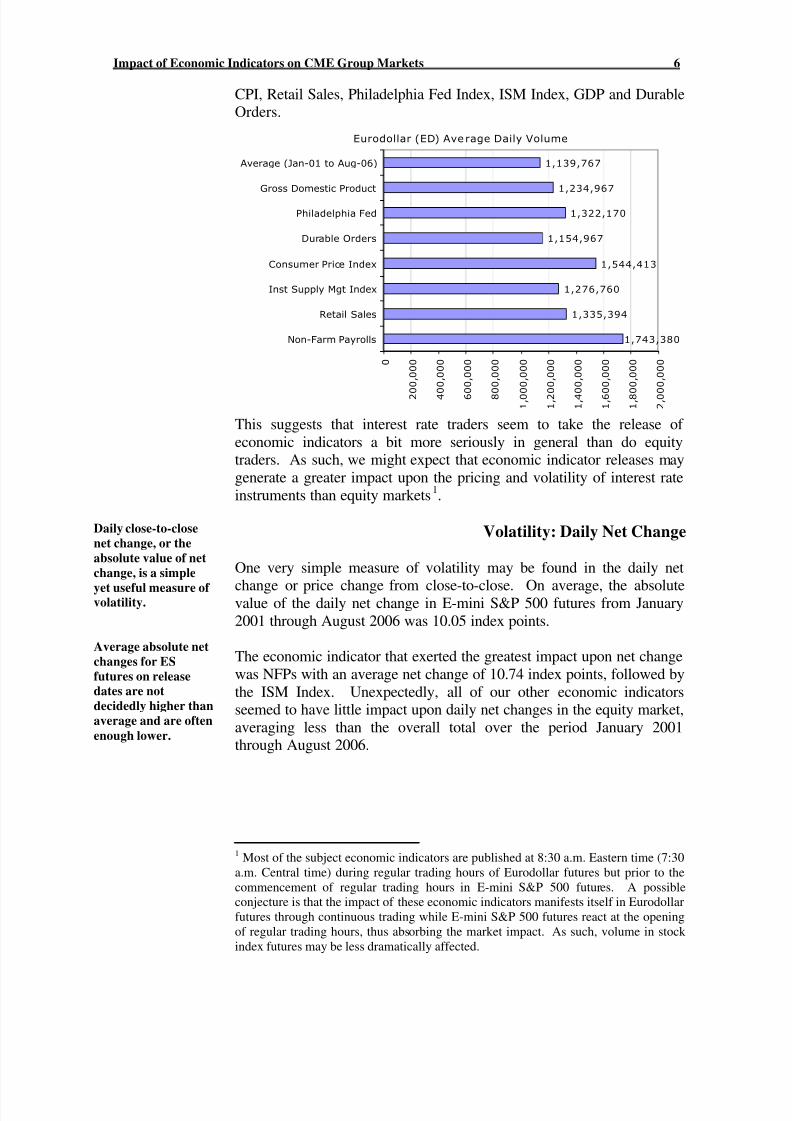
As a first pass, we may identify the average daily volume (ADV) on therelease dates for our seven indicators vs. average daily volume. Over
the entire period from January 2001 through August 2006, ADV in E-
mini S&P 500 futures was 601,346. Leading the pack is ADV on
release dates for CPI at 673,539, followed by Retail Sales, PhiladelphiaFed and NFPs. Interestingly, ADVs on release dates for GDP, Durable
Orders and the ISM Index are actually less than the overall ADV.
E-mini S&P 500 (ES) Average Daily Volume
613,143
673,539
576,974
677,298
561,042
665,196
586,013
601,346
0
1 0 0 , 0 0 0
2 0 0 , 0 0 0
3 0 0 , 0 0 0
4 0 0 , 0 0 0
5 0 0 , 0 0 0
6 0 0 , 0 0 0
7 0 0 , 0 0 0
8 0 0 , 0 0 0
Non-Farm Payrolls
Retail Sales
Inst Supply Mgt Index
Consumer Price Index
Durable Orders
Philadelphia Fed
Gross Domestic Product
Average (Jan-01 to Aug-06)
Our summary results are somewhat more decisive with respect to ADV
in Eurodollar futures. ADVs over the entire January 2001 throughAugust 2006 period were 1,139,767. ADV on the release dates for all
seven of our indicators exceeded the overall average, often by a wide
margin. NFP release dates lead the pack with 1,743,380, followed by
ES volumes seem to
perk up on the
release of CPI, retail
sales and the Philly
Fed Index. However,
ES volumes have
been below the
average on the
release of some
indicators.
ED volumes on
release dates are
decidedly higher than
average, particularly
upon the release of
NFP figures.
8/3/2019 Economic Indicators Whitepaper
http://slidepdf.com/reader/full/economic-indicators-whitepaper 6/13
Impact of Economic Indicators on CME Group Markets 6
CPI, Retail Sales, Philadelphia Fed Index, ISM Index, GDP and DurableOrders.
Eurodollar (ED) Average Daily Volume
1,743,380
1,335,394
1,276,760
1,544,413
1,154,967
1,322,170
1,234,967
1,139,767
0
2 0
0 , 0
0 0
4 0
0 , 0
0 0
6 0
0 , 0
0 0
8 0
0 , 0
0 0
1 , 0 0
0 , 0
0 0
1 , 2 0
0 , 0
0 0
1 , 4 0
0 , 0
0 0
1 , 6 0
0 , 0
0 0
1 , 8 0
0 , 0
0 0
2 , 0 0
0 , 0
0 0
Non-Farm Payrolls
Retail Sales
Inst Supply Mgt Index
Consumer Price Index
Durable Orders
Philadelphia Fed
Gross Domestic Product
Average (Jan-01 to Aug-06)
This suggests that interest rate traders seem to take the release of
economic indicators a bit more seriously in general than do equitytraders. As such, we might expect that economic indicator releases may
generate a greater impact upon the pricing and volatility of interest rate
instruments than equity markets1.
Volatility: Daily Net Change
One very simple measure of volatility may be found in the daily net
change or price change from close-to-close. On average, the absolutevalue of the daily net change in E-mini S&P 500 futures from January
2001 through August 2006 was 10.05 index points.
The economic indicator that exerted the greatest impact upon net change
was NFPs with an average net change of 10.74 index points, followed by
the ISM Index. Unexpectedly, all of our other economic indicatorsseemed to have little impact upon daily net changes in the equity market,
averaging less than the overall total over the period January 2001through August 2006.
1 Most of the subject economic indicators are published at 8:30 a.m. Eastern time (7:30
a.m. Central time) during regular trading hours of Eurodollar futures but prior to the
commencement of regular trading hours in E-mini S&P 500 futures. A possible
conjecture is that the impact of these economic indicators manifests itself in Eurodollar
futures through continuous trading while E-mini S&P 500 futures react at the opening
of regular trading hours, thus absorbing the market impact. As such, volume in stock
index futures may be less dramatically affected.
Daily close-to-close
net change, or the
absolute value of net
change, is a simple
yet useful measure of volatility.
Average absolute net
changes for ES
futures on release
dates are not
decidedly higher than
average and are often
enough lower.

8/3/2019 Economic Indicators Whitepaper
http://slidepdf.com/reader/full/economic-indicators-whitepaper 7/13
Impact of Economic Indicators on CME Group Markets 7
E-mini S&P 500 (ES) Absolute Daily Net Changes
10.74
8.82
10.64
8.74
7.60
8.07
8.51
10.05
0 1 2 3 4 5 6 7 8 9 10 11
Non-Farm Payrolls
Retail Sales
Inst Supply Mgt Index
Consumer Price Index
Durable Orders
Philadelphia Fed
Gross Domestic Product
Average (Jan-01 to Aug-06)
Net Change in Index Points
While E-mini S&P 500 futures appear rather insensitive to economicreleases, Eurodollars performed much closer to our expectations. NFPs
seem to exert the greatest impact upon market volatility with an average
absolute net change of 9.8 basis points compared to the overall averageof 4.9 basis points. NFP was far beyond any other indicator in this
regard although all of our indicators inspired movement at least slightly
in excess of the overall average.
Eurodollar (ED) Absolute Daily Net Changes
9.8
6.0
5.6
5.1
6.0
5.4
5.4
4.9
0 2 4 6 8 10
Non-Farm Payrolls
Retail Sales
Inst Supply Mgt Index
Consumer Price Index
Durable Orders
Philadelphia Fed
Gross Domestic Product
Average (Jan-01 to Aug-06)
Net Change in Basis Points
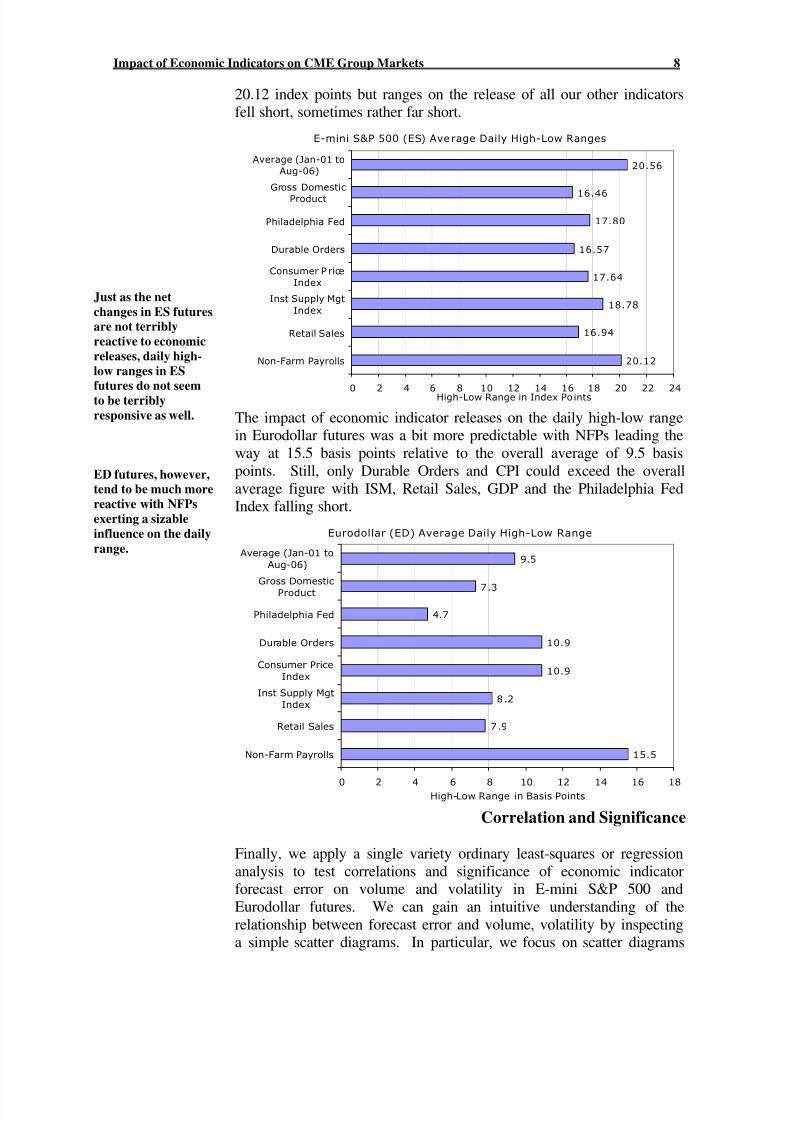
Volatility: Daily High-Low Range
Another simple measure of volatility is found in the daily high-low
range. The average daily high-low range in E-mini S&P 500 futuresduring the period January 2001 through August 2006 was 20.56 index
points. However, not a single one of our economic indicators could
generate such a wide high-low range. Non-farm payrolls came close at
ED futures are much
more reactive to
economic releases. In
particular, NFPs
result in sizable
market movements.
8/3/2019 Economic Indicators Whitepaper
http://slidepdf.com/reader/full/economic-indicators-whitepaper 8/13
Impact of Economic Indicators on CME Group Markets 8
20.12 index points but ranges on the release of all our other indicatorsfell short, sometimes rather far short.
E-mini S&P 500 (ES) Average Daily High-Low Ranges
20.12
16.94
18.78
17.64
16.57
17.80
16.46
20.56
0 2 4 6 8 10 12 14 16 18 20 22 24
Non-Farm Payrolls
Retail Sales
Inst Supply Mgt
Index
Consumer P rice
Index
Durable Orders
Philadelphia Fed
Gross Domestic
Product
Average (Jan-01 to
Aug-06)
High-Low Range in Index Po ints
The impact of economic indicator releases on the daily high-low rangein Eurodollar futures was a bit more predictable with NFPs leading the
way at 15.5 basis points relative to the overall average of 9.5 basis
points. Still, only Durable Orders and CPI could exceed the overall
average figure with ISM, Retail Sales, GDP and the Philadelphia FedIndex falling short.
Eurodollar (ED) Average Daily High-Low Range
15.5
7.9
8.2
10.9
10.9
4.7
7.3
9.5
0 2 4 6 8 10 12 14 16 18
Non-Farm Payrolls
Retail Sales
Inst Supply Mgt
Index
Consumer Price
Index
Durable Orders
Philadelphia Fed
Gross Domestic
Product
Average (Jan-01 to
Aug-06)
High-Low Range in Basis Points
Correlation and Significance
Finally, we apply a single variety ordinary least-squares or regression
analysis to test correlations and significance of economic indicatorforecast error on volume and volatility in E-mini S&P 500 and
Eurodollar futures. We can gain an intuitive understanding of the
relationship between forecast error and volume, volatility by inspectinga simple scatter diagrams. In particular, we focus on scatter diagrams
Just as the net
changes in ES futures
are not terribly
reactive to economic
releases, daily high-
low ranges in ES
futures do not seem
to be terribly
responsive as well.
ED futures, however,
tend to be much more
reactive with NFPs
exerting a sizable
influence on the daily
range.

8/3/2019 Economic Indicators Whitepaper
http://slidepdf.com/reader/full/economic-indicators-whitepaper 9/13
Impact of Economic Indicators on CME Group Markets 9
depicting forecast errors for NFPs vs. daily net changes in ES and EDfutures.
NFP Error Forecas t vs . ES Daily Net Change
-50
-40
-30
-20
-10
0
10
20
30
40
50
-400 -300 -200 -100 0 100 200 300 400
Non-Farm Payrolls Forecast Error
E - m i n i S & P 5 0 0 N e t C h a n g e
We might expect that forecast errors greater than zero … indicative of
stronger than expected economic conditions … would portend of
stronger equity values and higher interest rates (lower fixed incomeinstrument prices). Forecast errors less than zero … indicative of
weaker than expected economic conditions … may portend of weaker
equity values and lower interest rates (higher fixed income prices).
NFP Forecas t Error vs . ED Net Change
-40
-30
-20
-10
0
10
20
30
40
-400 -300 -200 -100 0 100 200 300 400
Non-Farm Payrolls Forecast Error
E u r o d
o l l a r N e t C h a n g e
A scatter diagram of
NFP forecast errors
vs. net changes in ES
and ED futures
provide an intuitive
feel for correlation.
Clearly, NFP forecast
errors exert an
observable influence
on ED futures albeit
with no consistent
impact on ES futures.

8/3/2019 Economic Indicators Whitepaper
http://slidepdf.com/reader/full/economic-indicators-whitepaper 10/13
Impact of Economic Indicators on CME Group Markets 10
This relationship appears evident in our scatter diagram for Eurodollarfutures where positive forecast errors typically result in falling prices
(rising rates); while negative forecast errors are more typically
associated with rising prices (falling rates). However, the scatterdiagram in the context of E-mini S&P 500 futures exhibits a pronounced
shotgun effect with no particular causal relationship in evidence.
We further test the significance of any relationships by running a simpleregression analysis, focusing on R2 and the t-Stat associated with the
coefficient for the single independent variable. The only relationship in
the context of E-mini S&P 500 futures that rises to the level of statisticalsignificance is that between (absolute) NFP forecast error and volume.
Regression Results vs. Economic Indicator Forecast ErrorR
2and (t-Stat)
E-mini S&P 500 (ES) Eurodollars (ED)
Volume NetChange
Range Volume NetChange
Range
Non-Farm
Payrolls (NFP)
0.074
(2.295) *
0.006
(-0.652)
0.000
(0.023)
0.149
(3.401) *
0.419
(-6.902) *
0.109
(2.836) *
Retail Sales0.002
(-0.403)
0.001
(-0.308)
0.000
(-0.161)
0.011
(-0.872)
0.030
(-1.441)
0.000
(0.113)
Inst Supply Mgt
(ISM) Index
0.003
(-0.410)
0.003
(0.481)
0.000
(0.069)
0.003
(0.458)
0.253
(-4.726) *
0.070
(2.223) *
Consumer Price
Index (CPI)
0.011
(0.866)
0.033
(-1.509)
0.010
(-0.834)
0.019
(1.126)
0.002
(-0.389)
0.001
(0.204)
Durable Orders0.001
(-0.230)
0.003
(0.463)
0.002
(0.359)
0.009
(-0.792)
0.004
(-0.492)
0.026
(1.326)
Philadelphia Fed0.000
(-0.125)
0.014
(-0.982)
0.000
(-0.155)
0.000
(0.136)
0.280
(-5.062) *
0.080
(2.394) *
Gross Domestic
Product (GDP)
0.006
(0.619)
0.004
(0.496)
0.030
(-1.436)
0.020
(1.163)
0.135
(-3.208) *
0.046
(1.781)
* Statistically significant result
The indicator that clearly exerts the most impact upon Eurodollar futures
is NFPs. Note that there is a markedly significant relationship betweenabsolute NFP forecast error and volume; NFP forecast error and net
change; absolute NFP forecast error and range. There are further
significant relationships between forecast errors for ISM, PhiladelphiaFed Index and GDP vs. both net change and range.
Conclusions
Non-Farm Payrolls are clearly and predictably the most significanteconomic indicator that impacts upon the performance of CME Group
flagship products in the form of E-mini S&P 500 and Eurodollar futures.
Actually, the relationships between economic releases and ES futures
Regression results
indicate several
statistically
significant
relationships.
Notable relationshipsare observed between
NFP forecast and E-
mini S&P 500 volume
and ED volume and
volatility. Other
significant
relationships exist
between the ISM
Index, Philly Fed
Index and GDP and
ED volatility.

8/3/2019 Economic Indicators Whitepaper
http://slidepdf.com/reader/full/economic-indicators-whitepaper 11/13
Impact of Economic Indicators on CME Group Markets 11
are rather tenuous.2
These relationships are far stronger in the context of Eurodollar futures.
While NFPs may be the most significant of these indicators, DurableOrders appear to be the least significant of these indicators as a general
rule. Finally, one may observe that while CPI releases tend to be
accompanied by high volumes, the indicator’s impact upon pricemovement is perhaps a bit muted, possibly attributed to the ratherpredicable nature of CPI and generally low forecast errors.
Appendix: Economic Indicator Descriptions
This appendix provides a description of the seven economic indicators
that are the subject of this study.
Non-Farm Payrolls – Non-Farm Payrolls (NFPs) are released by theBureau of Labor Statistics (BLS) at 7:30 a.m. (CT) on the first Friday of
each month along with a battery of other employment information.Actually, there are two distinct reports generated from separate surveys… a survey of approximately 375,000 businesses which is used to
generate NFPs and a survey of approximately 60,000 households used to
generate the unemployment rate. The unemployment report is the firstmajor economic release of the month that depicts economic activity in
the prior month. The Federal Reserve typically focuses keenly on the
employment report including NFPs, the unemployment rate, average
workweek, overtime and average hourly earnings.
Retail Sales - The retail sales report is published by the Census Bureau
of the Commerce Department. It is releases at 7:30 a.m. (CT) on orabout the 13th of the month and represents data for the prior calendar
month. It is a measure of the total receipts of retail stores. The figure is
closely monitored as a useful indication of consumer spending. Analystsfrequently study the report on an “ex-autos” basis noting potentially
dramatic advances and declines in auto sales driven by discounting
tactics on the part of the auto makers. Food and energy components of the index are likewise often discounted as volatile but not necessarily
always sustainable drivers. Note that services are not included in retail
sales and that the figures may be volatile and subject to wide revisions.
ISM Index - The Institute for Supply Management releases its ISMIndex at 9:00 a.m. (CT) on the first business day of the month,
representing the prior calendar month. The ISM Index is generated froma nationwide poll of purchasing managers. The Index is weighted to
incorporate new orders (30%), production (25%), employment (20%),
2 While it is difficult to argue that these economic indicators do not provide market
moving information, perhaps their directional impact on CME E-mini S&P 500 futures
is less certain than in CME Eurodollar futures where a direct monetary policy linkage
is evident.
Consistent with our
expectations, non-
farm payrolls are
clearly the most
potent of economic
indicators,
particularly withrespect to volumes
and volatility in CME
Eurodollar futures.

8/3/2019 Economic Indicators Whitepaper
http://slidepdf.com/reader/full/economic-indicators-whitepaper 12/13
Impact of Economic Indicators on CME Group Markets 12
deliveries (15%), and inventories (10%). An Index in excess of 50%suggests economic expansion relative to the prior month; an Index less
than 50% is indicative of economic contraction relative to the prior
month. The ISM Index is perhaps the most significant privatelygenerated economic report.
Consumer Price Index – CPI is compiled by the Bureau of LaborStatistics (BLS) of the U.S. Department of Labor and released at 7:30a.m. (CT) on or about the 13th of the month. CPI measures prices of a
fixed market basket of goods and services purchased by consumers and
is widely used to determine cost of living adjustments (COLAs) in thecontext of public and private labor agreements. Analysts often study
CPI excluding volatile food and energy prices which are often seasonal
or cyclical in nature, leaving one with a reading of “core” inflation.These figures may tend to exaggerate the true impact of inflation in the
sense that the astute consumers will tend to find substitutes for overly
inflated goods and services, patterns which are not recognized per the
statistic.
Durable Orders – Durable goods orders are released by the Census
Bureau of the Commerce Department at 7:30 a.m. (CT) on or about the26th of each month representing data from the prior month. This figure
represents orders, shipments and unfilled orders of durable goods. A
“durable good” is considered one which may last for three years orbetter. These figures are frequently distorted by large defense or aircraft
orders. Still, durable orders are considered an important indicator of
manufacturing activity.
Philadelphia Fed Index – The Index is released by the PhiladelphiaFederal Reserve Bank at 11:00 a.m. (CT) on the 3rd Thursday of the
month. It is one of several manufacturing surveys generated by theregional branches of the Federal Reserve. However, the Philly Fed
Index is considered a leading indicator in the sense that it is first to be
released and represented activity for the month in which it is reported.The Index is similar to the ISM Index in that it varies from 0 to 100%
with any figures in excess of 50% representing expansion from the prior
month while figures less than 50% represent contraction from the priormonth.
Gross Domestic Product - Gross Domestic Product (GDP) is compiledby the Bureau of Economic Analysis (BEA), an arm of the U.S.Commerce Department, and is the broadest measure of economic
activity. The figures represent activity in a previous calendar quarter.Actually, the figures are reported in stages. There is an “advance”
announcement in the first month of each calendar quarter representing
activity in the prior calendar quarter; revised by a “preliminary” releaseduring the middle month of the quarter; capped by a “final” revision
during the last month of each calendar quarter. Revisions can be

8/3/2019 Economic Indicators Whitepaper
http://slidepdf.com/reader/full/economic-indicators-whitepaper 13/13
Impact of Economic Indicators on CME Group Markets 13
significant and may impact upon figures reflecting activity several yearsin the past.
GDP is often quoted as an annualized percent change basis. The mostsignificant components of GDP include consumption, investment, net
exports, government purchases and inventories. Consumption is the
single most important of these components. The BEA further publishedGDP deflators or measurements of the change in prices of GDPcomponents and is considered a key indicator of inflationary pressures.
The GDP deflator might be considered a bit more useful than CPI in the
sense that it is not tied to a fixed basket of goods and services but ratherrepresents the actual mix of goods and services produced.