Energy Indicators for the Economic Dimension of ... · Economic Dimension of Sustainable...
34
Energy Indicators for the Economic Dimension of Sustainable Development Prof. Peter Taylor Mainstreaming Energy Sustainable Development Goals (SDGs), Targets and Indicators into Statistical Programmes in Select African Countries Addis Ababa, Ethiopia, 27-29 June 2016
-
Upload
truongtuong -
Category
Documents
-
view
220 -
download
4
Transcript of Energy Indicators for the Economic Dimension of ... · Economic Dimension of Sustainable...
Energy Indicators for the Economic
Dimension of Sustainable Development
Prof. Peter Taylor
Mainstreaming Energy Sustainable Development Goals (SDGs),
Targets and Indicators into Statistical Programmes in Select African
Countries
Addis Ababa, Ethiopia, 27-29 June 2016
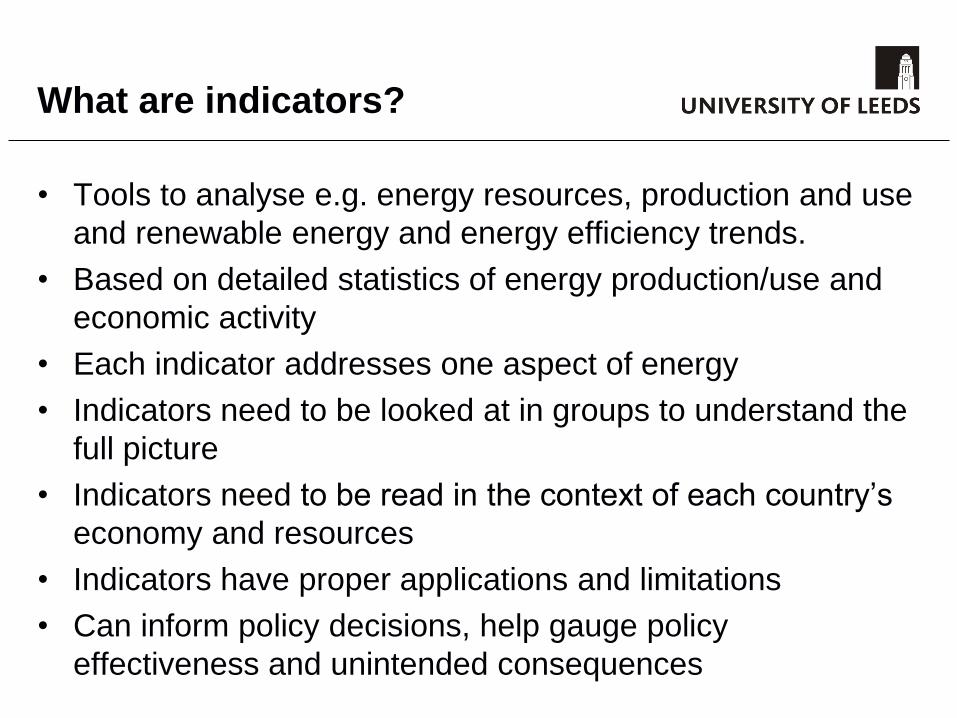
What are indicators?
• Tools to analyse e.g. energy resources, production and use
and renewable energy and energy efficiency trends.
• Based on detailed statistics of energy production/use and
economic activity
• Each indicator addresses one aspect of energy
• Indicators need to be looked at in groups to understand the
full picture
• Indicators need to be read in the context of each country’s
economy and resources
• Indicators have proper applications and limitations
• Can inform policy decisions, help gauge policy
effectiveness and unintended consequences
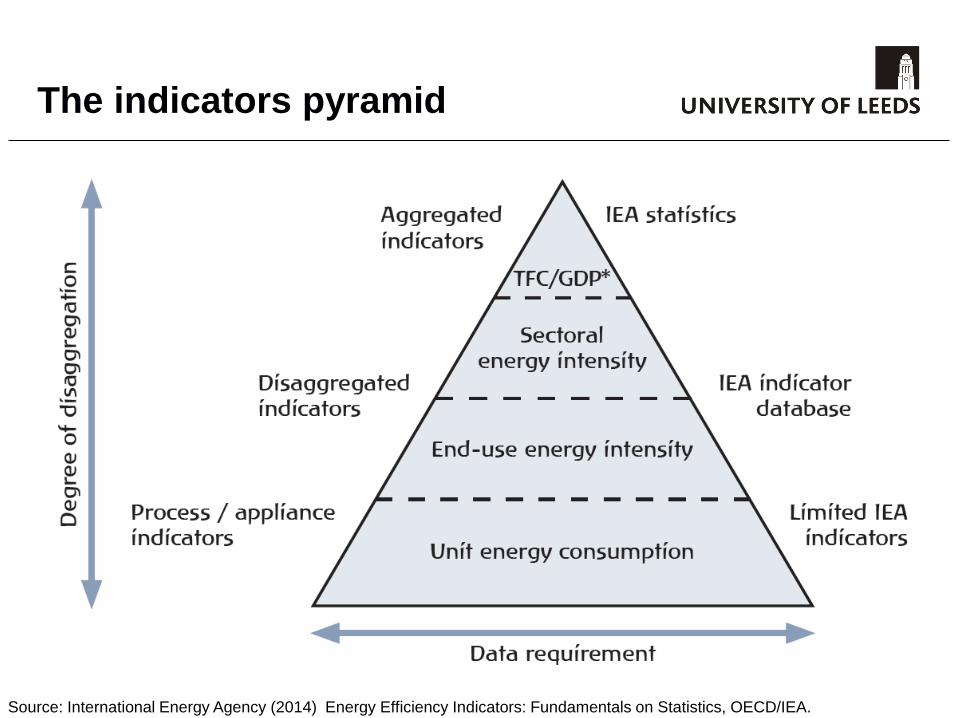
The indicators pyramid
Source: International Energy Agency (2014) Energy Efficiency Indicators: Fundamentals on Statistics, OECD/IEA.
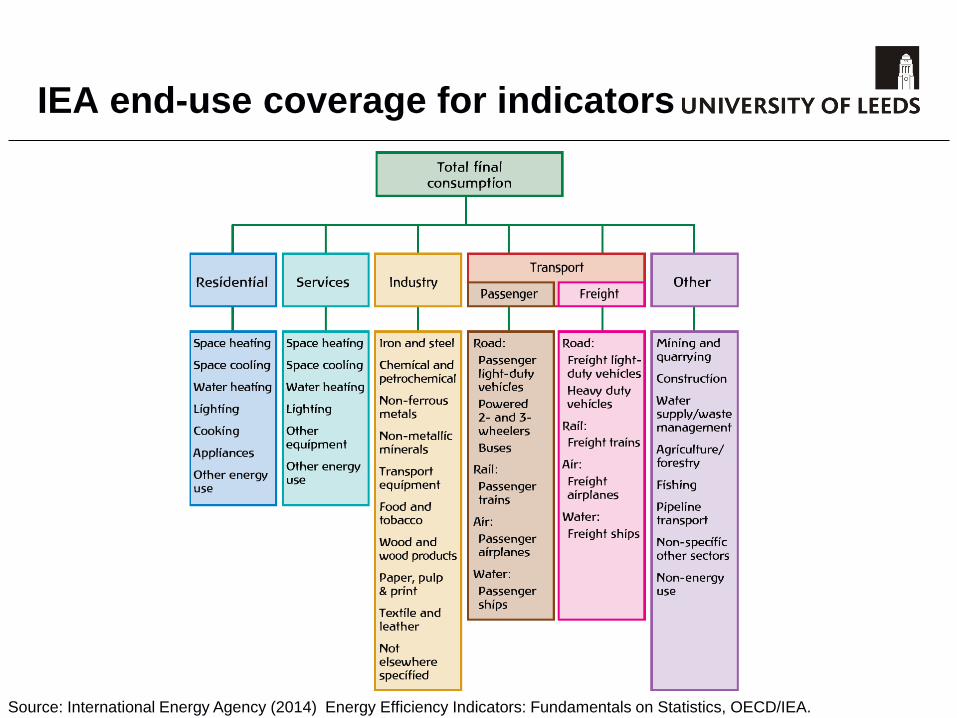
IEA end-use coverage for indicators
Source: International Energy Agency (2014) Energy Efficiency Indicators: Fundamentals on Statistics, OECD/IEA.
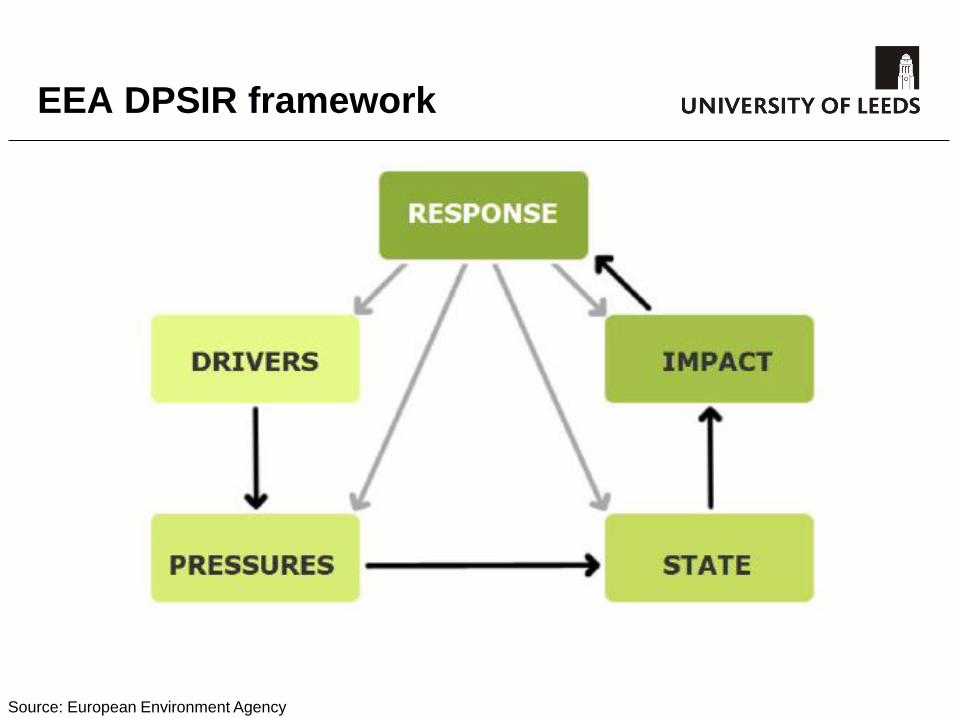
EEA DPSIR framework
Source: European Environment Agency
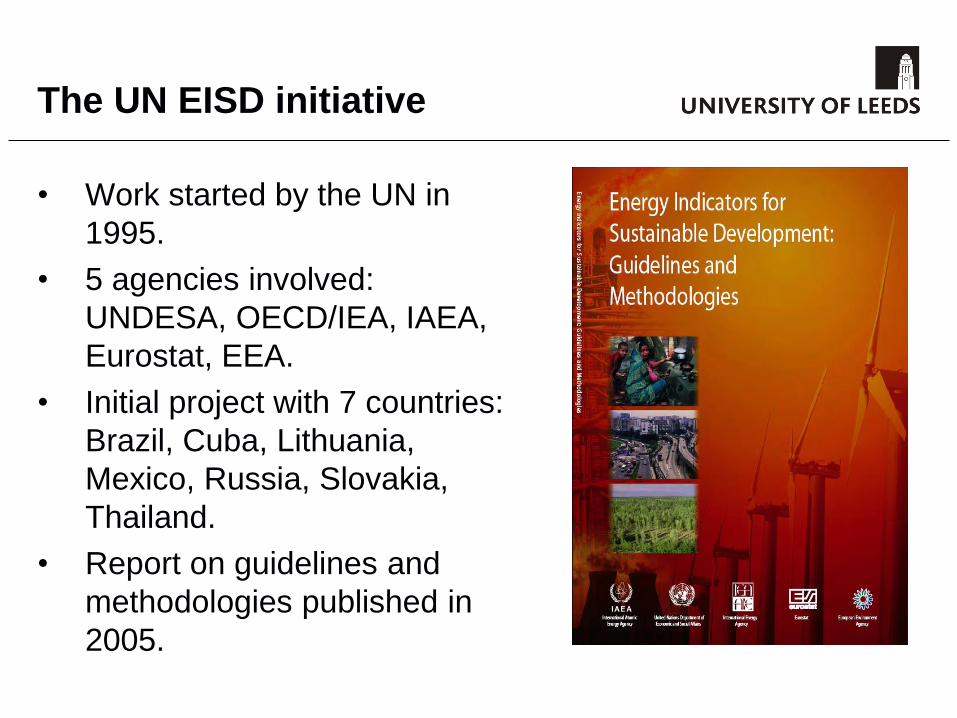
The UN EISD initiative
• Work started by the UN in
1995.
• 5 agencies involved:
UNDESA, OECD/IEA, IAEA,
Eurostat, EEA.
• Initial project with 7 countries:
Brazil, Cuba, Lithuania,
Mexico, Russia, Slovakia,
Thailand.
• Report on guidelines and
methodologies published in
2005.
• Modern economies depend on a reliable and adequate
energy supply.
• All sectors of the economy — residential, commercial,
transport, service and agriculture — demand modern
energy services.
• These services in turn foster economic and social
development at the local level by raising productivity and
enabling local income generation.
• Energy supply affects jobs, productivity and development.
• Electricity is the dominant form of energy for
communications, information technology, manufacturing
and services.
Economic Dimension of
Sustainable Development
Economic indicators and
themes
The economic indicators have two themes. Divided into a
number of sub-themes:
1. Use and production patterns
Overall Use, Overall Productivity, Supply Efficiency,
Production, End Use, Diversification (Fuel Mix) and Prices.
2. Security
Imports and Strategic Fuel Stocks.
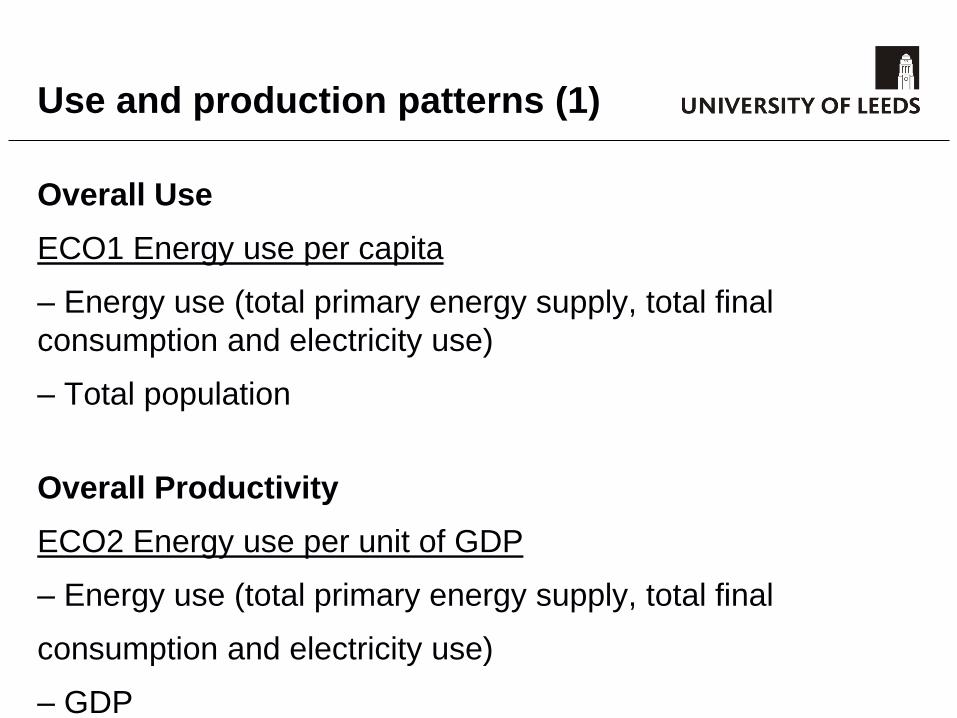
Use and production patterns (1)
Overall Use
ECO1 Energy use per capita
– Energy use (total primary energy supply, total final
consumption and electricity use)
– Total population
Overall Productivity
ECO2 Energy use per unit of GDP
– Energy use (total primary energy supply, total final
consumption and electricity use)
– GDP
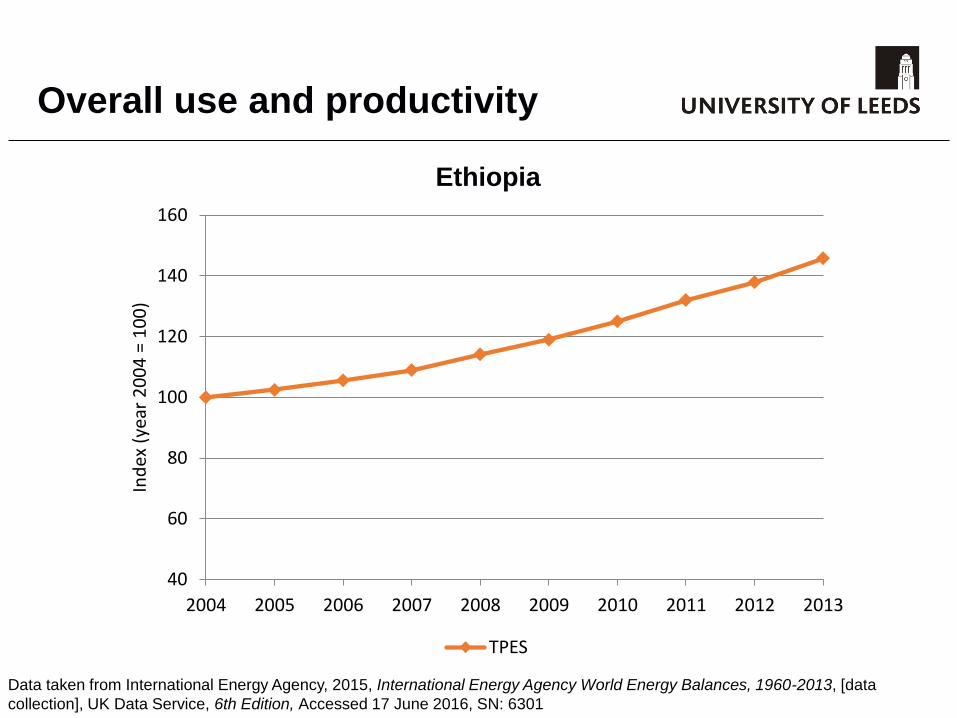
Overall use and productivity
Ethiopia
40
60
80
100
120
140
160
2004 2005 2006 2007 2008 2009 2010 2011 2012 2013
Ind
ex (
year
20
04
= 1
00
)
TPES
Data taken from International Energy Agency, 2015, International Energy Agency World Energy Balances, 1960-2013, [data
collection], UK Data Service, 6th Edition, Accessed 17 June 2016, SN: 6301
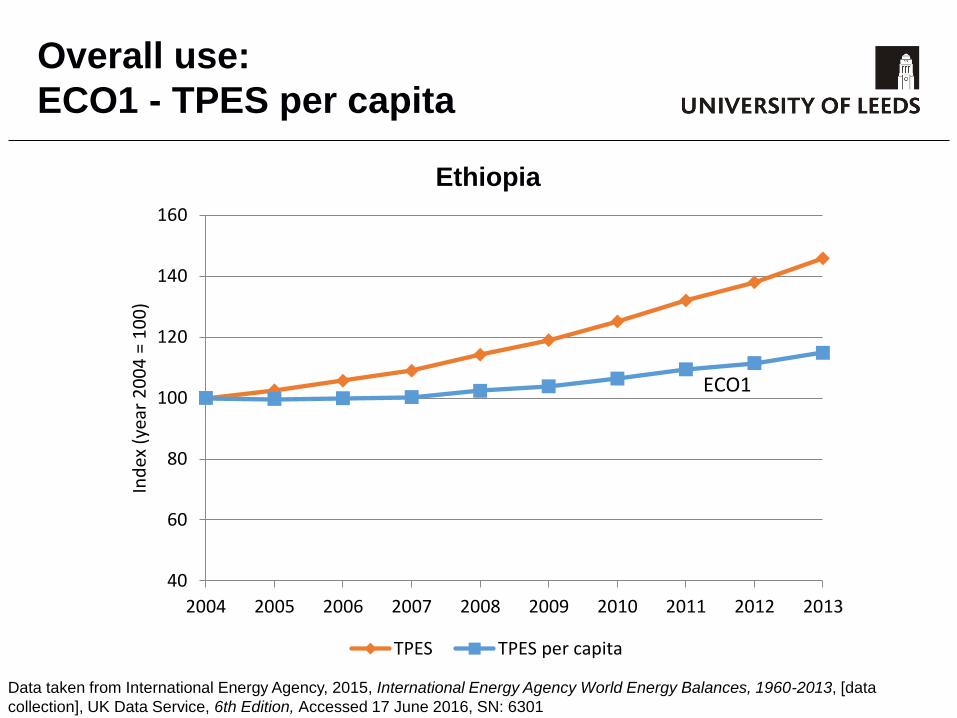
Overall use:
ECO1 - TPES per capita
Ethiopia
40
60
80
100
120
140
160
2004 2005 2006 2007 2008 2009 2010 2011 2012 2013
Ind
ex (
year
20
04
= 1
00
)
TPES TPES per capita
ECO1
Data taken from International Energy Agency, 2015, International Energy Agency World Energy Balances, 1960-2013, [data
collection], UK Data Service, 6th Edition, Accessed 17 June 2016, SN: 6301
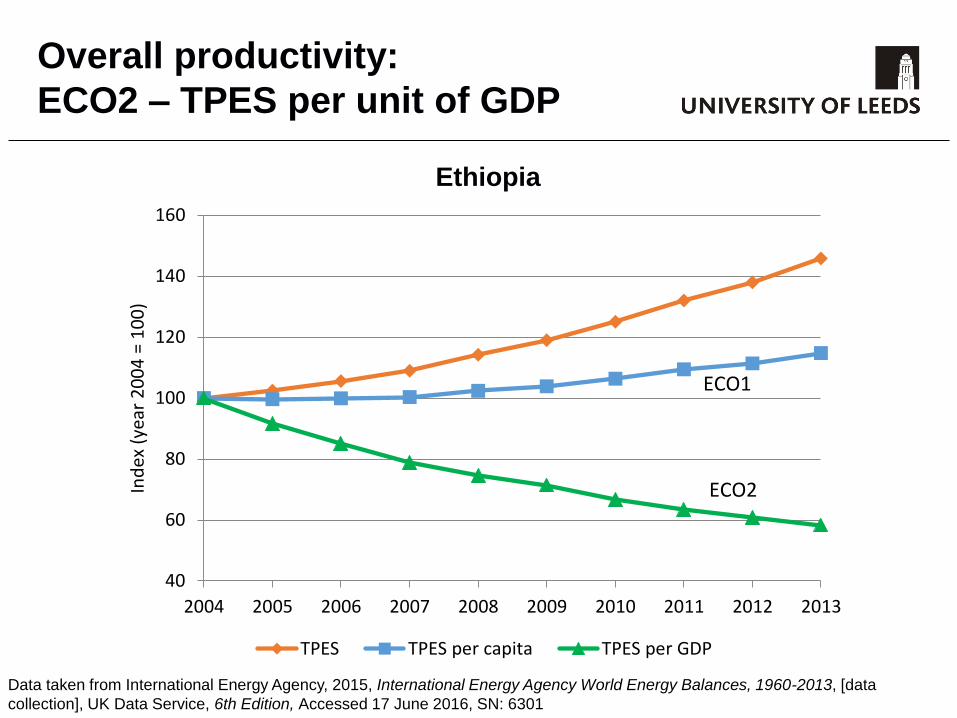
Overall productivity:
ECO2 – TPES per unit of GDP
Ethiopia
40
60
80
100
120
140
160
2004 2005 2006 2007 2008 2009 2010 2011 2012 2013
Ind
ex (
year
20
04
= 1
00
)
TPES TPES per capita TPES per GDP
ECO1
ECO2
Data taken from International Energy Agency, 2015, International Energy Agency World Energy Balances, 1960-2013, [data
collection], UK Data Service, 6th Edition, Accessed 17 June 2016, SN: 6301
Use and production patterns (2)
Supply Efficiency
ECO3 Efficiency of energy conversion and distribution
– Losses in transformation systems including losses in
electricity generation, transmission and distribution
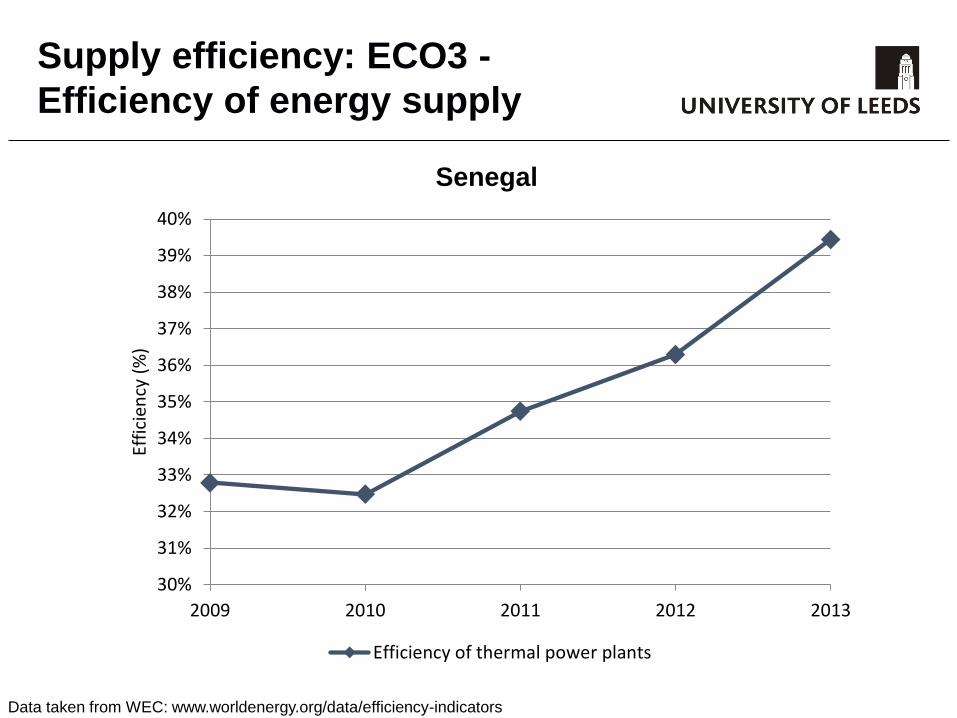
Supply efficiency: ECO3 -
Efficiency of energy supply
Senegal
Data taken from WEC: www.worldenergy.org/data/efficiency-indicators
30%
31%
32%
33%
34%
35%
36%
37%
38%
39%
40%
2009 2010 2011 2012 2013
Effi
cien
cy (
%)
Efficiency of thermal power plants
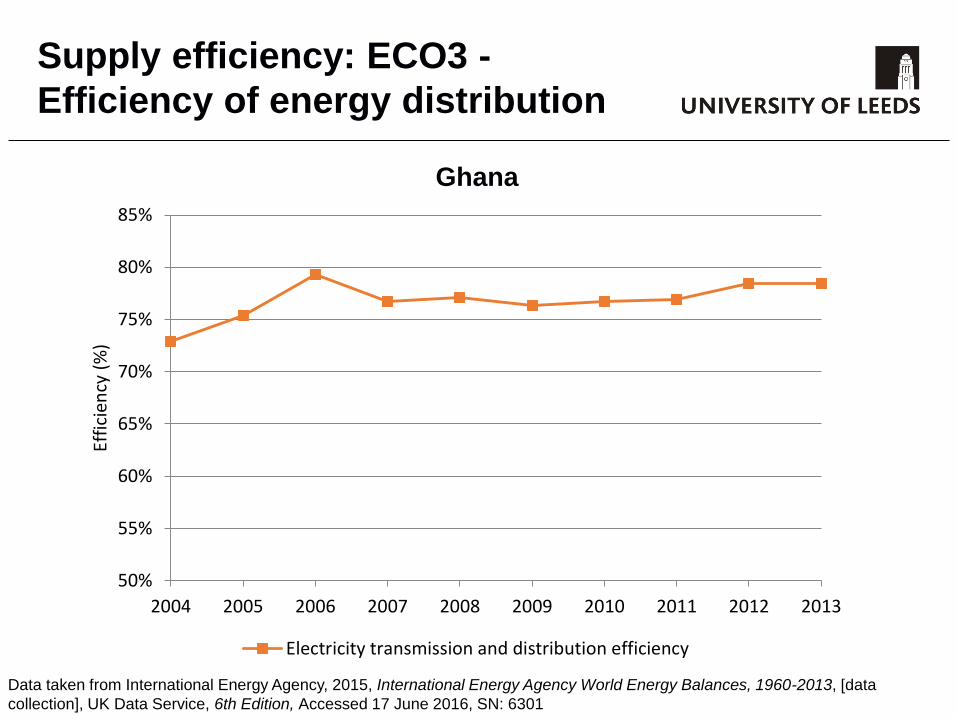
Supply efficiency: ECO3 -
Efficiency of energy distribution
Ghana
Data taken from International Energy Agency, 2015, International Energy Agency World Energy Balances, 1960-2013, [data
collection], UK Data Service, 6th Edition, Accessed 17 June 2016, SN: 6301
50%
55%
60%
65%
70%
75%
80%
85%
2004 2005 2006 2007 2008 2009 2010 2011 2012 2013
Effi
cien
cy (
%)
Electricity transmission and distribution efficiency
Use and production patterns (3)
Production
ECO4 Reserves-to-production ratio
– Proven recoverable reserves
– Total energy production
ECO5 Resources-to-production ratio
– Total estimated resources
– Total energy production
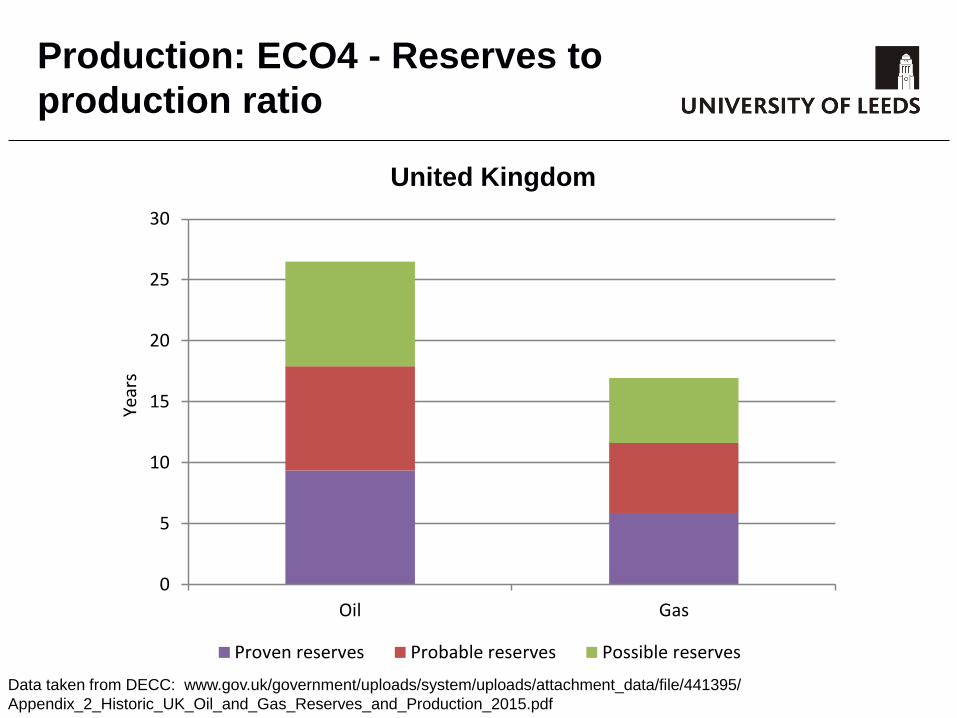
Production: ECO4 - Reserves to
production ratio
United Kingdom
0
5
10
15
20
25
30
Oil Gas
Year
s
Proven reserves Probable reserves Possible reserves
Data taken from DECC: www.gov.uk/government/uploads/system/uploads/attachment_data/file/441395/
Appendix_2_Historic_UK_Oil_and_Gas_Reserves_and_Production_2015.pdf
Use and production patterns (4)
End Use
ECO6 Industrial energy intensities
ECO7 Agricultural energy intensities
ECO8 Service/ commercial energy intensities
– Energy use in industrial or commercial or agricultural sector
– Corresponding value added
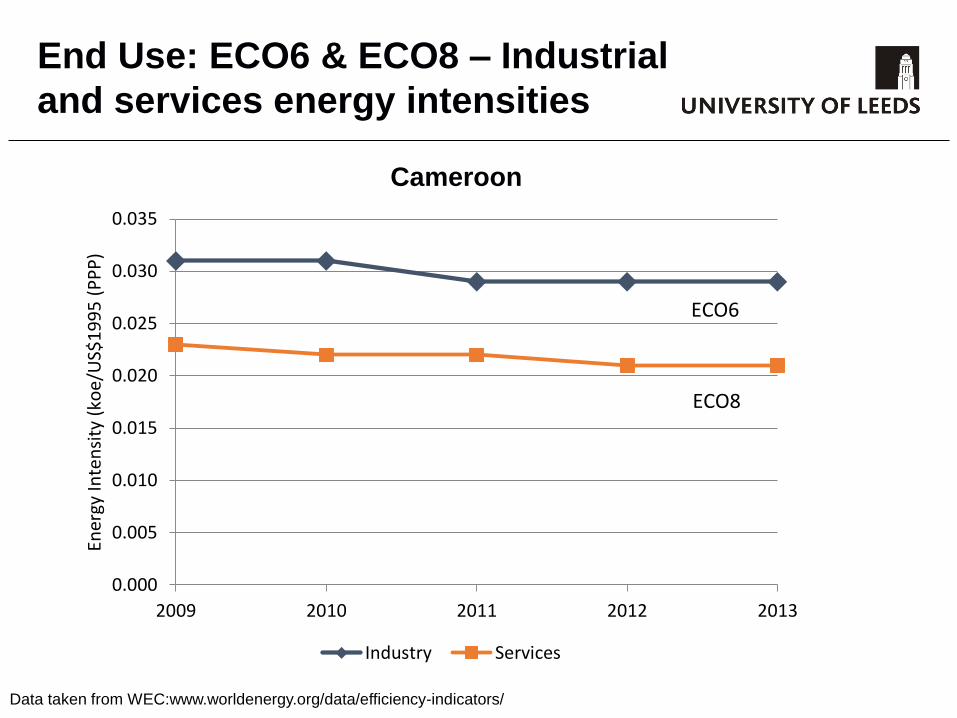
End Use: ECO6 & ECO8 – Industrial
and services energy intensities
Cameroon
Data taken from WEC:www.worldenergy.org/data/efficiency-indicators/
0.000
0.005
0.010
0.015
0.020
0.025
0.030
0.035
2009 2010 2011 2012 2013
Ener
gy In
ten
sity
(ko
e/U
S$1
99
5 (
PP
P)
Industry Services
ECO6
ECO8
Use and production patterns (5)
End Use (cont.)
ECO9 Household energy intensities
– Energy use in households and by key end use
– Number of households, floor area, persons per household,
appliance ownership
ECO10 Transport energy intensities
– Energy use in passenger travel and freight sectors and by
mode
– Passenger-km travel and tonne-km freight and by mode
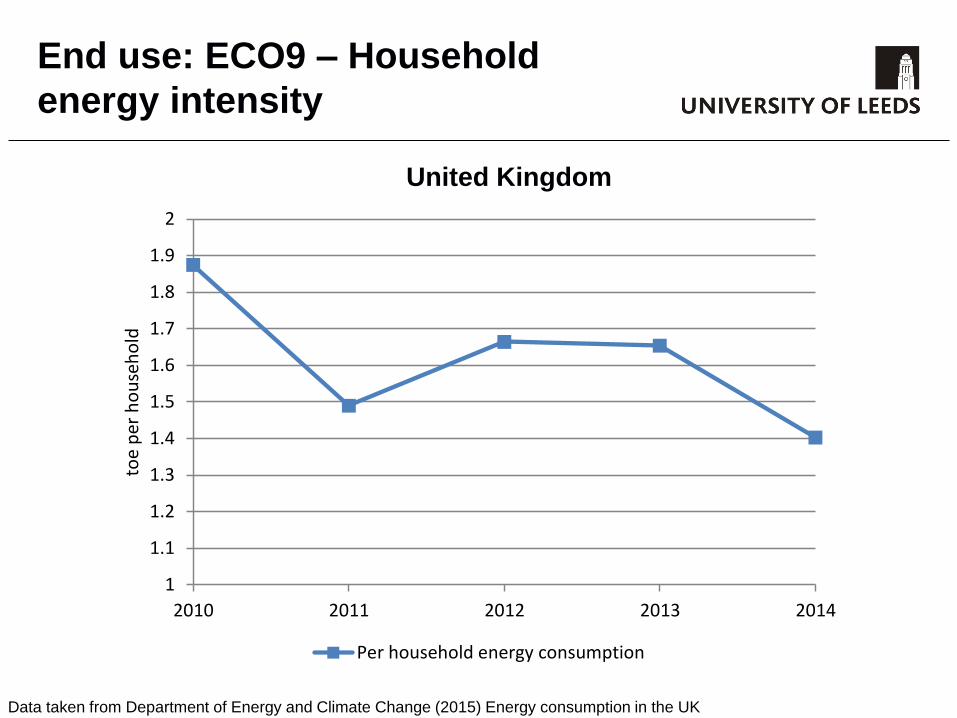
End use: ECO9 – Household
energy intensity
United Kingdom
Data taken from Department of Energy and Climate Change (2015) Energy consumption in the UK
1
1.1
1.2
1.3
1.4
1.5
1.6
1.7
1.8
1.9
2
2010 2011 2012 2013 2014
toe
per
ho
use
ho
ld
Per household energy consumption
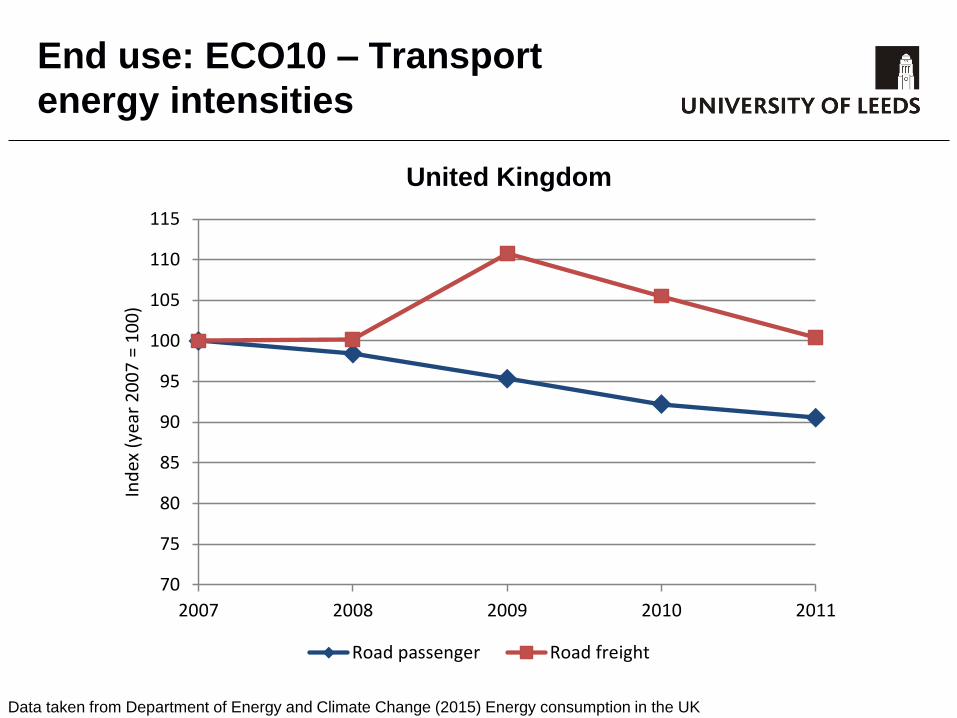
End use: ECO10 – Transport
energy intensities
United Kingdom
Data taken from Department of Energy and Climate Change (2015) Energy consumption in the UK
70
75
80
85
90
95
100
105
110
115
2007 2008 2009 2010 2011
Ind
ex (
year
20
07
= 1
00
)
Road passenger Road freight
Use and production patterns (6)
ECO11 Fuel shares in energy and electricity
– Primary energy supply and final consumption, electricity
generation and generating capacity by fuel type
– Total primary energy supply, total final consumption, total
electricity generation and total generating capacity
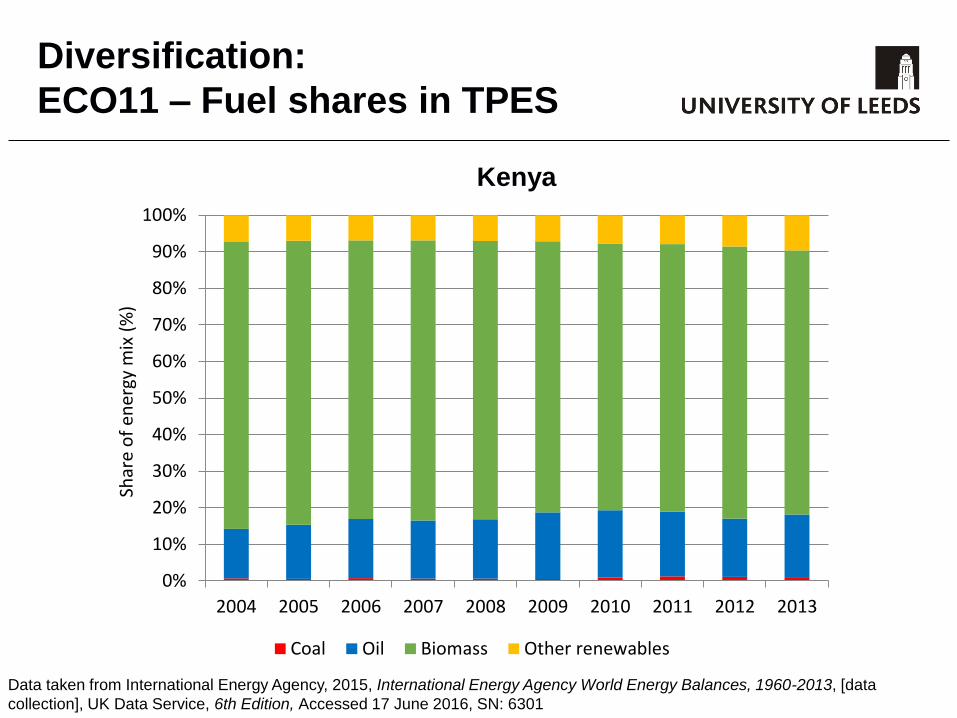
Diversification:
ECO11 – Fuel shares in TPES
Kenya
0%
10%
20%
30%
40%
50%
60%
70%
80%
90%
100%
2004 2005 2006 2007 2008 2009 2010 2011 2012 2013
Shar
e o
f en
ergy
mix
(%
)
Coal Oil Biomass Other renewables
Data taken from International Energy Agency, 2015, International Energy Agency World Energy Balances, 1960-2013, [data
collection], UK Data Service, 6th Edition, Accessed 17 June 2016, SN: 6301
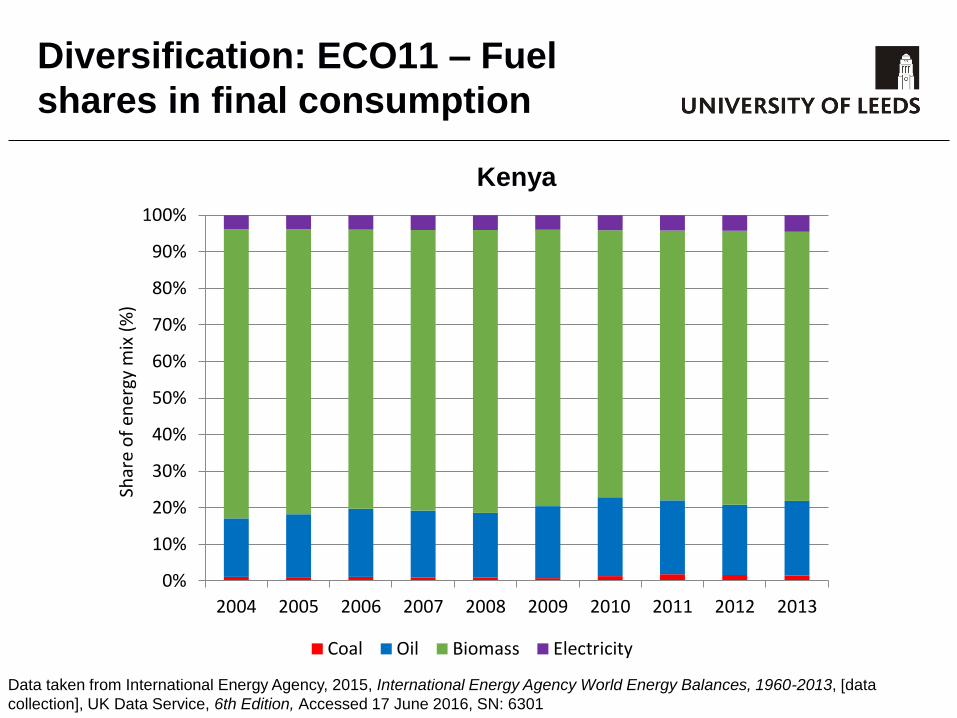
Diversification: ECO11 – Fuel
shares in final consumption
Kenya
Data taken from International Energy Agency, 2015, International Energy Agency World Energy Balances, 1960-2013, [data
collection], UK Data Service, 6th Edition, Accessed 17 June 2016, SN: 6301
0%
10%
20%
30%
40%
50%
60%
70%
80%
90%
100%
2004 2005 2006 2007 2008 2009 2010 2011 2012 2013
Shar
e o
f en
ergy
mix
(%
)
Coal Oil Biomass Electricity
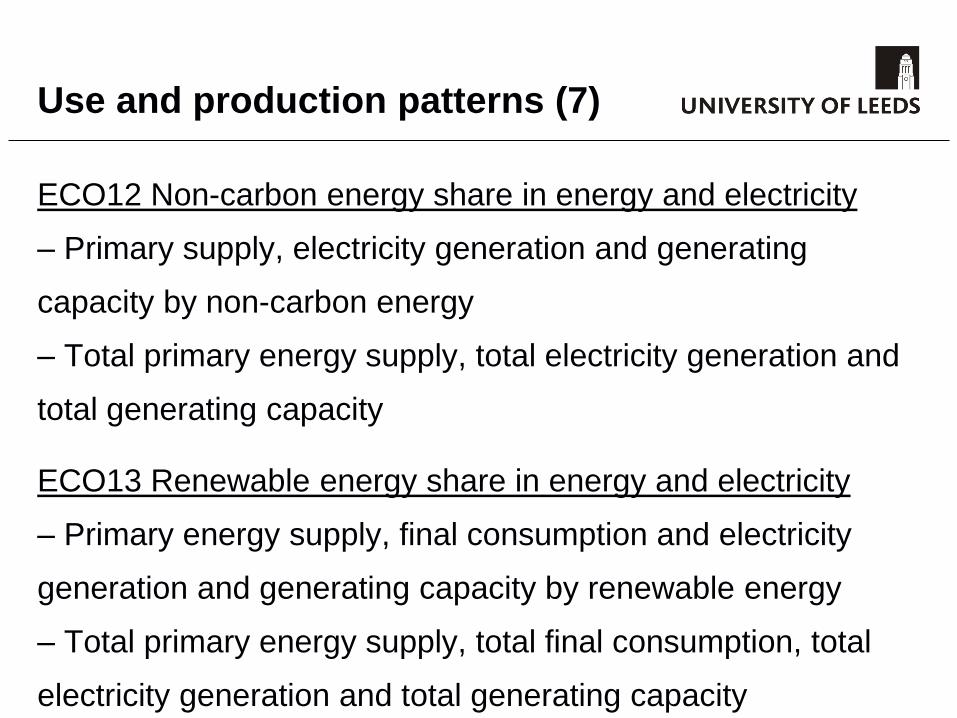
Use and production patterns (7)
ECO12 Non-carbon energy share in energy and electricity
– Primary supply, electricity generation and generating
capacity by non-carbon energy
– Total primary energy supply, total electricity generation and
total generating capacity
ECO13 Renewable energy share in energy and electricity
– Primary energy supply, final consumption and electricity
generation and generating capacity by renewable energy
– Total primary energy supply, total final consumption, total
electricity generation and total generating capacity
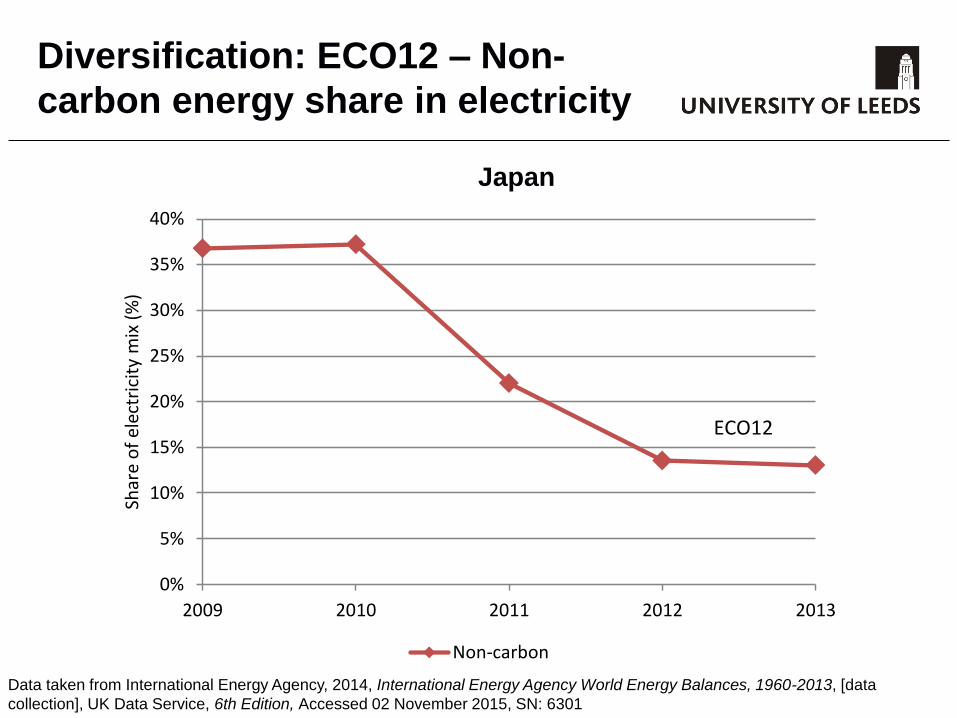
Diversification: ECO12 – Non-
carbon energy share in electricity
Japan
0%
5%
10%
15%
20%
25%
30%
35%
40%
2009 2010 2011 2012 2013
Shar
e o
f el
ectr
icit
y m
ix (
%)
Non-carbon
ECO12
Data taken from International Energy Agency, 2014, International Energy Agency World Energy Balances, 1960-2013, [data
collection], UK Data Service, 6th Edition, Accessed 02 November 2015, SN: 6301
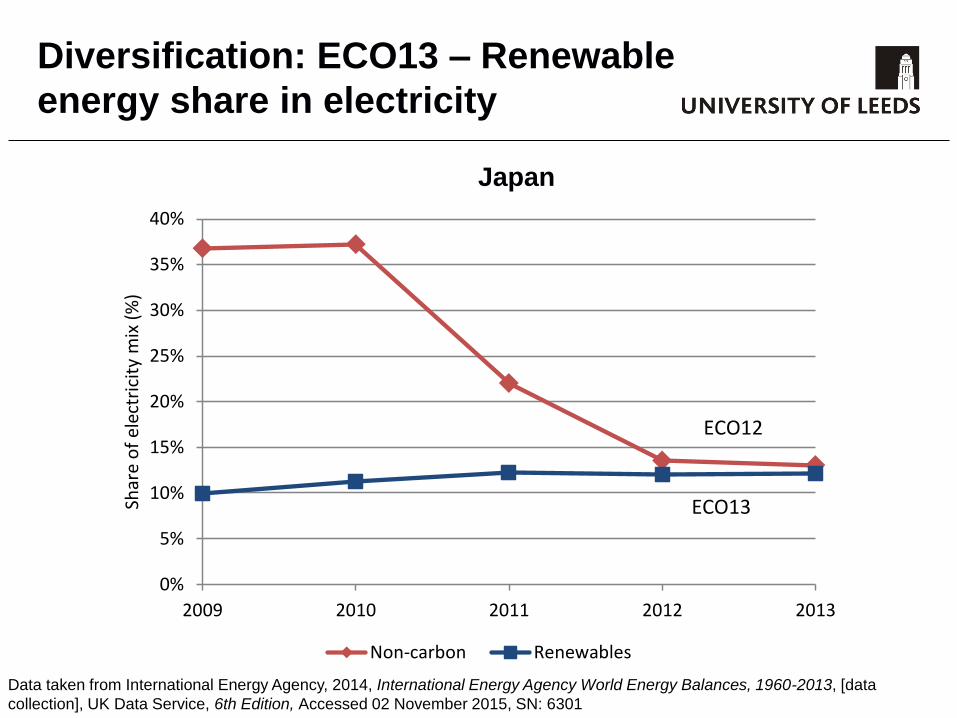
Diversification: ECO13 – Renewable
energy share in electricity
Japan
0%
5%
10%
15%
20%
25%
30%
35%
40%
2009 2010 2011 2012 2013
Shar
e o
f el
ectr
icit
y m
ix (
%)
Non-carbon Renewables
ECO12
ECO13
Data taken from International Energy Agency, 2014, International Energy Agency World Energy Balances, 1960-2013, [data
collection], UK Data Service, 6th Edition, Accessed 02 November 2015, SN: 6301
Use and production patterns (8)
Prices
ECO14 End-use energy prices by fuel and by sector
– Energy prices (with and without tax/subsidy)
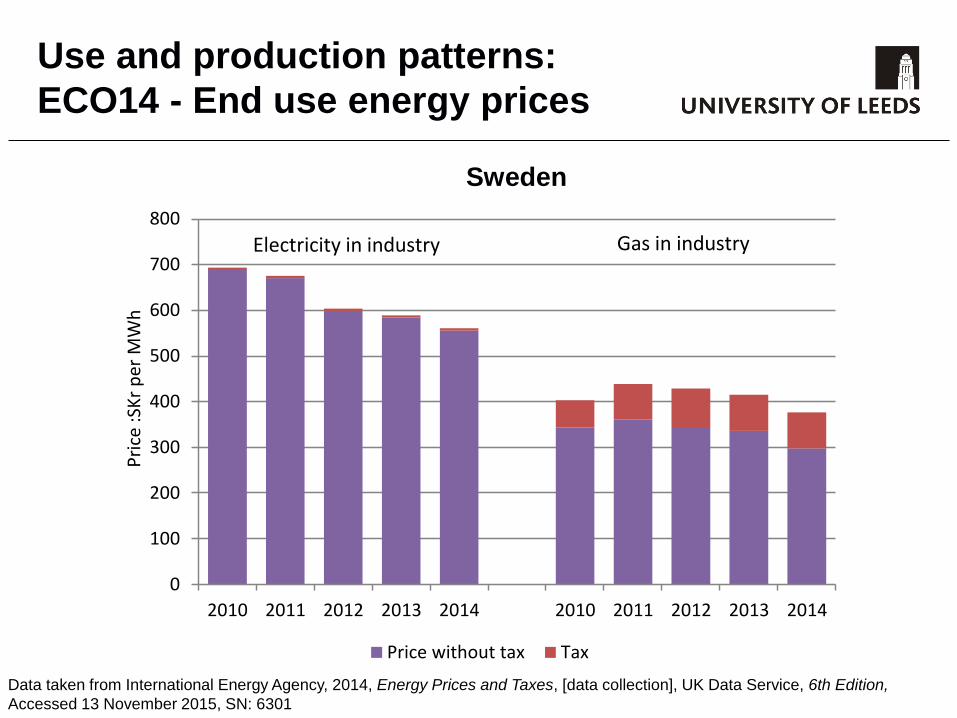
Use and production patterns:
ECO14 - End use energy prices
Sweden
0
100
200
300
400
500
600
700
800
2010 2011 2012 2013 2014 2010 2011 2012 2013 2014
Pri
ce :
SKr
per
MW
h
Price without tax Tax
Gas in industryElectricity in industry
Data taken from International Energy Agency, 2014, Energy Prices and Taxes, [data collection], UK Data Service, 6th Edition,
Accessed 13 November 2015, SN: 6301
Security
Imports
ECO15 Net energy import dependency
– Energy imports
– Total primary energy supply
Strategic Fuel Stocks
ECO16 Stocks of critical fuels per corresponding fuel
consumption
– Stocks of critical fuel (e.g. oil, gas, etc.)
– Critical fuel consumption
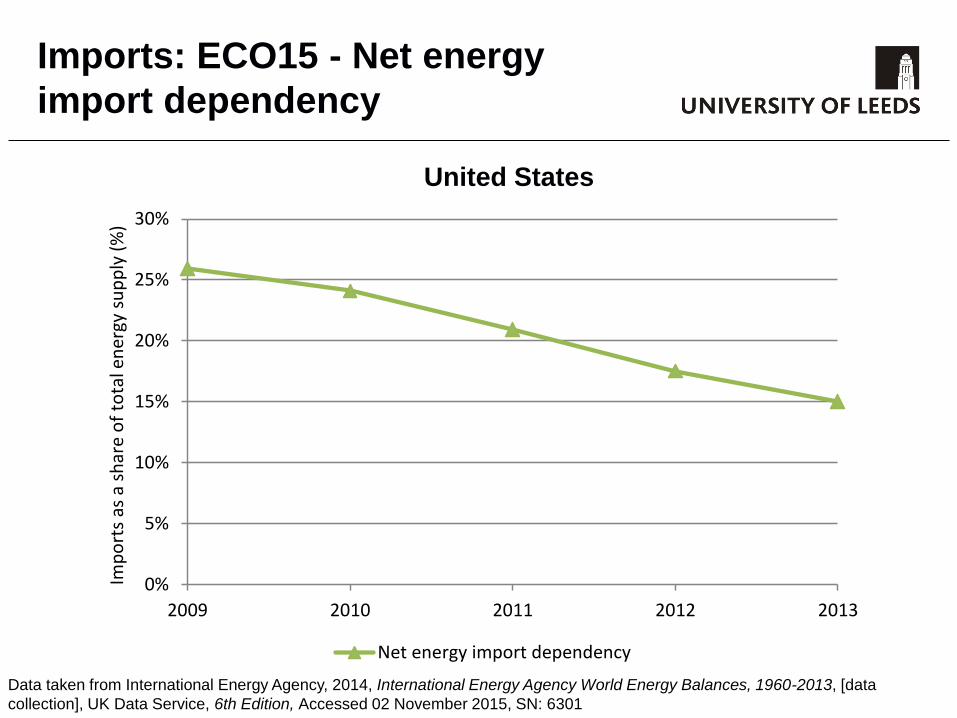
Imports: ECO15 - Net energy
import dependency
United States
0%
5%
10%
15%
20%
25%
30%
2009 2010 2011 2012 2013
Imp
ort
s as
a s
har
e o
f to
tal e
ner
gy s
up
ply
(%
)
Net energy import dependency
Data taken from International Energy Agency, 2014, International Energy Agency World Energy Balances, 1960-2013, [data
collection], UK Data Service, 6th Edition, Accessed 02 November 2015, SN: 6301
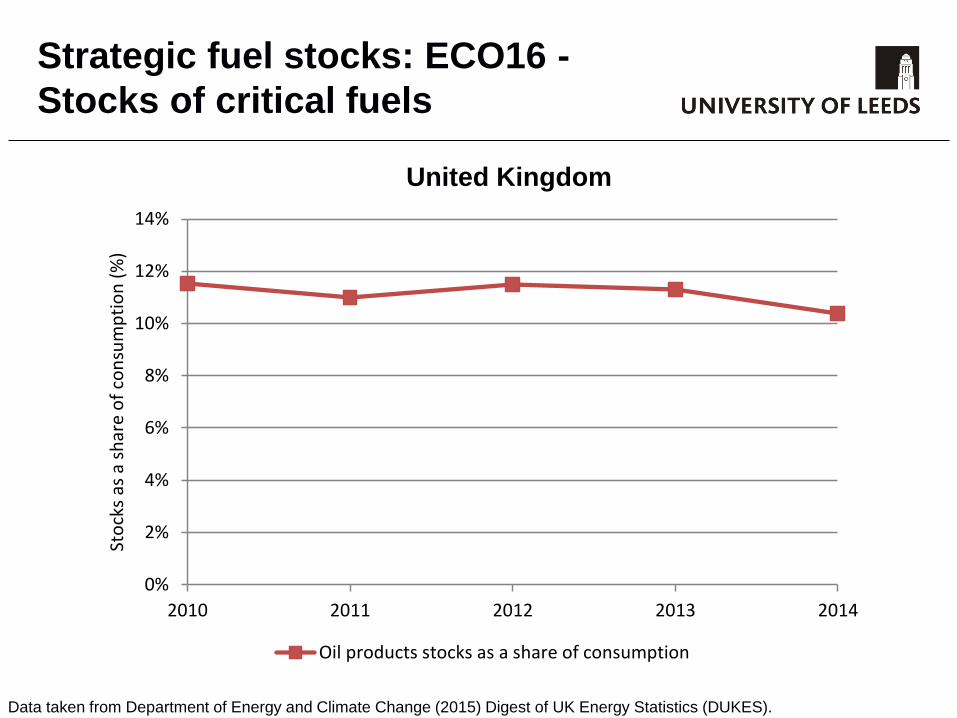
Strategic fuel stocks: ECO16 -
Stocks of critical fuels
United Kingdom
0%
2%
4%
6%
8%
10%
12%
14%
2010 2011 2012 2013 2014
Sto
cks
as a
sh
are
of
con
sum
pti
on
(%
)
Oil products stocks as a share of consumption
Data taken from Department of Energy and Climate Change (2015) Digest of UK Energy Statistics (DUKES).
Final remarks
• Energy indicators covering the economic dimension should
be used together with those examining the social and
environmental dimensions.
• Unlike some other indicators, the EISD are meant to be
used for national analyses.
• Not all indicators will be appropriate for all countries.
• Not all countries will currently have the data to construct all
indicators.
• They are intended to help countries address their energy
challenges in the most appropriate way.