A vision for the forests of the White River Watershed Future 1Future 2Future 3 Economic Indicators...
34
A vision for the forests of the White River Watershed Future 1 Future 2 Future 3 Economic Indicators Economic Indicators Economic Indicators Environmental Indicators Environmental Indicators Environmental Indicators Social/Cultural Indicators Social/Cultural Indicators Social/Cultural Indicators
-
date post
21-Dec-2015 -
Category
Documents
-
view
215 -
download
0
Transcript of A vision for the forests of the White River Watershed Future 1Future 2Future 3 Economic Indicators...

A vision for the forests of the White River Watershed
Future 1 Future 2 Future 3
EconomicIndicators
EconomicIndicators
EconomicIndicators
EnvironmentalIndicators
EnvironmentalIndicators
EnvironmentalIndicators
Social/CulturalIndicators
Social/CulturalIndicators
Social/CulturalIndicators
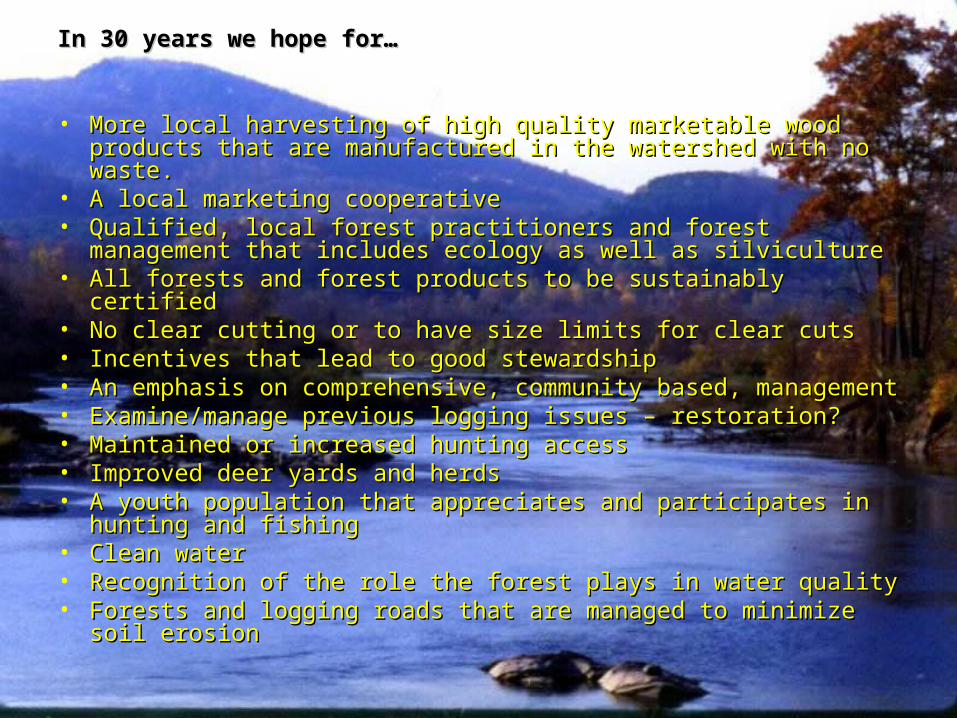
In 30 years we hope for…In 30 years we hope for…
• More local harvesting of high quality marketable wood products that More local harvesting of high quality marketable wood products that are manufactured in the watershed with no waste.are manufactured in the watershed with no waste.
• A local marketing cooperativeA local marketing cooperative• Qualified, local forest practitioners and forest management that Qualified, local forest practitioners and forest management that
includes ecology as well as silvicultureincludes ecology as well as silviculture• All forests and forest products to be sustainably certified All forests and forest products to be sustainably certified • No clear cutting or to have size limits for clear cutsNo clear cutting or to have size limits for clear cuts• Incentives that lead to good stewardshipIncentives that lead to good stewardship• An emphasis on comprehensive, community based, managementAn emphasis on comprehensive, community based, management• Examine/manage previous logging issues – restoration?Examine/manage previous logging issues – restoration?• Maintained or increased hunting accessMaintained or increased hunting access• Improved deer yards and herds Improved deer yards and herds • A youth population that appreciates and participates in hunting and A youth population that appreciates and participates in hunting and
fishingfishing• Clean waterClean water• Recognition of the role the forest plays in water qualityRecognition of the role the forest plays in water quality• Forests and logging roads that are managed to minimize soil Forests and logging roads that are managed to minimize soil
erosionerosion

• A forest that is high in biodiversity – managed for biodiversity and A forest that is high in biodiversity – managed for biodiversity and sustainabilitysustainability
• Regulation/monitoring of recreational use (ATV, snowmobile, mtn. Regulation/monitoring of recreational use (ATV, snowmobile, mtn. bikes)bikes)
• Large areas of pristine wilderness to be accessible for recreation Large areas of pristine wilderness to be accessible for recreation (define “pristine”)(define “pristine”)
• The same amount of private landsThe same amount of private lands• Landowners to have the right to harvest trees on their own landLandowners to have the right to harvest trees on their own land• Maintain current balance between private and public land as well as Maintain current balance between private and public land as well as
current wilderness designationscurrent wilderness designations• An aesthetic watershed where no littering or dumping occursAn aesthetic watershed where no littering or dumping occurs• Multiple useMultiple use• Forests to provide economic livelihood (pay taxes)Forests to provide economic livelihood (pay taxes)• A plan for emergencies (ice storms, disease, etc.)A plan for emergencies (ice storms, disease, etc.)• Management that takes into consideration possible residential Management that takes into consideration possible residential
development (i.e. subdivisions) in planning and incorporates development (i.e. subdivisions) in planning and incorporates forested areas (wilderness) into any development plansforested areas (wilderness) into any development plans
• A state that has addressed the inequities in the market A state that has addressed the inequities in the market • Increased quality/quantity of forestry educationIncreased quality/quantity of forestry education
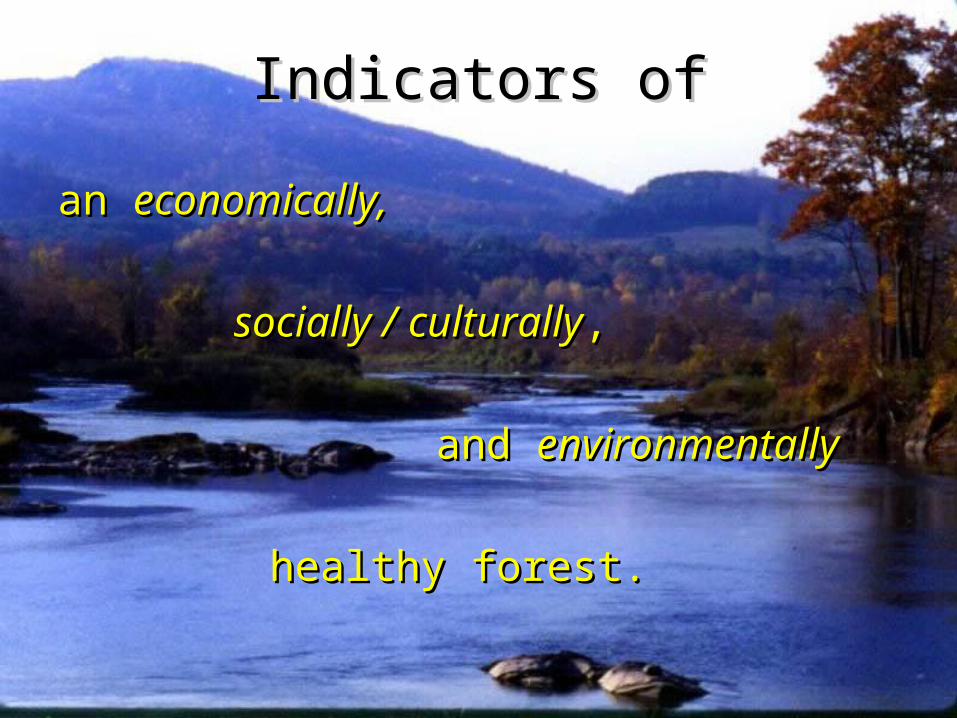
Indicators ofIndicators of
an an economically,economically,
socially / culturallysocially / culturally,,
and and environmentallyenvironmentally
healthy forest.healthy forest.

What is the current status and What is the current status and trend of an indicator?trend of an indicator?

Indicators of anIndicators of aneconomically healthy foresteconomically healthy forest
• Number/amount of products manufactured in the watershed • Number/amount of products/logs exported (need clarification)• List of primary/secondary manufacturers• Impediments to new manufacturing (start-ups) --
legal/social/economic• Number of foresters living and working in the watershed• Number of acres of forests certified • Board feet harvested annually in the watershed • Number of visitor days to the area

Forest Inventory and Stumpage ValueForest Inventory and Stumpage ValueKelsey CorneliusKelsey Cornelius
• Forest land covers 84% of the White River Basin (Vermont Agency of Natural Resources 2002)
• Comparison of Size Class, Growing Stock Volume, Sawtimber Volume, Stumpage Value for two endpoints:– George D. Aiken Resource Conservation and Development
Report, 1970.– Forest Service, Northeastern Forest Inventory & Analysis, 1997
(data for Orange, Rutland, Washington, Windsor and Addison counties).
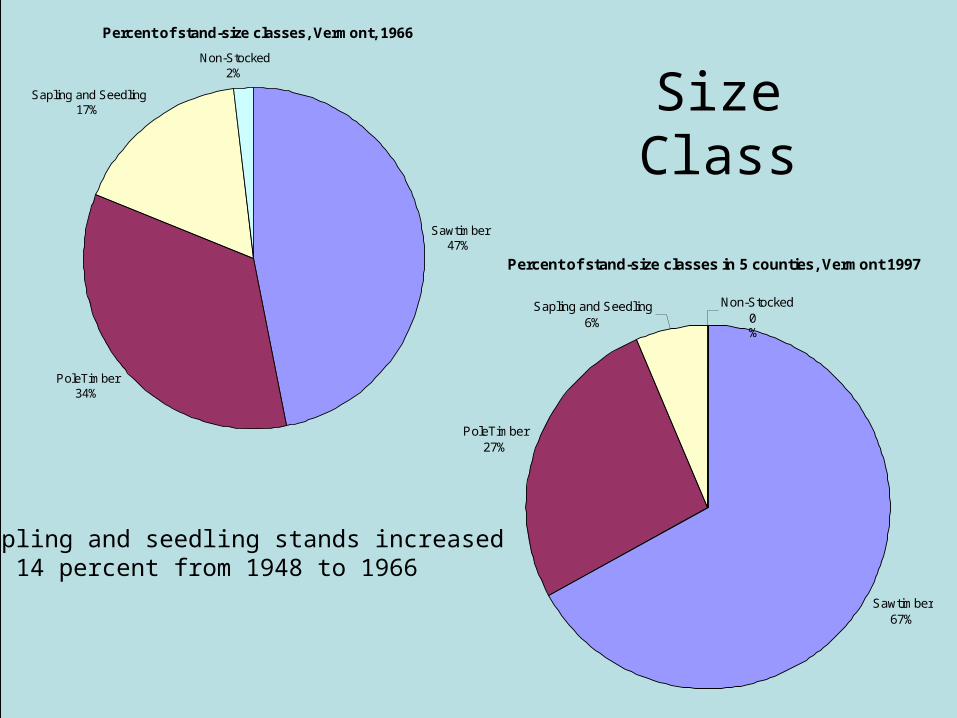
SizeClass
Percent of stand-size classes, Vermont, 1966
Sawtimber 47%
PoleTimber 34%
Sapling and Seedling 17%
Non-Stocked 2%
Percent of stand-size classes in 5 counties, Vermont 1997
Sawtimber 67%
PoleTimber 27%
Sapling and Seedling 6%
Non-Stocked 0%
Sapling and seedling stands increasedby 14 percent from 1948 to 1966
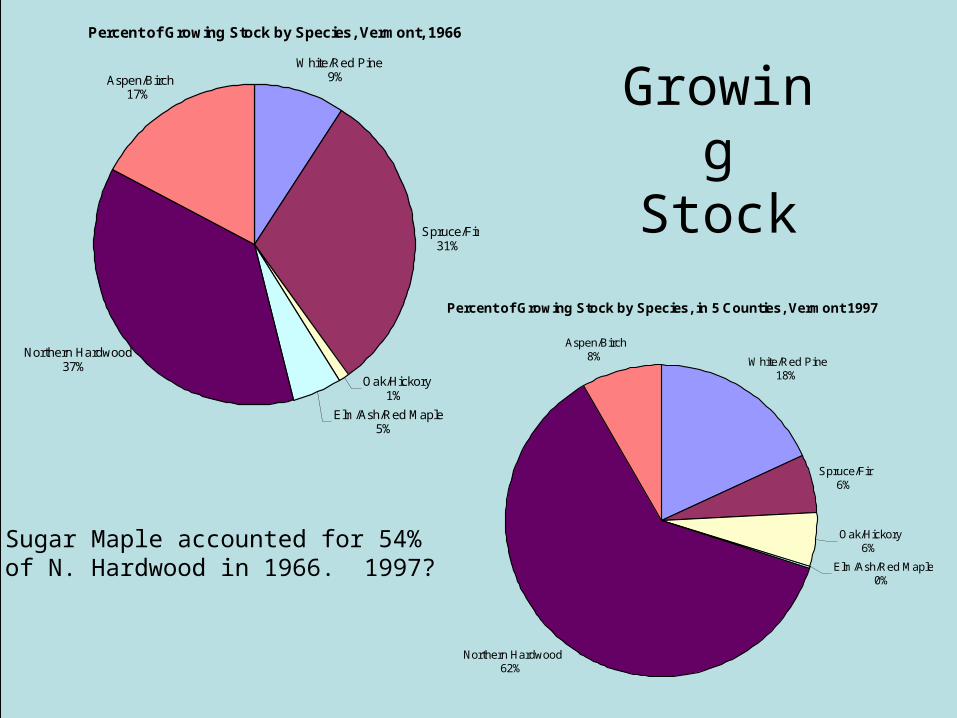
GrowingStock
Percent of Growing Stock by Species, Vermont, 1966 White/Red Pine
9%
Spruce/Fir 31%
Oak/Hickory 1%
Elm/Ash/Red Maple 5%
Northern Hardwood 37%
Aspen/Birch 17%
Percent of Growing Stock by Species, in 5 Counties, Vermont 1997
White/Red Pine 18%
Spruce/Fir 6%
Oak/Hickory 6%
Elm/Ash/Red Maple 0%
Northern Hardwood 62%
Aspen/Birch 8%
Sugar Maple accounted for 54%of N. Hardwood in 1966. 1997?
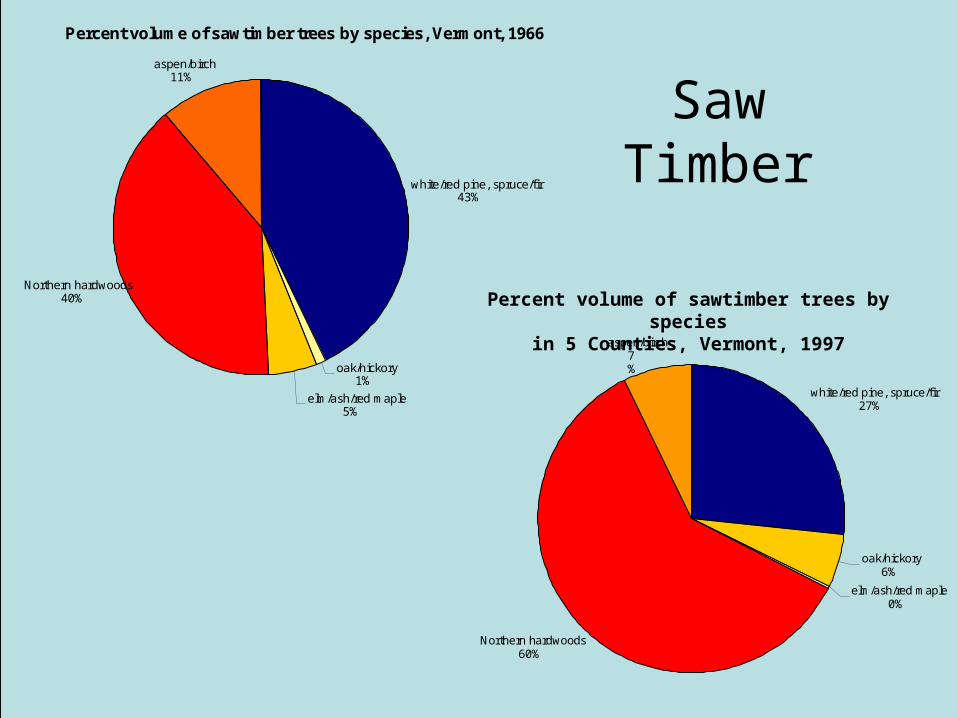
SawTimber
Percent volume of sawtimber trees by species, Vermont, 1966
white/red pine, spruce/fir 43%
oak/hickory 1%
elm/ash/red maple 5%
Northern hardwoods 40%
aspen/birch 11%
white/red pine, spruce/fir 27%
oak/hickory 6%
elm/ash/red maple 0%
Northern hardwoods 60%
aspen/birch 7%
Percent volume of sawtimber trees by speciesin 5 Counties, Vermont, 1997
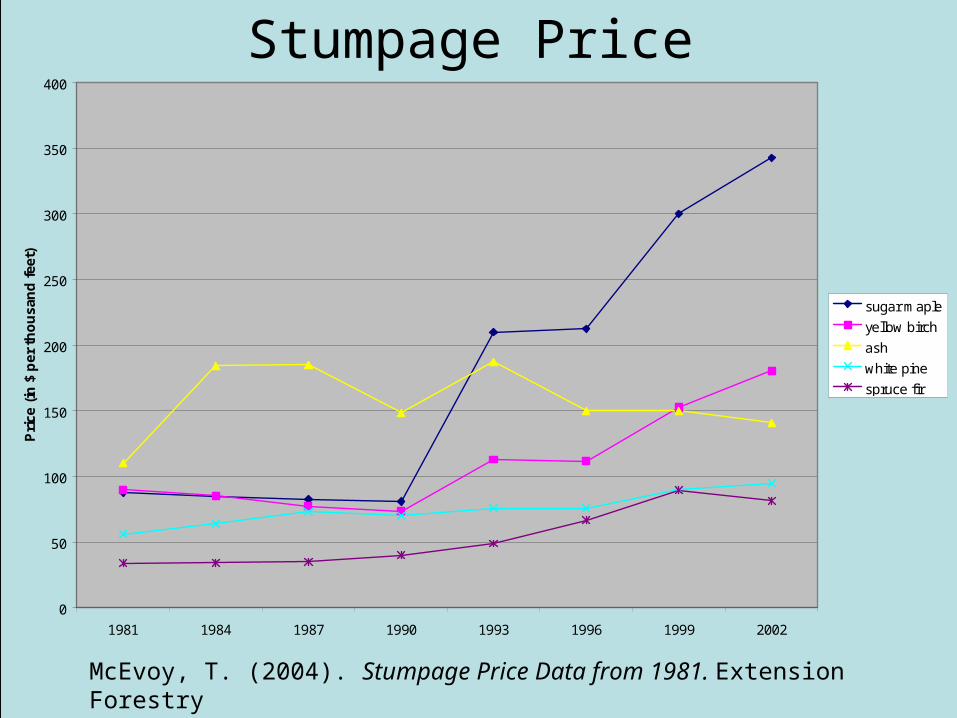
Stumpage Prices of Different Species
0
50
100
150
200
250
300
350
400
1981 1984 1987 1990 1993 1996 1999 2002
Pri
ce (
in $
pe
r th
ou
san
d f
eet)
sugar maple
yellow birch
ash
white pine
spruce fir
McEvoy, T. (2004). Stumpage Price Data from 1981. Extension Forestryin Vermont. Retrieved from http://stumpage.uvm.edu/19813.html
Stumpage Price

Forest Products Industry: Primary ProductionForest Products Industry: Primary ProductionAdam LucasAdam Lucas
• Sawmills, 2002– Vermont = 185 (187 in 1995)– White River Watershed = 12
Six with annual production > 100 MbfSix with annual production < 100 Mbf
• Interviewed Gabriel Bolton of Wagner Forest Management on direct and indirect impacts of primary production, including excavating contractors, fuel purchase for equipment, purchase of parts for equipment, maintenance of equipment, some local housing when necessary, and use of local markets and stores, property taxes, recreation use.
• Year 2000 employment in (1) Farming, Fishing, and Forestry (FFF), and (2) Agriculture, Forestry, Fishing and Hunting, and Mining occupations (AFFM)
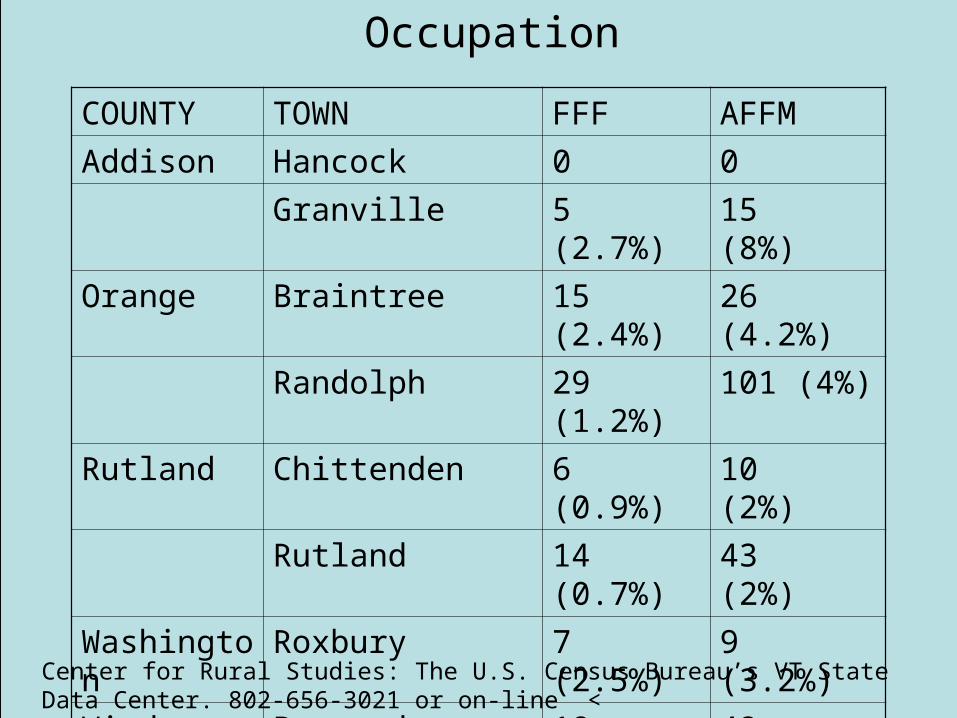
COUNTY TOWN FFF AFFM
Addison Hancock 0 0
Granville 5 (2.7%) 15 (8%)
Orange Braintree 15 (2.4%) 26 (4.2%)
Randolph 29 (1.2%) 101 (4%)
Rutland Chittenden 6 (0.9%) 10 (2%)
Rutland 14 (0.7%) 43 (2%)
Washington Roxbury 7 (2.5%) 9 (3.2%)
Windsor Barnard 18 (3.6%) 42 (8.4%)
Rochester 10 (1.6%) 30 (4.8%)
White River Junct. 5 (0.4%) 5 (0.4%)
Center for Rural Studies: The U.S. Census Bureau’s VT State Data Center. 802-656-3021 or on-line < http://crs.uvm.edu/census/2000dps/ >
Occupation

Forest Products Industry: Secondary ProductionForest Products Industry: Secondary ProductionPaula ZampieriPaula Zampieri
• Economic Impact of the Value-Added Portion of the Forest and Wood Products Industry in Vermont, 2001:– $300 million in VT personal income– 6.2% of VT employment (down from 16.5% in 1987)

Value Added Products State wide Watershed wide
Architectural Millwork 31 1 Bentwood 11 0 Custom Cabinets 63 1 Carvings/ Sculptures 40 0 Furniture/ custom 84 1 Furniture, Outdoor 16 0 Furniture, Parts 26 1 Furniture Production 37 1 Millworks 26 1 Moldings 31 1 Picture Frames 29 1 Toys 29 0 Turnings 26 0 Woodenware 38 3
Selection of Manufactured State Watershed Forest Products
Source: Agency of Commerce and Community Development, State of Vermont Secondary Wood Products Industry: Study and Strategic Plan, January 10, 2002.
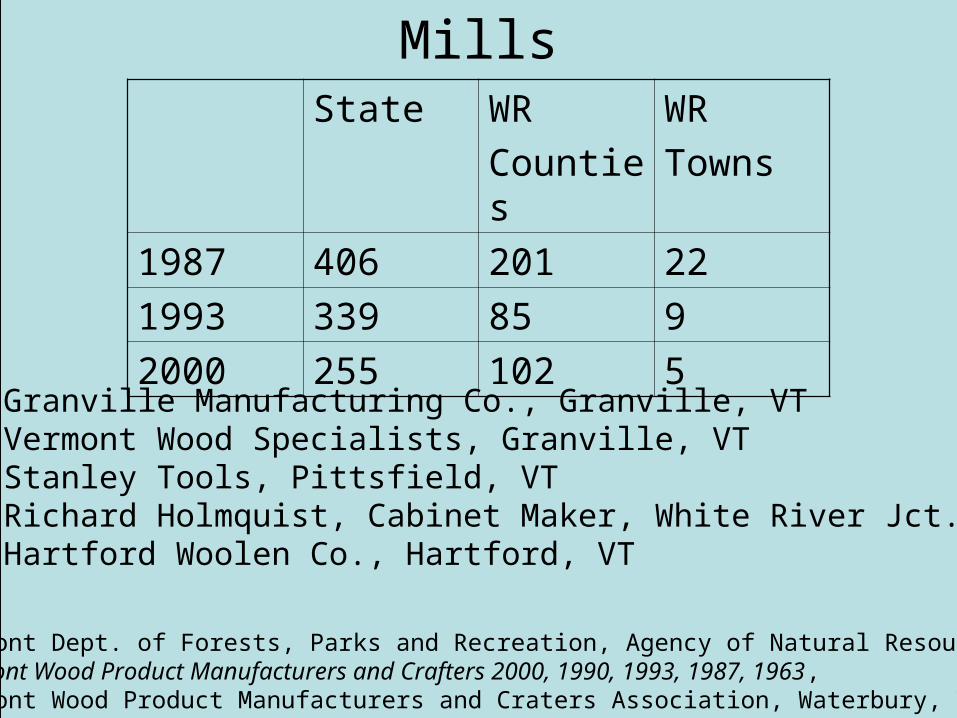
Mills
Vermont Dept. of Forests, Parks and Recreation, Agency of Natural Resources, Vermont Wood Product Manufacturers and Crafters 2000, 1990, 1993, 1987, 1963,Vermont Wood Product Manufacturers and Craters Association, Waterbury, VT.
State WR
Counties
WR
Towns
1987 406 201 22
1993 339 85 9
2000 255 102 5
• Granville Manufacturing Co., Granville, VT• Vermont Wood Specialists, Granville, VT• Stanley Tools, Pittsfield, VT• Richard Holmquist, Cabinet Maker, White River Jct., VT • Hartford Woolen Co., Hartford, VT
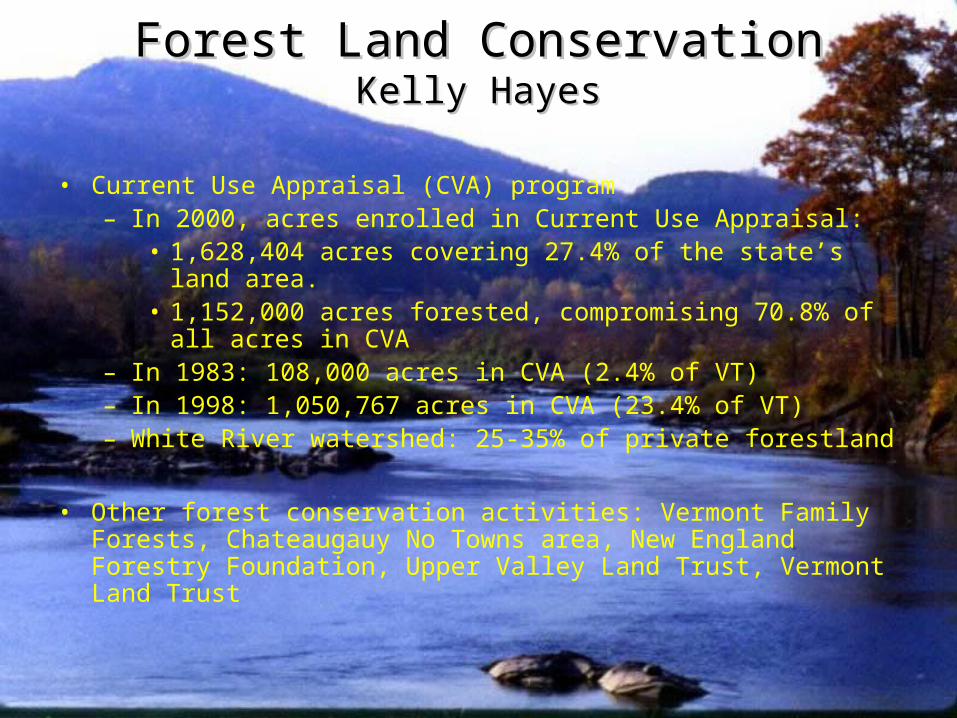
Forest Land ConservationForest Land ConservationKelly HayesKelly Hayes
• Current Use Appraisal (CVA) program– In 2000, acres enrolled in Current Use Appraisal:
• 1,628,404 acres covering 27.4% of the state’s land area.• 1,152,000 acres forested, compromising 70.8% of all acres in
CVA– In 1983: 108,000 acres in CVA (2.4% of VT)– In 1998: 1,050,767 acres in CVA (23.4% of VT) – White River watershed: 25-35% of private forestland
• Other forest conservation activities: Vermont Family Forests, Chateaugauy No Towns area, New England Forestry Foundation, Upper Valley Land Trust, Vermont Land Trust
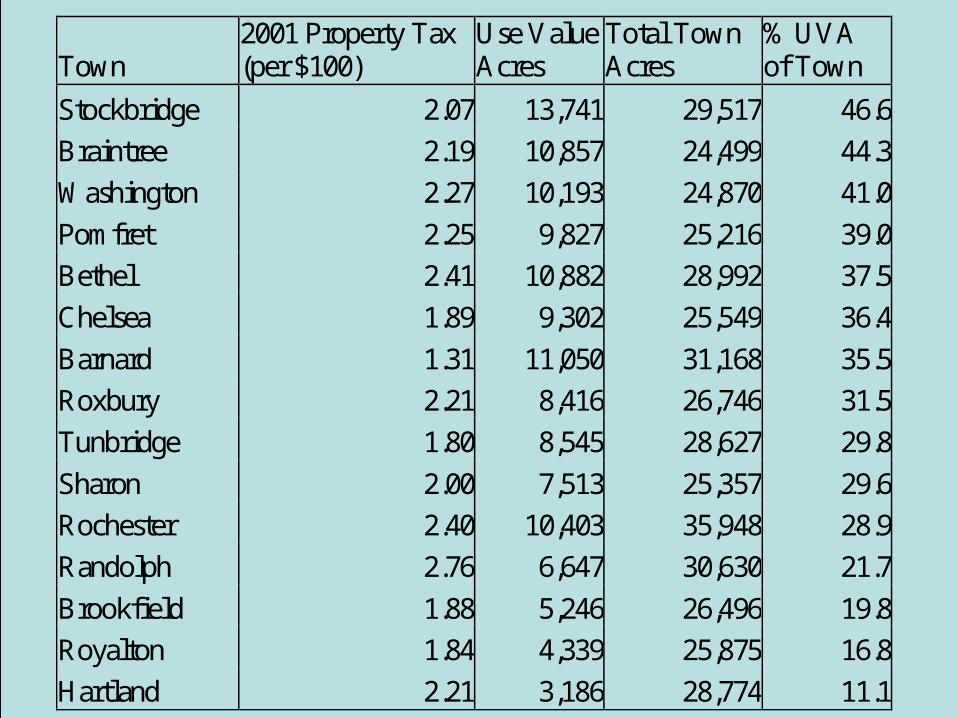
Town 2001 Property Tax (per $100)
Use Value Acres
Total Town Acres
% UVA of Town
Stockbridge 2.07 13,741 29,517 46.6
Braintree 2.19 10,857 24,499 44.3
Washington 2.27 10,193 24,870 41.0
Pomfret 2.25 9,827 25,216 39.0
Bethel 2.41 10,882 28,992 37.5
Chelsea 1.89 9,302 25,549 36.4
Barnard 1.31 11,050 31,168 35.5
Roxbury 2.21 8,416 26,746 31.5
Tunbridge 1.80 8,545 28,627 29.8
Sharon 2.00 7,513 25,357 29.6
Rochester 2.40 10,403 35,948 28.9
Randolph 2.76 6,647 30,630 21.7
Brookfield 1.88 5,246 26,496 19.8
Royalton 1.84 4,339 25,875 16.8
Hartland 2.21 3,186 28,774 11.1

Indicators of asocially/culturally healthy forest
• Number of acres clearcut each year and size of those cutsNumber of acres clearcut each year and size of those cuts• Presence of a single watershed wide foresterPresence of a single watershed wide forester• Number of acres of private land open to hunting and recreationNumber of acres of private land open to hunting and recreation• Deer hunting and habitatDeer hunting and habitat• Town recreation plans are coordinated Town recreation plans are coordinated • Number of recreational accessesNumber of recreational accesses• Acres of land that are roadlessAcres of land that are roadless• Restrictions on right to harvest on own landRestrictions on right to harvest on own land• Number of acres in private/public ownershipNumber of acres in private/public ownership• State/federal land management plans (?)State/federal land management plans (?)• Number of forestry programs in local high schoolsNumber of forestry programs in local high schools• Incentives available to encourage teachers to include forestryIncentives available to encourage teachers to include forestry• Number of forestry education opportunities in the watershed Number of forestry education opportunities in the watershed
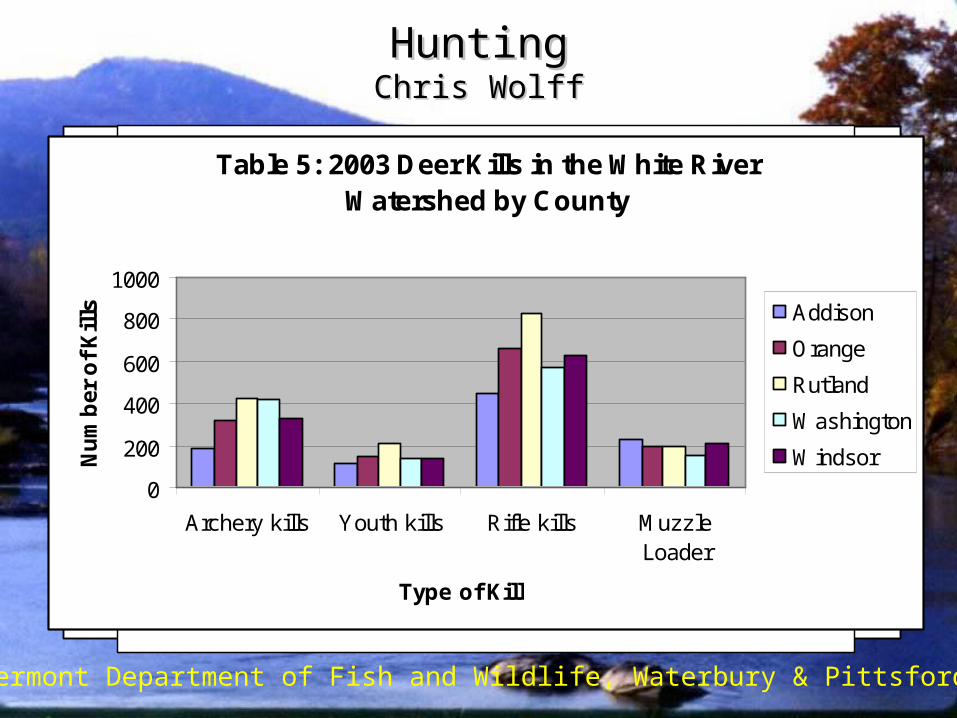
HuntingHuntingChris WolffChris Wolff
Table 1: Total Resident and Non-Resident License Sales 1987 - 2003
020000400006000080000
100000120000140000160000180000
1987
1989
1991
1993
1995
1997
1999
2001
2003
Year
Nu
mb
er
of
Lic
en
se
s S
old
Total Resident
Total Non-Resident
Arc
he
ry k
ills
Yo
uth
kill
s
Rifl
e k
ills
Mu
zzle
Lo
ad
er
To
tals
2002 Deer Kills
2003 Deer Kills
6578
997
3148
7561677
8415
1620
4169
7131913 0100020003000400050006000700080009000
Number of Kills
Type of Kill
Table 3: Comparison of Deer Kills Between 2002 and 2003 in the White River Watershed, VT
Table 5: 2003 Deer Kills in the White River Watershed by County
0
200
400
600
800
1000
Archery kills Youth kills Rifle kills MuzzleLoader
Type of Kill
Nu
mb
er o
f K
ills Addison
Orange
Rutland
Washington
Windsor
Source: Vermont Department of Fish and Wildlife, Waterbury & Pittsford Offices

FishingFishingDave RosaDave Rosa
• Interviews with Mike Stidena (Fishing Guide), Ron Rhodes (WRP Board), Brad Yoder (Fishing Guide)– Past ten years has seen two 100-year floods– Main stem from Bethel to Rochester, only caught 2 brook trout in
past 12 years– 99% mortality rate on stocked fish, due primarily to high temps– River is perhaps “too clean”, with not enough nutrients– Some evidence of overfishing– However, guiding business is strong
• Stats. from Vermont Fish and Wildlife Department
Fishing License Sales - Resident & Non-Resident 1987 - 2003
0
5000
10000
15000
20000
25000
30000
35000
40000
45000
50000
55000
60000
65000
70000
75000
80000
85000
90000
95000
100000
105000
110000
Year
ResidentLicense Sales
Non-ResidentLicense Sales

Hiking Trail Access and UseHiking Trail Access and UseChris AnderbergChris Anderberg
• 443.73 miles of hiking trails in the White River Watershed (Vermont Center for Geographic Information, 2002), including:
– Randolph Town Forest Trails Clark Brook Trail– Ainsworth State Park Trails Middlebury Gap– Mount Cushman State Forest Trails Silent Cliff Trail– Hancock Branch Trail Brandon Gap– Mt. Horrid (Brandon gap N) Great Cliff Trail– Mount Horrid Overlook Chittenden Brook Trail– Liberty Hill Texas Gap Trail– Barnard Trail Long Trail (portion)– Appalachian Trail (portions)
County Hiking/Walking
Permitted Public Private Total Addison 45 3 48 Orange 4 1 5 Rutland 35 8 43 Washington 33 3 36 Windsor 34 3 37 Grand Totals 151 18 169
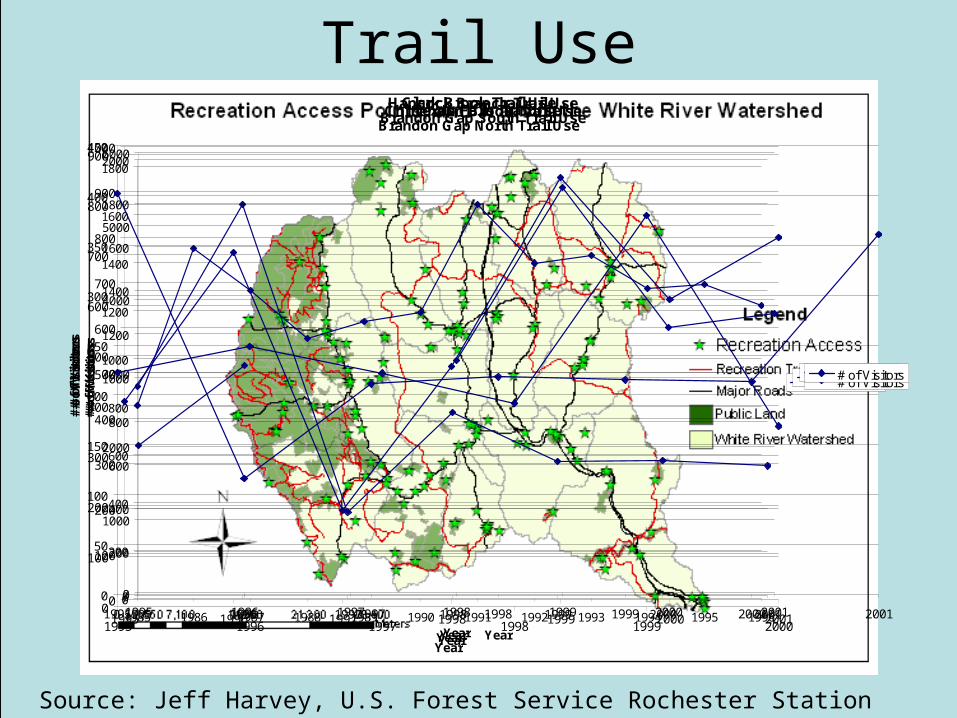
Trail UseBrandon Gap North Trail Use
0
200
400
600
800
1000
1200
1400
1600
1800
1985 1986 1987 1988 1989 1990 1991 1992 1993 1994 1995 1996
Year
# o
f V
isit
ors
# of Visitors
Brandon Gap South Trail Use
0
200
400
600
800
1000
1200
1400
1600
1800
2000
1995 1996 1997 1998 1999 2000 2001
Year
# o
f V
isit
ors
# of Visitors
Texas Falls Trail Use
0
1000
2000
3000
4000
5000
6000
1995 1996 1997 1998 1999 2000 2001
Year
# o
f V
isit
ors
# of Visitors
Chittenden Brook Trail Use
0
100
200
300
400
500
600
700
800
900
1995 1996 1997 1998 1999 2000
Year
# o
f V
isit
ors
# of Visitors
Hancock Branch Trail Use
0
100
200
300
400
500
600
700
800
900
1000
1995 1996 1997 1998 1999 2000 2001
Year
# o
f V
isit
ors
# of Visitors
Clark Brook Trail Use
0
50
100
150
200
250
300
350
400
450
1995 1996 1997 1998 1999 2000 2001
Year
# o
f V
isit
ors
Source: Jeff Harvey, U.S. Forest Service Rochester Station

Snowmobile Access and UseSnowmobile Access and UseTaylor CameronTaylor Cameron
• Vermont Association of Snow Travelers (VAST)– 140 clubs statewide– Over 45,000 members combined
• Nearly eighty percent of the 4500 miles of trail in Vermont are on private lands
• Expenditures:– Average of $511 million spent on snowmobiles, accessories, and
trips in Vermont– A typical snowmobiler will spend close to $4,000 on snowmobile
related expenses annually, will ride an average of 990 miles in a year, and will spend 7.2 nights in a hotel or resort while riding
• ATV use on VAST trails has caused a great deal of conflict as ATV popularity grows

Forest EducationForest EducationBrianna ParkeBrianna Parke
• K-12 Programs in Vermont’s 285 public schools– 10 of 21 vocational technology centers list forestry or natural
resources programs (1996)– The Great Northern Forest Curriculum, Fairbanks
Museum/Planetarium, St. Johnsbury, VT – VT Fish & Wildlife programs: Fall Naturalist, Project Learning
Tree, and Project Wild – VT Dept. of Forest, Parks, and Recreation programs
• Forestry education: UVM Extension Forestry, technical workshops through Dept of Forest, Parks and Recreation, Consulting Foresters Assoc. of VT, VT Professional Loggers Assoc., Logger Education to Advance Professionalism (LEAP)
• Land owners and general public: Center for Northern Studies, Sterling College, VT Youth Conservation Corp., UVM
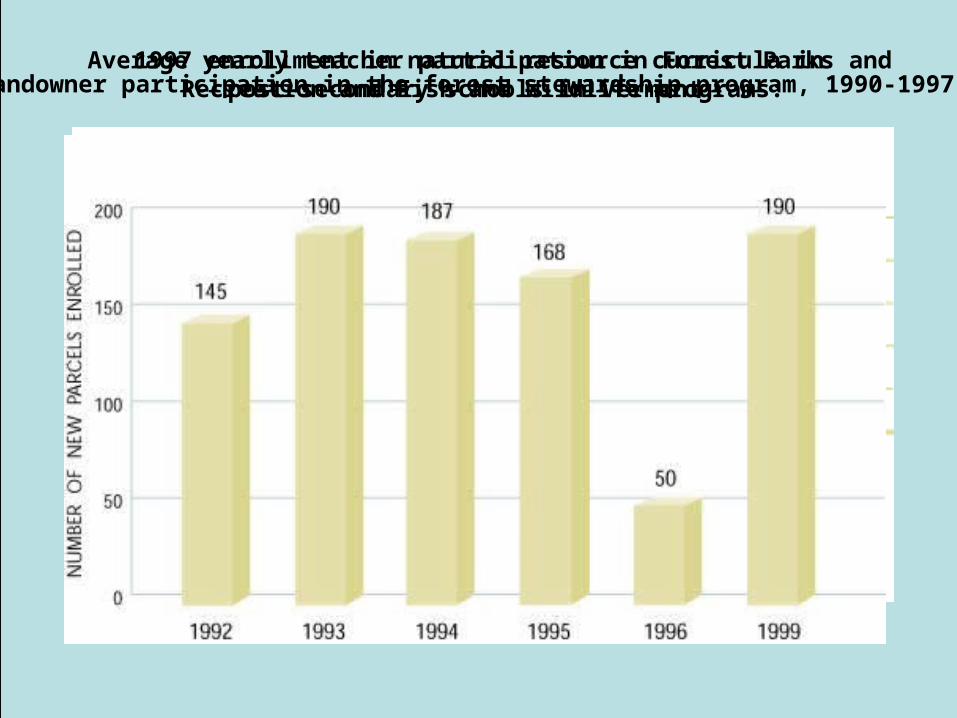
Average yearly teacher participation in Forest Parks andRecreation and Fish and Wildlife programs:
1997 enrollment in natural resource curricula inpost-secondary schools in Vermont: Landowner participation in the forest stewardship program, 1990-1997:
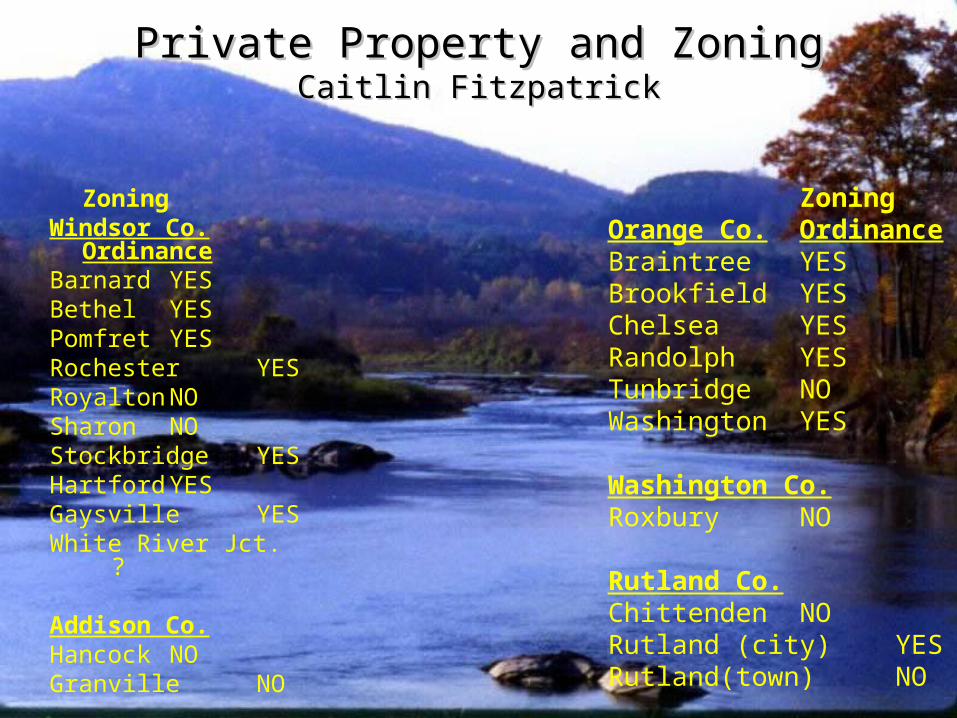
Private Property and ZoningPrivate Property and ZoningCaitlin FitzpatrickCaitlin Fitzpatrick
ZoningWindsor Co.
OrdinanceBarnard YESBethel YESPomfret YESRochester YESRoyalton NOSharon NOStockbridge YESHartford YESGaysville YESWhite River Jct. ?
Addison Co.Hancock NOGranville NO
ZoningOrange Co. OrdinanceBraintree YESBrookfield YESChelsea YESRandolph YESTunbridge NOWashington YES
Washington Co.Roxbury NO
Rutland Co.Chittenden NORutland (city) YESRutland(town) NO

Indicators of anenvironmentally healthy forest
• Number of forest management plans that include ecology as well as Number of forest management plans that include ecology as well as tree productiontree production
• Number of acres in land trust, easements, current useNumber of acres in land trust, easements, current use• Cost sharing programs – communities/federal/state (?)Cost sharing programs – communities/federal/state (?)• All loggers in the watershed are trained in the application of BMP’s All loggers in the watershed are trained in the application of BMP’s
(?)(?)• Healthy, sustainable deer herdHealthy, sustainable deer herd• Develop list of habitat characteristics (?)Develop list of habitat characteristics (?)• Monitoring water in all logging operations (not just clear cuts)Monitoring water in all logging operations (not just clear cuts)• Pre- and post- monitoring of logging jobs (temperature/turbidity)Pre- and post- monitoring of logging jobs (temperature/turbidity)• Miles of class IV roads managed by towns Miles of class IV roads managed by towns

Deer Yards and Biological DiversityDeer Yards and Biological DiversityDan EvansDan Evans
• An estimated 40,691 acres of deer yards in the White River Watershed– 15,554 acres (38 %) are located within 100 meters of major roads
– 14,789 acres (36 %) located outside of high risk areas, not including those on public land
– 3,681 acres (11 %) are located on public / conserved lands


Soil Protection and Water QualitySoil Protection and Water QualityCarla Fenner and Christina TwomeyCarla Fenner and Christina Twomey

Best Management PracticeBest Management PracticeKyle ClarkKyle Clark
• Acceptable Management Plan paper, effective as of August 15, 1987
– Practice #1: “Steep pitches (greater than 10%) on permanent truck roads shall not exceed 300 feet in length.
– Practice #4: “Drainage ditches shall not terminate where they will feed water directly into streams or other surface waters”
– Practice #10: “Logging activities, except for the necessary and proper construction of stream crossing structures, shall be kept out of stream channels.”
• Use Value Appraisal (UVA) law, 1978 1. To keep Vermont’s agricultural and forested land productive,2. To slow development on these lands, and3. To establish greater equity in property taxation on undeveloped
land. Statutory changes: Act 220 (1984), Act 262 (1986), Act 57 (1987),
Act 200 (1988), Act 178 (1996) and Act 60 (1998) • Forest Stewardship Program

Fish Habitat and StockingFish Habitat and StockingColin KaferleColin Kaferle
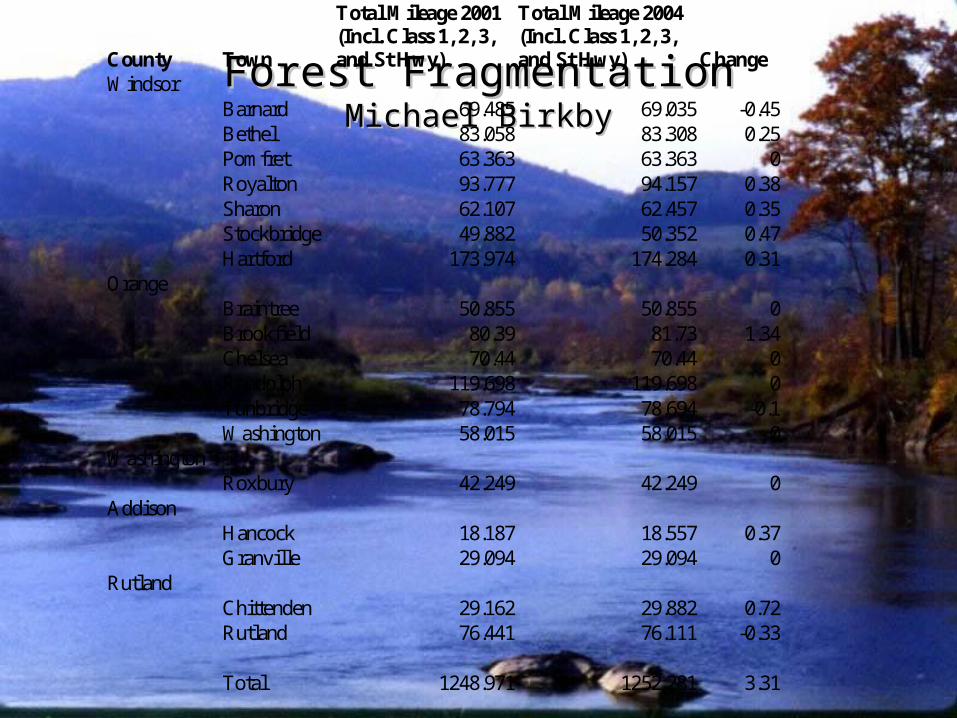
Forest FragmentationForest FragmentationMichael BirkbyMichael Birkby
County Town
Total Mileage 2001 (Incl. Class 1, 2, 3, and St Hwy)
Total Mileage 2004 (Incl. Class 1, 2, 3, and St Hwy) Change
Windsor Barnard 69.485 69.035 -0.45 Bethel 83.058 83.308 0.25 Pomfret 63.363 63.363 0 Royalton 93.777 94.157 0.38 Sharon 62.107 62.457 0.35 Stockbridge 49.882 50.352 0.47 Hartford 173.974 174.284 0.31 Orange Braintree 50.855 50.855 0 Brookfield 80.39 81.73 1.34 Chelsea 70.44 70.44 0 Randolph 119.698 119.698 0 Tunbridge 78.794 78.694 -0.1 Washington 58.015 58.015 0 Washington Roxbury 42.249 42.249 0 Addison Hancock 18.187 18.557 0.37 Granville 29.094 29.094 0 Rutland Chittenden 29.162 29.882 0.72 Rutland 76.441 76.111 -0.33 Total 1248.971 1252.281 3.31