GROUNDNUT MARKET VALUE CHAIN PROFILE 2013 … Publications... · 1 GROUNDNUT MARKET VALUE CHAIN...
39
1 GROUNDNUT MARKET VALUE CHAIN PROFILE 2013 Department of Agriculture, Forestry and Fisheries Directorate Marketing Private Bag X 15 Arcadia 0007 Tel: 012 319 8455/6 Fax: 012 319 8131 Email: [email protected]
Transcript of GROUNDNUT MARKET VALUE CHAIN PROFILE 2013 … Publications... · 1 GROUNDNUT MARKET VALUE CHAIN...
1
GROUNDNUT MARKET VALUE CHAIN PROFILE
2013
Department of Agriculture, Forestry and Fisheries
Directorate Marketing Private Bag X 15
Arcadia 0007
Tel: 012 319 8455/6 Fax: 012 319 8131
Email: [email protected]

2
TABLE OF CONTENTS
1. DESCRIPTION OF THE INDUSTRY ...............................................................................................3
1.1. Producing Areas ...........................................................................................................................3
1.2. Production Trends ...................................................................................................................5
2. MARKET STRUCTURE ...................................................................................................................6
2.1. Domestic Market and Prices ....................................................................................................6
2.2. Exports .........................................................................................................................................8
2.3. Share Analysis ....................................................................................................................... 20
2. 4. Imports ...................................................................................................................................... 23
2.5. Processing ............................................................................................................................. 26
2.6 Market Value Chain ............................................................................................................... 29
3. Market Intelligence ......................................................................................................................... 30
3.1 Tariffs ..................................................................................................................................... 30
3.2. Performance of the groundnut industry .................................................................................. 34
4. ACKNOWLEDGEMENTS .................................................................................................................. 39

3
1. DESCRIPTION OF THE INDUSTRY Groundnuts contribute approximately 1.1% to the gross value of field crops and the average annual gross value of groundnuts for the previous ten years up to 2010/11 season amounts to approximately R 373 800 million. Groundnuts can be consumed in an unprocessed state, but they also serve in the economy as raw materials for the manufacturing of various products. These include, but not limited to, the manufacturing of such products as peanuts, peanut butter, sweets and cooking oil. The production of groundnuts is highly affected by the costs of production inputs as well as the demand for groundnuts. The contribution of the groundnut industry to the gross value of agricultural production is summarized in Figure 1.
Source: Statistics and Economic Analysis
The gross value of groundnut production, as shown in Figure 1, was relatively higher during 2002/03 season and this was followed by a slight increase in the gross value of groundnut production during 2003/04 season. The contribution of the groundnut industry to the gross value of agricultural production was characterized by fluctuations throughout the period under analysis with some consistent increases between 2006/07 and 2008/09 seasons. The gross value of production has reached the highest level during 2008/09 mainly as a result of relatively higher levels of production coupled with higher producer prices at the time. The contribution of the groundnut industry to the GVP declined slightly between 2009/10 and 2010/11 seasons and this was followed by a slight increase during 2011/12 season.
1.1. Producing Areas
Figure 2 below shows the contribution of each province to the total groundnuts production in South Africa. The figure clearly indicates that the groundnuts are produced mainly in three provinces, namely
0 100000 200000 300000 400000 500000 600000 700000 800000
R'0
00
Years
Figure 1: Groundnut Gross Value of Agricultural products

4
the Free state (37%),Northern Cape (29%) and North West Province (28%).. Groundnuts are also produced in Limpopo, KwaZulu-Natal and Gauteng provinces although the production is lower in these provinces.
Source: Statistics and Economic Analysis Table 1: Groundnut production by provinces
PROVINCE Production (tons) 2006/07
Production (tons) 2007/08
Production (tons) 2008/09
Production (tons) 2009/10
Production (tons) 2010/11
Production (tons) 2011/12
Northern Cape
21700 21500 31 000 27 120 18 950 16900
Free State 21 000 35 700 33 690 35 000 20 700 21800
Kwazulu-Natal
30 80 0 300 0 150
Limpopo 2 200 5 810 6 750 3 520 3 500 3350
North West 13 000 25 650 28 000 22 000 20 900 16800
Gauteng 50 60 60 60 0 0
Source: Statistics and Economic Analysis
Table 1 indicates that during the past three years Free State Province has been the major producer of groundnuts even though groundnut production in this province has experienced considerable fluctuations during this period. Northern Cape is the second largest producer of groundnuts after Free State. However North West Province increased its production significantly during 2007/08 and surpassed Northern Cape’s production volumes. Notably, groundnut production in all the major producing regions, except in Northern Cape, has undergone a drastic increase during 2007/08 season, leading to a slight increase in South Africa’s total groundnuts production. During 2010/11 season groundnuts production from provinces such as Free State and North West increased while production
Northern Cape 29%
Free State 37%
Kwazulu-Natal 0%
Limpopo 6%
Gauteng 0%
North West 28%
Figure 2: Groundnuts Production by Province 2011/12
5
remained low in Gauteng and Kwazulu Natal provinces for the past six seasons. The volumes of groundnut production declined slightly in some provinces during 2011/12 season.
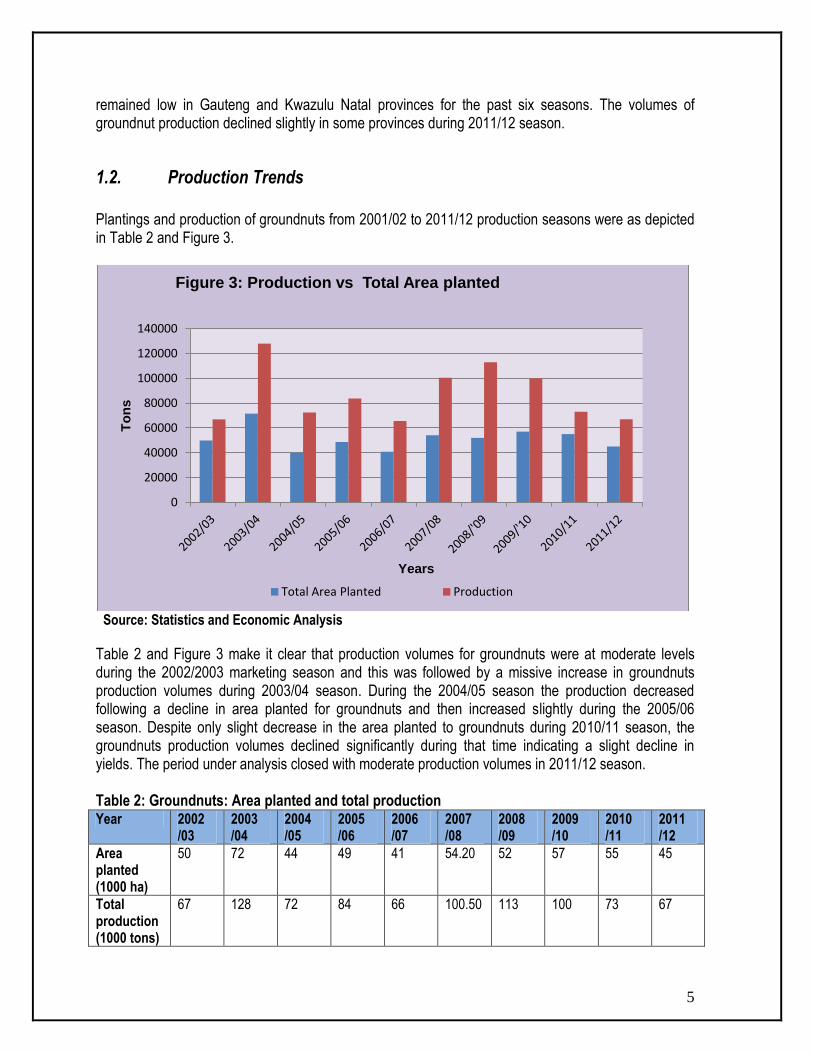
1.2. Production Trends
Plantings and production of groundnuts from 2001/02 to 2011/12 production seasons were as depicted in Table 2 and Figure 3.
Source: Statistics and Economic Analysis
Table 2 and Figure 3 make it clear that production volumes for groundnuts were at moderate levels during the 2002/2003 marketing season and this was followed by a missive increase in groundnuts production volumes during 2003/04 season. During the 2004/05 season the production decreased following a decline in area planted for groundnuts and then increased slightly during the 2005/06 season. Despite only slight decrease in the area planted to groundnuts during 2010/11 season, the groundnuts production volumes declined significantly during that time indicating a slight decline in yields. The period under analysis closed with moderate production volumes in 2011/12 season. Table 2: Groundnuts: Area planted and total production Year 2002
/03 2003 /04
2004 /05
2005 /06
2006 /07
2007 /08
2008 /09
2009 /10
2010 /11
2011 /12
Area planted (1000 ha)
50 72 44 49 41 54.20 52 57 55 45
Total production (1000 tons)
67 128 72 84 66 100.50 113 100 73 67
0
20000
40000
60000
80000
100000
120000
140000
To
ns
Years
Figure 3: Production vs Total Area planted
Total Area Planted Production
6
Source: Statistics and Economic Analysis
3. MARKET STRUCTURE
2.1. Domestic Market and Prices
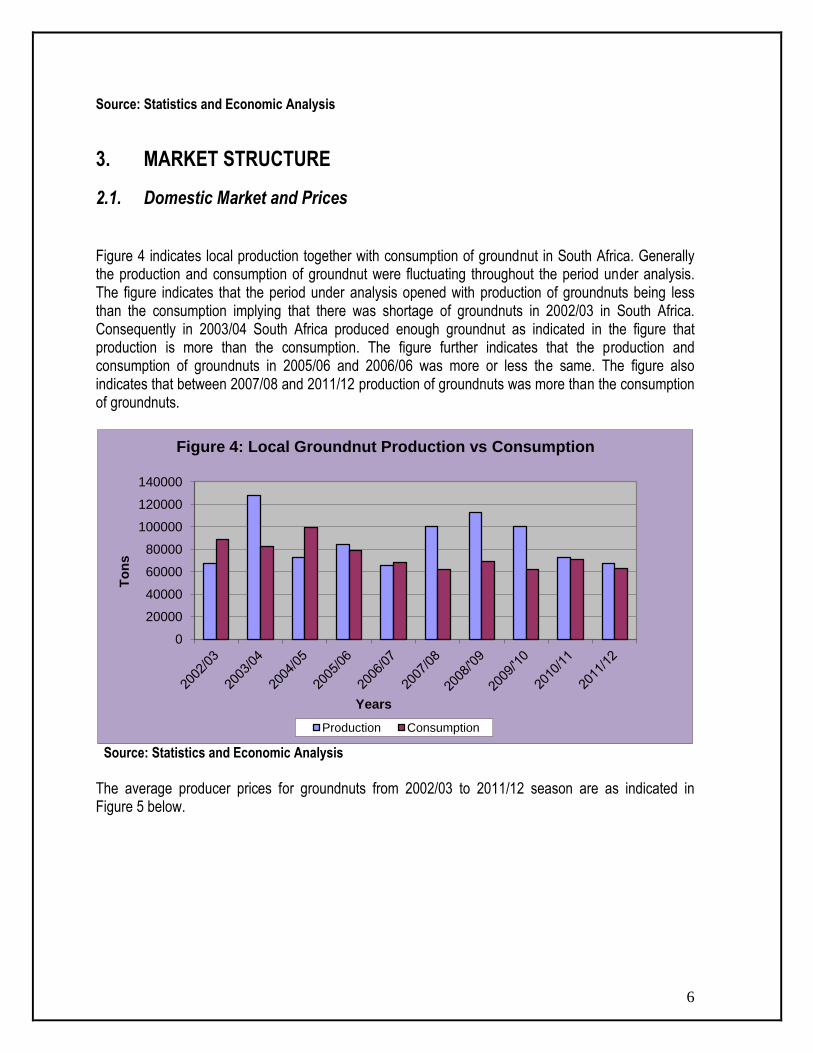
Figure 4 indicates local production together with consumption of groundnut in South Africa. Generally the production and consumption of groundnut were fluctuating throughout the period under analysis. The figure indicates that the period under analysis opened with production of groundnuts being less than the consumption implying that there was shortage of groundnuts in 2002/03 in South Africa. Consequently in 2003/04 South Africa produced enough groundnut as indicated in the figure that production is more than the consumption. The figure further indicates that the production and consumption of groundnuts in 2005/06 and 2006/06 was more or less the same. The figure also indicates that between 2007/08 and 2011/12 production of groundnuts was more than the consumption of groundnuts.
Source: Statistics and Economic Analysis The average producer prices for groundnuts from 2002/03 to 2011/12 season are as indicated in Figure 5 below.
0
20000
40000
60000
80000
100000
120000
140000
To
ns
Years
Figure 4: Local Groundnut Production vs Consumption
Production Consumption

7
Source: Statistics and Economic Analysis
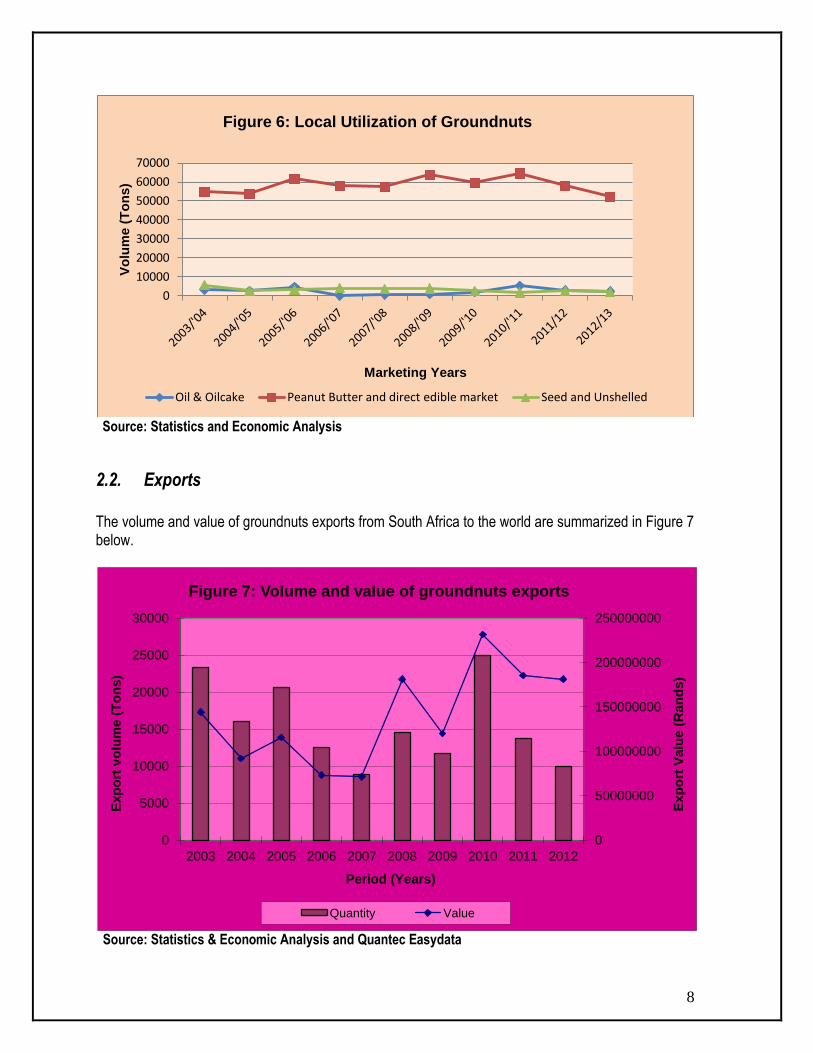
Figure 5 indicates the producer prices for groundnuts from 2003 to 2012, it further shows that the price for groundnuts ranges from R2464.21 to R8291.22 per ton. Generally the figure indicates fluctuating trend of groundnut producer price. The period under analysis opened with moderate level of groundnut producers’ price. The figure further indicates that prices of groundnuts declined dramatically between 2003/04 and 2004/05. This was followed by gradual increase in groundnuts producer price between 2005/06 and 2008/09. The figure indicates that the groundnuts producer prices closed with higher prices (R8291.22/ton) Figure 6 indicates the utilization of groundnuts in South Africa from 2003/04 to 2012/13. The crop groundnut is utilized for peanut butter and direct market, for oil and oilcake and for seed in South Africa. The figure further indicates that groundnut is mainly used for peanut butter and direct market as compared to the use for oil &oilcake and seed. . Throughout the period under analysis groundnuts were sold as edible groundnuts. On average 2492 tons of groundnuts are sold for crushing into oil and oilcake in the domestic market while 3271 tons are directed to the animal feed and seed markets.
2002/03
2003/04
2004/05
2005/06
2006/07
2007/08
2008/09
2009/10
2010/11
2011/12
Price (R/ton) 5050 2870 2464 2849 5514 6122 6361 4660 5142 8292
0
1000
2000
3000
4000
5000
6000
7000
8000
9000
Pri
ce (
R/t
on
)
Period (years)
Figure 5: Groundnuts Producers Prices
8
Source: Statistics and Economic Analysis
2.2. Exports
The volume and value of groundnuts exports from South Africa to the world are summarized in Figure 7 below.
Source: Statistics & Economic Analysis and Quantec Easydata
0
10000
20000
30000
40000
50000
60000
70000
Vo
lum
e (
To
ns)
Marketing Years
Figure 6: Local Utilization of Groundnuts
Oil & Oilcake Peanut Butter and direct edible market Seed and Unshelled
0
50000000
100000000
150000000
200000000
250000000
0
5000
10000
15000
20000
25000
30000
2003 2004 2005 2006 2007 2008 2009 2010 2011 2012
Exp
ort
Valu
e (
Ran
ds)
Exp
ort
vo
lum
e (
To
ns)
Period (Years)
Figure 7: Volume and value of groundnuts exports
Quantity Value
9
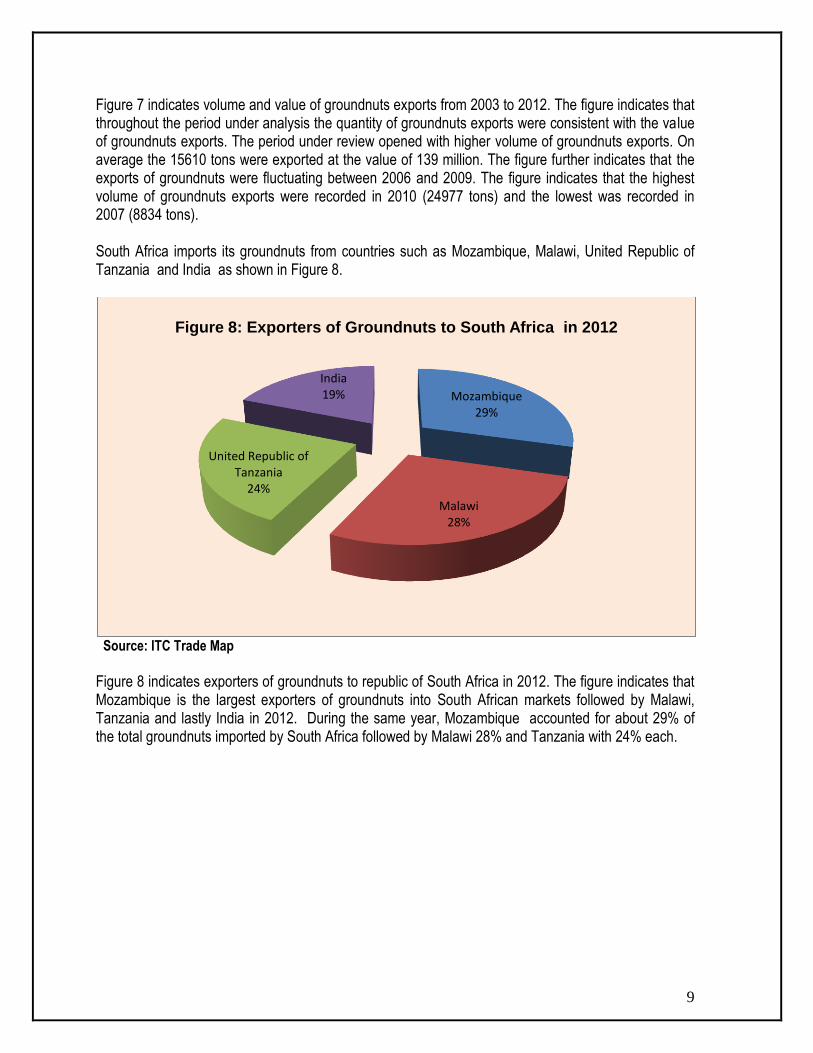
Figure 7 indicates volume and value of groundnuts exports from 2003 to 2012. The figure indicates that throughout the period under analysis the quantity of groundnuts exports were consistent with the value of groundnuts exports. The period under review opened with higher volume of groundnuts exports. On average the 15610 tons were exported at the value of 139 million. The figure further indicates that the exports of groundnuts were fluctuating between 2006 and 2009. The figure indicates that the highest volume of groundnuts exports were recorded in 2010 (24977 tons) and the lowest was recorded in 2007 (8834 tons). South Africa imports its groundnuts from countries such as Mozambique, Malawi, United Republic of Tanzania and India as shown in Figure 8.
Source: ITC Trade Map
Figure 8 indicates exporters of groundnuts to republic of South Africa in 2012. The figure indicates that Mozambique is the largest exporters of groundnuts into South African markets followed by Malawi, Tanzania and lastly India in 2012. During the same year, Mozambique accounted for about 29% of the total groundnuts imported by South Africa followed by Malawi 28% and Tanzania with 24% each.
Mozambique 29%
Malawi 28%
United Republic of Tanzania
24%
India 19%
Figure 8: Exporters of Groundnuts to South Africa in 2012

10
Source: Quantec Easy data
Figure 9 indicates volume of groundnuts exports to various regions in the world. The figure indicates that South Africa exports mainly to Europe, Asia and Africa. The figure also indicates that volumes of groundnuts exports to America and Oceania are less than 400 tons of groundnuts per year. Figure 9 shows that groundnut exports from South Africa are destined for the markets in Europe, Asia, Africa, the Americas and Oceania. The groundnut exports from South Africa to Europe and Asia are more than those destined to neighboring countries of South Africa within the African continent which is not surprising as most countries in Africa are involved mostly in primary agricultural production than in processing. Generally, the volume of groundnuts exports to Europe started to decline from 2003 until 2007, followed by slight increases between 2008 and 2010. Exports to Asia fluctuated at moderate levels from the year 2002 until some increases were experienced in 2008. The period under review closed with larger volumes of groundnuts exports being destined to Europe followed by Asia. Figure 10 below indicates exports of groundnuts to European Union from 2003 to 2012. The exports of groundnuts to these regions were fluctuating throughout the period under analysis. The figure indicates that South Africa was exporting mainly to Netherlands, United Kingdom and Germany throughout the period under analysis while exports to Belgium and Finland remained minimal. The period under analysis closed with Netherlands accumulating large volume of groundnuts originating from South Africa.
2004 2005 2006 2007 2008 2009 2010 2011 2012
Africa 2643.27 1915.729 1358.475 1070.288 1937.279 2032.579 3975.855 8449.31 285.161
Americas 0 0 0 60 0 186 18.1 316.8 90
Asia 6536.151 9021.961 7208.214 4645.001 7496.656 4542 7523.6 4886.35 3939.9
Europe 6714.996 9276.902 3721.533 2700.478 4663.704 4655.175 13297.91 7361.424 5514.188
Oceania 108 396.08 252 198 386.4 216 162 324 144
0
2000
4000
6000
8000
10000
12000
14000
Exp
ort
s V
olu
mes (
To
ns)
Period (Years)
Figure 9: Volume of groundnuts exports to various regions
Africa Americas Asia Europe Oceania

11
Source: Quantec Easy data
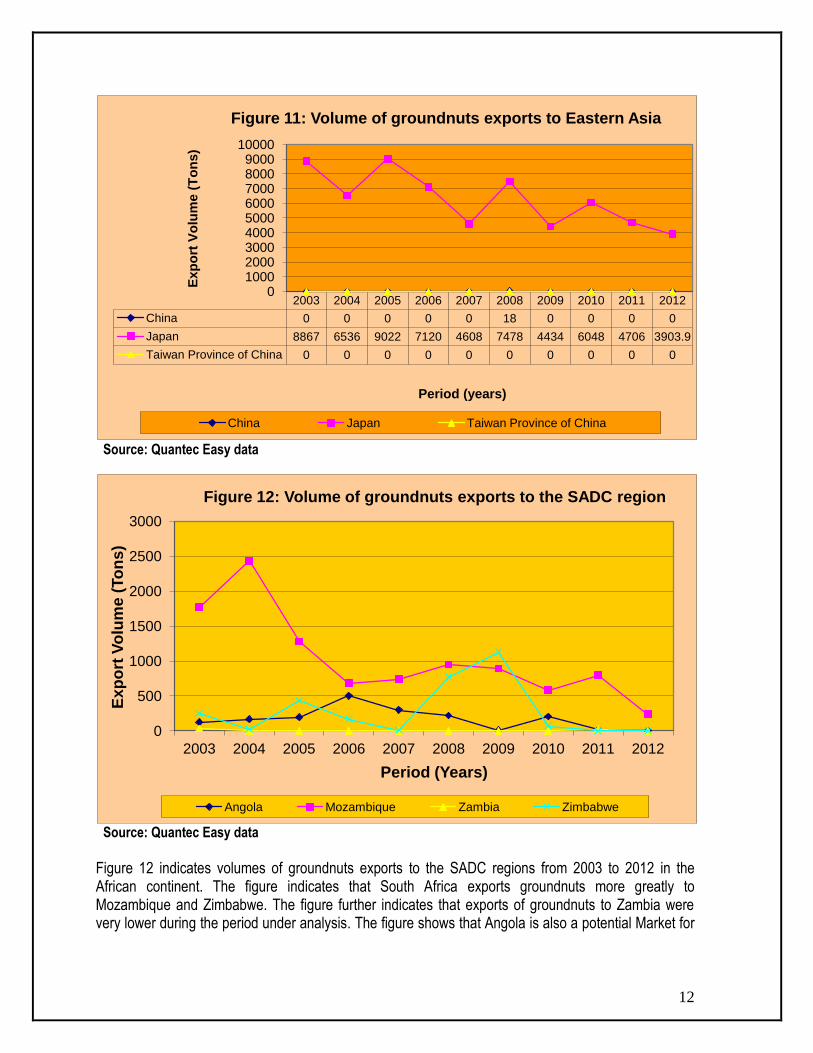
Figure 11 indicates exports of groundnuts to Eastern Asia from 2003 to 2012. The figure indicates that in eastern Asia, South Africa exports Mainly to Japan. The figure further indicates that exports of groundnuts to China and Taiwan Province of China were lower during period under analysis. However, as mentioned earlier, it is important to note the steep decline in groundnut exports to Eastern Asia that occurred between 2005 and 2007, which was followed by a huge increase in export volumes from South Africa to Japan in 2008. The volume of groundnuts exports to Japan declined dramatically during the year 2009. On the African continent South African groundnut exports are destined mainly to the SADC region.
2003 2004 2005 2006 2007 2008 2009 2010 2011 2012
Belgium 70 38 54 36 0 130 98 97 0 0
Germany 1173 1931 3310 1630 822 134 344 1447 769 0
Finland 324 180 58 0 0 470 114 288 234 122
United Kingdom 1801 943 2144 486 348 703 90 2206 506 0
Netherlands 7766 3134 3513 1385 1250 2513 3451 8749 5344 5159
0 1000 2000 3000 4000 5000 6000 7000 8000 9000
10000 E
xp
ort
s V
olu
mes (
To
ns)
Period (Years)
Figure 10: Volume of Groundnut exports to the European Union
Belgium Germany Finland United Kingdom Netherlands
12
Source: Quantec Easy data
Source: Quantec Easy data
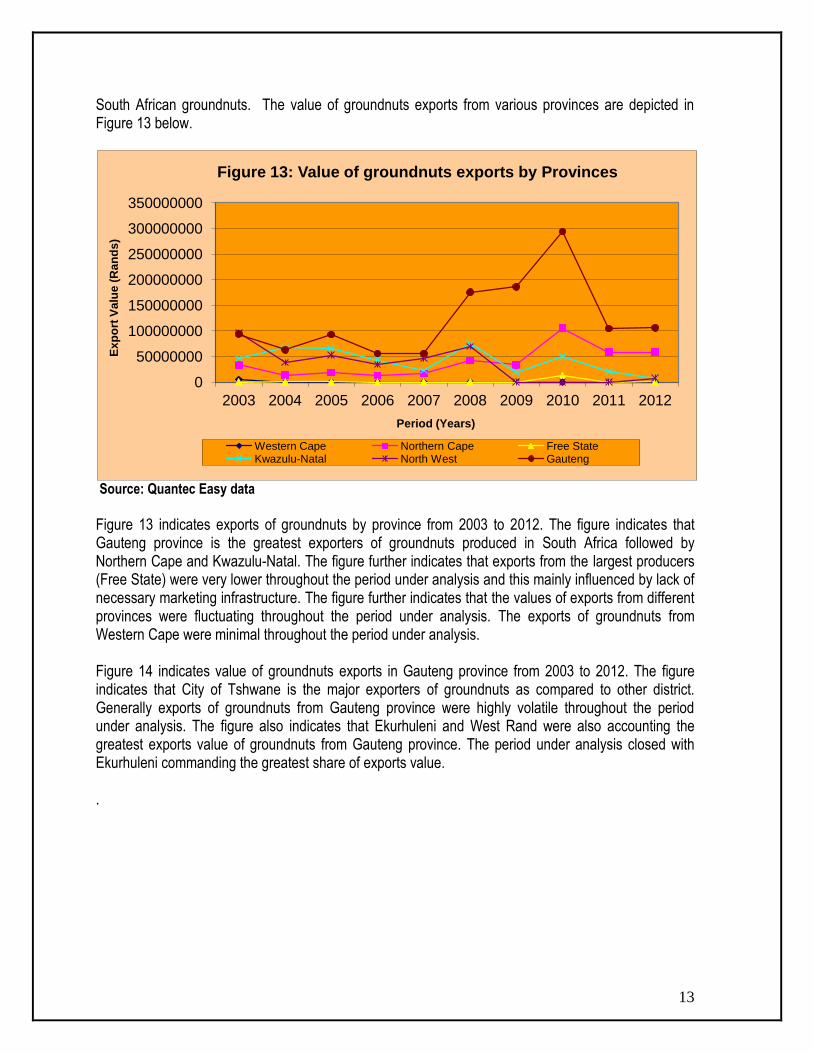
Figure 12 indicates volumes of groundnuts exports to the SADC regions from 2003 to 2012 in the African continent. The figure indicates that South Africa exports groundnuts more greatly to Mozambique and Zimbabwe. The figure further indicates that exports of groundnuts to Zambia were very lower during the period under analysis. The figure shows that Angola is also a potential Market for
2003 2004 2005 2006 2007 2008 2009 2010 2011 2012
China 0 0 0 0 0 18 0 0 0 0
Japan 8867 6536 9022 7120 4608 7478 4434 6048 4706 3903.9
Taiwan Province of China 0 0 0 0 0 0 0 0 0 0
0 1000 2000 3000 4000 5000 6000 7000 8000 9000
10000
Exp
ort
Vo
lum
e (
To
ns)
Period (years)
Figure 11: Volume of groundnuts exports to Eastern Asia
China Japan Taiwan Province of China
0
500
1000
1500
2000
2500
3000
2003 2004 2005 2006 2007 2008 2009 2010 2011 2012
Ex
po
rt V
olu
me
(To
ns)
Period (Years)
Figure 12: Volume of groundnuts exports to the SADC region
Angola Mozambique Zambia Zimbabwe
13
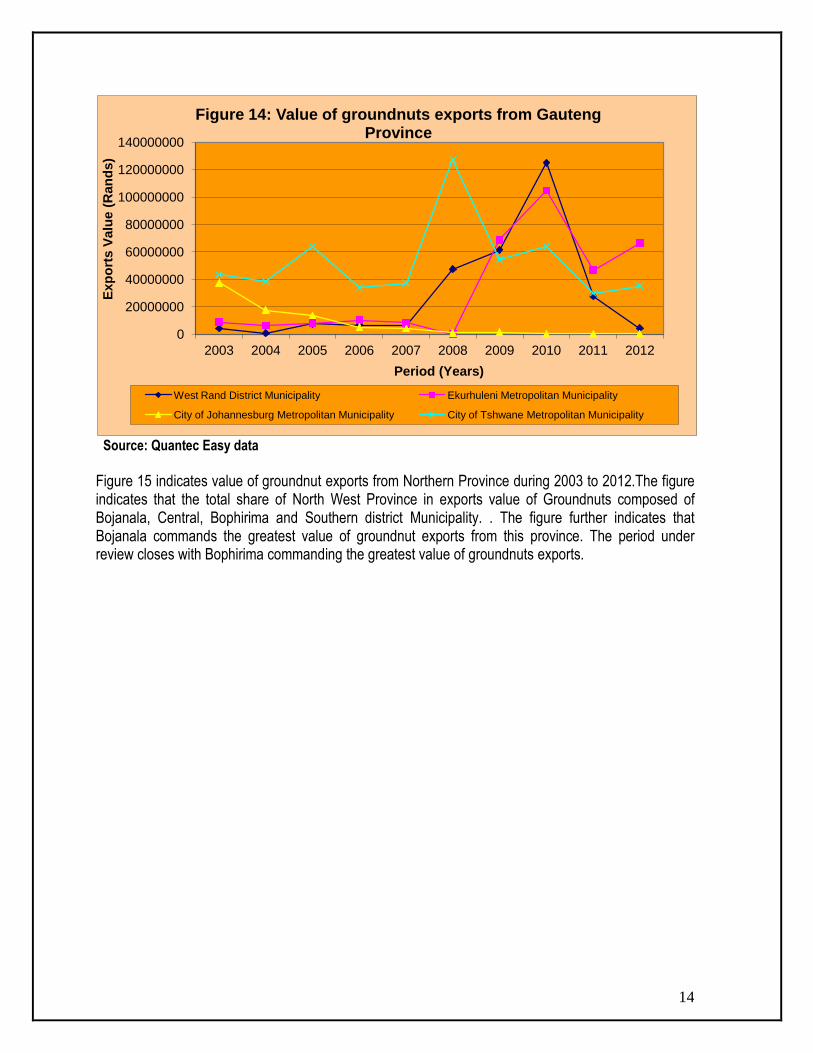
South African groundnuts. The value of groundnuts exports from various provinces are depicted in Figure 13 below.
Source: Quantec Easy data
Figure 13 indicates exports of groundnuts by province from 2003 to 2012. The figure indicates that Gauteng province is the greatest exporters of groundnuts produced in South Africa followed by Northern Cape and Kwazulu-Natal. The figure further indicates that exports from the largest producers (Free State) were very lower throughout the period under analysis and this mainly influenced by lack of necessary marketing infrastructure. The figure further indicates that the values of exports from different provinces were fluctuating throughout the period under analysis. The exports of groundnuts from Western Cape were minimal throughout the period under analysis. Figure 14 indicates value of groundnuts exports in Gauteng province from 2003 to 2012. The figure indicates that City of Tshwane is the major exporters of groundnuts as compared to other district. Generally exports of groundnuts from Gauteng province were highly volatile throughout the period under analysis. The figure also indicates that Ekurhuleni and West Rand were also accounting the greatest exports value of groundnuts from Gauteng province. The period under analysis closed with Ekurhuleni commanding the greatest share of exports value. .
0
50000000
100000000
150000000
200000000
250000000
300000000
350000000
2003 2004 2005 2006 2007 2008 2009 2010 2011 2012
Ex
po
rt V
alu
e (
Ra
nd
s)
Period (Years)
Figure 13: Value of groundnuts exports by Provinces
Western Cape Northern Cape Free State Kwazulu-Natal North West Gauteng
14
Source: Quantec Easy data
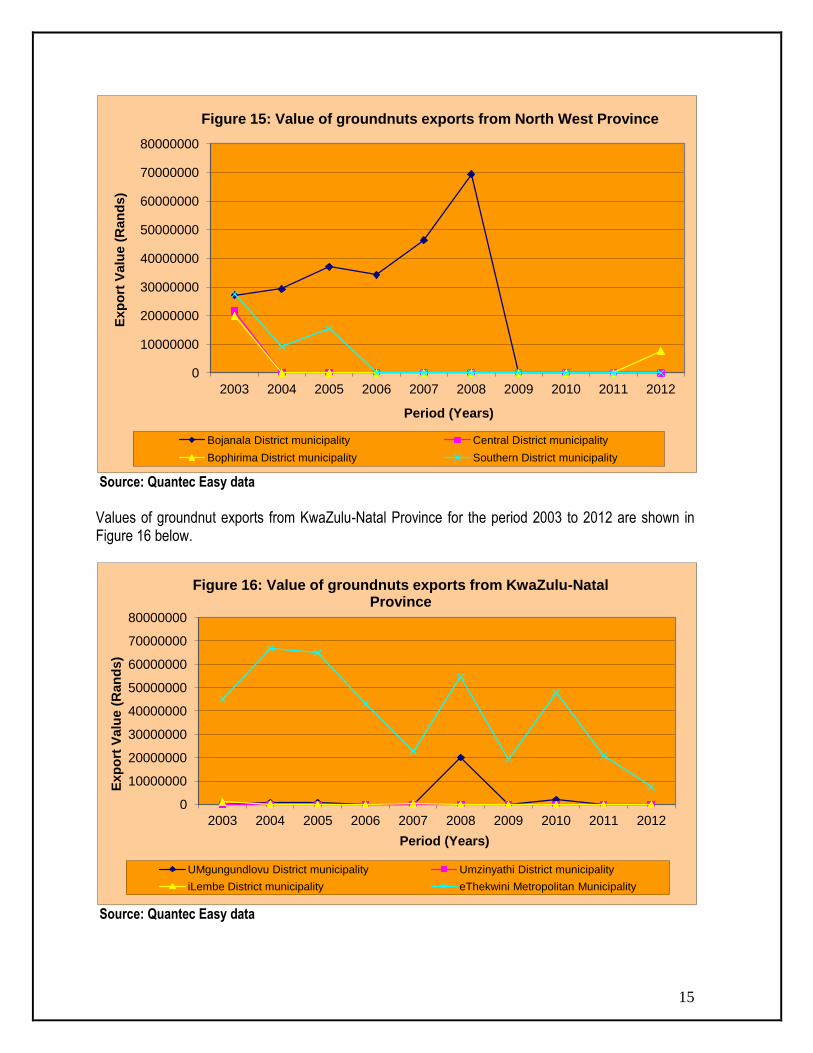
Figure 15 indicates value of groundnut exports from Northern Province during 2003 to 2012.The figure indicates that the total share of North West Province in exports value of Groundnuts composed of Bojanala, Central, Bophirima and Southern district Municipality. . The figure further indicates that Bojanala commands the greatest value of groundnut exports from this province. The period under review closes with Bophirima commanding the greatest value of groundnuts exports.
0
20000000
40000000
60000000
80000000
100000000
120000000
140000000
2003 2004 2005 2006 2007 2008 2009 2010 2011 2012
Exp
ort
s V
alu
e (
Ran
ds)
Period (Years)
Figure 14: Value of groundnuts exports from Gauteng Province
West Rand District Municipality Ekurhuleni Metropolitan Municipality
City of Johannesburg Metropolitan Municipality City of Tshwane Metropolitan Municipality
15
Source: Quantec Easy data
Values of groundnut exports from KwaZulu-Natal Province for the period 2003 to 2012 are shown in Figure 16 below.
Source: Quantec Easy data
0
10000000
20000000
30000000
40000000
50000000
60000000
70000000
80000000
2003 2004 2005 2006 2007 2008 2009 2010 2011 2012
Exp
ort
Valu
e (
Ran
ds)
Period (Years)
Figure 15: Value of groundnuts exports from North West Province
Bojanala District municipality Central District municipality
Bophirima District municipality Southern District municipality
0
10000000
20000000
30000000
40000000
50000000
60000000
70000000
80000000
2003 2004 2005 2006 2007 2008 2009 2010 2011 2012
Exp
ort
Valu
e (
Ran
ds)
Period (Years)
Figure 16: Value of groundnuts exports from KwaZulu-Natal Province
UMgungundlovu District municipality Umzinyathi District municipality
iLembe District municipality eThekwini Metropolitan Municipality
16
Figure 16 indicates value of groundnuts exports from Kwazulu-Natal during 2003 to 2012.The figure indicates that the value of groundnuts exports during the period of analysis was highly volatile.. The figure indicates that eThekwini commands the greatest value of groundnuts exports from the province followed by Umgungundlovu and Umzinyathi district . The period under review closes with eThekwini which commanded the larger value of groundnuts exports in KwaZulu-Natal Province.
Source: Quantec Easy data
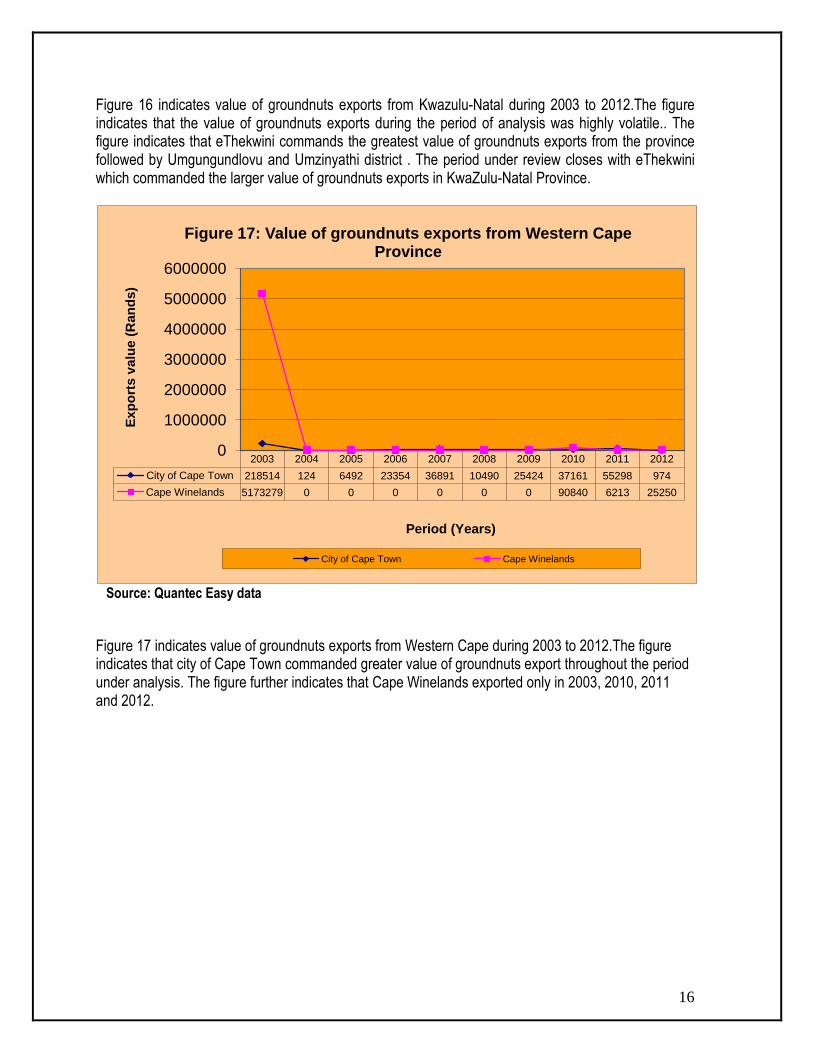
Figure 17 indicates value of groundnuts exports from Western Cape during 2003 to 2012.The figure indicates that city of Cape Town commanded greater value of groundnuts export throughout the period under analysis. The figure further indicates that Cape Winelands exported only in 2003, 2010, 2011 and 2012.
2003 2004 2005 2006 2007 2008 2009 2010 2011 2012
City of Cape Town 218514 124 6492 23354 36891 10490 25424 37161 55298 974
Cape Winelands 5173279 0 0 0 0 0 0 90840 6213 25250
0
1000000
2000000
3000000
4000000
5000000
6000000
Exp
ort
s v
alu
e (
Ran
ds)
Period (Years)
Figure 17: Value of groundnuts exports from Western Cape Province
City of Cape Town Cape Winelands
17
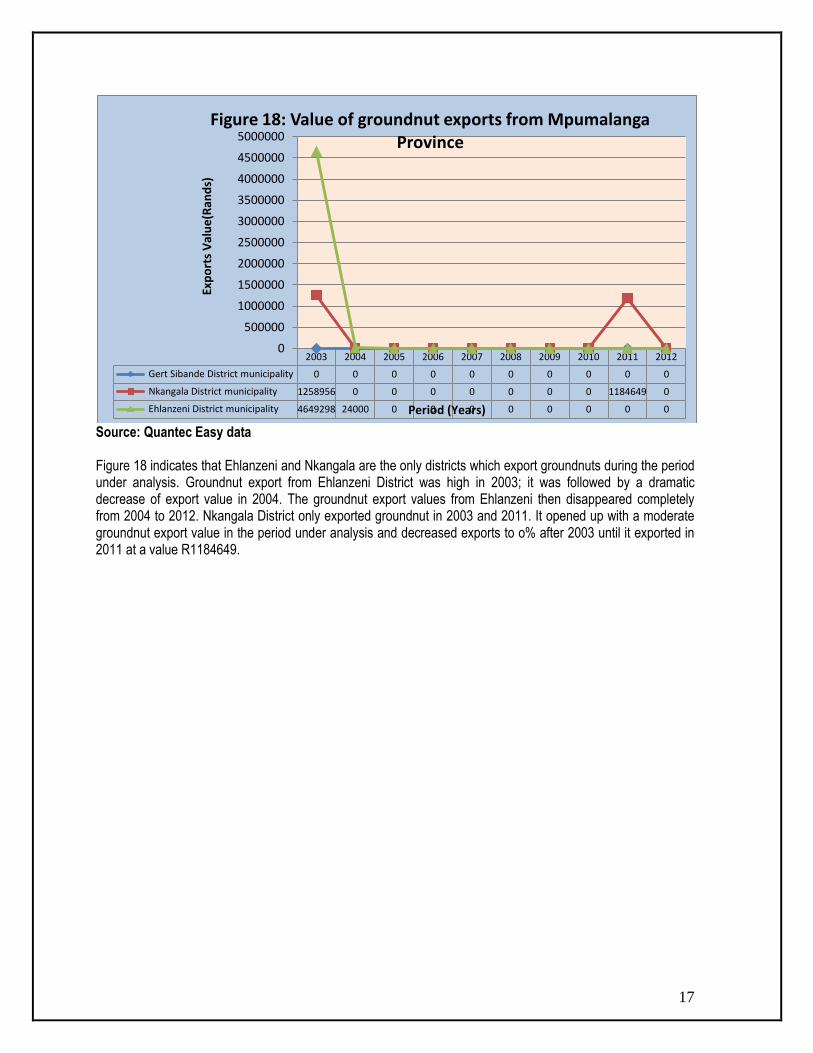
Source: Quantec Easy data Figure 18 indicates that Ehlanzeni and Nkangala are the only districts which export groundnuts during the period under analysis. Groundnut export from Ehlanzeni District was high in 2003; it was followed by a dramatic decrease of export value in 2004. The groundnut export values from Ehlanzeni then disappeared completely from 2004 to 2012. Nkangala District only exported groundnut in 2003 and 2011. It opened up with a moderate groundnut export value in the period under analysis and decreased exports to o% after 2003 until it exported in 2011 at a value R1184649.
2003 2004 2005 2006 2007 2008 2009 2010 2011 2012
Gert Sibande District municipality 0 0 0 0 0 0 0 0 0 0
Nkangala District municipality 1258956 0 0 0 0 0 0 0 1184649 0
Ehlanzeni District municipality 4649298 24000 0 0 0 0 0 0 0 0
0
500000
1000000
1500000
2000000
2500000
3000000
3500000
4000000
4500000
5000000
Exp
ort
s V
alu
e(R
and
s)
Period (Years)
Figure 18: Value of groundnut exports from Mpumalanga Province
18
Source: Quantec Easy data
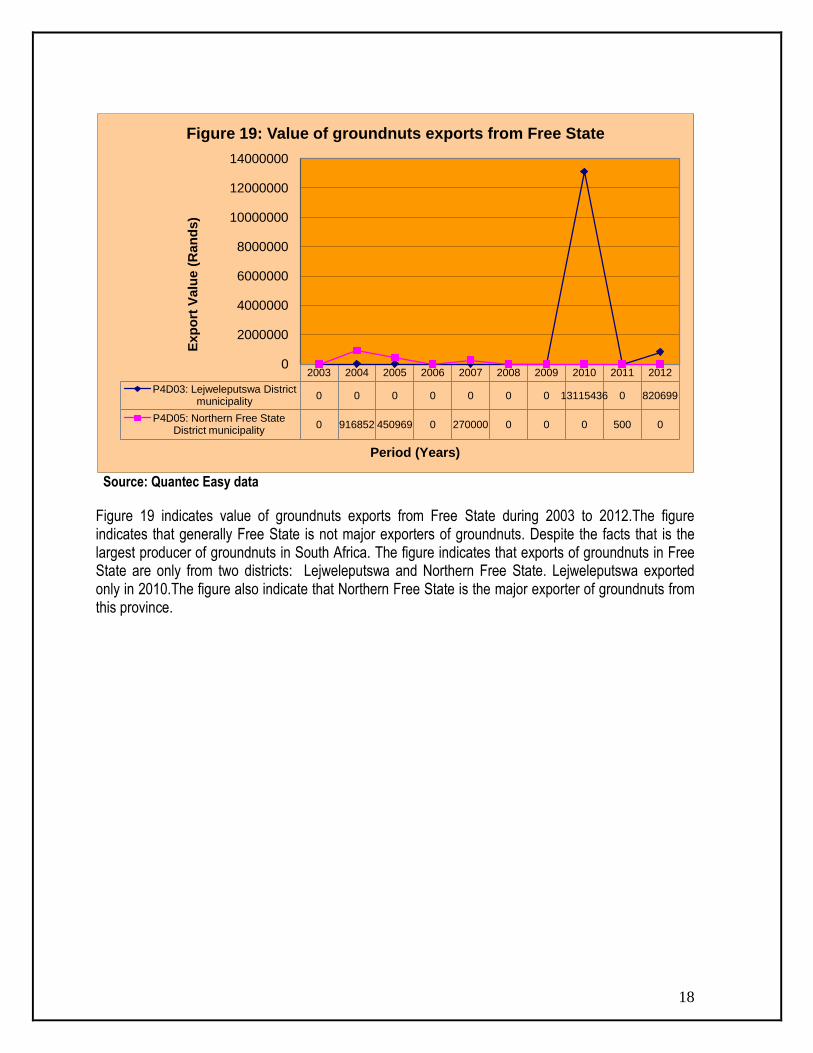
Figure 19 indicates value of groundnuts exports from Free State during 2003 to 2012.The figure indicates that generally Free State is not major exporters of groundnuts. Despite the facts that is the largest producer of groundnuts in South Africa. The figure indicates that exports of groundnuts in Free State are only from two districts: Lejweleputswa and Northern Free State. Lejweleputswa exported only in 2010.The figure also indicate that Northern Free State is the major exporter of groundnuts from this province.
2003 2004 2005 2006 2007 2008 2009 2010 2011 2012
P4D03: Lejweleputswa District municipality
0 0 0 0 0 0 0 13115436 0 820699
P4D05: Northern Free State District municipality
0 916852 450969 0 270000 0 0 0 500 0
0
2000000
4000000
6000000
8000000
10000000
12000000
14000000
Exp
ort
Valu
e (
Ran
ds)
Period (Years)
Figure 19: Value of groundnuts exports from Free State
19
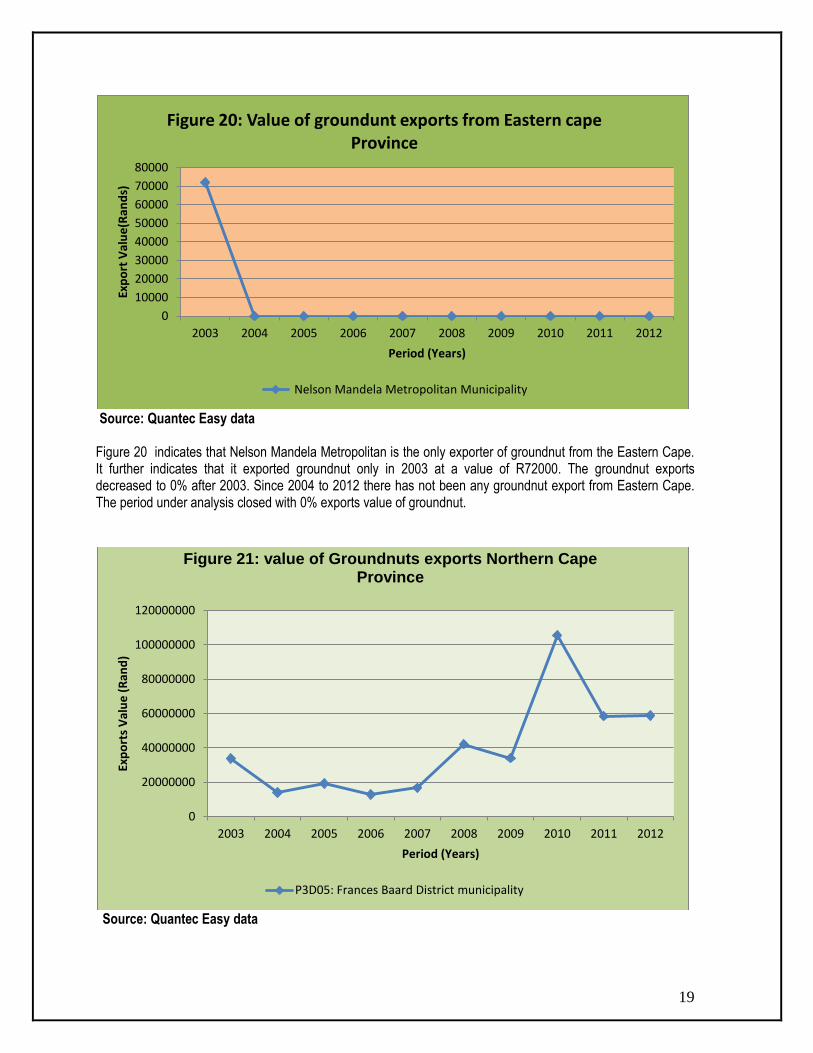
Source: Quantec Easy data Figure 20 indicates that Nelson Mandela Metropolitan is the only exporter of groundnut from the Eastern Cape. It further indicates that it exported groundnut only in 2003 at a value of R72000. The groundnut exports decreased to 0% after 2003. Since 2004 to 2012 there has not been any groundnut export from Eastern Cape. The period under analysis closed with 0% exports value of groundnut.
Source: Quantec Easy data
0
10000
20000
30000
40000
50000
60000
70000
80000
2003 2004 2005 2006 2007 2008 2009 2010 2011 2012
Exp
ort
Val
ue
(Ran
ds)
Period (Years)
Figure 20: Value of groundunt exports from Eastern cape Province
Nelson Mandela Metropolitan Municipality
0
20000000
40000000
60000000
80000000
100000000
120000000
2003 2004 2005 2006 2007 2008 2009 2010 2011 2012
Exp
ort
s V
alu
e (
Ran
d)
Period (Years)
Figure 21: value of Groundnuts exports Northern Cape Province
P3D05: Frances Baard District municipality
20
Figure 21 indicates value of groundnuts exports from Northern Cape during 2003 to 2012.The figure indicates that out of all districts in Northern Cape only one district is exporting groundnuts. The figure further indicates that Frances Baard district commanded greater value of groundnuts exports throughout the period under analysis.
2.3. Share Analysis
Table 3: Share of Provincial groundnut exports to the total South African groundnuts exports (%)
Year 2003 2004 2005 2006 2007 2008 2009 2010 2011 2012 Province
Western Cape
1.87 0.00 0.00 0.02 0.03 0.00 0.01 0.03 0.03 0.03
Northern Cape
11.74 7.60 8.30 8.82 11.76 11.61 14.21 22.79 31.55 32.44
Free State 0.00 0.49 0.19 0.00 0.19 0.00 0.00 2.83 0.00 0.45
Kwazulu-Natal
16.07 36.69 28.49 29.50 16.12 0.00 8.09 10.75 11.25 4.16
North West 33.48 20.95 22.76 23.44 32.58 0.00 0.00 0.00 0.01 4.23
Gauteng 32.73 34.23 40.25 38.22 39.33 63.60 77.69 63.59 56.52 58.68
Source: Calculated from Quantec Easy data
Table 3 indicates share of groundnuts exports from 2003 to 2012 by different province across South Africa. The table indicates that Gauteng, Kwazulu-Natal and Northern Cape Province were dominant throughout the period under review mainly due to the availability of a necessary marketing infrastructure in this province. The figure further indicates that the share of groundnuts exports from other provinces remained minimal throughout the period under review. Northern Cape Province’s share of groundnuts exports have been increasing since 2003 until 2012. During the year 2003 Northern Cape’s contribution to South Africa’s total groundnuts exports was 11.74% and this has increased to 32.44% in 2012. This scenario is not surprising since Northern Cape Province has recently emerged to be one of the biggest producers of groundnuts, having accounted for 29% of South Africa’s total groundnuts production during 2011/12 season. Table 4: Share of the district groundnut exports to the total Gauteng groundnut exports (%)
Year 2003 2004 2005 2006 2007 2008 2009 2010 2011 2012 District
West Rand 4.49 1.06 8.03 12.07 10.81 46.46 33.01 42.51 26.56 4.24
Ekurhuleni 9.51 10.10 8.58 18.30 14.96 0.07 36.92 35.65 44.73 62.45
City of Johannesburg
39.77 27.92 14.72 9.08 7.52 0.98 0.84 0.09 0.31 0.29
City of Tshwane
46.22 60.92 68.67 60.55 66.71 52.49 29.23 21.75 28.40 33.01
Source: Calculated from Quantec Easy data
21
Table 4 indicates share of different district on the groundnuts exports to the total Gauteng groundnuts exports. The table shows that out of 5 districts in Gauteng province four districts are contributing to the total exports of the province. The table indicates that City of Tshwane commanded the greatest share of Groundnuts exports between 2003 and 2008. The table further indicates that the Ekurhuleni district municipality has commanded the greatest of groundnuts exports between 2009 and 2011. During the year 2012, Ekurhuleni commanded the greatest share of Gauteng’s total groundnuts exports, 62.45% followed by City of Tshwane and West Rand whose contributions to Gauteng’s groundnuts exports were 33.01% and 4.24% respectively. Table 5: Share of the district groundnut exports to the total KwaZulu-Natal groundnut exports (%)
Year 2003 2004 2005 2006 2007 2008 2009 2010 2011 2012
Districts
UMgungundlovu 0.42 0.99 1.23 0.00 0.00 26.77 0.00 3.86 0.07 0.00
UMzinyathi 0.00 0.00 0.00 0.00 0.00 0.00 0.00 0.00 0.00 0.00
UThungulu 0.00 0.00 0.00 0.00 0.00 0.00 0.00 0.00 0.00 0.00
ILembe 2.38 0.08 0.00 0.00 0.99 0.00 0.00 0.00 0.00 0.00
EThekwini 97.20 98.93 98.71 100 99.00 73.23 100 96.14 99.97 100
Source: Calculated from Quantec Easy data
Table 5 indicates share of different district on the groundnuts exports to the total Kwazulu-Natal groundnuts exports. The table shows that out of 11 districts in Kwazulu-Natal only five districts are contributing to the total exports of the province. The figure further indicates that Kwazulu-Natal province has exports originating mainly from eThekwini districts primarily due to the use of the Durban harbor as a viaduct of produce that are transported from the Randfontein grain market for export purposes. The table indicates that UMgungundlovu, UMzinyathi districts, ILembe and UThungulu were showing a very low flow of exports of groundnuts in the province. During the year 2012, eThekwini district commanded the greatest share of Kwazulu-Natal total groundnuts exports, contributing 100% while other districts contributed 0.00%. %. Table 6: Share of the district groundnut exports to the total North West groundnut exports (%)
Year 2003 2004 2005 2006 2007 2008 2009 2010 2011 2012 Districts
Bojanala Platinum
28.23 76.07 70.55 100 100 100 0.00 0.00 0.00 0.00
Ngaka-Modiri Molema
22.42 0.00 0.00 0.00 0.00 0.00 0.00 0.00 0.00 0.00
Ruth Mompati
20.67 0.00 0.00 0.00 0.00 0.00 0.00 0.00 0.00 0.00
Kenneth Kaunda
28.68 23.93 29.45 0.00 0.00 0.00 0.00 0.00 100 100
Source: Calculated from Quantec Easy data
Table 6 indicates that from the periods 2003 to 2012, groundnut exports in the North West Province were mainly originating from Bojanala-Platinum District and Kenneth Kaunda District. The table futher
22
indicates that Ngaka Modiri-Molema District and Ruth Mompati District contribution to the total groundnut exports was minimal throughout the period under review. During the year 2012, Kenneth Kaunda District Municipality alone accounted for 100% of the total North West groundnuts exports, while exports from other districts diminished. There were no exports of groundnuts from North West Province during the years 2009 and 2010. Table 7: Share of the district groundnut exports to the total Free State groundnut exports (%)
Year 2003 2004 2005 2006 2007 2008 2009 2010 2011 2012 Districts
Northern Free State
0.00 100 100 0.00 100 0.00 0.00 0.00 100 0.00
Lejweleputswa 0.00 0.00 0.00 0.00 0.00 0.00 0.00 100 0.00 100
Source: Calculated from Quantec Easy data
Table 7 indicates share of different district on the groundnuts exports to the total Free State Province groundnuts exports. The table shows that out of 5 districts in Free State only two districts are contributing to the total exports of the province. Table 7 indicates that in the Free State Province groundnuts exports are mainly from the Northern Free State District Municipality and that groundnuts exportation in the province are not consistent since there were no exports from 2003. The Northern Free State District Municipality commanded the greatest share during the periods 2004 – 2005, and again in 2007. Lejweleputswa district did not export any groundnuts for the period under analysis, except during the year 2010 and 2012 when the district accounted for 100% of Free State’s total groundnuts exports. Table7 also indicates that there were no exports of groundnuts from the Free State Province in 2008 and 2009. During the year 2012, Lejweleputswa district commanded the greatest share of Free State total groundnuts exports, 100% while Northern Free State District Municipality contributed 0.00%. Table 8 below demonstrates contribution of various districts to the Northern Cape’s total value of groundnut exports. The table shows that out of 5 districts in Free State only one district is contributing to the total exports of the province. The table shows that in the Northern Cape Province groundnuts exports are mainly from Frances Baard District. The province only started to export groundnuts from 2003 until 2012 through Frances Baard District which shows a maximum performance in terms of exports commanding 100% shares of the total Northern Cape groundnut exports. Table 8: Share of the district groundnut exports to the total Northern Cape groundnut exports (%)
Year 2003 2004 2005 2006 2007 2008 2009 2010 2011 2012 Districts
Frances Baard
100 100 100 100 100 100 100 100 100 100
Source: Calculated from Quantec Easydata

23
Table 9: Share of the district groundnut exports to total Western Cape groundnut exports (%)
Year 2003 2004 2005 2006 2007 2008 2009 2010 2011 2012 Districts
City of Cape Town
4.05 100 100 100 100 100 100 29.02 89.90 3.71
Cape Winelands
95.95 0.00 0.00 0.00 0.00 0.00 0.00 70.97 10.10 96.29
Source: Calculated from Quantec Easydata
Table 9 indicates contribution of different districts of groundnuts exports in Western Cape Province. The figure indicates groundnuts exports from the Western Cape Province were mainly through the City of Cape Town district due to the use of the Cape Town harbor as a bypass. Since from the year 2004 to 2009, the City of Cape Town has been doing well in terms of groundnuts exports, having been the only exporter of groundnuts in the province between 2004 and 2009. The Cape Winelands district contributed largely in 2003 and 2010 with 95.95% and 70.97% respectively. During the year 2012, Cape Winelands district commanded the greatest share of Western Cape total groundnuts exports, 96.29% while the districts contributed 3.71%.
2. 4. Imports
The quantities of groundnuts imported and import values from 2003 to 2012 pursue the pattern which is shown in Figure 22.
Source: Statistics & Economic Analysis; Quantec Easydata
0
20000000
40000000
60000000
80000000
100000000
120000000
140000000
160000000
0
5000
10000
15000
20000
25000
30000
2003 2004 2005 2006 2007 2008 2009 2010 2011 2012
Imp
ort
s V
alu
e (
Ran
ds)
Imp
ort
s V
olu
me (
To
ns)
Period (Years)
Figure 22: Value and volume of Groundnuts imported in South Africa
Import Quantity (Ton) Import Value (Rand)

24
On average South Africa imports approximately 11518 tons of groundnuts per annum to the value of about 35 million rands. Figure 23 indicates that groundnut imports fluctuated considerably from the year 2003 until 2012. This occurred as a result of fluctuations in production volumes which were caused by inconsistent weather conditions over the period. The highest quantities of groundnuts were imported during the years 2003 while the lowest were imported in 2010. South Africa imports groundnuts from the following regions: Europe, Asia, the Americas and Africa particularly from the SADC region. Figure 23 indicates that over the past ten years South Africa has been importing groundnuts consistently from Africa, the Americas, Asia and Europe. The major groundnuts import market for South Africa is Europe followed by Africa and the Americas. On average, South Africa imports about 6789 tons of groundnuts annually from Africa while imports from Americas and Asia are about 1760 tons and 2961 tons per annum, respectively.
Source: Quantec Easy Data
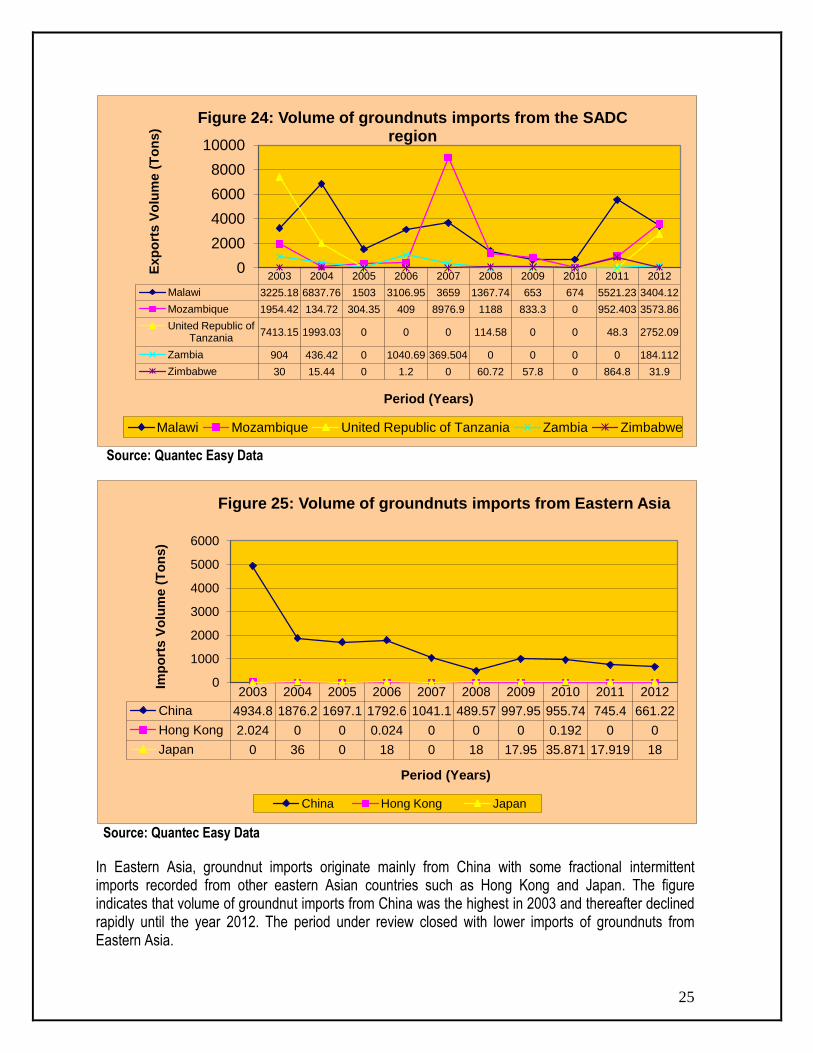
Figure 24 below indicates that South Africa imports groundnuts from the following regions: Malawi, Mozambique, Zimbabwe Tanzania and Zambia from the SADC region. The Figure indicates that over the past ten years South Africa has been importing groundnuts consistently from Malawi and Mozambique. The major groundnuts import market for South Africa is Europe followed by Malawi. The figure further indicates that groundnut imports from the SADC region were inconsistent over the period under review with the lowest import volumes originating from Zambia, Zimbabwe and Tanzania.
0
2000
4000
6000
8000
10000
12000
14000
16000
2003 2004 2005 2006 2007 2008 2009 2010 2011 2012
Imp
ort
s V
olu
me (
To
ns)
Period (Years)
Figure 23: Volume of groundnuts imports from various regions
Africa Americas Asia Europe
25
Source: Quantec Easy Data
Source: Quantec Easy Data
In Eastern Asia, groundnut imports originate mainly from China with some fractional intermittent imports recorded from other eastern Asian countries such as Hong Kong and Japan. The figure indicates that volume of groundnut imports from China was the highest in 2003 and thereafter declined rapidly until the year 2012. The period under review closed with lower imports of groundnuts from Eastern Asia.
2003 2004 2005 2006 2007 2008 2009 2010 2011 2012
Malawi 3225.18 6837.76 1503 3106.95 3659 1367.74 653 674 5521.23 3404.12
Mozambique 1954.42 134.72 304.35 409 8976.9 1188 833.3 0 952.403 3573.86
United Republic of Tanzania
7413.15 1993.03 0 0 0 114.58 0 0 48.3 2752.09
Zambia 904 436.42 0 1040.69 369.504 0 0 0 0 184.112
Zimbabwe 30 15.44 0 1.2 0 60.72 57.8 0 864.8 31.9
0
2000
4000
6000
8000
10000 E
xp
ort
s V
olu
me (
To
ns)
Period (Years)
Figure 24: Volume of groundnuts imports from the SADC region
Malawi Mozambique United Republic of Tanzania Zambia Zimbabwe
2003 2004 2005 2006 2007 2008 2009 2010 2011 2012
China 4934.8 1876.2 1697.1 1792.6 1041.1 489.57 997.95 955.74 745.4 661.22
Hong Kong 2.024 0 0 0.024 0 0 0 0.192 0 0
Japan 0 36 0 18 0 18 17.95 35.871 17.919 18
0
1000
2000
3000
4000
5000
6000
Imp
ort
s V
olu
me (
To
ns)
Period (Years)
Figure 25: Volume of groundnuts imports from Eastern Asia
China Hong Kong Japan
26
Source: Quantec Easy Data
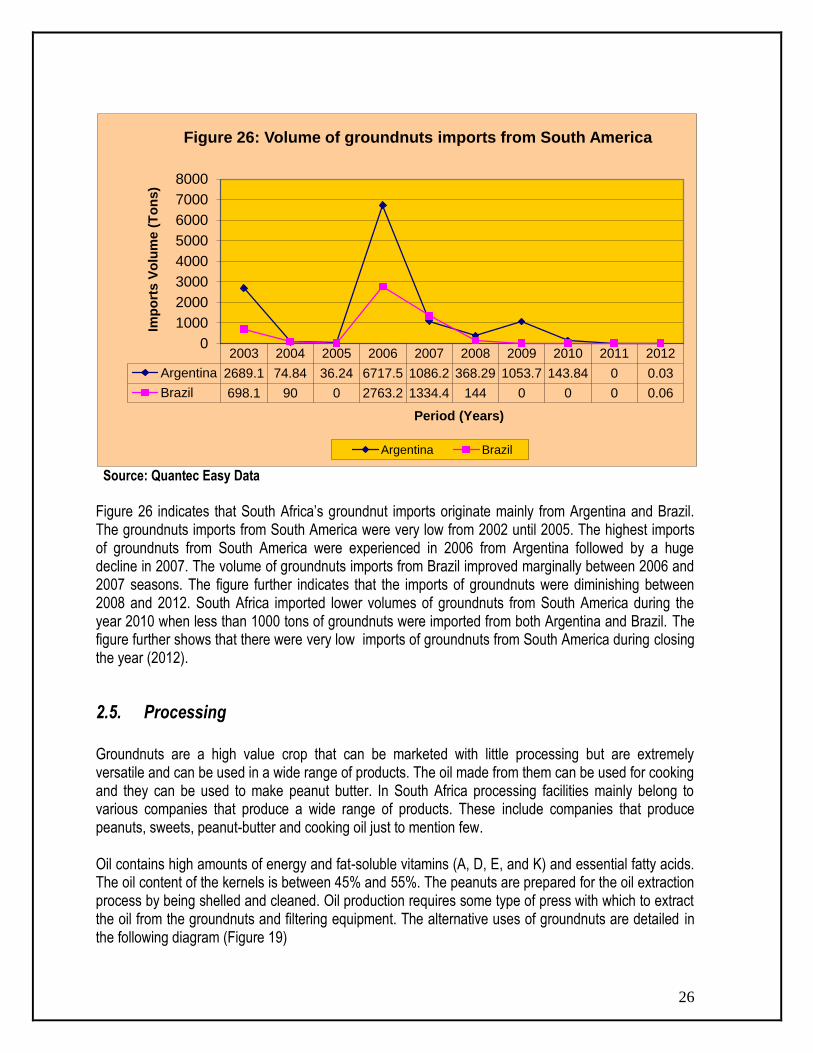
Figure 26 indicates that South Africa’s groundnut imports originate mainly from Argentina and Brazil. The groundnuts imports from South America were very low from 2002 until 2005. The highest imports of groundnuts from South America were experienced in 2006 from Argentina followed by a huge decline in 2007. The volume of groundnuts imports from Brazil improved marginally between 2006 and 2007 seasons. The figure further indicates that the imports of groundnuts were diminishing between 2008 and 2012. South Africa imported lower volumes of groundnuts from South America during the year 2010 when less than 1000 tons of groundnuts were imported from both Argentina and Brazil. The figure further shows that there were very low imports of groundnuts from South America during closing the year (2012).
2.5. Processing
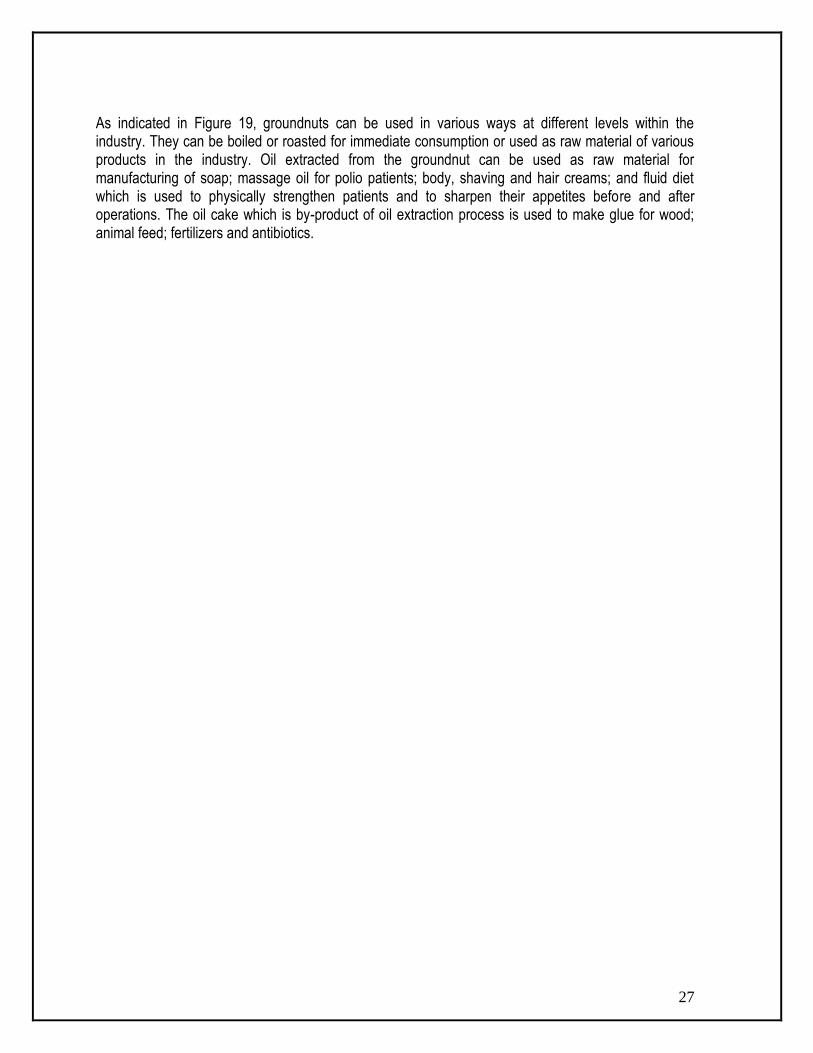
Groundnuts are a high value crop that can be marketed with little processing but are extremely versatile and can be used in a wide range of products. The oil made from them can be used for cooking and they can be used to make peanut butter. In South Africa processing facilities mainly belong to various companies that produce a wide range of products. These include companies that produce peanuts, sweets, peanut-butter and cooking oil just to mention few. Oil contains high amounts of energy and fat-soluble vitamins (A, D, E, and K) and essential fatty acids. The oil content of the kernels is between 45% and 55%. The peanuts are prepared for the oil extraction process by being shelled and cleaned. Oil production requires some type of press with which to extract the oil from the groundnuts and filtering equipment. The alternative uses of groundnuts are detailed in the following diagram (Figure 19)
2003 2004 2005 2006 2007 2008 2009 2010 2011 2012
Argentina 2689.1 74.84 36.24 6717.5 1086.2 368.29 1053.7 143.84 0 0.03
Brazil 698.1 90 0 2763.2 1334.4 144 0 0 0 0.06
0
1000
2000
3000
4000
5000
6000
7000
8000
Imp
ort
s V
olu
me (
To
ns)
Period (Years)
Figure 26: Volume of groundnuts imports from South America
Argentina Brazil
27
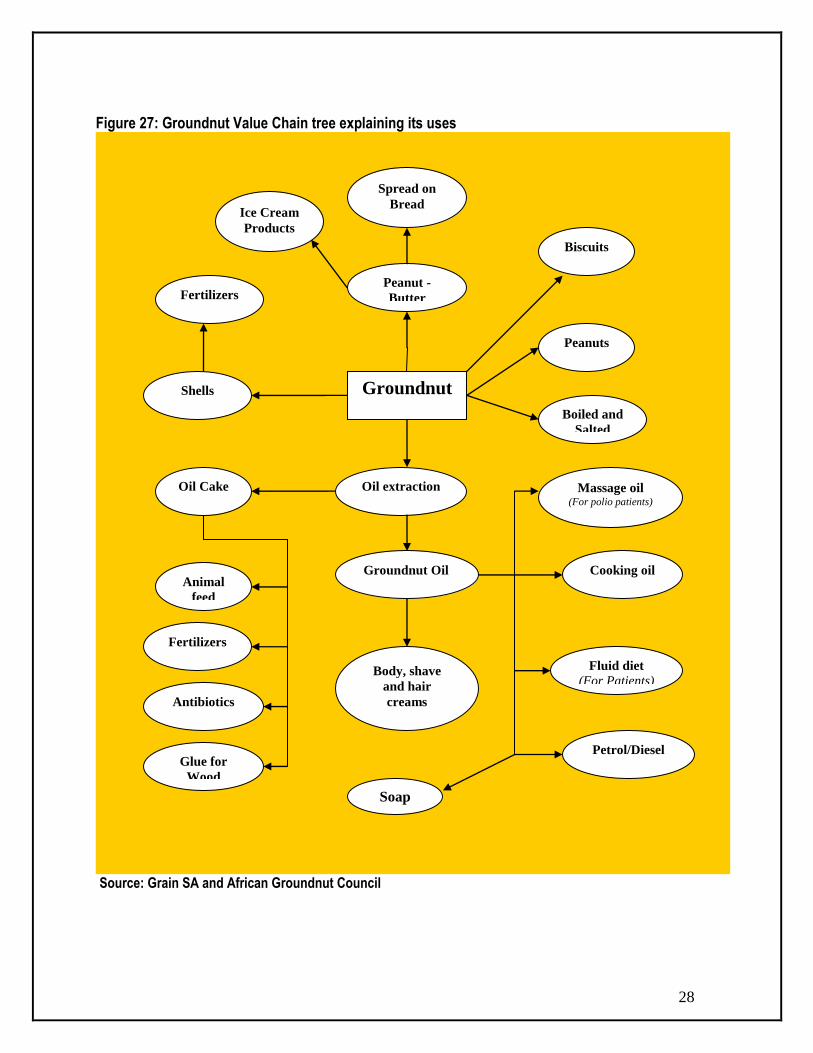
As indicated in Figure 19, groundnuts can be used in various ways at different levels within the industry. They can be boiled or roasted for immediate consumption or used as raw material of various products in the industry. Oil extracted from the groundnut can be used as raw material for manufacturing of soap; massage oil for polio patients; body, shaving and hair creams; and fluid diet which is used to physically strengthen patients and to sharpen their appetites before and after operations. The oil cake which is by-product of oil extraction process is used to make glue for wood; animal feed; fertilizers and antibiotics.
28
Figure 27: Groundnut Value Chain tree explaining its uses
Source: Grain SA and African Groundnut Council
Oil extraction
Groundnut Oil Cooking oil
Massage oil (For polio patients)
Body, shave
and hair
creams
Petrol/Diesel
Fluid diet
(For Patients)
Oil Cake
Animal
feed
Fertilizers
Antibiotics
Glue for
Wood
Groundnut
Shells
Fertilizers
Peanuts
Peanut -
Butter
Spread on
Bread Ice Cream
Products
Biscuits
Boiled and
Salted
Soap
29
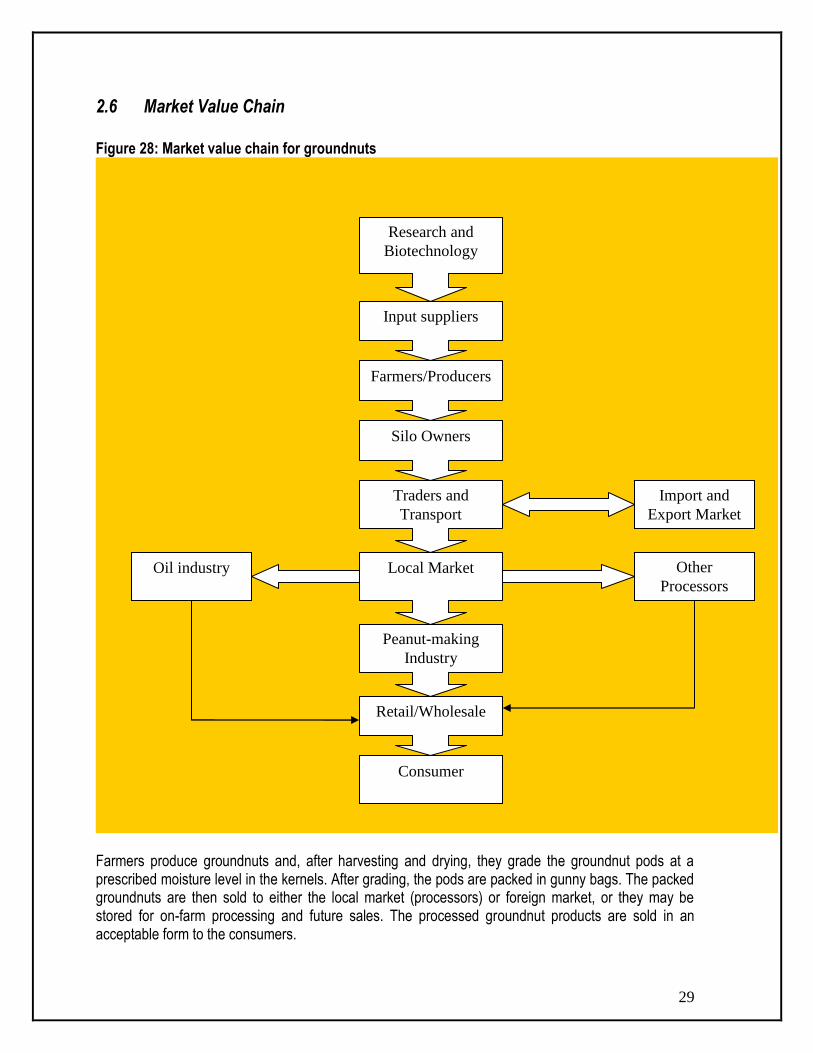
2.6 Market Value Chain
Figure 28: Market value chain for groundnuts
Farmers produce groundnuts and, after harvesting and drying, they grade the groundnut pods at a prescribed moisture level in the kernels. After grading, the pods are packed in gunny bags. The packed groundnuts are then sold to either the local market (processors) or foreign market, or they may be stored for on-farm processing and future sales. The processed groundnut products are sold in an acceptable form to the consumers.
Research and
Biotechnology
Input suppliers
Farmers/Producers
Silo Owners
Import and
Export Market
Traders and
Transport
Local Market
Peanut-making
Industry
Other
Processors
Oil industry
Retail/Wholesale
Consumer
30
3. Market Intelligence
3.1 Tariffs
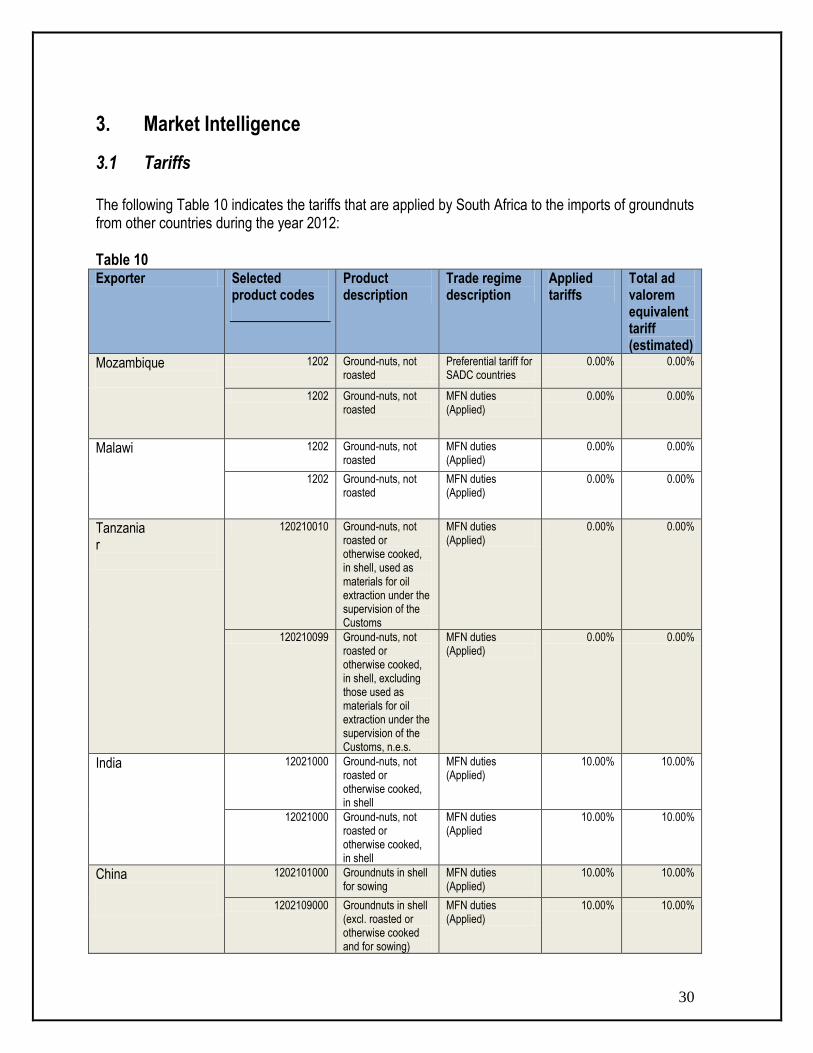
The following Table 10 indicates the tariffs that are applied by South Africa to the imports of groundnuts from other countries during the year 2012: Table 10 Exporter Selected
product codes
Product description
Trade regime description
Applied tariffs
Total ad valorem equivalent tariff (estimated)
Mozambique
1202 Ground-nuts, not roasted
Preferential tariff for SADC countries
0.00% 0.00%
1202 Ground-nuts, not roasted
MFN duties (Applied)
0.00% 0.00%
Malawi
1202 Ground-nuts, not roasted
MFN duties (Applied)
0.00% 0.00%
1202 Ground-nuts, not roasted
MFN duties (Applied)
0.00% 0.00%
Tanzania r
120210010 Ground-nuts, not roasted or otherwise cooked, in shell, used as materials for oil extraction under the supervision of the Customs
MFN duties (Applied)
0.00% 0.00%
120210099 Ground-nuts, not roasted or otherwise cooked, in shell, excluding those used as materials for oil extraction under the supervision of the Customs, n.e.s.
MFN duties (Applied)
0.00% 0.00%
India 12021000 Ground-nuts, not roasted or otherwise cooked, in shell
MFN duties (Applied)
10.00% 10.00%
12021000 Ground-nuts, not roasted or otherwise cooked, in shell
MFN duties (Applied
10.00% 10.00%
China
1202101000 Groundnuts in shell for sowing
MFN duties (Applied)
10.00% 10.00%
1202109000 Groundnuts in shell (excl. roasted or otherwise cooked and for sowing)
MFN duties (Applied)
10.00% 10.00%
31
Exporter Selected product codes
Product description
Trade regime description
Applied tariffs
Total ad valorem equivalent tariff (estimated)
1202200000 Shelled groundnuts, whether or not broken (excl. roasted or otherwise cooked)
MFN duties (Applied)
10.00% 10.00%
12021010 Ground-nuts, not roasted or otherwise cooked, whether or not shelled or broken: In shell For feed purpose
MFN duties (Applied)
0.00% 0.00%
Madagascar
12021000 Ground-nuts, not roasted or otherwise cooked, in shell
MFN duties (Applied)
0.00% 0.00%
Area Nes 12021000 Ground-nuts, not roasted or otherwise cooked, in shell
MFN duties (Applied)
Zambia 12021000 Ground-nuts, not roasted or otherwise cooked, in shell
Preferential tariff for SADC countries
0.00% 0.00%
Source: ITC Market Access Map
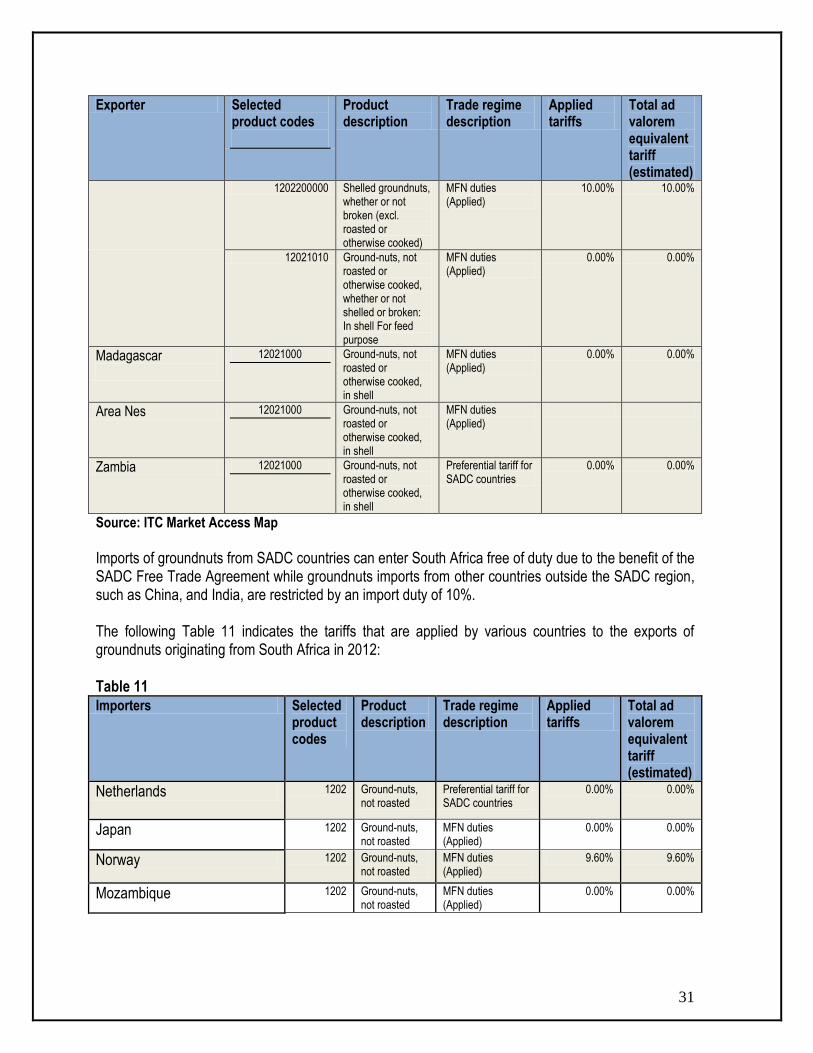
Imports of groundnuts from SADC countries can enter South Africa free of duty due to the benefit of the SADC Free Trade Agreement while groundnuts imports from other countries outside the SADC region, such as China, and India, are restricted by an import duty of 10%. The following Table 11 indicates the tariffs that are applied by various countries to the exports of groundnuts originating from South Africa in 2012: Table 11 Importers Selected
product codes
Product description
Trade regime description
Applied tariffs
Total ad valorem equivalent tariff (estimated)
Netherlands 1202 Ground-nuts, not roasted
Preferential tariff for SADC countries
0.00% 0.00%
Japan 1202 Ground-nuts, not roasted
MFN duties (Applied)
0.00% 0.00%
Norway 1202 Ground-nuts, not roasted
MFN duties (Applied)
9.60% 9.60%
Mozambique 1202 Ground-nuts, not roasted
MFN duties (Applied)
0.00% 0.00%
32
Importers Selected product codes
Product description
Trade regime description
Applied tariffs
Total ad valorem equivalent tariff (estimated)
New Zealand
120210010 Ground-nuts, not roasted or otherwise cooked, in shell, used as materials for oil extraction under the supervision of the Customs
MFN duties (Applied)
0.00% 0.00%
120210099 Ground-nuts, not roasted or otherwise cooked, in shell, excluding those used as materials for oil extraction under the supervision of the Customs, n.e.s.
MFN duties (Applied)
0.00% 0.00%
Finland
12021000 Ground-nuts, not roasted or otherwise cooked, in shell
MFN duties (Applied)
0.00% 0.00%
12021000 Ground-nuts, not roasted or otherwise cooked, in shell
MFN duties (Applied 0.00% 0.00%
Georgia 1202101000 Groundnuts in shell for sowing
MFN duties (Applied)
0.00% 0.00%
1202109000 Groundnuts in shell (excl. roasted or otherwise cooked and for sowing)
MFN duties (Applied)
0.00% 0.00%
1202200000 Shelled groundnuts, whether or not broken (excl. roasted or otherwise cooked)
MFN duties (Applied)
0.00% 0.00%
USA 12021010 Ground-nuts, not roasted or otherwise cooked, whether or not shelled or broken: In shell
MFN duties (Applied)
68.4% 68.4%
33
Importers Selected product codes
Product description
Trade regime description
Applied tariffs
Total ad valorem equivalent tariff (estimated)
For feed purpose
12021010 Ground-nuts, not roasted or otherwise cooked, whether or not shelled or broken: In shell For feed purpose
MFN duties (Applied)
68.4% 68.4%
Trinidad and Tobago
12021000 Groundnuts in shell, not roasted or otherwise cooked
General tariff 22.50% 22.50%
12022000 Shelled groundnuts, whether or not broken (excl. roasted or otherwise cooked)
General tariff 22.50% 22.50%
Egypt 1202101000 Groundnuts in shell for sowing
MFN duties (Applied)
5.00% 5.00%
1202109000 Groundnuts in shell (excl. roasted or otherwise cooked and for sowing)
MFN duties (Applied)
5.00% 5.00%
1202200000 Shelled groundnuts, whether or not broken (excl. roasted or otherwise cooked)
MFN duties (Applied)
5.00% 5.00%
Source: ITC Market Access Map
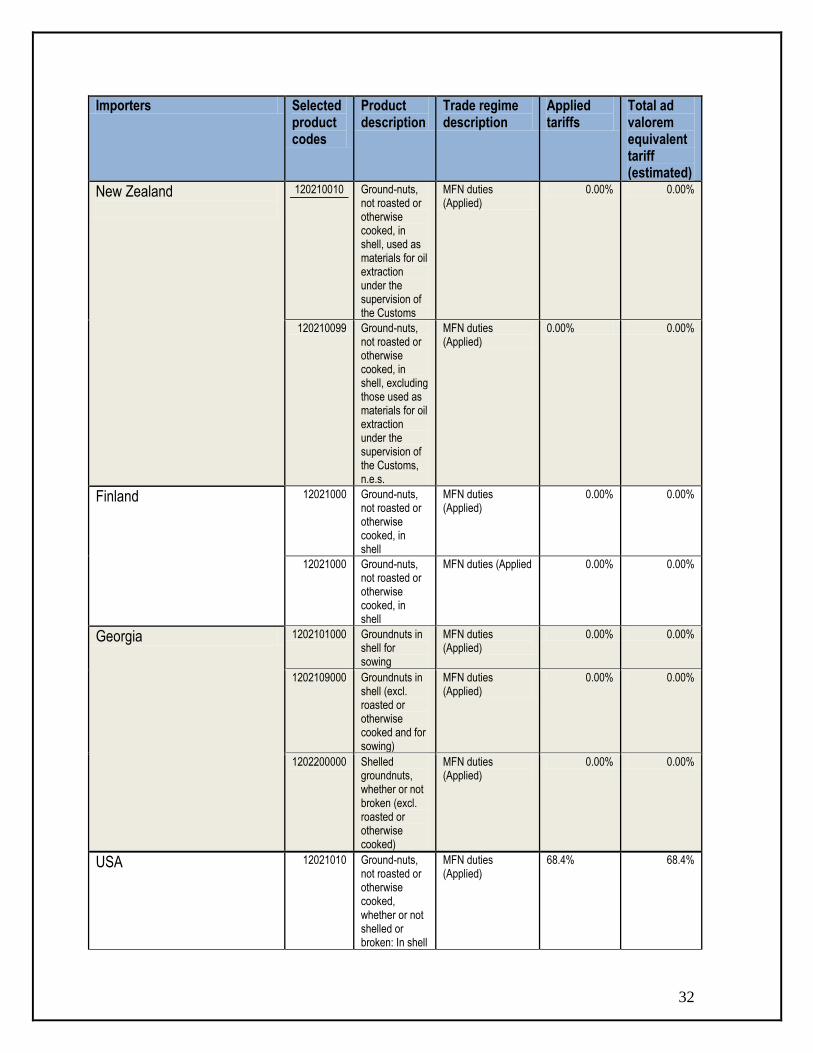
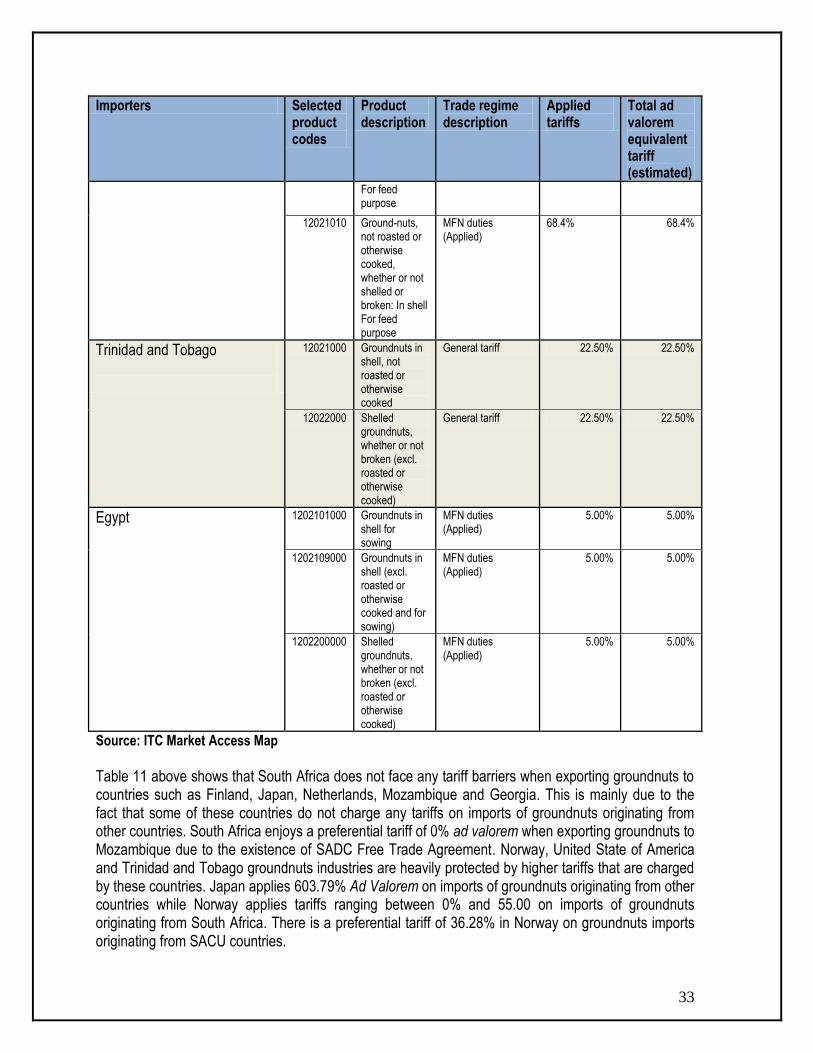
Table 11 above shows that South Africa does not face any tariff barriers when exporting groundnuts to countries such as Finland, Japan, Netherlands, Mozambique and Georgia. This is mainly due to the fact that some of these countries do not charge any tariffs on imports of groundnuts originating from other countries. South Africa enjoys a preferential tariff of 0% ad valorem when exporting groundnuts to Mozambique due to the existence of SADC Free Trade Agreement. Norway, United State of America and Trinidad and Tobago groundnuts industries are heavily protected by higher tariffs that are charged by these countries. Japan applies 603.79% Ad Valorem on imports of groundnuts originating from other countries while Norway applies tariffs ranging between 0% and 55.00 on imports of groundnuts originating from South Africa. There is a preferential tariff of 36.28% in Norway on groundnuts imports originating from SACU countries.
34
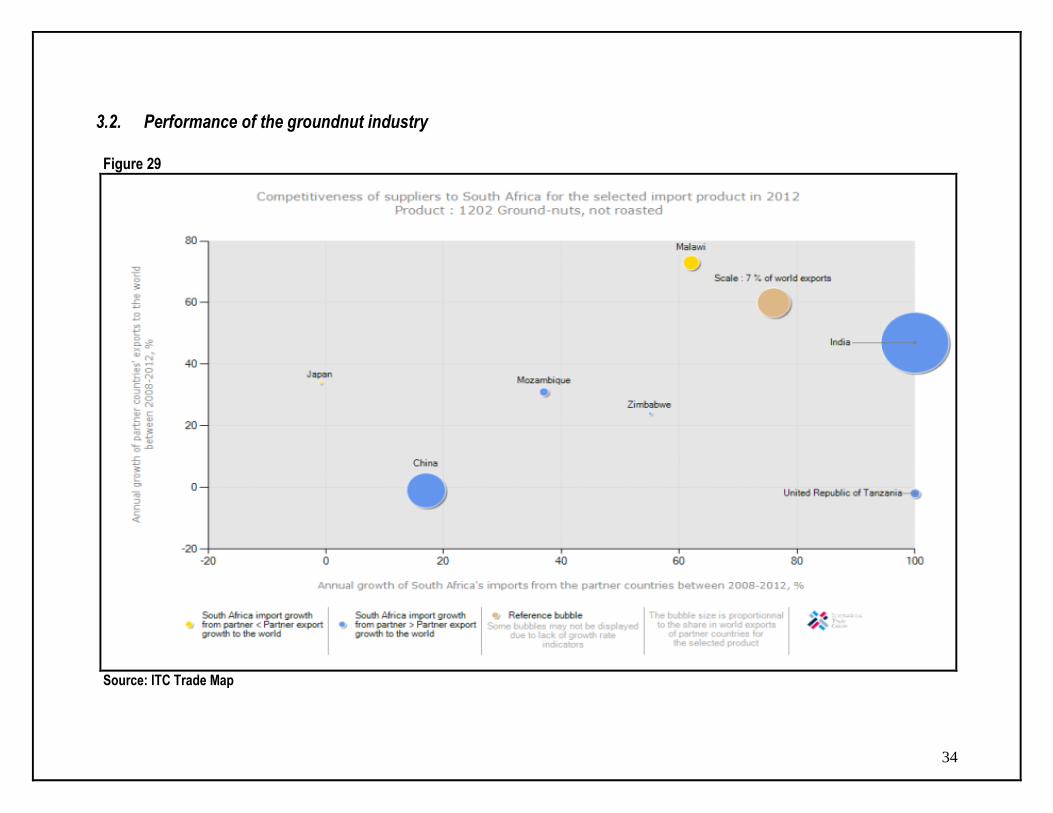
3.2. Performance of the groundnut industry
Figure 29
Source: ITC Trade Map
35
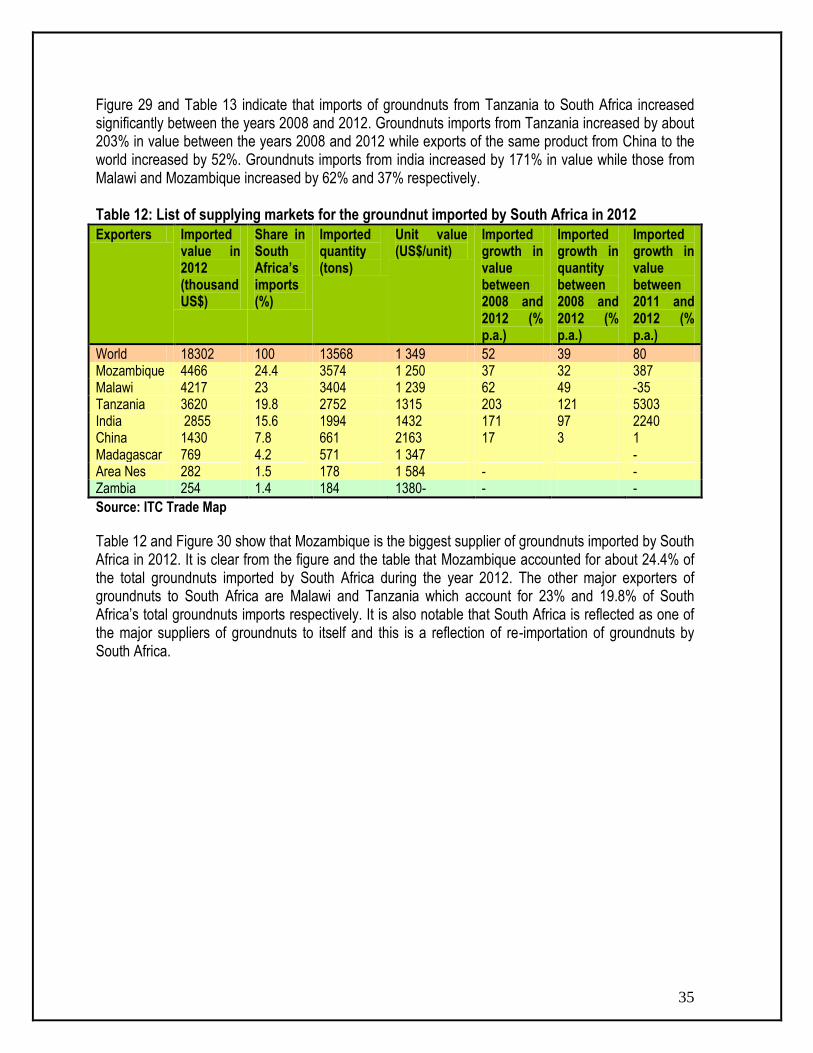
Figure 29 and Table 13 indicate that imports of groundnuts from Tanzania to South Africa increased significantly between the years 2008 and 2012. Groundnuts imports from Tanzania increased by about 203% in value between the years 2008 and 2012 while exports of the same product from China to the world increased by 52%. Groundnuts imports from india increased by 171% in value while those from Malawi and Mozambique increased by 62% and 37% respectively. Table 12: List of supplying markets for the groundnut imported by South Africa in 2012
Exporters Imported value in 2012 (thousand US$)
Share in South Africa’s imports (%)
Imported quantity (tons)
Unit value (US$/unit)
Imported growth in value between 2008 and 2012 (% p.a.)
Imported growth in quantity between 2008 and 2012 (% p.a.)
Imported growth in value between 2011 and 2012 (% p.a.)
World 18302 100 13568 1 349 52 39 80 Mozambique 4466 24.4 3574 1 250 37 32 387 Malawi 4217 23 3404 1 239 62 49 -35 Tanzania 3620 19.8 2752 1315 203 121 5303 India 2855 15.6 1994 1432 171 97 2240 China 1430 7.8 661 2163 17 3 1 Madagascar 769 4.2 571 1 347 - Area Nes 282 1.5 178 1 584 - - Zambia 254 1.4 184 1380- - -
Source: ITC Trade Map
Table 12 and Figure 30 show that Mozambique is the biggest supplier of groundnuts imported by South Africa in 2012. It is clear from the figure and the table that Mozambique accounted for about 24.4% of the total groundnuts imported by South Africa during the year 2012. The other major exporters of groundnuts to South Africa are Malawi and Tanzania which account for 23% and 19.8% of South Africa’s total groundnuts imports respectively. It is also notable that South Africa is reflected as one of the major suppliers of groundnuts to itself and this is a reflection of re-importation of groundnuts by South Africa.

36
Figure 30
Source: ITC Trade Map

37
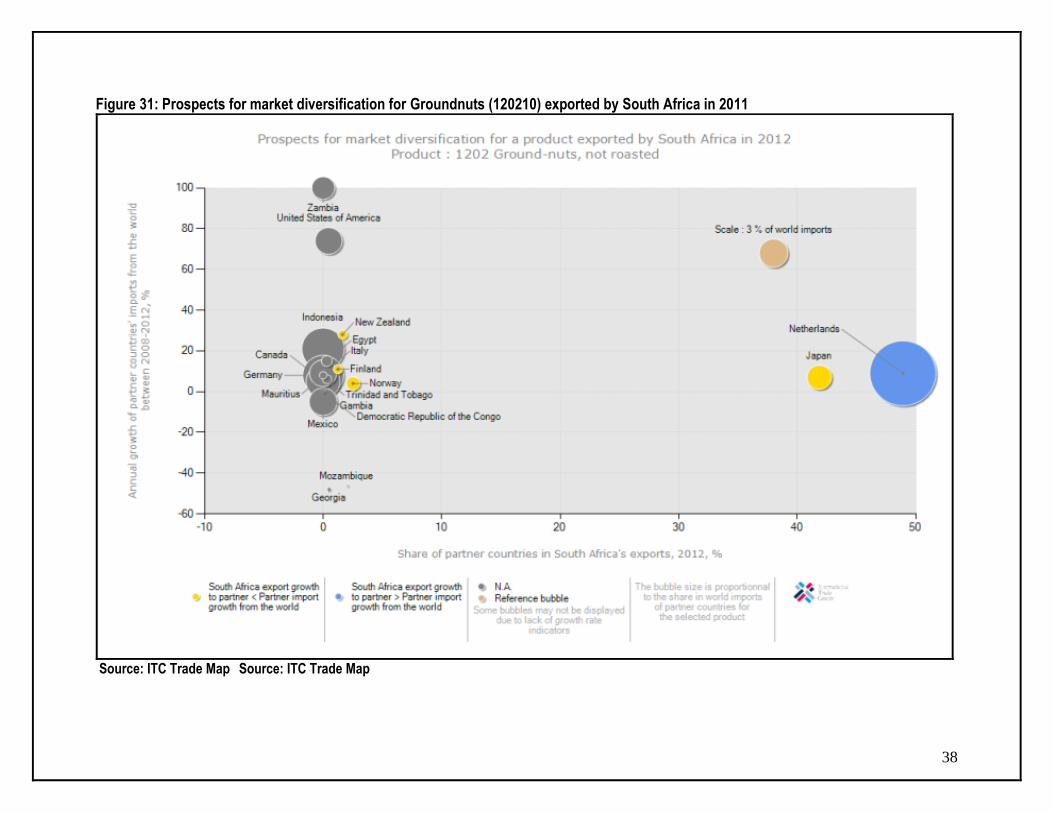
Table 13: List of Importing markets for the groundnut exported by South Africa in 2012
Importers Exported value in 2012 (thousand US$)
Share in South Africa’s exports (%)
Exported quantity 2012 (tons)
Unit value (US$/ton)
Exported growth in value between 2008 and 2012 (% p.a.)
Exported growth in quantity between 2008 and 2012 (% p.a.)
Exported growth in value between 2011 and 2012 (% p.a.)
World 22316 100 10090 2212 6 -5 -13
Netherlands 10915 48.9 5177 2108 38 21 19 Japan 9,340 41.9 3904 2392 0 -12 1 Norway 565 2.5 233 2425 -4 -15 -40 Mozambique 448 2 339 1322 -8 -19 -61 New Zealand 366 1.6 144 2542 3 -9 -54 Finland 281 1.3 122 2 303 -6 -18 -50 Georgia 114 0.5 36 3167 - USA 105 0.5 54 1 944 -6 Trinidad and Tobago
77 0.3 36 2139 -90
Egypt 71 0.3 25 2 840 - 103
Source: ITC Trade Map
It is clear from Table 13 and Figure 31 that the major export destinations for ground-nut originating from South Africa are Netherlands, Japan Norway, Mozambique, New Zealand, Finland, Georgia USA Trinidad and Tobago, and Egyptwith the greatest volumes being exported to Japan and Netherlands. In 2011, Netherlands alone absorbed 48.9% of South Africa’s total groundnut exports followed Japan and Norway with 41.9% and 2.5% respectively. South Africa’s value of groundnuts exports to the world increased by 6% in value terms between the years 2008 and 2012. The figure and the table further show that, between the years 2011-2012 the value of the South African groundnut exports to the world declined by 13% while those towards Egypt increased by 103% over the same period. Figure 31 further shows that South Africa’s groundnuts exports to countries such as Netherlands, Japan, United Kingdom, USA, Norway and Mozambique have grown faster than these countries’ imports from the rest of the world. The growth rate of South Africa’s groundnut exports to countries such as New Zealand and Mauritius is less than the growth in these countries’ imports from the rest of the world. The figure further shows that if South Africa wishes to expand its ground-nut export base, the prospective markets exist in countries such as Canada, Germany and Indonesia.
38
Figure 31: Prospects for market diversification for Groundnuts (120210) exported by South Africa in 2011
Source: ITC Trade Map Source: ITC Trade Map

39
4. ACKNOWLEDGEMENTS The following organizations are acknowledged: Statistics and Economic Analysis: Department of Agriculture, Forestry and Fisheries Tel: (012) 319 8453 Fax: (012) 319 8031 www.daff.gov.za Grain South Africa www.grainsa.co.za African Groundnut Council www.afgroundnutcouncil.org Quantec Easydata P.O.Box 35466 Menlo Park Pretoria 0102 Tel: 012 361 5154 Fax: 012 348 5874 Website: www.quantec.co.za ITC Trade Map Website: http://www.trademap.org ITC Market Access Map www.macmap.org Disclaimer: This document and its contents have been compiled by the Department of Agriculture, Forestry and Fisheries for the purpose of detailing the groundnut industry. Anyone who uses the information as contained in this document does so at his/her own risk. The views expressed in this document are those of the Department with regard to the industry, unless otherwise stated. The Department therefore accepts no liability that can be incurred resulting from the use of this information.