GROUNDNUT MARKET VALUE CHAIN PROFILE … Publications...1 GROUNDNUT MARKET VALUE CHAIN PROFILE...
38
1 GROUNDNUT MARKET VALUE CHAIN PROFILE 2011/2012 Department of Agriculture, Forestry and Fisheries Directorate Marketing Private Bag X 15 Arcadia 0007 Tel: 012 319 8455/6 Fax: 012 319 8131 Email: [email protected]
Transcript of GROUNDNUT MARKET VALUE CHAIN PROFILE … Publications...1 GROUNDNUT MARKET VALUE CHAIN PROFILE...

1
GROUNDNUT MARKET VALUE CHAIN PROFILE
2011/2012
Department of Agriculture, Forestry and Fisheries
Directorate Marketing Private Bag X 15
Arcadia 0007
Tel: 012 319 8455/6 Fax: 012 319 8131
Email: [email protected]

2
TABLE OF CONTENTS
1. DESCRIPTION OF THE INDUSTRY ...................................................................................... 3
1.1. Producing Areas ............................................................................................................ 3 1.2. Production Trends ......................................................................................................... 5
3. MARKET STRUCTURE ........................................................................................................ 6
2.1. Domestic Market and Prices ........................................................................................... 6 2.2. Exports ......................................................................................................................... 8
2.3. Share Analysis ............................................................................................................ 19
2. 4. Imports ................................................................................................................... 23 2.5. Processing .................................................................................................................. 26
2.6 Market Value Chain ..................................................................................................... 28
3. MARKET INTELLIGENCE ................................................................................................... 29 3.1 Tariffs ......................................................................................................................... 29
3.2. Performance of the groundnut industry .......................................................................... 32
4. ACKNOWLEDGEMENTS .................................................................................................... 38

3
1. DESCRIPTION OF THE INDUSTRY Groundnuts contribute approximately 1.1% to the gross value of field crops and the average annual gross value of groundnuts for the previous ten years up to 2010/11 season amounts to approximately R 373 800 million. Groundnuts can be consumed in an unprocessed state, but they also serve in the economy as raw materials for the manufacturing of various products. These include, but not limited to, the manufacturing of such products as peanuts, peanut butter, sweets and cooking oil. The production of groundnuts is highly affected by the costs of production inputs as well as the demand for groundnuts. The contribution of the groundnut industry to the gross value of agricultural production is summarized in Figure 1.
Source: Statistics and Economic Analysis, DAFF
Despite lower groundnut producer prices that were experienced during 2001/02 season, the gross value of groundnut production, as shown in Figure 1, was relatively higher at that time mainly as a result of larger volumes that were harvested during that period. Between 2001/02 and 2010/11, the contribution of the groundnut industry to the gross value of agricultural production was characterized by fluctuations with some consistent increases between 2006/07 and 2008/09 seasons. The gross value of production has reached the highest level during 2008/09 mainly as a result of relatively higher levels of production coupled with higher producer prices at the time. The contribution of the groundnut industry to the GVP declined slightly between 2009/10 and 2010/11 seasons.
1.1. Producing Areas
Groundnuts are produced mainly in the north-western regions of South Africa, namely the North West province (33%), Free state (32%) and Northern Cape (30%). Groundnuts are also produced in Limpopo, KwaZulu-Natal and Gauteng provinces although the production is lower in these provinces.
0
100000
200000
300000
400000
500000
600000
700000
800000
2001/02 2002/03 2003/04 2004/05 2005/06 2006/07 2007/08 2008/'09 2009/'10 2010/11
R'0
00
Years
Figure 1: Groundnut Gross Value of Agricultural products

4
The contribution of various provinces to South Africa’s total groundnuts production is depicted in Figure 2 and Table 1 below.
Source: Statistics and Economic Analysis, DAFF
Table 1: Groundnut production by provinces
PROVINCE Production (tons)
2005/06
Production (tons)
2006/07
Production (tons)
2007/08
Production (tons)
2008/09
Production (tons)
2009/10
Production (tons)
2010/11
Northern Cape 26100 21700 21500 31 000 27 120 18 950
Free State 26 000 21 000 35 700 33 690 35 000 20 700
Kwazulu-Natal 0 30 80 0 300 0
Limpopo 2 930 2 200 5 810 6 750 3 520 3 500
North West 18950 13 000 25 650 28 000 22 000 20 900
Gauteng 20 50 60 60 60 0
Source: Statistics and Economic Analysis, DAFF
Table 1 indicates that during the past three years Free State Province has been the major producer of groundnuts even though groundnut production in this province has experienced considerable fluctuations during this period. Northern Cape is the second largest producer of groundnuts after Free State. However North West Province increased its production significantly during 2007/08 and surpassed Northern Cape’s production volumes. Notably, groundnut production in all the major producing regions, except in Northern Cape, has undergone a drastic increase during 2007/08 season, leading to a slight increase in South Africa’s total groundnuts production. During 2010/11 season groundnuts production from provinces such as Free State and North West increased while production remained low in Gauteng and Kwazulu Natal provinces for the past six seasons.
Northern Cape 30%
Free State 32%
Kwazulu-Natal 0%
Limpopo 5%
Gauteng 0%
North West 33%
Figure 2: groundnut production by Province 2010/11

5
1.2. Production Trends
Plantings and production of groundnuts from 2001/02 to 2010/11 production seasons were as depicted in Table 2 and Figure 3 below.
Source: Statistics and Economic Analysis, DAFF
Table 2 and Figure 3 make it clear that production volumes for groundnuts were at the highest level during the 2001/2002 season, mainly as a result of larger plantings at the time. The production, as both Table 2 and Figure 3 indicate, started to decrease in 2001/02 season as a result of reduced plantings and this continued until 2002/03 season. In 2003/04 season the production increased following a slight increment in area planted. During the 2004/05 season the production decreased following a decline in area planted for groundnuts and then increased slightly during the 2005/06 season. Despite only slight decrease in the area planted to groundnuts during 2010/11 season, the groundnuts production volumes declined significantly during that time indicating a slight decline in yields. Table 2: Groundnuts: Area planted and total production Year 2001
/02 2002 /03
2003 /04
2004 /05
2005 /06
2006 /07
2007 /08
2008 /09
2009 /10
2010 /11
Area planted (1000 ha)
94 50 72 44 49 41 54.20 52 57 55
Total production (1000 tons)
134 67 128 72 84 66 100.50 113 100 73
Source: Statistics and Economic Analysis, DAFF
Figure 3: Production vs Total Area planted
0
20000
40000
60000
80000
100000
120000
140000
160000
2001/02
2002/03
2003/04
2004/05
2005/06
2006/07
2007/08
2008/'09
2009/'10
2010/11
Years
Prod
ucti
on (t
on)
0100002000030000400005000060000700008000090000100000
Are
a Pl
ante
d (h
a)
Production Area planted

6
3. MARKET STRUCTURE
2.1. Domestic Market and Prices
Figure 4 depicts local consumption of groundnuts compared to the total local production to find out if our country is self sufficient in groundnuts or not. The figure indicates that the production of groundnuts is mostly higher than consumption which is an indication that South Africa is self-sufficient in terms of groundnut production and it may not be necessary for us to depend on import except in rare cases where we sometimes experience shortages in groundnuts just like in 2002/03 season where the domestic consumption exceeded local production making it extremely necessary for us to import in order to meet local demand.
Source: Statistics and Economic Analysis, DAFF
Increased groundnuts plantings in 2007/08 and 2008/09 lead to a situation where groundnuts production volumes increased to an extent of surpassing the local consumption needs. The period under review closed with relatively lower production volumes during the 2010/11 season, but this was still enough to match the domestic consumption volumes. The average producer prices for groundnuts from 2001/02 to 2010/11 season are as indicated in Table 3 and Figure 5 below. Table 3: Groundnuts: Producer prices
Season 2001/02 2002/03 2003/04 2004/05 2005/06 2006/07 2007/08 2008/09 2009/10 2010/11
R/Ton
Producer Prices
2426 5050 2870 2504 2849 58684 6122 6361 4553 5142
Source: Statistics and Economic Analysis, DAFF
Figure 4: Groundnut Production vs Consumption
0
20000
40000
60000
80000
100000
120000
140000
160000
2001/02
2002/03
2003/04
2004/05
2005/06
2006/07
2007/08
2008/'09
2009/'10
2010/11
Period (Years)
Tons
production consumption

7
Source: Statistics and Economic Analysis, DAFF
Table 3 and Figure 5 explain that the producer prices of groundnuts increased steadily between 2001/02 and 2002/03 seasons. The producer price for groundnuts went to as high as R5000/ton in 2002/03 season which can be highly ascribed to low levels of production during that season, which resulted in low levels of local supply. Producer prices declined to levels below R3 000/ton between 2003 and 2006 and increased substantially during 2006/07 season, primarily due to the local demand exceeding the domestic production. The price increased further during 2007/08 and 2008/09 seasons to the levels beyond R6 000/ton. The period under analysis closed with a price of about R5 100 for a ton of groundnuts during the year 2011. Figure 6 below shows a breakdown of groundnuts utilization in the domestic market from 2001/02 to 2010/11 season. In South Africa groundnuts are traded for three main functions: for peanut butter and direct market, for oil and oilcake and for seed. The figure shows that the greater quantities of groundnuts in the domestic market were sold as edible groundnuts with sales showing an increase in 2002/03 season. More than 60 000 tons of groundnuts were sold as edible groundnuts during the years 2002/03 and 2010/11. On average less than 20 000 tons of groundnuts are sold for crushing into oil and oilcake in the domestic market while less that 10 000 tons are directed to the animal feed and seed markets.
Figure 5: Groundnuts Producers Prices
0
1000
2000
3000
4000
5000
6000
7000
2001/02
2002/03
2003/04
2004/05
2005/06
2006/07
2007/08
2008/'09
2009/'10
2010/11
Period (years)
Price
(R/t
on)

8
Source: Statistics and Economic Analysis, DAFF
2.2. Exports
The volume and value of groundnuts exports from South Africa to the world are summarized in Figure 7 below.
Source: Statistics and Economic Analysis (DAFF) and Quantec Easydata
0
10000
20000
30000
40000
50000
60000
70000
Vo
lum
e (
Ton
s)
Marketing Years
Figure 6: Local Utilization of Groundnuts
Oil and Oilcake Peanut butter and direct edible market seed and unshelled seed
0
50000000
100000000
150000000
200000000
250000000
300000000
0
10000
20000
30000
40000
50000
60000
2002 2003 2004 2005 2006 2007 2008 2009 2010 2011
Exp
ort
Valu
e (
Ran
ds)
Exp
ort
vo
lum
e (
To
ns)
Period (Years)
Figure 7: Volume and value of groundnuts exports - 2002 to 2011
Quantity Value

9
South Africa exports an average of 9 670 tons of groundnuts per annum. This represents about 26% of the groundnuts that are produced by South Africa annually. Figure 7 indicates that the period under analysis opened with relatively higher levels of groundnuts exports during the year 2002. The year 2002 was the best year ever (looking at the period under the examination) in groundnut exportation. More than 50 000 tons were exported during that year and this yielded the export earnings amounting to approximately 255 million Rands. The export values decreased significantly as a result of a drastic decline in export volumes which went down to as low as 16 000 tons between the year 2003 and 2004, and continued to decline substantially until 2007. However, both volume and value of groundnut exports increased slightly during the years 2008 and 2010. The period under analysis closed with higher values of groundnuts exports during the year 2011 while the export volumes remained at lower levels. South Africa imports its groundnuts from countries such as China, Malawi, Argentina and Japan as shown in Figure 8.
Source: ITC Trade Map
Figure 8 makes it clear that Malawi is the largest exporter of groundnuts to South Africa, having accounted for 67% of South Africa’s total groundnut imports (in value terms) during the year 2011. During the same year, China accounted for about 15% of the total groundnuts imported by South Africa followed by Mozambique and Malawi with 9% each. Figure 9 below shows volumes of groundnuts exports to the various regions.

10
Source: Quantec Easydata
Figure 9 shows that groundnut exports from South Africa are destined for the markets in Europe, Asia, Africa, the Americas and Oceania. The figure indicates that exports to Europe and Asia are more than those destined to neighboring countries to South Africa within the African continent which is not surprising as most countries in Africa are involved mostly in primary agricultural production than in processing. Generally, the volume of groundnuts exports to Europe started to decline from 2003 until 2007, followed by slight increases between 2008 and 2010. Exports to Asia fluctuated at moderate levels from the year 2002 until some increases were experienced in 2008. The period under review closed with larger volumes of groundnuts exports being destined to Europe followed by Asia. Volumes of groundnuts exports to the European Union are depicted in Figure 10 below. In the European Union, Netherlands is the main market for South African groundnut exports followed by Germany and the United Kingdom. The exports to United Kingdom remained at lower levels from the year 2002 to 2007 and increased marginally in 2008. Furthermore, it can also be inferred from Figure 10 that the volume of groundnut exports originating from South Africa to the EU has also started to decline as from the 2003 season. This means that the RSA is slowly losing market share for groundnuts in the EU.
2002 2003 2004 2005 2006 2007 2008 2009 2010 2011
Africa 5475.9 2238.5 2643.3 1915.7 1358.5 1070.3 1937.3 2032.6 3975.9 844.93
Americas 851.75 96.619 0 0 0 60 0 186 18.1 316.8
Asia 13315 8919.6 6536.2 9022 7208.2 4645 7496.7 4542 7523.6 4886.4
Europe 30719 11828 6715 9276.9 3721.5 2700.5 4663.7 4655.2 13298 7361.4
Oceania 208.41 233.95 108 396.08 252 198 386.4 216 162 324
0
5000
10000
15000
20000
25000
30000
35000 E
xp
ort
s V
olu
me (
ton
s)
Period (years)
Figure 9: Volume of groundnuts exports to various regions
Africa Americas Asia Europe Oceania

11
Source: Quantec Easydata
Figure 11 indicates that in Asia, Japan is the main export market for groundnuts emanating from South Africa. Groundnut exports from South Africa to China and Taiwan were minimal over the period under review mainly due to the fact that China has a robust grain and oil seeds production base. However, as mentioned earlier, it is important to note the steep decline in groundnut exports to Eastern Asia that occurred between 2005 and 2007, which was followed by a huge increase in export volumes from South Africa to Japan in 2008. The volume of groundnuts exports to Japan declined dramatically during the year 2009. On the African continent South African groundnut exports are destined mainly to the SADC region.
Source: Quantec Easydata

12
Source: Quantec Easydata
Figure 12 indicates that groundnut exports from South Africa to the SADC region are mainly destined to Mozambique, Angola and Zimbabwe, with minimum volumes going to Zambia and other countries within SADC. The volume of groundnut exports to Zambia has been consistently low during the period under review while those to Zimbabwe have fluctuated tremendously and declined the lower levels in 2007 and again in 2010 and 2011.Generally, groundnuts exports from South Africa to the SADC region have been declining from 2004 until 2011. The value of groundnuts exports from various provinces are depicted in Figure 13 below.
Source: Quantec Easydata
0
500
1000
1500
2000
2500
3000
2002 2003 2004 2005 2006 2007 2008 2009 2010 2011
Exp
ort
Vo
lum
e (
To
ns)
Period (Years)
Figure 12: Volume of groundnuts exports to the SADC region
Angola Mozambique Zambia Zimbabwe
0
50000000
100000000
150000000
200000000
250000000
300000000
350000000
2002 2003 2004 2005 2006 2007 2008 2009 2010 2011
Ex
po
rt V
alu
e (
Ra
nd
s)
Period (Years)
Figure 13: Value of groundnuts exports by Provinces
Western Cape Northern Cape Free State Kwazulu-Natal North West Gauteng

13
Figure 13 above indicates that groundnuts are mainly exported from Gauteng, North West and KwaZulu-Natal provinces. It is not surprising to witness North West province recording such high export values because it is amongst the largest producers of groundnuts in the country but Gauteng and KwaZulu-Natal provinces’ capacity to export is brought about by the availability of suitable infrastructure for exportation in these provinces. Gauteng is exporting much because of favorable agro-logistics, the presence of a large number of exporters in the province and the role of the Randfontein grain market while KwaZulu-Natal’s export capability is enhanced by the presence of Durban harbor through which most commodities are shipped. Exports from Limpopo, Free State and Eastern Cape provinces were very low over the period under analysis. Despite Eastern Cape being one of South Africa’s main export hubs, groundnuts exports from this Province remained very low mainly because the harbor facilities that are available in Port Elizabeth are mainly used for trading of automotive parts rather than agricultural products. Figure 14 indicates that groundnut exports from the Gauteng province originate mainly from three districts, namely City of Tshwane, City of Johannesburg and Ekurhuleni district Municipality. On average the West Rand District is the one that accounted for the highest export values in 2002 followed by the City of Johannesburg. From 2003 until 2008 the City of Tshwane commanded the greatest share in groundnut exports while export values from the three other districts experienced a decrease to levels below 20 million rand per annum. In 2009, the value of groundnuts exports from City of Tshwane declined to about 20 million rand. The period under review closed with lower values of groundnuts exports from all regions in Gauteng province.
Source: Quantec Easydata
Figure 15 below indicates that in general the values of groundnut exports from the North West province experienced a substantial decrease from the year 2003 until the lowest levels were reached during the year 2004. A general increase in the value of groundnuts exports from North West province was experienced from the year 2004 until 2008, particularly from Bojanala District. Bojanala District was the

14
only exporter of groundnuts in the North West province between the years 2006 and 2008. There were no exports of groundnuts from North West between the years 2009 and 2011.
Source: Quantec Easydata
Values of groundnut exports from KwaZulu-Natal province for the period 2002 to 2011 are shown in Figure 16 below.
Source: Quantec Easydata
0
10000000
20000000
30000000
40000000
50000000
60000000
70000000
80000000
2002 2003 2004 2005 2006 2007 2008 2009 2010 2011
Exp
ort
Valu
e (
Ran
ds)
Period (Years)
Figure 15: Value of groundnuts exports from North West Province
Bojanala District municipality Central District municipality
Bophirima District municipality Southern District municipality
0
10000000
20000000
30000000
40000000
50000000
60000000
70000000
80000000
2002 2003 2004 2005 2006 2007 2008 2009 2010 2011
Exp
ort
Valu
e (
Ran
ds)
Period (Years)
Figure 16: Value of groundnuts exports from KwaZulu-Natal Province
UMgungundlovu District municipality Umzinyathi District municipality
iLembe District municipality eThekwini Metropolitan Municipality

15
Figure 16 above indicates that in KwaZulu-Natal, eThekwini Metro municipality is the main exporter of groundnuts. This is not surprising because of availability of Durban harbor in the district, which serves as an overpass for the exports of numerous commodities. Of importance to note is that the values of groundnut exports through the eThekwini district has also experienced a considerable decrease between 2005 and 2007 while groundnut export values from the rest of the other districts were close to zero. An increase in export values from aThekwini and Umgungundlovu districts were experienced during the year 2008, basically due to a slight increase that was experienced in production volumes in the country at that time. This was followed by a decline during the year 2009. The value of groundnuts exports from KwaZulu-Natal province increased slightly during the year 2010, particularly those from eThekwini and UMgungundlovu District and this was followed by a decline in the value of groundnuts exports from both districts during the year 2011. Groundnuts exports from the Western Cape province are shown in Figure 17.
Source: Quantec Easydata
In the Western Cape province, between 2002 and 2003 groundnut exports originated mainly from the Cape Winelands district municipality and the City of Cape Town metropolitan municipality. Groundnut exports from the Cape Winelands municipality fluctuated over time until peak was reached in 2002 and thereafter there were no exports of groundnuts from this district. A similar trend is observed regarding the values of groundnut exports from the City of Cape Town district. Between the years 2004 and 2011 groundnuts export values from all districts of the Western Cape province were at the lowest levels. The contributions of various districts to total Limpopo export value for groundnuts are illustrated in Figure 18.
2002 2003 2004 2005 2006 2007 2008 2009 2010 2011
City of Cape Town 14012005 218514 124 6492 23354 36891 10490 25424 37161 55298
Cape Winelands 5082639 5173279 0 0 0 0 0 0 90840 6213
0
2000000
4000000
6000000
8000000
10000000
12000000
14000000
16000000
Exp
ort
s v
alu
e (
Ran
ds)
Period (Years)
Figure 17: Value of groundnuts exports from Western Cape Province
City of Cape Town Cape Winelands

16
Source: Quantec Easydata
Figure 18 makes it clear that in Limpopo Province Vhembe and Capricorn districts were the only exporter of groundnuts. The figure further shows that for the period under analysis, Limpopo Province exported groundnuts only during the year 2002 after which the Province ceased to participate in the export market for groundnuts. Values of various districts to total Mpumalanga export value for groundnuts are depicted in Figure 19.
Source: Quantec Easydata
2002 2003 2004 2005 2006 2007 2008 2009 2010 2011
Vhembe District 9737605 0 0 0 0 0 0 0 0 0
Capricorn District 1386314 0 0 0 0 0 0 0 0 0
0
2000000
4000000
6000000
8000000
10000000
12000000
Exp
ort
s V
alu
e (
Ran
ds)
Period (Years)
Figure 18: Value of groundnuts exports from Limpopo Province
Vhembe District Capricorn District
2002 2003 2004 2005 2006 2007 2008 2009 2010 2011
Nkangala District 0 2517913 0 0 0 0 0 0 0 1184649
Ehlanzeni District 3.9E+07 9298596 48000 0 0 0 0 0 0 0
0
5000000
10000000
15000000
20000000
25000000
30000000
35000000
40000000
45000000
Exp
ort
s V
alu
e (
Ran
ds)
Period (Years)
Figure 19: Value of groundnuts exports from Mpumalanga Province
Nkangala District Ehlanzeni District

17
Ehlanzeni and Ngangala are the only districts in Mpumalanga that exported groundnuts during the period under analysis. Groundnut export values from Mpumalanga province declined in 2003 and then disappeared completely from 2004 until 2010. Exports of groundnuts from Mpumalanga re-surfaced again during the year 2011, particularly from Nkangala District. Figure 20 below presents groundnut export values from various districts of Free-state Province.
Source: Quantec Easydata
In Free-State province, groundnut exports originate mainly from the Northern Free State District Municipality. Northern Free-State District Municipality only started to export groundnuts in 2005 and 2007, after which groundnuts exports from Free State disappeared until 2009. During the year 2010, Lejweleputswa District Municipality contributed the largest value to the provincial groundnuts exports. At that time the value of exports from Lejweleputswa District amounted to about 13 million rands, which is the highest for the period under analysis. The values of groundnuts exports were very low during the closing year of the period under analysis (year 2011). As indicated in Figure 21 below, in the Eastern Cape province groundnut exports originate mainly from Nelson Mandela district only. More export values from Nelson Mandela district were recorded in 2003 while there were no groundnut exports between 2004 and 2011. Eastern Cape province is not one of the major producers of groundnuts and it is for this reason, amongst others, that there were no exports of groundnuts from the province for the most part of the period under analysis.
2002 2003 2004 2005 2006 2007 2008 2009 2010 2011
Lejweleputswa District 0 0 0 0 0 0 0 0 13115436 0
Northern Free State District 0 0 916852 450969 0 270000 0 0 0 500
0
2000000
4000000
6000000
8000000
10000000
12000000
14000000
Ex
po
rt V
alu
e (
Ra
nd
s)
Period (Years)
Figure 20: Value of groundnuts exports from Free State
Lejweleputswa District Northern Free State District

18
Source: Quantec Easydata
Figure 22 indicates that Frances Baard District Municipality is the only exporter of groundnuts in Northern Cape and that the district it only started exporting groundnuts during the year 2002 with a peak reached in 2010. The exports experienced fluctuations between 2004 and 2007 at levels below 10 million rands per annum. A massive increase in exports from the Northern Cape province was experienced during the year 2010 to the level above 100 million Rands. The value of groundnuts exports from the province declined slightly during the year 2011.
Source: Quantec Easydata
0
20000
40000
60000
80000
100000
120000
140000
160000
2002 2003 2004 2005 2006 2007 2008 2009 2010 2011
Ex
po
ts V
Alu
e
Period (Years)
Figure 21: Value of Groundnuts exports from Eastern Cape Province
Nelson Mandela Metropolitan Municipality
0
20000000
40000000
60000000
80000000
100000000
120000000
2002 2003 2004 2005 2006 2007 2008 2009 2010 2011
Exp
ort
Valu
e (
Ran
ds)
Period (Years)
Figure 22: Value of Groundnut Export from Northern Cape Province
P3D05: Frances Baard District municipality

19
2.3. Share Analysis
The shares of various provinces to the total value of South African exports for groundnuts are presented in Table 3. Table 3: Share of provincial groundnut exports to total South African groundnuts exports (%)
Year 2002 2003 2004 2005 2006 2007 2008 2009 2010 2011 Province
Western Cape
3.43 1.87 0.00 0.00 0.02 0.03 0.00 0.01 0.03 0.03
Northern Cape
1.65 11.74 7.60 8.30 8.82 11.76 11.61 14.21 22.79 31.55
Free State 0.00 0.00 0.49 0.19 0.00 0.19 0.00 0.00 2.83 0.00
Kwazulu-Natal
8.77 16.07 36.69 28.49 29.50 16.12 0.00 8.09 10.75 11.25
North West 41.36 33.48 20.95 22.76 23.44 32.58 0.00 0.00 0.00 0.01
Gauteng 35.84 32.73 34.23 40.25 38.22 39.33 63.60 77.69 63.59 56.52
Mpumalanga 6.95 4.11 0.03 0.00 0.00 0.00 0.00 0.00 0.00 0.64
Limpopo 1.99 0.00 0.00 0.00 0.00 0.00 0.00 0.00 0.00 1.00
Source: Calculated from Quantec Easydata
Table 3 above indicates that the Gauteng province commands a greater share of groundnuts exports followed by KwaZulu-Natal and North West provinces. This trends indicate that the greatest percentage of groundnut exports are recorded as originating from Gauteng province and partly from KwaZulu-Natal province despite the fact that the largest producers of groundnuts are the Northern Cape, Free State and North West provinces. This implies that most of groundnuts produced in theses provinces are transported to Gauteng and KwaZulu-Natal provinces because of the fact that these provinces are well equipped with storage facilities and they are, in addition, well located to serve as exportation points. Northern Cape province’s share of groundnuts exports have been increasing since 2002 until 2011. During the year 2002 Northern Cape’s contribution to South Africa’s total groundnuts exports was 1.65% and this has increased to 31.55% in 2011. This scenario is not surprising since Northern Cape province has recently emerged to be one of the biggest producers of groundnuts, having accounted for 30% of South Africa’s total groundnuts production during 2010/11 season. The shares of various districts to the total export value for groundnuts in Gauteng province are presented in Table 4. Table 4: Share of the district groundnut exports to the total Gauteng groundnut exports (%)
Year 2002 2003 2004 2005 2006 2007 2008 2009 2010 2011 District
West Rand 61.28 4.49 1.06 8.03 12.07 10.81 46.46 33.01 42.51 26.56
Ekurhuleni 4.09 9.51 10.10 8.58 18.30 14.96 0.07 36.92 35.65 44.73
City of Johannesburg
29.91 39.77 27.92 14.72 9.08 7.52 0.98 0.84 0.09 0.31
City of Tshwane
4.71 46.22 60.92 68.67 60.55 66.71 52.49 29.23 21.75 28.40
Source: Calculated from Quantec Easydata

20
Table 4 shows the contribution of various districts to the total Gauteng’s groundnuts exports, with West Rand being the leading district in terms of export commanding the greatest shares in total Gauteng groundnut exports, followed by the City of Johannesburg and the City of Tshwane. This table indicates that most of groundnut exports in Gauteng are originating from the West Rand District. During the year 2011, Ekurhuleni commanded the greatest share of Gauteng’s total groundnuts exports, 44.73% followed by City of Tshwane and West Rand whose contributions to Gauteng’s groundnuts exports were 28.4%% and 26.56% respectively. Table 5: Share of the district groundnut exports to total KwaZulu-Natal groundnut exports (%)
Year 2002 2003 2004 2005 2006 2007 2008 2009 2010
Districts
UMgungundlovu 1.73 0.42 0.99 1.23 0.00 0.00 26.77 0.00 3.86
UMzinyathi 5.94 0.00 0.00 0.00 0.00 0.00 0.00 0.00 0.00
UThungulu 0.00 0.00 0.00 0.00 0.00 0.00 0.00 0.00 0.00
ILembe 7.37 2.38 0.08 0.00 0.00 0.99 0.00 0.00 0.00
EThekwini 84.97 97.20 98.93 98.71 100 99.00 73.23 100 96.14
Source: Calculated from Quantec Easydata
Table 5 shows the contribution of various districts to the total Kwazulu Natal groundnut exports in percentages. This table further explains that EThekwini as the major exporting district in Kwazulu-Natal province commands the greatest shares of the total groundnut exports in KZN followed by UMgungundlovu and UMzinyathi districts, with ILembe and UThungulu showing a very low flow of exports in the districts. EThekwini’s contribution to KwaZulu-Natal’s total groundnuts exports was above 80% for the most part of the period under review until a decline was experienced in 2008 to 73.23%. During the year 2010, eThekwini Metro Municipality accounted for about 96.14% of groundnuts exports in KZN province followed by UMgungundlovu with 3.86%. Table 6: Share of the district groundnut exports to the total North West groundnut exports (%)
Year 2002 2003 2004 2005 2006 2007 2008 2009 2010 2011 Districts
Bojanala Platinum
32.72 28.23 76.07 70.55 100 100 100 0.00 0.00 0.00
Ngaka-Modiri Molema
12.61 22.42 0.00 0.00 0.00 0.00 0.00 0.00 0.00 0.00
Ruth Mompati
30.90 20.67 0.00 0.00 0.00 0.00 0.00 0.00 0.00 0.00
Kenneth Kaunda
23.77 28.68 23.93 29.45 0.00 0.00 0.00 0.00 0.00 100
Source: Calculated from Quantec Easydata
Table 6 indicates that from the periods 2002 to 2011, groundnut exports in the North West province were mainly originating from Bojanala-Platinum District, Ngaka Modiri-Molema District, Kenneth Kaunda District and Ruth Mompati District. The table shows that Bojanala District command the greatest share of the total North West groundnut export followed by the Southern District and Central District in that order. During the year 2008, Bojanala District Municipality alone accounted for 100% of

21
the total North West groundnuts exports, while exports from other districts diminished. There were no exports of groundnuts from North West province during the years 2009 and 2010. Table 7: Share of the district groundnut exports to the total Free State groundnut exports (%)
Year 2002 2003 2004 2005 2006 2007 2008 2009 2010 2011 Districts
Northern Free State
0.00 0.00 100 100 0.00 100 0.00 0.00 0.00 100
Lejweleputswa 0.00 0.00 0.00 0.00 0.00 0.00 0.00 0.00 100 0.00
Source: Calculated from Quantec Easydata
Table 7 indicates that in the Free State province groundnuts exports are mainly from the Northern Free State District Municipality and that groundnuts exportation in the province is not consistent since there were no exports from 2002 to 2003. The Northern Free State District Municipality commanded the greatest share during the periods 2004 – 2005, and again in 2007. Lejweleputswa district did not export any groundnuts for the period under analysis, except during the year 2010 when the district accounted for 100% of Free State’s total groundnuts exports. Table 7 also indicates that there were no exports of groundnuts from the Free State province in 2008 and 2009. Table 8: Share of the district groundnut exports to the total Mpumalanga groundnut exports (%)
Year 2002 2003 2004 2005 2006 2007 2008 2009 2010 2011 Districts
Ehlanzeni 100 78.69 100 0.00 0.00 0.00 0.00 0.00 0.00 0.00
Nkangala 0.00 21.31 0.00 0.00 0.00 0.00 0.00 0.00 0.00 100
Source: Calculated from Quantec Easydata
In the Mpumalanga province, the Ehlanzeni District commanded the greatest shares of the total Mpumalanga groundnut exports as shown by Table 8. The Ehlanzeni district is the major exporter of groundnuts in Mpumalanga province. The maximum performance in terms of groundnut exports was shown by the district between the periods of 2001-2004, when it commanded the highest shares, which recently decreased to zero between the years 2005 to 2011. Nkangala District only exported groundnuts during the years 2003 and 2011. Table 9: Share of the district groundnut exports to the total Limpopo groundnut exports (%)
Year 2002 2003 2004 2005 2006 2007 2008 2009 2010 2011 Districts
Vhembe 87.00 0.00 0.00 0.00 0.00 0.00 0.00 0.00 0.00 0.00
Capricorn 12.99 0.00 0.00 0.00 0.00 0.00 0.00 0.00 0.00 0.00
Source: Calculated from Quantec Easydata
Table 9 indicates that only two districts in the Limpopo Province contribute to these provinces’ export values. In Limpopo only Vhembe and Capricorn districts are the exporters of groundnuts. Vhembe district commanded the greatest shares of the total Limpopo groundnut exports with Capricorn district being the second exporter for the province. However, Limpopo Province only exported groundnuts in 2002 after which there were no groundnut exports from this province until 2011.
22
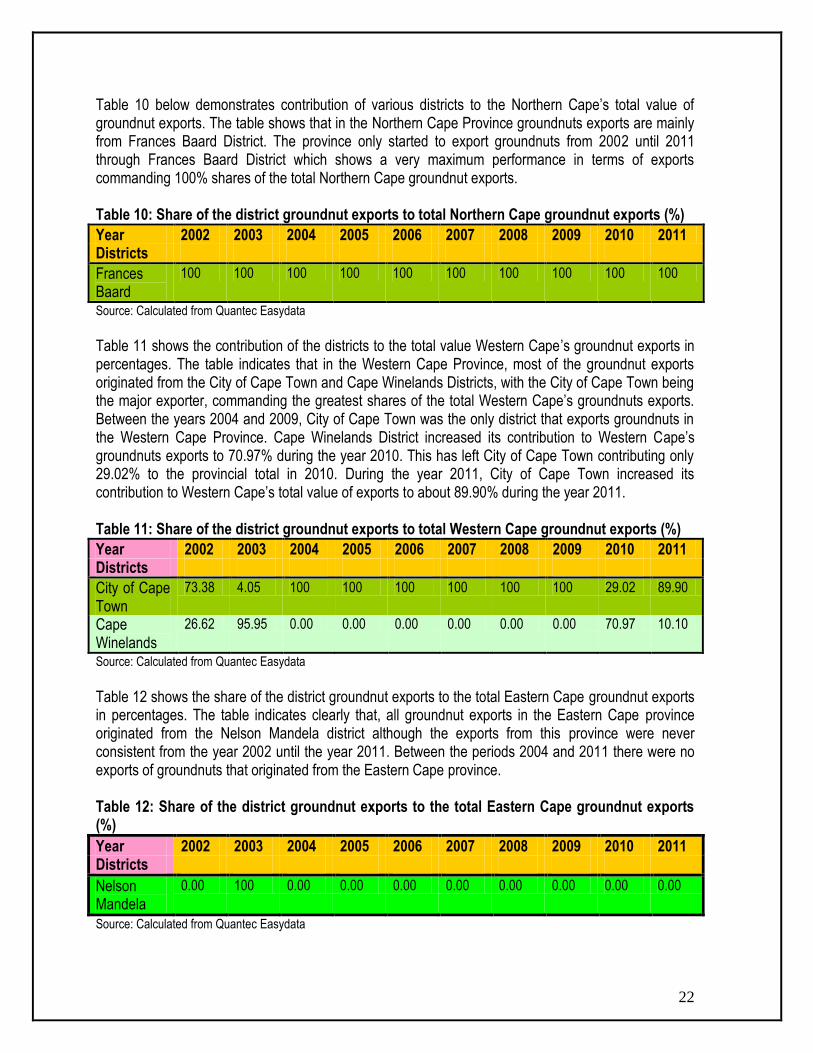
Table 10 below demonstrates contribution of various districts to the Northern Cape’s total value of groundnut exports. The table shows that in the Northern Cape Province groundnuts exports are mainly from Frances Baard District. The province only started to export groundnuts from 2002 until 2011 through Frances Baard District which shows a very maximum performance in terms of exports commanding 100% shares of the total Northern Cape groundnut exports. Table 10: Share of the district groundnut exports to total Northern Cape groundnut exports (%)
Year 2002 2003 2004 2005 2006 2007 2008 2009 2010 2011 Districts
Frances Baard
100 100 100 100 100 100 100 100 100 100
Source: Calculated from Quantec Easydata
Table 11 shows the contribution of the districts to the total value Western Cape’s groundnut exports in percentages. The table indicates that in the Western Cape Province, most of the groundnut exports originated from the City of Cape Town and Cape Winelands Districts, with the City of Cape Town being the major exporter, commanding the greatest shares of the total Western Cape’s groundnuts exports. Between the years 2004 and 2009, City of Cape Town was the only district that exports groundnuts in the Western Cape Province. Cape Winelands District increased its contribution to Western Cape’s groundnuts exports to 70.97% during the year 2010. This has left City of Cape Town contributing only 29.02% to the provincial total in 2010. During the year 2011, City of Cape Town increased its contribution to Western Cape’s total value of exports to about 89.90% during the year 2011. Table 11: Share of the district groundnut exports to total Western Cape groundnut exports (%)
Year 2002 2003 2004 2005 2006 2007 2008 2009 2010 2011 Districts
City of Cape Town
73.38 4.05 100 100 100 100 100 100 29.02 89.90
Cape Winelands
26.62 95.95 0.00 0.00 0.00 0.00 0.00 0.00 70.97 10.10
Source: Calculated from Quantec Easydata
Table 12 shows the share of the district groundnut exports to the total Eastern Cape groundnut exports in percentages. The table indicates clearly that, all groundnut exports in the Eastern Cape province originated from the Nelson Mandela district although the exports from this province were never consistent from the year 2002 until the year 2011. Between the periods 2004 and 2011 there were no exports of groundnuts that originated from the Eastern Cape province. Table 12: Share of the district groundnut exports to the total Eastern Cape groundnut exports (%)
Year 2002 2003 2004 2005 2006 2007 2008 2009 2010 2011 Districts
Nelson Mandela
0.00 100 0.00 0.00 0.00 0.00 0.00 0.00 0.00 0.00
Source: Calculated from Quantec Easydata

23
2. 4. Imports
The quantities of groundnuts imported and import values from 2002 to 2011 pursue the pattern which is shown in Figure 23.
Source: Statistics & Economic Analysis (DAFF); Quantec Easydata
On average South Africa imports approximately 104.31 thousand tons of groundnuts per annum to the value of about 14.2 million rands. Figure 23 indicates that groundnut imports fluctuated considerably from the year 2002 until 2011. This occurred as a result of fluctuations in production volumes which were caused by inconsistent weather conditions over the period. The highest quantities of ground were imported during the years 2003 while the lowest were imported in 2011. Figure 24 below clearly indicates that South Africa imports groundnuts mainly from Africa, the Americas and Asia. Figure 24 indicates that groundnuts imports from Africa and Asia fluctuated at lower levels between the year 2002 and 2004 and that during the same period there were no groundnuts imports from Europe. South Africa started importing reasonable volumes from the Americas in the year 2005 and the imports from this region increased significantly in 2006 to reach the levels above 250 thousand tons. The volume of imports from Africa remained at the levels below 100 thousand tons throughout the period under analysis with a peak in 2003. The volumes of groundnuts imports from various regions were very low during the year 2010 and this was followed by a slight increase in 2011.
0
5000000
10000000
15000000
20000000
25000000
30000000
35000000
40000000
45000000
0
5000
10000
15000
20000
25000
30000
2002 2003 2004 2005 2006 2007 2008 2009 2010 2011
Imp
ort
s V
alu
e (
Ran
ds)
Imp
ort
s V
olu
me (
To
ns)
Period (Years)
Figure 23: Groundnuts imports for the period 2002 - 2011
Import Quantity (Ton) Import Value (Rand)

24
Source: Quantec Easydata
From the SADC region groundnut imports originate mainly from countries such as Malawi, Mozambique, Zimbabwe and Zambia. The volumes of groundnut imports originating from all the SADC countries as in Figure 25 have been below 10 thousand tons between the period 2002 and 2011. The groundnuts imports originating from Malawi increased sharply to a level above 6 thousand tons during the year 2004. Figure 25 further shows that groundnut imports from the SADC region were inconsistent over the period under review with the lowest import volumes originating from Zambia.
Source: Quantec Easydata
0
2000
4000
6000
8000
10000
12000
14000
16000
2002 2003 2004 2005 2006 2007 2008 2009 2010 2011
Imp
ort
s V
olu
me (
To
ns)
Period (Years)
Figure 24: Volume of groundnuts imports from various regions
Africa Americas Asia Europe
2002 2003 2004 2005 2006 2007 2008 2009 2010 2011
Malawi 588 3225.2 6837.8 1503 3107 3659 1367.7 653 674 5521.2
Mozambique 36 1954.4 134.72 304.35 409 8976.9 1188 833.3 0 952.4
Tanzania 0 7413.2 1993 0 0 0 114.58 0 0 48.3
Zambia 0 904 436.42 0 1040.7 369.5 0 0 0 0
Zimbabwe 0 30 15.44 0 1.2 0 60.72 57.8 0 864.8
0 1000 2000 3000 4000 5000 6000 7000 8000 9000
10000
Ex
po
rts V
olu
me
(T
on
s)
Period (Years)
Figure 25: Volume of groundnuts imports from the SADC region
Malawi Mozambique Tanzania Zambia Zimbabwe
25
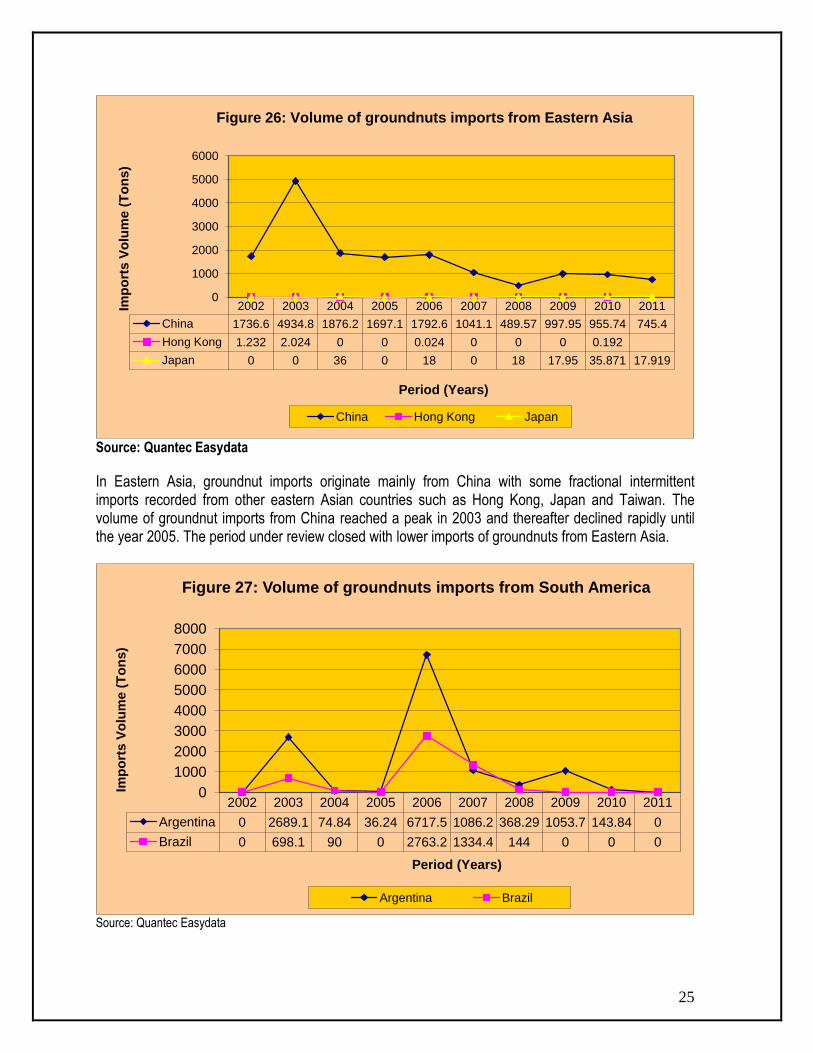
Source: Quantec Easydata
In Eastern Asia, groundnut imports originate mainly from China with some fractional intermittent imports recorded from other eastern Asian countries such as Hong Kong, Japan and Taiwan. The volume of groundnut imports from China reached a peak in 2003 and thereafter declined rapidly until the year 2005. The period under review closed with lower imports of groundnuts from Eastern Asia.
Source: Quantec Easydata
2002 2003 2004 2005 2006 2007 2008 2009 2010 2011
China 1736.6 4934.8 1876.2 1697.1 1792.6 1041.1 489.57 997.95 955.74 745.4
Hong Kong 1.232 2.024 0 0 0.024 0 0 0 0.192
Japan 0 0 36 0 18 0 18 17.95 35.871 17.919
0
1000
2000
3000
4000
5000
6000
Imp
ort
s V
olu
me (
To
ns)
Period (Years)
Figure 26: Volume of groundnuts imports from Eastern Asia
China Hong Kong Japan
2002 2003 2004 2005 2006 2007 2008 2009 2010 2011
Argentina 0 2689.1 74.84 36.24 6717.5 1086.2 368.29 1053.7 143.84 0
Brazil 0 698.1 90 0 2763.2 1334.4 144 0 0 0
0
1000
2000
3000
4000
5000
6000
7000
8000
Imp
ort
s V
olu
me (
To
ns)
Period (Years)
Figure 27: Volume of groundnuts imports from South America
Argentina Brazil

26
Figure 27 indicates that South Africa’s groundnut imports originate mainly from Argentina and Brazil. The groundnuts imports from South America were very low from 2002 until 2005. The highest imports of groundnuts from South America were experienced in 2006 from Argentina followed by a huge decline in 2007. The volume of groundnuts imports from Brazil improved marginally between 2006 and 2007 seasons. South Africa imported lower volumes of groundnuts from South America during the year 2010 when less than 1000 tons of groundnuts were imported from both Argentina and Brazil. The figure further shows that there were no imports of groundnuts from South America during the year 2011.
2.5. Processing
Groundnuts are a high value crop that can be marketed with little processing but are extremely versatile and can be used in a wide range of products. The oil made from them can be used for cooking and they can be used to make peanut butter. In South Africa processing facilities mainly belong to various companies that produce a wide range of products. These include companies that produce peanuts, sweets, peanut-butter and cooking oil just to mention few Oil contains high amounts of energy and fat-soluble vitamins (A, D, E, and K) and essential fatty acids. The oil content of the kernels is between 45% and 55%. The peanuts are prepared for the oil extraction process by being shelled and cleaned. Oil production requires some type of press with which to extract the oil from the groundnuts and filtering equipment. The alternative uses of groundnuts are detailed in the following diagram (Figure 28) As indicated in Figure 28, groundnuts can be used in various ways at different levels within the industry. They can be boiled or roasted for immediate consumption or used as raw material of various products in the industry. Oil extracted from the groundnut can be used as raw material for manufacturing of soap; massage oil for polio patients; body, shaving and hair creams; and fluid diet which is used to physically strengthen patients and to sharpen their appetites before and after operations. The oil cake which is by-product of oil extraction process is used to make glue for wood; animal feed; fertilizers and antibiotics.

27
Figure 28: Groundnut Value Chain tree explaining its uses
Source: Grain SA and African Groundnut Council
Oil extraction
Groundnut Oil Cooking oil
Massage oil (For polio patients)
Body, shave
and hair
creams
Petrol/Diesel
Fluid diet
(For Patients)
Oil Cake
Animal
feed
Fertilizers
Antibiotics
Glue for
Wood
Groundnut
Shells
Fertilizers
Peanuts
Peanut -
Butter
Spread on
Bread Ice Cream
Products
Biscuits
Boiled and
Salted
Soap

28
2.6 Market Value Chain
The market value chain for groundnuts is illustrated in Figure 29. Figure 29: Market value chain for groundnuts
Farmers produce groundnuts and, after harvesting and drying, they grade the groundnut pods at a prescribed moisture level in the kernels. After grading, the pods are packed in gunny bags. The packed groundnuts are then sold to either the local market (processors) or foreign market, or they may be
Research and
Biotechnology
Input suppliers
Farmers/Producers
Silo Owners
Import and
Export Market
Traders and
Transport
Local Market
Peanut-making
Industry
Other
Processors
Oil industry
Retail/Wholesale
Consumer

29
stored for on-farm processing and future sales. The processed groundnut products are sold in an acceptable form to the consumers.
3. MARKET INTELLIGENCE
3.1 Tariffs
Table 13 indicates the tariffs that are applied by South Africa to the imports of groundnuts from other countries during the year 2012. Table 13: Tariffs applied by South Africa to imports of groundnuts from other countries Exporter Selected
product codes
Product description Trade regime description
Applied tariffs
Total ad valorem equivalent tariff (estimated)
Argentina 12021000 Groundnuts in shell, not roasted or otherwise cooked: In shell
MFN duties (Applied)
10.00% 10.00%
12022000 Shelled groundnuts, whether or not broken (excl. roasted or otherwise cooked): Shelled, whether or not broken
MFN duties (Applied)
10.00% 10.00%
China 12021000 Groundnuts in shell, not roasted or otherwise cooked: In shell
MFN duties (Applied)
10.00% 10.00%
12022000 Shelled groundnuts, whether or not broken (excl. roasted or otherwise cooked): Shelled, whether or not broken
MFN duties (Applied)
10.00% 10.00%
Hong Kong 12021000 Groundnuts in shell, not roasted or otherwise cooked: In shell
MFN duties (Applied)
10.00% 10.00%
12022000 Shelled groundnuts, whether or not broken (excl. roasted or otherwise cooked): Shelled, whether or not broken
MFN duties (Applied)
10.00% 10.00%
Japan 12021000 Groundnuts in shell, not roasted or otherwise cooked: In shell
MFN duties (Applied)
10.00% 10.00%
12022000 Shelled groundnuts, whether or not broken (excl. roasted or otherwise cooked): Shelled, whether or not broken
MFN duties (Applied)
10.00% 10.00%
Malawi 12021000 Groundnuts in shell, not roasted or otherwise cooked: In shell
MFN duties (Applied)
10.00% 10.00%
12021000 Groundnuts in shell, not roasted or otherwise cooked: In shell
Preferential tariff for SADC countries
0.00% 0.00%
12022000 Shelled groundnuts, whether or not broken (excl. roasted or otherwise cooked): Shelled, whether or not broken
MFN duties (Applied)
10.00% 10.00%
12022000 Shelled groundnuts, whether or not broken (excl. roasted or otherwise cooked): Shelled, whether or not broken
Preferential tariff for SADC countries
0.00% 0.00%
Source: ITC Market Access Map
Imports of groundnuts from SADC countries can enter South Africa free of duty due to the benefit of the SADC Free Trade Agreement while groundnuts imports from Uganda and other countries outside the

30
SADC region, such as Argentina, China, Japan and Hong Kong, are restricted by an import duty of 10%. Table 14 indicates the tariffs that are applied by various countries to the exports of groundnuts originating from South Africa in 2012. Table 14: Tariffs applied by leading markets to groundnuts originating from South Africa
Importers Selected product codes
Product description Trade regime description
Applied tariffs
Total ad valorem equivalent tariff (estimated)
Angola 1202 Ground-nuts, not roasted MFN duties (Applied)
5.00% 5.00%
Finland 1202 Ground-nuts, not roasted MFN duties (Applied)
0.00% 0.00%
Germany 1202 Ground-nuts, not roasted MFN duties (Applied)
0.00% 0.00%
Indonesia 1202 Ground-nuts, not roasted MFN duties (Applied)
5.00% 5.00%
Japan 120210010 Ground-nuts, not roasted or otherwise cooked, in shell, used as materials for oil extraction under the supervision of the Customs
MFN duties (Applied)
0.00% 0.00%
120210099 Ground-nuts, not roasted or otherwise cooked, in shell, excluding those used as materials for oil extraction under the supervision of the Customs, n.e.s.
MFN duties (Applied)
5870.11 $/Ton
603.79%
120220010 Ground-nuts, not roasted or otherwise cooked, shelled, used as materials for oil extraction under the supervision of the Customs
MFN duties (Applied)
0.00% 0.00%
120220099 Ground-nuts, not roasted or otherwise cooked, shelled, excluding those used as materials for oil extraction under the supervision of the Customs, n.e.s.
MFN duties (Applied)
5870.11 $/Ton
546.81%
Mozambique 12021000 Ground-nuts, not roasted or otherwise cooked, in shell
MFN duties (Applied)
20.00% 20.00%
12021000 Ground-nuts, not roasted or otherwise cooked, in shell
Preferential tariff for South Africa
0.00% 0.00%
Netherlands 1202101000 Groundnuts in shell for sowing MFN duties (Applied)
0.00% 0.00%
1202109000 Groundnuts in shell (excl. roasted or otherwise cooked and for sowing)
MFN duties (Applied)
0.00% 0.00%
1202200000 Shelled groundnuts, whether or not broken (excl. roasted or otherwise cooked)
MFN duties (Applied)
0.00% 0.00%
Norway 12021010 Ground-nuts, not roasted or otherwise cooked, whether or not shelled or broken: In shell For feed purpose
MFN duties (Applied)
627.31 $/Ton
55.00%
12021010 Ground-nuts, not roasted or otherwise cooked, whether or not shelled or broken: In shell For feed purpose
Preferential tariff for GSP countries
562.92 $/Ton
49.36%

31
Importers Selected product codes
Product description Trade regime description
Applied tariffs
Total ad valorem equivalent tariff (estimated)
12021010 Ground-nuts, not roasted or otherwise cooked, whether or not shelled or broken: In shell For feed purpose
Preferential tariff for SACU countries
562.92 $/Ton
49.36%
12021090 Ground-nuts, not roasted or otherwise cooked, whether or not shelled or broken: In shell Other
MFN duties (Applied)
0.00% 0.00%
12022010 Ground-nuts, not roasted or otherwise cooked, whether or not shelled or broken: Shelled, whether or not broken For feed purpose
MFN duties (Applied)
627.31 $/Ton
40.43%
12022010 Ground-nuts, not roasted or otherwise cooked, whether or not shelled or broken: Shelled, whether or not broken For feed purpose
Preferential tariff for GSP countries
562.92 $/Ton
36.28%
12022010 Ground-nuts, not roasted or otherwise cooked, whether or not shelled or broken: Shelled, whether or not broken For feed purpose
Preferential tariff for SACU countries
562.92 $/Ton
36.28%
Sudan 12021000 Groundnuts in shell, not roasted or otherwise cooked
General tariff 25.00% 25.00%
12022000 Shelled groundnuts, whether or not broken (excl. roasted or otherwise cooked)
General tariff 25.00% 25.00%
United Kingdom 1202101000 Groundnuts in shell for sowing MFN duties (Applied)
0.00% 0.00%
1202109000 Groundnuts in shell (excl. roasted or otherwise cooked and for sowing)
MFN duties (Applied)
0.00% 0.00%
1202200000 Shelled groundnuts, whether or not broken (excl. roasted or otherwise cooked)
MFN duties (Applied)
0.00% 0.00%
Source: ITC Market Access Map
Table 14 above shows that South Africa does not face any tariff barriers when exporting groundnuts to countries such as Finland, Germany, Netherlands, Mozambique and United Kingdom. This is mainly due to the fact that some of these countries do not charge any tariffs on imports of groundnuts originating from other countries. South Africa enjoys a preferential tariff of 0% ad valorem when exporting groundnuts to Mozambique due to the existence of SADC Free Trade Agreement. Norway, Sudan and Japan’s groundnuts industries are heavily protected by higher tariffs that are charged by these countries. Japan applies 603.79% Ad Valorem on imports of groundnuts originating from other countries while Norway applies tariffs ranging between 0% and 55.00 on imports of groundnuts originating from South Africa%. There is a preferential tariff of 36.28% in Norway on groundnuts imports originating from SACU countries.

32
3.2. Performance of the groundnut industry
Figure 30 illustrates the competitiveness of suppliers to South Africa for groundnuts imported in 2011.

33
Figure 30: Competitiveness of suppliers to South Africa for groundnuts in 2011
Source: ITC Trade Map

34
Figure 30 and Table 15 indicate that imports of groundnuts from China to South Africa increased significantly between the years 2007 and 2011. Groundnuts imports from China increased by about 16% in value between the years 2007 and 2011 while exports of the same product from China to the world declined by 4%. Groundnuts imports from Malawi increased by 11% in value while those from Mozambique and India declined by 61% and 55% respectively. Table 15: List of supplying markets for the groundnut imported by South Africa in 2011
Exporters Imported value in 2011 (thousand US$)
Share in South Africa’s imports (%)
Imported quantity (tons)
Unit value (US$/unit)
Imported growth in value between 2007 and 2011 (% p.a.)
Imported growth in quantity between 2007 and 2011 (% p.a.)
Imported growth in value between 2010 and 2011 (% p.a.)
World 10 152 100 8 280 1 226 -4 -20 329 Malawi 6 443 63.5 5 521 1 167 11 1 10 080 China 1 442 14 745 1 909 16 0 -10 Mozambique 917 9 952 963 -61 -43 - Zimbabwe 862 8.5 865 997 - - - South Africa 284 2.8 46 6 174 - - 255 India 122 1.2 77 1 584 -55 -44 - Tanzania 25 0.7 48 1 396 - - - Japan 25 0.2 18 1 389 - 7 -49
Source: ITC Trade Map
Table 15 and Figure 31 show that Malawi is the biggest supplier of groundnuts imported by South Africa in 2011. It is clear from the figure and the table that Malawi accounted for about 63.5% of the total groundnuts imported by South Africa during the year 2011. The other major exporters of groundnuts to South Africa are China and Mozambique which account for 14% and 9% of South Africa’s total groundnuts imports respectively. It is also notable that South Africa is reflected as one of the major suppliers of groundnuts to itself and this is a reflection of re-importation of groundnuts by South Africa.

35
Figure 31: Prospects for diversification of suppliers for groundnuts imported by South Africa in 2011
Source: ITC Trade Map

36
Table 16: List of Importing markets for the groundnut exported by South Africa in 2011
Importers Exported value in 2011 (thousand US$)
Share in South Africa’s exports (%)
Exported quantity 2011 (tons)
Unit value (US$/ton)
Exported growth in value between 2007 and 2011 (% p.a.)
Exported growth in quantity between 2007 and 2011 (% p.a.)
Exported growth in value between 2010 and 2011 (% p.a.)
World 25,543 100 13 800 1 851 25 16 -20
Japan 9,221 36.1 4 742 1 945 6 -2 11 Netherlands 9,148 35.8 5 326 1 718 66 51 -22 Mozambique 1,143 4.5 798 1 432 12 -2 55 USA 1,102 4.3 378 2 915 193 109 4 138 Hong Kong 1,024 4 181 5 657 - - - Norway 940 3.7 448 2 098 20 7 51 New Zealand 798 3.1 324 2 463 9 -2 470 Germany 738 2.9 733 1 007 12 24 -42 United Kingdom 688 2.7 531 1 296 24 22 -70 Finland 559 2.2 234 2 389 - -11 45
Source: ITC Trade Map
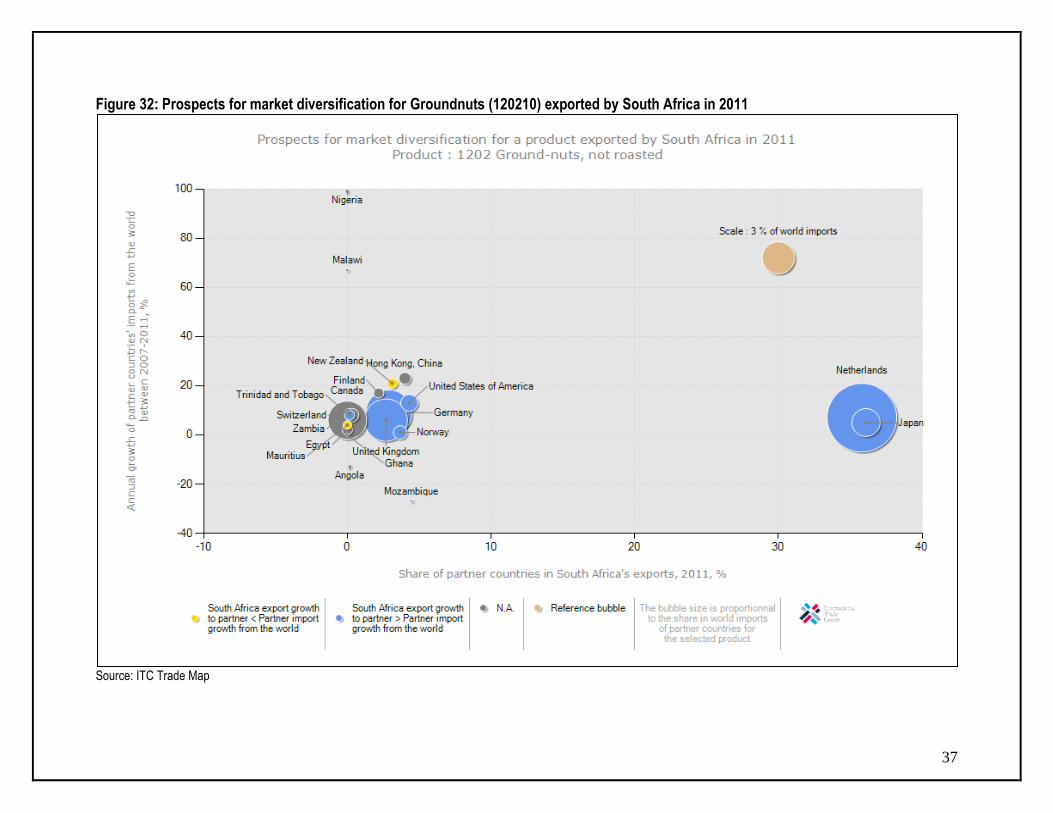
It is clear from Table 16 and Figure 32 that the major export destinations for ground-nut originating from South Africa are Japan, Netherlands, Mozambique, USA and Hong Kong with the greatest volumes being exported to Japan and Netherlands. In 2011, Japan alone absorbed 36.1% of South Africa’s total groundnut exports followed Netherlands and Mozambique with 35.8% and 4.5% respectively. South Africa’s value of groundnuts exports to the world increased by 25% in value terms between the years 2007 and 2011. The figure and the table further show that, between the years 2010-2011 the value of the South African groundnut exports to the world declined by 20% while those towards Mozambique increased by 55% over the same period. Figure 32 further shows that South Africa’s groundnuts exports to countries such as Netherlands, Japan, United Kingdom, USA, Germany and Norway have grown faster than these countries’ imports from the rest of the world. The growth rate of South Africa’s groundnut exports to countries such as New Zealand and Mauritius is less than the growth in these countries’ imports from the rest of the world. The figure further shows that if South Africa wishes to expand its ground-nut export base, the prospective markets exist in countries such as Canada, Egypt and Nigeria.
37
Figure 32: Prospects for market diversification for Groundnuts (120210) exported by South Africa in 2011
Source: ITC Trade Map

38
4. ACKNOWLEDGEMENTS The following organizations are acknowledged: Statistics and Economic Analysis: Department of Agriculture, Forestry and Fisheries Tel: (012) 319 8453 Fax: (012) 319 8031 www.daff.gov.za Grain South Africa www.grainsa.co.za African Groundnut Council www.afgroundnutcouncil.org Quantec Easydata P.O.Box 35466 Menlo Park Pretoria 0102 Tel: 012 361 5154 Fax: 012 348 5874 Website: www.quantec.co.za ITC Trade Map Website: http://www.trademap.org ITC Market Access Map www.macmap.org Disclaimer: This document and its contents have been compiled by the Department of Agriculture, Forestry and Fisheries for the purpose of detailing the groundnut industry. Anyone who uses the information as contained in this document does so at his/her own risk. The views expressed in this document are those of the Department with regard to the industry, unless otherwise stated. The Department therefore accepts no liability that can be incurred resulting from the use of this information.