GROUNDNUT - Application serverwebapps.daff.gov.za/AmisAdmin/upload/Groundnut market value...
38
GROUNDNUT MARKET VALUE CHAIN PROFILE 2010-2011 GROUNDNUT
Transcript of GROUNDNUT - Application serverwebapps.daff.gov.za/AmisAdmin/upload/Groundnut market value...

GROUNDNUTMARKET VALUE CHAIN PROFILE 2010-2011
GROUNDNUT

1. DESCRIPTION OF THE INDUSTRY
Groundnuts contribute approximately 1, 1% to the gross value of field crops, and the average annual gross value of groundnuts for the previous five years up to 2005/06 season amounts to approximately R 332 million. Groundnuts can be consumed in an unprocessed state, but they also serve in the economy as raw materials for the manufacturing of various products. These include, but not limited to, the manufacturing of such products as peanuts, peanut butter, sweets and cooking oil. The production of groundnuts is highly affected by the costs of production inputs as well as the demand for groundnuts. The contribution of the groundnut industry to the gross value of agricultural production is summarized in Figure 1.
Source: Agricultural Statistics
The contribution of the industry to the gross value of agricultural production as shown in Figure 1 demonstrates an increase that occurred from the 1999/00 to 2000/01 production years mainly as a result of an increase in plantings which led to higher production during that period. In the 2000/2001 production season the industry’s contribution to the gross value of agricultural production was found to be higher which was due to the highest production which occurred during the season while the prices were still in a favorable position for the producers.
Between 2002 and 2008, the contribution of the groundnut industry to the gross value of agricultural production was characterized by fluctuations until increases were experienced from 2006 onwards. The gross value of production has reached the highest level during 2008/09 mainly as a result of relatively higher levels of production coupled with higher producer prices that were experienced during the same period.
1.1 PRODUCINg AREAS
Groundnuts are mainly produced in the north-western regions of South Africa, namely the western and north-western Free State (33%), Northern Cape (31%) and the North West Province (28%). Groundnuts are also produced in Limpopo, KwaZulu-Natal and Mpumalanga Provinces although the production is lower in these provinces. The contribution of various provinces to South Africa’s total groundnuts production is depicted in Figure 2.
102 GROUNDNUT MARKET VALUE CHAIN PROFILE 2010-2011

Source: Agricultural Statistics
Table 1: Groundnut production by provinces
PROVINCEProduction
(tons) 2004/05
Production (tons)
2005/06
Production (tons)
2006/07
Production (tons)
2007/08
Production (tons)
2008/09
Northern Cape 18 450 26 100 21 700 21 500 31 000
Free State 27 500 26 000 21 000 35 700 33 690
Kwazulu-Natal 250 0 30 80 0
Limpopo 2 150 2 930 2 200 5 810 6 750
North West 14880 18 950 13 000 25 650 28 000
Gauteng 50 20 50 60 60
Source: Agricultural Statistics
Table 1 indicates that during the past four seasons the Northern Cape Province has been the major producer of groundnuts even though groundnut production in this province has experienced considerable decline during this period. However, Free State and North West Provinces increased their production significantly during 2007/08 and surpassed Northern Cape’s production volumes. Notably, groundnut production in all the major producing regions, except in Northern Cape, has undergone a drastic increase during 2007/08 season, leading to a slight increase in South Africa’s total groundnuts production. During 2008/09 season groundnuts production from provinces such as Northern Cape, Free State, Limpopo and North West increased while production remained stable in Gauteng province during that period.
103GROUNDNUT MARKET VALUE CHAIN PROFILE 2010-2011
1.2 PRODUCTION TRENDS
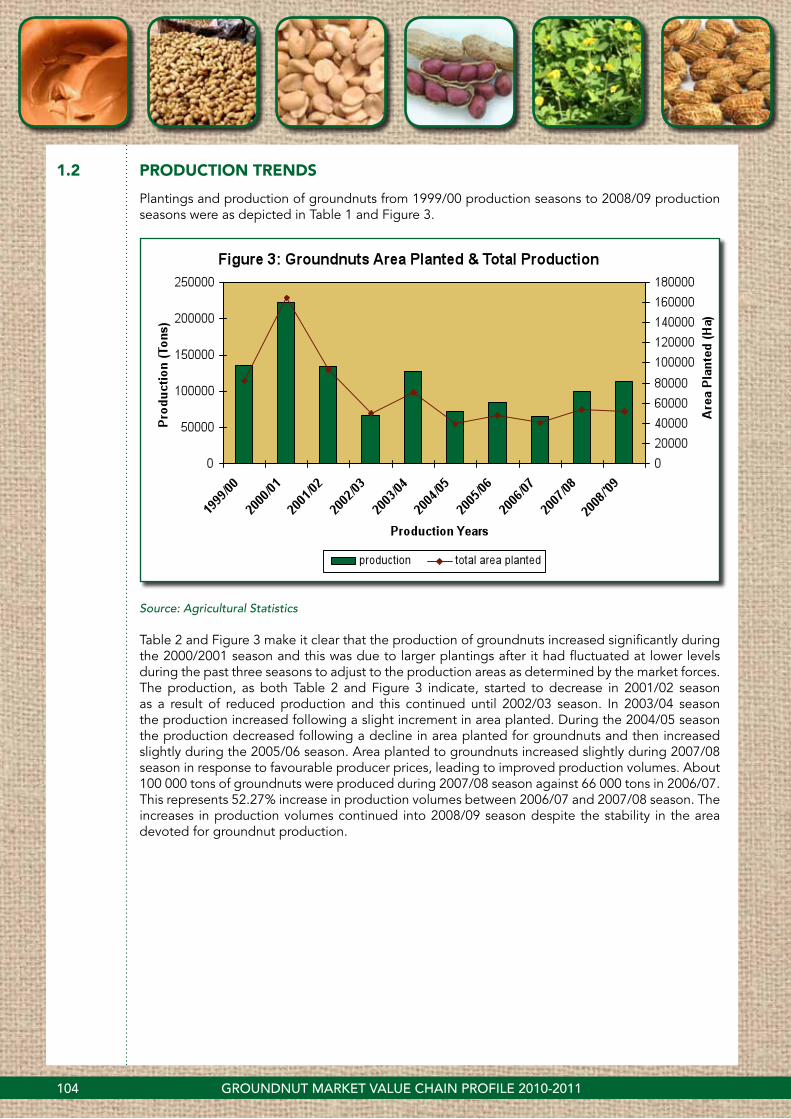
Plantings and production of groundnuts from 1999/00 production seasons to 2008/09 production seasons were as depicted in Table 1 and Figure 3.
Source: Agricultural Statistics
Table 2 and Figure 3 make it clear that the production of groundnuts increased significantly during the 2000/2001 season and this was due to larger plantings after it had fluctuated at lower levels during the past three seasons to adjust to the production areas as determined by the market forces. The production, as both Table 2 and Figure 3 indicate, started to decrease in 2001/02 season as a result of reduced production and this continued until 2002/03 season. In 2003/04 season the production increased following a slight increment in area planted. During the 2004/05 season the production decreased following a decline in area planted for groundnuts and then increased slightly during the 2005/06 season. Area planted to groundnuts increased slightly during 2007/08 season in response to favourable producer prices, leading to improved production volumes. About 100 000 tons of groundnuts were produced during 2007/08 season against 66 000 tons in 2006/07. This represents 52.27% increase in production volumes between 2006/07 and 2007/08 season. The increases in production volumes continued into 2008/09 season despite the stability in the area devoted for groundnut production.
104 GROUNDNUT MARKET VALUE CHAIN PROFILE 2010-2011
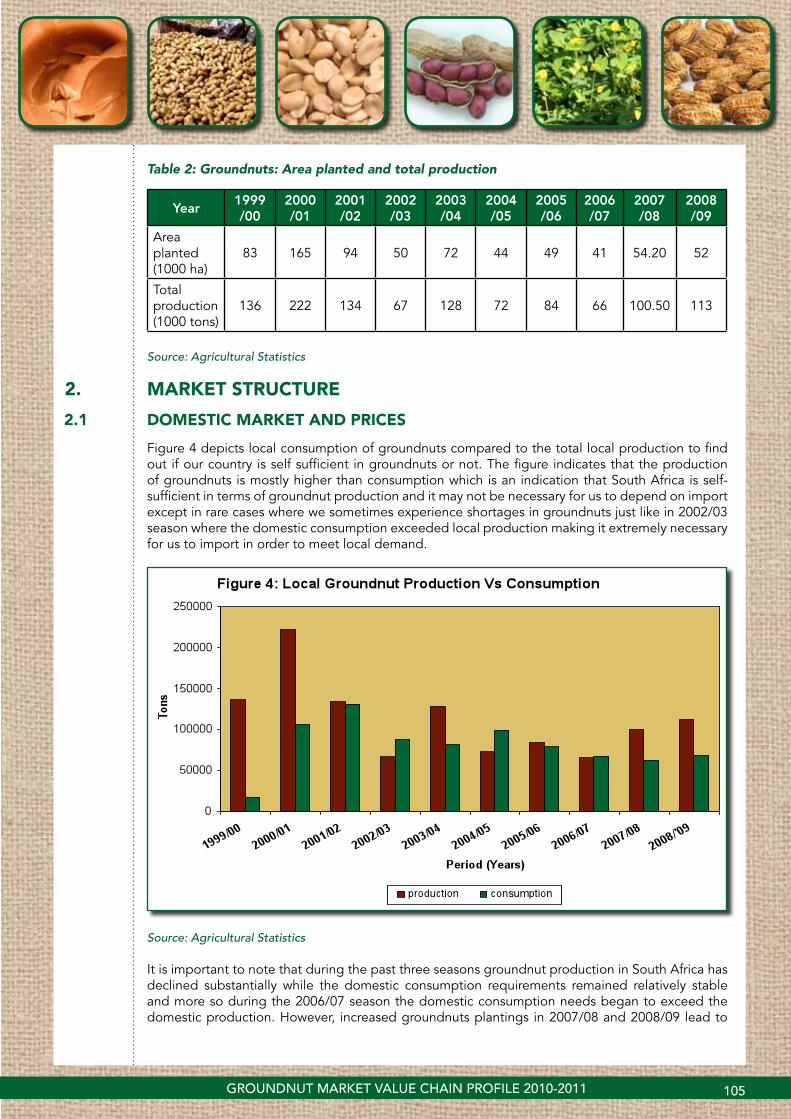
Table 2: Groundnuts: Area planted and total production
Year1999/00
2000/01
2001/02
2002/03
2003/04
2004/05
2005/06
2006/07
2007/08
2008/09
Area planted (1000 ha)
83 165 94 50 72 44 49 41 54.20 52
Total production (1000 tons)
136 222 134 67 128 72 84 66 100.50 113
Source: Agricultural Statistics
2. MARKET STRUCTURE
2.1 DOMESTIC MARKET AND PRICES
Figure 4 depicts local consumption of groundnuts compared to the total local production to find out if our country is self sufficient in groundnuts or not. The figure indicates that the production of groundnuts is mostly higher than consumption which is an indication that South Africa is self-sufficient in terms of groundnut production and it may not be necessary for us to depend on import except in rare cases where we sometimes experience shortages in groundnuts just like in 2002/03 season where the domestic consumption exceeded local production making it extremely necessary for us to import in order to meet local demand.
Source: Agricultural Statistics
It is important to note that during the past three seasons groundnut production in South Africa has declined substantially while the domestic consumption requirements remained relatively stable and more so during the 2006/07 season the domestic consumption needs began to exceed the domestic production. However, increased groundnuts plantings in 2007/08 and 2008/09 lead to
105GROUNDNUT MARKET VALUE CHAIN PROFILE 2010-2011

a situation where groundnuts production volumes increased to an extent of surpassing the local consumption needs.
The average producer prices of groundnuts from 1998/99 to 2008/09 are as indicated in Table 3 and Figure 5.
Table 3: Groundnuts: Producer prices
Season 1998/99
1999/00
2000/01
2001/02
2002/03
2003/04
2004/05
2005/06
2006/07
2007/08
2008/09
R/Ton
Producer Prices
1538 2460 2045 2426 5050 2870 2504 2849 5868 6122 6353
Source: Agricultural Statistics
Source: Agricultural Statistics
Table 3 and Figure 5 explain that the producer prices of groundnuts were fairly stable from 1998/99 to 2001/02. And the price went to as high as R5000/ton in 2002/03 season which can be highly ascribed to low levels of production during that season, which resulted in low levels of local supply. Producer prices declined to levels below R3 000/ton between 2003 and 2006 and increased substantially to a level above R5 000/ton during the 2006/07 season primarily due to the local demand exceeding the domestic production. The producer price increased further during 2007/08 to the levels beyond R6000/ton, which represents 4.33% increase from 2006/07 season’s prices. The price increases continued into the 2008/09 season.
106 GROUNDNUT MARKET VALUE CHAIN PROFILE 2010-2011
Source: Agricultural Statistics
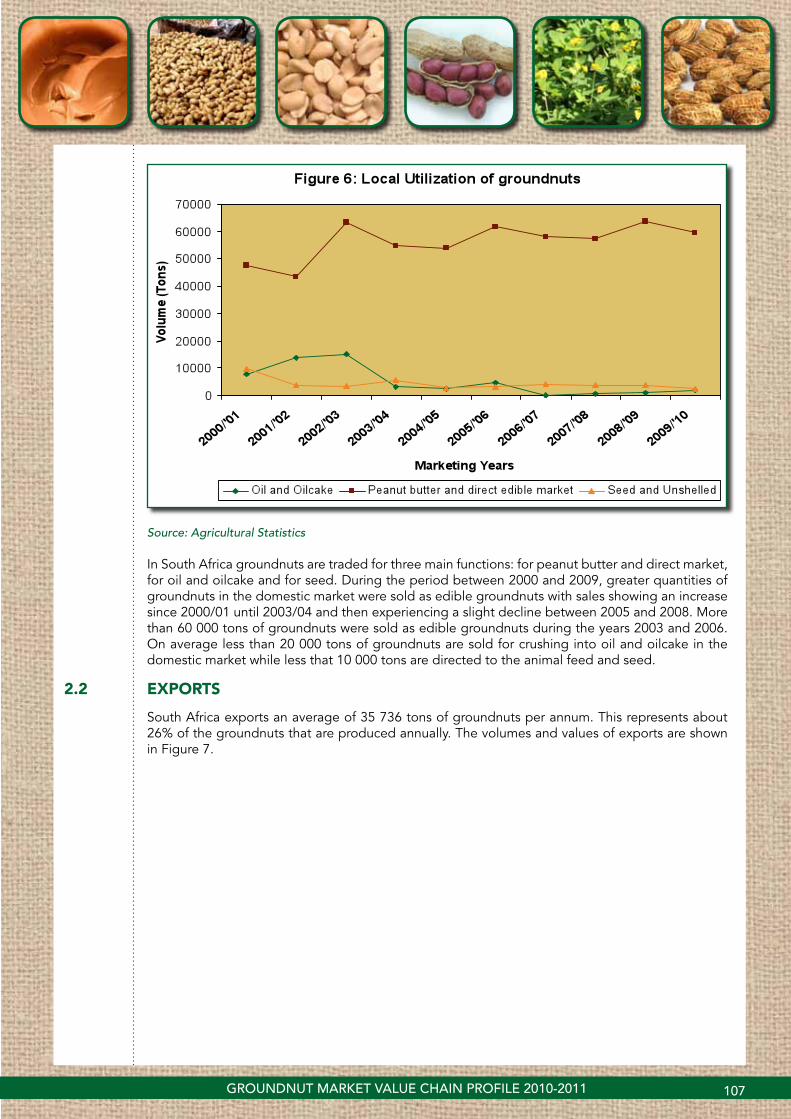
In South Africa groundnuts are traded for three main functions: for peanut butter and direct market, for oil and oilcake and for seed. During the period between 2000 and 2009, greater quantities of groundnuts in the domestic market were sold as edible groundnuts with sales showing an increase since 2000/01 until 2003/04 and then experiencing a slight decline between 2005 and 2008. More than 60 000 tons of groundnuts were sold as edible groundnuts during the years 2003 and 2006. On average less than 20 000 tons of groundnuts are sold for crushing into oil and oilcake in the domestic market while less that 10 000 tons are directed to the animal feed and seed.
2.2 ExPORTS
South Africa exports an average of 35 736 tons of groundnuts per annum. This represents about 26% of the groundnuts that are produced annually. The volumes and values of exports are shown in Figure 7.
107GROUNDNUT MARKET VALUE CHAIN PROFILE 2010-2011

Source: Agricultural Statistics and Quantec Easyda
Figure 7 indicates a continuous increase in exports of groundnuts in both volume and value terms from 2000 until a peak was reached in 2002. The year 2002 was the best year ever (looking at the time under the examination) in groundnut exportation. More than 20 000 tons were exported during that year and this yielded the export earnings amounting to approximately 250 million rands. The export values decreased significantly as a result of a drastic decline in export volumes which went down to as low as 8 000 tons in 2005 and continued to decline substantially until 2007. An increase in both volume and value of groundnut exports was experienced during the year 2008, followed by a decline in 2009.
South Africa imports its groundnuts from countries such as China, Malawi, Malaysia and India as shown in Figure 8.
Source: ITC Trade Map
108 GROUNDNUT MARKET VALUE CHAIN PROFILE 2010-2011
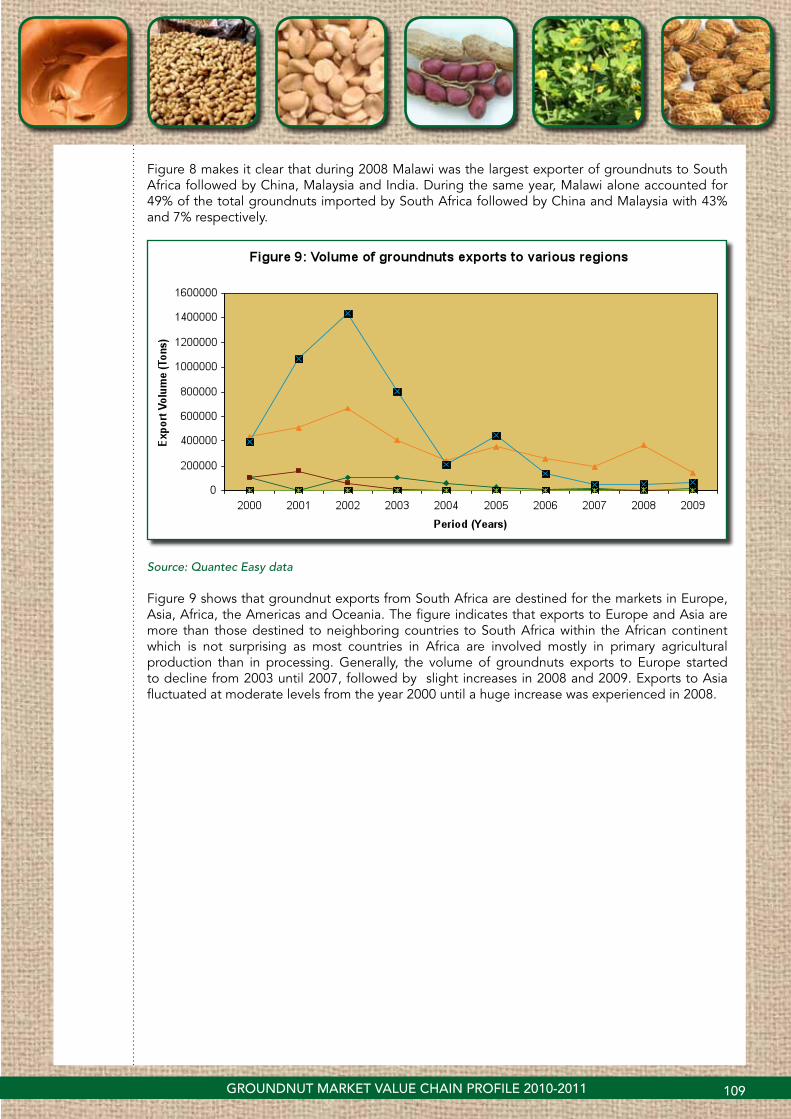
Figure 8 makes it clear that during 2008 Malawi was the largest exporter of groundnuts to South Africa followed by China, Malaysia and India. During the same year, Malawi alone accounted for 49% of the total groundnuts imported by South Africa followed by China and Malaysia with 43% and 7% respectively.
Source: Quantec Easy data
Figure 9 shows that groundnut exports from South Africa are destined for the markets in Europe, Asia, Africa, the Americas and Oceania. The figure indicates that exports to Europe and Asia are more than those destined to neighboring countries to South Africa within the African continent which is not surprising as most countries in Africa are involved mostly in primary agricultural production than in processing. Generally, the volume of groundnuts exports to Europe started to decline from 2003 until 2007, followed by slight increases in 2008 and 2009. Exports to Asia fluctuated at moderate levels from the year 2000 until a huge increase was experienced in 2008.
109GROUNDNUT MARKET VALUE CHAIN PROFILE 2010-2011

Source: Quantec Easy data
In the European Union, Netherlands is the main market for South African groundnut exports followed by Germany and the United Kingdom. The exports to United Kingdom remained at lower levels from the year 2000 to 2007 and increased marginally in 2008. Furthermore, it can also be inferred from Figure 10 that the volume of groundnut exports originating from South Africa to the EU has also started to decline as from the 2003 season, so RSA is slowly losing market share for groundnuts in the EU.
Source: Quantec Easy data
Figure 11 indicates that in Asia, Japan is the main export market for groundnuts emanating from South Africa. Groundnut exports from South Africa to China and Taiwan were minimal over the
110 GROUNDNUT MARKET VALUE CHAIN PROFILE 2010-2011

period under review mainly due to the fact that China has a robust groundnut production base. However, as mentioned earlier on it is important to note the steep decline in groundnut exports to Eastern Asia between 2005 and 2007, which was followed by a huge increase in export volumes from South Africa to Japan in 2008. The volume of groundnuts exports to Japan declined dramatically during the year 2009. On the African continent South African groundnut exports are destined mainly to the SADC region.
Source: Quantec Easy data
Figure 12 indicates that groundnut exports from South Africa to the SADC region are mainly destined to Mozambique, Zimbabwe, Angola, and Zambia. The volume of groundnut exports to Zambia has been consistently very low during the period under review while those to Zimbabwe have fluctuated tremendously and reached the lowest levels in 2007 and 2008, followed by a slight increase in 2009. Generally groundnuts exports from South Africa to the SADC region have been declining from 2004 until 2009.
111GROUNDNUT MARKET VALUE CHAIN PROFILE 2010-2011

Source: Quantec Easy data
Figure 13 indicates that groundnuts are mainly exported from Gauteng, North West and KwaZulu-Natal Provinces. It is not surprising to witness North West Province recording such high export values because it is amongst the largest producers of groundnuts in the country but Gauteng and KwaZulu-Natal Provinces’ capacity to export is brought about by the availability of suitable infrastructure for exportation in these Provinces. Gauteng is exporting much because of favorable agro-logistics, the presence of a large number of exporters in the province and the role of the Randfontein grain market while KwaZulu-Natal’s export capability is enhanced by the presence of Durban harbor through which most commodities are shipped. Exports from Limpopo, Free State and Eastern Cape Provinces were very low over the period under analysis. Despite Eastern Cape being one of South Africa’s main export hubs, groundnuts exports from this Province remained very low mainly because the harbor facilities that are available in Port Elizabeth are mainly used for trading of automotive parts rather than agricultural products.
112 GROUNDNUT MARKET VALUE CHAIN PROFILE 2010-2011

Source: Quantec Easy data
Figure 14 indicates that groundnut exports from the Gauteng Province are mainly from three districts, namely City of Tshwane, City of Johannesburg and Ekurhuleni district Municipality. On average the West Rand District is the one that accounted for the highest export values from 2000 to 2002 followed by the City of Johannesburg. From 2003 until 2009 the City of Tshwane commanded the greatest share in groundnut exports while export values from the three other districts experienced a decrease to levels below 5 million rand per annum. In 2009, the value of groundnuts exports from City of Tshwane declined to about 20 million rand.
Source: Quantec Easy data
113GROUNDNUT MARKET VALUE CHAIN PROFILE 2010-2011

Figure 15 indicates that in general the values of groundnut exports from the North West province experienced a substantial increase from 2000 with a peak attained during the 2002 season. From 2003 exports of groundnuts declined substantially, reaching levels far below 15 million rands per annum with the greatest values from the Bojanala Platinum district. A general increase in the value of groundnuts exports from North West Province was experienced from the year 2004 until 2008. Values of groundnut exports from KwaZulu-Natal Province are shown in Figure 16.The groundnut exports from all districts in the North West province declined dramatically between 2003 and 2006. There were no exports of groundnuts from North West province between 2006 and 2009.
Source: Quantec Easy data
Figure 16 indicates that in KwaZulu-Natal eThekwini municipality is the main exporter of groundnuts. This is not surprising because of availability of Durban harbor in the district, which serves as an overpass for the exports of numerous commodities. Of importance to note is that the values of groundnut exports through the eThekwini district has also experienced a considerable decrease between 2005 and 2007 while groundnut export values from the rest of the other districts were close to zero. An increase in export values from aThekwini and Umgungundlovu districts were experienced during the year 2008, basically due to a slight increase that was experienced in production volumes in the country at that time. This was followed by a decline during the year 2009. Groundnuts exports from the Western Cape Province are shown in Figure 17.
114 GROUNDNUT MARKET VALUE CHAIN PROFILE 2010-2011
Source: Quantec Easy data
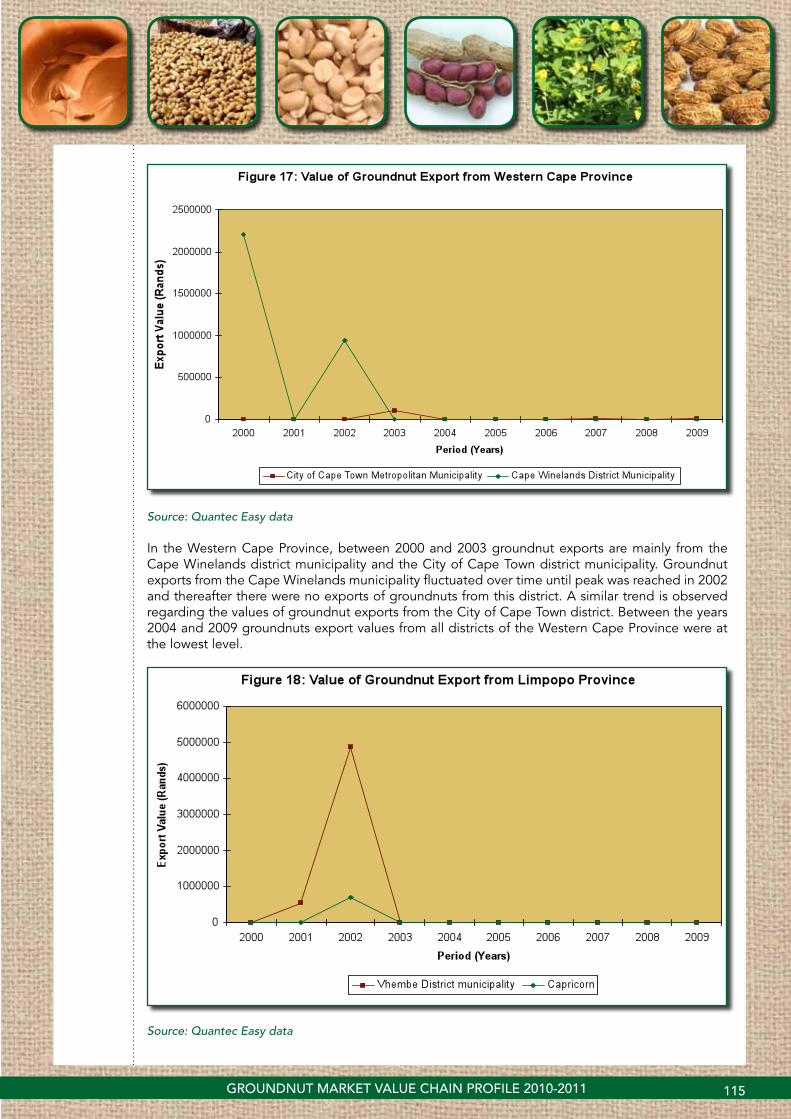
In the Western Cape Province, between 2000 and 2003 groundnut exports are mainly from the Cape Winelands district municipality and the City of Cape Town district municipality. Groundnut exports from the Cape Winelands municipality fluctuated over time until peak was reached in 2002 and thereafter there were no exports of groundnuts from this district. A similar trend is observed regarding the values of groundnut exports from the City of Cape Town district. Between the years 2004 and 2009 groundnuts export values from all districts of the Western Cape Province were at the lowest level.
Source: Quantec Easy data
115GROUNDNUT MARKET VALUE CHAIN PROFILE 2010-2011

Figure 18 makes it clear that in Limpopo Province Vhembe and Capricorn districts were the only exporter of groundnuts. Vhembe district only started to export groundnuts in 2001 with peak experienced during the year 2002. Capricorn District Municipality only participated in groundnuts exports in 2002. Prior to 2002 only fractional export values were recorded from Vhembe district and during the year 2002 the peak was reached and thereafter a rapid decline was experienced in 2003. No groundnuts were exported from Limpopo Province since 2003 until the year 2009.
Source: Quantec Easy data
Ehlanzeni and Ngangala are the only districts in Mpumalanga that exported groundnuts in the period under analysis. Groundnut export values from Mpumalanga province declined in 2003 and then disappeared completely from 2004 to 2009. Figure 20 presents groundnut export values from various districts of Free-state Province.
116 GROUNDNUT MARKET VALUE CHAIN PROFILE 2010-2011
Source: Quantec Easy data
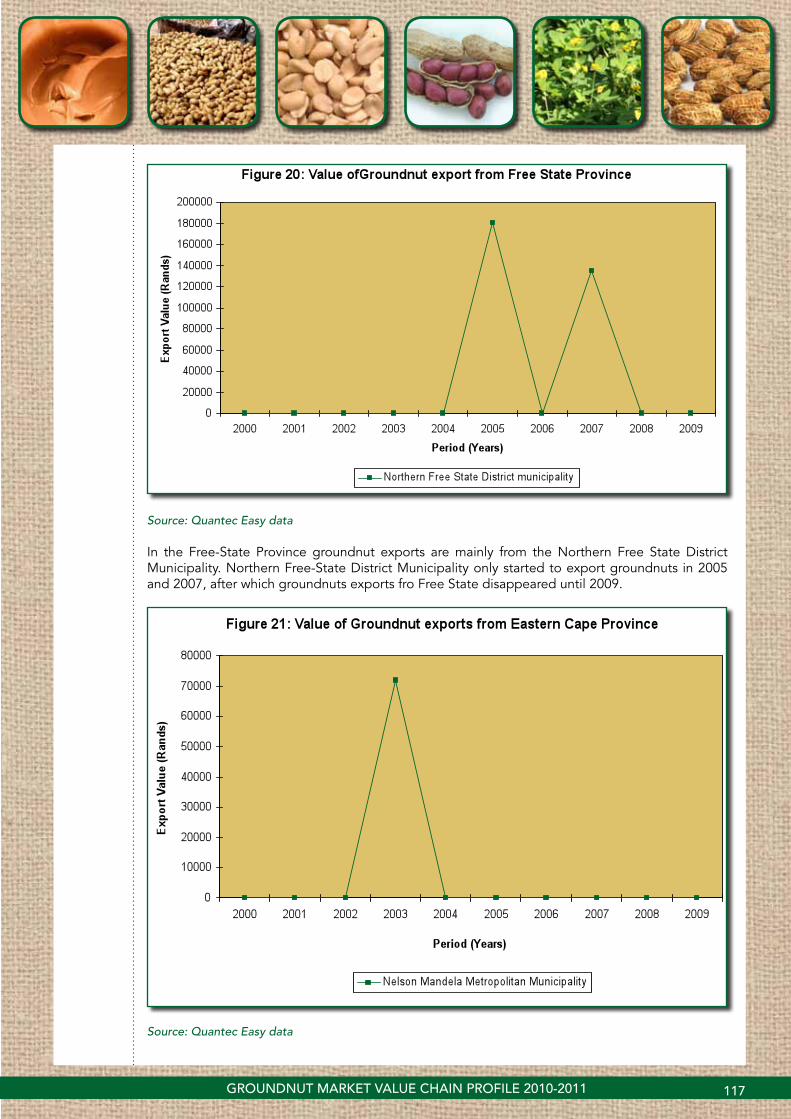
In the Free-State Province groundnut exports are mainly from the Northern Free State District Municipality. Northern Free-State District Municipality only started to export groundnuts in 2005 and 2007, after which groundnuts exports fro Free State disappeared until 2009.
Source: Quantec Easy data
117GROUNDNUT MARKET VALUE CHAIN PROFILE 2010-2011

As indicated in Figure 21, in the Eastern Cape Province groundnut exports are from Nelson Mandela district only. More export values from Nelson Mandela district were recorded in 2003 while there were no groundnut exports between 2004 and 2009. Eastern Cape Province is not one of the major producers of groundnuts and it is for this reason, amongst others, that there were no exports of groundnuts from the Province for the most part of the period under analysis.
Source: Quantec Easy data
Figure 22 indicates that Frances Baard District Municipality is the only exporter of groundnuts in Northern Cape and it only started exporting from 2002 with a peak reached in 2008. The exports experienced fluctuations between 2004 and 2007 at levels below 10 million rands per annum. A massive increase in exports from the Northern Cape Province was experienced during the year 2008 to the levels above 20 million rands, followed by a slight decline in 2009.
Table 3: Share of Provincial groundnut exports to the total South African groundnuts exports (%)
Year 2000 2001 2002 2003 2004 2005 2006 2007 2008 2009
Province
Western Cape 2.91 0.16 3.43 1.87 0.00 0.00 0.02 0.03 0.00 0.01
Northern Cape 0.00 0.06 1.65 11.74 7.60 8.30 8.82 11.76 11.61 14.21
Free State 0.00 0.00 0.00 0.00 0.49 0.19 0.00 0.19 0.00 0.00
Kwazulu-Natal 32.44 15.27 8.77 16.07 36.69 28.49 29.50 16.12 0.00 8.09
North West 21.24 34.88 41.36 33.48 20.95 22.76 23.44 32.58 0.00 0.00
Gauteng 43.41 49.34 35.84 32.73 34.23 40.25 38.22 39.33 63.60 77.69
Mpumalanga 0.00 0.01 6.95 4.11 0.03 0.00 0.00 0.00 0.00 0.00
Limpopo 0.00 0.27 1.99 0.00 0.00 0.00 0.00 0.00 0.00 0.00
Source: Calculated from Quantec Easy data
118 GROUNDNUT MARKET VALUE CHAIN PROFILE 2010-2011
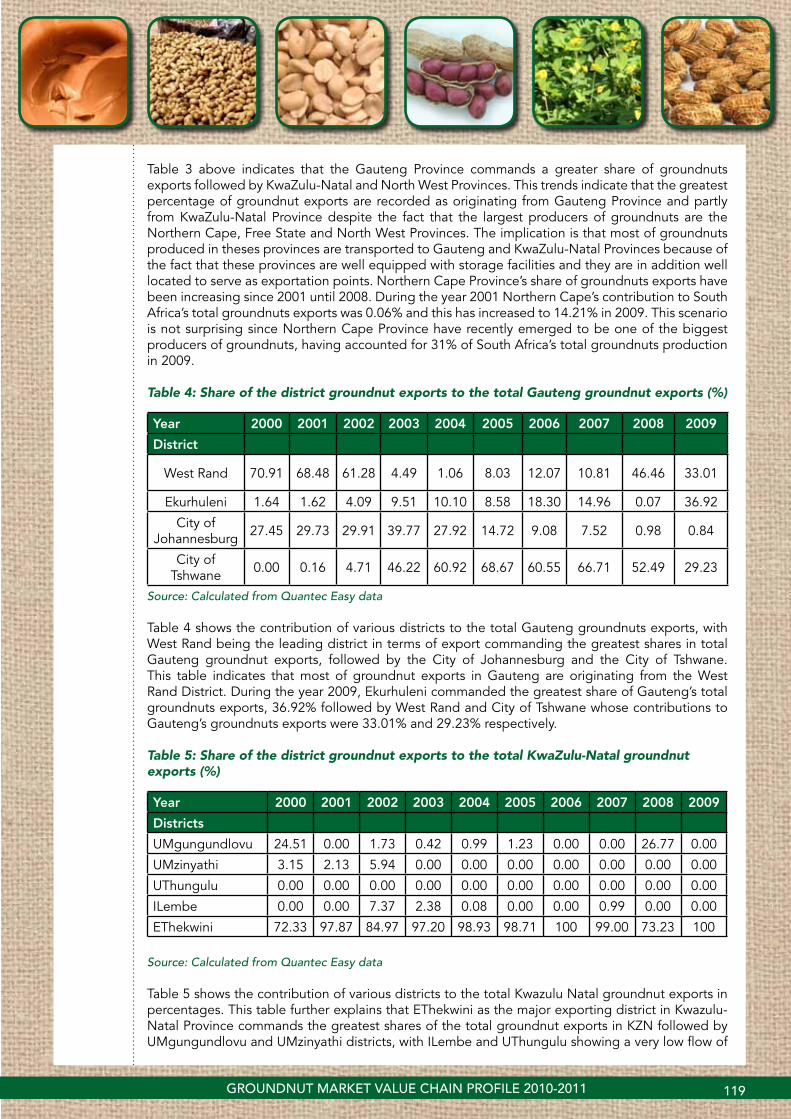
Table 3 above indicates that the Gauteng Province commands a greater share of groundnuts exports followed by KwaZulu-Natal and North West Provinces. This trends indicate that the greatest percentage of groundnut exports are recorded as originating from Gauteng Province and partly from KwaZulu-Natal Province despite the fact that the largest producers of groundnuts are the Northern Cape, Free State and North West Provinces. The implication is that most of groundnuts produced in theses provinces are transported to Gauteng and KwaZulu-Natal Provinces because of the fact that these provinces are well equipped with storage facilities and they are in addition well located to serve as exportation points. Northern Cape Province’s share of groundnuts exports have been increasing since 2001 until 2008. During the year 2001 Northern Cape’s contribution to South Africa’s total groundnuts exports was 0.06% and this has increased to 14.21% in 2009. This scenario is not surprising since Northern Cape Province have recently emerged to be one of the biggest producers of groundnuts, having accounted for 31% of South Africa’s total groundnuts production in 2009.
Table 4: Share of the district groundnut exports to the total Gauteng groundnut exports (%)
Year 2000 2001 2002 2003 2004 2005 2006 2007 2008 2009
District
West Rand 70.91 68.48 61.28 4.49 1.06 8.03 12.07 10.81 46.46 33.01
Ekurhuleni 1.64 1.62 4.09 9.51 10.10 8.58 18.30 14.96 0.07 36.92
City of Johannesburg 27.45 29.73 29.91 39.77 27.92 14.72 9.08 7.52 0.98 0.84
City of Tshwane 0.00 0.16 4.71 46.22 60.92 68.67 60.55 66.71 52.49 29.23
Source: Calculated from Quantec Easy data
Table 4 shows the contribution of various districts to the total Gauteng groundnuts exports, with West Rand being the leading district in terms of export commanding the greatest shares in total Gauteng groundnut exports, followed by the City of Johannesburg and the City of Tshwane. This table indicates that most of groundnut exports in Gauteng are originating from the West Rand District. During the year 2009, Ekurhuleni commanded the greatest share of Gauteng’s total groundnuts exports, 36.92% followed by West Rand and City of Tshwane whose contributions to Gauteng’s groundnuts exports were 33.01% and 29.23% respectively.
Table 5: Share of the district groundnut exports to the total KwaZulu-Natal groundnut exports (%)
Year 2000 2001 2002 2003 2004 2005 2006 2007 2008 2009
Districts
UMgungundlovu 24.51 0.00 1.73 0.42 0.99 1.23 0.00 0.00 26.77 0.00
UMzinyathi 3.15 2.13 5.94 0.00 0.00 0.00 0.00 0.00 0.00 0.00
UThungulu 0.00 0.00 0.00 0.00 0.00 0.00 0.00 0.00 0.00 0.00
ILembe 0.00 0.00 7.37 2.38 0.08 0.00 0.00 0.99 0.00 0.00
EThekwini 72.33 97.87 84.97 97.20 98.93 98.71 100 99.00 73.23 100
Source: Calculated from Quantec Easy data
Table 5 shows the contribution of various districts to the total Kwazulu Natal groundnut exports in percentages. This table further explains that EThekwini as the major exporting district in Kwazulu-Natal Province commands the greatest shares of the total groundnut exports in KZN followed by UMgungundlovu and UMzinyathi districts, with ILembe and UThungulu showing a very low flow of
119GROUNDNUT MARKET VALUE CHAIN PROFILE 2010-2011

exports in the districts. EThekwini’s contribution to KwaZulu-Natal’s total groundnuts exports was above 80% for the most part of the period under review until a decline was experienced in 2008 to 73.23%. UMgungundlovu’s contribution increased marginally from the levels below 20% to register 26.77% of the total KwaZulu-Natal’s groundnuts exports.
Table 6: Share of the district groundnut exports to the total North West groundnut exports (%)
Year 2000 2001 2002 2003 2004 2005 2006 2007 2008 2009
Districts
Bojanala Platinum 31.46 49.24 32.72 28.23 76.07 70.55 100 100 100 0.00
Ngaka-Modiri Molema
0.00 0.00 12.61 22.42 0.00 0.00 0.00 0.00 0.00 0.00
Ruth Mompati 0.00 27.77 30.90 20.67 0.00 0.00 0.00 0.00 0.00 0.00
Kenneth Kaunda 68.54 22.98 23.77 28.68 23.93 29.45 0.00 0.00 0.00 0.00
Source: Calculated from Quantec Easy data
Table 6 indicates that from the periods 2000 to 2008, groundnut exports in the North West Province were mainly originating from Bojanala-Platinum District, Ngaka Modiri-Molema District, Kenneth Kaunda District and Ruth Mompati District. The table shows that Bojanala District command the greatest share of the total North West groundnut export followed by the Southern District and Central District in that order. During the year 2008, Bojanala District Municipality alone accounted for 100% of the total North West groundnuts exports, while exports from other districts diminished. There were no exports of groundnuts from North West Province during the year 2009.
Table 7: Share of the district groundnut exports to the total Free State groundnut exports (%)
Year 2000 2001 2002 2003 2004 2005 2006 2007 2008 2009
Districts
Northern Free State 0.00 0.00 0.00 0.00 100 100 0.00 100 0.00 0.00
Source: Calculated from Quantec Easy data
Table 7 indicates that in the Free State Province groundnuts exports are mainly from the Northern Free State District Municipality and that groundnuts exportation in the province is not consistent since there were no exports from 2000 to 2003. The Northern Free State District Municipality commanded the greatest share during the periods 2004 – 2005, and again in 2007. Table 7 also indicates that there were no exports of groundnuts from the Free State Province in 2009.
Table 8: Share of the district groundnut exports to the total Mpumalanga groundnut exports (%)
Year 2000 2001 2002 2003 2004 2005 2006 2007 2008 2009
Districts
Ehlanzeni 0.00 100 100 100 100 0.00 0.00 0.00 0.00 0.00
Source: Calculated from Quantec Easy data
120 GROUNDNUT MARKET VALUE CHAIN PROFILE 2010-2011

In the Mpumalanga Province, the Ehlanzeni District commanded the greatest shares of the total Mpumalanga groundnut exports as shown by Table 8. The Ehlanzeni district is the major exporter of groundnuts in Mpumalanga Province. The maximum performance in terms of groundnut exports was shown by the district between the periods of 2001-2004, when it commanded the highest shares, which recently decreased to zero between the years 2005 to 2009.
Table 9: Share of the district groundnut exports to the total Limpopo groundnut exports (%)
Year 2000 2001 2002 2003 2004 2005 2006 2007 2008 2009
Districts
Vhembe 0.00 100 87.00 0.00 0.00 0.00 0.00 0.00 0.00 0.00
Capricorn 0.00 0.00 12.99 0.00 0.00 0.00 0.00 0.00 0.00 0.00
Source: Calculated from Quantec Easydata
Table 9 indicates that only two districts in the Limpopo Province contribute to these provinces’ export values. In Limpopo only Vhembe and Capricorn districts are the exporters of groundnuts. Vhembe district commanded the greatest shares of the total Limpopo groundnut exports with Capricorn district being the second exporter for the province. However, exports of groundnuts originating from the Limpopo Province ceased in 2002 after which there were no groundnut exports from this province until 2009.
Table 10: Share of the district groundnut exports to the total Northern Cape groundnut exports (%)
Year 2000 2001 2002 2003 2004 2005 2006 2007 2008 2009
Districts
Frances Baard 0.00 100 100 100 100 100 100 100 100 100
Source: Calculated from Quantec Easydata
Table 10 above demonstrates contribution of various districts to the Northern Cape’s total value of groundnut exports. The table shows that in the Northern Cape Province groundnuts exports are mainly from Frances Baard District and this province has not been able to export groundnuts during the year 2000. The province only started to export groundnuts from 2001 until 2009 through Frances Baard District which shows a very maximum performance in terms of exports commanding 100% shares of the total Northern Cape groundnut exports.
Table 11: Share of the district groundnut exports to the total Western Cape groundnut exports (%)
Year 2000 2001 2002 2003 2004 2005 2006 2007 2008 2009
Districts
City of Cape Town
44.53 3.29 73.38 4.05 100 100 100 100 100 100
Cape Winelands
55.47 96.71 26.62 95.95 0.00 0.00 0.00 0.00 0.00 0.00
Source: Calculated from Quantec Easydata
121GROUNDNUT MARKET VALUE CHAIN PROFILE 2010-2011

Table 11 shows the contribution of the districts to the total value Western Cape’s groundnut exports in percentages. The table indicates that in the Western Cape Province, most of the groundnut exports originated from the City of Cape Town and Cape Winelands Districts, with the City of Cape Town being the major exporter, commanding the greatest shares of the total Western Cape’s groundnuts exports. Between the years 2004 and 2009, City of Cape Town was the only district that exports groundnuts in the Western Cape Province.
The City of Cape Town has not been doing well in terms of groundnut exports during the years between 2000 and 2003, until it showed a maximum performance from the periods between 2004 and 2009 dominating with 100% of the total provincial groundnuts exports, whereas the Cape Wine lands District showed a very low performance with no groundnuts exports from 2004 until 2009.
Table 12: Share of the district groundnut exports to the total Eastern Cape groundnut exports (%)
Year 2000 2001 2002 2003 2004 2005 2006 2007 2008 2009
Districts
Nelson Mandela 0.00 0.00 0.00 100 0.00 0.00 0.00 0.00 0.00 0.00
Source: Calculated from Quantec Easydata
Table 12 shows the share of the district groundnut exports to the total Eastern Cape groundnut exports in percentages. The table indicates clearly that, all groundnut exports in the Eastern Cape Province originated from the Nelson Mandela district although the exports from this Province were never consistent from the year 2000 until the year 2008. Between the periods 2004 and 2009 there were no exports of groundnuts that originated from the Eastern Cape Province.
2.3 IMPORTS
The quantities of groundnuts imported and import values from 1999 to 2008 pursue the pattern which is shown in Figure 23.
Source: Agricultural Statistics & Quantec Easydata
122 GROUNDNUT MARKET VALUE CHAIN PROFILE 2010-2011

On average South Africa imports approximately 16 million tons of groundnuts per annum. Figure 23 indicates that groundnut imports fluctuated from 2000 until 2009. This occurred as a result of fluctuations in production volumes which were caused by inconsistent weather conditions over the period. The highest quantities of ground were imported during the years 2006 and 2009 mainly as a result of relatively lower production volumes at the time.
Source: Quantec Easy Data
Figure 24 clearly indicates that South Africa imports groundnuts mainly from Africa, the Americas and Asia. Figure 24 indicates that groundnuts imports from Africa and Asia fluctuated at lower levels between the year 2000 and 2004 and that during the same period there were no groundnuts imports from the Americas. South Africa started importing from the Americas in the year 2005 and the imports from this region increased significantly in 2006 to reach the levels above 250 thousand tons. The volume of imports from Africa remained at the levels below 100 thousand tons throughout the period under analysis with a peak in 2003.
123GROUNDNUT MARKET VALUE CHAIN PROFILE 2010-2011

Source: Quantec Easy Data
From the SADC region groundnut imports originate mainly from countries such as Malawi, Mozambique, Zimbabwe and Zambia. The volumes of groundnut imports originating from all the SADC countries as in Figure 25 have been below 50 thousand tons between the period 2000 and 2009. The groundnut imports originating from Malawi increased sharply to a level above 40 thousand tons during the year 2003. Figure 25 further shows that groundnut imports from the SADC region were inconsistent over the period under review with the lowest import volumes from Zambia.
124 GROUNDNUT MARKET VALUE CHAIN PROFILE 2010-2011
Source: Quantec Easy Data
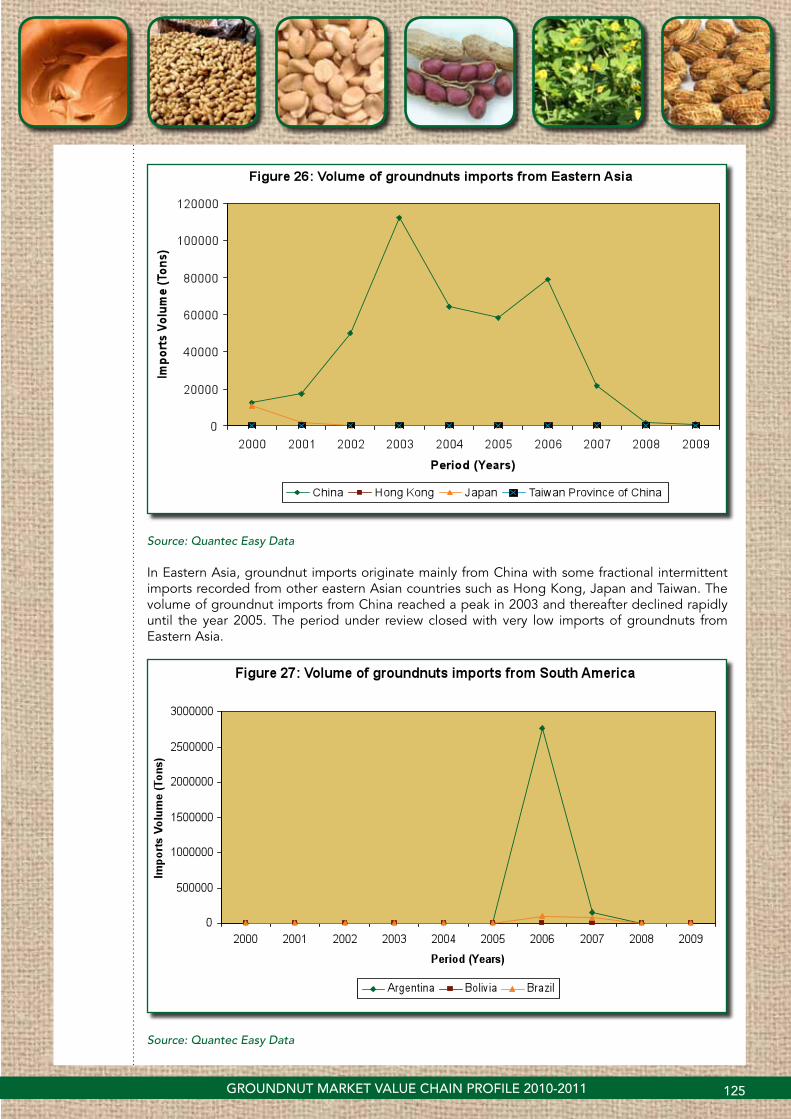
In Eastern Asia, groundnut imports originate mainly from China with some fractional intermittent imports recorded from other eastern Asian countries such as Hong Kong, Japan and Taiwan. The volume of groundnut imports from China reached a peak in 2003 and thereafter declined rapidly until the year 2005. The period under review closed with very low imports of groundnuts from Eastern Asia.
Source: Quantec Easy Data
125GROUNDNUT MARKET VALUE CHAIN PROFILE 2010-2011

In South America, groundnut imports into South Africa originate mainly from Argentina and Brazil. The groundnuts imports volumes from South America were very low from 2000 until 2005. The highest imports of groundnuts from South America were experienced in 2006 from Argentina followed by a huge decline in 2007. The value of groundnuts imports from Brazil improved marginally between 2006 and 2007 seasons. In 2008 and 2009 South Africa did not import any groundnuts from South America.
2.4 PROCESSINg
Groundnuts are a high value crop that can be marketed with little processing but are extremely versatile and can be used in a wide range of products. The oil made from them can be used for cooking and they can be used to make peanut butter. In South Africa processing facilities mainly belong to various companies that produce a wide range of products. These include companies that produce peanuts, sweets, peanut-butter and cooking oil just to mention few
Oil contains high amounts of energy and fat-soluble vitamins (A, D, E, and K) and essential fatty acids. The oil content of the kernels is between 45% and 55%. The peanuts are prepared for the oil extraction process by being shelled and cleaned. Oil production requires some type of press with which to extract the oil from the groundnuts and filtering equipment. The alternative uses of groundnuts are detailed in the following diagram (Figure 19)
As indicated in Figure 19, groundnuts can be used in various ways at different levels within the industry. They can be boiled or roasted for immediate consumption or used as raw material of various products in the industry. Oil extracted from the groundnut can be used as raw material for manufacturing of soap; massage oil for polio patients; body, shaving and hair creams; and fluid diet which is used to physically strengthen patients and to sharpen their appetites before and after operations. The oil cake which is by-product of oil extraction process is used to make glue for wood; animal feed; fertilizers and antibiotics.
126 GROUNDNUT MARKET VALUE CHAIN PROFILE 2010-2011

Figure 28: Groundnut Value Chain tree explaining its uses
Oil extraction
Groundnut Oil Cooking oil
Massage oil (For polio patients)
Body, shave and hair creams
Petrol/Diesel
Fluid diet (For Patients)
Oil Cake
Animal feed
Fertilizers
Antibiotics
Glue for Wood
Groundnut
Shells
Fertilizers
Peanuts
Peanut -Butter
Spread on Bread Ice Cream
Products
Biscuits
Boiled and Salted
Soap
Source: Grain SA and African Groundnut Council
Figure 25: Market value chain for groundnuts
127GROUNDNUT MARKET VALUE CHAIN PROFILE 2010-2011

Figure 25: Market value chain for groundnuts
Research and Biotechnology
Input suppliers
Farmers/Producers
Silo Owners
Import and Export Market
Traders and Transport
Local Market
Peanut-making Industry
Other Processors Oil industry
Retail/Wholesale
Consumer
2.5 MARKET VALUE CHAIN
Farmers produce groundnuts and, after harvesting and drying, they grade the groundnut pods at a prescribed moisture level in the kernels. After grading, the pods are packed in gunny bags. The packed groundnuts are then sold to either the local market (processors) or foreign market, or they may be stored for on-farm processing and future sales. The processed groundnut products are sold in an acceptable form to the consumers.
2.6 MARKET INTELLIgENCE
2.6.1 TARIFFS
The following Table 13 indicates the tariffs that are applied by South Africa to the imports of groundnuts from other countries:
128 GROUNDNUT MARKET VALUE CHAIN PROFILE 2010-2011

Table 13
CO
UN
TRY
TRA
DE
RE
GIM
E
DE
SCR
IPTI
ON
AP
PLI
ED
TA
RIF
FS(2
008)
EST
IMA
TED
TO
TAL
AD
VA
LOR
EM
E
QU
IVA
LEN
T TA
RIF
F (2
008)
AP
PLI
ED
TA
RIF
FS(2
009)
EST
IMA
TED
TO
TAL
AD
VA
LOR
EM
E
QU
IVA
LEN
T TA
RIF
F (2
009)
AP
PLI
ED
TA
RIF
FS(2
010)
EST
IMA
TED
TO
TAL
AD
VA
LOR
EM
E
QU
IVA
LEN
T TA
RIF
F (2
010)
Zimbabwe
MFN duties (Applied)
10.00% 10.00% 10.00% 10.00% 10.00% 10.00%
Preferential tariff from SADC countries
0.00% 0.00% 0.00% 0.00% 0.00% 0.00%
Malawi
MFN duties (Applied)
10.00% 10.00% 10.00% 10.00% 10.00% 10.00%
Preferential tariff from SADC countries
0.00% 0.00% 0.00% 0.00% 0.00% 0.00%
Zambia
MFN duties (Applied)
10.00% 10.00% 10.00% 10.00% 10.00% 10.00%
Preferential tariff from SADC countries
0.00% 0.00% 0.00% 0.00% 0.00% 0.00%
UgandaMFN duties (Applied)
10.00% 10.00% 10.00% 10.00% 10.00% 10.00%
Tanzania
MFN duties (Applied)
10.00% 10.00% 10.00% 10.00% 10.00% 10.00%
Preferential tariff from SADC countries
0.00% 0.00% 0.00% 0.00% 0.00% 0.00%
Mozambique
MFN duties (Applied)
10.00% 10.00% 10.00% 10.00% 10.00% 10.00%
Preferential tariff from SADC countries
0.00% 0.00% 0.00% 0.00% 0.00% 0.00%
Source: ITC Market Access Map
129GROUNDNUT MARKET VALUE CHAIN PROFILE 2010-2011

Imports of groundnuts from SADC countries can enter South Africa free of duty due to the benefit of the SADC Free Trade Agreement while groundnuts imports from Uganda and other countries outside the SADC region are restricted by an import duty of 10%. Table 13 above indicates that tariffs applied by South Africa on imports of groundnuts remained unchanged between the year 2008 and 2010.
The following Table 14 indicates the tariffs that are applied by various countries to the exports of groundnuts originating from South Africa:
Table 14
COUNTRY PRODUCT DESCRIPTIONTRADE REGIME
DESCRITION
APPLIED TARIFFS(2010)
ESTIMATED TOTAL AD VALOREM
EQUIVALENT TARIFF (2010)
United Kingdom
Groundnuts in shell for sowing: 1202101000
MFN duties (Applied) 0.00% 0.00%
Groundnuts in shell (excl. roasted and for sowing): 1202109000
MFN duties (Applied) 0.00% 0.00%
Norway
Groundnuts in shell (for feed purpose): 12021010
MFN duties (Applied) 497.86 $/Ton 43.65%
Preferential tariff for SACU countries
446.76 39.17%
Netherlands
Groundnuts in shell for sowing: 1202101000
MFN duties (Applied) 0.00% 0.00%
Groundnuts in shell (excl. roasted and for sowing): 1202109000
MFN duties (Applied) 0.00% 0.00%
Japan
Groundnuts, not roasted or otherwise cooked used for oil extraction: 120210010
MFN duties (Applied) 0.00% 0.00%
Groundnuts, not roasted or otherwise cooked (excl. those used as material for oil extraction): 120210099
MFN duties (Applied) 5 870 $/Ton 603.79%
Germany Groundnuts in shell for sowing: 1202101000
MFN duties (Applied) 0.00% 0.00%
Groundnuts in shell (excl. roasted and for sowing): 1202109000
MFN duties (Applied) 0.00% 0.00%
Finland Groundnuts in shell for sowing: 1202101000
MFN duties (Applied) 0.00% 0.00%
Groundnuts in shell (excl. roasted and for sowing): 1202109000
MFN duties (Applied) 0.00% 0.00%
Belgium Groundnuts in shell for sowing: 1202101000
MFN duties (Applied) 0.00% 0.00%
Groundnuts in shell (excl. roasted and for sowing): 1202109000
MFN duties (Applied) 0.00% 0.00%
Source: ITC Market Access Map
130 GROUNDNUT MARKET VALUE CHAIN PROFILE 2010-2011

Table 14 above shows that South Africa does not face any tariff barriers when exporting groundnuts to countries such as Belgium, Finland, Germany, Netherlands and United Kingdom. This is mainly due to the fact that these countries no not charge any tariffs on imports of groundnuts originating from other countries. Norway and Japan’s groundnuts industries are heavily protected by higher tariffs that are charged by these countries. Japan applies 603.79% Ad Valorem on imports of groundnuts originating from other countries while Norway applies 43.65%. There is a preferential tariff of 39.17% in Norway for the groundnuts imports originating from SACU countries.
131GROUNDNUT MARKET VALUE CHAIN PROFILE 2010-2011
Source: ITC Trade Map
132 GROUNDNUTs MARKET VALUE CHAIN PROFILE 2010-2011
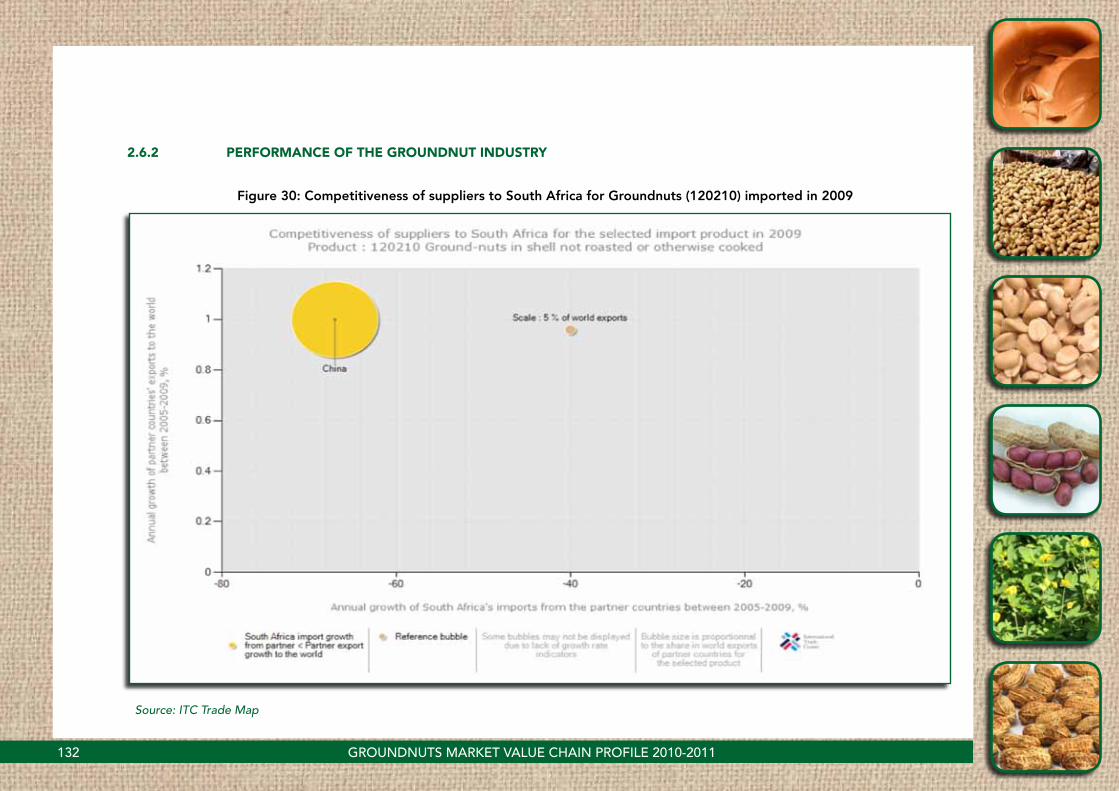
2.6.2 PERFORMANCE OF THE gROUNDNUT INDUSTRY
Figure 30: Competitiveness of suppliers to South Africa for Groundnuts (120210) imported in 2009

Figure 30 indicates that China is the only major exporter of groundnuts to South Africa. The figure also shows that South Africa’s groundnuts imports from China declined by about 67% between the years 2005 and 2009, while at the same time China’s exports to the rest of the world increased by 1% over the same period.
Table 15: List of Importing markets for the groundnut exported by South Africa in 2009
Imp
ort
ers
Exp
ort
ed v
alue
in
2009 (
tho
usan
d U
S$)
Shar
e in
So
uth
Afr
ica’
s ex
po
rts
(%)
Exp
ort
ed q
uant
ity
2009 (
tons
)
Uni
t va
lue
(US$
/uni
t)
Exp
ort
ed g
row
th in
va
lue
bet
wee
n 2005
and
2009 (
% p
.a.)
Exp
ort
ed g
row
th in
q
uant
ity
bet
wee
n 2005 a
nd 2
009 (
%
p.a
.)
Exp
ort
ed g
row
th in
va
lue
bet
wee
n 2008
and
2009 (
% p
.a.)
Tari
ff a
d v
alo
rem
fa
ced
by
Sout
h A
fric
a
World 2 449 100 2 222 1 102 -15 -23 -65
Japan 1 654 67.50 1 386 1 193 -6 -14 -73 301.90
Netherlands 275 11.2 252 1 091 -20 -26 - 0
Germany 135 5.5 110 1 227 -53 -61 -35 0
Finland 107 4.4 78 1 372 65 8 234 0
Source: ITC Trade Map
The major export destinations for South African groundnuts during 2009 were Japan, Germany, Netherlands and Finland, with the greatest volumes being exported to Japan and Netherlands. In 2009, Japan alone absorbed 67.50% of South Africa’s total groundnut exports followed Netherlands and Germany with 11.20%% and 5.5% respectively. However, South Africa’s exports of groundnuts to Japan, Netherlands and Germany have shown a declining trend between the periods 2005 and 2009. The result further shows that, between the years 2008-2009 the value of the South African groundnut exports to the world declined by 15% while those towards Finland increased by 65%.
133GROUNDNUT MARKET VALUE CHAIN PROFILE 2010-2011
Source: ITC Trade Map
134 GROUNDNUTs MARKET VALUE CHAIN PROFILE 2010-2011
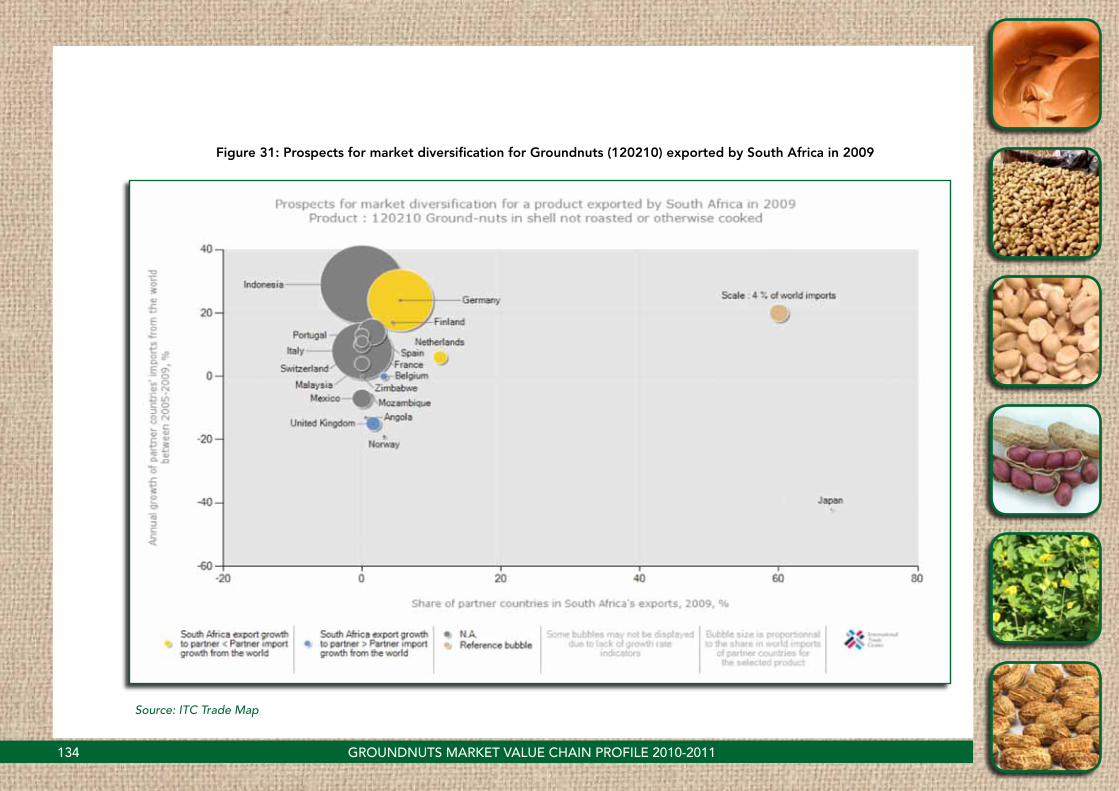
Figure 31: Prospects for market diversification for Groundnuts (120210) exported by South Africa in 2009

Figure 31 shows that, Japan and Netherlands are the major importer of groundnuts from South Africa. During the year 2009, Japan absorbed about 67% of South Africa’s total groundnuts exports followed by Netherlands with 11.20%. The figure further shows that South Africa’s groundnuts exports to countries such as Germany and Netherlands have grown slower than these countries’ imports from the rest of the world. South Africa’s exports to countries such as Belgium, Norway and United Kingdom have grown faster than the growth in these countries’ growth in imports from the rest of the world.
Table 16: List of supplying markets for the groundnut imported by South Africa in 2009
Exp
ort
ers
Imp
ort
ed v
alue
in 2
009
(tho
usan
d U
S$)
Shar
e in
So
uth
Afr
ica’
s im
po
rts
(%)
Imp
ort
ed q
uant
ity
(to
ns)
Uni
t va
lue
(US$
/uni
t)
Imp
ort
ed g
row
th in
va
lue
bet
wee
n 2005 a
nd
20
09
(%
p.a
.)
Imp
ort
ed g
row
th in
q
uant
ity
bet
wee
n 2005
and
20
09 (
% p
.a.)
Imp
ort
ed g
row
th in
va
lue
bet
wee
n 2008 a
nd
20
09
(%
p.a
.)
World 7 100 14 500 -70 -70 -88
China 6 85.7 7 857 -67 -72 -76
Zimbabwe 1 14.3 7 143 - - -
Source: ITC Trade Map
Table 15 shows that groundnut imports from the world decreased by 70% per annum in both value and quantity between 2005 and 2009; while on the other hand declining in value by 88% per year between 2008 and 2009. In the year 2009 South Africa’s groundnuts imports originated mainly from China (86% share) and Zimbabwe (14% share).
135GROUNDNUT MARKET VALUE CHAIN PROFILE 2010-2011
Source: ITC Trade Map
136 GROUNDNUTs MARKET VALUE CHAIN PROFILE 2010-2011
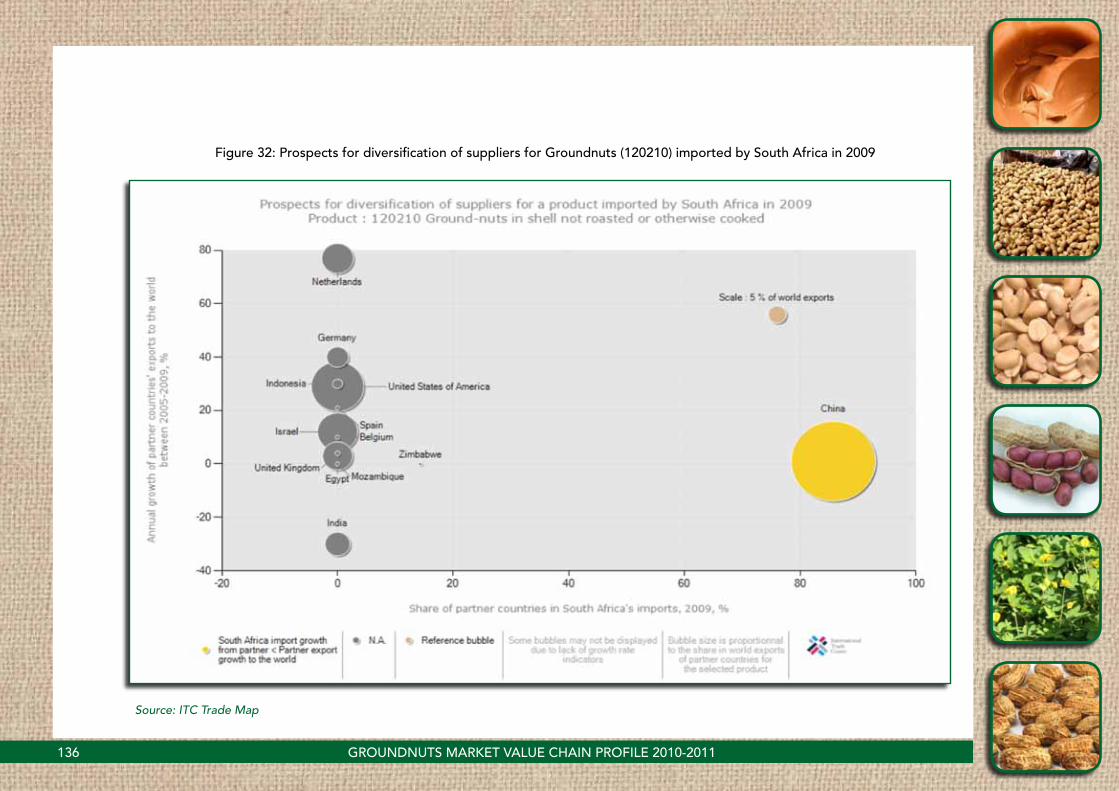
Figure 32: Prospects for diversification of suppliers for Groundnuts (120210) imported by south Africa in 2009

Figure 28 above confirms the earlier observation that China is the only major exporter of groundnuts to South Africa. The figure further shows that, if South Africa wishes to diversify its groundnut imports, reliable markets exist in Germany, United Kingdom, Netherlands and United States of America with a small market in Indonesia, Israel, Spain and Belgium. These are countries whose exports of groundnuts to the rest of the world have experienced a positive growth between the year 2005 and 2009, but South Africa has not imported groundnuts from them over the same period. During the period between 2005 and 2009, China commanded the greatest share in South Africa’s imports of groundnuts.
137GROUNDNUT MARKET VALUE CHAIN PROFILE 2010-2011

3. ACKNOWLEDgEMENTS
The following organizations are acknowledged:
Agricultural Statistics: Department of Agriculture, Forestry and FisheriesTel: (012) 319 8453Fax: (012) 319 8031 www.nda.agric.za
Grain South Africawww.grainsa.co.za
African Groundnut Councilwww.afgroundnutcouncil.org
Quantec EasydataP.O.Box 35466Menlo ParkPretoria0102Tel: 012 361 5154Fax: 012 348 5874Website: www.quantec.co.za
ITC Trade MapWebsite: http://www.trademap.org
ITC Market Access Mapwww.macmap.org
Disclaimer: This document and its contents have been compiled by the Department of Agriculture for the purpose of detailing the groundnut industry. Anyone who uses the information as contained in this document does so at his/her own risk. The views expressed in this document are those of the Department of Agriculture with regard to the industry, unless otherwise stated. The Department of Agriculture therefore accepts no liability that can be incurred resulting from the use of this information.
138 GROUNDNUT MARKET VALUE CHAIN PROFILE 2010-2011