Groundnut Market Value Chain Profile 2016 - … Publications...1 A PROFILE OF THE SOUTH AFRICAN...
32
1 A PROFILE OF THE SOUTH AFRICAN GROUNDNUT MARKET VALUE CHAIN 2016 Directorate Marketing Tel: 012 319 8455 Private Bag X 15 Fax: 012 319 8131 Arcadia E-mail:[email protected] 0007 www.daff.gov.za
Transcript of Groundnut Market Value Chain Profile 2016 - … Publications...1 A PROFILE OF THE SOUTH AFRICAN...

1
A PROFILE OF THE SOUTH AFRICAN GROUNDNUT MARKET VALUE CHAIN
2016
Directorate Marketing Tel 012 319 8455 Private Bag X 15 Fax 012 319 8131 Arcadia E-mailMogalaMdaffgovza 0007 wwwdaffgovza
2
TABLE OF CONTENTS
1 DESCRIPTION OF THE INDUSTRY 3
11 Producing Areas 4 3 MARKET STRUCTURE 6
21 Domestic Market and Prices 6
22 Exports 8 23 Share Analysis 17
2 4 Imports 18
25 Processing 22 26 Market Value Chain 24
3 Market Intelligence 25
31 Tariffs 25 32 Performance of the groundnut industry 27
4 ACKNOWLEDGEMENTS 32
3
1 DESCRIPTION OF THE INDUSTRY Groundnuts contribute approximately 1 to the gross value of field crops production The average annual gross value of groundnuts production for the previous ten years up to 201415 season amounts to approximately R 496 740 million Groundnuts can be consumed in an unprocessed state but they also serve in the economy as raw materials for the manufacturing of various products These include but not limited to the manufacturing of such products as peanuts peanut butter sweets and cooking oil The production of groundnuts is highly affected by the costs of production inputs as well as the demand for groundnuts The contribution of the groundnut industry to the gross value of agricultural production is summarized in Figure 1 below
Source Statistics and Economic Analysis
The gross value of groundnut production as shown in Figure 1 above was relatively low during 200506 season and this was followed by an increase in the gross value of groundnut production during 200607 season The contribution of the groundnut industry to the gross value of agricultural production was characterized by fluctuations throughout the period under analysis with some consistent increases between 200607 and 200809 seasons The gross value of production has reached the highest level during 200809 and in 201314 mainly as a result of relatively higher levels of production coupled with higher producer prices at the time The contribution of the groundnut industry to the GVP declined slightly between 200910 and 201011 seasons and this was followed by a slight increase during 201112 season Relatively higher gross value of groundnut production was recorded in 201314 season However this was followed by a slight decline in gross value of production during the 201415 season
100 000
200 000
300 000
400 000
500 000
600 000
700 000
800 000
200506 200607 200708 200809 200910 201011 201112 201213 201314 201415
R0
00
Years
Figure 1 Groundnuts Gross value of production
4
11 Producing Areas
Figure 2 below shows the contribution of each province to the total groundnuts production in South Africa The figure clearly indicates that the groundnuts are produced mainly in three provinces namely the North Cape (48) North West (25) and Free State Province (21) Groundnuts are also produced in Limpopo province although the production is lower with 6 of the total production
Source Statistics and Economic Analysis
Table 1 Groundnut production by provinces
PROVINCE
Production (tons) 200809
Production (tons) 200910
Production (tons) 201011
Production (tons) 201112
Production (tons) 201213
Production (tons) 201314
Production (tons) 201415
Production (tons) 201516
Northern Cape
31 000 27 120 18 950 16900 14000 18200 22700 16500
Free State
33 690 35 000 20 700 21800 16200 23500 21800 7200
Kwazulu-Natal
0 300 0 150 150 90 100 0
Limpopo 6 750 3 520 3 500 3350 1200 4110 3250 1920
North West
28 000 22 000 20 900 16800 10000 28500 14450 8500
Gauteng 60 60 0 0 0 0 0 0
Source Statistics and Economic Analysis
Table 1 indicates that during the past five years Free State Province has been the major producer of groundnuts even though groundnut production in this province has experienced considerable fluctuations during this period Northern Cape is the second largest producer of groundnuts after Free State However North West Province increased its production significantly during 200708 and
Northern Cape 48
Free State 21
Limpopo 6
North West 25
Figure 2 Groudnuts production by provinces 201516
5
surpassed Northern Capersquos production volumes Notably groundnut production in all the major producing regions has undergone a drastic decline during 201213 season leading to a slight decline in South Africarsquos total groundnuts production Gauteng Province has no recorded any groundnuts production volume from 201011 until 201516 Plantings and production trends of groundnuts from 200607 to 201516 production seasons are as depicted in Figure 3 below
Source Statistics and Economic Analysis
Figure 3 makes it clear that production volumes for groundnuts were at lower levels during the 200607 marketing season and this was followed by a slight increase in groundnuts production volumes during 200708 season During the 200607 season both the production and area planted for groundnut increased until maximum volumes above 100 000 tons were reached in 200809 season This was followed by a drastic decline in groundnuts production volumes during that time indicating a slight decline in yields The period under analysis closed with relatively lower volumes and area planted to during 201516 season This can be attributed to La Nina induced drought conditions which affected most part of the country including the major production areas
200607
200708
200809
200910
201011
201112
201213
201314
201415
201516
total area planted 41 00 54 00 55 00 57 00 55 00 45 00 47 00 52 00 58 00 23 00
production 66 00 100 0 113 0 100 0 73 00 67 00 47 00 84 00 70 00 39 00
20 000
40 000
60 000
80 000
100 000
120 000
10 000
20 000
30 000
40 000
50 000
60 000
70 000
Pro
du
ctio
n (
To
ns)
Are
a P
lan
ted
(H
a)
Figure 3 Production vs Total Area Planted
6
3 MARKET STRUCTURE
21 Domestic Market and Prices
Figure 4 indicates the local production together with consumption of groundnut in South Africa Generally the production and consumption of groundnut fluctuated considerably throughout the period under analysis The figure indicates that the period under analysis opened with production of groundnuts being more than the consumption implying that there was enough groundnuts production and less consumption in South Africa in 200607 as indicated in the figure The figure also indicates that between 200708 and 201112 production of groundnuts was more than the consumption of groundnuts In 20142015 South Africarsquos groundnut production amounted to 70 000 tons which is 17 lower than the previous season This decrease in production occurred despite an increase in area planted from 52 000 hectares to 58 000 hectares mainly due to unfavourable weather conditions However the period under analysis closed with more consumption as compared to production volumes in 201516 season mainly as a result of reduced area planted to groundnut resulting in decreased final product The decrease in area planted could be as a result of severe drought conditions experienced during 201516 production period
Source Statistics and Economic Analysis
20 000
40 000
60 000
80 000
100 000
120 000
200607 200708 200809 200910 201011 201112 201213 201314 201415 201516
To
ns
Period (Years)
Figure 4 Local Groundnuts Production vs Consumption
Groundnuts Production Groundnuts Consumption
7
The average producer prices for groundnuts from 200506 to 201415 season are as indicated in Figure 5 below
Source Statistics and Economic Analysis
Figure 5 shows that producer prices for groundnuts were very low during the opening season of the period under analysis (200506) Generally the figure indicate that groundnut producer prices traded below R8 000ton meanwhile the domestic consumption of groundnut remained fairly stable This was followed by gradual increase in groundnuts producer price from 201011 marketing season mainly driven by international price movements which are triggered by increase in demand The figure indicates that the period under analysis closed with slightly higher producer prices above R7 000ton for the production season 201415 The figure shows that from 201011 to 201415 the domestic prices for groundnut increased by 315 from R5 200ton to R7 589ton Figure 6 shows the utilization of groundnuts in South Africa from 200607 to 201516 The figure shows that groundnuts in South Africa are utilized mainly for manufacturing peanut butter for sales as raw peanuts to the direct market for oil and oilcake and for seed The figure further indicates that groundnut is mainly used for peanut butter and direct market as compared to the use for oil amp oilcake and seed On average 2 220 tons of groundnuts are sold for crushing into oil and oilcake in the domestic market while 3 217 tons are directed to the animal feed and seed markets
200506 200607 200708 200809 200910 201011 201112 201213 201314 201415
Producer Prices 2 84911 5 51438 6 12210 6 36069 4 65965 5 20052 8 28726 8 75587 8 23351 7 58951
000
1 00000
2 00000
3 00000
4 00000
5 00000
6 00000
7 00000
8 00000
9 00000
10 00000
Pri
ce (
Rt
on
)
Period (Years)
Figure 5 Producer prices for Groundnuts
8
Source Statistics and Economic Analysis
22 Exports
The volume and value of groundnuts exports from South Africa to the world are summarized in Figure 7 below Figure 7 indicates volume and value of groundnuts exports from 2006 to 2015 The figure indicates that throughout the period under analysis the quantity of groundnuts exports were consistent with the value of groundnuts exports The period under review opened with moderate volume of groundnuts exports in 2006 On average 14 456 tons were exported at the value of 15786 million The figure further indicates that exports of groundnuts fluctuated considerably over the period under analysis The highest volume of groundnuts exports were recorded in 2010 (29 289 tons) and the lowest was recorded in 2007 (8 834 tons)
10 000
20 000
30 000
40 000
50 000
60 000
70 000
200607 200708 200809 200910 201011 201112 201213 201314 201415 201516
Vo
lum
e (T
on
s)
Marketing Years
Figure 6 Utilization of Groundnuts in the domestic markets
Oil and Oilcake Peanut butter and direct edible market Seed and Unshelled
9
Source Statistics amp Economic Analysis and Quantec Easydata
South Africa imports its groundnuts from countries such as Namibia Zambia Malawi Mozambique and USA as shown in Figure 8
Source ITC Trade Map
Figure 8 below shows exporters of groundnuts to the Republic of South Africa during the year 2015 The figure indicates that Namibia is the largest exporters of groundnuts into South African markets
0
50000000
100000000
150000000
200000000
250000000
300000000
0
5000
10000
15000
20000
25000
30000
35000
2006 2007 2008 2009 2010 2011 2012 2013 2014 2015
Exp
ort
Val
ue
(R0
00)
Exp
ort
Vo
lum
es (
To
ns)
Period (Years)
Figure 7 Volume and Value of Groundnuts exports 2006-2015
Export Quantity (Tons) Export Value (Rands)
Namibia 56
Zambia 19
Malawi 16
Mozambique 8
United States of America
1
Figure 8 Export of Groundnuts to RSA in 2015
10
followed by Zambia Malawi and Mozambique in 2015 During the same year Namibia accounted for about 56 of the total groundnuts imported by South Africa followed by Zambia (19 ) and Malawi with 16 Mozambique contributed 8 towards South Africarsquos total groundnut imports in 2015
Source Quantec Easy data
Figure 9 indicates volume of groundnuts exports to various regions in the world The figure indicates that South Africa exports mainly to Europe Asia and Africa The figure also indicates that on average volumes of groundnuts exports to America and Oceania are less than 400 tons of groundnuts per year As shown in figure 9 the groundnut exports from South Africa are mainly destined for the markets in Europe Asia Africa the Americas and Oceania The figure indicates that exports to Europe and Asia are more than those destined to neighbouring countries to South Africa within the African continent which is not surprising as most countries in Africa are involved mostly in primary agricultural production than in processing Generally the volume of groundnuts exports to Europe started to decline from 2006 until 2007 followed by slight increases between 2008 and 2010 Exports to Asia fluctuated at moderate levels from the year 2006 until some increases were experienced in 2008 The period under review closed with larger volumes of groundnuts exports being destined to Africa followed by Asia and Europe in 2015 Figure 10 indicates exports of groundnuts to European Union from 2006 to 2015 The exports of groundnuts to this region were fluctuating throughout the period under analysis The figure indicates that the South African groundnuts exports over the period under review were destined mainly to Netherlands United Kingdom Finland and Belgium Exports to Belgium remained minimal The period under analysis closed with decreasing volumes of groundnuts from South Africa to the Netherlands in 2015
2006 2007 2008 2009 2010 2011 2012 2013 2014 2015
Africa 1358475 1070288 1937279 2032579 8324231 4021748 8824 2328622 3683915 1531505
Americas 0 60 0 186 181 396 90 0 001 0
Asia 7208214 4645001 7496656 4542 75056 483235 39038 2562193 2704995 3547535
Europe 3721533 2700478 4663704 4655175 1327971 7312424 551419 3855612 316372 260535
Oceania 252 198 3864 216 162 324 144 144 126001 324081
02000400060008000
1000012000140001600018000
Exp
ort
Vo
lum
e (T
on
s)
Period (Years)
Figure 9 Volumes of Groundnut Export to various regions
11
Source Quantec Easy data
Figure 11 presents exports of groundnuts to Eastern Asia from 2006 to 2015 The figure indicates that in Eastern Asia South Africa exports groundnuts mainly to Japan The figure further indicates that exports of groundnuts to China and Hong Kong were very low and erratic during period under analysis As depicted in Figure 11 below exports of groundnuts from South Africa to Eastern Asia have generally been declining from 2006 until the year 2013 and slightly increase until 2015 mainly because Japan who is the major importer of groundnuts from South Africa in Eastern Asia substituted imports from South Africa with those from Argentina and Brazil
Source Quantec Easy data
2006 2007 2008 2009 2010 2011 2012 2013 2014 2015
Belgium 36 0 130 98 79 0 0 0 540 702
Finland 0 0 470 114 288 234 122 79 72 18
United Kingdom 486 348 703 90 2206 531 0 0 286 80
Netherlands 1385 1250 2513 3451 8713 5326 5159 3402 2086 1726
0100020003000400050006000700080009000
10000E
xpo
rt V
olu
mes
(T
on
s)
Period (Years)
Figure 10 Volume of groundnuts exports to the European Union
0
1000
2000
3000
4000
5000
6000
7000
8000
9000
10000
2005 2006 2007 2008 2009 2010 2011 2012 2013 2014 2015
Exp
ort
Vo
lum
e (T
on
s)
Period (Years)
Figure 11 Volume of groundnuts exports to Eastern Asia
China Hong Kong Special Administrative Region of China Japan
12
Figure 12 below indicates volumes of groundnuts exports to the SADC region from 2006 to 2015 The figure indicates that South Africa exports groundnuts more greatly to Mozambique and Zimbabwe Exports of groundnuts to Zambia were very lower during the period under analysis The figure further indicates that Angola is also an important market for South African groundnuts The exports of groundnuts from South Africa to the SADC countries with the exception of Mozambique were very low between the years 2011 and 2015
Source Quantec Easy data
Figure 13 shows exports of groundnuts by province from 2006 to 2015
0
2000
4000
6000
8000
10000
12000
2005 2006 2007 2008 2009 2010 2011 2012 2013 2014 2015
Exp
ort
Vo
lum
e (T
on
s)
Period (Years)
Figure 12 Volume of groundnuts export to the SADC region
Angola Mozambique Zambia Zimbabwe
13
Source Quantec Easy data
Figure 13 above indicates that Gauteng province is the greatest exporters of groundnuts produced in South Africa followed by Northern Cape and Kwazulu-Natal The figure further indicates that exports from the largest producer (Free State) were very low throughout the period under analysis and this mainly influenced by lack of necessary marketing infrastructure It is also clear that the values of exports from different provinces were fluctuating throughout the period under analysis with those from Mpumalanga being at the lowest Figure 14 presents the value of groundnuts exports in Gauteng province from 2006 to 2015 The figure indicates that City of Tshwane is the major exporters of groundnuts as compared to other district Generally exports of groundnuts from Gauteng province were highly volatile throughout the period under analysis The figure also indicates that Ekurhuleni and West Rand also contributes significantly towards Gauteng provincersquos total value of groundnuts exports The period under analysis closed with City of Johannesburg commanding the greatest share of Gautengrsquos value of groundnuts exports in 2015
0
20000000
40000000
60000000
80000000
100000000
120000000
140000000
160000000
180000000
2006 2007 2008 2009 2010 2011 2012 2013 2014 2015
Exp
ort
Val
ue
(Ran
ds)
Period (Years)
Figure 13 Value of groundnuts exports by provinces
Western Cape Eastern Cape Northern CapeFree State KwaZulu-Natal North WestGauteng Mpumalanga Limpopo
14
Source Quantec Easy data
Figure 15 below shows value of groundnut exports from North West province during the period 2006 to 2015 Observable from the figure is very low and erratic trend with regard to exports of groundnuts from various districts in the province Dr Ruth Segomotsi Mompati District Municipality was the greatest exporter of groundnuts from North West province between 2012 and 2015 Exports of groundnuts from Dr Kenneth Kaunda district were very low during the year 2006 and remained very low for the rest of the period under analysis
Source Quantec Easy data
Values of groundnut exports from KwaZulu-Natal Province for the period 2006 to 2015 are shown in Figure 16 below Figure 16 indicates value of groundnuts exports from Kwazulu-Natal during 2006 to 2015The figure indicates that the value of groundnuts export during the period of analysis was highly volatile The figure indicates that eThekwini commands the greatest value of groundnuts exports from
0
20000000
40000000
60000000
80000000
100000000
120000000
2006 2007 2008 2009 2010 2011 2012 2013 2014 2015
Exp
ort
Val
ue
(Ran
ds)
Period (Years)
Figure 14 Value of groundnuts exports from Gauteng
West Rand Ekurhuleni City of Johannesburg City of Tshwane
0
2000000
4000000
6000000
8000000
10000000
12000000
14000000
16000000
2006 2007 2008 2009 2010 2011 2012 2013 2014 2015
Exp
ort
Val
ue
(Ran
ds)
Period (Years)
Figure 15 Value of groundnuts exports from North West Province
Dr Ruth Segomotsi Mompati Dr Kenneth Kaunda
15
the provinces followed by Umgungundlovu and iLembe In 2015 the period under review closed with lower levels of groundnuts exports from KwaZulu-Natal Province
Source Quantec Easy data
Source Quantec Easy data
Figure 17 indicates value of groundnuts exports from Western Cape during 2006 to 2015The figure indicates that City of Cape Town was the major exporter of groundnuts in Western Cape for a better part of the period under analysis The figure further indicates that Cape Winelands exported only from 2010 until 2015 while Eden district exported only in 2012 The period closed with decreasing groundnuts exports from the province in 2015
0
5000000
10000000
15000000
20000000
25000000
30000000
2006 2007 2008 2009 2010 2011 2012 2013 2014 2015
Exp
ort
Val
ue
(Ran
ds)
Period (Years)
Figure 16 Value of groundnuts exports from Kwazulu-Natal Province
UMgungundlovu Umzinyathi iLembe eThekwini
2006 2007 2008 2009 2010 2011 2012 2013 2014 2015
City of Cape Town 11677 18446 5245 12712 18521 55273 974 1149 17065 85353
Cape Winelands 0 0 0 0 45420 6213 25250 677 215704 198863
Eden 0 0 0 0 0 0 23573 0 0 0
0
50000
100000
150000
200000
250000
Exp
ort
Val
ue
(Ran
ds)
Figure 17 Value of groundnuts exports from Western Cape Province
16
Source Quantec Easy data
Figure 18 shows value of groundnuts exports from Free State during 2006 to 2015The figure indicates that generally Free State is not major exporters of groundnuts Despite the facts that is the largest producer of groundnuts in South Africa Exports of groundnuts in Free State originate only from four districts Lejweleputswa Thabo Mofutsanyane Fezile Dabi and Mangaung Lejweleputswa exported only in 2010 and 2013 while Mangaung recorded exports only in 2014 The marketing season for 2015 closed higher with the greatest value of groundnuts exports from Lejweleputswa district the highest attained for the entire period
Source Quantec Easy data
0
2000000
4000000
6000000
8000000
10000000
12000000
14000000
16000000
2006 2007 2008 2009 2010 2011 2012 2013 2014 2015
Exp
ort
Val
ue
(Ran
ds)
Period (Years)
Figure 19 Value of groundnuts exports from Free State Province
Lejweleputswa Thabo Mofutsanyane Fezile Dabi Mangaung
0
10000000
20000000
30000000
40000000
50000000
60000000
70000000
80000000
90000000
2006 2007 2008 2009 2010 2011 2012 2013 2014 2015
Exp
ort
Val
ue
(Ran
ds)
Period (Years)
Figure 19 Value of groundnuts exports from Northern Cape Province
Frances Baard
17
Figure 19 shows value of groundnuts exports from Northern Cape during 2006 to 2015The figure indicates that out of all the districts in Northern Cape only one district (Frances Baard) exports groundnuts The figure further indicates that Frances Baard recorded highest value of groundnuts exports during the year 2012 The period under review closed with the highest value of groundnuts exports from Northern Cape in 2015
23 Share Analysis
Table 2 Contribution of various provinces to South Africarsquos total value of groundnuts export ()
Year 2006 2007 2008 2009 2010 2011 2012 2013 2014 2015 Province
Western Cape
002 003 000 001 003 003 003 003 025 014
Northern Cape
882 1176 1161 1421 2279 3155 3244 2511 3564 4081
Free State 000 019 000 000 283 000 045 470 072 773
Kwazulu-Natal
2950 1612 000 809 1075 1125 416 550 505 211
North West 2344 3258 000 000 000 001 423 303 284 663
Gauteng 3822 3933 6360 7769 6359 5652 5868 6107 5550 3922
Source Calculated from Quantec Easy data
Table 2 confirms the earlier observation that Gauteng province is the largest contributor towards South Africarsquos total value of groundnuts exports followed by Kwazulu-Natal and Northern Cape provinces The table further indicates that the share of groundnuts exports from other provinces remained minimal throughout the period under review Northern Cape Provincersquos share of groundnuts exports have been increasing since 2006 until 2012 followed by a slight decline in 2013 and an increase in 2014 and 2015 During the year 2006 Northern Capersquos contribution to South Africarsquos total groundnuts exports was 882 and this has increased to 3244 in 2012 This scenario is not surprising since Northern Cape Province has recently emerged to be one of the biggest producers of groundnuts having accounted for 3564 and 4081 of South Africarsquos total groundnuts production during 2014 and 2015 season Table 3 Contribution of various districts to Gauteng Provincersquos total value of groundnut exports ()
Year 2006 2007 2008 2009 2010 2011 2012 2013 2014 2015 District
West Rand 1207 1081 4646 3301 4251 2656 424 1239 028 651
Ekurhuleni 1830 1496 007 3692 3565 4473 6245 6385 259 545
City of Johannesburg
908 752 098 084 009 031 029 033 4944 3449
City of Tshwane
6055 6671 5249 2923 2175 2840 3301 2443 4769 5355
Source Calculated from Quantec Easy data
18
Table 3 shows that out of five districts in Gauteng province four districts are contributing to the total groundnuts exports of the province The table indicates that City of Tshwane commanded the greatest share of Gautengrsquos total groundnuts exports value between 2006 and 2008 The table further indicates that the Ekurhuleni district municipality has commanded the greatest share of the Provincersquos total value of groundnuts exports between 2009 and 2013 During the year 2014 City of Johannesburgrsquos share of Gautengrsquos total groundnuts exports was 4944 followed by City of Tshwane and West Rand whose contributions to Gautengrsquos groundnuts exports were 4769 and 259 respectively In 2015 the City of Tshwane commanded the greatest share of 5355 in total Gauteng province exports Table 4 Contribution of various districts to KwaZulu-Natal Provincersquos total value of groundnut exports ()
Year 2006 2007 2008 2009 2010 2011 2012 2013 2014 2015
Districts
UMgungundlovu 000 000 2677 000 386 007 000 000 541 277
UMzinyathi 000 000 000 000 000 000 000 450 000 000
ILembe 000 099 000 000 000 000 000 000 000 3077
EThekwini 100 9900 7323 100 9614 9997 100 9550 9459 6645
Source Calculated from Quantec Easy data
Table 4 shows that out of 11 districts in Kwazulu-Natal only five districts are contributing to the total groundnuts exports by the province The figure further indicates that Kwazulu-Natal province has exports of groundnuts originating mainly from EThekwini district primarily due to the use of the Durban harbour as a viaduct of produce that are transported from the Randfontein grain market for export purposes The table indicates that UMgungundlovu UMzinyathi and ILembe Districts contributed insignificantly towards the provincersquos value groundnuts exports During the year 2015 EThekwini commanded the greatest share of Kwazulu-Natal total groundnuts exports 6645 while ILembe and UMgungundlovu district contributed 30775 and 277 Table 5 below demonstrates the contribution of various districts to the Northern Capersquos total value of groundnut exports The table shows that out of all districts in Northern Cape only one district is contributing to the total groundnuts exports by the province The province only started to export groundnuts from 2006 until 2015 through Frances Baard District which shows a very maximum performance in terms of exports contributing 100 to the Northern Capersquos total value groundnut exports Table 5 Contribution of various districts to the Northern Cape Provincersquos total value of groundnut exports ()
Year 2006 2007 2008 2009 2010 2011 2012 2013 2014 2015 Districts
Frances Baard
100 100 100 100 100 100 100 100 100 100
Source Calculated from Quantec Easydata
2 4 Imports
19
The quantities of groundnuts imported and import values from 2006 to 2015 pursue the pattern which is shown in Figure 20 below
Source Statistics amp Economic Analysis Quantec Easydata
On average South Africa imports approximately 11 696 tons of groundnuts per annum to the value of about R114 million Figure 20 indicates that groundnut imports fluctuated considerably from the year 2006 until 2015 This occurred as a result of fluctuations in production volumes which were caused by inconsistent weather conditions over the period The highest quantities of ground were imported during the years 2006 while the lowest were imported in 2010 South Africa imports groundnuts from the following regions Europe Asia the Americas and Africa particularly from the SADC region Figure 21 indicates that over the past ten years South Africa has been importing groundnuts consistently from Africa the Americas Asia and Europe The major groundnuts import market for South Africa is Africa followed by Asia and the Americas On average South Africa imports about 6 442 tons of groundnuts annually from Africa while imports from Americas and Asia are about 2 953 tons and 2 160 tons per annum respectively
0
50000000
100000000
150000000
200000000
250000000
300000000
0
5000
10000
15000
20000
25000
2006 2007 2008 2009 2010 2011 2012 2013 2014 2015
Imp
ort
Val
ue
(Ran
ds)
Imp
ort
Qu
anti
ty (
To
ns)
Period (Years)
Figure 20 Groundnuts Imports for the period 2006-2015
Import Quantity (Tons) Import Value (Rands)
20
Source Quantec Easy Data
Figure 22 below indicates that on the African Continent South Africa imports groundnuts from the following Countries Malawi Mozambique Zimbabwe Tanzania and Zambia from the SADC region The figure indicates that over the past ten years South Africa has been importing groundnuts consistently from Malawi and Mozambique It is also clear from the figure that groundnut imports from the SADC countries fluctuated considerably over the period under review with the lowest import volumes originating from Zambia Zimbabwe Malawi and Tanzania
Source Quantec Easy Data
0
2000
4000
6000
8000
10000
12000
14000
16000
2006 2007 2008 2009 2010 2011 2012 2013 2014 2015
Imp
ort
Vo
lum
e (T
on
s)
Period (Years)
Figure 21 Volume of groundnuts imports from various regions
Africa Americas Asia Europe Oceania
2006 2007 2008 2009 2010 2011 2012 2013 2014 2015
Malawi 3107 3659 1368 653 674 5491 3404 2114 794 271
Mozambique 409 8977 1188 833 0 952 3554 9117 1578 54
United Republic of Tanzania 0 0 115 0 0 48 2752 416 0 0
Zambia 1041 3695 0 0 0 0 184 250 1049 314
Zimbabwe 12 0 61 58 0 865 32 30 12 0
0100020003000400050006000700080009000
10000
Imp
ort
Vo
lum
e (T
on
s)
Figure 22 Volume of groundnuts Imports from the SADC region
21
Source Quantec Easy Data
In Eastern Asia groundnut imports originate mainly from China with some fractional intermittent imports originating from other Eastern Asian countries such as Hong Kong and Japan Figure 23 above indicates that volume of groundnut imports from China were at the highest level in 2006 and thereafter declined rapidly to lower levels until the year 2014 The period under review closed with lower imports of groundnuts from Eastern Asia in 2015
Source Quantec Easy Data
Figure 26 indicates that South Africarsquos groundnut imports from South America originate mainly from Argentina and Brazil The groundnuts imports volumes from South America were slightly higher in
2006 2007 2008 2009 2010 2011 2012 2013 2014 2015
China 17926071041125 489566 997952 955733 745487 661224 232136 282516 868072
Hong Kong 0024 0 0 0 0192 0 0 0 0 0
Japan 18 0 18 1795 35871 17919 18 36 0 18
0
200
400
600
800
1000
1200
1400
1600
1800
2000
Imp
ort
Vo
lum
e (T
on
s)
Figure 23 Volume of groundnuts imports from Eastern Asia
2006 2007 2008 2009 2010 2011 2012 2013 2014 2015
Argentina 671745 108621 36829 105372 14384 0 003 2859 26033 943963
Brazil 2763202 133438 144 0 0 0 006 0 0 925
0
1000
2000
3000
4000
5000
6000
7000
8000
9000
10000
Imp
ort
Vo
lum
e (T
on
s)
Period (Years)
Figure 24 Volume of groundnuts Imports from South America
22
2006 The highest imports of groundnuts from South America were experienced in 2006 from Argentina followed by a huge decline in 2007 The volume of groundnuts imports from Brazil improved marginally between 2006 and 2007 seasons The figure further indicates that the imports of groundnuts were lower between 2008 and 2014 South Africa imported lower volumes of groundnuts from South America during the year 2010 when less than 1000 tons of groundnuts were imported from both Argentina and Brazil combined The figure further shows that there were no imports of groundnuts from Brazil during the year 2014 while those from Argentina were also lower The period under review closed with the highest imports volumes above 9 000 tons from Argentina during the year 2015
25 Processing
Groundnuts are a high value crop that can be marketed with little processing but are extremely versatile and can be used in a wide range of products The oil made from them can be used for cooking and they can be used to make peanut butter In South Africa processing facilities mainly belong to various companies that produce a wide range of products These include companies that produce peanuts sweets peanut-butter and cooking oil just to mention few Oil contains high amounts of energy and fat-soluble vitamins (A D E and K) and essential fatty acids The oil content of the kernels is between 45 and 55 The peanuts are prepared for the oil extraction process by being shelled and cleaned Oil production requires some type of press with which to extract the oil from the groundnuts and filtering equipment The alternative uses of groundnuts are detailed in the following diagram (Figure 25) As indicated in Figure 25 groundnuts can be used in various ways at different levels within the industry They can be boiled or roasted for immediate consumption or used as raw material of various products in the industry Oil extracted from the groundnut can be used as raw material for manufacturing of soap massage oil for polio patients body shaving and hair creams and fluid diet which is used to physically strengthen patients and to sharpen their appetites before and after operations The oil cake which is by-product of oil extraction process is used to make glue for wood animal feed fertilizers and antibiotics
23
Figure 25 Groundnut Value Chain tree explaining its uses
Source Grain SA and African Groundnut Council
Oil extraction
Groundnut Oil Cooking oil
Massage oil
Body shave
and hair
creams
PetrolDiesel
Fluid diet
(For Patients)
Oil Cake
Animal
feed
Fertilizers
Antibiotics
Glue for
Wood
Groundnut
Shells
Fertilizers
Peanuts
Peanut -
Butter
Spread on
Bread Ice Cream
Products
Biscuits
Boiled and
Salted
Soap
24
26 Market Value Chain
Figure 26 Market value chain for groundnuts
Farmers produce groundnuts and after harvesting and drying they grade the groundnut pods at a prescribed moisture level in the kernels After grading the pods are packed in gunny bags The packed groundnuts are then sold to either the local market (processors) or foreign market or they may be stored for on-farm processing and future sales The processed groundnut products are sold in an acceptable form to the consumers
Research and
Biotechnology
Input suppliers
FarmersProducers
Silo Owners
Import and
Export Market
Traders and
Transport
Local Market
Peanut-making
Industry
Other
Processors
Oil industry
RetailWholesale
Consumer
25
3 Market Intelligence
31 Tariffs
The following Table 6 indicates the tariffs that are applied by South Africa to the imports of groundnuts from other countries during the year 2015 South Africa generally applies an import duty of 1000 Ad valorem on imports of groundnuts However imports of groundnuts from member-countries of the following regional structures may enter South Africa free of duty SACU European Union and SADC This is due to free trade agreements that exist between South Africa and abovementioned regional structures Table 6 Tariffs applied by South Africa to groundnut imports
Selected Product description
Tariff regime description Applied Tariff Total ad valorem equivalent tariff (estimated)
Groundnuts not roasted or otherwise cooked 120230
MFN duties (Applied) 1000 1000
Intra SACU rate 000 000
Preferential tariff for European Union Countries
000 000
Preferential tariff for SADC countries
000 000
Source ITC Market Access Map
The following Table 7 indicates the tariffs that are applied by various countries to the exports of groundnuts originating from South Africa in 2015 Table 7 Tariffs applied to South African groundnut exports
Importers Selected product codes
Product description
Trade regime description
Applied tariffs Total ad valorem equivalent tariff
Japan 1202 Ground-nuts not roasted
MFN duties (Applied)
6 02315$Ton 41914
Zimbabwe 12023000 Ground-nuts not roasted
MFN duties (Applied)
1000 1000
12024100 Ground-nuts not roasted (in shell)
Preferential tariff (SADC)
000 000
Mozambique 12022090 Ground-nuts not roasted
MFN duties (Applied)
2000 2000
Preferential tariff for South Africa
000 000
26
Importers Selected product codes
Product description
Trade regime description
Applied tariffs Total ad valorem equivalent tariff
Netherlands 12024200 Ground-nuts not roasted
MFN duties (Applied)
000 000
Zambia 12024210
Ground-nuts not roasted
MFN duties (Applied)
500 500
Preferential tariff for South Africa
000 000
Source ITC Market Access Map
Table 7 above shows that South Africa does not face any tariff barriers when exporting groundnuts to countries such as Netherlands Mozambique and Zambia This is mainly due to the fact that some of these countries do not charge any tariffs on imports of groundnuts originating from other countries South Africa enjoys a preferential tariff of 0 ad valorem when exporting groundnuts to Mozambique and Zambia due to the existence of SADC Free Trade Agreement Japanrsquos groundnuts industries are heavily protected by higher import duties that are charged by these countries on imports of groundnuts from elsewhere Japan applies an import duty of 41914 Ad Valorem on imports of groundnuts originating from other countries and on imports of groundnuts originating from South Africa
27
32 Performance of the groundnut industry
Figure 27 Competitiveness of supplying countries for SA groundnut imports 2015
Source ITC Trade Map
28
Figure 27 and Table 8 indicate that imports of groundnuts from Namibia and Zambia increased significantly between the years 2011 and 2015 Groundnuts imports from Namibia increased by about 39 in quantity between the years 2011 and 2015 while those from Zambia increased by 19 in quantity Table 8 List of supplying markets for the groundnut imported by South Africa in 2015
Exporters
Trade Indicators
Imported value 2015
(USD thousand)
Share in South
Africas imports
()
Imported quantity
2015
Unit value (USDunit)
Imported growth in value between
2011-2015 (
pa)
Imported growth
in quantity between
2011-2015 (
pa)
Imported growth in
value between
2014-2015 (
pa)
World 9333 100 8489 1099 -11 -5 16
Argentina 5791 62 5288 1095
3209
China 1520 163 849 1790 -11 -6 305
Brazil 1294 139 1200 1078
Namibia 228 24 604 377 14 39 -85
Zambia 179 19 207 865
19 -71
Malawi 131 14 172 762 -61 -57 mdash84
Mozambique 44 05 84 524 -31 -6 -11
United States of America
24 03 6 4000 -53 -43 -95
Source ITC Trade Map
Table 8 and Figure 28 also show that Argentina is the biggest supplier of groundnuts imported by South Africa in 2015 It is clear from the figure and the table that Argentina accounted for about 62 of the total groundnuts imported by South Africa during the year 2015 The other major exporters of groundnuts to South Africa are China Brazil and Namibia which account for 163 139 and 24 of South Africarsquos total groundnuts imports respectively South Africa also imports groundnuts from other countries such Zambia Malawi Mozambique and the United States of America
29
Figure 28 Prospects for diversification of suppliers of groundnut imported by South Africa 2015
Source ITC Trade Map
30
Table 9 List of Importing markets for the groundnut exported by South Africa in 2015
Importers
Trade Indicators
Exported value 2015
(USD thousand)
Share in South
Africas exports
()
Exported quantity
2015
Unit value
(USDunit)
Exported growth in
value between
2011-2015 ( pa)
Exported growth in quantity between
2011-2015 ( pa)
Exported growth in
value between 2014-2015 (
pa)
World 15312 100 22182 690 -16 5 17
Japan 5064 331 3076 1646 -17 -11 3
Zimbabwe 2830 185 7019 403 0 0 2450
Mozambique 2704 177 8632 313 30 100 147
Netherlands 2559 167 1668 1534 -31 -28 -28
Zambia 619 4 622 995 233 123 479
Swaziland 349 23 356 980 -44 -41 157
New Zealand 338 22 180 1878 -19 -12 33
Norway 289 19 159 1818 -25 -21 -16
Egypt 158 1 144 1097 241 246 -74
Source ITC Trade Map
It is clear from Table 9 and Figure 29 that the major export destinations for groundnuts originating from South Africa are Japan Zimbabwe Mozambique Netherlands Zambia Swaziland New Zealand Norway and Egypt with the greatest volumes being exported to Japan and Zimbabwe In 2015 Japan alone absorbed 331 of South Africarsquos total groundnut exports followed Zimbabwe and Mozambique with 185 and 177 respectively South Africarsquos value of groundnuts exports to the world declined by 16 in value terms between the years 2011 and 2015 The figure and the table further show that between the years 2014 and 2015 the value of the South African groundnut exports to the world increased by 17 while those towards Japan also increased by 3 over the same period Figure 29 further shows that South Africarsquos groundnuts exports to countries such as Netherlands Japan Norway New Zealand Mozambique and Finland have grown at a slow pace compared to these countriesrsquo imports growth from the rest of the world The growth rate of South Africarsquos groundnut exports to countries such as Zambia and Egypt is more than the growth in these countriesrsquo imports from the rest of the world The figure further shows that if South Africa wishes to expand its groundnut export base the prospective markets exist in countries such as Botswana Namibia Belgium and Taipei Chinese
31
Figure 29 Prospects for market diversification for Groundnuts (1202) exported by South Africa in 2015
Source ITC Trade Map
32
4 ACKNOWLEDGEMENTS The following organizations are acknowledged Statistics and Economic Analysis Department of Agriculture Forestry and Fisheries Tel (012) 319 8453 Fax (012) 319 8031 wwwdaffgovza Grain South Africa wwwgrainsacoza African Groundnut Council wwwafgroundnutcouncilorg Quantec Easydata POBox 35466 Menlo Park Pretoria 0102 Tel 012 361 5154 Fax 012 348 5874 Website wwwquanteccoza ITC Trade Map Website httpwwwtrademaporg ITC Market Access Map wwwmacmaporg Disclaimer This document and its contents have been compiled by the Department of Agriculture Forestry and Fisheries for the purpose of detailing the groundnut industry Anyone who uses the information as contained in this document does so at hisher own risk The views expressed in this document are those of the Department with regard to the industry unless otherwise stated The Department therefore accepts no liability that can be incurred resulting from the use of this information
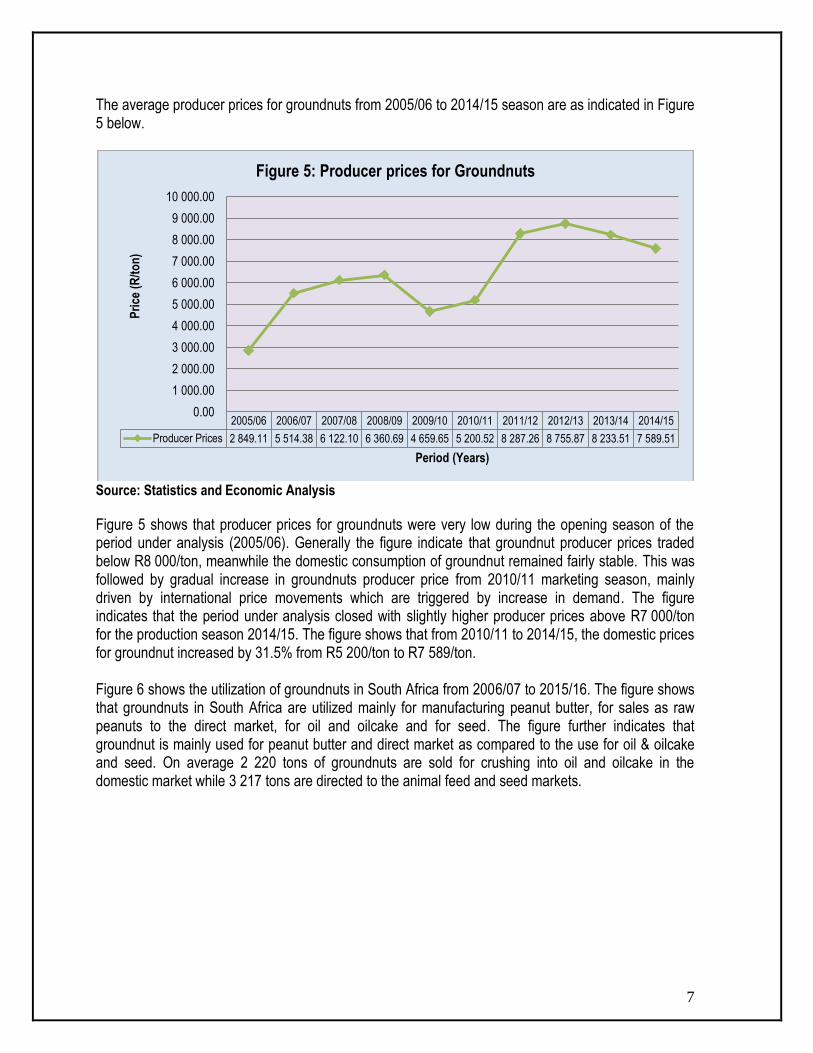
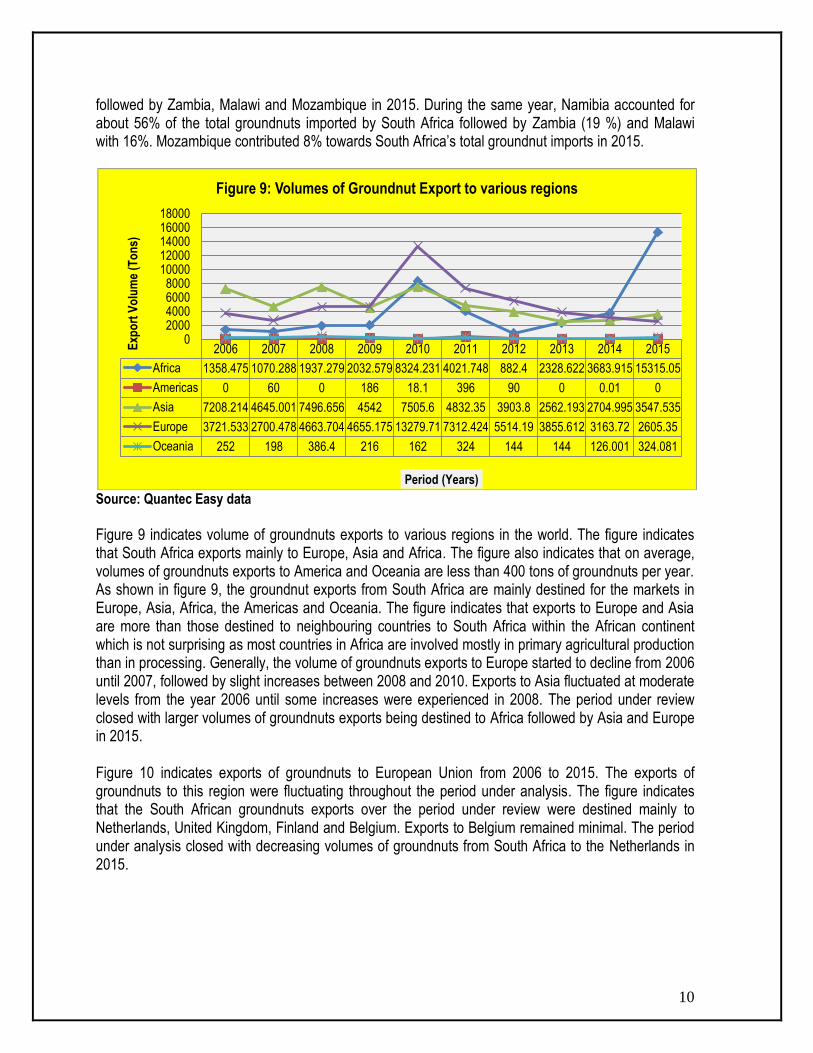
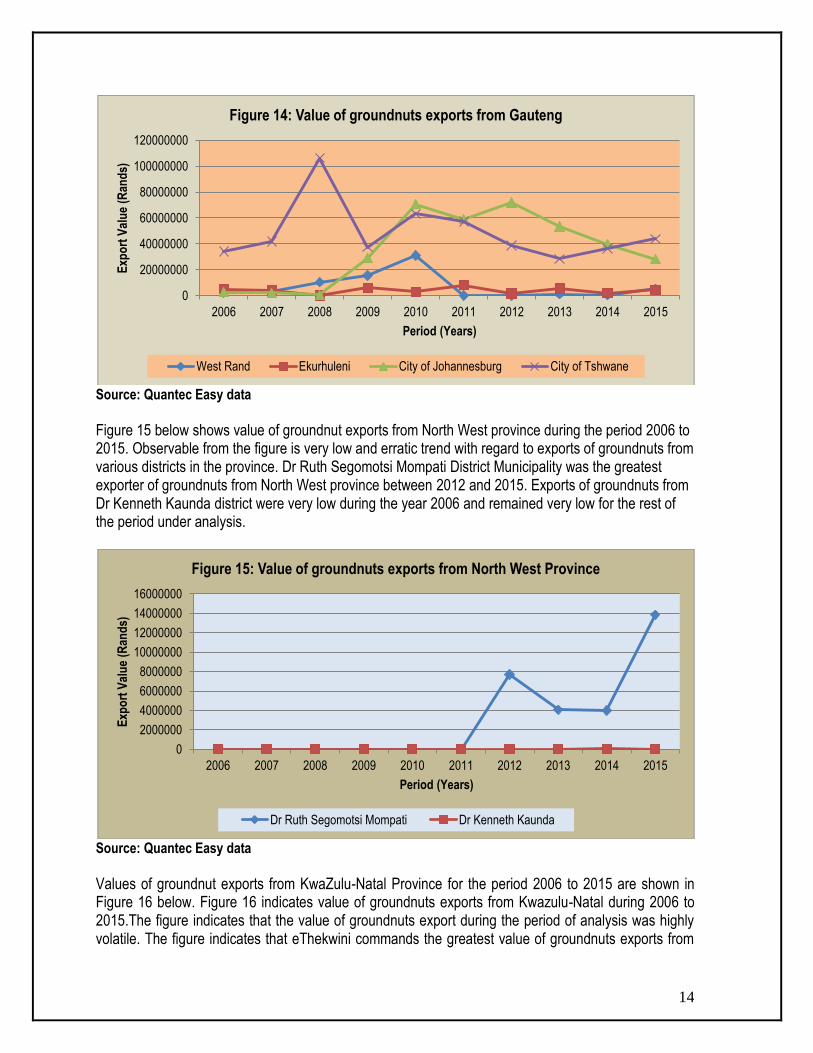
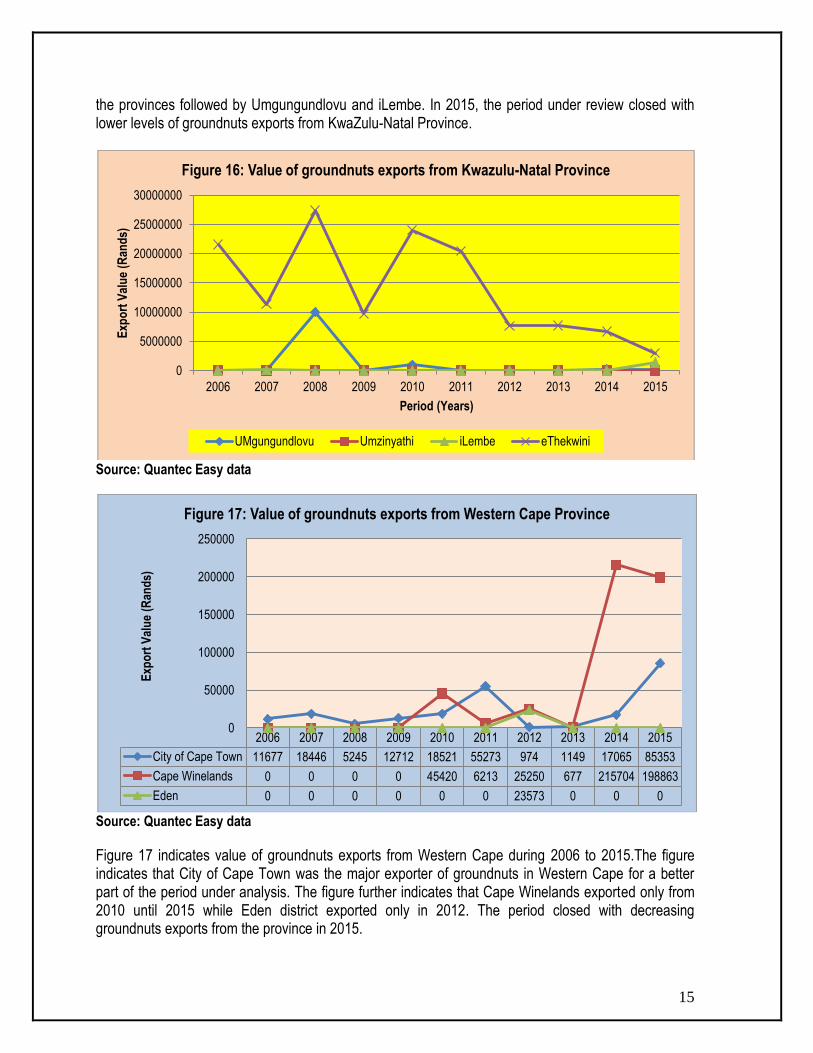
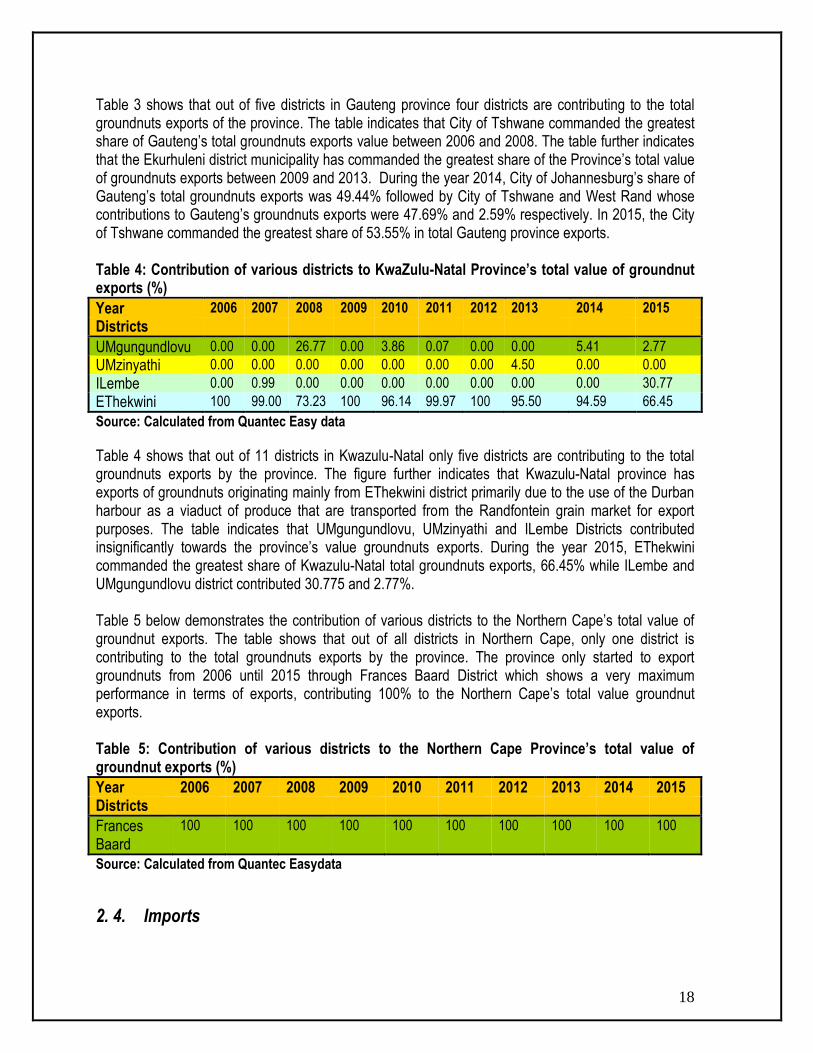
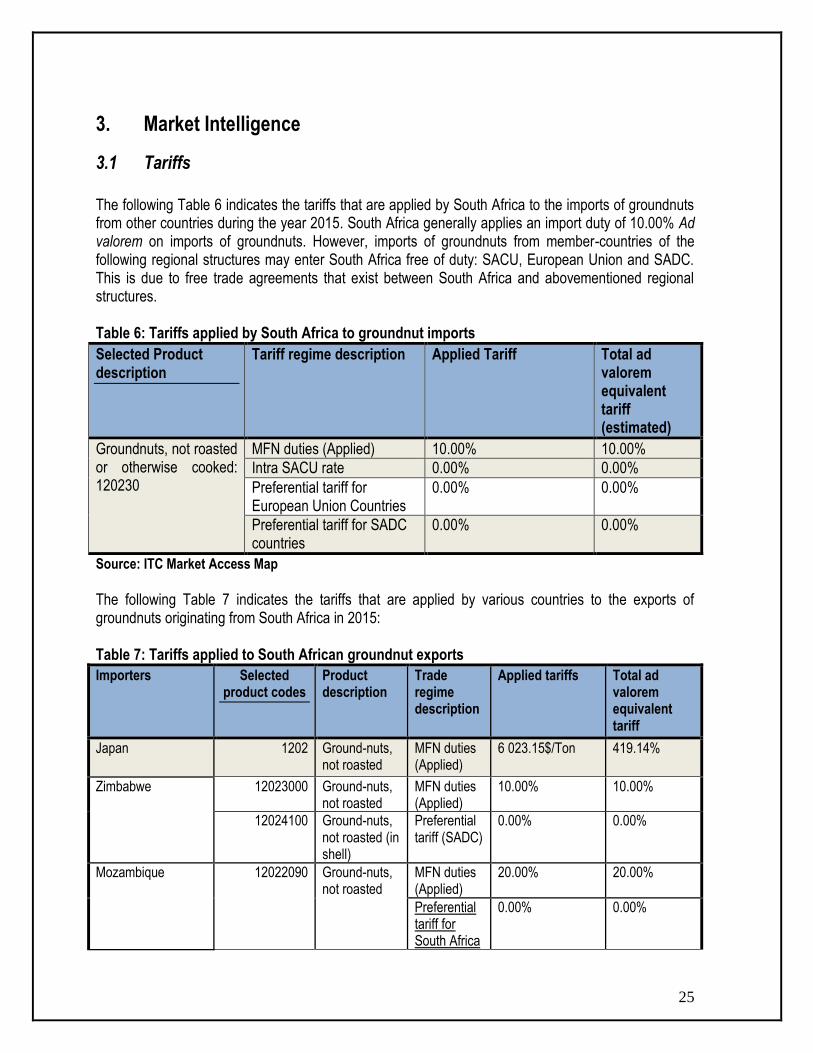
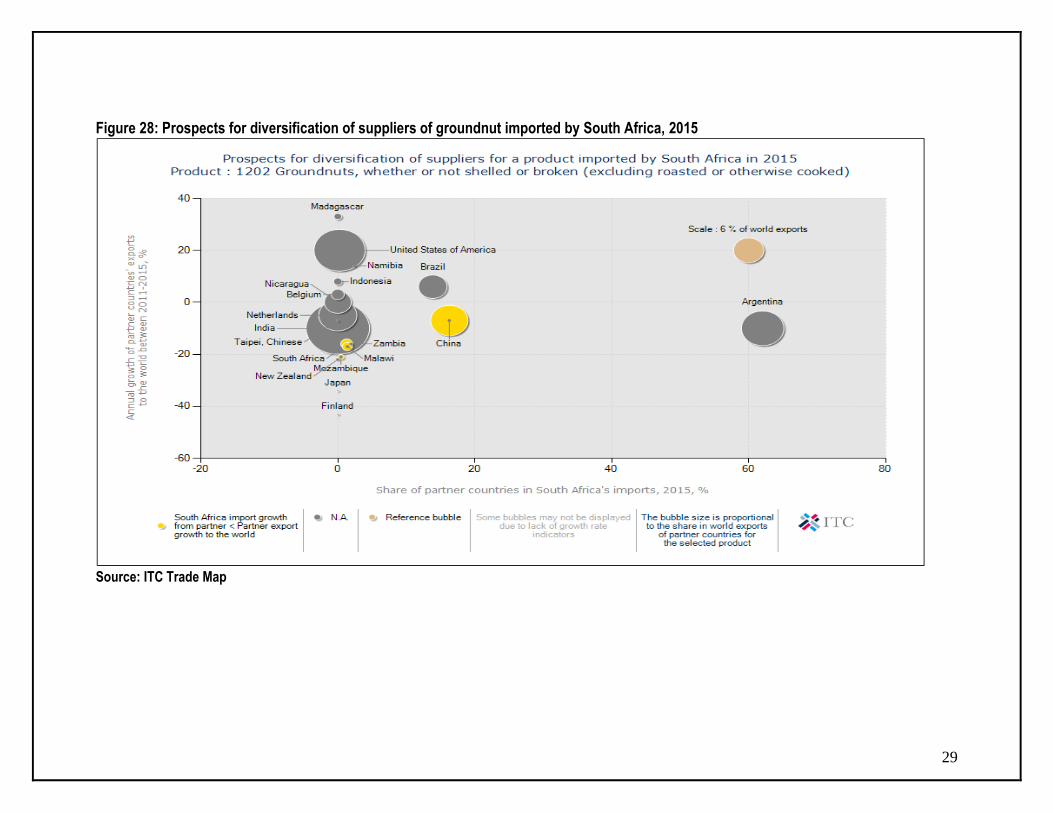
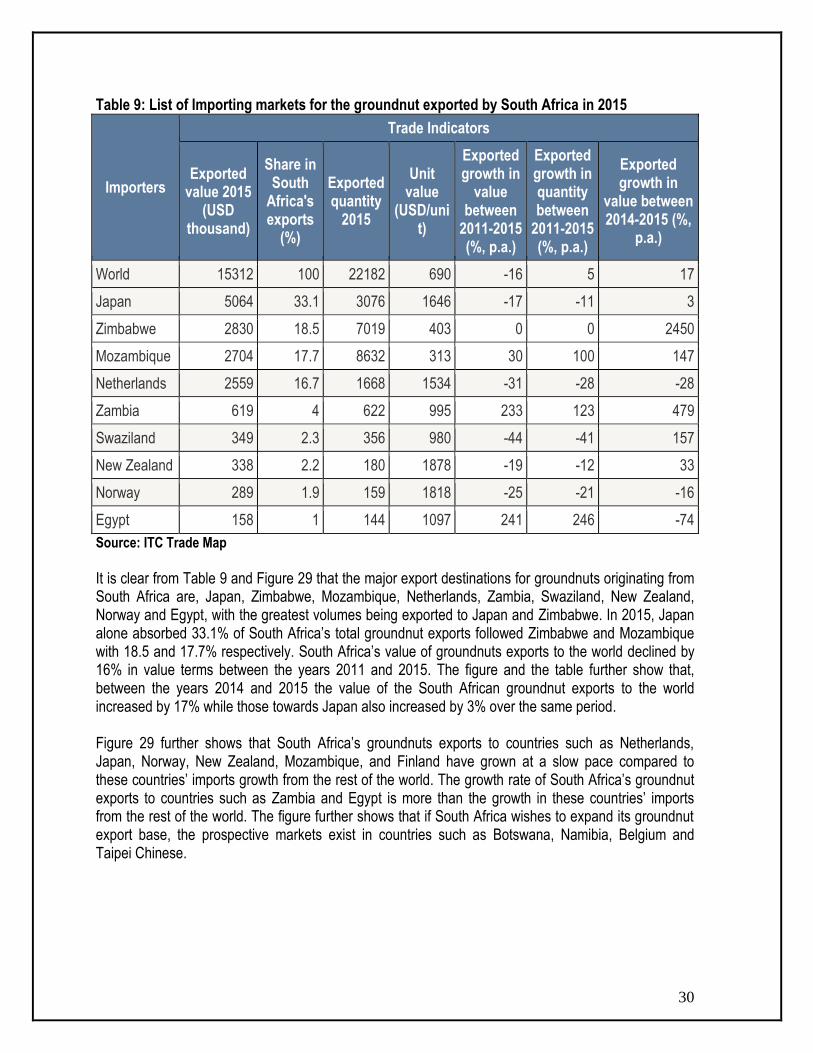