LETTUCE VALUE CHAIN PROFILE
37
A PROFILE OF THE SOUTH AFRICAN CUCUMBER MARKET VALUE CHAIN 2020 Directorate Marketing Tel: 012 319 8455 Private Bag X 15 Fax: 012 319 8131 Arcadia E-mail:[email protected] 0007 www.dalrrd.gov.za
Transcript of LETTUCE VALUE CHAIN PROFILE

A PROFILE OF THE SOUTH AFRICAN CUCUMBER MARKET VALUE CHAIN
2020
Directorate Marketing Tel: 012 319 8455 Private Bag X 15 Fax: 012 319 8131 Arcadia E-mail:[email protected] 0007 www.dalrrd.gov.za

2
TABLE OF CONTENT 1. DESCRIPTION OF THE INDUSTRY 3
1.1 Production areas 4
1.3 Production vs. Consumption of cucumber 5
2.1 Domestic markets and prices 6
2.2 South Africa’s Cucumber Exports 7
2.3 Share analysis 18
2.4 Cucumber imports by South Africa 23
2.5 Cucumber processing 26
3. MARKET INTELLIGENCE 29
3.1 Tariffs 29
3.2 Non tariff barriers 31
3.3 Asian Market Access 33
4. GENERAL DISTRIBUTION CHANNELS 33
5. LOGISTICAL ISSUES 33
5.1 Mode of transport 33
5.2 Cold chain management 34
5.3 Packaging 34
5.4 Storage and Conditioning for cucumber 34
6. COMPETITIVENESS OF SOUTH AFRICAN CUCUMBER EXPORTS 34
7. ACKNOWLEDGEMENTS 37
3
1. DESCRIPTION OF THE INDUSTRY
The cucumber (Cucumis sativus) is a widely cultivated plant in the family Cucurbitaceae. Cucumbers originated in India between the Bay of Bengal and the Himalayas. Some sources claim that cucumber origins are from tropical Africa and Egypt, where they are thought to have been used by people for many generations. There are three main varieties of cucumber that is slicing, pickling and burples. They have been in cultivation for some 3,000 years, maybe being one of our oldest crops. China is the world’s number one producer of cucumber. Though cucumber technically is a fruit, cucumbers are widely considered vegetables. Cucumbers are 90-95 percent water and have limited nutritional value compared to other vegetables. Much like tomatoes and squash, however, their sour-bitter flavour contributes to cucumbers being perceived, prepared and eaten as vegetables and there is no conflict in classifying cucumber as both a fruit and a vegetable. Cucumbers are high in potassium and fibre with moderate amounts of Vitamins A and C, as well as folic acid, phosphorous, and magnesium. Although they can be cooked, cucumbers are most often eaten raw in salads, in cold soups and cucumber based sauces. With so many health benefits, cucumber has become one of the most important parts of food as well as skin diets.
Source: Statistics and Economic Analysis, DALRRD
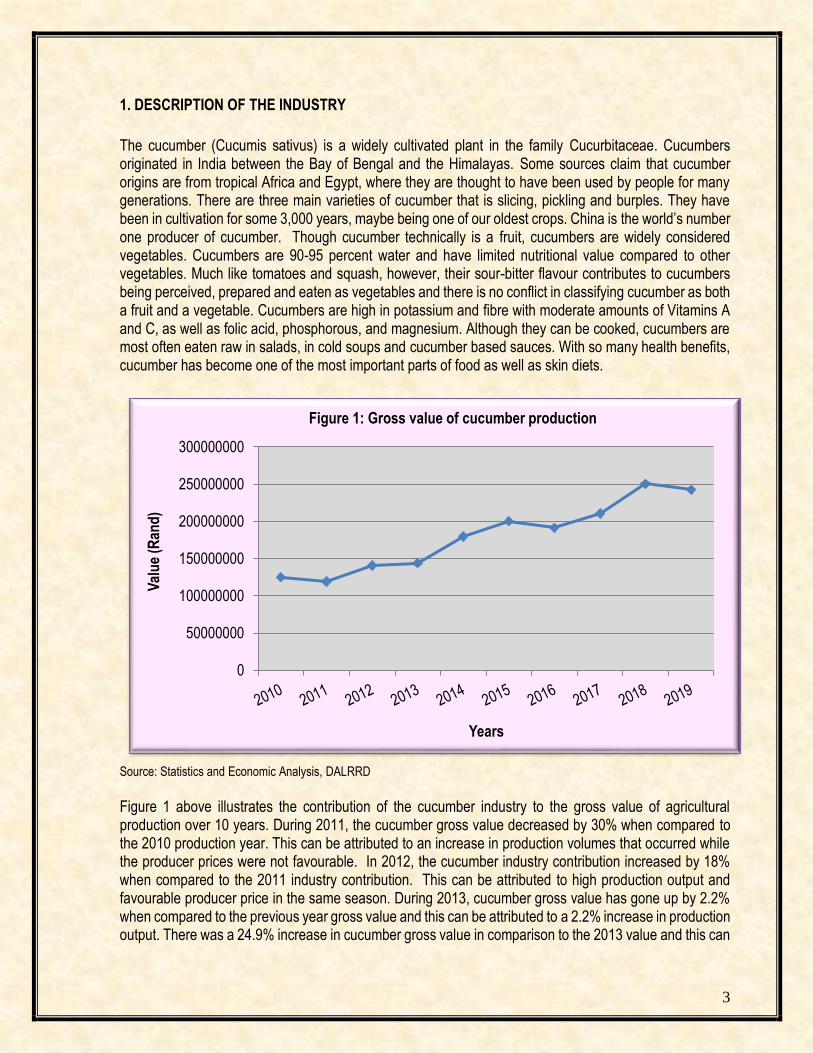
Figure 1 above illustrates the contribution of the cucumber industry to the gross value of agricultural production over 10 years. During 2011, the cucumber gross value decreased by 30% when compared to the 2010 production year. This can be attributed to an increase in production volumes that occurred while the producer prices were not favourable. In 2012, the cucumber industry contribution increased by 18% when compared to the 2011 industry contribution. This can be attributed to high production output and favourable producer price in the same season. During 2013, cucumber gross value has gone up by 2.2% when compared to the previous year gross value and this can be attributed to a 2.2% increase in production output. There was a 24.9% increase in cucumber gross value in comparison to the 2013 value and this can
0
50000000
100000000
150000000
200000000
250000000
300000000
Val
ue
(Ran
d)
Years
Figure 1: Gross value of cucumber production

4
be attested to an 8% increase in production output. In 2015, the cucumber gross value has slightly increased by 11.4%, when compared to the 2014 gross value and this can be attributed to a 12.4% increment in production output. Cucumber gross value decreased by 4.3% in 2016 when compared to 2015 value and this can be ascribed to a 3.8% decrement in the production output. During 2017, cucumber gross value has experienced a 9.8% increment relative to the 2016 gross value and this can be ascribed to 2.9% growth in the production output. As of 2018, cucumber gross value has increased by 18.9% relative to 2017 value and this can be attributed to higher producer prices that occurred in the same year. In 2019, cucumber gross value declined slightly and this can be ascribed to high production which occurred while the prices were unfavourable.
1.1 Production areas
Cucumbers are produced in almost all the provinces of South Africa, as they can also be produced under controlled environment. However, the cucumber production is more concentrated in Western Cape, Eastern Cape, Free State and KwaZulu Natal Provinces. Globally, China is still the world’s largest producer for cucumber, followed by Turkey, Iran, the Russian Federation, Ukraine, Spain and the United States of America. In Africa, Egypt remains among the largest producers of cucumbers and gherkins in the world.
1.2 Production trends
Figure 2 below illustrates the production volumes of cucumber over the past ten years.
Source: Statistics and Economic Analysis, DALRRD
In 2010, the production volume was just above 21 134 tons and it was a record low production volume in ten years. The increase in production output during 2011 was 15% when compared to the previous year. High production can be attributed to increasing consumer demand and favourable climatic conditions. In 2012, production output dropped slightly by 4.2% and during 2013, the output has gone up by 2.2% when compared to the previous year production output. During 2014, cucumber production output has slightly
0
5000
10000
15000
20000
25000
30000
35000
Ton
s
Year
Figure 2: Total production of cucumber

5
increased by 8% in comparison to the previous year production output. A record high production volume was recorded in 2015, and this represents a 12.4% increase in production output in comparison to 2014 output. In 2016, cucumber production output experienced a 3.8% decrement in comparison to 2015 production. There was a slight increase of 2.9% in cucumber production output relative to 2016 production output. As of 2018, South Africa’s cucumber production declined by 6.3% relative to 2017 production output. During 2019, South Africa’s cucumber production grew by 8.5% in comparison to the previous year (2018) output.
1.3 Production vs. Consumption of cucumber
Figure 3 below depicts the local consumption of cucumber compared to the production over 10 years. The figure indicates that the production of cucumber has been fairly higher compared to the consumption nationally over the decade. This indicates that in terms of cucumber production South Africa is self-sufficient and the surplus is exported. During 2019, South African average cucumber consumption is approximately 28 037 tons per annum. In 2019, fresh consumption increased by 8.6% compared to the previous year (2018). The decline in fresh consumption can be attributed to a 6.3% decrement in cucumbers production output in the same year.
Source: Statistics and Economic Analysis, DALRRD 2. MARKET STRUCTURE There is no regulation or restriction on the marketing of cucumber. The prices of cucumber are determined by the market forces of demand and supply. The industry uses fresh produce market, restaurants, processors, wholesalers and retailers as channels of marketing. Cucumbers are also exported to other countries through export agents and marketing companies. South Africa also imports cucumbers from other countries. Table 1 below indicates that in 2019, 73% of cucumbers produced were marketed through fresh produce markets. The remaining 27% is for cucumbers that were exported and cucumbers that were
0
5000
10000
15000
20000
25000
30000
35000
Ton
s
Year
Figure 3: Production vs Consumption
Production (Tons) Consumption (Tons)

6
processed. In 2019, there was a 28% decrement in volume exported and cucumbers that were processed increased by 8.3% when compared to 2018. The decrement in export volumes can be attributed to a notable increase in cucumber processed and an 8.6% increment in sales at the fresh produce markets.
2.1 Domestic markets and prices
The various channels through which cucumbers are marketed are presented in Table 1. Table 1: Cucumber sold through different market channels
Years National Fresh Produce
Markets (tons)
Exports (tons) Processing (tons)
2010 14 778 1 191 1449
2011 17 151 2 076 1 521
2012 15 913 1 122 4 773
2013 16 653 1 221 1 574
2014 18 209 1 364 1 440
2015 20 302 1 732 1 908
2016 19 833 1 894 1 438
2017 20 727 1 678 1 109
2018 19 549 2 155 819
2019 21 241 1 545 887
Source: Statistics and Economic Analysis, DALRRD *Cucumber export data was adjusted from 2010 to reflect SACU export data.
Figure 4 below illustrates South Africa’s cucumbers sold at major fresh produce markets from 2010 to 2019.
Source: Statistics and Economic Analysis, DALRRD
0
2000
4000
6000
8000
10000
12000
0
5000
10000
15000
20000
25000
30000
Ran
d/t
on
Ton
s
Years
Figure 4: Cucumber sold at major fresh produce markets
Volume(tons) Price (Rand/ton)

7
Figure 4 above illustrates the sales of cucumbers in the fresh produce markets over 10 years. In 2010, cucumber supplied at the markets were just above 14 778 tons. During 2011, and the market price fell by 18% when compared to the 2010 production year. As of 2012, market price increased by 28.5% when compared to the 2011 market price and this can be attributed to a 7.2% drop in volumes supplied across the market. In 2013, cucumber volumes increased by 4.5% and as a result, the price fell by 2.8% when compared to the 2012 season. There was a 44% increase in cucumber supplied at the market during 2014 and as a result, the market price has dropped by 3.3% in comparison to the previous year. In 2015, the cucumber price has dropped by 15.5%, which can be attributed to a notable increase of 18% at cucumber supplied at the market. There was a 2.3% decline in cucumber volume supplied in the markets during 2016. At the same time, the market price slightly dropped by 0.9% and this can be ascribed to poor cucumber uptake. In 2017, cucumber market price eased slightly higher by 4.54% despite a 4.5% increment in the cucumber supplied at the market and this can be ascribed to strong demand of cucumber in the same season. As of 2018, there was a 5.7% decline in cucumber supplied at the fresh produce markets and this has resulted in a 20% increment in the cucumber price in the same season. There was a slight decline of 0.3% in market price relative to 2018 prices and this can be attested to an 8.6% increment in cucumber volume supplied at the market.
2.2 South Africa’s Cucumber Exports In 2019, South Africa's cucumber exports still represent 0.1% of world exports for this product and its ranking in world cucumber exports were 41. South Africa has lost its competitiveness in cucumber export, due to a notable decline in export volume. In 2018, South Africa cucumber export was ranked 39 in world cucumber exports. During 2019, South African cucumber exports left in ship stores and the bunker was still insignificant. As of 2019, Botswana, Namibia, Lesotho, Eswatini and Mozambique, have remained the primary export markets for cucumber originating from South Africa. Globally Spain, Mexico, Netherlands, Canada, the United States of America, China, Belgium and Turkey were major cucumber exporters in 2019. Figure 5 below illustrates South African cucumber export destinations in 2019.
Source ITC Trade Map
0 10 20 30 40 50 60
Botswana
Lesotho
Namibia
Eswatini
Mozambique
Malawi
Zambia
Nigeria
Others
Co
un
trie
s
Figure 5: South Africa's cucumber export destinations in 2019
Share in South Africa's exports (%)

8
Table 2 indicates that Botswana has commanded the greatest share of 54.5%, followed by Lesotho with 15.2%, Namibia 11.5% and Eswatini with 11.4% share of South Africa cucumber exports. South Africa’s cucumber exports to Botswana have increased by 17% in value and 9% in quantity during the 2015 – 2019 period. During 2019, South African cucumber export to Namibia has decreased by 20% in terms of value and has decreased by 22% in quantity during the 2015 – 2019 period. South African cucumber exports to Eswatini grew by 20% in value and 6% in quantity between 2015 and 2019. South African cucumber exports to Lesotho have gone up by 16% and 9% in terms of value and quantity respectively between 2015 and 2019. Table 2: South African cucumber exports in 2019
Importers
Value exported in 2019 (USD thousand)
Trade balance 2019 (USD thousand)
Share in South Africa's exports (%)
The quantity exported in 2019 (tons)
Growth in exported value between 2015-2019 (%, p.a.)
Growth in exported quantity between 2015-2019 (%, p.a.)
Growth in exported value between 2018-2019 (%, p.a.)
World 1732 1696 100 1546 5 -1 -21
Botswana 944 944 54.5 817 17 8 -8
Lesotho 263 263 15.2 207 16 9 -4
Namibia 200 169 11.5 154 -20 -22 -59
Eswatini 198 198 11.4 236 20 6 -16
Mozambique 85 85 4.9 97 -1 -3 -3
Malawi 15 15 0.9 11 10 4 -10
Zambia 11 11 0.6 11 -17 -19 45
Nigeria 11 11 0.6 8 441 42
Angola 2 2 0.1 2 -35 -36 -93 Source ITC Trade Map
Figure 6 below illustrates cucumber exports from South Africa over the past ten years. The volume of cucumber exports has been fluctuating over the years. During 2010, cucumber exports were just above 1190 tons. In 2011, cucumber export has substantially increased by 74%, which can be attested to a 15% increase in domestic production output and 2012, cucumber exports have gone down by 45.9% when compared to the 2011 exports. The decrease in exports during 2012 can be attributed to a 6.8% decline in cucumber production output in the same year. In 2013, export volume increased by 8.8% when compared to the previous year exported volumes. During 2014, cucumber export has gone up by 11.7%, which can be ascribed to 8% increase in the domestic production output. There was a notable increase of 27% in 2015 and this can be attributed to a 12.4% increment in domestic production output. During 2016, South Africa cucumber exports grew by 9.3%, in comparison to 2015 exports. There was an 11.4% decline in South Africa cucumber export relative to 2016 export, despite a 2.9% growth in domestic cucumber output. In 2009, 2012 to 2017, it was more profitable to export cucumber since higher values were recorded for volume exported. As of 2018, South Africa cucumber export grew by 28% relative to export and it was also more profitable to export cucumber. In 2019, South Africa’s cucumber export notably dropped by 28% and it was more profitable to export cucumber relative to 2018 exports.

9
Source: Quantec Easydata *Cucumber export data was adjusted from 2010 to reflect SACU export data.
Figure 7 below illustrates the South Africa’s cucumber exports to the regions. Africa region is the primary export market for cucumber export from South Africa. In 2010, high quantities of lettuce exports were not allocated to any region. Higher exports to African countries can be attributed to low export cost to the neighbouring countries and the high perishability nature of the product. Cucumber exports to the Oceania region were less significant. From 2010 to 2012, there were no cucumber exports to the European region. During 2012 and 2013, the African region continued to be the major market for cucumbers originating from South Africa and more than 94% of the cucumbers were exported to this region. As of 2012, the unallocated volume has increased by 30.5% when compared to the previous year and in 2013, unallocated exports dropped by 33%. In 2013, cucumber exports to the Asian region have significantly increased while exports to the Americas and Oceania regions were less significant. In 2014, the African region continued to be the primary export market for cucumber exports from South Africa. In the same year, unallocated exports and exports to Asia has significantly dropped when compared to 2013. There was a notable increase in exports destined for Africa region during 2015, export to Asia and Oceania region has also increased. During 2016, the Africa region remained the main recipient of cucumber exports originating from South Africa. In the same year, there was a notable increase in cucumber export to Oceania region and an unallocated export has notably increased. In 2017, the Africa region was still the primary market for cucumber export from South Africa however, the export volume eased lower by 11.5% relative to 2016 export volume. At the same time, cucumber exports destined for Oceania and Europe were insignificant, whilst unallocated volume was incomparably higher when compared to previous year (2016) exports. As of 2018, Africa region was still by far the main export market for South Africa’s cucumber exports, export to Oceania and unallocated exports were trivial. In 2019, Africa region has remained the primary export destination for cucumber exports originating from South Africa, exports recorded for the America region was trivial and unallocated exports declined by 53% relative to 2018 exports.
0
5000000
10000000
15000000
20000000
25000000
30000000
35000000
0
500
1000
1500
2000
2500
Ran
d
Ton
s
Years
Figure 6: Value of cucumber exports by South Africa
Volume (Tons) Value (Rand)

10
Source: Quantec Easydata
Figure 8 below illustrates the value of cucumber exports earned from the regions. As of 2010, unallocated cucumber exports have a high export value. During 2011, it was more profitable to export to Asia, while the unallocated exports had less export value. In the same year, it was also more profitable to export to African region when compared to the 2010 production year. During 2012, Cucumber exports to Asia fetched high values followed by unallocated exports and exports to African regions were less profitable. In 2013, it was more profitable to export cucumbers to Oceania followed by African region, and at the same time, it was less profitable to export cucumber to the Asian region. In 2014, Asia was by far the most profitable export market and exports to African region were less profitable. In 2015, it was still more profitable to export cucumbers to Asia region, followed by Africa region, while exports to Oceania were less profitable. During 2016, it was relatively more profitable to export cucumber to the Oceania region, while Africa remained the least profitable export market. It was slightly more profitable to export cucumber to African region relative to 2016 export value to the same region, unallocated cucumber exports have also fetched higher export values, whereas export destined to Oceania has less export value. As of 2018, Africa cucumber export value has increased by 38% relative to 2017 cucumber export value and unallocated export has also fetched a higher value. In 2019, it was more profitable to export cucumber to the African region relative to the 2018 export value.
2010 2011 2012 2013 2014 2015 2016 2017 2018 2019
Africa 1133921 2071110 1101221 1212859 1362969 1731345 1892552 1675662 2152668 1544272
Americas 0 0 10 50 0 0 0 0 0 20
Asia 35 261 25 3880 399 956 0 0 0 0
Europe 0 0 0 0 0 0 0 9 0 1
Oceania 6 0 0 114 0 173 500 189 1200 0
Antarctica 50 3 0 0 0 0 0 0 0 0
Not allocated 56544 4917 21166 4280 376 95 650 1704 1558 721
0
500000
1000000
1500000
2000000
2500000
Vo
lum
e (K
g)
Years
Figure 7 :South Africa 's cucumber export to the regions

11
Source: Quantec Easydata
Figure 9 below illustrates the value of cucumber exports by South Africa’s provinces from 2010 to 2019. In 2010, Western Cape, Gauteng and KwaZulu export were the primary exit point for cucumber exports from South Africa. At the same time, Limpopo province has recorded a less significant export value. The high export values for Natal can be attributed to the export exit points and the registered exporters located in the provinces. During 2011, the Free State province has recorded export value for the first time in ten years. In 2012, Gauteng and Western Cape provinces continued to lead in cucumber exports from South Africa and KwaZulu Natal export value has notably increased. In 2013, the export value from the Free State province has significantly increased. In the same year, in Western Cape, KwaZulu Natal and Mpumalanga, export values have considerably increased. North West province has recorded its export value in 2014 and this can be ascribed to increased cucumber export to neighbouring Botswana. In the same year, Eastern Cape and Northern Cape have also recorded their first export values, which were insignificant. During 2015, there was a significant increment in Gauteng, Mpumalanga, Free State, North West and Western Cape cucumber export values. High export values for Free State North West, Western Cape and Mpumalanga can be attributed to a notable increase in cucumber exports destined to the neighbouring countries. In 2016, Western Cape and Gauteng provinces remained the primary exit points for South Africa’s cucumber exports. At the same time, Free State, North West and Mpumalanga have significantly contributed to South Africa’s cucumber exports. During 2017, Gauteng was still the primary exit point for cucumber exports from South Africa, but the export value eased notably lower by 26.7% relative to the 2016 export value. In the same year, Eastern Cape, KwaZulu Natal, Limpopo and Mpumalanga export values have surged whereas Free State export share declined by 15.6%. As of 2018, Western Cape and Gauteng were still the primary exits for South Africa’s cucumber exports and the values for these provinces has increased notably by 46% and 31.7% respectively. At the same time, KwaZulu Natal export value has increased notably by 52%, Mpumalanga export value has gone up by 57%, Limpopo export value eased higher by 32.9%, whilst Free State and Eastern Cape export values have declined by 57% and 38%
2010 2011 2012 2013 2014 2015 2016 2017 2018 2019
Africa 10045574 9625574 11546290 13780005 17760640 20567261 22534203 20839000 28774375 24968608
Americas 0 0 294 75 0 0 0 0 0 850
Asia 529 5705 908 709 12595 46868 0 0 0 0
Europe 0 0 0 0 0 0 0 543 0 55
Oceania 74 0 0 3220 0 1134 32872 1990 3000 0
Artantica 1064 80 0 0 0 0 0 0 0 0
Not allocated 1091829 49180 83791 47410 2196 1568 20824 31705 19676 13104
0
5000000
10000000
15000000
20000000
25000000
30000000
35000000
Val
ue
(Ran
d)
Years
Figure 8: Value of cucumber export to the regions

12
respectively. During 2019, Gauteng and Western Cape were still primary exit points for South Africa’s cucumber exports. In the same year, Free State and Mpumalanga export values have increased by 54% and 59% when compared to 2018 export values. The following figures (Figure 10 -15) show the value of cucumber exports from the various districts in all provinces of South Africa.
Source: Quantec Easydata
Figure 10 below illustrates that cucumber exports from Western Cape Province were mainly from the City of Cape Town district municipality. Cape Town harbour serves as an export exit point. In 2011, export value for the City of Cape Town has decreased by 11% when compared to 2010 export values. During 2012, the City of Cape Town continued to be a major contributor to cucumber exports from Western Cape province and the export value has increased by 7.4% when compared to 2011 export value. In 2013, City of Cape Town and Cape Winelands district municipalities have notably increased their cucumber export values. During 2014, the Cape Winelands has contributed notably to Western Cape cucumber exports and Cape Winelands cucumber export value grew by 16.4% relative to 2013 export value. In 2015, City of Cape Town has recorded a higher value, Eden export value has recorded a trivial value, while Cape Winelands export value has notably dropped in comparison to the 2014 value. During 2016, City of Cape Town has remained the primary exit point of cucumber export from Western Cape province and Cape Winelands has notably increased its cucumber export value in comparison to 2015 values. As of the 2017 season, City of Cape Town export value grew slightly by 3%, Cape Winelands export value increased notably by 50%, whilst Eden has recorded a zero value. As of 2018, City of Cape Town was still by far the primary exit point for cucumber export from Western Cape province, and the export value has sharply increased by 46% and Cape Winelands export value was incomparably higher relative to the previous year (2017) export value. In 2019, City of Cape Town cucumber export value drastically dropped by 27% and Cape Winelands export value declined by 19.7% in comparison to the 2018 export value.
2010 2011 2012 2013 2014 2015 2016 2017 2018 2019
Western Cape 748065 542264 584905 984551 7351571 8047874 8111111 8255040 12132617 8833872
Eastern Cape 0 0 0 0 120 96 91 4398 2704 1200
Northern Cape 0 0 0 0 1828 937 0 0 0 0
Free State 0 15556 9550 35528 279801 383186 366560 309243 129935 207239
KwaZulu-Natal 799352 49433 61898 56230 64276 34399 36275 73282 34888 54027
North West 0 0 0 0 64065 70180 992512 1069542 1287195 130435
Gauteng 9583015 9051345 10951117 12720008 9967640 11940713 12599892 9229618 12162296 12739488
Mpumalanga 0 0 1054 20379 42800 133127 478223 1929417 3043830 3014418
Limpopo 8638 21941 22759 14723 3330 6319 1879 2698 3586 1938
0
2000000
4000000
6000000
8000000
10000000
12000000
14000000
Val
ue
(Ran
d)
Years
Figure 9: Value of cucumber export by SA Provinces

13
Source: Quantec Easydata
Figure 11 below indicates that cucumber exports from Gauteng province were mainly from the City of Johannesburg. City of Tshwane and Ekurhuleni district municipalities have contributed to a lesser extent. As of 2011, the export value for the City of Johannesburg and Ekurhuleni have decreased while export value the City of Tshwane has increased. OR Tambo International Airport serves as an export exit point for cucumber from these municipalities. During 2013, City of Johannesburg remained the main contributor to cucumber exports from Gauteng province and the highest export value was recorded in the same year. At the same time, Ekurhuleni and City of Tshwane have considerably increased their export values. The West Rand district has significantly contributed to Gauteng cucumber exports in 2014. In the same year, City of Johannesburg export value has drastically dropped, while Ekurhuleni and City of Tshwane have notably increased. During 2015, City of Johannesburg, West Rand and City of Tshwane export values have notably increased while Ekurhuleni export value has dropped in comparison to 2014 values. In 2016, City of Johannesburg has continued to lead in Gauteng cucumber exports, and City of Tshwane has notably increased its cucumber export value. At the same time, Ekurhuleni and West Rand export values have slightly dropped, while Sedibeng recorded an insignificant export value. During 2017, City of Johannesburg was still the preferred exit point for Gauteng cucumber export but the export value has significantly dropped by 46%, West Rand export value has also drastically declined by 99%, City of Tshwane export value has slightly decreased by 1% whilst Ekurhuleni export value has experienced a notable increment of 62% relative to 2016 export value. As of 2018, City of Johannesburg, City of Tshwane and Ekurhuleni were still the primary exits points for Gauteng provincial cucumber export. At the same time, there was also a notable increase of 36.5% recorded for West Rand district municipality. In 2019, City of Tshwane cucumber export value increased by 24.9%, Ekurhuleni export value grew by 1.7%, whereas City of Johannesburg export value has dropped by 6.8% relative to 2018 export values.
2010 2011 2012 2013 2014 2015 2016 2017 2018 2019
City of Cape Town 4099616 3639361 3907989 4607619 6808884 7936392 7961469 8202799 12018413 8746664
West Coast 154 0 0 269 0 0 0 0 0 0
Cape Winelands 29581 40344 24205 34078 39667 30073 34694 52241 131257 86590
Eden 0 0 0 0 0 608 0 0 0 618
0
2000000
4000000
6000000
8000000
10000000
12000000
14000000
Val
ue
(Ran
d)
Years
Figure 10 : Value of cucumber exports by Western Cape

14
Source: Quantec Easydata
Figure 12 below illustrates that cucumber exports from the KwaZulu Natal province were mainly from the Ethekwini district municipality. During 2011, cucumber export value for KwaZulu Natal has drastically dropped when compared to the previous year. In 2012, export value for Ethekwini increased by 20% in comparison to the 2011 export value and Umgungundlovu has recorded a trivial export value. In 2013, Ugu district municipality has recorded cucumber export value for the first time in 10 years. At the same time, Ethekwini export value has gone down by 23% compared to the 2012 export value. Ugu and Ethekwini district have increased their cucumber export values during 2014. At the same time, ILembe has contributed for the first time to KwaZulu Natal export. In 2015, KwaZulu Natal cucumber was exported solely through the Ethekwini district and the export value has slightly dropped by 28% when compared to the 2014 value. During 2016, Ethekwini was still the primary exit point of KwaZulu Natal cucumber export and the export value has slightly increased by 5.4% when compared to the 2015 export value. The high exports by Ethekwini can be attributed to Durban Harbour that serves as an export exit point. Ethekwini cucumber export share has surged in 2017, in comparison to 2016 export value and this can be attested to 44% increment in the value of export destined to neighbouring Eswatini. In the same year, Zululand has contributed for the first time to KwaZulu Natal export value however, the export was significant. As of 2018, Ethekwini cucumber export value has gone down by 55.9% relative to 2017 export value and Zululand has also recorded a notable export value. In 2019, Zululand cucumber export value has surged whilst Ethekwini export value has dropped by 18.9% relative to the 2018 export value.
2010 2011 2012 2013 2014 2015 2016 2017 2018 2019
Sedibeng 0 0 0 0 0 0 1395 0 0 0
West Rand 0 0 58 0 236494 446592 396860 1175 1604 899
Ekurhuleni 168638 97884 180272 388813 1920887 1909617 1376480 2235114 3100600 3154156
City of Johannesburg 9226898 8720877 1046989012014144 5448701 7060012 8181147 4397288 5464569 5091171
City of Tshwane 187479 232584 300897 317051 2363496 2524493 2644010 2596041 3595523 4493262
0
2000000
4000000
6000000
8000000
10000000
12000000
14000000
Val
ue
(Ran
d)
Years
Figure 11 :Value of cucumber exports by Gauteng Province

15
Source: Quantec Easydata
Figure 13 below shows that Mpumalanga province has recorded zero trade in cucumber during 2010 and 2011. During 2012, Mpumalanga province exported cucumber through Ehlanzeni but the export value was less significant. In 2013, Ehlanzeni export value has notably increased and this can be attributed to an increase in cucumber exported to neighbouring Swaziland. During 2014, Gert Sibande has contributed to Mpumalanga cucumber export value for the first time in 10 years. At the same time, export value for Ehlanzeni has increased by 56% in comparison to 2013 export value. In 2015, Mpumalanga cucumber export value has notably increased and this can be attributed to an increase in exports destined to neighbouring Swaziland. During 2016, Nkangala has significantly contributed to Mpumalanga cucumber export values; Ehlanzeni export value improved by 12.7%, whereas Gert Sibande export has drastically dropped. High cucumber export value by Mpumalanga province can be attributed to a notable increase in cucumber export to neighbouring Mozambique and Swaziland. In 2017, Nkangala and Ehlanzeni cucumber export values were incomparably higher relative to 2016 export value and this can be attributed to a 28% increment in value of export destined for neighbouring Mozambique. As of 2018, Nkangala has remained as a primary exit point of Mpumalanga cucumber export and the export value was 53.9% more relative to 2017 export value. At the same time, Ehlanzeni export value has drastically increased by 117% whilst Gert Sibande export value declined by 42% in comparison to the previous year (2017). In 2019, Nkangala district was still by far the main contributor to cucumber export however, the export value decreased by 4.9%. At the same time, Ehlanzeni export value grew notably by 41% in comparison to 2018 value.
2010 2011 2012 2013 2014 2015 2016 2017 2018 2019
Ugu 0 0 0 8820 12245 0 0 0 0 0
UMgungundlovu 0 0 548 0 0 0 0 0 0 0
Zululand 0 0 0 0 0 0 0 721 2910 28112
Uthungulu 0 0 0 1008 0 0 0 0 0 0
Ilembe 463 0 0 0 4004 0 0 0 0 0
Ethekwini 1040590 50028 68931 57621 13101 34399 36272 72561 31978 25915
0
200000
400000
600000
800000
1000000
1200000V
alu
e (R
and
)
Years
Figure 12 : Value of cucumber exports by KwaZulu-Natal Province

16
Source: Quantec Easydata
Figure 14 illustrate the value of cucumber exports by Limpopo Province.
Source: Quantec Easydata
Figure 14 above illustrates that in 2011, the value of cucumber exports for Vhembe and Capricorn districts have increased notably when compared to exports value recorded in 2010. During 2012, Limpopo cucumber was exported through Vhembe and Greater Sekhukhune district. Export value for Vhembe exports has increased 26.6%, while Greater Sekhukhune export value was insignificant. In 2013, Limpopo
2010 2011 2012 2013 2014 2015 2016 2017 2018 2019
Gert Sibande 0 0 0 0 2812 48152 2153 2725 1578 3115
Nkangala 0 0 0 0 0 0 380576 1806540 2781365 2643635
Ehlanzeni 0 0 1054 20379 14414 84975 95816 120152 260887 367668
0
500000
1000000
1500000
2000000
2500000
3000000V
alu
e (R
and
)
Years
Figure 13 :Value of cucumber exports by Mpumalanga Province
2010 2011 2012 2013 2014 2015 2016 2017 2018 2019
Mopani 139501 24632 0 0 376 1203 929 216 0 493
Vhembe 5972 17563 22418 14723 2585 0 0 0 0 0
Capricorn 10797 6442 6181 228 848 4313 950 1152 2028 305
Waterberg 0 0 0 0 976 803 0 1330 1558 1140
Greater Sekhukhune 0 58 658 0 0 0 0 0 0 0
0
20000
40000
60000
80000
100000
120000
140000
160000
Val
ue
(Ran
d)
Years
Figure 14: Value of cucumber exports by Limpopo Province

17
province exported cucumbers through the Vhembe district and the export value has notably dropped when compared to the 2012 export value. During 2014, Waterberg contributed for the first time to Limpopo cucumber exports, but the value was insignificant. At the same time, Vhembe cucumber exports have drastically dropped. In 2015, Limpopo cucumber was exported through Capricorn, Waterberg and Mopani districts. During 2016, Mopani and Capricorn districts have recorded insignificant export values. As of 2017, Limpopo cucumbers were exported through Waterberg, Capricorn and Mopani but the cucumber export values recorded were less significant. During 2018, Limpopo cucumber was exported through Capricorn and Waterberg districts and the export values have increased by 76% and 17% respectively. In 2019, Limpopo cucumbers were exported through Waterberg, Capricorn and Mopani, however, the export values recorded were less significant.
Source: Quantec Easydata
Figure 15 above illustrates the value of cucumber exports by Free State province. The province has recorded its first cucumber export in 2011 through Thabo Mofutsanyane district municipality. In 2012, Free State exports were exported through Xhariep and in the following year exports were recorded for Fezile Dabi. During 2014, Free State province has exported cucumber through Thabo Mofutsanyane, Mangaung, Xhariep, Lejweleputswa and Fezile Dabi. The overall Free State cucumber exports went up and this can be ascribed to cucumbers exported to neighbouring Lesotho. During 2015, Thabo Mofutsanyane export value has drastically increased and at the same time Xhariep, Lejweleputswa and Mangaung export values have also increased in comparison to the previous year export values. In 2016, Thabo Mofutsanyane was still the main exit point for Free State cucumber exports however, the export value has dropped by 13.6%. In the same year, Lejweleputswa and Fezile Dabi cucumber export values have significantly increased. The overall increase in Free State cucumber export value can be ascribed to an 18% increase in cucumber export destined to neighbouring Lesotho. As of 2017, Lejweleputswa export value was still by far the preferred exit point for cucumber export from Free State however, the export value has notably dropped by 19.7%, Lejweleputswa export value grew by 20.8%, Mangaung export value has surged by 70%,
2010 2011 2012 2013 2014 2015 2016 2017 2018 2019
Xhariep 0 0 9550 33728 20046 28435 5173 8155 10530 17200
Lejweleputswa 0 0 0 0 9182 36683 58441 70624 57809 41918
Thabo Mofutsanyane 0 15556 0 0 73004 309315 266991 214268 46910 144220
Fezile Dabi 0 0 0 1800 6760 0 26435 0 0 0
Mangaung 0 0 0 0 2336 8753 9522 16196 14686 3901
0
50000
100000
150000
200000
250000
300000
350000
Val
ue
(Ran
d)
Years
Figure 15 :Value cucumber exports from Free State Province

18
Xhariep export value increased by 57.7% whilst Fezile Dabi has recorded zero trade for cucumber. As of 2018, Xhariep export value grew by 29% whereas Lejweleputswa, Thabo Mofutsanyane and Fezile Dabi export values have decreased by 18.1%, 78% and 9.3% respectively. In 2019, Thabo Mofutsanyane and Xhariep export values were incomparably higher relative to the previous year (2018) export values. At the same time, Lejweleputswa and Mangaung have experienced a notable drop in the cucumber export values.
Figure 16 below illustrates the value of cucumber exports by North West province
Source: Quantec Easydata
Figure 16 above illustrates cucumber exports from the North West province. In 2011, North West exports were exported mainly through Bojanala and in the following year exports were recorded for North West province were trivial. In 2014 and 2015 , North West province has exported cucumber solely through Bojanala district . As of 2016 and 2017, North West cucumber exports have surged relative to the previous years. In the same year, Ngaka Modiri Molema and Dr Keneth Kaunda district have recorded trivial export values. During 2018, North West cucumber exports value was incomparably higher relative to 2017 export values and this can be ascribed to a 35% increase in cucumber export value destined to Botswana. In 2019, Ngaka Moiri Molema district cucumber export value surged and Bojanala export value grew notably by 19.7% relative to 2018 export value.
2.3 Share analysis
Table 3 below is an illustration of the provincial share of national cucumber exports. Gauteng commanded the greatest share of South Africa’s cucumber exports and Western Cape has contributed to a lesser extent. In 2012, Gauteng has recorded a 94.15% share of South Africa cucumber exports. During 2013, Gauteng continued to lead in cucumber exports and it has commanded a 91.96% export share. At the same time, Western Cape has increased its export share to 7.12% when compared to 5.03% in 2012. KwaZulu Natal, Free State and Mpumalanga have increased their export share during 2013 but the export shares were insignificant. The high export shares in the Western Cape and Gauteng can be attributed to registered exporters and available ports based in this province. During 2014, Gauteng export share has drastically
2009 2010 2011 2012 2013 2014 2015 2016 2017 2018
Bojanala 0 14780 60310 132 0 15142 70180 989566 1064635 1274960
Ngaka Modiri Molema 0 272031 0 0 76 0 0 2860 4335 12235
Dr Kenneth Kaunda 0 0 0 0 0 0 0 0 572 0
0
200000
400000
600000
800000
1000000
1200000
1400000
Val
ue
(Ran
d)
Year
Figure 16: Value of North West cucumber export

19
dropped to 56.08%, while Western Cape has notably increased its export share to 41.36%. Gauteng and Western Cape provinces have continued to dominate South Africa’s cucumber export shares during 2015. In the same year, there was a slight increase in Free State and Mpumalanga cucumber export shares. In 2016, Gauteng has continued to lead in South Africa’s cucumber exports by commanding 55.78% share, followed by Western Cape with 35.91% share. North West has increased its export share to 4.39% and Mpumalanga’s share has gone up to 2.12%. During 2017, Gauteng cucumber export share has dropped further to 44.22%, Western Cape export share rose to 39.55%, Mpumalanga export share grew to 9.24% and North West export share has increased to 5.12% share. As of 2018, Gauteng has commanded 42.23% share of South Africa’s cucumber exports, Western Cape has registered 42.13%, Mpumalanga has recorded 10.57% whereas North West export share has declined to 4.47% relative to the 2017 share. In 2019, Gauteng was still the primary exit point for South Africa’s cucumber export and the export share grew to 50.99%, Western Cape has registered 35.36% share and Mpumalanga has commanded a 12.79% share of exports. Table 3: Share of provincial exports to the total of RSA cucumber exports (%)
Year
Provinces
2010 2011 2012 2013 2014 2015 2016 2017 2018 2019
Western Cape 6.73 5.60 5.03 7.12 41.36 39.04 35.91 39.55 42.13 35.36
Eastern Cape 0 0 0 0 0 0 0 0.02 0.01 0
Northern Cape 0 0 0 0 0.01 0 0 0 0 0
Free State 0 0.16 0.08 0.26 1.57 1.86 1.62 1.48 0 0.83
KwaZulu-Natal 7.18 0.51 0.53 0.41 0.36 0.17 0.16 0.35 0.12 0.20
North West 0 0 0 0 0.36 0.34 4.39 5.12 4.47 0.55
Gauteng 86.09 93.50 94.15 91.96 56.08 57.92 55.78 44.22 42.23 50.99
Mpumalanga 0 0 0.01 0.15 0.24 0.65 2.12 9.24 10.57 12.79
Limpopo 0.08 0.23 0.20 0.11 0.02 0.03 0.01 0.01 0.01 0.01
South Africa 100 100 100 100 100 100 100 100 100 100
Source: Calculated from Quantec Easydata
Table 4: Share of district exports to the total Western Cape provincial cucumber exports (%)
Year
District
2010 2011 2012 2013 2014 2015 2016 2017 2018 2019
City of Cape Town 99.28 98.90 99.38 99.26 99.42 99.61 99.57 99.37 98.92 99.01
West Coast 0 0 0 0.01 0 0 0 0 0 0
Cape Winelands 0.72 1.10 0.62 0.73 0.58 0.38 0.43 0.63 1.08 0.98
Eden 0 0 0 0 0 0.01 0 0 0 0.01
Western Cape 100 100 100 100 100 100 100 100 100 100
Source: Calculated from Quantec Easydata
Table 4 above indicates that in 2010, City of Cape Town commanded a 99.28% share of cucumber exports from Western Cape Province. During 2011, City of Cape Town commanded a 98.90% share and Cape Winelands commanded 1.10% of Western Cape Province. In 2012, City of Cape Town continued to lead

20
in cucumber export and it has commanded 99.38%. During 2013, it has commanded 99.26%. Cape Town Harbour renders the exit point of cucumber exports During 2015, City of Cape Town continued to dominate in Western Cape cucumber export and it has recorded a 99.61% share. From 2016 to 2019, City of Cape Town was still the primary exit point for cucumber exports and the district has commended approximately 98% of Western Cape cucumber export share. Table 5: Share of district exports to the total Gauteng provincial cucumber exports (%)
Year
District
2010 2011 2012 2013 2014 2015 2016 2017 2018 2019
Sedibeng 0 0 0 0 0 0 0.01 0 0 0
West Rand 0 0 0 0 2.37 3.74 3.15 0.01 0.01 0.01
Ekurhuleni 1.76 1.08 1.65 3.06 19.26 15.99 10.92 24.22 25.49 24.76
City of Johannesburg 96.28 96.35 95.61 94.45 54.66 59.13 64.93 47.64 44.93 39.96
City of Tshwane 1.96 2.57 2.75 2.49 23.71 21.14 20.98 28.13 29.56 35.27
Gauteng 100 100 100 100 100 100 100 100 100 100
Source: Calculated from Quantec Easy data
Table 5 above, indicates that the City of Johannesburg commanded the most share of cucumber export by Gauteng Province. As of 2010, City of Johannesburg has commanded the greatest share of Gauteng cucumber export . In 2011, City of Johannesburg commanded the greatest share of 96.35% share and City of Tshwane commanded a 2.57% share of cucumber exports by Gauteng Province. In 2012, City of Johannesburg continued to lead in cucumber exports from Gauteng and it has commanded a 95.61% share. In the same year, the City of Tshwane’s export share has slightly increased to 2.75%. During 2013, Ekurhuleni has increased its export share to 3.06%, City of Johannesburg export shares have dropped when compared to the previous year export value. OR Tambo International Airport renders the exit point of cucumber exports from Gauteng Province. In 2014, City of Tshwane export share has increased to 23.71%, Ekurhuleni export share has gone up to 19.26%, while City of Johannesburg export share has gone down to 54.66%. During 2015, City of Johannesburg has continued to lead in Gauteng cucumber export by recording a 59.13% share and City of Tshwane export share has dropped slightly to 21.14%. At the same time, Ekurhuleni export share has dropped to 15.99%, whereas West Rand export share has increased to 3.74%. In 2016, City of Johannesburg has increased its export share to 64.93%, while City of Tshwane export share has dropped slightly to 20.98% and Ekurhuleni export share has declined to 10.92%. In the same year, Sedibeng has contributed for the first time to Gauteng cucumber export share however, the share was trivial. City of Johannesburg cucumber export share has dropped notably to 47.64% in 2017, Ekurhuleni has registered a notable gain in cucumber export share of 24.22% and City of Tshwane export share has increased to 28.13%. As of 2018, City of Johannesburg has commanded 44.93%, City of Tshwane has registered 29.56% and the Ekurhuleni export share has increased to 25.49%. In 2019, City of Johannesburg export share declined to 39.96%, City of Tshwane export share increased to 35.27% whereas Ekurhuleni export share dropped to 24.76% share.

21
Table 6: Share of district exports to the total KwaZulu-Natal provincial cucumber exports (%)
Year
District
2010 2011 2012 2013 2014 2015 2016 2017 2018 2019
Ugu 0 0 0 15.69 19.05 0 0 0 0 0
Zululand 0 0 0 0 0 0 0 0.99 8.34 52.03
Uthungulu 0 0 0 0 5.86 0 0 0 0 0
Ethekwini 100 100 100 84.31 80.95 100 100 99.01 91.66 47.96
KwaZulu Natal 100 100 100 100 100 100 100 100 100 100
Source: Calculated from Quantec Easy data
Table 6 shows that Ethekwini commanded a 100% share of cucumber exports from the KwaZulu Natal province from 2010 to 2012. The greatest share by Ethekwini can be attributed to Durban Harbour which renders an export exit point. In 2013, Ethekwini export share has gone down to 84.31%, while Ugu has commanded a 15.69% share of exports. Ethekwini export share has dropped further to 80.95% during 2014 while Ugu export share has increased to 19.05%. In 2015 and 2016, Ethekwini has commanded 100% share of KwaZulu Natal cucumber export. During 2017, Ethekwini export share dropped slightly to 99.01%, Zululand has commanded a cucumber export share for the first time in ten years, however, the export share was insignificant. As of 2018, Ethekwini has continued to command the highest share of 91.66% of Gauteng cucumber export share and Zululand export share has notably increased to 8.34% relative to the previous year (2017). During 2019, Ethekwini export share dropped notably to 47.96%, whilst Zululand export share surged to 52.03%. Table 7: Share of district exports to the total Mpumalanga provincial cucumber exports (%)
Year
District
2010 2011 2012 2013 2014 2015 2016 2017 2018 2019
Gert Sibande 100 100 0 0 25.59 36.17 0.45 0.14 0.05 0.10
Nkangala 0 0 0 0 0 0 79.51 93.63 91.38 87.70
Ehlanzeni 0 0 100 100 74.41 63.83 20.04 6.23 8.57 12.20
Mpumalanga 100 100 100 100 100 100 100 100 100 100
Source: Calculated from Quantec Easydata
Table 7 illustrates Mpumalanga provincial cucumber export share during ten years. From 2010 to 2011, Gert Sibande district has commanded a 100% share of cucumber exports from this province. During 2012 and 2013, Ehlanzeni commanded a 100% share of exports from Mpumalanga province. In 2014, Ehlanzeni export share has decreased from 100% to 74.41%, while Gert Sibande export share has gone up to 25.59% in comparison to 2013 shares. During 2015, Gert Sibande cucumber export share has increased to 36.17% and Ehlanzeni export share has dropped to 63.83%. In 2016, Nkangala commanded the greatest share of 79.51%, whilst Ehlanzeni export share dropped notably to 20.04% and Gert Sibande export share has gone down to 0.45%. As of 2017, Nkangala cucumber export value grew notably to 93.63% whilst Ehlanzeni export share eased lower from 20.04% to 6.23%. In 2018, Nkangala was still in the lead in Mpumalanga cucumber export share and it has commanded 91.38% and Ehlanzeni has registered an

22
8.57% share. During 2019, Nkangala export share declined to 87.70% and Ehlanzeni has commanded a 12.20% export share. Table 8: Share of district exports to the total Limpopo provincial cucumber exports (%)
Year
District
2010 2011 2012 2013 2014 2015 2016 2017 2018 2019
Mopani 69.11 79.59 97.11 100 77.63 0 49.44 8.01 0 25.44
Vhembe 30.89 20.14 0 0 0 68.25 0.00 0 0 0
Capricorn 0 0.26 0 0 22.37 12.71 50.56 42.70 56.55 15.74
Waterberg 0 0 2.89 0 0 0 0 49.30 43.45 58.82
Greater Sekhukhune 0 0 0 0 0 19.04 0 0 0 0
Limpopo 100 100 100 100 100 100 100 100 100 100
Source: Calculated from Quantec Easydata
Table 8 above illustrates that in 2010, the greatest share was commanded by Mopani district with 69.11%, followed by Vhembe district with 30.89%. In 2011, Vhembe commanded a 79.59% share and Capricorn commanded a 20.14 % share of Limpopo Provincial cucumber exports. During 2012, Vhembe continued to command a high export share and in 2013; Vhembe district commanded a 100% share of cucumber exports from Limpopo province. In 2014, Vhembe district export share has dropped from 100% to 77.63%, while Waterberg export share has commanded 23.37%. During 2015, Capricorn has recorded higher cucumber export share of 68.25%, followed by Mopani with a 19.04% share and Waterberg export share has dropped to 12.71%. In 2016, Capricorn district increased its cucumber export share to 49.44% and Capricorn cucumber export share has gone up to 50.56%. Waterberg cucumber export share grew sharply to 49.30% during 2017, Capricorn export share dropped to 42.70% whilst Mopani export share decreased sharply to 8%. As of 2018, Capricorn has commanded 56.55% and Waterberg has recorded 43.45% of Limpopo cucumber export share. In 2019, Waterberg district has commanded a 58.82% share of Limpopo cucumber export, Mopani has registered 25.44% share, whereas Capricorn export share significantly decreased to 15.74% share. Table 9: Share of district exports to the total Free State provincial cucumber exports (%)
Year
District
2010 2011 2012 2013 2014 2015 2016 2017 2018 2019
Xhariep 0 0 100 94.93 7.25 7.42 1.41 2.64 8.10 8.30
Lejweleputswa 0 0 0 0 9.81 9.57 15.94 22.84 44.49 20.23
Thabo Mofutsanyane 0 100 0 0 78.02 80.72 72.84 69.29 36.10 69.59
Fezile Dabi 0 0 0 5.07 2.42 0 7.21 0 0 0
Mangaung 0 0 0 0 2.50 2.28 2.60 5.24 11.30 1.88
Free State 0 100 100 100 100 100 100 100 100 100
Source: Calculated from Quantec Easydata

23
Table 9 above shows that in 2010, Free State province recorded zero cucumber trade. Thabo Mofutsanyane has recorded 100% export share in 2011 and Xhariep has commanded 100% share in 2012. During 2013, Xhariep has commanded 94.93%, while Fezile Dabi has commanded 5.07% share. Thabo Mofutsanyane has recorded a 78.02% share in 2014. Mangaung has commanded 12.31% and Xhariep has recorded a 7.25% share to the total Free State provincial export share in 2014. During 2015, Thabo Mofutsanyane cucumber export share has increased to 80.72%, followed by Lejweleputswa with 9.57% and Xhariep has recorded a 7.42% share. In 2016, Thabo Mofutsanyane continued to lead in Free State export share by commanding 72.84% share, Fezile Dabi export share increased to 7.21% whilst Xhariep export share dropped sharply to 1.41%. Thabo Mofutsanyane export share has dropped to 69.29% during 2017, Lejweleputswa export share grew to 22.84% and Mangaung has registered a 5.24% share of cucumber export. During 2018, Lejweleputswa increased its cucumber export share to 44.49%, Mangaung export share grew to 11.30% whilst Thabo Mofutsanyane cucumber export share declined sharply to 36.10% share. As of 2019, Thabo Mofutsanyane cucumber export share surged to 69.59%, whilst Lejweleputswa export share dropped notably to 20.23% share. 2.4 Cucumber imports by South Africa
In 2019, South African cucumber imports still represented 0% of world imports and the country was ranked number 87 in the world cucumber imports. South Africa is self-sufficient in terms of cucumber production, hence low volumes of imports. In 2010 and 2016, there were no cucumber imports recorded for South Africa. From 2011, the import volumes were insignificant. These can be attributed to increasing domestic cucumber production in the same years. Globally, United States of America, Germany, United Kingdom, the Netherlands, the Russian Federation, France, Canada, the Czech Republic and Poland were top cucumber importers during 2019.
Source: Quantec Easydata
0
200000
400000
600000
800000
1000000
1200000
0
20
40
60
80
100
120
140
160
180
Ran
d
Ton
s
Years
Figure 17: Value of cucumber imports by South Africa
Volume (Tons) Value (Rand)

24
Figure 17 above indicates that cucumber imports were relatively unstable from 2010 to 2019. During 2010 and 2011, South African cucumber imports were less significant and this can be attributed to a 15.5% increase in domestic production. During 2012, South Africa imported only 59Kg of cucumbers and this can be attributed to a 6.8% increase in the domestic cucumber output. In 2013, South Africa imported only 27kg of cucumber and it was relatively more expensive to import cucumber when compared to 2012 and 2013 imports. During 2014, cucumber import dropped by 51.5% in comparison to 2013 and this can be ascribed to an 8% increase in domestic production output. In 2015, South Africa’s cucumber import has dropped further by 99% in comparison to 2014 imports and this can be attributed to a 12.4% increase in production output. During 2016, South Africa has recorded zero trade for cucumber, despite a 3.8% decline in domestic production output. South Africa has imported 85.5% tons of cucumber in 2017, which was incomparably higher relative to the 2016 import volume. The import volume surged despite a 2.9% growth in domestic cucumber output. It was more expensive to import cucumber when compared to 2015 imports. As of 2018, South Africa’s cucumber import has surged 96% relative to 2017 imports and this can be attributed to a 6.3% decline in cucumber domestic production output. In 2019, South Africa’s cucumber notably declined by 29% relative to 2018 import volume. The drop in cucumber import volume can be attributed to an 8.5% increment in domestic production output.
Source: Quantec Easydata
Figure 18 above, shows the regions that supplied cucumber during the 10 years. During 2010, South Africa imported considerable volumes of cucumber from the Africa region. South Africa apply a 0% tariff for cucumber imports from Zambia and Zimbabwe. In 2011, there were notable cucumber imports from the Asia region. In 2012, South Africa’s cucumber exports were sourced mainly from the African region. In 2013, South Africa imported cucumber from Africa and Asia regions (Hong Kong, Turkey and China). In 2014, Africa (Eswatini) and Asia (India) remained the main suppliers of cucumber imported by South Africa. During 2015, South Africa has imported cucumber from Asia region; however, the import volume was insignificant. In 2016, there were no cucumber imports recorded for South Africa. During 2017, South Africa has imported a substantial volume of cucumber from Africa region (Namibia and Eswatini) and there was
2010 2011 2012 2013 2014 2015 2016 2017 2018 2019
Africa 15000 2 58769 26845 11501 9 0 83530 157959 104500
Americas 0 0 0 0 0 0 0 0 0 0
Asia 0 923 0 442 1717 144 0 0 0 0
Europe 0 0 87 0 0 0 0 0 0 1
Not allocated 0 15 0 0 0 0 0 1970 10091 13900
020000400006000080000
100000120000140000160000180000
Vo
lum
e (K
g)
Years
Figure 18 : South Africa cucumber imports from the regions

25
a notable increase in unallocated import. As of 2018, Africa (Namibia and Eswatini) region was still the primary supplier of South Africa’s cucumber imports. At the same time, there was a notable volume of imports which was unallocated. During 2019, Africa (Namibia) region was still the primary source of South Africa’s cucumber imports and the unallocated imports have notably increased by 38% relative to 2018 imports. Figure 19 below illustrates the value of cucumber exports by regions from 2010 to 2019.
Source: Quantec Easydata
Figure 19 above shows the value of cucumber imports from regions. The African region has recorded higher values as high volume were imported from this region. In 2012, it was cheaper to import cucumbers from Africa region. During 2013, it was relatively more expensive to import cucumber from Africa region and imports from Asia were relatively cheaper. In 2014, it was cheaper to import cucumber from the Asia region, while it was more expensive to import from Africa region. Cucumber import values for Africa and Asia regions were insignificant. During 2016, South Africa recorded zero trade for cucumber. In 2017, South Africa cucumber import value was a record high in a ten year period, which is attributed to a record high import volume during the same year. As of 2018, it was cheaper to import cucumber from Africa region, relative to 2017 imports from the same region. Unallocated imports have also fetched higher import value. In 2019, it was cheaper to import cucumber from Africa region, in comparison to the 2018 cucumber import value from the same region. Figure 20 below illustrates South Africa’s provincial cucumber imports. From 2010 to 2011, Gauteng province was the entry point for South Africa’s cucumber import. Higher import values were recorded in 2012 and 2013. At the same time, Western Cape has contributed to South Africa cucumber imports, but the import values were insignificant. During 2014, Gauteng import value has notably dropped and KwaZulu
2010 2011 2012 2013 2014 2015 2016 2017 2018 2019
Africa 72000 310 516230 547932 219494 180 0 841171 1059000 447400
Americas 0 0 0 0 0 0 0 0 0 0
Asia 0 1742 0 1420 9131 780 0 0 0 0
Europe 0 0 2415 0 0 0 0 0 0 75
Not allocated 0 621 0 0 0 0 0 14931 28550 66200
0
200000
400000
600000
800000
1000000
1200000
Val
ue
(Ran
d)
Years
Figure 19 : Value of cucumber imports from regions

26
Natal has contributed to South Africa cucumber import. During 2015, South Africa imported cucumbers through the Western Cape and KwaZulu Natal provinces. However, the import values were insignificant. In 2016, there was no record of cucumber entering South Africa. During 2017, Western Cape was by far the primary entry point of cucumber imports and this can be ascribed to neighbouring Namibia supplying 95.3% of South Africa cucumber imports. Gauteng cucumber import value has significantly increased relative to 2016 zero trade. During 2018, Gauteng province was by fair the primary entry point for South Africa’s cucumber imports, followed by Western Cape and Mpumalanga has also recorded a notable import value. The Mpumalanga import value can be attributed to cucumber imports from the neighbouring Eswatini. As of 2019, Western Cape was the primary entry point for South Africa’s cucumber import and Gauteng has registered a trivial import value. High import recorded for Western Cape can be ascribed to 86.1% import share from neighbouring Namibia.
Source: Quantec Easydata
2.5 Cucumber processing
Cucumber can be cooked, but they are most often eaten raw in salads, in cold soups and cucumber based sauces. Cucumbers are also the vegetable of choice for pickles. Cucumbers are pickled for flavour and longer shelf-life. Pickles are made by placing cucumber in a seasoned brine or vinegar solution. Cucumber juice is in great demand in various forms as a cooling and beautifying agent for the skin. Cucumber juice is also used in the preparation of cosmetics like soap, glycerine, creams and perfumes. Cucumber can be cooked, but they are most often eaten raw in salads, in cold soups and cucumber based sauces. Another benefit of cucumber is it helping to heal a range of illness, including lungs, stomach, chest problems, gout, and arthritis and tapeworm. Figure 21 presents a cucumber value chain tree explaining its uses.
2010 2011 2012 2013 2014 2015 2016 2017 2018 2019
Western Cape 0 0 676 847 0 180 0 675921 226500 513600
KwaZulu-Natal 0 0 0 0 8828 780 0 0 0 0
Gauteng 72000 2673 517969 548505 219797 0 0 180181 842400 75
North West 0 0 441920 118764 0 0 0 0 0 0
Mpumalanga 0 0 0 0 0 0 0 0 18650 0
0
100000
200000
300000
400000
500000
600000
700000
800000
900000
Val
ue
(Ran
d)
Years
Figure 20: Value of South Africa's provincial cucumber imports

27
Figure 21: Cucumber value chain tree explaining its uses
Fresh Cucumber Canning
Cucumber Essential oil
Cucumber juice
Perfume Cream
Glycerin
Soap
Lotion
Cucumber salad

28
Figure 22: Cucumber market value chain
Figure 22 presents the market value chain for cucumber. The cucumber value chain can be broken down into the following levels: the producer of cucumber (farmers), pack house owner (who cleans, grade and quality control); cold storage and transport facilities (store and transport cucumber on behalf of the farmers); traders in cucumber (market and sell cucumber); processors (add value to cucumber and process cucumber to other usable forms) and end users (consumers).
Input Suppliers Farmers/Producers
Harvesting
Imports
Fresh produce Markets, Wholesalers, Supermarkets,
Retailers and Informal markets
Consumers
Quality grade standards and
packaging
Exports
Cleaning/Handling
Storage, transportation and distribution
Processors: Canning

29
3. MARKET INTELLIGENCE
3.1 Tariffs
Tariffs applied by the various markets to cucumbers originating from South Africa during 2018 and 2019 are presented in Table 10. Table 10: Tariffs applied by various export markets for cucumber originating from South Africa.
Country Product Description (H070700)
Trade Regime description
Applied tariff
Estimated total ad valorem equivalent tariff
Applied tariff
Estimated total ad valorem equivalent tariff
2018 2019
Angola Cucumber and gherkins fresh or chilled
MFN duties Applied 50.00% 50.00% 50.00% 50.00%
Belgium Cucumber fresh or chilled Preferential tariff for South Africa
0.00% 0.00% 0.00% 0.00%
Botswana Cucumber and gherkins fresh or chilled
Intra SACU rate 0.00% 0.00% 0.00% 0.00%
China Cucumber and gherkins fresh or chilled
MFN duties Applied 13.00% 13.00% 13.00% 13.00%
Denmark Cucumber fresh or chilled Preferential tariff for South Africa
0.00% 0.00% 0.00% 0.00%
DRC Cucumber and gherkins fresh or chilled
MFN duties Applied 10.00% 10.00% 10.00% 10.00%
Ethiopia Cucumber fresh or chilled General tariff 30.00% 30.00% 30.00% 30.00%
Germany Cucumber fresh or chilled Preferential tariff for South Africa
0.00% 0.00% 0.00% 0.00%
Iran Cucumber fresh or chilled General tariff 90.00% 90.00% 55.00% 55.00%
Lesotho Cucumber fresh or chilled Intra SACU rate 0.00% 0.00% 0.00% 0.00%
Malawi Cucumber and gherkins fresh or chilled
Preferential tariff for South Africa
0.00% 0.00% 0.00% 0.00%
Mauritius Cucumber fresh or chilled MFN duties Applied 0.00% 0.00% 0.00% 0.00%
Mexico Cucumber fresh or chilled MFN duties Applied 10.00% 10.00% 10.00% 10.00%

30
Country Product Description (H070700)
Trade Regime description
Applied tariff
Estimated total ad valorem equivalent tariff
Applied tariff
Estimated total ad valorem equivalent tariff
Mozambique Cucumber and gherkins fresh or chilled
Preferential tariff for South Africa
0.00% 0.00% 0.00% 0.00%
Namibia Cucumber fresh or chilled Intra SACU rate 0.00% 0.00% 0.00% 0.00%
Netherlands Cucumber fresh or chilled Preferential tariff for South Africa
0.00% 0.00% 0.00% 0.00%
Russian Federation Cucumber and gherkins fresh or chilled
General tariff (MFN) 56.74$/ton 10.00% 56.74$/ton 10.00%
Eswatini Cucumber and gherkins fresh or chilled
Intra SACU rate 0.00% 0.00% 0.00% 0.00%
Nigeria Cucumber fresh or chilled MFN duties Applied 20.00% 20.00% 20.00% 20.00%
United Kingdom Cucumber fresh or chilled Preferential tariff for South Africa
0.00% 0.00% 0.00% 0.00%
United States of America
Cucumber and gherkins fresh or chilled
Preferential tariff for GSP countries
0.00% 0.00% 0.00% 0.00%
Zambia Cucumber and gherkins fresh or chilled
Preferential tariff for South Africa
0.00% 0.00% 0.00% 0.00%
Zimbabwe Cucumber and gherkins fresh or chilled
Preferential tariff for South Africa
0.00% 0.00% 0.00% 0.00%
Source: Market Access Map
During 2019, Botswana, Namibia, Lesotho and Eswatini remained the primary export markets for cucumber originating from South Africa and together they account for 92.6% of South Africa cucumber exports. These countries apply 0% Intra SACU rate to cucumber exports from South Africa. South Africa has also exported cucumber to Mozambique, Angola, Malawi, Zambia, Nigeria, Ethiopia and the Democratic Republic of the Congo. Angola and the Democratic Republic of the Congo have still protected by 50% and 10% tariffs respectively despite the existence of the SADC- FTA. Zimbabwe and Mozambique have reduced their tariff 0% preferential tariff. Zambia and Malawi also apply 0% preferential tariff to cucumber exports originating from South Africa. South Africa can also diversify their cucumber exports to Europe since these countries apply 0% a preferential tariff to cucumber exports originating from South Africa due to EU-SA Free Trade Agreement (FTA). China is the largest producer of cucumber and its domestic producers are still protected by 13% tariff. Nigeria is the second-largest cucumber producer and its domestic producers are highly protected with a 20% tariff, Iran the third largest cucumber has reduced its import tariff from 90% to 55% tariff.

31
3.2 Non-tariff barriers
3.2.1 The European Union Non-tariff barriers can be divided into those that are mandatory and laid out in the EU Commission’s legislature, and those that are as a result of consumers, retailers, importers and other distributions’ preferences. 3.2.1(a) Product legislation: quality and marketing There are a number of pieces of EU legislation that govern the quality of produce that may be imported, marketed and sold within the EU. General Food Law covers matters in procedures of food safety and hygiene (micro-biological and chemical), including provisions on the traceability of food (for example, Hazard Analysis and Critical Control Points, of HACCP). EU Marketing Standards, which govern the quality and labelling of vegetables, are laid out in the CAP framework under regulation EC 2200/96. These regulations include diameter, weight and class specifications, and any produce that does not comply with these standards are not allowed to be sold on the EU markets (detailed lists of products and their standards can be found in the annexes to the directive). The legislation (under EU 1148/2001) also dictates that a Certificate of Conformity must be obtained by anyone wishing to export and sell vegetables in the EU if that particular vegetable falls under the jurisdiction on the EU marketing standards, Vegetables to be used in further processing needs a Certificate of Industrial Use, whilst another legislative directive covers the Maximum Residue Limits (MRL) of various pesticides allowed. 3.2.2 Product legislation: phytosanitary regulations The international standard for phytosanitary measures was set up by the International Plant Protection Committee (IPPC) to protect against the spreading of diseases or insects through the importation of certain agricultural goods. The EU has its own particular rules formalized under EC 2002/89, which attempts to prevent contact of EU crops with harmful organisms from elsewhere in the world. The crux of the directive is that it authorizes the Plant Protection Services to inspect a large number of vegetable products upon arrival in the EU. This inspection consists of a physical examination of a consignment deemed to have a level of phytosanitary risk, identification of any harmful organisms and certification of the validity of any phytosanitary certificate covering the consignment. If the consignment does not comply with the requirements, it may not enter the EU, although certain organisms can be fumigated at the expense of the exporter. 3.2.3 Product legislation: packaging The EU commission lays down rules for materials that come into contact with food and which may endanger people’s health or bring about an unacceptable change in the composition of the foodstuffs. The framework

32
legislation for this EC 1935/2004. Recycling packaging materials are also emphasized under 94/62/EC, whereby member states are required to recycle between 50% and 65% of packaging waste. If exporters do not ship produce in packaging which is reusable, they may be liable for the costs incurred by the importing companies. Wood packaging is subject to phytosanitary controls (see Directive EC 2002/89) and may need to undergo heat treatment, fumigation, etc. 3.2.4 Non-legal market requirements: social and environmental accountability To access a market, importers must not only comply with the legal requirements set out above, but also with market requirements and demands. For the most part, these revolve around quality and the perceptions of European consumers about the environmental, social, health and safety aspects of both the products and the production techniques. Whilst supplying vegetables that complies with these issues may not be mandatory in the legal sense, they are becoming increasingly important in Europe and cannot be ignored by existing or potential exporters. (i) Social responsibility is becoming important in the industry, not only amongst consumers, but also for retail outlets and wholesalers. The Social Accountability 8000 (SA8000) certification is a management system based on International Labour Organization (ILO) conventions, and deals with issues such as a child labour, health and safety, and freedom of association, and requires an on-site audit to be performed annually. The certificate is seen as necessary for accessing any European market successfully. The major retailers in the EU also play an important role in tackling environmental issues, which means that exporters have to take these into account when negotiating exporting arrangements. (ii) Environmental issues are becoming increasingly important with European consumers. Consumer movements are lobbying against purchasing non-environmental friendly or non-sustainable produce. To this end, both governments and private partners have created standards (such as ISO 14001 and EUREPGAP) and labels to ensure produce adhere to particular specifications. Labels are an absolute must for exporters attempting to enter the rapidly expanding organic produce market. The EU Commission has recently adopted and EU label for identifying food produced according to EU organic standards in the directive EEC 209/91. 3.1.5 Consumer health and safety requirements Increasing consumer conscience about health and safety issues has prompted a number of safety initiatives in Europe, such as EUREPGAP on good agricultural practices (GAP) by the main European retailers, the international management system of HACCP, which is independently certified and required by legislation for European producers as well as food imported into Europe (EC 852/2004), and the ISO 9000 management standards system (for procedures and working methods), which is certified by the International Standards Organization (ISO). 3.2 The United States The USDA has quality standards for vegetables that provide a basis for domestic and international trade and promote efficiency in marketing and procurement. At the same time the USDA issues quality certificates based on these standards and a comprehensive grading system. Graders are located around the country at terminal markets. These certification services, which facilitate the ordering and purchasing

33
of products by large-volume buyers, assure these buyers that the product they purchase will meet the terms of the contract in terms of quality, processing, size, packaging and delivery.
3.3 Asian Market Access
Japan’s agricultural sector is heavily protected, with calculations from the Organization for Economic Co-operation and Development (OECD) estimating that almost 60% of the value of Japan’s farm production comes from trade barriers or domestic subsidies. Japan uses tariff rate quotas (TRQ) to protect its most sensitive products, and reserves the right for trading many of these products (within the quota) for one or two state trading enterprises. However, these extremely protective measures apply only to some products; others are able to compete more effectively with outside competition, often on the grounds of higher quality. Perhaps the biggest barrier to trade with Japan in vegetable markets is its strict phytosanitary requirements, which have often been challenged in the WTO as having little or no scientific justification. Other measures that are being challenged include Japan’s use of fumigation on agricultural products when cosmopolitan pests (already found in Japan) are detected. Japan is also increasing its labelling requirements.
4. GENERAL DISTRIBUTION CHANNELS
There are roughly three distinct sales channels for exporting vegetables. One can sell directly to an importer with or without the assistance of an agent (usually larger, more established commercial farms/orchards). One can supply a vegetable combine, which will then contract out importers/marketers and try to take advantage of economies of scale and increased bargaining power. At the same time vegetable combines might also supply large retail chains. One can also be a member of a private or co-operate export organization (including marketing boards) which will find agents or importers and market the produce collectively. Similar to a vegetable combine, an export organization can either supply wholesale markets or retail chains depending on particular circumstances. Export organizations and marketing boards will wash, sort and package the produce.
5. LOGISTICAL ISSUES
5.1 Mode of transport
The transportation of vegetables falls within two categories – ocean cargo and air cargo – with ocean cargo taking much longer to reach the desired location but costing considerably less. Of course, the choice of transportation method depends, for the most part, on the fragility of the produce and how long it can remain relatively fresh. With the advent of technology and container improvements, the feasibility, cost and attractiveness of sea transportation have improved considerably. As more developing countries begin to export and supply major developed countries markets, so the number and regularity of maritime routes, and the container vessels travelling these routes, increase. Presently South American countries like Peru benefit from the asparagus trade, which has led to some level of economies of scale with other vegetable products, and this has enabled cheaper transport prices for their other vegetable varieties. Such economic of scale could benefit SADC countries if more producers became exporters and took advantage of the various ports which have special capabilities in handling vegetable produce (for example, the proposed terminal in Maputo). For some products, in order to reach

34
the destination market with an acceptable degree of freshness, air transport is the only option (asparagus, for example, is flown from Peru to the sufficient to cover the transport costs, and collective agreements between farmers of different commodities with different harvest periods can become particularly important.
5.2 Cold chain management is crucial when handling perishable products, from the initial packing houses to the refrigerated container trucks that transport the produce to the shipping terminals, through to the storage facilities at these terminals (and their pre-cooling capability), onto the actual shipping vessels and their containers, and finally on to the importers and distributors that must clear the produce and transport it to the markets/retail outlets, etc. For every 10oC increase above the recommended temperature, the rate of respiration and ripening of produce can increase twice or even thrice. Related to this are the increasingly important traceability standards, which requires an efficiently controlled supply chain and internationally accepted business standards. At home, store lettuce in a plastic bag in the refrigerator crisper. Iceberg lettuce should be cored, rinsed lightly and drained thoroughly before storing. Lettuce should keep in the refrigerator for two to five days or more.
5.3 Packaging also plays a vital role in ensuring safe and efficient transport of a product and conforming to handling requirements, uniformity, recyclable materials specifications, phytosanitary requirements, proper storage needs and even attractiveness (for marketing purposes). 5.4 Storage and Conditioning for cucumber -The recommended storage temperature is 10° to 13°C at a relative humidity of 95%. Even under these conditions, cucumbers cannot be expected to keep satisfactorily for more than 2 to 3 weeks. Chilling injury develops rapidly at temperatures below 10°C, and above 13°C ripening and yellowing occurs. Once pulled the cucumbers should be cooled as quickly as possible. Humidity should be kept high to prevent shrivelling. Cucumbers for fresh market can be waxed or shrink-wrapped in polyethylene film to minimize water loss. Holding cucumbers at higher temperatures will cause a rapid loss of green colour. Loss of colour will also occur more rapidly if held in the same room with apples, tomatoes or other ethylene producing crops.
Pickling cucumbers are normally stored for long periods in brine solution. If, however, fresh pickles need to be stored or held for a short period before being processed or placed in brine tanks, the cucumbers should be cooled as rapidly as possible to 10°C. Hydro cooling has been used successfully to remove field heat.
6. COMPETITIVENESS OF SOUTH AFRICAN CUCUMBER EXPORTS
Figure 23 below shows that South Africa cucumber exports which were left in ships and bunkers are growing faster than the world imports. South Africa’s cucumber exports are growing slower than the world cucumber imports into Lesotho, Botswana, Malawi, Eswatini and Lesotho. South Africa has lost market share in these dynamic markets and South Africa’s performance is regarded as underachievement. South Africa’s cucumber exports to Mozambique, Zambia and Namibia are growing while world imports are declining into these countries. South Africa’s cucumber exports are declining while world imports are growing into Mozambique.
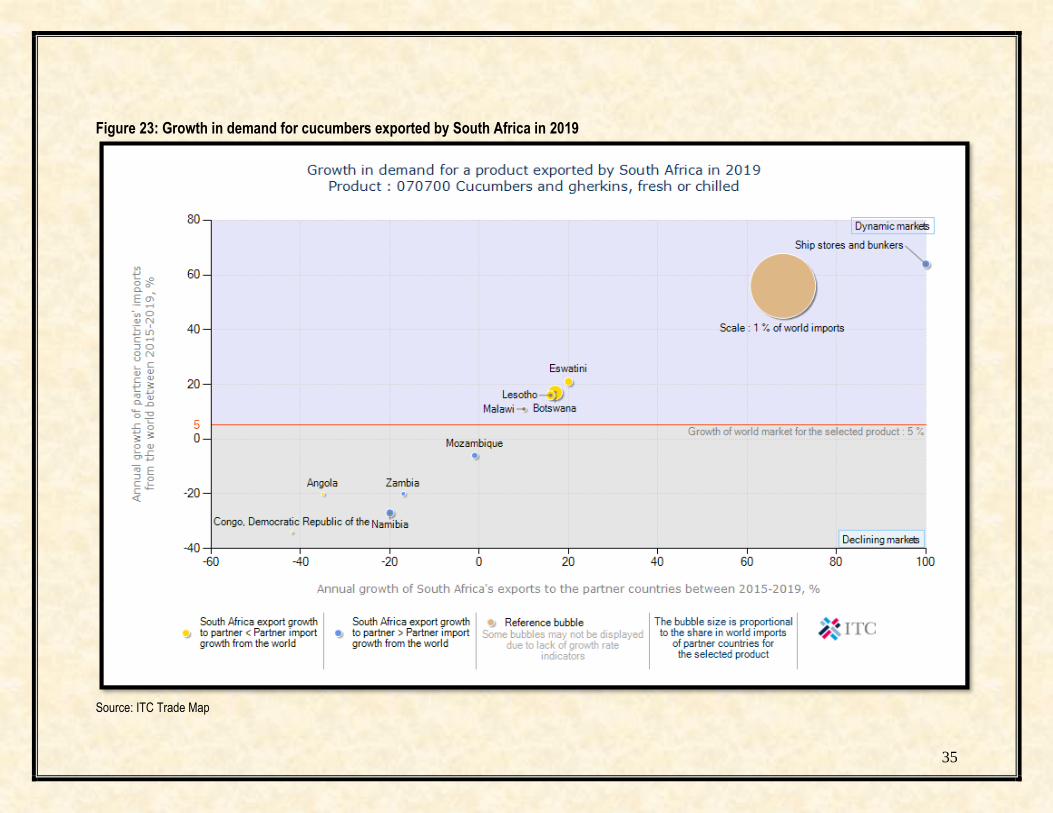
35
Figure 23: Growth in demand for cucumbers exported by South Africa in 2019
Source: ITC Trade Map

36
Figure 24: Prospects for market diversification for cucumbers exported by South Africa in 2019
Source: ITC Trade Map

37
Figure 24 above illustrates that Botswana still holds the biggest share of South African cucumber exports. This country holds more than 54.5% share of South Africa’s cucumber exports. Prospective export markets for cucumber from South Africa exist in the United Kingdom and Germany. Other small exports market exists in Saint Helena and the United States of America. However, if South Africa is to diversify its cucumber exports the most lucrative market exist in Malawi and the United States of America, which have increased their cucumber imports from the world by 11% and 7% respectively between 2015 and 2019 period.
7. ACKNOWLEDGEMENTS
The following organizations are acknowledged National Department of Agriculture, Land Reform and Rural Development Directorate: Statistics and Economic Analysis Private Bag X246 Pretoria 0001 Tel (012) 930 1134 Fax (012) 319 8031 www.daff.gov.za Trade and Industrial Policy Strategies (TIPS) P.O. Box 11214 Hatfield 0028 Tel (012) 431 7900 Fax (012) 431 7910 www.tips.org.za Quantec Easy Data www.easydata.co.za Market Access Map www.macmap.org Economic Research Service/USDA www.wikipedia.co.za Disclaimer: This document and its contents have been compiled by the Department of Agriculture, Land Reform and Rural Development for the purpose of detailing the cucumber industry. Anyone who uses this information does so at his/her own risk. The views expressed in this document are those of the Department of Agriculture, Land Reform and Rural Development with regard to agricultural industry unless otherwise stated. The Department of Agriculture, Land Reform and Rural Development, accepts no liability that can be incurred resulting from the use of this information


![Raaziq International | Logistics & Supply Chain Management - Profile []](https://static.fdocuments.us/doc/165x107/558c045cd8b42a4b788b464c/raaziq-international-logistics-supply-chain-management-profile-httpwwwraaziqcom.jpg)