GROUND WATER BROCHUREcgwb.gov.in/District_Profile/Telangana/Hyderabad.pdf · GROUND WATER BROCHURE...
20
For Official Use Only CENTRAL GROUND WATER BOARD MINISTRY OF WATER RESOURCES GOVERNMENT OF INDIA GROUND WATER BROCHURE HYDERABAD DISTRICT, ANDHRA PRADESH SOUTHERN REGION HYDERABAD September 2013
Transcript of GROUND WATER BROCHUREcgwb.gov.in/District_Profile/Telangana/Hyderabad.pdf · GROUND WATER BROCHURE...
For Official Use Only
CENTRAL GROUND WATER BOARD MINISTRY OF WATER RESOURCES
GOVERNMENT OF INDIA
GROUND WATER BROCHURE HYDERABAD DISTRICT, ANDHRA PRADESH
SOUTHERN REGION HYDERABAD
September 2013
CENTRAL GROUND WATER BOARD MINISTRY OF WATER RESOURCES
GOVERNMENT OF INDIA
GROUND WATER BROCHURE HYDERABAD DISTRICT, ANDHRA PRADESH
(AAP-2012-13)
BY
RAVI KUMAR GUMMA SCIENTIST-C
SOUTHERN REGION BHUJAL BHAWAN,
GSI Post, Bandlaguda NH.IV, FARIDABAD -121001
Hyderabad-500068 HARYANA, INDIA
Andhra Pradesh Tel: 0129-2418518
Tel: 040-24225201 Gram: Bhumijal
Gram: Antarjal
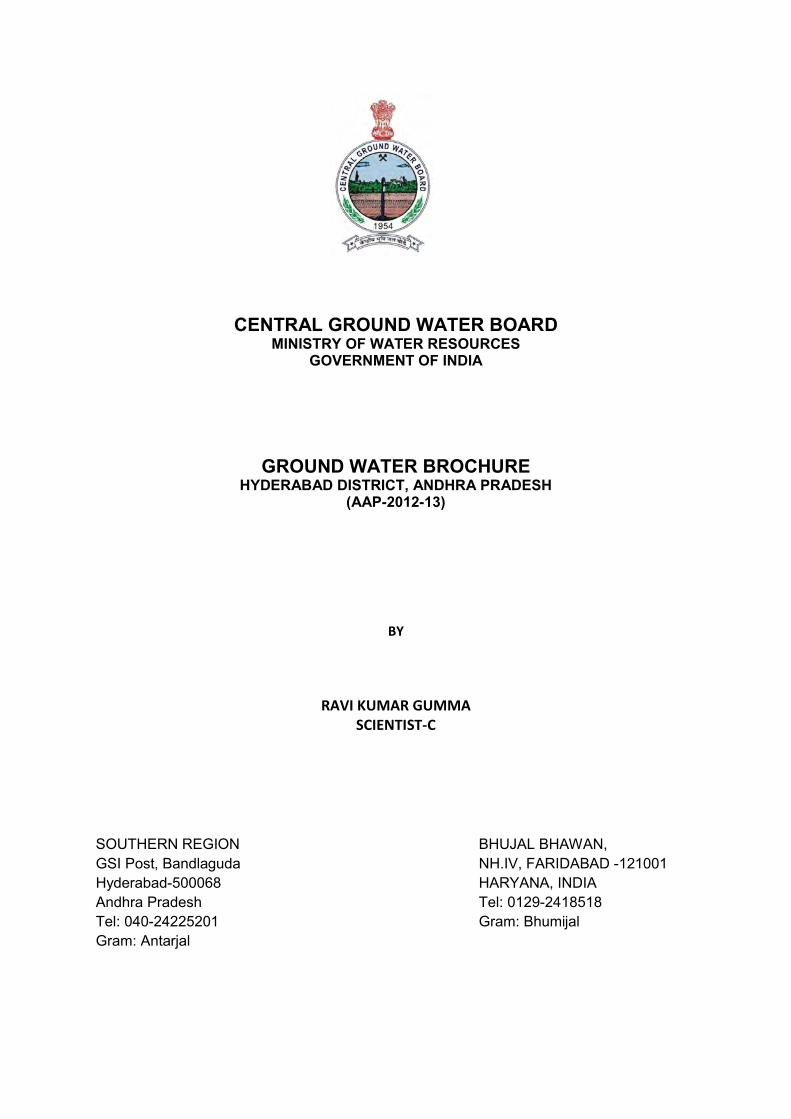
HYDERABAD DISTRICT AT A GLANCE 1 GENERAL Location North Latitude East Longitude Geographical area 186 sq.km
Headquarters
Hyderabad
No. of mandals 16 No. of villages Nil Population (2001) 36.33 lakhs Population density 19532/Sq.km Major rivers Musi Geology Granites,
gneisses
Soils Red loamy Agroclimatic zone
Zone 10 Southern Telangana zone
2 RAINFALL
Normal annual rainfall Annual Rainfall (2012)
Total 810 mm 779 mm
3 LAND USE
(Area in Sq.kms) Agriculture 4.3
Build up Area (Residential)
168
Build up Area (Industrial)
3.8
Open Grass land/ Tree cover area
0.4
Waste Land 1.07 Water Bodies 8.7 4 GEOLOGY Major rock types Granites, Granite
Gniesses and Alluvium
5 GROUND WATER
Exploration by CGWB
No. of wells drilled
10
Major aquifer zones
25-100 m & 156-173 m
Aquifer parametres
Transmissivity (sq.m/day)
11 to 202
Monitoring No. of 17
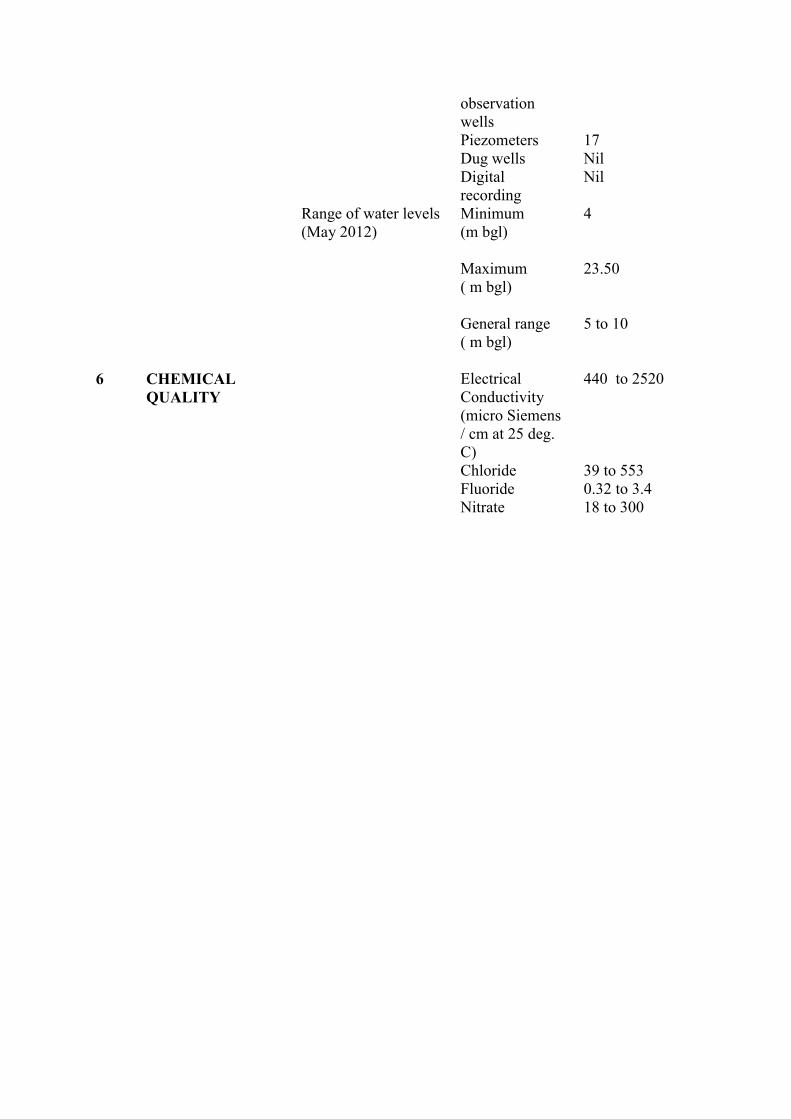
observation wells
Piezometers 17 Dug wells Nil Digital
recording Nil
Range of water levels (May 2012)
Minimum (m bgl)
4
Maximum ( m bgl)
23.50
General range ( m bgl)
5 to 10
6 CHEMICAL QUALITY
Electrical Conductivity (micro Siemens / cm at 25 deg. C)
440 to 2520
Chloride 39 to 553 Fluoride 0.32 to 3.4 Nitrate 18 to 300

GROUND WATER BROCHURE HYDERABAD DISTRICT, ANDHRA PRADESH
1.0 Introduction: Hyderabad, the capital of Andhra Pradesh, founded in the year 1591 by Mohammed Quli Qutub Shah, offers a fascinating panorama of the past, with richly mixed cultural and historical tradition spanning over 400 years. Soon after India gained independence, Hyderabad state merged with the union of India in the year 1948. On November 1, 1956 the map of India was redrawn into linguistic states and Hyderabad became the capital of Andhra Pradesh. Hyderabad centrally located on the top of the Deccan Plateau presently is one of the fastest growing cities of India and has emerged as a strong industrial, commercial, technology centre and occupies prime position in India. Secunderabad is a distinct unit physically separated from Hyderabad city by a lake called Hussain Sagar Lake.Hyderabad city is situated between 17°22' N latitude and 78°27' E longitude with an elevation of 525 m amsl. The Hyderabad urban agglomeration (HUA) is the sixth largest in India and is spread over an area of 778 sq.kms comprising Municipal Corporation of Hyderabad (MCH), ten peripheral municipalities, Secunderabad cantonment and Osmania University. The Hyderabad Metropolitan area covers an area of 1905 sq. km under the jurisdiction of Hyderabad Urban Development Authority (HUDA) covering toposheet nos. 56 K/6, 7, 10, 11 and 12. The administrative map of Hyderabad district is shown in the Fig.1. Hyderabad is one of the fastest growing metropolitan cities with a decadal growth rate of 32%. The growth of population was more than 50% during 1981-91 and 27% during 1991-2001.
Fig-1: Administrative Map of Hyderabad District
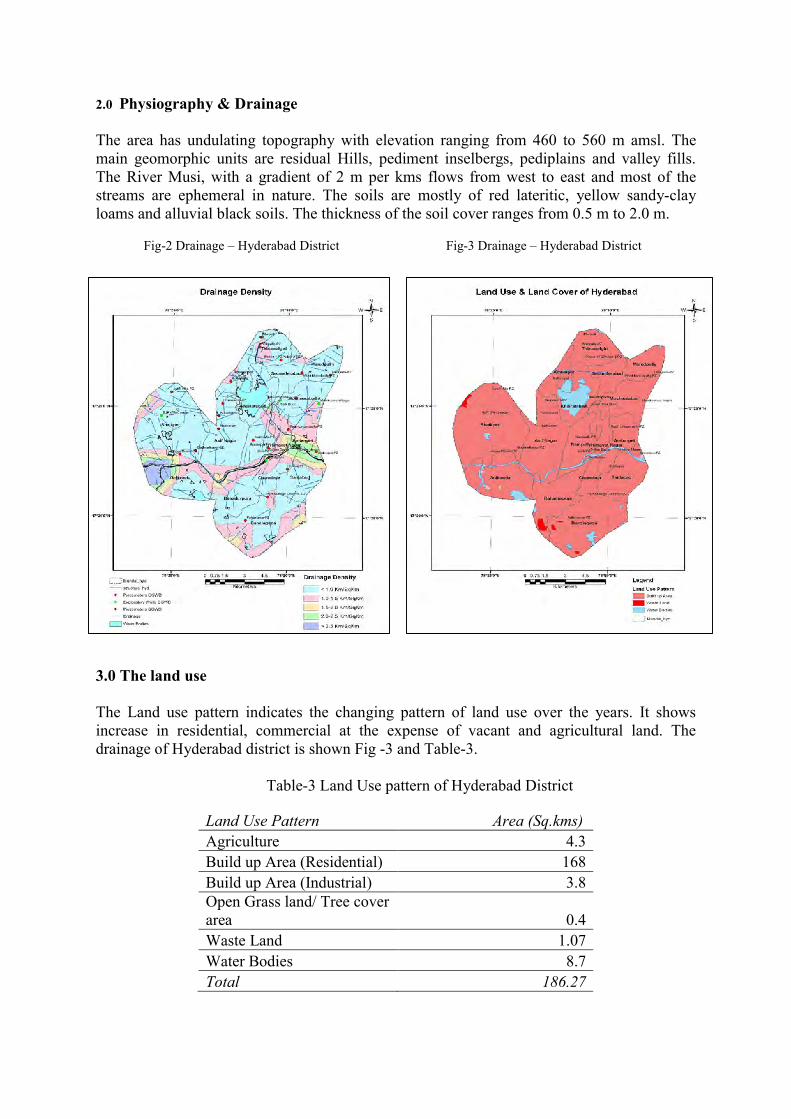
2.0 Physiography & Drainage The area has undulating topography with elevation ranging from 460 to 560 m amsl. The main geomorphic units are residual Hills, pediment inselbergs, pediplains and valley fills. The River Musi, with a gradient of 2 m per kms flows from west to east and most of the streams are ephemeral in nature. The soils are mostly of red lateritic, yellow sandy-clay loams and alluvial black soils. The thickness of the soil cover ranges from 0.5 m to 2.0 m.
Fig-2 Drainage – Hyderabad District Fig-3 Drainage – Hyderabad District
3.0 The land use The Land use pattern indicates the changing pattern of land use over the years. It shows increase in residential, commercial at the expense of vacant and agricultural land. The drainage of Hyderabad district is shown Fig -3 and Table-3.
Table-3 Land Use pattern of Hyderabad District
Land Use Pattern Area (Sq.kms)
Agriculture 4.3
Build up Area (Residential) 168
Build up Area (Industrial) 3.8 Open Grass land/ Tree cover area 0.4
Waste Land 1.07
Water Bodies 8.7
Total 186.27

The urban sprawl (built-up area) has occurred at an annual rate of 3.77 per cent during 1973-83, 4.95 per cent during 1983-91 and 2.37 per cent during 1991-96. Agricultural land to the extent of about 128sq.km was converted to residential, commercial, institutional and industrial purposes during this period (EPTRI, 1996: 23; The Hindu, 25 January 1997). Another study indicates that the urban built-up area has increased from 49.3 to 62.4 % of the total geographical area.
To address the negative effects emanating from the uncontrolled and haphazard
growth, the first development plan for the corporation area of Hyderabad was prepared and notified in 1975. The land use survey had covered an area of 194.11 sq. km (larger than MCH/Hyderabad district) covering 172.60 sq, km of city area (MCH) and 21.52 sq km of peripheral area which was envisaged to be urbanized in due course. The Land use pattern during 1975 and 2008 are shown in Table-3 (i) and (ii) respectively. Table: 3 (i) Land use Pattern - 1975
Sl. No Land Use Area in Ha Area in Ha % to total area 1 Residential 2694 13.88 2 Commercial 147 0.76 3 Industrial 306 1.57 4 Recreational 771 3.97 5 Public and Semi-public 1016 5.23 6 Transport and Communications 1295 6.67 7 Vacant 7633 39.32 8 Agricultural 3462 17.84 9 Other 2089 10.76 Total 19411 100
Source: Development Plan for Hyderabad, 1975
Table-3(ii) Land use Pattern -2008 Sr. No
Land Use
Area in (ha)
%
1 Residential 7635 44.24 2 Commercial 1270 7.36 3 Mixed 749 4.34 4 Industrial (Including manufacturing, small scale, household,
garages etc) 425 2.46
5 Public Semi Public 1555 9.01 6 Parks & Playgrounds 1175 6.81 7 Vacant lands, open lands, Rocks & Hills 273 1.58 8 River, Lakes, Nalahs, Kuntas 1075 6.23 9 Agriculture & Gardens etc 104 0.6 10 Transportation & Communication (Including Roads &
Circulation, streets, alleys, Airport, Bus Stations/Depots, Rly Tracks/Stns)
1864 10.8
11 Defence 834 4.83 12 Burial Grounds Crematoria etc 300 1.74 13 Total 17259 100
(Source: Master Plan of HMDA (MCH Area))

4.0 Hydrometeorology
Hyderabad experiences the semi arid tropical climatic conditions. The average annual rainfall
is 810 mm. The south west monsoon contributes 74% of annual rainfall and north east
monsoon contributes 14%. The temperatures reaches 45º C during the summer season and
with the onset of monsoons during June the temperature drop and varies between 26º C to 38º
C.
4.1 Rainfall Analysis
The nearest IMD rain gauge station to the study area is Hyderabad. The mean annual rainfall
is 884 mm recorded in 50 rainy days. The contribution of seasonal rainfall is 607 mm (69%),
146 mm (17%) and 130 mm (15%) in southwest (June-Sept), northeast (Oct-Dec) and non-
monsoon (Jan-May) respectively. The coefficient of variation of annual rainfall, which
indicates the dependability of rainfall, is 24%, which is not very high. Monthly rainfall ranges
from 9 mm in December to 197 mm in August. July and August are the rainiest months of the
year. About 40% of the annual rainfall is contributed by these two months. The variation of
monthly rainfall ranges from 45% in June to 138% in December. The unpredictability of
rainfall is clearly observed as these values are very high. Out of 40 years, 5 are excess years,
10 are deficit years and 25 are normal years of rainfall. As per the IMD, normal year is when
departure from normal is –19% to +19%, deficit year is when departure from normal is –20%
to –59% and excess year is when the departure from normal is greater than 60%. The annual
distribution of rainfall and cumulative departure of annual rainfall are depicted in the Fig.4 &
5 respectively. The Fig.4 shows a clear rising trend in the rainfall, which is 3.6mm per year.
During the period 1971-2010, highest rainfall occurred in 1978, which is 42% more than
normal and lowest annual rainfall has occurred in 1972, which is 53% less than normal.
Annual rainfall during 2012 is 779 mm.
Fig.4 Annual distribution of rainfall with moving average and trend
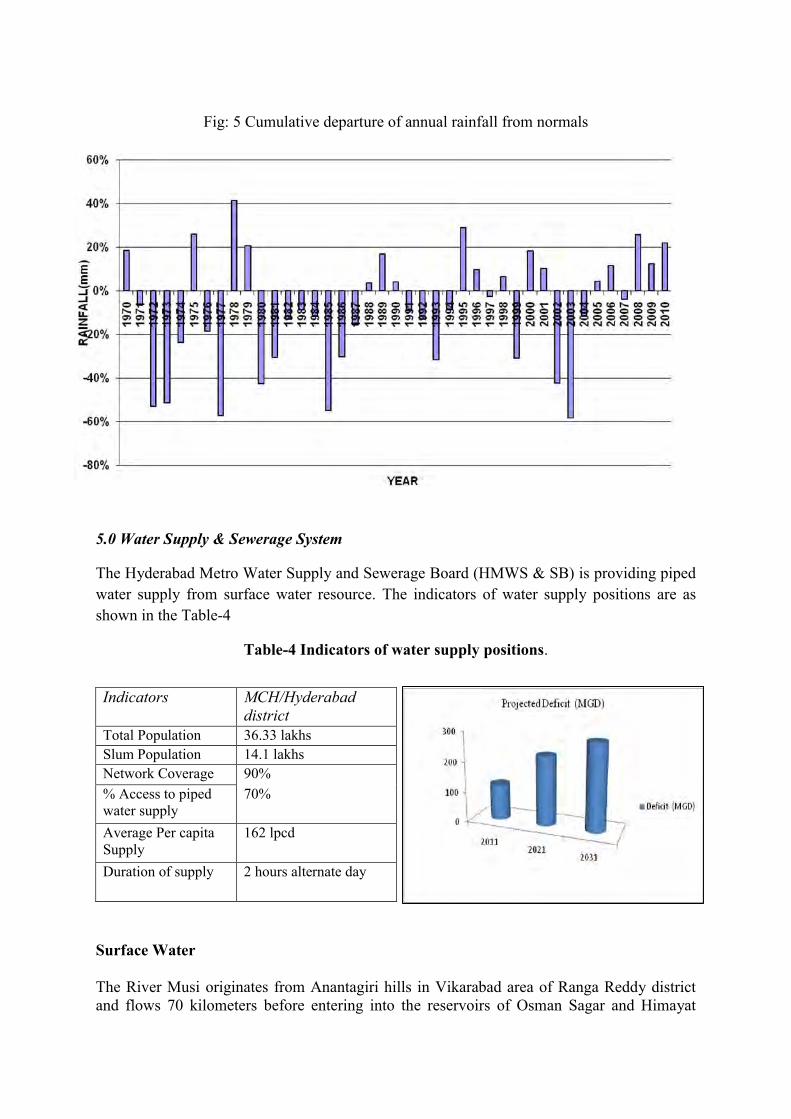
Fig: 5 Cumulative departure of annual rainfall from normals
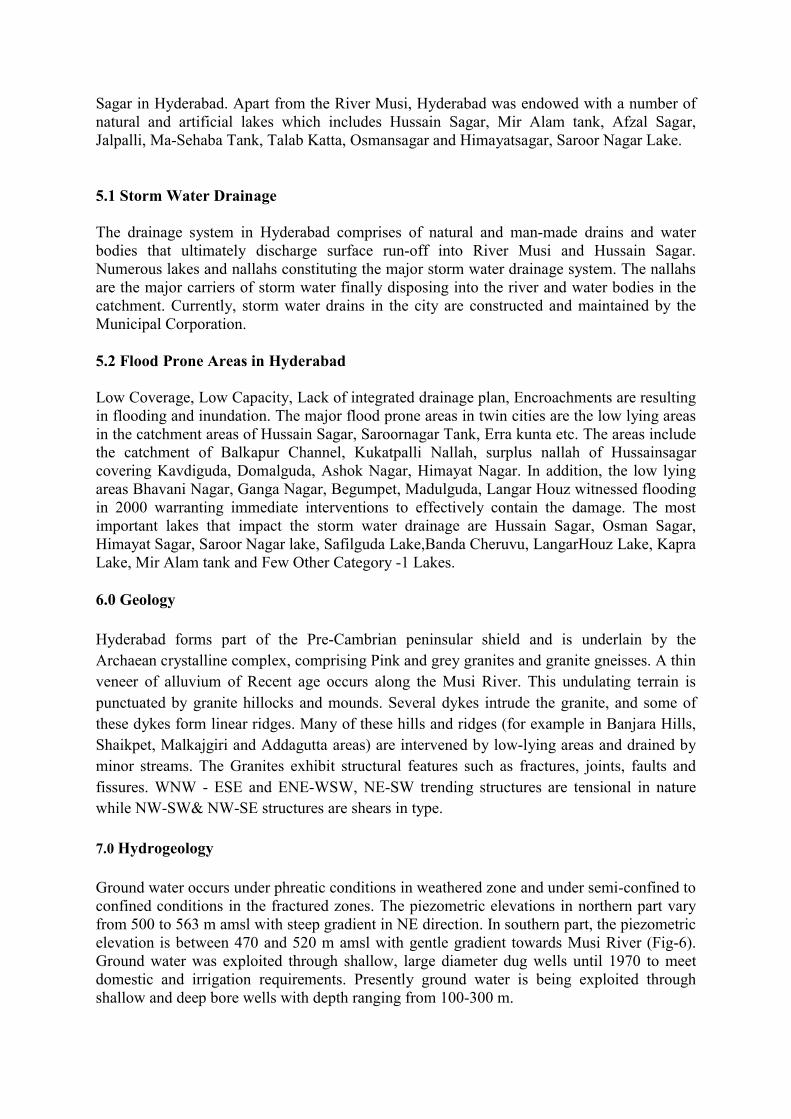
5.0 Water Supply & Sewerage System
The Hyderabad Metro Water Supply and Sewerage Board (HMWS & SB) is providing piped
water supply from surface water resource. The indicators of water supply positions are as
shown in the Table-4
Table-4 Indicators of water supply positions.
Surface Water
The River Musi originates from Anantagiri hills in Vikarabad area of Ranga Reddy district and flows 70 kilometers before entering into the reservoirs of Osman Sagar and Himayat
Indicators MCH/Hyderabad district
Total Population 36.33 lakhs
Slum Population 14.1 lakhs
Network Coverage 90%
% Access to piped water supply
70%
Average Per capita Supply
162 lpcd
Duration of supply 2 hours alternate day
Sagar in Hyderabad. Apart from the River Musi, Hyderabad was endowed with a number of natural and artificial lakes which includes Hussain Sagar, Mir Alam tank, Afzal Sagar, Jalpalli, Ma-Sehaba Tank, Talab Katta, Osmansagar and Himayatsagar, Saroor Nagar Lake.
5.1 Storm Water Drainage The drainage system in Hyderabad comprises of natural and man-made drains and water bodies that ultimately discharge surface run-off into River Musi and Hussain Sagar. Numerous lakes and nallahs constituting the major storm water drainage system. The nallahs are the major carriers of storm water finally disposing into the river and water bodies in the catchment. Currently, storm water drains in the city are constructed and maintained by the Municipal Corporation.
5.2 Flood Prone Areas in Hyderabad Low Coverage, Low Capacity, Lack of integrated drainage plan, Encroachments are resulting in flooding and inundation. The major flood prone areas in twin cities are the low lying areas in the catchment areas of Hussain Sagar, Saroornagar Tank, Erra kunta etc. The areas include the catchment of Balkapur Channel, Kukatpalli Nallah, surplus nallah of Hussainsagar covering Kavdiguda, Domalguda, Ashok Nagar, Himayat Nagar. In addition, the low lying areas Bhavani Nagar, Ganga Nagar, Begumpet, Madulguda, Langar Houz witnessed flooding in 2000 warranting immediate interventions to effectively contain the damage. The most important lakes that impact the storm water drainage are Hussain Sagar, Osman Sagar, Himayat Sagar, Saroor Nagar lake, Safilguda Lake,Banda Cheruvu, LangarHouz Lake, Kapra Lake, Mir Alam tank and Few Other Category -1 Lakes.
6.0 Geology
Hyderabad forms part of the Pre-Cambrian peninsular shield and is underlain by the
Archaean crystalline complex, comprising Pink and grey granites and granite gneisses. A thin
veneer of alluvium of Recent age occurs along the Musi River. This undulating terrain is
punctuated by granite hillocks and mounds. Several dykes intrude the granite, and some of
these dykes form linear ridges. Many of these hills and ridges (for example in Banjara Hills,
Shaikpet, Malkajgiri and Addagutta areas) are intervened by low-lying areas and drained by
minor streams. The Granites exhibit structural features such as fractures, joints, faults and
fissures. WNW - ESE and ENE-WSW, NE-SW trending structures are tensional in nature
while NW-SW& NW-SE structures are shears in type.
7.0 Hydrogeology
Ground water occurs under phreatic conditions in weathered zone and under semi-confined to confined conditions in the fractured zones. The piezometric elevations in northern part vary from 500 to 563 m amsl with steep gradient in NE direction. In southern part, the piezometric elevation is between 470 and 520 m amsl with gentle gradient towards Musi River (Fig-6). Ground water was exploited through shallow, large diameter dug wells until 1970 to meet domestic and irrigation requirements. Presently ground water is being exploited through shallow and deep bore wells with depth ranging from 100-300 m.
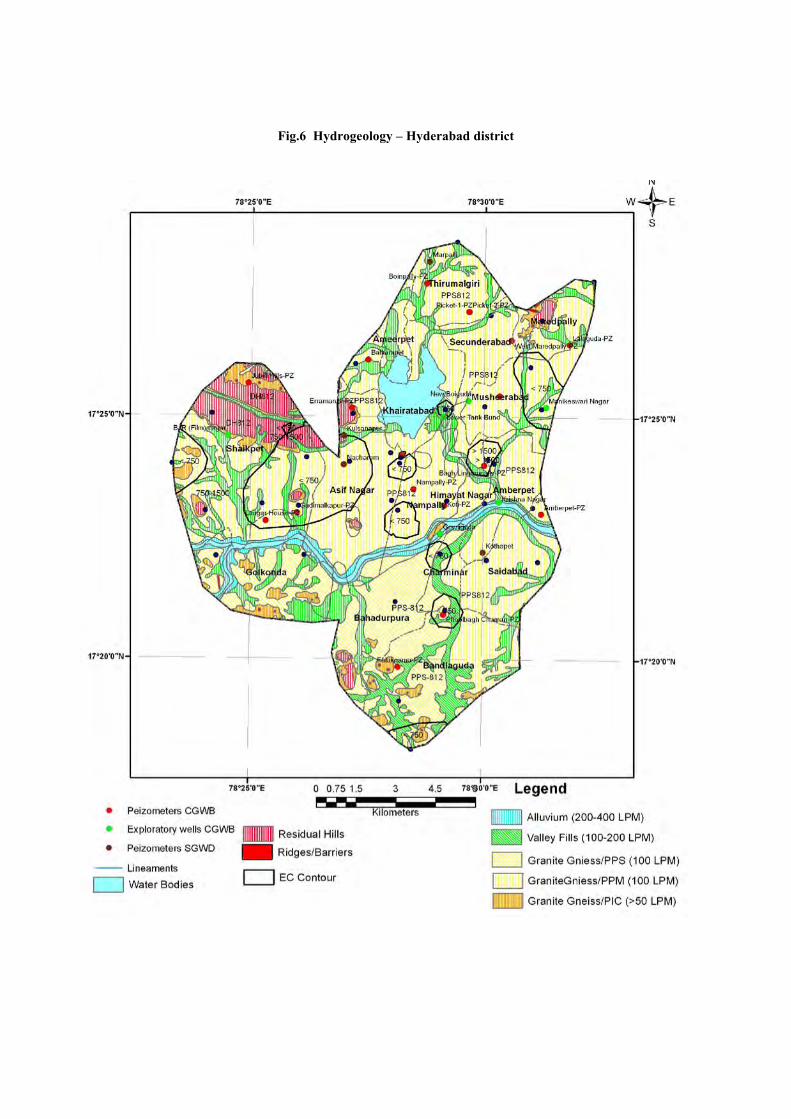
Fig.6 Hydrogeology – Hyderabad district

More than 97% of the area is underlain by the Archaean group of rocks consisting of mostly pink and grey granites and the remaining 3% of the area is underlain by the Alluvium. Accordingly two aquifer systems exist in the area, i.e Aquifers of the granites and Aquifers of Alluvium, though alluvial aquifers are insignificant.
7.1 Crystalline Aquifers
The aquifers are of anisotropic and non-homogenous type resulting in different hydrogeological conditions within the shorter distances depending upon degree and intensity of fracture and recharge conditions. The thickness of the weathered zone varies from 5-25 m (Fig.7) and yield ranges from negligible to 5 lps. High density of shallow fractures (Fig.8) are observed in the eastern, western and northern parts of the area while moderate to low density fractures are observed in central part in the main city area. In general, the shallow fractures are more productive than the deeper ones. But, in some locations in the western parts, the deeper fractures (127 m & 172 m) are more productive (6 lps at Film Nagar and 10 lps at Borabanda).
Fig.7 Thickness of the weathered Zone Fig-8 Occurrence of shallow fractures
The depth to water level ranges from 3.30 m (Manikeswarinagar) to 56.3 m in (Film nagar).The yield of wells varies from 0.21 to 6.9 lps with drawdown of 6 to 20.6 m. The specific capacities of the bore wells range between 10.0 lpm/m (New Boiguda) to 72 lpm/m (Borabanda) and the Transmissivity of the aquifers ranges between 0.48 and 202 sq.m/day.

7.2 Alluvial Aquifers
The alluvial formations occur as isolated patches along the Musi River. It consists of medium to fine grained sand, silt with thickness varies from few meters to about 5 meters. Ground Water occurs under phreatic conditions. The ground water used to be developed through large diameter dug wells, but presently not in practice due to the contamination of the pollutants from the Musi effluents
7.3 Ground Water Levels
The depth to water levels in general varies between 5 and 20 m and average water level is 12 m. The depth to water level during pre-monsoon period varies from 5 m to 20 m bgl, whereas during post monsoon periods it varies from 2 m to 15 m bgl (Fig.9&10). In the core area of Hyderabad, pre-monsoon water level ranges from 6.10 (Erra Manzil) to 17.33 m (Nampalli) and the post monsoon water level ranges from 1.40 m (Alwal) to 9.42 m (West Maredpalli) and from 8.65 (Tarnaka) to 18 m (Kothapaet). In Secunderabad area, pre-monsoon water levels ranges from 7.26 m (Bolarum) to 23.40 m (West Maredpalli) and post- monsoon water level ranges from 2.40 m (Bolarum) to 9.5 m (West Maredpalli). In the peripheral areas of Hyderabad, the pre-monsoon water level ranges from 1.98 (Ahmedguda) to 7.7 m (Patancheru) and post monsoon water level ranges from 2.90 (Kokapet) to 6.7 (Suraram). The population density and associated ground water draft guide the occurrence of water levels at deeper depths. In many places of the city the depth to water level exceeds 20m during pre and post monsoon periods where population density is dense (Boinpalli, Kothapet, Sanath Nagar etc).
Table-5 Details of ground water exploration
S.No Location Topography Hydro-geological set-up Other Information
S.W.L (m)
Q (lpm)
T (m2/day)
Quality Weathered
Depth Fracture
zones Potential deep fracture rock
1 BJR (film) nagar
Topographic High
Nil 61-63, 127-128
Massive rock in recharge area
56.35 216 31 Not potable, high F
2 Borabanda Topographic High
Nil 172-173 Near major E-W lineament and intersecting N-S block joints
25 574 202 Not potable, high F
Moderately potential weathered &fractured rock 3 Manikeswari
Nagar Moderately sloping ground
18.8 24-25 Recharge area 3.30 357 63 Not potable
4 Krishna Nagar
Topographic low
13.7 50,51, 68-70, 77
Upstream 12.35 314 59 Potable
5 Lower Tank bund
Moderately sloping ground
14.7 34-35, 56-57, 71-72
Close to contaminated drainage course
13.4 225 9
6 New Boiguda
7.1 9-10, 18-19, 25-26, 156-157
Recharge area 5.34 240 11 Potable
Massive rock with very poor yield 7 Rehmat
Nagar Topograhic high
nil nil Massive rock in recharge area
14 0.87 Not Potable
8 Sanath Nagar
Moderately sloping ground
5.5 nil Massive rock 19.3 0.666 Potable
Less potential rock with minor fractures 9 Sultan Bazar Moderately
sloping ground 11 80-82 Low recharge area,
massive rock 11 60 6
10 Gowliguda Topographic low
8.0 11-12, 130-132, 156-158
In Musi River Island
8.6 60 0.48

The high draft in dense urban agglomerations has resulted in drying up of shallow hand
pumps (Miyapur, Kukatpalli, Chanda Nagar, Dilsukhnagar, Sanath Nagar, Madhapur etc).
The depth to water levels are shallow in adjacent to the surface water bodies (Lower
tankbund, Kapra, Safilguda, etc). The water levels are moderate at (5-7 m) at peripheral
areas, semi-urban agglomerations. The deeper water levels can be attributed to ground water
draft for irrigation purposes.
The water levels are depleted over the years at many areas like Kothapet, Moulali,
Kukatpalli, Boinpalli, Aghapura, Erragadda, Bashherbagh, Langar house, Jubilee hills,
Begumpet, Koti, West Maredpalli, Gudimalkapur, Mushherabad, Sanath nagar, Picket and
Madhapur (Fig-11).
Fig-9 Depth to Water levels (Pre-Monsoon)

Fig-10 Depth to Water levels (Post-Monsoon)
However, there is a substantial increase of ground water levels in most of the localities of
Hyderabad due to the high precipitation received after 2008. This is not observed in localities
like Khairatabad, Humayun Nagar and Nampally, Sanath Nagar etc.
Fig-11 Hydrographs of select monitoring wells in City Core area

8.0 Ground Water Resources
The dynamic ground water resources (2009) of Hyderabad has been estimation and the
details are given in the Table-6.
Table-6 Ground Water Resources of Hyderabad District (GEC-2009) Ground Water Availability ha.m
Ground Water Utilization ha.m
Ground Water Balance ha.m
Stage of Development (%)
Category
1400 12099 -10699 864 OE
9.0 Ground Water Quality
The effects of urbanization and industrialization in Hyderabad led to the contamination of
ground water. Due to inadequate sewerage system and treatment capacities, the domestic
sewerage and industrial effluents are letting directly into the nalas and streams, causing
severe ground water contamination. The concentration of chemical constituents in ground
water at different locations is presented in Fig.12. The Nitrate (NO3) content is more than
permissible limits of BIS drinking water standards in 72 % of samples at Moosapet, Alwal,
Kutubshahi tombs, Tarnaka, Amberpet, Moosarambagh, Lalapet, Nallakunta, Secunderabad,
Kavadiguda, Ranigunj, Gosha Mahal, Golconda fort, Langar house, Tolichowki, Sanath
Nagar, Tadbund, Chandrayangutta(Fig.13&14). The general range of chemical constituents in
ground water in pre and post monsoon periods is furnished in the Table-7 & 8.
Fig -12 Water Quality Parameters in Hyderabad district : Post-monsoon
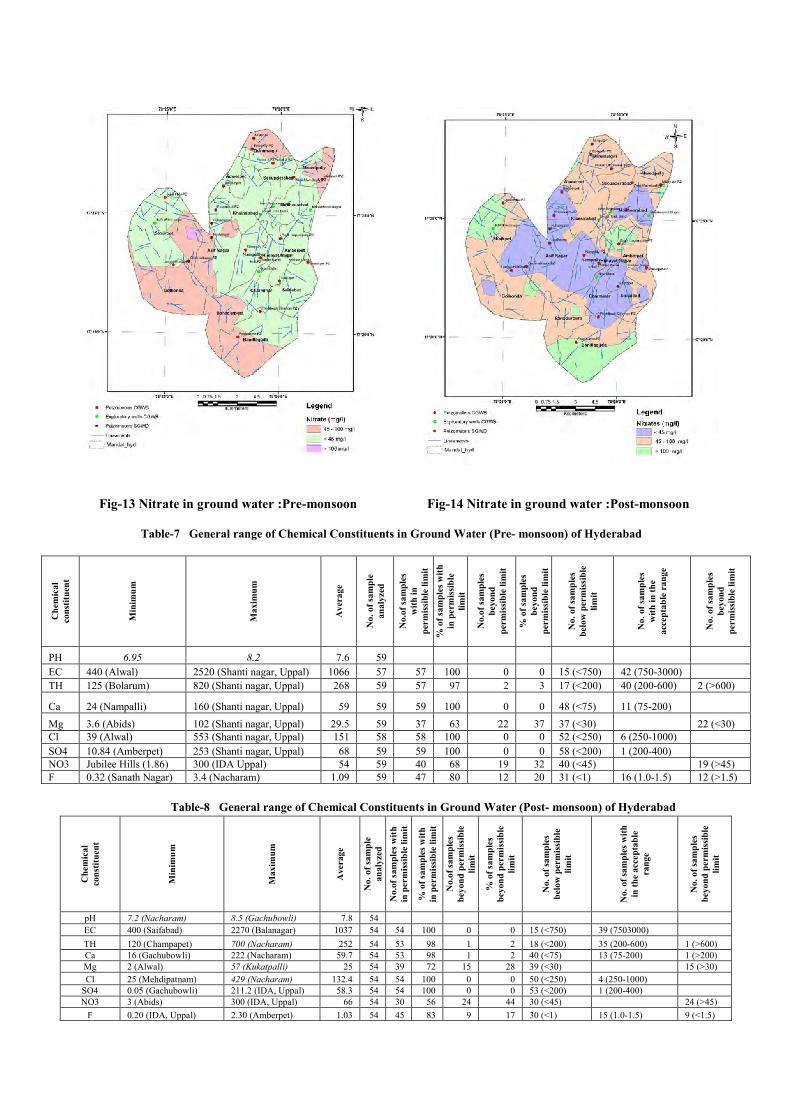
Fig-13 Nitrate in ground water :Pre-monsoon Fig-14 Nitrate in ground water :Post-monsoon
Table-7 General range of Chemical Constituents in Ground Water (Pre- monsoon) of Hyderabad
Ch
emic
al
con
stit
uen
t
Min
imu
m
Max
imu
m
Ave
rage
No.
of
sam
ple
an
alyz
ed
No.
of s
amp
les
wit
h i
n
per
mis
sib
le l
imit
% o
f sa
mp
les
wit
h
in p
erm
issi
ble
li
mit
No.
of s
amp
les
bey
ond
p
erm
issi
ble
lim
it
% o
f sa
mp
les
bey
ond
p
erm
issi
ble
lim
it
No.
of
sam
ple
s b
elow
per
mis
sib
le
lim
it
No.
of
sam
ple
s w
ith
in
th
e ac
cep
tab
le r
ange
No.
of
sam
ple
s b
eyon
d
per
mis
sib
le l
imit
PH 6.95 8.2 7.6 59
EC 440 (Alwal) 2520 (Shanti nagar, Uppal) 1066 57 57 100 0 0 15 (<750) 42 (750-3000)
TH 125 (Bolarum) 820 (Shanti nagar, Uppal) 268 59 57 97 2 3 17 (<200) 40 (200-600) 2 (>600)
Ca 24 (Nampalli) 160 (Shanti nagar, Uppal) 59 59 59 100 0 0 48 (<75) 11 (75-200)
Mg 3.6 (Abids) 102 (Shanti nagar, Uppal) 29.5 59 37 63 22 37 37 (<30) 22 (<30) Cl 39 (Alwal) 553 (Shanti nagar, Uppal) 151 58 58 100 0 0 52 (<250) 6 (250-1000)
SO4 10.84 (Amberpet) 253 (Shanti nagar, Uppal) 68 59 59 100 0 0 58 (<200) 1 (200-400) NO3 Jubilee Hills (1.86) 300 (IDA Uppal) 54 59 40 68 19 32 40 (<45) 19 (>45) F 0.32 (Sanath Nagar) 3.4 (Nacharam) 1.09 59 47 80 12 20 31 (<1) 16 (1.0-1.5) 12 (>1.5)
Table-8 General range of Chemical Constituents in Ground Water (Post- monsoon) of Hyderabad
Ch
emic
al
con
stit
uen
t
Min
imu
m
Maxi
mu
m
Aver
age
No.
of
sam
ple
an
alyz
ed
No.
of s
amp
les
wit
h
in p
erm
issi
ble
lim
it
% o
f sa
mp
les
wit
h
in p
erm
issi
ble
lim
it
No.
of s
amp
les
bey
ond
per
mis
sib
le
lim
it
% o
f sa
mp
les
bey
ond
per
mis
sib
le
lim
it
No.
of
sam
ple
s b
elow
per
mis
sib
le
lim
it
No.
of
sam
ple
s w
ith
in
th
e acc
epta
ble
ra
nge
No.
of
sam
ple
s b
eyon
d p
erm
issi
ble
li
mit
pH 7.2 (Nacharam) 8.5 (Gachubowli) 7.8 54
EC 400 (Saifabad) 2270 (Balanagar) 1037 54 54 100 0 0 15 (<750) 39 (7503000)
TH 120 (Champapet) 700 (Nacharam) 252 54 53 98 1 2 18 (<200) 35 (200-600) 1 (>600) Ca 16 (Gachubowli) 222 (Nacharam) 59.7 54 53 98 1 2 40 (<75) 13 (75-200) 1 (>200) Mg 2 (Alwal) 57 (Kukatpalli) 25 54 39 72 15 28 39 (<30) 15 (>30)
Cl 25 (Mehdipatnam) 429 (Nacharam) 132.4 54 54 100 0 0 50 (<250) 4 (250-1000) SO4 0.05 (Gachubowli) 211.2 (IDA, Uppal) 58.3 54 54 100 0 0 53 (<200) 1 (200-400) NO3 3 (Abids) 300 (IDA, Uppal) 66 54 30 56 24 44 30 (<45) 24 (>45)
F 0.20 (IDA, Uppal) 2.30 (Amberpet) 1.03 54 45 83 9 17 30 (<1) 15 (1.0-1.5) 9 (<1.5)
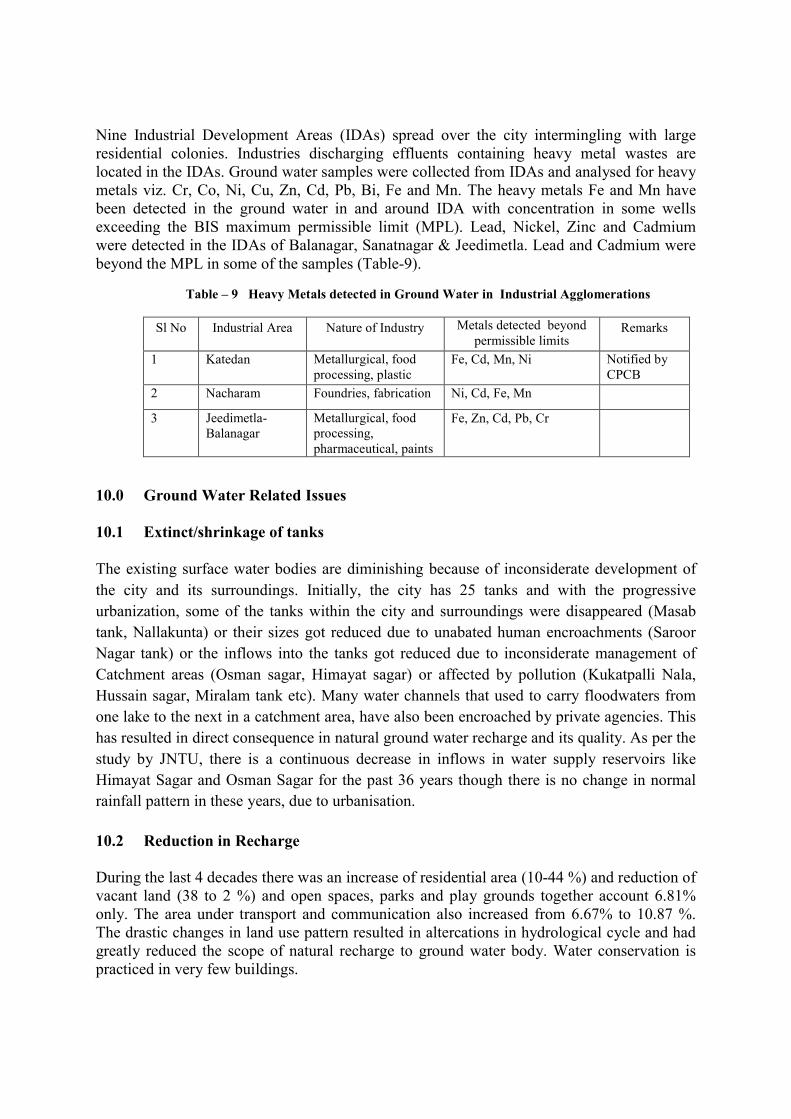
Nine Industrial Development Areas (IDAs) spread over the city intermingling with large residential colonies. Industries discharging effluents containing heavy metal wastes are located in the IDAs. Ground water samples were collected from IDAs and analysed for heavy metals viz. Cr, Co, Ni, Cu, Zn, Cd, Pb, Bi, Fe and Mn. The heavy metals Fe and Mn have been detected in the ground water in and around IDA with concentration in some wells exceeding the BIS maximum permissible limit (MPL). Lead, Nickel, Zinc and Cadmium were detected in the IDAs of Balanagar, Sanatnagar & Jeedimetla. Lead and Cadmium were beyond the MPL in some of the samples (Table-9).
Table – 9 Heavy Metals detected in Ground Water in Industrial Agglomerations
Sl No Industrial Area Nature of Industry Metals detected beyond permissible limits
Remarks
1 Katedan Metallurgical, food processing, plastic
Fe, Cd, Mn, Ni Notified by CPCB
2 Nacharam Foundries, fabrication Ni, Cd, Fe, Mn
3 Jeedimetla-Balanagar
Metallurgical, food processing, pharmaceutical, paints
Fe, Zn, Cd, Pb, Cr
10.0 Ground Water Related Issues 10.1 Extinct/shrinkage of tanks
The existing surface water bodies are diminishing because of inconsiderate development of
the city and its surroundings. Initially, the city has 25 tanks and with the progressive
urbanization, some of the tanks within the city and surroundings were disappeared (Masab
tank, Nallakunta) or their sizes got reduced due to unabated human encroachments (Saroor
Nagar tank) or the inflows into the tanks got reduced due to inconsiderate management of
Catchment areas (Osman sagar, Himayat sagar) or affected by pollution (Kukatpalli Nala,
Hussain sagar, Miralam tank etc). Many water channels that used to carry floodwaters from
one lake to the next in a catchment area, have also been encroached by private agencies. This
has resulted in direct consequence in natural ground water recharge and its quality. As per the
study by JNTU, there is a continuous decrease in inflows in water supply reservoirs like
Himayat Sagar and Osman Sagar for the past 36 years though there is no change in normal
rainfall pattern in these years, due to urbanisation.
10.2 Reduction in Recharge During the last 4 decades there was an increase of residential area (10-44 %) and reduction of vacant land (38 to 2 %) and open spaces, parks and play grounds together account 6.81% only. The area under transport and communication also increased from 6.67% to 10.87 %. The drastic changes in land use pattern resulted in altercations in hydrological cycle and had greatly reduced the scope of natural recharge to ground water body. Water conservation is practiced in very few buildings.
10.3 Ground water quality related issues Discharge of untreated industrial and domestic effluents has led to the total degradation of the water quality in surface and sub-surface water bodies. The sewerage network coverage is low and the treatment facilities are highly inadequate. Most of the untreated sewage finds its way into water bodies resulting in poor water quality, high pollution, loss of habitat and environmental degradation. River Musi, the main source of water, gets an estimated untreated sewage of 500 ML per day. Hussain Sagar Lake, once used to supply water for the city till 1930 is getting untreated domestic sewage creating high pollution levels. 11.0 Ground Water Development & Management Strategies 11.1 Further Ground Water Development
25-30 % of total water requirement is being met through ground water. Considering the limited potential of hard rock aquifers, reduced recharge and that the resource is being tapped from deeper depths any large scale development of ground water resources is not advisable without adopting proper augmentation practices and strict implementation strategies.
11.2 Management Strategies 11.2.1 Roof Top Rain Water Harvesting and Artificial Recharge In view of huge availability of larger roof areas, adoption of various water conservation measures is the need of hour. Delay in implementation of various conservation methods large scale will lead to a further depletion and contamination of ground water. Hence, the Rain Water Harvesting of Roof Top is required to be implemented on mandatory basis in urban areas.
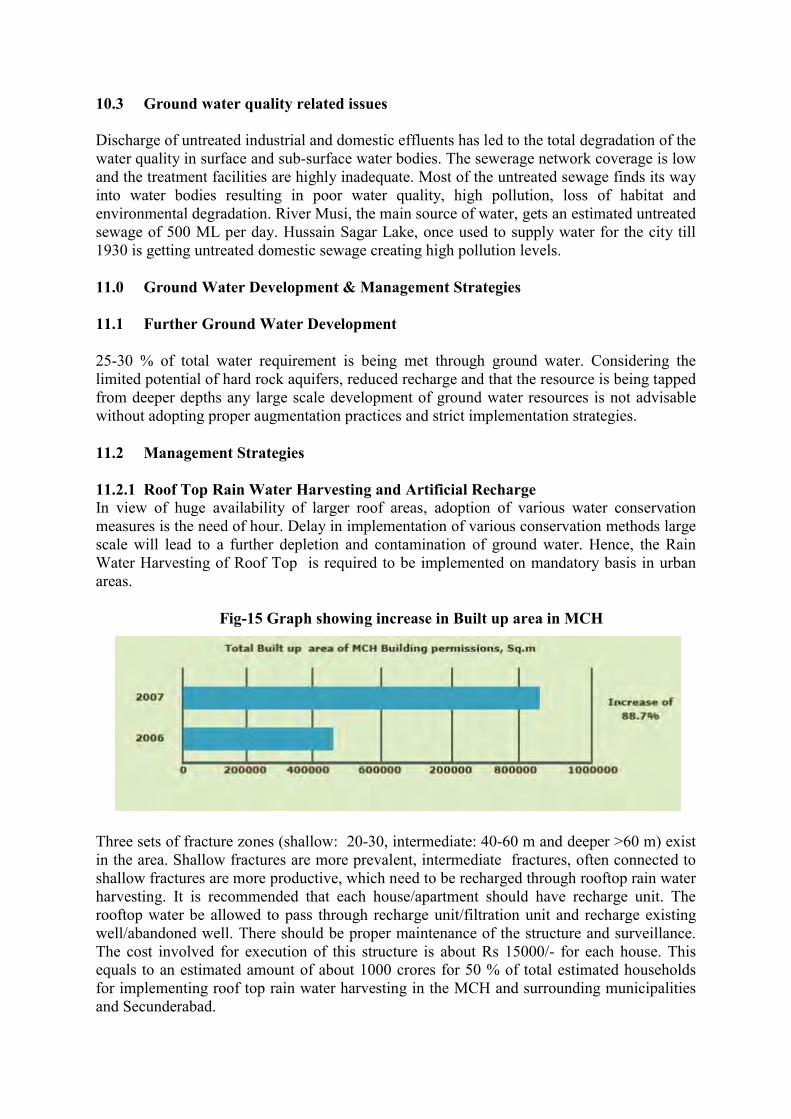
Fig-15 Graph showing increase in Built up area in MCH
Three sets of fracture zones (shallow: 20-30, intermediate: 40-60 m and deeper >60 m) exist in the area. Shallow fractures are more prevalent, intermediate fractures, often connected to shallow fractures are more productive, which need to be recharged through rooftop rain water harvesting. It is recommended that each house/apartment should have recharge unit. The rooftop water be allowed to pass through recharge unit/filtration unit and recharge existing well/abandoned well. There should be proper maintenance of the structure and surveillance. The cost involved for execution of this structure is about Rs 15000/- for each house. This equals to an estimated amount of about 1000 crores for 50 % of total estimated households for implementing roof top rain water harvesting in the MCH and surrounding municipalities and Secunderabad.

Besides this, in twin cities, Defence establishments (Secunderabad area), Universities, Central and State Institutions, Public Parks, Play grounds etc have large open areas. These areas are also suitable for taking up artificial recharge structures such as recharge shafts and recharge pits. 11.2.2 Storm runoff collection and recharge Hyderabad often faces serious floods during monsoons. This water can be recharged with proper infrastructure. The storm runoff generated within an area can be utilized for groundwater recharge by diverting it into suitably designed structures near pavements, parking lots, municipal parks, play grounds, stadiums, airports etc., and by earmarking some open spaces exclusively for the purpose. As per the land use pattern, a total of 66% including Residential areas (44.24%), Parks and play grounds (6.81%), Defence establishments (4.83 %), Public and semi-public (9.01%) and Vacant open lands (1.58%) can be brought under the ambit of Artificial recharge. The design of recharge structures should involve construction of sufficient number of recharge pits and trenches filled with gravel. Pavements can be utilized for collecting roadside run off and for recharging groundwater. Permeable pavement is an alternative to conventional paving in which water permeates through the paved structure rather than draining off it. 11.2.3 Waste water Recycling Methods Wastewater recycling and reuse at source can save up to 45% of water demand in individual residential buildings and can save up to 60% of water demand in apartment complexes, residential layouts, townships, institutional buildings and other large neighbourhoods. Introduction of dual plumbing systems to segregate wastewater (grey & black) will enable the separation of grey and black water at the source of generation. The grey water (sullage) constitutes about 70% of the wastewater generated, which can be treated by using simple and cost effective systems and thereby can be reused for landscaping, external washing in all treatment options and also be used for WC flushing by using some secondary treatment options. Once the grey water is separated, the remaining black water (sewage) can then be treated by decentralized wastewater treatment systems. These parameters will enable the architects/ contractors/ developers and users in assessing upon type of treatment option that should be adopted for different types of buildings. 11.2.4 Measures to prevent from contamination Comprehensive sewerage system in uncovered areas, strict disposal of treated waste by industries, restoration of tanks and maintenance of existing ground water structures, prevent ground water contamination. 11.2.5 Water Use Auditing Water use audits are an important initiative toward understanding a building’s water use and how it can be reduced. It reviews water use from its point of entry into the building through its discharge into the sewer. It identifies each point of water use within and around the building and estimates the quantity of water used at each of these areas.