GROUND WATER BROCHUREcgwb.gov.in/District_Profile/Telangana/Nizamabad.pdfGROUND WATER BROCHURE...
29
For Official Use Only CENTRAL GROUND WATER BOARD MINISTRY OF WATER RESOURCES GOVERNMENT OF INDIA GROUND WATER BROCHURE NIZAMABAD DISTRICT, ANDHRA PRADESH SOUTHERN REGION HYDERABAD September 2013
Transcript of GROUND WATER BROCHUREcgwb.gov.in/District_Profile/Telangana/Nizamabad.pdfGROUND WATER BROCHURE...

For Official Use Only
CENTRAL GROUND WATER BOARD MINISTRY OF WATER RESOURCES
GOVERNMENT OF INDIA
GROUND WATER BROCHURE NIZAMABAD DISTRICT, ANDHRA PRADESH
SOUTHERN REGION HYDERABAD September 2013

CENTRAL GROUND WATER BOARD MINISTRY OF WATER RESOURCES
GOVERNMENT OF INDIA
GROUND WATER BROCHURE
NIZAMABAD DISTRICT, ANDHRA PRADESH (AAP-2012-13)
By
G. PRAVEEN KUMAR Assistant Hydrogeologist
SOUTHERN REGION BHUJAL BHAWAN, GSI Post, Bandlaguda NH.IV, FARIDABAD-121001 Hyderabad-500068 HARYANA, INDIA Andhra Pradesh TEL: 0129-2418518 Tel: 24222508 Gram: Bhumijal Gram: Antarjal
GROUND WATER BROCHURE NIZAMABAD DISTRICT, ANDHRA PRADESH
CONTENTS DISTRICT AT A GLANCE 1.0 INTRODUCTION
1.1. Drainage 1.2. Land use 1.3. Cropping pattern 1.4. Irrigation 1.5. Studies carried out by CGWB
2.0 RAINFALL 3.0 GROUND WATER SCENARIO
3.1 Hydrogeology 3.2 Depth to water level 3.3 Ground water resources 3.4 Ground water quality
4.0 STATUS OF GROUND WATER DEVELOPMENT 5.0 GROUND WATER MANAGEMENT STRATEGY
6.0 RECOMMENDATIONS

N I Z A M A B A D D I S T R I C T A T A G L A N C E
1. GENERAL Location North Latitude 18
0 05' 19
0 00'
East Longitude 770 40' 78
0 37'
Geographical area 7956 sq.km Headquarters Nizamabad
No. of revenue mandals 36 No. of revenue villages 922 Population (2011) Urban 587800
Rural 1964273
Total 2552073 Population density 321 per sq.km Major rivers Godavari, Manjira, Maneru
Soils Black and red
Agroclimatic zone Zone-10-Northern Telangana zone
2. RAINFALL
Actual Rainfall
845 mm
3. LAND USE (2012) (Area in ha.) Forest 1,69,343
Barren and uncultivated 46,833 Cultivable waste 13,093
Current fallows 59,068 Net area sown 3,37,329 4. IRRIGATION (2012) (Area in ha.) Source of irrigation
Canals 47,182
Tanks 12,145
Dug wells 2797 Bore / Tube wells 1,45,027
Others 6,905 Net area irrigated 2,14,056
Gross area irrigated 3,98,454
Major irrigation projects Nizamsagar and Sriramsagar Medium irrigation projects Pocharam, Ramadugu
Koulasnala & Nallavagu 5. GEOLOGY
Major rock types Granites, granite gneisses and basalts 6. GROUND WATER Exploration by CGWB

No. of wells drilled 52 Major aquifer zones 8-70 m bgl
Aquifer parametres Transmissivity (m2/day) Consolidated 2.6 to 117 sq.m/day
(hard) rocks Unconsolidated 674 to 4576 sq.m/day rocks Storage Co-efficient Consolidated 2.8 x 10 -5 to 1.5 x 10 -4
(hard) rocks
Monitoring No. of observation wells 35 Dug wells 14 Piezometers 13 Manual 21
Range of water levels (May 2012)
Min – max 2.59 and 29.32 m bgl Range of water levels (Nov 2012) Min – max 0.40 and 20 m bgl
7. GROUND WATER RESOURCES (MCM)
Net annual ground water availability 1236.78
Net annual draft 942.25
Balance resource 282.33 Stage of ground water development 76%
8. GROUND WATER DEVELOPMENT CATEGORY
No. of mandals categorised as
Safe (<70 % of net available resource) 24 Semi Critical (70 - 90 %) 05 Critical (90 - 100 %) 01
Over exploited (> 100 %) 06
9. CHEMICAL QUALITY
Electrical Conductivity (micro Siemens / cm at 25 deg. C) 540 to 3530 Chloride (mg/l) 28 to 546
Fluoride (mg/l) 0.18 to 1.7 Nitrate (mg/l) Nil to 340

GROUND WATER BROCHURE NIZAMABAD DISTRICT, ANDHRA PRADESH
1.0 INTRODUCTION
The Nizamabad district, named after the Nizam of Hyderabad Asaf Jah VI
is one of the ten districts of Telangana region. The total geographical area of the
district is 7956 sq.km i.e., about almost 3 percent of the total area of the State.
The district is located in North Western part of the State bordering Maharashtra
State. It lies between 18º 05" 00' and 19º 00" 00' North latitudes and 77º 32" 00’
and 78º 40'" 00' East longitudes (Fig.1). Nizamabad district is primarily an
agrarian district ranking first among Telangana districts of the State with almost
80% populace living in rural areas. The district has a population of 25,52,073.
Density of population in the district is 321 persons/ km2.
1.1 Drainage The district falls under Godavari river basin. The two tributaries Manjira
and Maneru join the Godavari. The Manjira flows from South East to North West
and then towards North, takes an easterly turn and then flows in NNE direction
before joining the Godavari at Kadakurthi (Sangam). The Maneru river flows
from Kamareddy towards south east in the district.
The drainage predominantly forms dendritic pattern, which is governed by
lithology of the area in absence of structural control. Granitic and basaltic
terrains mainly exhibit this type of pattern while the rare parallel to sub-parallel
drainage pattern locally exhibited in alluvial areas.
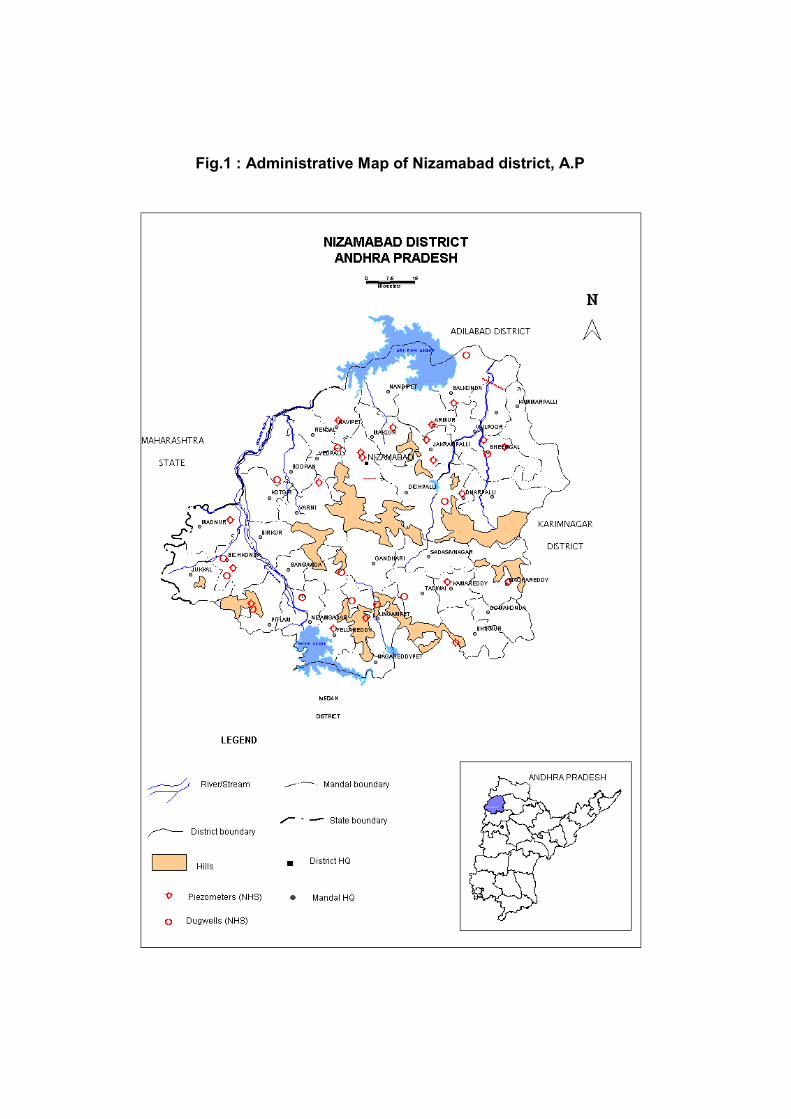
Fig.1 : Administrative Map of Nizamabad district, A.P

1.2 Land Use
The land use particulars of the District for the year 2012 are shown in Table-1.
Table-1: Land Use Pattern (2011-2012).
Sl. No.
Category Area in Ha
1 Forest 169343 2 Barren & uncultivable lands 46833 3 Land put to non-agricultural use 97053 4 Cultivable waste 13093 5 Permanent pastures 19780 6 Land under miscellaneous, tree, crops
and grooves not included in net sown area 1540
7 Other fallow lands 51561 8 Current fallow lands 59068 9 Net area sown 337329 10 Area sown more than once 226460
1.3 Cropping Pattern The district is the most developed agrarian district of the State. Paddy
and Maize are the main crops grown in the district. Other crops include
Bengalgram, jowar, groundnut, cotton, turmeric, chillies, greengram, black gram,
soyabeen, Sugarcane etc. Mostly long duration paddy and sugarcane are grown
in perennial zone (falling under canal command area). In dry lands, crops like
jowar, ragi, groundnut and cotton are cultivated.
1.4 Irrigation
Total net area of 2,14,056 ha was irrigated in the district during 2012.
About 5% of net area irrigated was under surface water, while the rest 95% was
irrigated by ground water.
i) Surface water:
There are two major irrigation projects namely, Nizamsagar and
Sriramsagar projects and 4 medium irrigation projects namely Pocharam,

3 Ramudugu, Koulasnala and Nallavagu projects. Besides this, there are
several minor irrigation projects in the district. A net area of 6650 hectares was
irrigated under surface water during 2009-2010. Net area of 4319 ha was
irrigated under major and medium projects and 2331 hectares under minor
irrigation projects.
ii) Ground water:
Net area of 1477824 ha was irrigated under ground water during the year
2012 . Area irrigated by different sources is presented in Table-2.
Table2: Area irrigated by different sources (2012).
Sl. No.
Source Net Area in Ha
1 Canals 47182 2 Tanks 12145 3 Tube wells 145027 4 Dug wells 2797 5 Other sources 6905
1.5 Studies carried out by CGWB
CGWB has covered the entire district by systematic hydrogeological
surveys. The hydrogeological conditions of the district are reappraised by
CGWB at regular intervals. Exploratory drilling for ground water was carried out
in parts of Nizamabad district during the years 1999-2011. During this period,
112 wells in 68 locations. The details are given in table No. 3.
Table No. 3 : Exploratory well details (1999-2011)
Type of well Number of wells drilled
Exploratory wells 52
Observation wells 12
Piezometers 48
The analysis of the exploration data reveals that the depth of weathered
zone ranges from 5 m. to 35 m.bgl. Major area in the district is covered by the
weathered zone with thickness ranging from 5 to 20 m.bgl.
The depth of first fracture encountered ranges from 5.0 m. to 30.0 m.bgl.
In about 83% of the wells drilled, the shallow fractures occur between 10.0 – 25.0

m.bgl. The drilling discharge of these shallow aquifers varies from 0.01 lps to 2.5
lps.
Deeper fractures were encountered upto a depth of 166 m.bgl. About
77% of the fractures are encountered in 25 to 75 m.bgl depth range. In majority
of the wells, the yield is less than 2.0 lps. About 88% of the fractures yield
between 0.1 to 2.0 lps.
Ground water regime in the district is monitored four times in a year on
regular basis through a network of 19 dug wells and 13 purpose built
piezometers.
2.0 RAINFALL
The annual rainfall of the district is 845 mm during 2012. The mean
monthly rainfall distribution is given in Figure 2.
The annual and seasonal rainfall distribution with its departure from mean
along with percentage distribution year-wise is given in Table 4. The data is
presented in Figure 2. The annual rainfall ranges from 685 mm in 2002 to 1198
mm in 2005. The annual rainfall departure ranges from -36 % in 2002 and 2009
to 12 % in 2005. The southwest monsoon rainfall contributes about 86 % of
annual rainfall. It ranges from 565 mm in 2002 to 993 mm in 2000. The year
2002, 2004 and 2009 experienced drought conditions in the district as the annual
rainfall recorded in these three years is less than 75% of normal. The distribution
of annual rainfall and its departure from normal is presented in Figure 2. It
indicates that, the cumulative rainfall departure as on 2011 is negative i.e. -
169%, showing rainfall deficit.

TABLE : 4 MONTHLY RAINFALL DISTRIBUTION (1999-2011)
Sl No
YEAR ANNUAL SWM NEM WINTER SUMMER SWM(%) NEM(%) WINTER
(%) SUMMER
(%)
DEP FROM LPA (%)
1 1999 963.0 866.0 59.0 0.0 38.0 89.93% 6.13% 0.00% 3.95% -10%
2 2000 1043.0 993.0 6.0 4.0 40.0 95.21% 0.58% 0.38% 3.84% -3%
3 2001 869.9 693.0 116.9 1.0 59.0 79.66% 13.44% 0.11% 6.78% -19%
4 2002 684.8 564.8 52.0 35.0 33.0 82.48% 7.59% 5.11% 4.82% -36%
5 2003 831.4 750.0 44.0 6.0 31.4 90.21% 5.29% 0.72% 3.78% -22%
6 2004 733.1 598.7 54.0 8.4 72.0 81.67% 7.37% 1.15% 9.82% -32%
7 2005 1197.8 984.5 102.3 74.8 36.2 82.19% 8.54% 6.24% 3.02% 12%
8 2006 1066.6 881.0 59.7 0.0 125.9 82.60% 5.60% 0.00% 11.80% 0%
9 2007 917.6 872.2 37.2 0.0 8.2 95.05% 4.05% 0.00% 0.89% -14%
10 2008 959.3 845.1 13.2 12.1 88.9 88.10% 1.38% 1.26% 9.27% -10%
11 2009 689.7 596.4 67.6 0.0 25.7 86.47% 9.80% 0.00% 3.73% -36%
12 2010 1192.7 952.5 192.8 38.7 8.7 79.86% 16.17% 3.24% 0.73% 11%
13 2011 962.9 908.2 15.6 4.2 34.9 94.32% 1.62% 0.44% 3.62% -10%
1070.7 918.8 91.8 14.4 45.7 85.82% 8.57% 1.35% 4.26%
Note : SWM= South west monsoon, NEM = North east monsoon
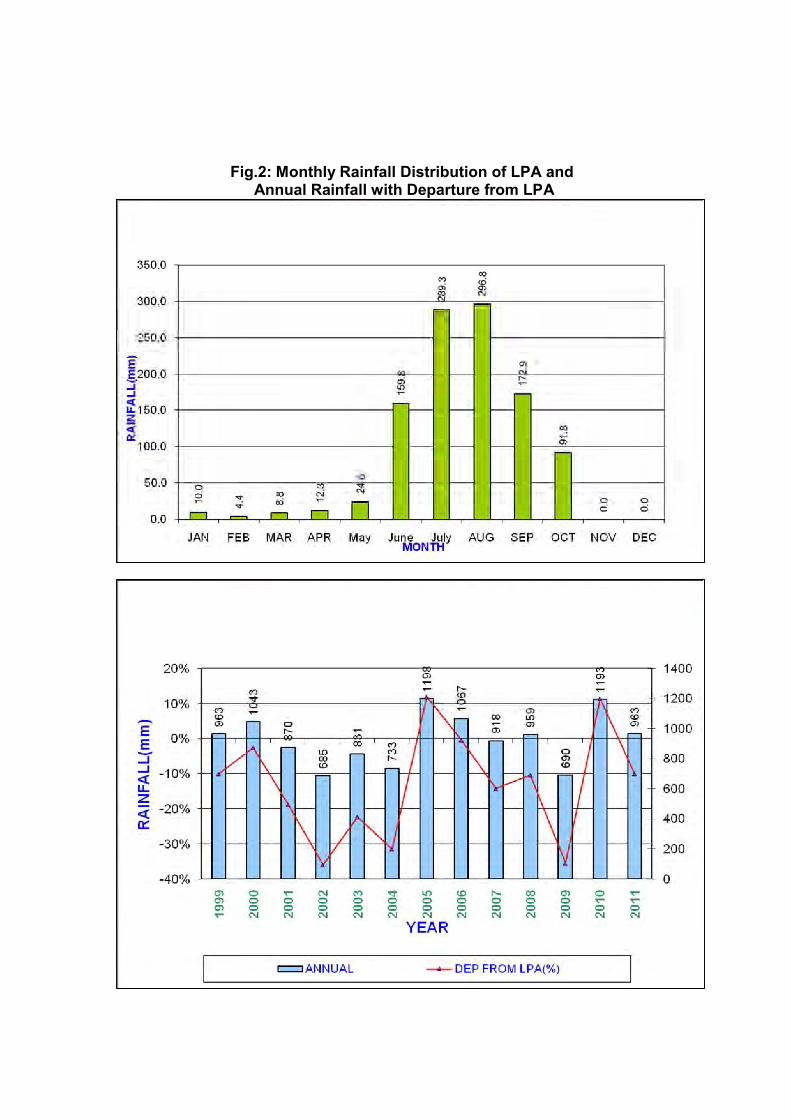
Fig.2: Monthly Rainfall Distribution of LPA and Annual Rainfall with Departure from LPA
3.0 GROUND WATER SCENARIO
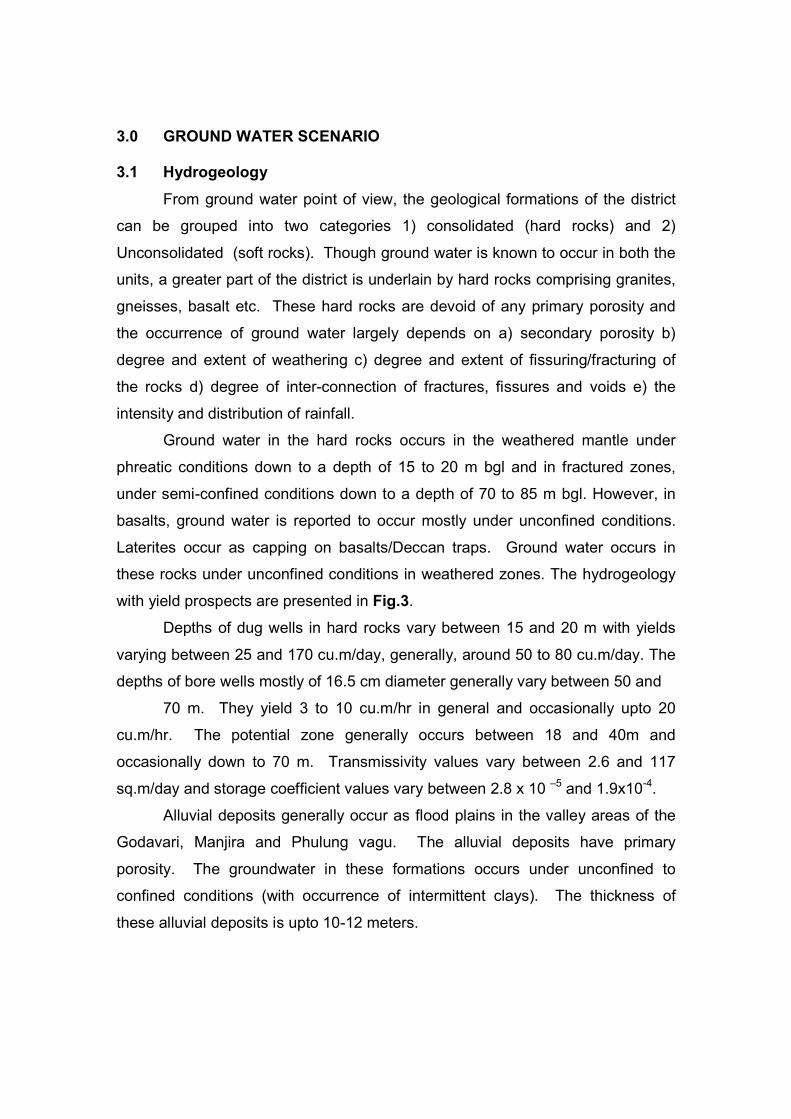
3.1 Hydrogeology
From ground water point of view, the geological formations of the district
can be grouped into two categories 1) consolidated (hard rocks) and 2)
Unconsolidated (soft rocks). Though ground water is known to occur in both the
units, a greater part of the district is underlain by hard rocks comprising granites,
gneisses, basalt etc. These hard rocks are devoid of any primary porosity and
the occurrence of ground water largely depends on a) secondary porosity b)
degree and extent of weathering c) degree and extent of fissuring/fracturing of
the rocks d) degree of inter-connection of fractures, fissures and voids e) the
intensity and distribution of rainfall.
Ground water in the hard rocks occurs in the weathered mantle under
phreatic conditions down to a depth of 15 to 20 m bgl and in fractured zones,
under semi-confined conditions down to a depth of 70 to 85 m bgl. However, in
basalts, ground water is reported to occur mostly under unconfined conditions.
Laterites occur as capping on basalts/Deccan traps. Ground water occurs in
these rocks under unconfined conditions in weathered zones. The hydrogeology
with yield prospects are presented in Fig.3.
Depths of dug wells in hard rocks vary between 15 and 20 m with yields
varying between 25 and 170 cu.m/day, generally, around 50 to 80 cu.m/day. The
depths of bore wells mostly of 16.5 cm diameter generally vary between 50 and
70 m. They yield 3 to 10 cu.m/hr in general and occasionally upto 20
cu.m/hr. The potential zone generally occurs between 18 and 40m and
occasionally down to 70 m. Transmissivity values vary between 2.6 and 117
sq.m/day and storage coefficient values vary between 2.8 x 10 –5 and 1.9x10⁻⁴.
Alluvial deposits generally occur as flood plains in the valley areas of the
Godavari, Manjira and Phulung vagu. The alluvial deposits have primary
porosity. The groundwater in these formations occurs under unconfined to
confined conditions (with occurrence of intermittent clays). The thickness of
these alluvial deposits is upto 10-12 meters.
The depths of filter points in alluvium vary between 9.75 and 15.77 m. the
water levels vary between 5.04 and 5.08 m and the discharges vary between 8.7
and 9.3 liters/second and the transmissivity values vary between 674 and 4576
m2/day.
Fig. 3: Hydrogeology – Nizamabad district, A.P

3.2 Depth to water level 3.2.1 Pre-monsoon A perusal of the maps prepared from pre monsoon water level data (May,
2012) collected from observation wells of C.G.W.B shows that the depth of water
level in the district vary between 2.59 and 29.32 m bgl. The depth to water levels
in major part of the district varies between 5 and 20 m bgl (Fig.4). Shallow water
levels are noticed in small areas on western side of the district, while deeper
water levels of more than 20 m bgl are noticed in eastern side of the district.
Fig.4: Depth to Water Level – Pre monsoon (May 2012)
3.2.2. Post-monsoon
A perusal of the depth to water level map of November, 2012 shows that the
water levels vary between 0.40 and 20 m. In major part of the district, depth to
water level of 2-10 meters is noticed (Fig.5). Deeper water levels of more than
10 m are noticed in eastern and south eastern side of the district, while
shallow/water logged condition with less than 2 m depth to water level is noticed
in small patches in northern, western and south eastern part of the district.
Fig.5: Depth to Water Level – Post monsoon (Nov-2012)
3.2.3 Water level fluctuation
Water level fluctuation between pre-monsoon (May, 2012) and post-
monsoon period (November, 2012) is presented in Fig.6. The perusal of the map
shows that rise in water level varies between less than 2m (0.03) and more than
4m (16.48) is observed. In majority of the area is covered with water level rise of
more than 4 m. Water level fall is not noticed in the district.
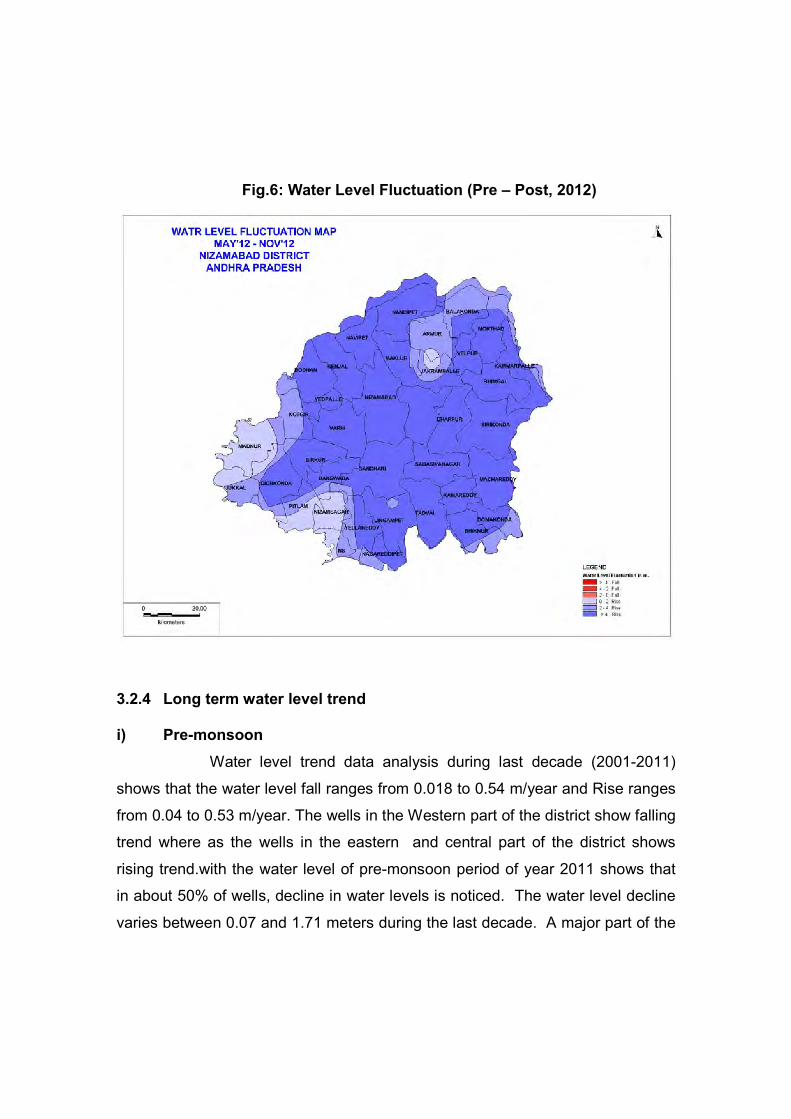
Fig.6: Water Level Fluctuation (Pre – Post, 2012)
3.2.4 Long term water level trend i) Pre-monsoon
Water level trend data analysis during last decade (2001-2011)
shows that the water level fall ranges from 0.018 to 0.54 m/year and Rise ranges
from 0.04 to 0.53 m/year. The wells in the Western part of the district show falling
trend where as the wells in the eastern and central part of the district shows
rising trend.with the water level of pre-monsoon period of year 2011 shows that
in about 50% of wells, decline in water levels is noticed. The water level decline
varies between 0.07 and 1.71 meters during the last decade. A major part of the

district shows water level decline of 2-4 meters (83% wells). The hydrographs of
ground water monitoring wells are presented in Fig.7.
Fig.7: Hydrographs

3.3 Ground Water Resources:
Based on the Ground Water Estimation Committee (GEC-1997)
recommendations, ground water assessment was done in 2011. The mandal
wise details of ground water resources for all the 36 mandals of the district is
presented in Table-5 & 6. The total groundwater resources available in the
district are 1236.78 MCM viz., 514.61 MCM in command area and 722.17
MCM in non-command area. The total ground water utilization is 942.25
MCM viz., 356.93 MCM in command area and 585.32 MCM in non-command
area. Thus, the total ground water balance left is of the order of 282.33 MCM,
145.72 MCM in the command area and the rest 136.61 MCM in non-
command area.
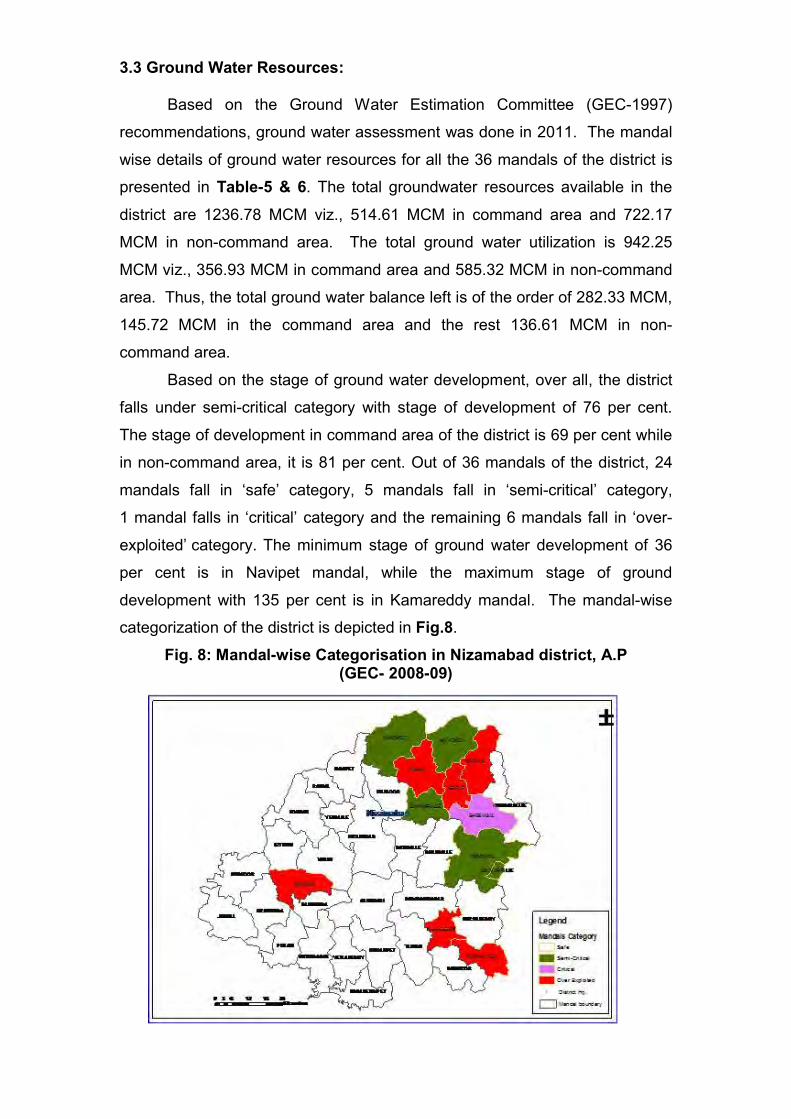
Based on the stage of ground water development, over all, the district
falls under semi-critical category with stage of development of 76 per cent.
The stage of development in command area of the district is 69 per cent while
in non-command area, it is 81 per cent. Out of 36 mandals of the district, 24
mandals fall in ‘safe’ category, 5 mandals fall in ‘semi-critical’ category,
1 mandal falls in ‘critical’ category and the remaining 6 mandals fall in ‘over-
exploited’ category. The minimum stage of ground water development of 36
per cent is in Navipet mandal, while the maximum stage of ground
development with 135 per cent is in Kamareddy mandal. The mandal-wise
categorization of the district is depicted in Fig.8.
Fig. 8: Mandal-wise Categorisation in Nizamabad district, A.P (GEC- 2008-09)
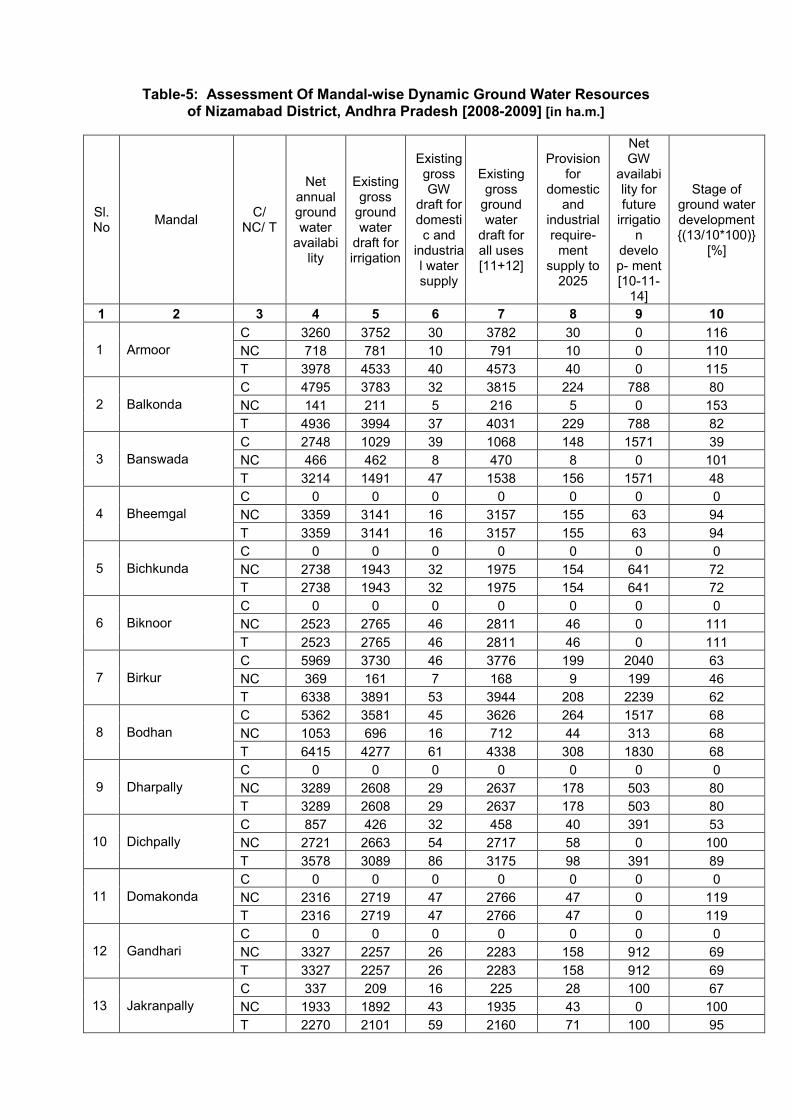
Table-5: Assessment Of Mandal-wise Dynamic Ground Water Resources of Nizamabad District, Andhra Pradesh [2008-2009] [in ha.m.]
Sl.No
Mandal C/
NC/ T
Net annual ground water
availability
Existing gross
ground water
draft for irrigation
Existing gross GW
draft for domestic and
industrial water supply
Existing gross
ground water
draft for all uses [11+12]
Provision for
domestic and
industrial require-
ment supply to
2025
Net GW
availabi lity for future
irrigation
develop- ment [10-11-
14]
Stage of ground water development {(13/10*100)}
[%]
1 2 3 4 5 6 7 8 9 10
1 Armoor
C 3260 3752 30 3782 30 0 116
NC 718 781 10 791 10 0 110
T 3978 4533 40 4573 40 0 115
2 Balkonda
C 4795 3783 32 3815 224 788 80
NC 141 211 5 216 5 0 153
T 4936 3994 37 4031 229 788 82
3 Banswada
C 2748 1029 39 1068 148 1571 39
NC 466 462 8 470 8 0 101
T 3214 1491 47 1538 156 1571 48
4 Bheemgal
C 0 0 0 0 0 0 0
NC 3359 3141 16 3157 155 63 94
T 3359 3141 16 3157 155 63 94
5 Bichkunda
C 0 0 0 0 0 0 0
NC 2738 1943 32 1975 154 641 72
T 2738 1943 32 1975 154 641 72
6 Biknoor
C 0 0 0 0 0 0 0
NC 2523 2765 46 2811 46 0 111
T 2523 2765 46 2811 46 0 111
7 Birkur
C 5969 3730 46 3776 199 2040 63
NC 369 161 7 168 9 199 46
T 6338 3891 53 3944 208 2239 62
8 Bodhan
C 5362 3581 45 3626 264 1517 68
NC 1053 696 16 712 44 313 68
T 6415 4277 61 4338 308 1830 68
9 Dharpally
C 0 0 0 0 0 0 0
NC 3289 2608 29 2637 178 503 80
T 3289 2608 29 2637 178 503 80
10 Dichpally
C 857 426 32 458 40 391 53
NC 2721 2663 54 2717 58 0 100
T 3578 3089 86 3175 98 391 89
11 Domakonda
C 0 0 0 0 0 0 0
NC 2316 2719 47 2766 47 0 119
T 2316 2719 47 2766 47 0 119
12 Gandhari
C 0 0 0 0 0 0 0
NC 3327 2257 26 2283 158 912 69
T 3327 2257 26 2283 158 912 69
13 Jakranpally
C 337 209 16 225 28 100 67
NC 1933 1892 43 1935 43 0 100
T 2270 2101 59 2160 71 100 95
1 2 3 4 5 6 7 8 9 10
14 Jukkal
C 0 0 0 0 0 0 0
NC 2139 935 32 967 121 1083 45
T 2139 935 32 967 121 1083 45
15 Kamareddy
C 0 0 0 0 0 0 0
NC 2077 2738 58 2796 58 0 135
T 2077 2738 58 2796 58 0 135
16 Kammarpally
C 489 463 6 469 15 11 96
NC 3175 2395 21 2416 139 641 76
T 3664 2858 27 2885 154 652 79
17 Kotagiri
C 3904 2507 40 2547 234 1163 65
NC 418 164 44 208 44 210 50
T 4322 2671 84 2755 278 1373 64
18 Lingampet
C 0 0 0 0 0 0 0
NC 3541 2048 35 2083 131 1362 59
T 3541 2048 35 2083 131 1362 59
19 Machareddy
C 0 0 0 0 0 0 0
NC 4897 3364 33 3397 332 1201 69
T 4897 3364 33 3397 332 1201 69
20 Madnoor
C 0 0 0 0 0 0 0
NC 2248 1674 35 1709 140 434 76
T 2248 1674 35 1709 140 434 76
21 Makloor
C 2700 1756 23 1779 160 784 66
NC 400 276 32 308 32 93 77
T 3100 2032 55 2087 192 877 67
22 Morthad
C 1995 2130 74 2204 74 0 110
NC 1781 1971 32 2003 32 0 112
T 3776 4101 106 4207 106 0 111
23 Nagireddypet
C 0 0 0 0 0 0 0
NC 1900 1595 63 1658 143 162 87
T 1900 1595 63 1658 143 162 87
24 Nandipet
C 3245 2280 12 2292 206 759 71
NC 1480 1089 45 1134 71 320 77
T 4725 3369 57 3426 277 1079 73
25 Navipet
C 3421 1389 11 1400 123 1909 41
NC 1253 233 27 260 27 993 21
T 4674 1622 38 1660 150 2902 36
26 Nizamabad
C 2244 1854 9 1863 167 223 83
NC 2554 1979 23 2002 134 441 78
T 4798 3833 32 3865 301 664 81
27 Nizamsagar
C 1087 288 12 300 55 744 28
NC 1694 1096 47 1143 82 516 67
T 2781 1384 59 1443 137 1260 52
28 Pitlam
C 0 0 0 0 0 0 0
NC 2252 1800 76 1876 125 327 83
T 2252 1800 76 1876 125 327 83
29 Renjal
C 1704 927 8 935 102 675 55
NC 203 55 46 101 46 102 50 T 1907 982 54 1036 148 777 54
30
Sadashivanagar
C 0 0 0 0 0 0 0
NC 2937 2500 42 2542 121 316 87
T 2937 2500 42 2542 121 316 87
1 2 3 4 5 6 7 8 9 10

31
Sirikonda
C 0 0 0 0 0 0 0
NC 4923 3957 49 4006 95 871 81
T 4923 3957 49 4006 95 871 81
32
Tadwai
C 0 0 0 0 0 0 0
NC 2367 1685 54 1739 175 507 73
T 2367 1685 54 1739 175 507 73
33
Velpoor
C 694 690 10 700 10 0 101
NC 1267 1305 72 1377 72 0 109
T 1961 1995 82 2077 82 0 106
34
Varni
C 4488 3119 15 3134 227 1142 70
NC 1094 199 52 251 52 843 23
T 5582 3318 67 3385 279 1985 61
35
Yedapally
C 1897 1081 11 1092 99 717 58
NC 0 0 0 0 0 0 0
T 1897 1081 11 1092 99 717 58
36
Yellareddy
C 265 216 12 228 12 38 86
NC 2664 1882 36 1918 174 608 72
T 2929 2098 48 2146 186 646 70
District
C 51461 35210 483 35693 2417 14572 69
NC 72217 57239 1293 58532 3261 13661 81
T 123678 92449 1776 94225 5678 28233 76
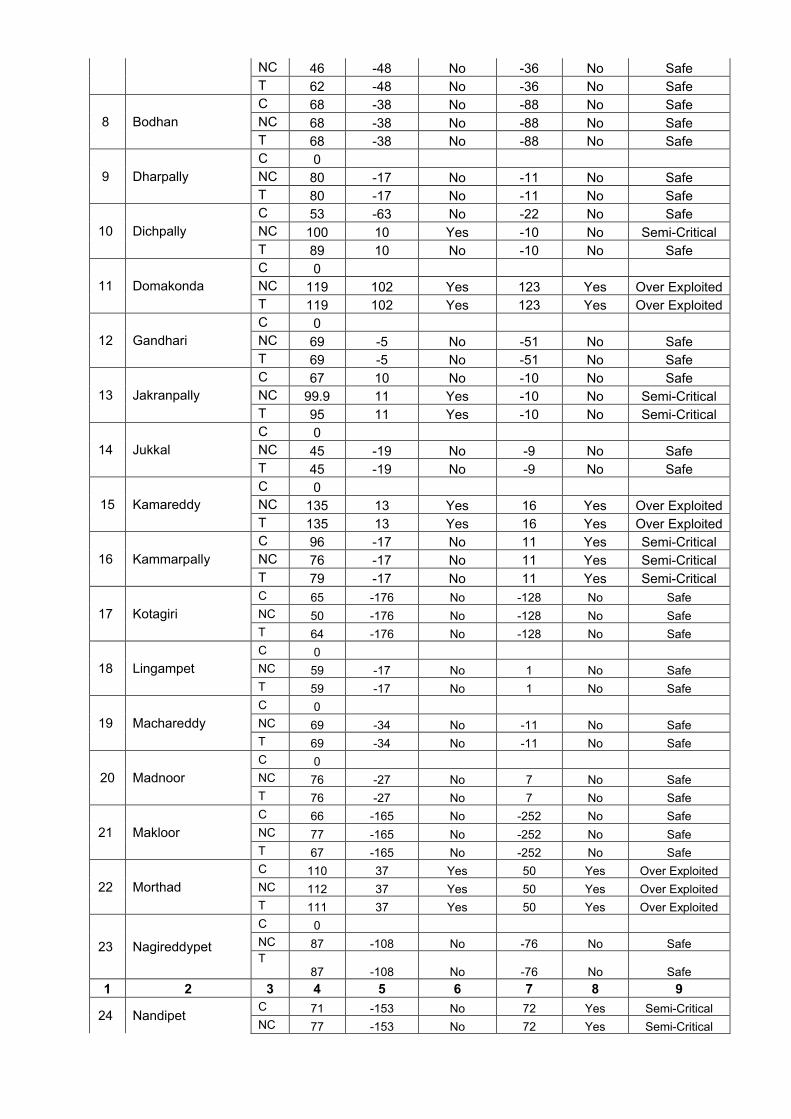
Table-6: Mandal-wise Categorisation [2008-2009] of Nizamabad District
Sl.No
Mandal C/
NC/ T
Sta
ge o
f gro
und
wate
r
deve
lop m
ent
[%]
Pre-monsoon Post monsoon
Cate
gory
[sa
fe/
sem
icritica
l/
Critic
al/
Ove
r exp
loite
d]
Is there
a s
ignifi
cant
decl
ine [Y
ES
/NO
]
Wate
r le
vel
trend
cm/y
r
Is there
a
signifi
can
t decl
ine
[YE
S/N
O]
Wate
r le
vel
trend
cm/y
r
Wate
r le
vel t
rend
cm/y
r
1 2 3 4 5 6 7 8 9
1 Armoor
C 116 24 Yes 42 Yes Over Exploited
NC 110 24 Yes 42 Yes Over Exploited
T 115 24 Yes 42 Yes Over Exploited
2 Balkonda
C 80 11 Yes -10 No Semi-Critical
NC 153 11 Yes -10 No Over Exploited
T 82 11 Yes -10 No Semi-Critical
3 Banswada
C 39 -63 No -22 No Safe
NC 101 13 Yes -22 No Over Exploited
T 48 -63 No -22 No Safe
4 Bheemgal
C 0
NC 94 12 Yes 11 Yes Critical
T 94 12 Yes 11 Yes Critical
5 Bichkunda
C 0
NC 72 -108 No -76 No Safe
T 72 -108 No -76 No Safe
6 Biknoor
C 0
NC 111 13 Yes 16 Yes Over Exploited
T 111 13 Yes 16 Yes Over Exploited
1 2 3 4 5 6 7 8 9
7 Birkur C 63 -48 No -36 No Safe
NC 46 -48 No -36 No Safe
T 62 -48 No -36 No Safe
8 Bodhan
C 68 -38 No -88 No Safe
NC 68 -38 No -88 No Safe
T 68 -38 No -88 No Safe
9 Dharpally
C 0
NC 80 -17 No -11 No Safe
T 80 -17 No -11 No Safe
10 Dichpally
C 53 -63 No -22 No Safe
NC 100 10 Yes -10 No Semi-Critical
T 89 10 No -10 No Safe
11 Domakonda
C 0
NC 119 102 Yes 123 Yes Over Exploited
T 119 102 Yes 123 Yes Over Exploited
12 Gandhari
C 0
NC 69 -5 No -51 No Safe
T 69 -5 No -51 No Safe
13 Jakranpally
C 67 10 No -10 No Safe
NC 99.9 11 Yes -10 No Semi-Critical
T 95 11 Yes -10 No Semi-Critical
14 Jukkal
C 0
NC 45 -19 No -9 No Safe
T 45 -19 No -9 No Safe
15 Kamareddy
C 0
NC 135 13 Yes 16 Yes Over Exploited
T 135 13 Yes 16 Yes Over Exploited
16 Kammarpally
C 96 -17 No 11 Yes Semi-Critical
NC 76 -17 No 11 Yes Semi-Critical
T 79 -17 No 11 Yes Semi-Critical
17 Kotagiri
C 65 -176 No -128 No Safe
NC 50 -176 No -128 No Safe
T 64 -176 No -128 No Safe
18 Lingampet
C 0
NC 59 -17 No 1 No Safe
T 59 -17 No 1 No Safe
19 Machareddy
C 0
NC 69 -34 No -11 No Safe
T 69 -34 No -11 No Safe
20 Madnoor
C 0
NC 76 -27 No 7 No Safe
T 76 -27 No 7 No Safe
21 Makloor
C 66 -165 No -252 No Safe
NC 77 -165 No -252 No Safe
T 67 -165 No -252 No Safe
22 Morthad
C 110 37 Yes 50 Yes Over Exploited
NC 112 37 Yes 50 Yes Over Exploited
T 111 37 Yes 50 Yes Over Exploited
23 Nagireddypet
C 0
NC 87 -108 No -76 No Safe T 87 -108 No -76 No Safe
1 2 3 4 5 6 7 8 9
24 Nandipet C 71 -153 No 72 Yes Semi-Critical
NC 77 -153 No 72 Yes Semi-Critical
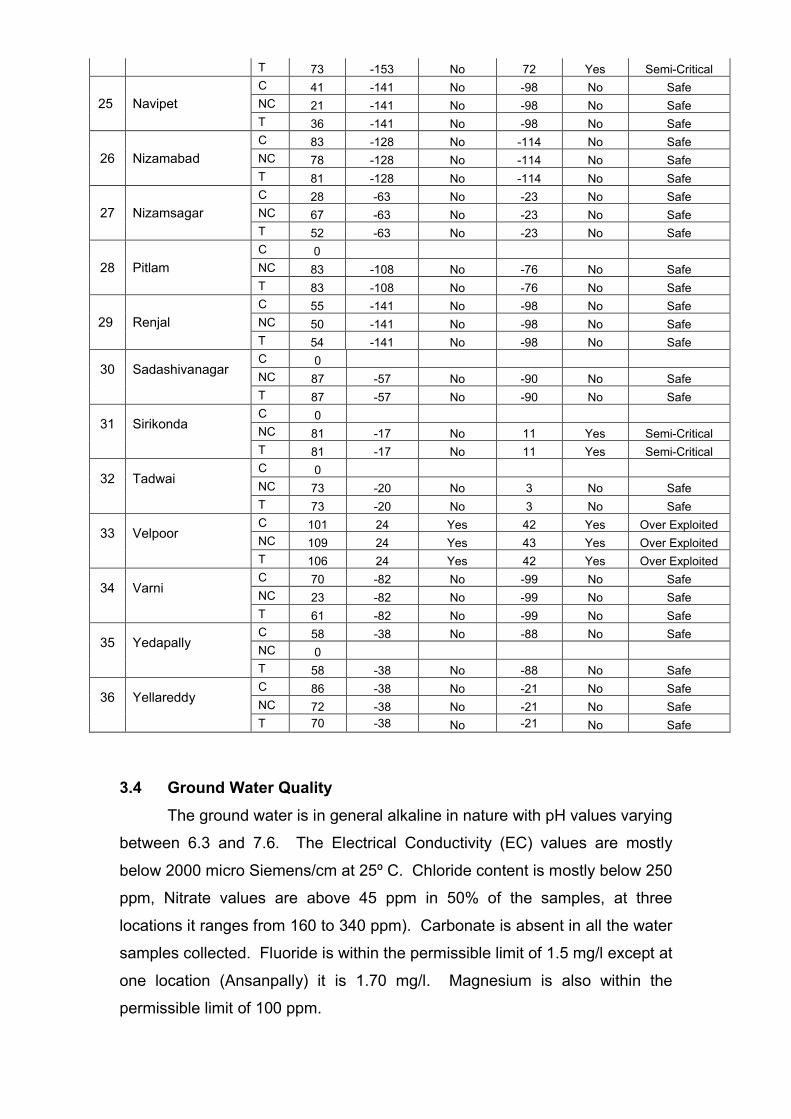
T 73 -153 No 72 Yes Semi-Critical
25 Navipet
C 41 -141 No -98 No Safe
NC 21 -141 No -98 No Safe
T 36 -141 No -98 No Safe
26 Nizamabad
C 83 -128 No -114 No Safe
NC 78 -128 No -114 No Safe
T 81 -128 No -114 No Safe
27 Nizamsagar
C 28 -63 No -23 No Safe
NC 67 -63 No -23 No Safe
T 52 -63 No -23 No Safe
28 Pitlam
C 0
NC 83 -108 No -76 No Safe
T 83 -108 No -76 No Safe
29 Renjal
C 55 -141 No -98 No Safe
NC 50 -141 No -98 No Safe
T 54 -141 No -98 No Safe
30
Sadashivanagar
C 0
NC 87 -57 No -90 No Safe
T 87 -57 No -90 No Safe
31
Sirikonda
C 0
NC 81 -17 No 11 Yes Semi-Critical
T 81 -17 No 11 Yes Semi-Critical
32
Tadwai
C 0
NC 73 -20 No 3 No Safe
T 73 -20 No 3 No Safe
33
Velpoor
C 101 24 Yes 42 Yes Over Exploited
NC 109 24 Yes 43 Yes Over Exploited
T 106 24 Yes 42 Yes Over Exploited
34
Varni
C 70 -82 No -99 No Safe
NC 23 -82 No -99 No Safe
T 61 -82 No -99 No Safe
35
Yedapally
C 58 -38 No -88 No Safe
NC 0
T 58 -38 No -88 No Safe
36
Yellareddy
C 86 -38 No -21 No Safe
NC 72 -38 No -21 No Safe
T 70 -38 No -21 No Safe
3.4 Ground Water Quality
The ground water is in general alkaline in nature with pH values varying
between 6.3 and 7.6. The Electrical Conductivity (EC) values are mostly
below 2000 micro Siemens/cm at 25º C. Chloride content is mostly below 250
ppm, Nitrate values are above 45 ppm in 50% of the samples, at three
locations it ranges from 160 to 340 ppm). Carbonate is absent in all the water
samples collected. Fluoride is within the permissible limit of 1.5 mg/l except at
one location (Ansanpally) it is 1.70 mg/l. Magnesium is also within the
permissible limit of 100 ppm.
Thus, the ground water of the district in general is suitable for drinking
purposes. Since, water is moderate hard to hard, needs to be softened before
using for domestic purposes.
From Agriculture point of view, ground water of the district from shallow
aquifers mostly falls under C2 S1 and C3S1 classes with medium to high EC
and low Sodium alkaline hazards as per U.S. Salinity classification for waters
used for Irrigation purposes.
Thus, the ground water of the district is in general suitable for irrigation
purposes.
4.0 STATUS OF GROUND WATER DEVELOPMENT
The district is dependent on ground water both for domestic and
irrigation needs. During the year 2009-2010 about 95% of the net area was
irrigated by ground water. At present, there are several dug wells and bore
wells/tube wells which cater to the needs of domestic purposes while
energized dug wells and bore wells/tube wells support Irrigation needs.
Small diameter dug wells of 1 to 3 m and of total depth of 4.5 to 16.2
meters is in vogue for domestic purposes. The water is lifted from these wells
by bucket and rope also by 1 to 2 HP electric motor. Shallow bore wells fitted
mostly with hand pumps and also submersible pumps of 3 to 5 HP serve the
purpose of domestic needs.
The irrigation-dug wells in hard rocks are mostly rectangular in shape
with length of 6-15 m and breadths of 2 to 10 m. The total depth of irrigation
dug wells range from 6 to 20.2 meters with general depths of 6 to 11 meters.
Extension bores of diameter ranging between 25 and 100 mm are drilled
down to 10 to 25 m in many of the irrigation dug wells.
In alluvial aquifers, the development of ground water is through shallow
dug wells and filter point wells. The dug wells vary in diameter between 3 and
4.6 meters and total depths vary between 5.6 and 1.5 meters. The irrigation
well density is 14 wells per sq.km in the district.
The dug wells/dug-cum-bore wells in hard rock areas are operated
mostly by 3 to 5 HP electric motors and yield 25 to 170 cu.m/day, generally
around 50 to 80 cu.m/day, depending on the season wet or dry and the water
column.
Bore wells mostly of 16.5 cm dia are drilled generally down to 50 to 70
meters. The potential zones are reported to occur generally between the

depths of 18 and 40 meters. The discharges of these bore wells drilled for
irrigation purposes varies between 3 and 10 cu.m/hr in general occasionally
upto 20cu.m/hr. The water is lifted generally by 5 to 7.5 HP submersible
pumps. The transmissivity values of State Ground Water Department bore
wells drilled under Hydrology Project vary between 6.34 and 34.82 cu.m/day.
The depth of filter points varies between 9.75 and 15.77 m. The filter
points yield 30 cu.m/hr to 50 cu.m/hr, in favourable places, where the
thickness of alluvium is more. The transmissivity values for the wells of
APSIDC in alluvium range between from 674 to 4576 sq.m/day.
Central Ground Water Board has drilled 112 wells in 68 locations, out
of which 52 are Exploratory wells, 12 are Observation wells, 48 are
Piezometers which include 11 well field sites for specific yield studies . The
weathered zone depth ranges from 5 m. to 35 m.bgl Major area in the district
is covered by the weathered zone with thickness ranging from 5 to 20 m.bgl.
The first fracture encountered depth ranges from 5.0 m. to 30.0 m.bgl.
In about 83% of the wells drilled, the shallow fractures occur between 10.0 –
25.0 m.bgl. The drilling discharge of these shallow aquifers varies from 0.01
lps to 2.5 lps.
The deeper fractures were encountered upto depth of 166 m.bgl. About
77% of the fractures fall in 25 to 75 m.bgl depth range. In majority of the
wells the yield is less than 2.0 lps. About 88% of the fractures yield between
0.1 to 2.0 lps.
Exploratory bore wells drilled by State Ground Water Department and
Irrigation Development Corporation of AP State down to maximum depths of
64.6 m gave discharges of 1 to 12 lps, generally upto 5 lps. Water levels
varied between 2.1 and 18.7 m bgl. Transmissivity values vary between 2.5
and 142 sq.m/day. Wells drilled in alluvial formations by Ground Water
Department down to 15.77 m gave discharges of 8.7 to 9.3 lps and
transmissivity values of 674 to 4576 sq.m/day. Water levels varied between
5.04 and 5.08 m.
5.0 GROUND WATER MANAGEMENT STRATEGY
Ground water resource, is a vital element for human existence, has to
be manage carefully, keeping in view of its sensitive nature to many stresses
that act on its quantity and quality. The resource has to be continuously and
carefully monitored and then utilized, wherever it is in great demand.

It is estimated that there is a total ground water balance of 282.33
MCM. Over all, the district falls under semi-critical category with stage of
ground water development at 76%. Of the 36 mandals of the district, only 24
mandals fall in ‘safe category’,5 in Semi Critical,1 in Critical and 6 mandals
fall in over-exploited category, hence much attention has to be given to
management strategies to avoid over-exploitation of the ground water
resources of the district.
Ground water management practices have to be initiated specially in
semi-critical to over-exploited mandals (12 nos.). Proper scientific techniques
have to be employed in selection of sites for dug wells and bore wells to avoid
failures. Strict implementation of WALTA Act is to be adhered to.
5.1 Water Conservation and Artificial Recharge
Ground water conservation and artificial recharge works have been
taken up on a large scale in the district since 2002 under Neru-Meeru,
watersheds, RIDF and other programmes. District Watershed Management
Agency under IWDP-III project (Phase I & II) constructed 21 check dams, 80
percolation tanks, 4 mini percolation tanks, 8585 contour trenches and 10305
farm ponds as on 20.3.2006. Apart from these, another 19473 farm ponds
are under construction in the District. These artificial recharge structures are
constructed to improve the ground water storage and to improve yields of
wells.
Construction of artificial recharge structures in non-command areas of
the District, especially in critical and over-exploited mandals should be
continued. The most ideally suited artificial recharge structures are check
dams and percolation tanks. The works should be taken up on watershed
basis after careful assessment of the available surface run off and after
meeting the needs of the existing structures. The site conditions like
availability of unsaturated zone to accept recharge, permeability of soils, etc.
have to be carefully studied before venturing for construction of artificial
recharge structures. Central Ground Water Board has conducted mass
awareness and training programmes in the district to bring awareness among
public about the importance of ground water management and teach the basic
skills in selection of sites and designs of artificial recharge structures.
Roof top harvesting both in urban and rural areas should be made
mandatory to enhance the ground water recharge.
6.0 RECOMMENDATIONS
1. Roof top rain water harvesting in both urban and rural areas are to be
made mandatory to enhance recharge to ground water system.
3. Large scale artificial recharge structures like, gully plugs, check dams,
percolation tanks, recharge ponds, etc. are to be launched on war footing
basis, based on topography, soil characteristics, slope, run off factors and
hydrological conditions, especially in critical and over-exploited mandals,
where ground water is in good demand.
4. Conjunctive utilisation of ground water and surface water to be adopted to
avoid water-logging conditions, which will lead to ground water salinity
problems, thereby lands becoming unsuitable for irrigation, in the long run.
5. Mass awareness programmes to be taken up at village levels, especially
in non-command areas to educate farmers regarding water conservation
and management techniques, regarding cropping pattern and modern
irrigation methods to be adopted.
6. Ground water development to be taken first in virgin areas and exploited
in phased manner, keeping an eye on the ground water regime and
thereby enhance irrigation potential.
7. Farmers should be educated regarding the extent of land to be irrigated
and the type of crop to be raised in a particular area, depending upon
availability of water resource and financial position.
8. Old and silted tanks are to be revitalized to restore their original storage
capacities.