eN - lapdf.usaid.gov/pdf_docs/PNAAQ323.pdfeN - la WI'T ErIFECTIVEBS;: OF PRC AMS TC CO;MnAr COT~I...
36
eN - la WI'T ErIFECTIVEBS;: OF PRC AMS TC CO;MnAr COT~I C~L~CRH'CD DI~nASrES DR. ~R D 111. hwtom BTUjRZAJ Mli hl'RICA AcGiUCY 1POR !TEMA3TIIJJAT. WEVJELOPITZINTiT WASKI"NCTO?.I, D. C. 2.05-521 165eye strecot, n.w./ suite 719/ washington, d.c./20006/ 202 628-2216
Transcript of eN - lapdf.usaid.gov/pdf_docs/PNAAQ323.pdfeN - la WI'T ErIFECTIVEBS;: OF PRC AMS TC CO;MnAr COT~I...
eN - la
WI'T ErIFECTIVEBS;: OF PRC AMS TC CO;MnAr
COT~I C~L~CRH'CD DI~nASrES
DR. ~R D 111. hwtom
BTUjRZAJ Mli hl'RICA
AcGiUCY 1POR !TEMA3TIIJJAT. WEVJELOPITZINTiT WASKI"NCTO?.I, D. C. 2.05-521
165eye strecot, n.w./ suite 719/ washington, d.c./20006/ 202 628-2216
TABLE OF CONTENTS
INTRODUCTION AND SUMMARY
I. IMMUNIZATION
A. Effectiveness of Immunization
B. Program Costs
C. Cost Effectiveness of Alternative Immunization Programs
II. COMMUNITY WATER PROJECT
A. Costs Effects
B. Effects
C. Cost Effectiveness of the Hypothetical Water Supply Project
III. ORAL REHYDRATION (IHOME THERAPY)
A. Costs
B. Effects
C. Cost Effectiveness of Oral Rehydration in Home Therapy
IV. COST EFFECTIVENESS COMPARISON
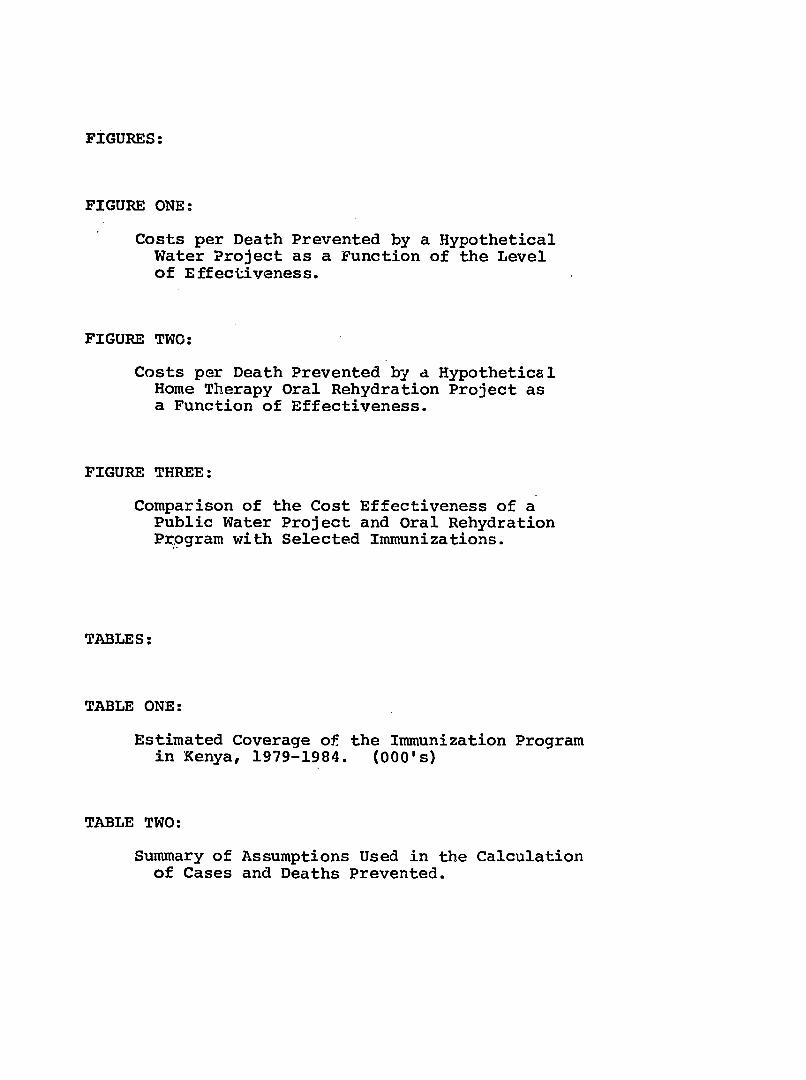
FIGURES:
FIGURE ONE:
Costs per Death Prevented by a Hypothetical Water Project as a Function of the Level of Effectiveness.
FIGURE TWO:
Costs per Death Prevented by a Hypothetical Home Therapy Oral Rehydration Project as a Function of Effectiveness.
FIGURE THREE:
Comparison of the Cost Effectiveness of a Public Water Project and Oral Rehydration Program with Selected Immunizations.
TABLES:
TABLE ONE:
Estimated Coverage of the Immunization Program in Kenya, 1979-1984. (000's)
TABLE TWO:
Summary of Assumptions Used in the Calculation of Cases and Deaths Prevented.

TABLES: (continued)
TABLE THREE:
Potential Number of Cases and Deaths Prevented by the Immunization Program.
TABLE FOUR:
Cost Breakdown by Type of Immunization Program. (000's of K.sh.)
TABLE FIVE:
Cost Effectiveness of Possible Imm~nization Programs for Kenya.
TABLE SIX:
Summary of Information Needed to Calculate Cases and Deaths Prevented from Diarrhea Control.
TABLE SEVEN:
Cost Effectiveness of a Hypothetical Water Project in the Preventing of Childhood Diarrhea.
TABLE EIGHT:
The Cost of a Hypothetical Oral Rehydration Program for Kenya. 000's K.sh. (000's $)
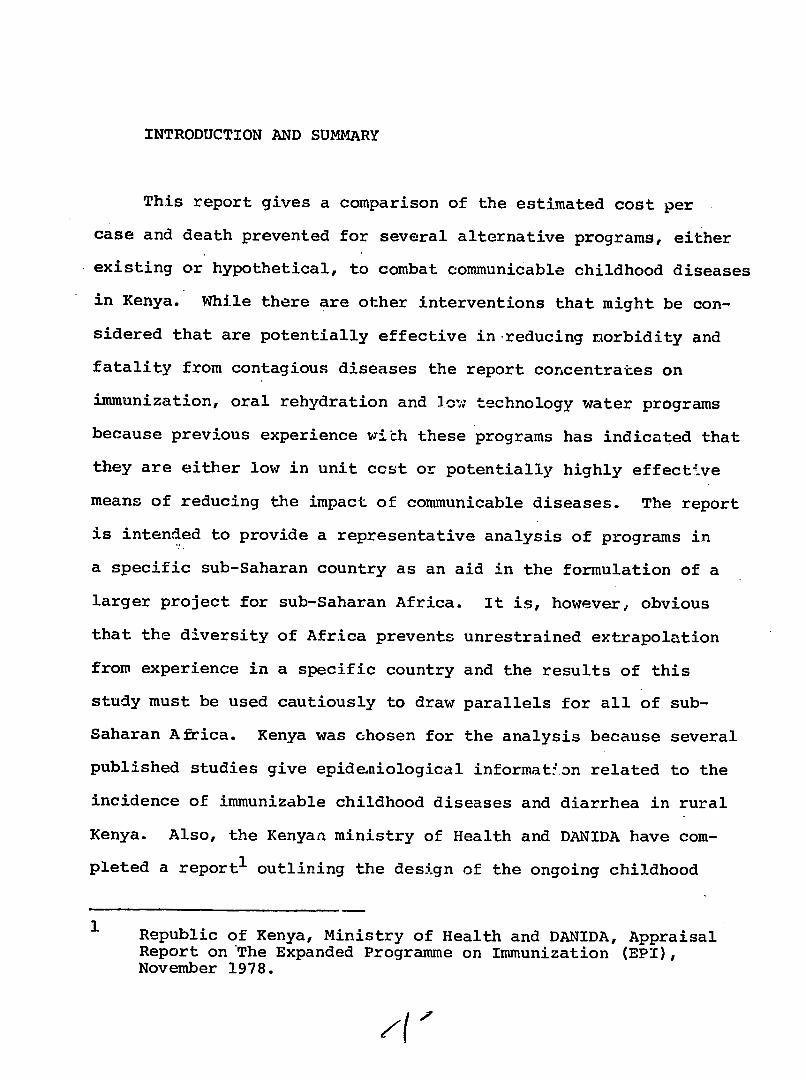
INTRODUCTION AND SUMMARY
This report gives a comparison of the estimated cost per
case and death prevented for several alternative programs, either
existing or hypothetical, to combat communicable childhood diseases
in Kenya. While there are other interventions that might be con
sidered that are potentially effective in-reducing morbidity and
fatality from contagious diseases the report concentrates on
immunization, oral rehydration and Jow technology water programs
because previous experience with these programs has indicated that
they are either low in unit ccst or potentially highly effective
means of reducing the impact of communicable diseases. The report
is intended to provide a representative analysis of programs in
a specific sub-Saharan country as an aid in the formulation of a
larger project for sub-Saharan Africa. It is, however, obvious
that the diversity of Africa prevents unrestrained extrapolation
from experience in a specific country and the results of this
study must be used cautiously to draw parallels for all of sub-
Saharan Africa. Kenya was chosen for the analysis because several
published studies give epideniological information related to the
incidence of immunizable childhood diseases and diarrhea in rural
Kenya. Also, the Kenyan ministry of Health and DANIDA have com
pleted a reportI outlining the design of the ongoing childhood
Republic of Kenya, Ministry of Health and DANIDA, Appraisal Report on The Expanded Programme on Immunization (EPI), November 1978.
/411
1
immunization program for Kenya and giving details of donor costs.
Several caveats must be made. First, to enable the estimation
of cases and deaths prevented it was necessary to extrapolate from
studies for specific regions in Kenya (or, in some cases, from
studies for other countries) to the entire country. Second, al
though donor costs for immunization were available in detail,
domestic costs had to be estimated by anology with other programs.
Third, the cost of the low technology water program was estimated
on the basis of a study made in Tanzania and is, therefore, only
an approximation of the cost of implementing a comparable program
in Kenya. Fourth, because there are no large scale operational
programs to provide background data, the cost and impact of an
oral rehydration program are based on tenuous assumptions concerning
the required frequency of treatment, cost of materials and effective
ness of treatment. For all of these reasons the results of the
study are speculative and must be applied cautiously.
The first section of the report estimates the impact and
costs of the ongoing MOH/DANIDA program of immunization against
childhood diseases. This section is intended to provide information
that allows not only P.comparison of the cost effectiveness of
immunization with alternative interventions but also answers ques
tions about the organization of the immunization program itself,
such as: "Is it cost effective to immunize the backlog of non
vaccinated children during the beginning stages of an immunization
program or would it be more efficient to limit the program to chil
- 2
dren in the first year of life?" and "Given the 10w incidence of
paralytic polio, is it cost effective to include polio immuni
zation in the program?" The second section gives estimates of
the cost and effects on childhood diarrhea of a low technology
water program. The third section discusses a potential oral re
hydration program. The final section of the report compares the
cost effectiveness of the interventions discussed in the preceeding
sections and draws tentative conclusions.
The report finds that polio immunization is highly cost in
effective (given the estimated level of incidence) in comparison
with other immunizations and oral rehydration. It is also estimated
that oral rehydration is more cost effective than the DPT and
BCG immunizations of the backlog of previously unimmunized children
over one (1) year in the initial stages of the immuni7ation pro
gram. Oral rehydration is especially cost effective when con
sidered as added to an ongoing program of child health services.
These findings are tempered by the knowledge that estimates of the
cost effectiveness of immunizations are based on more firmly
established assumed levels of effectiveness than are the alternative
non immunization programs.
I. IMMUNIZATION
Tlie immunization program for Kenya involves the delivery of
BCG vaccination at birth or first contact with the child, DPT and
3
oral polio in three visits during the first year, measles vac
cination after eight months of age and tetanus toxoid for pregnant
women in two shots, four weeks apart, early in the pregnancy.
AccessI to the program is limited during the first years of the
program but the number of districts in the program is to be ex
panded rapidly over the planning period, 1979 to 1985, to include
the entire population by the final year. Coverage 2 in the in
cluded districts is planned to increase from 75% in the first
three program years to 80% thereafter. Table 1 summarizes the
expansion of the program over the seven year planning period.
The table distinguishes between the coverage of the backlog of
unimmunized children in the 0-4 year age group during the imple
mentation period and the coverage of new births in the programs
maintenance phase. During the early years of the program the
preponderance of children are covered in the implementation phase
but towards the end 3f the program the majority of immunizations
are carried out in the maintenance phase of the program.
A. Effectiveness of Immunization
An estimate of the number of cases and deaths prevented
by the immunization program is made by following immunized
1 Access refers to population living within a reasonable distance of a point of delivery of the program service.
2 Coverage refers to population with access actually receiving the program service.
-4

population cohorts over the life of the vaccine under con
sideration. After adjusting for attrition to the population
cohort through other causes, the number of cases and deaths
that would have occurred in the absence of the vaccine and
attributable to the disease in question is calculated from
the estimates of the disease incidence and case fatality
rates given in table 2. The estimated cases and deaths
prevented are based only on the direct effects of the vaccine
and omit the effects of extended community protection as a
result of reduced transmission. The estimates assume that
the trends of disease are constant. Also, no adjustment has
been made for a possible decrease in vaccine efficacy due tc.
malnutrition. The estimates are conservative because the
effects of protection beyond the early childhood years has
not been calculated; nor has the effect of tetanus toxoid
on maternal mortality been included.
The estimate of the effect of the total immunization
program, given in table 3, is that the program will prevent
a total of 205874 deaths. Broken into program components
it is estimated that 73943 deaths are prevented by the im
plementation (children less than five not previously immunized)
phase and 131931 deaths by the maintenance (new births)
phase of the program.1 Also, 45559 deaths are predicted to
The number of deaths prevented by DPT, BCG immunizations in the maintenance phase is 13925.
- 5

be prevented by the tetanus toxoid, BCG and DPT components;
158702 deaths are predicted to be prevented by the measles
immunizations and 1613 deaths prevented from polio immuni
zation.
B. Program Costs
Program costs, broken down by type of immunization and
implementation and maintenance phases of the project, are
given in table 4. The costs for the total program, given
in the MOH/DANIDA report, were used to construct the hypo
thetical costs if the various immunizations were delivered
in independent projects. To do this, the costs of operating
independent programs were obtained by estimating the pro
portion of total expenditures in each of the expenditure
categories in table 4 that would be needed for the separate
programs. Thus, the entire costs of the cold chain is in
cluded in all separate programs but vaccine costs, syringes
and needles are broken into components directly related to
the number of immunizations in each of the individual programs.
Of the cost information in the eight expenditure
categories, the first six are taken from the donor cost
projections for DANIDA and UNICEF given in the MOH/DANIDA
report. The capitol costs (primarily vehicles and cold chain)
represent annual depreciation assuming a life of seven years.
The final two cost categories, which constitute the domestic
-6
recurrent costs of the program, are rough approximations
and depend on the assumption that the ministry of health
domestic costs for personnel, overhead and other health
delivery expenditures will be 21.2 K.shs. per fully immunized
child.1 Of this, twenty percent is assumed to be required
for administrative overhead. The apportionment of domestic
recurrent costs over the program categories is made on the
basis of the number of visits required and arbitrary assump
tions about the relative amount of time needed to deliver
the service in each type of program.2
The total estimated cost of the entire program is 132
million K.sh. ($17.6 million) of which 35 million K.sh.
($4.7 million dollars) is the value of donor supplied inputs
after subtracting the residual value o capital at the end
of the seven year period. The cost per fully immunized
child is 29 K.sh. ($'87).
1 Calculated by implication from an MOH/DANIDA estimate of
the unit cost of immunization. MOH/DANIDA Report, Op. cit.
2 It is assumed that DPT, TT, BCG and Polio together require
three times the namber of visits needed for measles vaccination alone and involve 75% of the total domestic variable expenses (or 57,914,000 K.sh). Of this amount 10% (5.,792,000 K.sh) is the marginal costs of adding polio. However, if polio were to be delivered separately, the three needed visits would require 80% of the recurrent domestic costs needed for delivering DPT,TT, BCG and Polio in the larger program. Similar assumptions were used to apportion the contingency category.
- 7

C. Cost Effectiveness of Alternative Immunization Programs
The costs per case and death prevented for the alternative
programs singled out for analysis are given in table 5.
The values in the table were obtained by dividing the costs
for each program, as given in table 4, by the appropriate
number of cases and deaths calculated from the results given
in table 3.
The analysis reveals that the cost per case and death
prevented by the entire program is $85. It is also estimated
that the cost per death prevented by adding the immunization
of children over one year of age in the implementation phase
is 6.0 p.ircent greater than the cost per death prevented
from the immunization of new births only. While the absolute
difference in cost is not great (the cost per death pre
vented for a new birth program only is $70; the cost per
death prevented by adding the implementation phase to a new
birth program is $113) the cost differential does imply
that, if financial restraints limited the adoption of the
entire program it would be more cost effective to concentrate
on immunization of newborns for a larger area rather than
the addition of an immunization program for older children
to an existing newborn program for a smaller area. This
result is attributable to the higher attack rates and case
fatality rates, for many of the diseases, in the first year
of life.
-8

Looking at the separate immunizations it can be seen
that the measles immunization is the most significant com
ponent of the total program and, at $50 per death prevented
would be highly cost effective even if it were necessary
to carry it out as a separate program. DPT, TT and BCG 1
together are somewhat costly (at $274 per death prevented)
as a separate program but are highly cost effective (at $69
per death prevented) as a component of the total program.
In contrast polio immunization, even when considered
as marginal (that is, as an added program) cost almost
twenty times more ($114) per case prevented and seven times
more ($568) per death prevented than the overall program.
It should be noted that this result is highly dependent on
the low attack rate for polio and the arbitrary assignment
of domestic recurrent cost in table 4. If the true attack
rate is significantly underestimated or the additional per
sonnel time and other recurrent costs are greatly over
estimated the actual cost effectiveness of polio immunization
would be greater. But, as calculated, the high cost of polio
immunization per unit of effectiveness encourages a search
Given the assumed low attack rate for tuberculosis it is pos
sible that the BCG component is relatively expensive per unit of effect. In addition a recent article reports new information that throws doubt on the efficacy of BCG in the prevention of tuberculosis. However, the especially poor quality of the information .on the costs and attack and case fatality rates associated with the BCG immunization precluded a separate analysis.
-9

for alternative, more cost effective interventions.
II. COMMUNITY WATER PROJECT
In this section the hypothetical cost effectiveness of a
low technology water supply project is estimated for a community
of 10000.
A. Costs
The cost estimates are based on a 1975 study carried
out in the Lushoto district of Tanzania.1 The project chosen
is apt to be fairly typical of a project for a rural popu
lation in areas of Kenya. Previous to the project the water
supply was a river downstream from other nearby towns. The
new water supply source relies on boreholes. The capital
costs of the project include the costs of the boreholes,
pipe, tanks and one tap per 200 population. Other costs in
clude transportation, the value of self help labor and out
side labor. Correcting for differences in exchange rates
and changes in the level of prices 2 the total annual cost 3 of
1 G. Tschannerl and M.R. Mujwahuz: Impact of Rural Water Supply: Eight Self Help Schemes, University of Dar es Salaam, Bureau of Land Use Planning, Research Paper No. 37, May 1975.
2 The price indices are taken from, Bank of Tanzania, Economic
Bulletin, Vol. X, No. 3, December 1978.
3 The total initial expenditure including the costs of capital is estimated to be $33204. Using an interest rate of .15 and an assumed life of seven years, the annualized cost is $6973.
- 10
providing public fountains within a short walk of each
household in a community of 10000 is estimated to be $7000.
B. Effects
The projected effects of the water project are based
on the case incidence and case fatality rates given in table
6. The effect of public water taps and an adequate quantity
of water in a community previously lacking an adequate source
of water is estimated to be a fifteen percent reduction in
diarrhe. in all age groups from birth through five years.
This estimate is basrad on the concensus of opinion among a
1small group of international health experts. The estimate
is not based on objective evidence and, therefore, the es
timates of cases and deaths prevented by the provision of a
public water supply are made with less confidence than in
the estimation of vaccine cffects.
Multiplying the population in each age group times the
case incidence rate times th,. expected percentage reduction
gives an estimate of the nimber of cases prevented in chil
dren less than five in a ,ommunity of 10000 people. The
case fatality rate can then be applied to get an estimate
of the number of deaths prevented. Using this procedure,
See, H. Barnum, R. Barlow, L. Fajardo and A. Praddilla, A Resource Allocation Model for Childhood Survival, report to USAID/Office of Health, June 1979, Chapter V.
- 1i

it is estimated that the total number of cases prevented in
a community of 10000 among children 0-5 is 544 per year
(table 7). The number of child deaths prevented is estimated
to be, approximately, five per year.
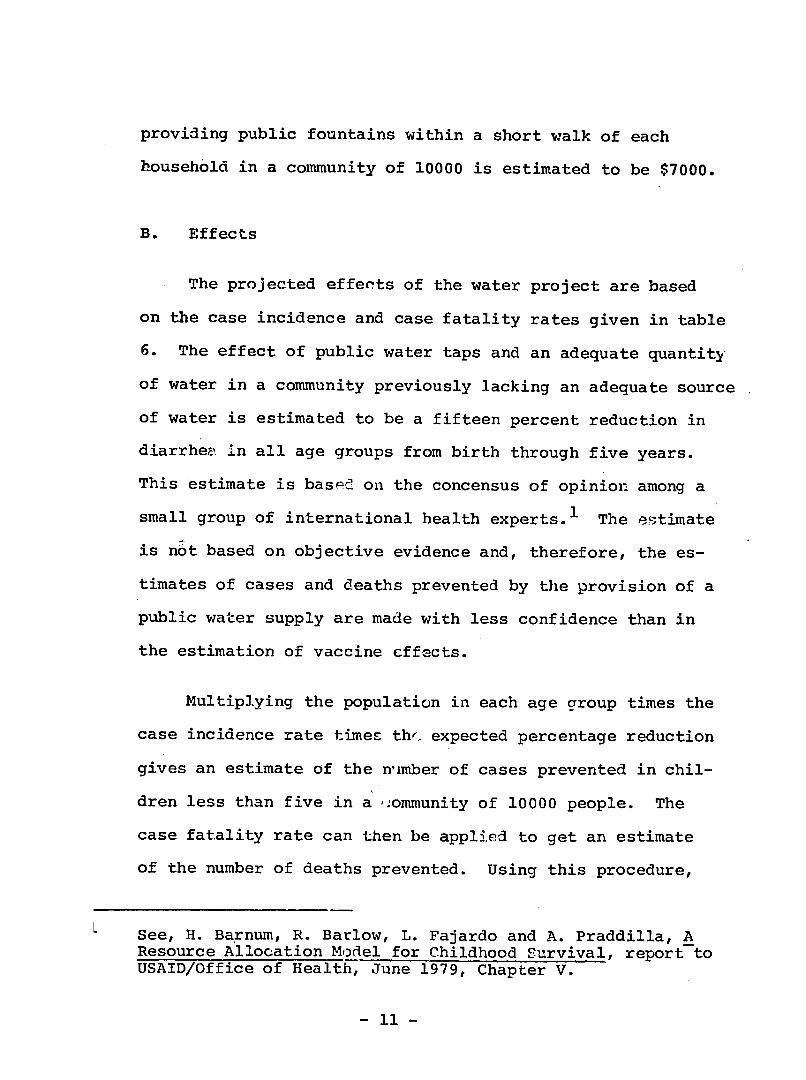
C. Cost Effectiveness of the Hypothetical Water Supply Project
Based on the costs and effects calculated above the
cost per case prevented in children 0-5 is $13 and the cost
per child death prevented is $1400. Because the assumed
level of effectiveness was determined subjectively and may
be unrealistically low it is useful to calculate the cost
per death prevented for other levels of effectiveness. Figure
one given the cost per death prevented (on the vertical axis)
by a low technology water supply project as a function of
the level of effectiveness (on the horizontal axis). The
graph shows, for example, that the cost effectiveness of
the water intervention would increase to $475 per death
prevented if the effectiveness of the intervention in reducing
diarrhea were fifty percent.
Although the cost per death prevented, at reasonable
levels of effectiveness, appears high it should be noted
that the provision of adequate water would have effects on
morbidity and mortality in older age groups as well as chil
dren. Thus, assigning all of the project costs to the effects
- 12
FIGURE ONE
.COSTS PER DEATH PREVENTED 1 BY A HYPOTHETICAL WATER PROJECT AS A FUNCTION OF
THE LEVEL OF EFFECTIVENESS
1600
1400
1200
1000
8001
600
<
-
n
..
'*-=j--t7
..
400
200'
"
"HP
. " " " "
Project
Effectiveness 2
0 .1 . .3 . 4 .5 6. .7 .8 9.9 1
2
In children 0-4 years of age.
Efftectiveness is measured as the incidence of diarrhea.
the proportional reduction in
- 13

on children alone underestimates the program's overall cost
effectiveness.
III. ORAL REHYDRATION (HOME,THERAPY)
This section considers the cost effectiveness of a program
of oral rehydration for children suffering from diarrhea. Several
studies have shown that a glucose electrolyte solution can be
taken orally and absorbed by children threatened with dehydration
from diarrhea. Many of the studies were carried out in clinical
trials but the evidence is growing that the solution is effective
when administered by the mother in home therapy. There is, how
ever, experience to date with large scale rehydration programs
and there is no reliable data on the cost and effects of a large
scale home therapy program in rural Africa. The estimates for
the hypothetical program for Kenya considered here are conjectural.
The estimates are made under the assumption that the program
would grow, in terms of the proportion of total children having
access to the service, at the same rate as planned for the Kenyan
immunization program. (See column 1 of table 1).
A. Costs
Two alternative estimates of costs are made. The first
estimate gives the cost of mounting a separate, independent,
rehydration program not drawing on personnel time or admini
- 14
strative expenses of the immunization program. The second
estimate gives the cost of adding oral rehydration as part
of an integrated child health program including immunization.
In this case the instruction and motivation of the mother
in the use of oral rehydration therapy would be given at the
same time as a visit for immunization.
Table 8 gives the estimates of the cost of an oral
rehydration program under the two alternatives. The costs
are approximated in each expenditure category by comparing
the probable requirements of the hypothetical oral rehydration
program with the requirements for the immunization program.
It is assumed that the personnel time required for explanation
of the use of the electrolyte solution in the home, motivation
of the mother and distribution of the packets would approxi
mately equal the time required for an independent measles
program. The footnotes to table 8 explain the estimates in
the individual categories.
B. Effects
Calculation of the number of deaths pre. ted by an oral
rehydration program is based on the case incidence and case
fatality rates listed in table 6. The program would cover
eighty percent of children between birth and four years of
age in districts with access to the program. The effectiveness
of home administered oral rehydration is difficult to predict
- 15
because of the many factors, such as water quality and the
timing and control of quantities administered, that, in
home therapy, may vary greatly from clinic conditions.
However, taking twenty five percent as a conservative estimate
of the reduction in the case fatality rate for children
receiving home therapy versus no therapy at all, then 37928
deaths would be prevented by the hypothetical oral rehydration
program over the first seven project years.
C. Cost Effectiveness of Oral Rehydration in Home Therapy
Given the costs and effects estimated above ih can be
calculated that with an effectiveness of .25 the cost per
death prevented by an independent oral rehydration would be
($147) and for the "added" program the cost per death pre
vented would be ($122). Because .25 is not a well established
figure - in clinical tests the indicated effectiveness is
much higher and in home therapy under adverse conditions the
effect.veness may be lower - the cost effectiveness of oral
rehydration under alternative degrees of effectiveness is
given in the form of a graph in figure 2. The cost per
death prevented by the oral rehydration program can be read
off of the vertical axis for a chosen level of effectiveness
indicated on the horizontal axis.
- 16

FIGUIE TWO
COSTS PER DEATH PREVENTED BY A HYPOTHETICAL HOME THERAPY ORAL REHYDRATION PROJECT
AS A FUNCTION OF EFFECTIVENESS
600 -
500 . .
400
300
260
100
- .t - -. :-
--
.
Oral Rehydrati n Effectiveness~
0 .1 .2 .3 .4 .5 .6 .7 .8 .9 1
Effectiveness is measured as the proportional reduction in
the case fatality rate versus no treatment.
- 17
IV. COST EFFECTIVENESS COMPARISON
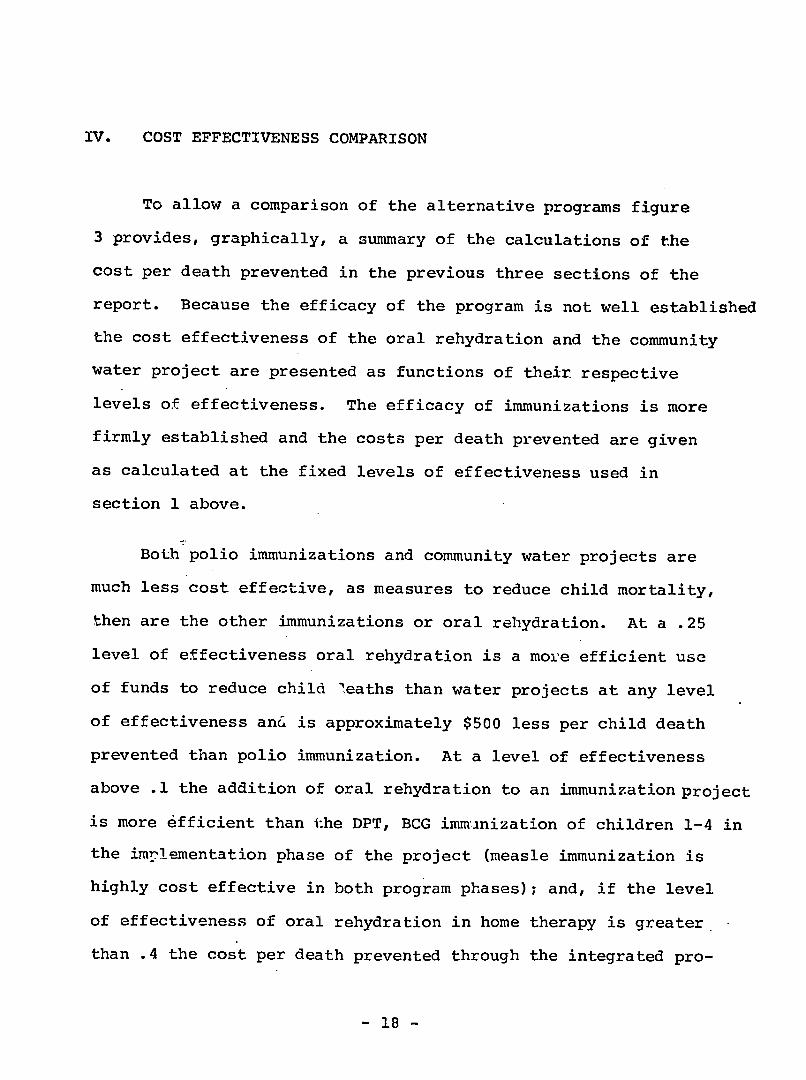
To allow a comparison of the alternative programs figure
3 provides, graphically, a summary of the calculations of the
cost per death prevented in the previous three sections of the
report. Because the efficacy of the program is not well established
the cost effectiveness of the oral rehydration and the community
water project are presented as functions of their respective
levels of effectiveness. The efficacy of immunizations is more
firmly established and the costs per death prevented are given
as calculated at the fixed levels of effectiveness used in
section 1 above.
Both polio immunizations and community water projects are
much less cost effective, as measures to reduce child mortality,
then are the other immunizations or oral relhydration. At a .25
level of effectiveness oral rehydration is a more efficient use
of funds to reduce child leaths than water projects at any level
of effectiveness ancd is approximately $500 less per child death
prevented than polio immunization. At a level of effectiveness
above .1 the addition of oral rehydration to an immunization project
is more 6fficient than the DPT, BCG imminization of children 1-4 in
the implementation phase of the project (measle immunization is
highly cost effective in both program phases); and, if the level
of effectiveness of oral rehydration in home therapy is greater.
than .4 the cost per death prevented through the integrated pro
- 18

FIGURE THREE
COMPARISON OF THE COST EFFECTIVENESS OF A PUBLIC WATER PROJECT AND ORAL REHYDRATION PROGRAM
WITH SELECTED IMMUNIZATIONS
- ... _ .
t-'J
700 J1*
600 .-7"
500
400 InIpl(3ientation phase 1
DPT, BCLm2C zti
3007
-- 7 '1*
7 . . " .• . . ". Public Water 200
-ImplEmentation
10Phase of mnzto " Total Itrnrization
Procja Ora~l Rehydration1JEffectiveness
0 .1 .2 .3 .4 .5 .6 .7 .8 .9 1
Considered .asadded to an ongoing immunization program.
- 19

gram (immunization plus oral rehydraticn) will be less than for
the total immunization program separately.
An implication of the above analysis is that a careful study
needs to be made of the incidence of polio before including as
a program component. A second implication is that oral rehydration
administered in hcme therapy may be a justifiable alternative
use of funds to polio immunization or, if the effectiveness of
oral rehydration is high enough, to the immunization of children
over one year of age with DPT, BCG in the implementation phase
of the program.
These results should be taken as provocative rather than
as definitive. If the case incidence of polio has been under
estimated or the marginal cost of adding polio, overestimated,
than polio immunization may be more competitive. Also, it should
be noted that there is more uncertainty in the calculation of the
effects of the non immunization programs. Until the effectiveness
of oral rehydration in home therapy is known with more certainty
it may be rational to allocate funds first to immunizations, in
cluding the implementation phase with DPT, because of the more
certain outcome.
- 20

TABL"J 1
ESTIMATED COVERAGE OF THE IMMUNIZATION PROGRAM IN KENYA t1979 - 1984)
(000's)
Proportion of Number of children Children to be covered Children to be covered Total Population Living in 2 during 3 during Total
YEAR Living in Included Districts implenentation phase maintenance phase3 Children Included DistrictsI Covered
Age 0-4 (Age 0-4) (Newborn) Not pre Newborn
1979 .02 60 0 45 0 45
1980 .10 251 16 188 12 200
1981 .34 764 80 573 60 633
1982 .56 701 265 563 212 775
1983 .75 641 460 513 368 881
1984 .98 800 655 640 524 1164
1985 1.00 170 900 136 719 855
TOTAL 3390 2376 2658 1895 4553
1 Derived by carparing Table 7 of the MOH/DANIDA report (cited earlier) with projected population for Kenya 1979-1985 (assuming a 2.8%population growth rate).
2 By implication fram Table 8, MOH/DANIDA report.
3 Assumes .75 coverage during the first three program years and .80 thereafter.
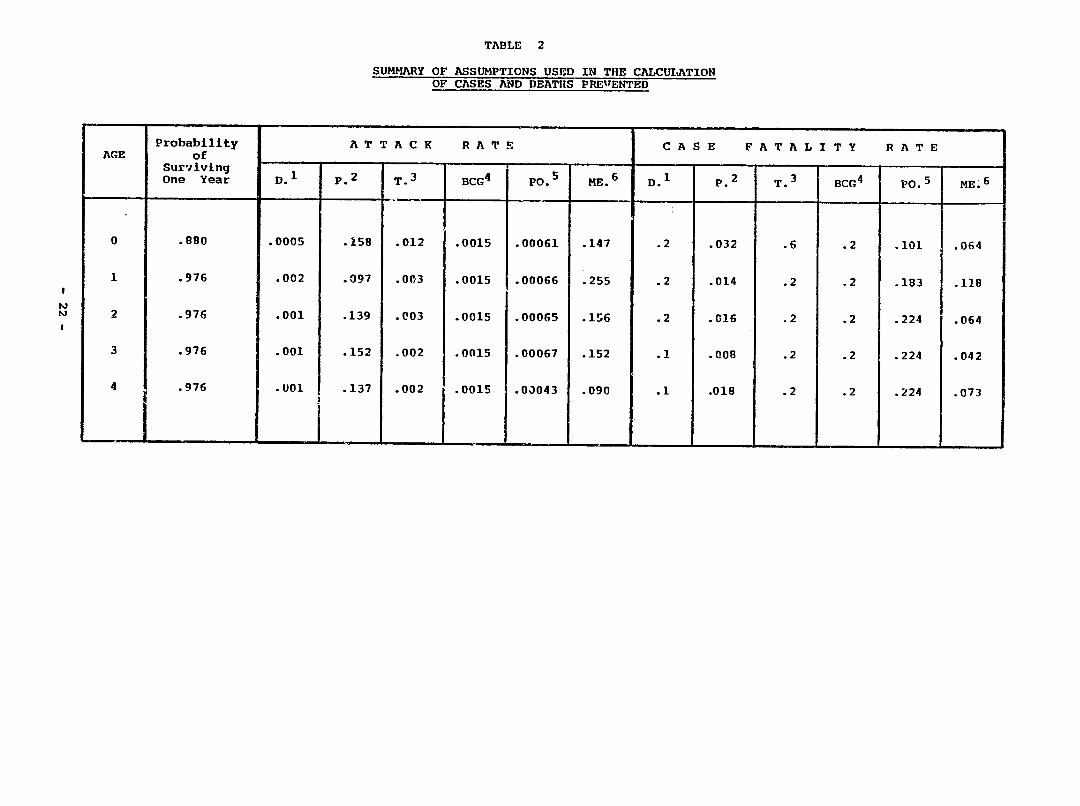
TABLE 2
SUMMARY OF ASSUMPTIONS USED IN THE CALCULATION OF CASES AND DEATHS PRErENTED
AGE
Probability
of
Surviving One Year D.1
A T T A C K
p. 2 T.3
R A T E
BCG 4 PO.5 ME.6
C
D.I
A S E
P.2
F A T A L I T Y
T.3 BCG4
R A T E
P0. 5 ME.6
0 .880 .0005 .158 .012 .0015 .00061 .147 .2 .032 .6 .2 .101 .064
1 .976 .002 .097 .003 .0015 .00066 .255 .2 .014 .2 .2 .183 .118
2 .976 .001 .139 .003 .0015 .00065 lr6 .2 .016 .2 .2 .224 .064
3 .976 .001 .152 .002 .0015 .00067 .152 .1 .008 .2 .2 .224 .042
4 .976 .001 .137 .002 .0015 .0J043 .090 .1 .018 .2 .2 .224 .073

TABLE 2 (continued)
FOOTNOTES
1 Data for Kenya were not available. These estimates are
roughly consistent with Bassett and Hadler (Sudan), DiopMar, Sow and Rey (Senegal) and the assumptions used in Barnum, Tarantola and Setiady (Indonesia).
2 J.M. Mahieu, A.S. Muller, A.M. Voorhoeve and H. Dikken
(Kenya).
Based on Bassett and Hadler (Sudan), Case fatality rates are as used in Barnum, Tarantola, Setiady (Indonesia).
Estimated from a statement in the MOH/DANIDA report (Kenya) that .03 of children aged 0-4 are tuberculin positive. It is assumed that .05 of children who are positive develop the disease. This is an especially weak estimate and for this reason the cost an& effect of BCG immunization has not been broken out for separate analysis in the text. The case fatality fate is as used in a WHO report for Rwanda.
B.K. Nottay and D. Metselaar estimate that the attack rate per 100,000 in Kenya is approximately 12. Information in Nottay and Metselaar together with data in Bassett and Hadler (Sudan) perinitted the construction of a hypothetical distribution of polio over age groups 0 through 4. (.23, .22, .21, .21 and .13 respectively). Assuming that all of the 12 cases per 200,000 occur at less than five years and deriving the population age distribution for Kenya from a model life table it is possible to estimate the attack rate. Case fatality rates are based on data in Bassett and Hadler (Sudan).
6 The estimates are based on the age 'istribution of measles cases given in Voorhoeve et al (Kenya) and the assumption that .80 of all children will have measles by the end of the 5th year. The estimates in Voorhoeve et al show approximately 50% of all children having measles by the end of year five. This estimate was felt to be conservative and the attack rates in Voorhoeve were adjusted upward to give the 80% figur- . The case fatality rates are as given in Voorhoeve.
- 23
TABLE 2 (continued)
BIBLIOGRAPHY
H.N. Barnum, D. Tarantola, I.F. Setiady, "Cost Effectiveness of a Program on Immunization in Indonesia", Bulletin of the World Health Organization. (forthcoming, 1980).
D.C. Bassett, S.C. Hadler, Capability Assessment of Sudan EPI, CDC/USAID, 1979. (2nd Draft).
Kenya, Ministry of Health and DANIDA, Appraisal Report on the Expanded Programme on Immunization, November, 1978.
I. Diop Mar, A. Sow, M. Rey, "La diptherie en Afrique tropicale" Afrique Medicale. 10:93, 749-756
J.M. Mahieu, A.S. Muller, A.M. Voorhoeve, H. Dikken, "Pertissis in a Rural Area of Kenya" Epidemiology and a Preliminary Report on a Vaccine Trial", Bulletin of the World Health Organization. 56 (5): 773-780, 1978.
B.K. Nottay, D. Metselaar, "Poliomyelitis: Epidemiology and Prophylaris (a longitudinal epidemiological survey in Kenya)",Bulletin of the World Health Organization. 48: 421-427, 1973.
World Health Organization, Plan du Programme Elargo de Vaccination pour 1979. (Rwanda). RWA/HSD/00!.-- EPI.
- 24
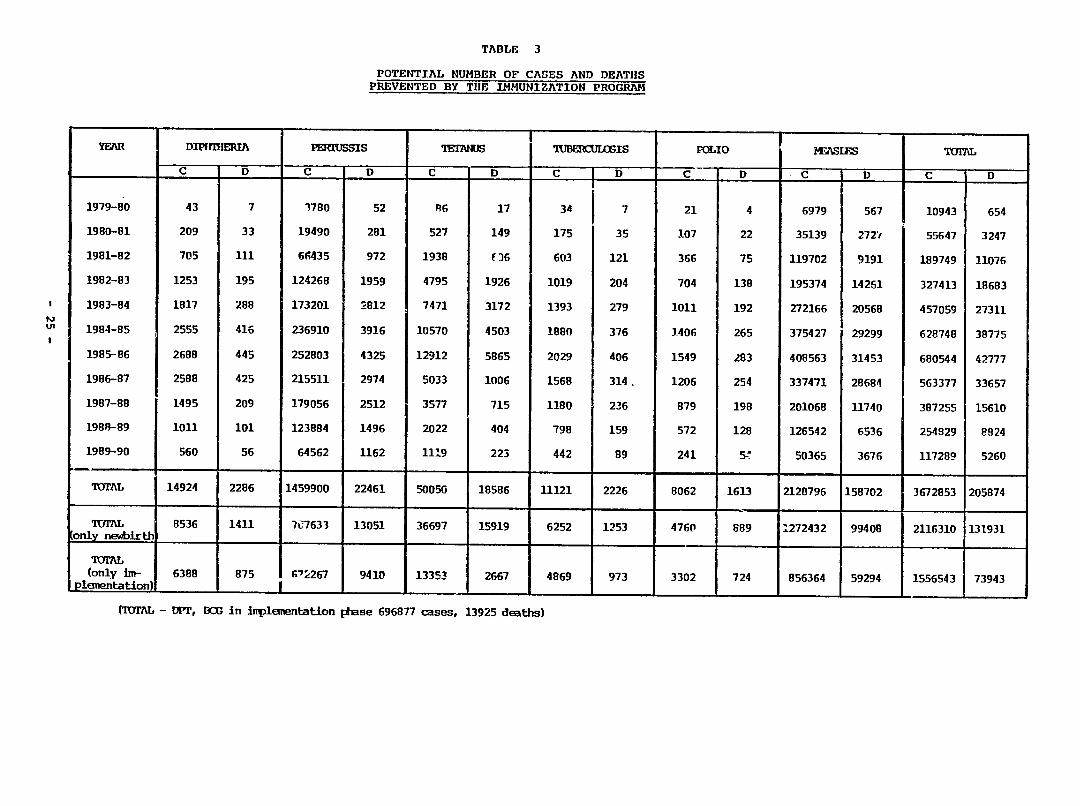
TABLE 3
POTENTIAL NUMBER OF CASES AND DEATHS PREVENTED BY THE IMMUNIZATION PROGRAM
YEAR
1979-80
DIPIfIHIA
C D
43 7
PEIRUSSIS
C D
1780 52
MIANUS
C
A6
D
17
TUBERCU[LOSIS
C D
34 7
POLIO
C
21
D
4
MEASLES
C D
6979 567
TOT
C
10943
D -
654
1980-81
1981-82
1982-83
1983-84
1984-85
209
705
1253
1817
2555
33
111
195
288
416
19490
64435
124268
173201
236910
281
972
1959
2812
3916
527
1938
4795
7471
10570
149
(36
1926
3172
4503
175
603
1019
1393
1880
35
121
204
279
376
107
366
704
1011
1406
22
75
138
192
265
35139
119702
195374
272166
375427
2721
9191
14261
20568
29299
55647
189749
327413
457059
628748
3247
11076
18683
27311
38775
1985--86
1986-87
1987-88
1988-89
1989-90
2688
2588
1495
1011
560
445
425
209
101
56
252803
215511
179056
123884
64562
4325
2974
2512
1496
1162
12912
5033
3577
2022
1119
5865
1006
715
404
223
2029
1568
1180
798
442
406
314.
236
159
89
1549
1206
879
572
241
283
254
198
128
5j
408563
337471
201068
126542
50365
31453
28684
11740
6536
3676
680544
563377
387255
254929
117289
42777
33657
15610
8924
5260
UIAL 14924 2286 1459900 22461 50050 18586 11121 2226 8062 1613 2120796 158702 3672853 205874
TVIAL only newbirthi
8536 1411 707633 13051 36697 15919 6252 1253 4760 889 1272432 99408 2116310 131931
(only un- 6388 ploentation)
(TOM - DiP,
875 G"2267 9410 13353 2667 4869 I I
BCG in Inplementatlon phase 696877 cases, 13925 deaths)
973 3302 724 856364 59294 I 1556543 73943
TABLE 4
COST BREAKDOWN BY TYPE OF IMMUNIZATION PROGRAM (000's of K. sh.)
C O S T
CATEGORY
vmraL PIERXWM
(Col.1)
W3T, TF, & BCr
Only
(Col. 2)
MEASLES
Only
(Col. 3)
POLIO
Only
(Col. 4)
DPT, TT, & BCG
Marginal
Co1.5)
MF1'SI
Marginal
(ol. 6)
POLIO
Marginal
(Col. 7)
IMPLE-NEW MENTATION
BIRSIsHmNI-ZATICN
Only Marginal
(ol. 8) (Col. 9)
ImIE-MFJATIN7
IltUNI-ZATION
Marginal (DPT, DC)
(Col. 10)
DANIDA, UNICEF
Dep. on Vehicles, Tranportation 3141 3141 1571 3141 3141
Dep. on Other capital exp. 1047 1047 1047 1047 - 1047 - -
Syringes, Needles
Vaccine
2030
19538
2030
8590
-
10653
-
295
2030
8590
-
10653
-
295
792
7620
1238
11918
1238
5240
Conting-ncie- 3719 1525 1413 781 1525 1413 791 1450 2269 930
Other Equip. & Sup. 6000 6000 6000 6000 - - - 6000 - -
MVKENYA
Adm. Overhead 19305 19305 19305 19305 - - - 19303 - -
Other variable (personnel)
exp. 77219 52125 19302 46333 11584 19302 5792 30115 47104 31797
IOAL 131999 93763 59291 76902 23729 31368 6868 69470 62529 39205
Col. 10 = Col. 2 x Col. 1
Col.9
TABLE 5
COST EFFECTIVENESS OF POSSIBLE IMMUNIZATION PROGRAMS FOR KENYA
PROGRAM DESCRIPTION
1. Total Program
2. DPT, TT, BCG only
3. Measles only
4. Polio only
5. DPT, TT, BCG as marginal program
6. Measles as marginal program
7. Polio as
marginal program
8. New Births only
9. Implementation marginal
(ALL IMMUNIZATIONS)
10. Implementation marginal
(DPT,BCG, Polio)
COST
000's of K. sh.
131999
93763
59291
76902
23729
31368
6868
69470
62529
39205
COST PER CASE PREVENTED
K.sh. ($)
36 ($4.8)
61 ($8.1)
28 ($3.7)
9539 ($1272)
15 ($2)
15 ($2)
852 ($114)
33 ($4.4)
40 ($5.3)
56 ($7.5)
COST PER DEATH PREVENTED
K. sh. ($)
641 ($85)
2058 ($274)
374 ($50)
47676 ($6357)
521 ($69)
198 ($26)
4258 ($568)
527 ($70)
846 ($113)
2815 ($375)
- 27

TABLE 6
SUMMARY OF INFORMATION NEEDED TO CALCULATE CASES AND DEATHS PREVENTED FROM DIARRHEA CONTROL
AGE
Nuber of children
per 10000 total pop.
(Col. 1)
Mortality Rate fran
All Causes1
(Col. 2)
Proportion of Mortality Attributable to Diarrhea 2
(Col. 3)
Mortality Rate
Attributable to Diarrhea"
(Col. 4)
Cases per Year 4
per Person
(Col. 5)
Inplied Case Fatality
Rate 5
(Col. 6)
0 453 .120 .33 .03 4.2 .01
1 398 .030 .40 .012 1.8 .007
2 386 .024 .25 .0075 .9 .006
3 376 .024 .25 .0075 .9 .006
4 367 .024 .25 .005 .9 .006
TABLE 6 (continued)
FOOTNOTES
By assumption based on reported infant mortality rate and life table; U.S. Department of Commerce, Country Demographic Profiles, KENYA, January 1978.
2 Approximated by reference to data in Puffer and Serrano,
Patterns of Mortality in Childhood, PAHO, 1973. Although the Puffer and Serrano study was of Western Hemisphere countries, the importance of diarrhea as a leading cause of death was consistent over a large number of countries throughout South America. Their findings are also consistent with less comprehensive studies of the causes of childhood mortality in Africa and are likely to be valid for any communities with high levels of infant and child mortality and limited water and sanitation facilities.
3 Col.4 = Col.2 X Col.3
4 From an extrapolation of the case rates per 2 week interval as reported in J. Leeuwenburg et al, 1978, "Machakos Project Studies: Agents affecting health of mother and child in a rural area of Kenya: The incidence of diarrhoeal disease in the under-five population." Tropicnl and Geographical Medicine. 30:3, p383-391.
5 Col.6 = Col.4 - Col.5
- 29
TABLE 7
COST EFFECTIVENESS OF A HYPOTHETICAL WATER PROJECT IN THE PREVENTION OF CHILDHOOD DIARRHEA
1. Cost for a community of 10000. $ 7000
2. Number of Cases Prevented per Year. 1 544
3. Number of Deaths Prevented per 7ear.1 5
4. Cost-per Case Prevented $ 13
5. Cost per Death Prevented $ 1400
In children 0-4 years of age. Assuming an efficacy of .15.
- 30
1

TABLE 8
THE COST OF A HYPOTHETICAL ORAL REHYDRATION PROGRAM FOR KENYA
000's K.sh. (000's $)
C 0 S T C A T E G O R Y
Vehicles 1
Packets2
Other Equipment and Training3
Contingencies4
Administrative Expenses5
Personnel 6
TOTAL COSTS
Independent Program
1600
14000
1500
1700
5000
18000
41800 ($5573)
The Program Considered as
"added" or marginal
14000
1500
1400
18000
34900 ($4653)
- 31
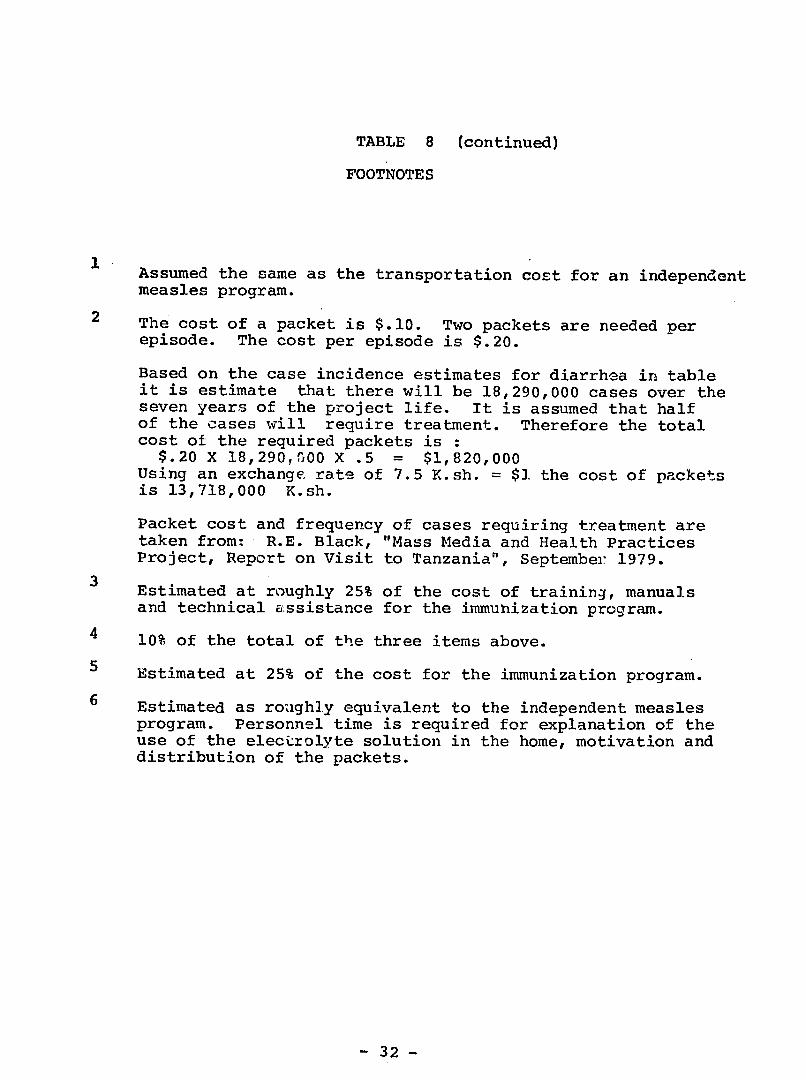
TABLE 8 (continued)
FOOTNOTES
Assumed the same as the transportation cost for an independent
measles program.
2 The cost of a packet is $.10. Two packets are needed per episode. The cost per episode is $.20.
Based on the case incidence estimates for diarrhea in table it is estimate that there will be 18,290,000 cases over the seven years of the project life. It is assumed that half of the cases will require treatment. Therefore the total cost of the required packets is :
$.20 X 18,290,G00 X .5 = $1,820,000 Using an exchange rate of 7.5 K.sh. = $1 the cost of packets is 13,718,000 K.sh.
Packet cost and frequency of cases requiring treatment are taken from: R.E. Black, "Mass Media and Health Practices Project, Report on Visit to Tanzania", September 1979.
Estimated at roughly 25% of the cost of training, manuals
and technical assistance for the immunization program.
4 10% of the total of the three items above.
Estimated at 25% of the cost for the immunization program.
6 Estimated as roughly equivalent to the independent measles program. Personnel time is required for explanation of the use of the electrolyte solution in the home, motivation and distribution of the packets.
- 32