Economic indicators report: Industry & Development
23
ECONOMIC INDICATORS REPORT: INDUSTRY & DEVELOPMENT UPDATED QUARTERLY Current as at 30.06.2020 Presented by ECONOMY & PROSPERITY
Transcript of Economic indicators report: Industry & Development

ECONOMIC INDICATORS REPORT: INDUSTRY & DEVELOPMENT
UPDATED QUARTERLY
Current as at 30.06.2020
Presented by ECONOMY & PROSPERITY

ISAAC.QLD.GOV.AU Economic indicators report: Industry & Development – 30.06.2020 02
ECONOMIC PROFILE

ISAAC.QLD.GOV.AU Economic indicators report: Industry & Development – 30.06.2020 03
ISAAC REGION ECONOMIC PROFILE
FIGURE 1. SUMMARY
(Source: REMPLAN Economy)
FIGURE 2. GSP/GRP COMPARISON
(Source: REMPLAN Economy)

ISAAC.QLD.GOV.AU Economic indicators report: Industry & Development – 30.06.2020 04
FIGURE 3. OUTPUT
(Source: REMPLAN Economy)
FIGURE 4. VALUE ADD
(Source: REMPLAN Economy)

ISAAC.QLD.GOV.AU Economic indicators report: Industry & Development – 30.06.2020 05
FIGURE 5. REGIONAL EXPORTS
(Source: REMPLAN Economy)
FIGURE 6. REGIONAL IMPORTS
(Source: REMPLAN Economy)
FIGURE 7. JOBS
(Source: REMPLAN Economy)

ISAAC.QLD.GOV.AU Economic indicators report: Industry & Development – 30.06.2020 06
ECONOMIC DRIVERS/KEY
PROPULSIVE SECTORS

ISAAC.QLD.GOV.AU Economic indicators report: Industry & Development – 30.06.2020 07
KEY PROPULSIVE SECTORS REPORT
These industry sectors (in descending order from most significant) re the key drivers of the Isaac Region’s economy in terms of regional exports, employment, value-added and local expenditure on goods and services (backward linkages).
DEFINITIONS
Value-Added - represents the marginal economic value that is added by each industry sector in a defined region. Value-Added is calculated by subtracting local expenditure and expenditure on regional imports from the output generated by an industry sector. Value-Added by industry sector is the major element in the calculation of Gross Regional Product.
Employment - the key social outcome of economy development; employment data represents the number of people employed by businesses / organisations in each of the industry sectors in the Isaac (R) Region.
Regional Exports - represents the value of goods and services exported outside of the Isaac (R) Region that have been generated by local businesses / organisations. Another way of defining exports is as an inflow of money into the region, i.e. Motels have an inflow of money from people who live outside the region’s boundaries thus they are earning export equivalent dollars.
Backward Linkages - details the industry sectors which spend the most on locally sourced intermediate goods and services per dollar of output. These industry sectors may not necessarily make the largest contributions to the Region’s economy at present however due to well developed local supply chains these sectors have a significant capacity to deliver
FIGURE 8. ISAAC REGION KEY PROPULSIVE SECTORS
Industry Sectors Backward Linkages
Exports Employment Value-Added Total
Agriculture, Forestry & Fishing 4
Mining 3
Construction 3
Manufacturing 2
(Source: REMPLAN Economy)
ECONOMIC OVERVIEW OF INDUSTRY SECTORS
AGRICULTURE, FORESTRY & FISHING (AGRIBUSINESS)
The Agribusiness sector contributes $308.653 million (and accounts for 2.2%) of the region’s total output. The sector is
the region’s second highest industry employer supporting 1,160 jobs (5.4%). The agribusiness industry sector sells
$36.561 million to local industry sectors as intermediate inputs into production and for further value-adding.
The total value of local sales for an industry sector relative to exports provides insights into the degree to which the
industry is dependent on local demand versus demand from outside the region. Agriculture, Forestry and Fishing is the
region’s third largest regional exporter ($256.098 million versus $36.56 million in local sales) and as such, Isaac’s
agribusiness sector is highly dependent on external demand.
Local Expenditure data represents the value of intermediate goods and services purchased by local industry sectors
within the region. A high level of local expenditure on intermediate goods and services proportionate to total output is
indicative of a well-developed local supply chain. In this instance, Isaac’s Agribusiness sector supply chain is quite well
developed, so any expansion in this sector would typically deliver broad based benefits for the region’s economy.
(Source: REMPLAN Economy)

ISAAC.QLD.GOV.AU Economic indicators report: Industry & Development – 30.06.2020 08
FIGURE 9. ECONOMIC OVERVIEW - AGRICULTURE
(Source: REMPLAN Economy)
MINING
The Isaac is a resource rich region spanning a large portion of the Bowen and Galilee Basins. It’s home to 26 active
coal mines, with further significant mining projects under development and gas exploration in the early stages. Isaac
region produces more than half (54%) of Queensland’s saleable coal, with the majority being world-class metallurgical
coal. Isaac’s mining sector also contributes $1.5 billion of Queensland’s royalties out of a total $3.8 billion (39.5%).
The Isaac economy is largely driven by the resources sector, which contributes $11.131 billion (or 79.3%) to the
region’s total output. The sector is the highest performer across output, employment, local sales, regional exports,
regional expenditure, and value added. The sector also imports the most of all industries.
Many of the goods and services imported from overseas are priced at a level making substitution with the local supply
unlikely and in instances, unfeasible. Imports from the rest of Australia (domestic imports) however, indicate
opportunities for import replacement, increased value adding and supply chain development. Supply of these goods
and services is currently feasible in the Australian context and provide a guide to realistic, high value strategic
opportunities to further develop the economy. A total of $5.181 billion in domestic goods and services are imported
from outside the region’s boundaries as inputs to the sector’s production process. This is significant economic leakage
that could be retained within the region through an improved supply chain.
(Source: REMPLAN Economy)
FIGURE 10. ECONOMIC OVERVIEW - MINING
(Source: REMPLAN Economy)
CONSTRUCTION
Construction services refer to businesses and organisations engaged in site preparation, trades, landscaping and the
hire of construction machinery. The construction services sector contributes $423.253 million accounting for 3% of the
region’s total output and supporting 848 local jobs.
The sector accounts for a significant share of the region’s local sales with $117.45 million (11.4%). Local expenditure
$62.49 million. Local sales relative to exports ($117.45M to $64.37M) reflects and industry sector which is highly
dependent on local demand compared to demand from outside of the region.

ISAAC.QLD.GOV.AU Economic indicators report: Industry & Development – 30.06.2020 09
The Construction sector in Isaac domestically imports a total of $214.34 million in goods and services from outside the
region’s boundaries as inputs into the sector’s production process.
(Source: REMPLAN Economy)
FIGURE 11. ECONOMIC OVERVIEW – CONSTRUCTION
(Source: REMPLAN Economy)
MANUFACTURING
The manufacturing sector contributes $610.564 million to total regional output, accounting for 4.3% of the region’s total
output and supporting 423 jobs (2% of the region’s total employment). This industry sector is selling $224.526 million of
goods and services to local industry for inputs into their production process which is a significant share of the region’s
local sales (14.5%). The manufacturing sector is also the second highest exporting industry sector in the region with
regional exports of $369.343 million (3.2% of total regional exports).
The manufacturing sector in Isaac imports a total of $417.132 million in goods and services from outside the region’s
boundaries as inputs to the sector’s production process. Many of the goods and services imported from overseas are
priced at a level making substitution with the local supply unlikely and in instances, unfeasible. Imports from the rest of
Australia (domestic imports) however, indicate opportunities for import replacement, increased value adding and supply
chain development. Supply of these goods and services is currently feasible in the Australian context and provide a
guide to realistic, high value strategic opportunities to further develop the economy. Domestic imports by the local
manufacturing sector totals $152.28 million.
(Source: REMPLAN Economy)
FIGURE 12. ECONOMIC OVERVIEW – MANUFACTURING
(Source: REMPLAN Economy)
Page 10 of 23
BOWEN BASIN UPDATE –
RESOURCE OPERATIONS

Page 11 of 23
BOWEN BASIN UPDATE (2017-19) The Bowen Basin in Central Queensland contains most of the State’s high quality metallurgical (coking and pulverised coal injection) coal reserves, as well as significant deposits of thermal coal. At June 2018, there were 44 coal mining operations and two metalliferous mines located in the region, along with coal seam gas (CSG) operations and other resource industry related infrastructure. Two new coal mines in the Bowen Basin commenced operations during 2017–18. Byerwen mine, operated by Byerwen Coal, is a hard coking coal mine expected to produce up to 10 million tonnes (Mt) per year once fully operational (QCoal Group, 2017). Aurizon began hauling coal from the mine in January 2018 (Aurizon, 2018). Meteor Downs South mine, a partnership between U&D Coal Limited and Sojitz Coal Mining, will have a capacity of more than 1.5 Mt per annum and a mine life of approximately 10 years (U&D Coal Ltd, 2018). First coal was mined in April 2018 (Sojitz Coal Mining, 2018). Three coal mines resumed operations in 2017–18 after being placed in care and maintenance by previous owners. Broadlea mine, which ceased operations in 2009, was acquired by Fitzroy Australia Resources in 2016. Contractors began overburden removal at the mine in October 2017 (Fitzroy Australia Resources, 2017). Mining at Baralaba North (formerly known as Baralaba mine), now owned by Baralaba Coal Company, restarted in May 2018, and is expected to reach full production by the end of 2018 (NRW Holdings, 2018). Cook mine was recommissioned by its new owner, Bounty Mining, in January 2018 and the first shipment of export coal left the Port of Gladstone in late June (Bounty Mining Limited, 2018). One coal infrastructure project was under construction in Isaac (R) in June 2018. BHP’s Caval Ridge Southern Circuit Project, which will convey coal from Peak Downs mine to Caval Ridge mine for processing, was progressing according to plan (BHP, 2018c). Conveying of first coal was expected in October 2018 (BHP, 2018b). Six solar energy projects were also under construction across the region in June 2018: Collinsville Solar Photovoltaic Project (RATCH-Australia Corporation, 2018) and Daydream and Hayman Solar Farms (Edify Energy, 2018a; Edify Energy, 2018b) in Whitsunday (R) (Bowen only); Emerald Solar Park (Renewable Energy Systems, 2018) and Lilyvale Solar Farm (Fotowatio Renewable Ventures, 2017) in Central Highlands (R); and Clermont Solar Farm (WIRSOL Energy, 2018) and Rugby Run Solar Farm (Adani Australia, 2018) in Isaac (R). All solar projects are expected to be operational by the end of 2018. The non–resident population influences of these projects will be short lived, as ongoing operational workforces will be small and predominantly resident-based in contrast to their construction workforces. In addition to new and reopened coal mines an construction projects, activity in the Bowen Basin in 2017-18 was influenced by expanded production activities and planned maintenance at existing mining operations. In total, the size of the Bowen Basin’s coal industry workforce grew from around 29,600 persons in June 2017 to 35,000 persons in June 2018 – an increase of 5,400 persons or 18% (DNRM, 2018). Of these 35,000 workers, around 1,000 were engaged at new or reopened coal mines, with the majority at existing operations. Workforce growth over this period is consistent with record production reported across several operations and maintenance works and sustaining projects at a number of mines.
(Source: Anglo American, 2018; BHP, 2018a; DIIS, 2018b; DNRM, 2018; Mastermyne, 2018).
PLANNED AND OPERATING PROJECTS
FIGURE 13. RESOURCE OPERATIONS IN THE BOWEN BASIN
Category(a) Project / operation name Company name LGA
Active operations(b)
A Abbot Point Bulk Coal Adani Australia Whitsunday (R) (Bowen only)
A Baralaba North Baralaba Coal Company Banana (S)
A Blackwater BHP Central Highlands (R)
A Blair Athol TerraCom Isaac (R)
A Broadmeadow BHP Isaac (R)
A Byerwen Byerwen Coal Isaac (R)
A Callide Batchfire Resources Banana (S)
A Callide Power Station CS Energy Banana (S)
A Capcoal Surface Operations Anglo American Isaac (R)
A Carborough Downs Fitzroy Australia Resources Isaac (R)
A Caval Ridge BHP Isaac (R)
A Clermont Glencore Coal Isaac (R)

Page 12 of 23
A Collinsville Glencore Coal Whitsunday (R) (Bowen only)
A Cook Bounty Mining Central Highlands (R)
A Coppabella Peabody Energy Isaac (R)
A Coppabella Train Loadout Facility Pacific National Isaac (R)
A Cracow Gold Mine Evolution Mining Banana (S)
A Curragh Coronado Coal Central Highlands (R)
A Daunia BHP Isaac (R)
A Dawson Anglo American Banana (S)
A Ensham Ensham Resources Central Highlands (R)
A Foxleigh Middlemount South Isaac (R)
A GLNG Drilling and Completions GLNG(c) Banana (S), Central Highlands (R)
A GLNG Surat Operations and Gas Gathering GLNG(c) Banana (S), Central Highlands (R)
A Goonyella Riverside BHP Isaac (R)
A Grasstree Anglo American Isaac (R)
A Greater Meridian SeamGas Drilling and Completions WestSide Corporation Banana (S)
A Greater Meridian SeamGas Operations and Gas Gathering
WestSide Corporation Banana (S)
A Grosvenor Anglo American Isaac (R)
A Hail Creek Glencore Coal Isaac (R)
A Isaac Plains Complex Stanmore Coal Isaac (R)
A Jellinbah East Jellinbah Group Central Highlands (R)
A Jellinbah Plains Jellinbah Group Central Highlands (R)
A Kestrel Kestrel Coal Resources Central Highlands (R)
A Lake Vermont Jellinbah Group Isaac (R)
A Meteor Downs South Sojitz Coal Mining Central Highlands (R)
A Middlemount Middlemount Coal Isaac (R)
A Millennium Peabody Energy Isaac (R)
A Minerva Sojitz Coal Mining Central Highlands (R)
A Moorvale Peabody Energy Isaac (R)
A Moranbah Ammonium Nitrate Plant Incitec Pivot Isaac (R)
A Moranbah Gas Project Arrow Energy Isaac (R)
A Moranbah North Anglo American Isaac (R)
A Mt Carlton Gold Mine Evolution Mining Whitsunday (R) (Bowen only)
A Nebo Rail Maintenance Facility Pacific National Isaac (R)
A Newlands Glencore Coal Isaac (R)
A North Goonyella Peabody Energy Isaac (R)
A Oaky Creek Glencore Coal Central Highlands (R)
A Peak Downs BHP Isaac (R)
(a) The five categories include active operations, and projects grouped according to their status in the approvals process as at December 2018. See methodology (page 2) and caveats (page 12) for further details.
(b) Operations that are in care and maintenance or that have ceased production are not included in this list or in the projections. These include Crinum and Gregory in Central Highlands (R) and Broadlea, Newlands Underground and Norwich Park in Isaac (R).
(Source: Bowen and Galilee Basins non-resident population projections 2019-2025)

Page 13 of 23
PROPOSED AND UPDATED
PROJECTS WITHIN ISAAC
Page 14 of 23
FIGURE 14. PROPOSED AND UPDATED MAJOR PROJECTS WITHIN ISAAC LGA (AS AT 2019)
Project Proponent Location Status Coordinated project Peak Workforce Projected Start
Byerwen Coal Project (BCP)
QCoal Group 20 km west of Glenden
EIS approved with conditions July 2014 (SDPWO Act). Early works commenced 2017
Yes Construction – 350
Operation - 545
2017
Olive Downs Project
Pembroke 30km North East of Dysart, South of Moranbah
EIS approved with conditions
Yes Construction – 500 -700 Operations 480
(Note: Wilunga expansion proposed 2027)
Construction. 2019-20
Operations 2021
New Lenton Project (NLP)
New Hope Group Approximately65 km north-west of Nebo, 65 km north of Moranbah, and 20 km south of Glenden
Lapsed – an EIS was not received by the designated date of 27 June 2018. The proponent may recommence the process in the future.
No Construction -200
Operation - 300
Unknown/Lapsed
Red Hill Mining Lease Project (RHMLP)
BMA 20 km north of
Moranbah
EIS approved with conditions June 2015 (SDPWO Act) EIS assumed development from 2020
Yes Construction - 2,000
Operation - 1,500
2020-21
Saraji East Mining Lease Project
BMA Approximately 60 km south east of Moranbah and 30 kms north of Dysart
Final Terms of Reference has been issued, EIS in preparation
No Construction – 1,000
Operation - 500
Potentially Construction -2022
Operations - 2024
Carmichael Coal Mine and Rail Project (CCM&RP)
Adani Mining Pty ltd Approximately 160 km northwest of Clermont
EIS approved with conditions May 2014 (SDPWO Act). Early works commenced October 2017. Details of outstanding approvals and milestones reached provided 28th June 2019. Items C – F still to be completed
Yes Mine:
Construction - 1075
Operation 3800
Railway line:
Construction 1400)
Operation - 120
Unknown
Page 15 of 23
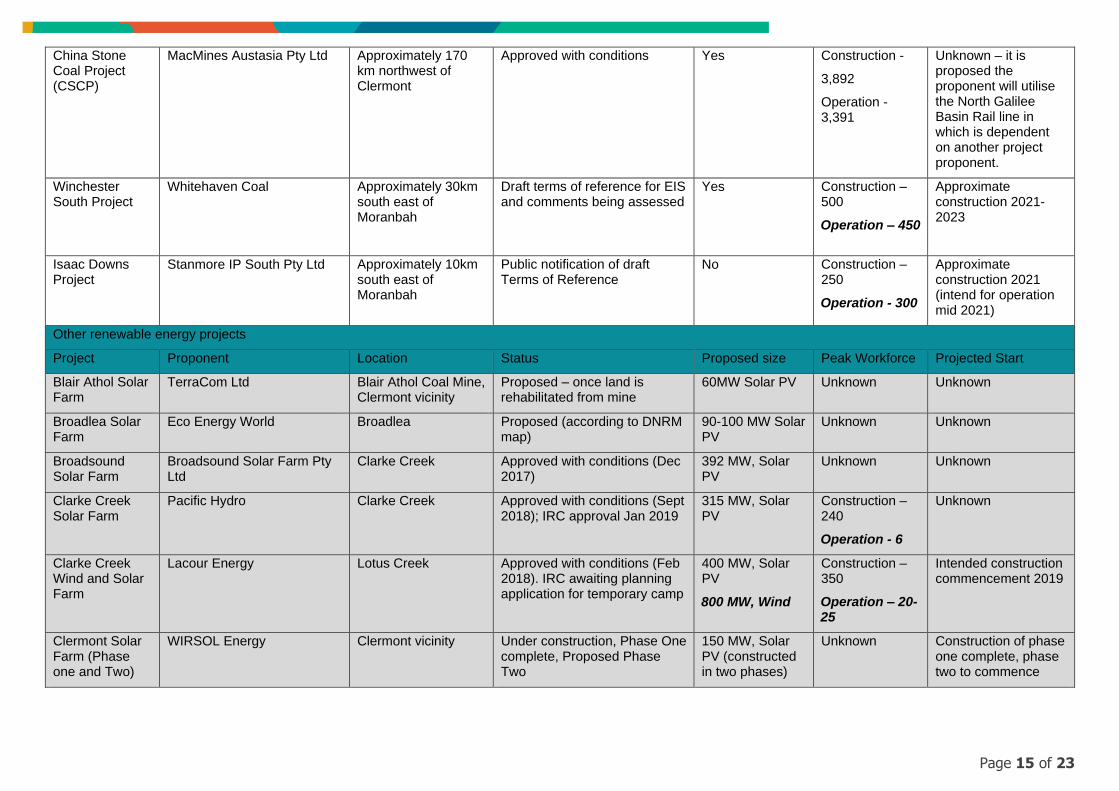
China Stone Coal Project (CSCP)
MacMines Austasia Pty Ltd Approximately 170 km northwest of Clermont
Approved with conditions Yes Construction -
3,892
Operation - 3,391
Unknown – it is proposed the proponent will utilise the North Galilee Basin Rail line in which is dependent on another project proponent.
Winchester South Project
Whitehaven Coal Approximately 30km south east of Moranbah
Draft terms of reference for EIS and comments being assessed
Yes Construction – 500
Operation – 450
Approximate construction 2021-2023
Isaac Downs Project
Stanmore IP South Pty Ltd Approximately 10km south east of Moranbah
Public notification of draft Terms of Reference
No Construction – 250
Operation - 300
Approximate construction 2021 (intend for operation mid 2021)
Other renewable energy projects
Project Proponent Location Status Proposed size Peak Workforce Projected Start
Blair Athol Solar Farm
TerraCom Ltd Blair Athol Coal Mine, Clermont vicinity
Proposed – once land is rehabilitated from mine
60MW Solar PV Unknown Unknown
Broadlea Solar Farm
Eco Energy World Broadlea Proposed (according to DNRM map)
90-100 MW Solar PV
Unknown Unknown
Broadsound Solar Farm
Broadsound Solar Farm Pty Ltd
Clarke Creek Approved with conditions (Dec 2017)
392 MW, Solar PV
Unknown Unknown
Clarke Creek Solar Farm
Pacific Hydro Clarke Creek Approved with conditions (Sept 2018); IRC approval Jan 2019
315 MW, Solar PV
Construction – 240
Operation - 6
Unknown
Clarke Creek Wind and Solar Farm
Lacour Energy Lotus Creek Approved with conditions (Feb 2018). IRC awaiting planning application for temporary camp
400 MW, Solar PV
800 MW, Wind
Construction – 350
Operation – 20-25
Intended construction commencement 2019
Clermont Solar Farm (Phase one and Two)
WIRSOL Energy Clermont vicinity Under construction, Phase One complete, Proposed Phase Two
150 MW, Solar PV (constructed in two phases)
Unknown Construction of phase one complete, phase two to commence

Page 16 of 23
Dysart 2 Solar Farm
Renewable Energy Developments/Hanwha
17km NE of Dysart Approved (Nov 2017) 130-145 MW, Solar PV
Unknown Anticipated construction 2018, connection stage early 2019
Dysart Solar Energy Farm
Tilt Renewables 8km East of Dysart Approved (Nov 2017) 100 MW, Solar PV
Construction – 300
Operation - 2
Unknown
Middlemount Sun Farm
SUSI Partners 1km East of Middlemount
Approved 26-34 MW, Solar PV
Unknown Unknown
Nebo Solar Farm
Tilt Renewables Nebo Proposed 80 MW, Solar PV Unknown Unknown
North Creek Solar Farm
Tilt Renewables Coppabella Approved with conditions (Aug 2018)
80MW, Solar PV Unknown Unknown
Rugby Run Solar Farm (Stages one and two)
Adani Renewables Moranbah Commissioned, Proposed Stage Two
65 MW, Solar PV (Approval for up to 300 MW)
Unknown Expected to be fully operational in first quarter, 2019
(Source: Isaac Regional Council – Internal Document)

Page 17 of 23
DNRME NATURAL RESOURCES INVENTORY
The Department of Natural Resources, Mines and Energy keep an inventory of all of Queensland’s natural resources
and how they are used. We have filtered this down to obtain specific data to the Isaac Region for each resource.
*Please note, there is a lag in the data provided due to the updating frequency.
RENEWABLE RESOURCES
FIGURE 15. COMMERCIAL PLANTS >1MW IN THE ISAAC REGION
(Source: DNRME Inventory - 2018)
FIGURE 16. ISAAC REGION RENEWABLE PRODUCTION CAPACITY
(Source: DNRME Inventory - 2018)
PETROLEUM & GAS
FIGURE 17. ISAAC REGION GAS & PETROLEUM EXPLORATION PERMITS
(Source: DNRME Inventory - 2018)
Page 18 of 23
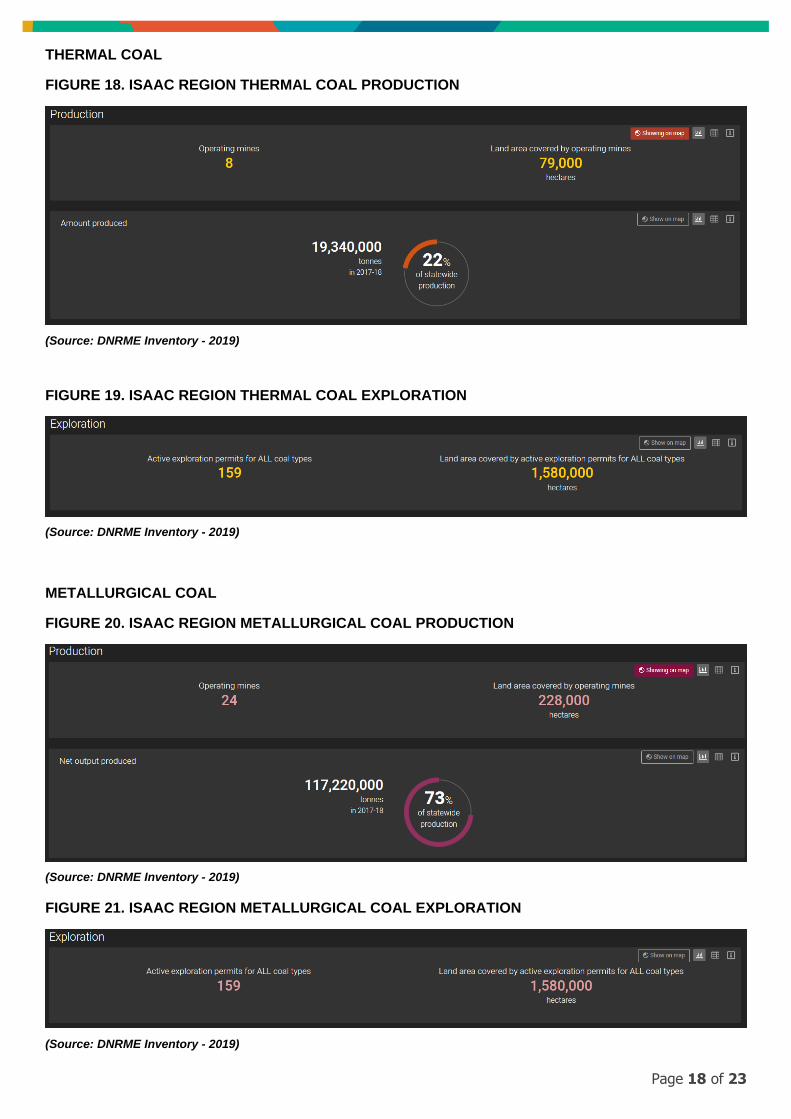
THERMAL COAL
FIGURE 18. ISAAC REGION THERMAL COAL PRODUCTION
(Source: DNRME Inventory - 2019)
FIGURE 19. ISAAC REGION THERMAL COAL EXPLORATION
(Source: DNRME Inventory - 2019)
METALLURGICAL COAL
FIGURE 20. ISAAC REGION METALLURGICAL COAL PRODUCTION
(Source: DNRME Inventory - 2019)
FIGURE 21. ISAAC REGION METALLURGICAL COAL EXPLORATION
(Source: DNRME Inventory - 2019)

Page 19 of 23
QUARRIES AND EXTRACTIVES (SAND, GRAVEL, ROCK, CLAY, SOIL)
FIGURE 22. TOTAL LOW-VALUE EXTRACTIVE PRODUCT RESOURCES
(Source: DNRME Inventory - 2017)
LAND
FIGURE 23. TOTAL LAND RESOURCES
(Source: DNRME Inventory - 2019)
VEGETATION
FIGURE 24. TOTAL VEGETATION RESOURCES
(Source: DNRME Inventory - 2019)
Page 20 of 23
BUILDING & PLUMBING

Page 21 of 23
BUILDING & PLUMBING
BUILDING AND PLUMBING APPLICATIONS
The following graph depicts the number of plumbing and building approvals issued throughout the Isaac region (both
internal and by private certifiers). Building and plumbing applications and approvals are an indicator for the level of
construction activity occurring in the region. They also indicate a level of consumer/investor confidence in the housing
market.
FIGURE 25. PLUMBING AND BUILDING APPROVALS IN ISAAC LGA
(Source: Isaac Regional Council 2019, refer to ECM Document 4710711 31/10/2019)
0
50
100
150
200
250
300
2014 2015 2016 2017 2018 2019
Plumbing and Building Approvals By Financial Year
Plumbing Building Private Certifier Yearly Total

Page 22 of 23
CATTLE SALES FIGURES

Page 23 of 23
CLERMONT SALEYARDS CATTLE SALE FIGURES
Figures from the Clermont Saleyards indicating the number of head of cattle (‘thruput’) per month, along with the total
revenue from each sale.
FIGURE 26. THRUPUT AND REVENUE FOR CATTLE SALES
(Source: Isaac Regional Council - Internal document)
FIGURE 27. ACCOMPANYING FIGURES WITH ABOVE GRAPH
Month Cattle Thruput (head) Revenue (dollars)
Dec-19 2416 $10,477
Jan-19 2519 $16,141
Feb-19 4602 $23,528
Mar-19 5605 $24,676
Apr-19 5605 $24,676
May-19 2929 $13,793
Jun-19 13485 $37,547
Jul-19 7014 $18,582
Aug-19 5508 $17,862
Sep-19 4573 $14,193
Oct-19 8395 $22,806
Nov-19 3032 $11,802
Dec-19 3612 $16,996
Jan-20 1781 $7641
Feb-20 1860 $13,255
Mar-20 8035 $43,551
Apr-20 8381 $35,208
May-20 12850 $54,706
(Source: Isaac Regional Council - Internal document)
0
10000
20000
30000
40000
50000
60000
0
2000
4000
6000
8000
10000
12000
14000
16000
Clermont Saleyards Figures
Thruput (Head) Revenue ($)