Economic and human development indicators
1
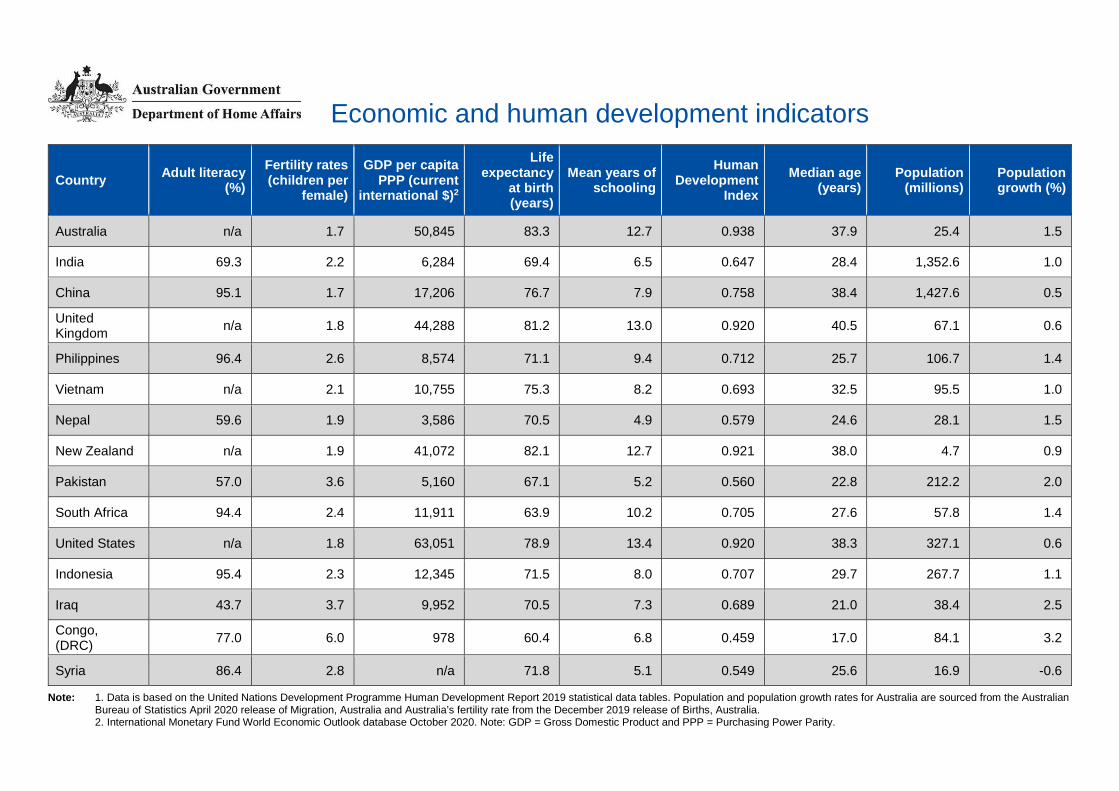
Economic and human development indicators Country Adult literacy (%) Fertility rates (children per female) GDP per capita PPP (current international $) 2 Life expectancy at birth (years) Mean years of schooling Human Development Index Median age (years) Population (millions) Population growth (%) Australia n/a 1.7 50,845 83.3 12.7 0.938 37.9 25.4 1.5 India 69.3 2.2 6,284 69.4 6.5 0.647 28.4 1,352.6 1.0 China 95.1 1.7 17,206 76.7 7.9 0.758 38.4 1,427.6 0.5 United Kingdom n/a 1.8 44,288 81.2 13.0 0.920 40.5 67.1 0.6 Philippines 96.4 2.6 8,574 71.1 9.4 0.712 25.7 106.7 1.4 Vietnam n/a 2.1 10,755 75.3 8.2 0.693 32.5 95.5 1.0 Nepal 59.6 1.9 3,586 70.5 4.9 0.579 24.6 28.1 1.5 New Zealand n/a 1.9 41,072 82.1 12.7 0.921 38.0 4.7 0.9 Pakistan 57.0 3.6 5,160 67.1 5.2 0.560 22.8 212.2 2.0 South Africa 94.4 2.4 11,911 63.9 10.2 0.705 27.6 57.8 1.4 United States n/a 1.8 63,051 78.9 13.4 0.920 38.3 327.1 0.6 Indonesia 95.4 2.3 12,345 71.5 8.0 0.707 29.7 267.7 1.1 Iraq 43.7 3.7 9,952 70.5 7.3 0.689 21.0 38.4 2.5 Congo, (DRC) 77.0 6.0 978 60.4 6.8 0.459 17.0 84.1 3.2 Syria 86.4 2.8 n/a 71.8 5.1 0.549 25.6 16.9 -0.6 Note: 1. Data is based on the United Nations Development Programme Human Development Report 2019 statistical data tables. Population and population growth rates for Australia are sourced from the Australian Bureau of Statistics April 2020 release of Migration, Australia and Australia’s fertility rate from the December 2019 release of Births, Australia. 2. International Monetary Fund World Economic Outlook database October 2020. Note: GDP = Gross Domestic Product and PPP = Purchasing Power Parity.
Transcript of Economic and human development indicators
Economic and human development indicators
Country Adult literacy
(%)
Fertility rates (children per
female)
GDP per capita PPP (current
international $)2
Life expectancy
at birth (years)
Mean years of schooling
Human Development
Index
Median age (years)
Population (millions)
Population growth (%)
Australia n/a 1.7 50,845 83.3 12.7 0.938 37.9 25.4 1.5
India 69.3 2.2 6,284 69.4 6.5 0.647 28.4 1,352.6 1.0
China 95.1 1.7 17,206 76.7 7.9 0.758 38.4 1,427.6 0.5
United Kingdom
n/a 1.8 44,288 81.2 13.0 0.920 40.5 67.1 0.6
Philippines 96.4 2.6 8,574 71.1 9.4 0.712 25.7 106.7 1.4
Vietnam n/a 2.1 10,755 75.3 8.2 0.693 32.5 95.5 1.0
Nepal 59.6 1.9 3,586 70.5 4.9 0.579 24.6 28.1 1.5
New Zealand n/a 1.9 41,072 82.1 12.7 0.921 38.0 4.7 0.9
Pakistan 57.0 3.6 5,160 67.1 5.2 0.560 22.8 212.2 2.0
South Africa 94.4 2.4 11,911 63.9 10.2 0.705 27.6 57.8 1.4
United States n/a 1.8 63,051 78.9 13.4 0.920 38.3 327.1 0.6
Indonesia 95.4 2.3 12,345 71.5 8.0 0.707 29.7 267.7 1.1
Iraq 43.7 3.7 9,952 70.5 7.3 0.689 21.0 38.4 2.5
Congo, (DRC)
77.0 6.0 978 60.4 6.8 0.459 17.0 84.1 3.2
Syria 86.4 2.8 n/a 71.8 5.1 0.549 25.6 16.9 -0.6
Note: 1. Data is based on the United Nations Development Programme Human Development Report 2019 statistical data tables. Population and population growth rates for Australia are sourced from the Australian Bureau of Statistics April 2020 release of Migration, Australia and Australia’s fertility rate from the December 2019 release of Births, Australia. 2. International Monetary Fund World Economic Outlook database October 2020. Note: GDP = Gross Domestic Product and PPP = Purchasing Power Parity.