
CPI_vs_ IIP
18
SUBMITTED BY: GROUP 6 ASMIT A SINHA POOJA SARAF PRATYUSH SAHU RAJDEEP JAISW AL SUPREET GUPTA TRISHA KAUSHIK
-
Upload
supreet-gupta -
Category
Documents
-
view
230 -
download
0
Transcript of CPI_vs_ IIP

8/12/2019 CPI_vs_ IIP
http://slidepdf.com/reader/full/cpivs-iip 1/18
SUBMITTED BY:
GROUP 6
ASMITA SINHA
POOJA SARAFPRATYUSH SAHU
RAJDEEP JAISWAL
SUPREET GUPTA
TRISHA KAUSHIK

8/12/2019 CPI_vs_ IIP
http://slidepdf.com/reader/full/cpivs-iip 2/18
WHAT IS INFLATION ?In economics, inflation is a persistent increase in thegeneral price level of goods and services inan economy over a period of time. When the generalprice level rises, each unit of currency buys fewergoods and services. Consequently, inflation reflects areduction in the purchasing power per unit of money– a loss of real value in the medium of exchange andunit of account within the economy. A chief measureof price inflation is the inflation rate, the annualizedpercentage change in a general price index over time.

8/12/2019 CPI_vs_ IIP
http://slidepdf.com/reader/full/cpivs-iip 3/18
EFFECTS OF INFLATIONPOSITIVE EFFECTS
Increase in the
opportunity cost ofholding money
Shortages of goods asconsumers
begin hoarding out ofconcern that prices willincrease in the future
NEGATIVE EFFECTS
Ensuring that central
banks can adjust realinterest rates
Encouraging investmentin non-monetary capital
projects
8/12/2019 CPI_vs_ IIP
http://slidepdf.com/reader/full/cpivs-iip 4/18
WHAT IS CONSUMER PRICE INDEX
?? A consumer price index (CPI) measures changes in
the price level of a market basket goods andservices purchased by households.
The annual percentage change in a CPI is used as ameasure of inflation.
It can be used to index the real value of wages, salaries,
pensions for regulating prices and for deflatingmonetary magnitudes to show changes in real values.

8/12/2019 CPI_vs_ IIP
http://slidepdf.com/reader/full/cpivs-iip 5/18
A consumer price index (CPI) in the UnitedStates is defined by the Bureau of Labor
Statistics as "a measure of the average change overtime in the prices paid by urban consumers fora market basket of consumer goods and services.“
The CPI is a statistical estimate constructed usingthe prices of a sample of representative items whose prices are collected periodically

8/12/2019 CPI_vs_ IIP
http://slidepdf.com/reader/full/cpivs-iip 6/18
CURRENT MARKET SCENARIO
Current inflation India (CPI India) – the inflation isbased upon the Indian consumer price index. Theindex is a measure of the average price whichconsumers spend on a market-based "basket" of goods
and services. Inflation based upon the consumer priceindex (CPI) is the main inflation indicator in mostcountries.
We suggest to use the links underneath the currentinflation rate, in case you are interested in moreextensive information on the development of thecurrent or historic inflation in India.
8/12/2019 CPI_vs_ IIP
http://slidepdf.com/reader/full/cpivs-iip 7/18
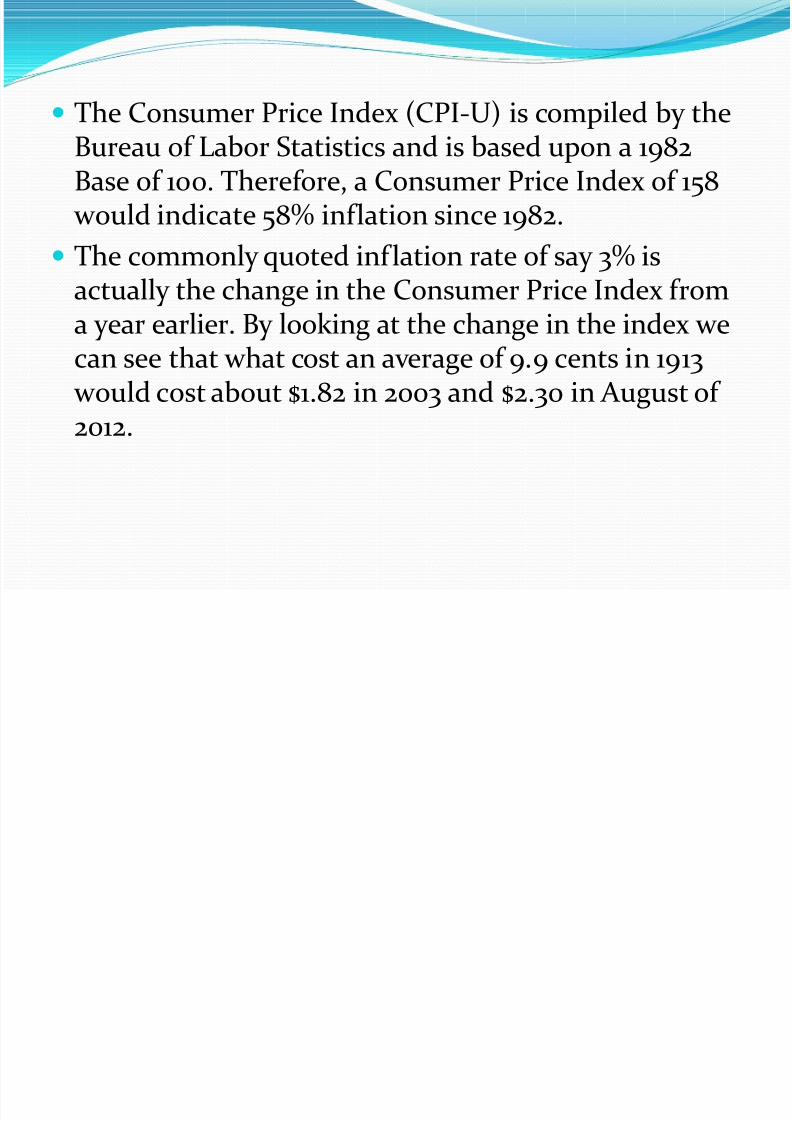
The Consumer Price Index (CPI-U) is compiled by the
Bureau of Labor Statistics and is based upon a 1982Base of 100. Therefore, a Consumer Price Index of 158 would indicate 58% inflation since 1982.
The commonly quoted inf lation rate of say 3% isactually the change in the Consumer Price Index froma year earlier. By looking at the change in the index wecan see that what cost an average of 9.9 cents in 1913 would cost about $1.82 in 2003 and $2.30 in August of2012.

8/12/2019 CPI_vs_ IIP
http://slidepdf.com/reader/full/cpivs-iip 8/18
OBJECTIVES
It is a measure of the cost of living and reflects changesin the general price level.
The CPI uses a basket of consumer goods to give goods
a weighting. Then price surveys find out how much theprices have increased.
The CPI excludes housing costs and so tends to give alower inflation rate than the old method of calculating
inflation Retail Price Index.

8/12/2019 CPI_vs_ IIP
http://slidepdf.com/reader/full/cpivs-iip 9/18
The CPI can be used to report how prices that
households face have changed over time, that is, thepercentage change between different periods for eachclass, subgroup, group, or for the overall CPI.
The CPI is used to help set monetary policy. The PolicyTargets Agreement between the Governor of theReserve Bank and the Minister of Finance.
f

8/12/2019 CPI_vs_ IIP
http://slidepdf.com/reader/full/cpivs-iip 10/18
What Is Index of industrial
production??
Index of Industrial Production (IIP) isan index which details out the growth of varioussectors in an economy, e.g. Indian IIP will focus on
sectors like mining, electricity and manufacturing.Index of Industrial Production (IIP) is an abstractnumber, the magnitude of which represents the statusof production in the industrial sector for a given
period of time as compared to a reference period oftime.

8/12/2019 CPI_vs_ IIP
http://slidepdf.com/reader/full/cpivs-iip 11/18
The all India IIP is a composite indicator thatmeasures the short-term changes in the volume ofproduction of a basket of industrial products during agiven period with respect to that in a chosen baseperiod.
An industrial production index is an index coveringproduction in mining, manufacturing and publicutilities (electricity, gas and water), but excludingconstruction.
The exact coverage, the weighting system and themethods of calculation vary from country to countrybut the divergences are less important than e.g. in thecase of the price and the wage indices.

8/12/2019 CPI_vs_ IIP
http://slidepdf.com/reader/full/cpivs-iip 12/18
CURRENT MARKET SCENARIO
The industry consumes a significant share (aroundone-third) of its own production. The industry has a14% weightage in the overall Index of Industrial
Production (IIP) which gives an indication of itsimportance in the country’s industrial growth. Arobust chemical industry ushers in many economicand strategic benefits for the nation. As on March 31,
2008, the size of the Indian chemical industry wasestimated at around USD 35 bn and 3% of India’s GDP.

8/12/2019 CPI_vs_ IIP
http://slidepdf.com/reader/full/cpivs-iip 13/18
Industrial shipments grow at a 3.0% annual rate overthe first 10 years of the projection and then slow to1.6% annual growth for the rest of the projection. Bulkchemicals and metals-based durables account for
much of the increased growth in industrial shipmentsin AEO2014. Industrial shipments of bulk chemicals, which benefit from an increased supply of natural gasliquids, grow by 3.4% per year from 2012 to 2025in AEO2014, as compared with 1.9% in the AnnualEnergy Outlook 2013

8/12/2019 CPI_vs_ IIP
http://slidepdf.com/reader/full/cpivs-iip 14/18
OBJECTIVESTo provide precise, reliable information, in the
shortest time possible, on the main structural andactivity characteristics of the different sectors thatcomprise the industrial activity of the economy, insuch a way that they may satisfy the national andinternational needs for information on the subject.

8/12/2019 CPI_vs_ IIP
http://slidepdf.com/reader/full/cpivs-iip 15/18
To measure the monthly evolution of theproduction activity of the industrial branches,excluding construction.
To measure the evolution of the prices of theindustrial products sold in the foreign market,and of those originating in the rest of the world.

8/12/2019 CPI_vs_ IIP
http://slidepdf.com/reader/full/cpivs-iip 16/18
COMPARISION
Index of industrial production (IIP) and the consumerprice index (CPI), it appears that a new principle is inplace. If the news is good, announce it during market
hours. If it is bad, wait until the market is closed.The IIP and CPI numbers certainly warranted this
caution. Together, they suggest that even as growth isdecelerating, inflation is actually accelerating.
The recent economic data makes things worse. CPIinflation comes at 11.24% and IIP at -1.8%.

8/12/2019 CPI_vs_ IIP
http://slidepdf.com/reader/full/cpivs-iip 17/18
IIP 1.6 per cent relative to May 2012 which wereanticipating a small positive number, the growth in which slowed to a mere 14.3 per cent during May, stillputting the April-May growth rate at a rather striking50.6 per cent.
CPI reading is the highest so far, expanding the indexby a marginal %, we see CPI averaging 10.5-11.5% forthe remaining part of the year. Only a flat base keeps
inflation around 9%. There is no base effect either.

8/12/2019 CPI_vs_ IIP
http://slidepdf.com/reader/full/cpivs-iip 18/18