AUG 02 DanskeCommodities Daily
9
www.danskeresearch.com Investment Research General Market Conditions Commodities news Overview – Commodities in positive mode this morning despite the Chinese PMI and US Q2 GDP pointing to further slowdown in global growth. Asian stock markets also generally higher on strong earnings. Markets looking ahead to US ISM today and the US employment report this Friday. US – Q2 GDP growth was on the whole somewhat disappointing. While headline Q1 figures were revised higher, Q2 came in below expectations at 2.4% q/q AR. Private consumption was the big disappointment, adding to the view that employment and private consumption are the main weaknesses in the US recovery. China – The July PMI report showed that the economy weakened further in July as the HSBC PMI fell to 49.4 in July from 50.4 in June; this is the weakest level since March 2009. A separate PMI index released by the National Bureau of Statistics on Sunday showed a decline to 51.2 in July from 52.1 in June. Both indices indicate that tightening measures from the government are working to cool the Chinese economy. China’s appetite for commodities remains key to the sector but official data may understate demand, see WSJ: China's Ore Demand Flies Under the Radar . Investor flows - The weekly positioning data from US exchanges showed that investors built up long positions in copper and wheat alike last week; notably, the recent weather-related surge in wheat prices has led speculators to reverse their net stake in the market to now be on average net long the grain. Cross commodities - During most of July, commodities have in general seen consistent price increases, not least over the past two weeks. Corporate earnings have in general surprised on the upside, and Euroland data have in fact turned out on average slightly better than analysts’ forecasts. As a result, risk markets have taken comfort from the fact that if Europe was supposed to be the weakest link in the global recovery, then things may not look too bad. However, as highlighted by Friday’s US GDP report, US growth may already have peaked and thus we cannot rule out that a disappointing US ISM number could spark a sell-off in commodities this afternoon. Manufacturing sentiment and metal prices Source: EcoWin, Danske Markets. 02 August 2010 Today s key points Euroland manufacturing PMIs US ISM manufacturing Commodities Daily Commodities overview Contract Last price %, d/d WTI, NYMEX 1. pos 79.3 1.2 Brent, ICE 1. pos 78. 4 1. 0 Heating Oil, NYMEX 1. pos 209. 3 2.7 Gasoline, NYMEX 1. pos 213. 1 1. 6 Aluminium, LME 3M 2196 4. 9 Copper, LME 3M 7410 2.5 Lead, LME 3M 2108 2. 8 Nickel, LME 3M 21650 4. 7 Zinc, LME 3M 2038 2.4 Steel, LME 3M 500 6. 8 Hot Rol Coil, NYMEX 1. pos 580 0.9 Gold, spot 1182 1. 5 Silver, spot 18 3.2 Wheat, CBOT 1. pos 675.8 7.7 Corn, CBOT 1. pos 397.0 4. 7 Source: Bloomberg, Danske Markets. Commodities Research: Chief Analyst Arne Lohmann Rasmussen +45 4521 8532 [email protected] Senior Analyst Christin Tuxen +45 45137867 [email protected] Commodities Sales: Senior Dealer Martin Vorgod +45 4514 3286 [email protected] Vice President Fredrik Åberg +45 4514 3285 [email protected] Bloomberg: DRFX <GO>
Transcript of AUG 02 DanskeCommodities Daily
8/9/2019 AUG 02 DanskeCommodities Daily
http://slidepdf.com/reader/full/aug-02-danskecommodities-daily 1/8
www.danskeresearch.com
Investment ResearchGeneral Market Conditions
Commodities news
Overview – Commodities in positive mode this morning despite the Chinese PMI and
US Q2 GDP pointing to further slowdown in global growth. Asian stock markets also
generally higher on strong earnings. Markets looking ahead to US ISM today and the
US employment report this Friday.
US – Q2 GDP growth was on the whole somewhat disappointing. While headline Q1
figures were revised higher, Q2 came in below expectations at 2.4% q/q AR. Private
consumption was the big disappointment, adding to the view that employment and
private consumption are the main weaknesses in the US recovery.
China – The July PMI report showed that the economy weakened further in July as
the HSBC PMI fell to 49.4 in July from 50.4 in June; this is the weakest level since
March 2009. A separate PMI index released by the National Bureau of Statistics on
Sunday showed a decline to 51.2 in July from 52.1 in June. Both indices indicate that
tightening measures from the government are working to cool the Chinese economy.
China’s appetite for commodities remains key to the sector but official data may
understate demand, see WSJ: China's Ore Demand Flies Under the Radar .
Investor flows - The weekly positioning data from US exchanges showed that
investors built up long positions in copper and wheat alike last week; notably, the
recent weather-related surge in wheat prices has led speculators to reverse their net
stake in the market to now be on average net long the grain.
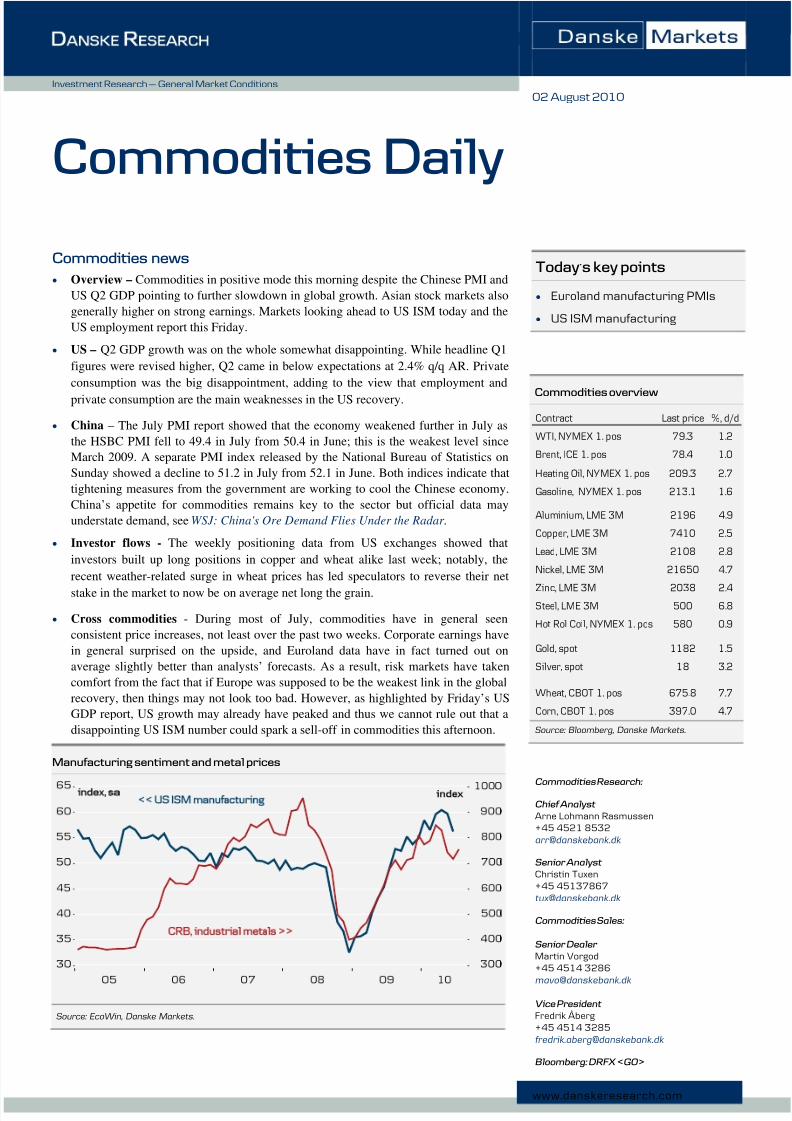
Cross commodities - During most of July, commodities have in general seen
consistent price increases, not least over the past two weeks. Corporate earnings have
in general surprised on the upside, and Euroland data have in fact turned out on
average slightly better than analysts’ forecasts. As a result, risk markets have taken
comfort from the fact that if Europe was supposed to be the weakest link in the global
recovery, then things may not look too bad. However, as highlighted by Friday’s US
GDP report, US growth may already have peaked and thus we cannot rule out that a
disappointing US ISM number could spark a sell-off in commodities this afternoon.
Manufacturing sentiment and metal prices
Source: EcoWin, Danske Markets.
02 August 2010
Todays key points
Euroland manufacturing PMIs
US ISM manufacturing
Commodities Daily
Commodities overview
Contract Last price %, d/d
WTI, NYMEX 1. pos 79.3 1.2
Brent, ICE 1. pos 78.4 1.0
Heating Oil, NYMEX 1. pos 209.3 2.7
Gasoline, NYMEX 1. pos 213.1 1.6
Aluminium, LME 3M 2196 4.9
Copper, LME 3M 7410 2.5
Lead, LME 3M 2108 2.8
Nickel, LME 3M 21650 4.7
Zinc, LME 3M 2038 2.4Steel, LME 3M 500 6.8
Hot Rol Coil, NYMEX 1. pos 580 0.9
Gold, spot 1182 1.5
Silver, spot 18 3.2
Wheat, CBOT 1. pos 675.8 7.7
Corn, CBOT 1. pos 397.0 4.7
Source: Bloomberg, Danske Markets.
Commodities Research:
Chief Analyst
Arne Lohmann Rasmussen+45 4521 [email protected]
Senior Analyst
Christin Tuxen+45 [email protected]
Commodities Sales:
Senior Dealer
Martin Vorgod+45 4514 3286
Vice President
Fredrik Åberg+45 4514 [email protected]
Bloomberg: DRFX <GO>
8/9/2019 AUG 02 DanskeCommodities Daily
http://slidepdf.com/reader/full/aug-02-danskecommodities-daily 2/8
2 | www.danskeresearch.com
Commodities Daily
Commodity-price movements
This year
Last price %, today Close %, d/d Price %, m/m Price %, y/y %, YTD
Energy (1. pos):
NYMEX WTI ($/bbl) 79.3 0.4 79.0 0.8 72.1 9.9 69.4 14.2 -0.1
ICE Brent ($/bbl) 78.4 0.3 78.2 0.8 71.7 9.4 71.7 9.3 0.6
NYMEX Heating Oil ($/gallon) 209.3 0.2 208.8 2.5 191.5 9.3 179.4 16.7 -1.2
NYMEX RBOB Gasoline ($/gallon) 213.1 0.4 212.2 1.2 197.8 7.8 204.5 4.2 3.8
ICE Gasoil ($/ton) 658.3 1.5 648.3 -0.3 613.8 7.3 570.5 15.4 3.6
ICE NWE Jet Fuel, CIF ($/ton) 719.9 1.0 712.7 0.9 666.9 8.0 629.5 14.4 2.8
TTF NL Natural Gas ( /mwh) 18.0 1.1 17.8 3.1 20.2 -10.7 9.7 86.8 40.2
Henry Hub Natural Gas ($/MMBtu) 5.0 1.1 4.9 2.0 4.7 6.2 3.7 36.3 -10.7
Nordpool electricity ( /mwh) 43.0 -1.1 43.4 0.0 46.8 -8.1 - - -
Fuel oil, 1%, FOB NWE ($/ton) 459.0 -0.8 462.5 - 446.5 3.8 301.3 53.8 81.3
Fuel oil, 3.5%, FOB ARA ($/ton) 433.0 -0.5 435.0 - 433.0 3.7 227.0 97.8 98.2
API2 steam coal, CIF ARA ($/ton) 93.9 0.2 93.7 1.6 96.5 -2.8 68.0 38.0 12.8
ICE ECX Carbon Emission ( /tn) 14.1 -0.3 14.2 0.9 15.4 -8.1 14.1 -0.1 12.6
Base metals:
Aluminium, LME 3M, $/ton 2196 1.0 2175 3.9 1937 13.4 1890 16.2 -1.5
Copper, LME 3M, $/ton 7410 1.6 7297 0.9 6410 15.6 5719 29.6 0.5
Lead, LME 3M, $/ton 2108 1.5 2078 1.3 1753 20.2 1879 12.2 -13.3
Nickel, LME 3M, $/ton 21650 2.4 21150 2.3 18800 15.2 17950 20.6 16.9
Zinc, LME 3M, $/ton 2038 0.6 2025 1.8 1780 14.5 1750 16.5 -20.4
Steel, LME 3M, $/ton 500 4.6 478 2.1 430 16.2 390 28.1 22.0
Hot Rolled Coil, NYMEX, 1. pos, $/ton 580 -0.9 585 1.7 615 -5.7 480 20.8 5.5
Precious Metals (spot, $/t oz.):
Gold 1182 0.1 1180 1.3 1209.4 -2.3 951.7 24.2 7.6
Silver 18 0.1 18 3.2 17.7 2.1 14.0 29.8 7.0
Agriculturals (1. pos):
CBOT Wheat ($/bu.) 675.8 2.2 661.5 5.4 487.8 38.5 528.3 27.9 24.8
Matif Mill Wheat ( /ton) 186.0 4.1 178.8 -0.8 136.5 36.3 127.0 46.5 41.7
CBOT Corn ($/bu.) 397.0 1.1 392.8 3.6 364.0 9.1 339.5 16.9 -4.2
CBOT Soybeans ($/bu.) 1063.3 1.0 1052.5 2.5 962.8 10.4 1134.0 -6.2 2.3
NYBOT Sugar ($/lb.) 19.6 0.4 19.5 3.3 18.0 8.5 18.8 4.4 -27.4
Commo dity indices (total return):
DJ-UBS 270 1.8 265 1.5 249 8.3 254 6.3 -3.5
S&P GSCI 4253 1.2 4201 1.7 3905 8.9 4276 -0.5 -6.2
Reuters CRB 274 1.5 270 1.5 254 7.8 257 6.7 -3.1
Rogers commodity index 3207 0.7 3184 1.7 2898 10.7 2976 7.8 -2.0
DJ-AIG 134 1.8 132 1.5 124 8.3 126 6.1 -3.5
S&P GSCI Energy 932 0.8 925 1.9 901 3.5 952 -2.1 -8.3S&P GSCI Industrial Metals 1627 2.1 1594 1.1 1463 11.2 1373 18.5 -4.7
S&P GSCI Precious Metals 1527 1.2 1508 0.8 1609 -5.1 1211 26.1 7.2
S&P GSCI Agriculture 593 3.1 575 1.7 504 17.7 556 6.7 -3.7
Yesterday Month ago Year ago02.08.2010
Source: Bloomberg, Danske Markets.

8/9/2019 AUG 02 DanskeCommodities Daily
http://slidepdf.com/reader/full/aug-02-danskecommodities-daily 3/8
3 | www.danskeresearch.com
Commodities Daily
Energy
Oil prices US crude oil stocks, EIA
Source: EcoWin, Danske Markets. Source: EcoWin, Danske Markets.
Jet fuel and gasoil crack spreads Gasoline crack spread, RBOB, NYMEX 1. Pos
Source: EcoWin, Danske Markets. Source: EcoWin, Danske Markets.
WTI (NYMEX) forward curve Brent (ICE) curve
Source: EcoWin, Danske Markets. Source: EcoWin, Danske Markets.
8/9/2019 AUG 02 DanskeCommodities Daily
http://slidepdf.com/reader/full/aug-02-danskecommodities-daily 4/8
4 | www.danskeresearch.com
Commodities Daily
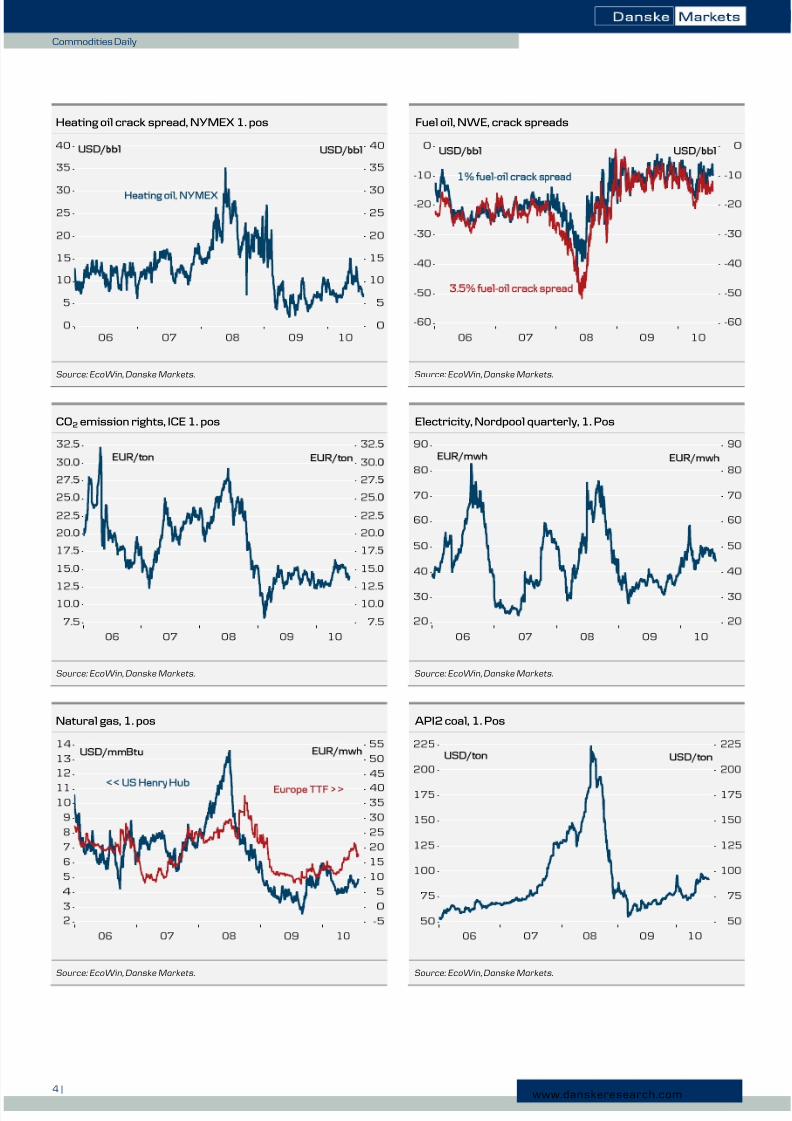
Heating oil crack spread, NYMEX 1. pos Fuel oil, NWE, crack spreads
Source: EcoWin, Danske Markets. Source: EcoWin, Danske Markets.
CO2 emission rights, ICE 1. pos Electricity, Nordpool quarterly, 1. Pos
Source: EcoWin, Danske Markets. Source: EcoWin, Danske Markets.
Natural gas, 1. pos API2 coal, 1. Pos
Source: EcoWin, Danske Markets. Source: EcoWin, Danske Markets.

8/9/2019 AUG 02 DanskeCommodities Daily
http://slidepdf.com/reader/full/aug-02-danskecommodities-daily 5/8
5 | www.danskeresearch.com
Commodities Daily
Metals
Aluminium Aluminium forward curve
Source: EcoWin, Danske Markets. Source: EcoWin, Danske Markets.
Copper Copper forward curve
Source: EcoWin, Danske Markets. Source: EcoWin, Danske Markets.
Nickel Nickel forward curve
Source: EcoWin, Danske Markets. Source: EcoWin, Danske Markets.

8/9/2019 AUG 02 DanskeCommodities Daily
http://slidepdf.com/reader/full/aug-02-danskecommodities-daily 6/8
6 | www.danskeresearch.com
Commodities Daily
Zinc Zinc forward curve
Source: EcoWin, Danske Markets. Source: EcoWin, Danske Markets.
Copper SHFE-LME spread Steel
Source: EcoWin, Danske Markets. Source: EcoWin, Danske Markets.
Gold and silver Gold forward curve
Source: EcoWin, Danske Markets. Source: EcoWin, Danske Markets.

8/9/2019 AUG 02 DanskeCommodities Daily
http://slidepdf.com/reader/full/aug-02-danskecommodities-daily 7/8
7 | www.danskeresearch.com
Commodities Daily
Grains
Wheat Milling wheat forward curve, NYSE LIffe
Source: EcoWin, Danske Markets. Source: EcoWin, Danske Markets.
Corn, CBOT 1. pos Corn forward curve, CBOT
Source: EcoWin, Danske Markets. Source: EcoWin, Danske Markets.
Soybeans, CBOT 1. pos Soybeans forward curve, CBOT
Source: EcoWin, Danske Markets. Source: EcoWin, Danske Markets.
8/9/2019 AUG 02 DanskeCommodities Daily
http://slidepdf.com/reader/full/aug-02-danskecommodities-daily 8/8
8 |
Commodities Daily
DisclosureThis research report has been prepared by Danske Research, which is part of Danske Markets, a division of
Danske Bank. Danske Bank is under supervision by the Danish Financial Supervisory Authority.
Danske Bank has established procedures to prevent conflicts of interest and to ensure the provision of high
quality research based on research objectivity and independence. These procedures are documented in the DanskeBank Research Policy. Employees within the Danske Bank Research Departments have been instructed that any
request that might impair the objectivity and independence of research shall be referred to Research Management
and to the Compliance Officer. Danske Bank Research departments are organised independently from and do not
report to other Danske Bank business areas. Research analysts are remunerated in part based on the over-all
profitability of Danske Bank, which includes investment banking revenues, but do not receive bonuses or other
remuneration linked to specific corporate finance or debt capital transactions.
Danske Bank research reports are prepared in accordance with the Danish Society of Investment Professionals’
Ethical rules and the Recommendations of the Danish Securities Dealers Association.
Financial models and/or methodology used in this research report
Calculations and presentations in this research report are based on standard econometric tools and methodology
as well as publicly available statistics for each individual security, issuer and/or country. Documentation can be
obtained from the authors upon request.
Risk warning
Major risks connected with recommendations or opinions in this research report, including as sensitivity analysis
of relevant assumptions, are stated throughout the text.
First date of publication
Please see the front page of this research report for the first date of publication. Price-related data is calculated
using the closing price from the day before publication.
DisclaimerThis publication has been prepared by Danske Markets for information purposes only. It has been prepared
independently, solely from publicly available information and does not take into account the views of Danske
Bank’s internal credit department. It is not an offer or solicitation of any offer to purchase or sell any financial
instrument. Whilst reasonable care has been taken to ensure that its contents are not untrue or misleading, no
representation is made as to its accuracy or completeness and no liability is accepted for any loss arising from
reliance on it. Danske Bank, its affiliates or staff may perform services for, solicit business from, hold long or
short positions in, or otherwise be interested in the investments (including derivatives), of any issuer mentioned
herein. The Equity and Corporate Bonds analysts are not permitted to invest in securities under coverage in their
research sector. This publication is not intended for retail customers in the UK or any person in the US. Danske
Markets is a division of Danske Bank A/S. Danske Bank A/S is authorized by the Danish Financial Supervisory
Authority and is subject to provisions of relevant regulators in all other jurisdictions where Danske Bank A/S
conducts operations. Moreover Danske Bank A/S is subject to limited regulation by the Financial Services
Authority (UK). Details on the extent of our regulation by the Financial Services Authority are available from us
on request. Copyright (C) Danske Bank A/S. All rights reserved. This publication is protected by copyright and
may not be reproduced in whole or in part without permission.
This publication has been prepared by the correspondent of Auerbach Grayson & Company Incorporated
(“AGC”) named above on the date listed above.
We are distributing this publication in the U.S. and any U.S. person receiving this report and wishing to effect
transactions in any security discussed herein, should do so only with a representative of Auerbach Grayson &
Company Incorporated. Additional information on recommended securities is available on request.