![AEIS 2010-11 [Our School District]](https://static.fdocuments.us/doc/165x107/56813096550346895d967300/aeis-2010-11-our-school-district.jpg)
Appendix K SIDRA Summary - eisdocs.dsdip.qld.gov.aueisdocs.dsdip.qld.gov.au/New Acland Coal Mine...
57
Appendix K SIDRA Summary
Transcript of Appendix K SIDRA Summary - eisdocs.dsdip.qld.gov.aueisdocs.dsdip.qld.gov.au/New Acland Coal Mine...

Appendix KSIDRA Summary

New Acland Coal Mine Stage 3 Project AEIS SIDRA summary results
(12/06/2014 9:49:15 AM)
Table S14 from Sidra Output Tables Intersection ID: 1 Give-Way Sign Controlled Intersection -------------------------------------------------------------------------- Lane Demand Flow (veh/h) Adj. Eff Grn Deg Aver. Longest Shrt No. -------------------- %HV Basic (sec) Sat Delay Queue Lane L T R Tot Satf. 1st 2nd x sec m m -------------------------------------------------------------------------- SouthEast: West Duke St 1 L 20 20 21 0.022 11.5 1 50 2 R 6 6 0 0.017 17.3 0 50 ------------------------------------------------------------------ 20 0 6 26 16 0.022 12.9 1 -------------------------------------------------------------------------- East: Warrego Hwy (East) 1 L 4 4 0 0.002 11.0 0 80 2 T 238 238 19 0.137 0.0 0 500 ------------------------------------------------------------------ 4 238 0 242 18 0.137 0.2 -------------------------------------------------------------------------- West: Warrego Hwy (West) 1 TR 252 9 261 21 0.157 1.8 9 500 ------------------------------------------------------------------ 0 252 9 261 21 0.157 1.8 9 ========================================================================== ALL VEHICLES Total % Max Aver. Max Flow HV X Delay Queue 529 20 0.157 1.6 9 ========================================================================== Peak flow period = 30 minutes. Queue values in this table are 95% queue (metres) Note: Basic Saturation Flows are not adjusted at roundabouts or sign- controlled intersections and apply only to continuous lanes.
Geometry
Warrego Highway / West Duke Street AM Peak
Base Case (2014)
Demand flows
Average delay Queue distance (m)
Degree of saturation

New Acland Coal Mine Stage 3 Project AEIS SIDRA summary results
(12/06/2014 9:49:15 AM)
Table S14 from Sidra Output Tables Intersection ID: 1 Give-Way Sign Controlled Intersection -------------------------------------------------------------------------- Lane Demand Flow (veh/h) Adj. Eff Grn Deg Aver. Longest Shrt No. -------------------- %HV Basic (sec) Sat Delay Queue Lane L T R Tot Satf. 1st 2nd x sec m m -------------------------------------------------------------------------- SouthEast: West Duke St 1 L 21 21 21 0.024 11.6 1 50 2 R 6 6 0 0.019 18.4 0 50 ------------------------------------------------------------------ 21 0 6 27 16 0.024 13.2 1 -------------------------------------------------------------------------- East: Warrego Hwy (East) 1 L 4 4 0 0.002 11.0 0 80 2 T 256 256 19 0.147 0.0 0 500 ------------------------------------------------------------------ 4 256 0 260 18 0.147 0.2 -------------------------------------------------------------------------- West: Warrego Hwy (West) 1 TR 279 11 289 21 0.173 2.0 11 500 ------------------------------------------------------------------ 0 279 11 289 21 0.173 2.0 11 ========================================================================== ALL VEHICLES Total % Max Aver. Max Flow HV X Delay Queue 577 19 0.173 1.7 11 ========================================================================== Peak flow period = 30 minutes. Queue values in this table are 95% queue (metres) Note: Basic Saturation Flows are not adjusted at roundabouts or sign- controlled intersections and apply only to continuous lanes.
Geometry
Warrego Highway / West Duke Street AM Peak
Peak Construction Phase (2016)
Demand flows
Average delay Queue distance (m)
Degree of saturation
New Acland Coal Mine Stage 3 Project AEIS SIDRA summary results
(12/06/2014 9:49:15 AM)
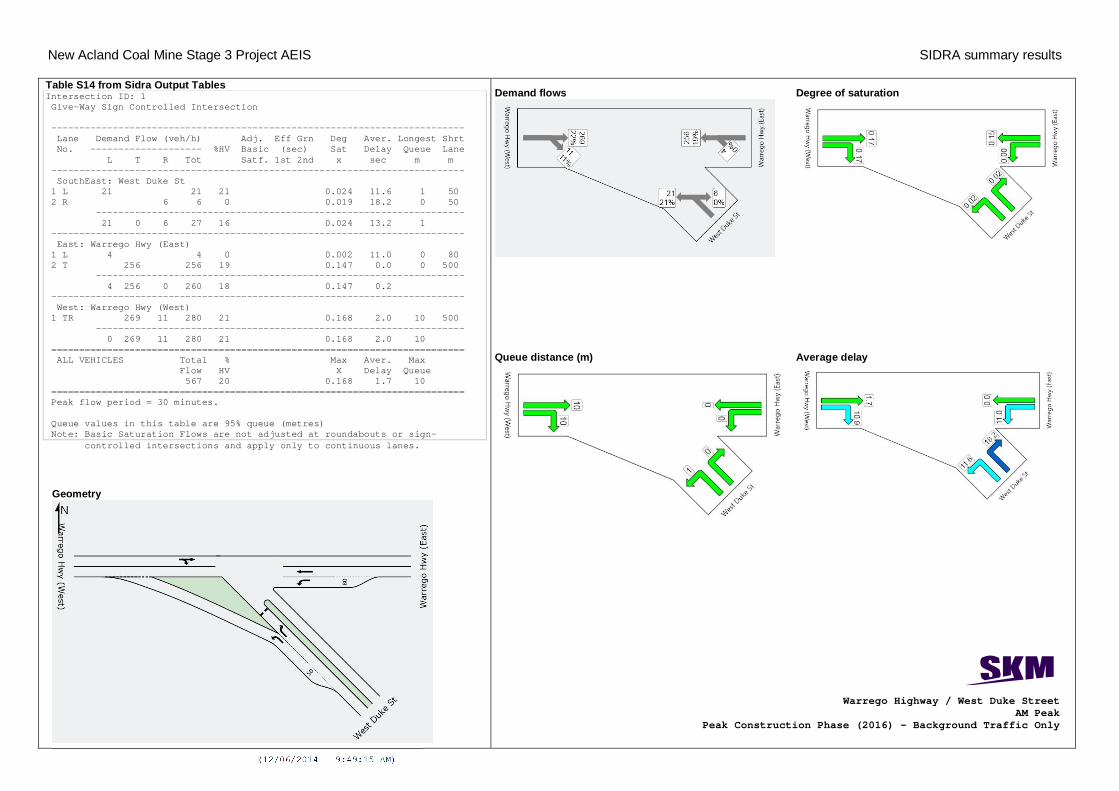
Table S14 from Sidra Output Tables Intersection ID: 1 Give-Way Sign Controlled Intersection -------------------------------------------------------------------------- Lane Demand Flow (veh/h) Adj. Eff Grn Deg Aver. Longest Shrt No. -------------------- %HV Basic (sec) Sat Delay Queue Lane L T R Tot Satf. 1st 2nd x sec m m -------------------------------------------------------------------------- SouthEast: West Duke St 1 L 21 21 21 0.024 11.6 1 50 2 R 6 6 0 0.019 18.2 0 50 ------------------------------------------------------------------ 21 0 6 27 16 0.024 13.2 1 -------------------------------------------------------------------------- East: Warrego Hwy (East) 1 L 4 4 0 0.002 11.0 0 80 2 T 256 256 19 0.147 0.0 0 500 ------------------------------------------------------------------ 4 256 0 260 18 0.147 0.2 -------------------------------------------------------------------------- West: Warrego Hwy (West) 1 TR 269 11 280 21 0.168 2.0 10 500 ------------------------------------------------------------------ 0 269 11 280 21 0.168 2.0 10 ========================================================================== ALL VEHICLES Total % Max Aver. Max Flow HV X Delay Queue 567 20 0.168 1.7 10 ========================================================================== Peak flow period = 30 minutes. Queue values in this table are 95% queue (metres) Note: Basic Saturation Flows are not adjusted at roundabouts or sign- controlled intersections and apply only to continuous lanes.
Geometry
Warrego Highway / West Duke Street AM Peak
Peak Construction Phase (2016) – Background Traffic Only
Demand flows
Average delay Queue distance (m)
Degree of saturation

New Acland Coal Mine Stage 3 Project AEIS SIDRA summary results
(12/06/2014 9:49:15 AM)
Table S14 from Sidra Output Tables Intersection ID: 1 Give-Way Sign Controlled Intersection -------------------------------------------------------------------------- Lane Demand Flow (veh/h) Adj. Eff Grn Deg Aver. Longest Shrt No. -------------------- %HV Basic (sec) Sat Delay Queue Lane L T R Tot Satf. 1st 2nd x sec m m -------------------------------------------------------------------------- SouthEast: West Duke St 1 L 22 22 21 0.026 11.7 1 50 2 R 7 7 0 0.023 18.9 1 50 ------------------------------------------------------------------ 22 0 7 29 16 0.026 13.5 1 -------------------------------------------------------------------------- East: Warrego Hwy (East) 1 L 4 4 0 0.002 11.0 0 80 2 T 268 268 18 0.154 0.0 0 500 ------------------------------------------------------------------ 4 268 0 273 18 0.154 0.2 -------------------------------------------------------------------------- West: Warrego Hwy (West) 1 TR 283 11 294 21 0.176 2.1 11 500 ------------------------------------------------------------------ 0 283 11 294 21 0.176 2.1 11 ========================================================================== ALL VEHICLES Total % Max Aver. Max Flow HV X Delay Queue 596 19 0.176 1.8 11 ========================================================================== Peak flow period = 30 minutes. Queue values in this table are 95% queue (metres) Note: Basic Saturation Flows are not adjusted at roundabouts or sign- controlled intersections and apply only to continuous lanes.
Geometry
Warrego Highway / West Duke Street AM Peak
Peak Operation Phase (2017)
Demand flows
Average delay Queue distance (m)
Degree of saturation

New Acland Coal Mine Stage 3 Project AEIS SIDRA summary results
(12/06/2014 9:49:15 AM)
Table S14 from Sidra Output Tables Intersection ID: 1 Give-Way Sign Controlled Intersection -------------------------------------------------------------------------- Lane Demand Flow (veh/h) Adj. Eff Grn Deg Aver. Longest Shrt No. -------------------- %HV Basic (sec) Sat Delay Queue Lane L T R Tot Satf. 1st 2nd x sec m m -------------------------------------------------------------------------- SouthEast: West Duke St 1 L 22 22 21 0.025 11.7 1 50 2 R 7 7 0 0.023 18.7 1 50 ------------------------------------------------------------------ 22 0 7 29 16 0.025 13.5 1 -------------------------------------------------------------------------- East: Warrego Hwy (East) 1 L 4 4 0 0.002 11.0 0 80 2 T 264 264 19 0.152 0.0 0 500 ------------------------------------------------------------------ 4 264 0 268 18 0.152 0.2 -------------------------------------------------------------------------- West: Warrego Hwy (West) 1 TR 279 11 289 21 0.174 2.1 11 500 ------------------------------------------------------------------ 0 279 11 289 21 0.174 2.1 11 ========================================================================== ALL VEHICLES Total % Max Aver. Max Flow HV X Delay Queue 587 20 0.174 1.8 11 ========================================================================== Peak flow period = 30 minutes. Queue values in this table are 95% queue (metres) Note: Basic Saturation Flows are not adjusted at roundabouts or sign- controlled intersections and apply only to continuous lanes.
Geometry
Warrego Highway / West Duke Street AM Peak
Peak Operation Phase (2017) – Background Traffic Only
Demand flows
Average delay Queue distance (m)
Degree of saturation
New Acland Coal Mine Stage 3 Project AEIS SIDRA summary results
(12/06/2014 9:49:15 AM)
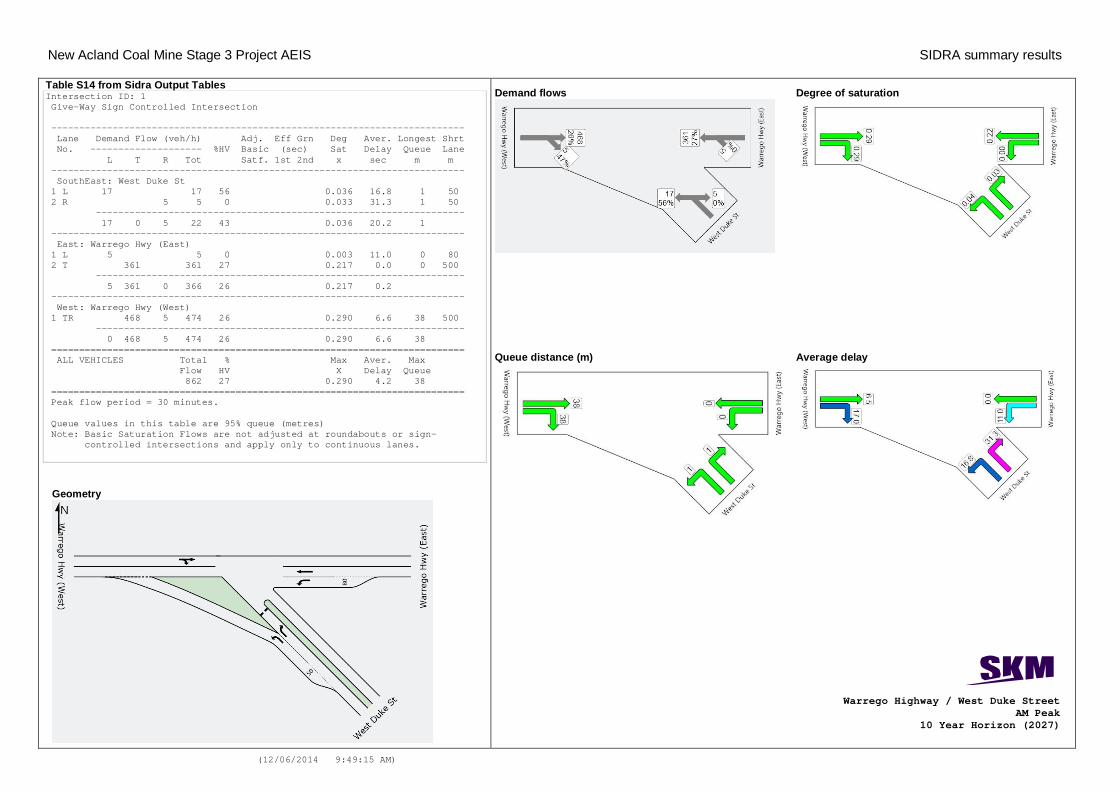
Table S14 from Sidra Output Tables Intersection ID: 1 Give-Way Sign Controlled Intersection -------------------------------------------------------------------------- Lane Demand Flow (veh/h) Adj. Eff Grn Deg Aver. Longest Shrt No. -------------------- %HV Basic (sec) Sat Delay Queue Lane L T R Tot Satf. 1st 2nd x sec m m -------------------------------------------------------------------------- SouthEast: West Duke St 1 L 17 17 56 0.036 16.8 1 50 2 R 5 5 0 0.033 31.3 1 50 ------------------------------------------------------------------ 17 0 5 22 43 0.036 20.2 1 -------------------------------------------------------------------------- East: Warrego Hwy (East) 1 L 5 5 0 0.003 11.0 0 80 2 T 361 361 27 0.217 0.0 0 500 ------------------------------------------------------------------ 5 361 0 366 26 0.217 0.2 -------------------------------------------------------------------------- West: Warrego Hwy (West) 1 TR 468 5 474 26 0.290 6.6 38 500 ------------------------------------------------------------------ 0 468 5 474 26 0.290 6.6 38 ========================================================================== ALL VEHICLES Total % Max Aver. Max Flow HV X Delay Queue 862 27 0.290 4.2 38 ========================================================================== Peak flow period = 30 minutes. Queue values in this table are 95% queue (metres) Note: Basic Saturation Flows are not adjusted at roundabouts or sign- controlled intersections and apply only to continuous lanes.
Geometry
Warrego Highway / West Duke Street AM Peak
10 Year Horizon (2027)
Demand flows
Average delay Queue distance (m)
Degree of saturation

New Acland Coal Mine Stage 3 Project AEIS SIDRA summary results
(12/06/2014 9:49:15 AM)
Table S14 from Sidra Output Tables Intersection ID: 1 Give-Way Sign Controlled Intersection -------------------------------------------------------------------------- Lane Demand Flow (veh/h) Adj. Eff Grn Deg Aver. Longest Shrt No. -------------------- %HV Basic (sec) Sat Delay Queue Lane L T R Tot Satf. 1st 2nd x sec m m -------------------------------------------------------------------------- SouthEast: West Duke St 1 L 17 17 56 0.036 16.8 1 50 2 R 5 5 0 0.033 31.2 1 50 ------------------------------------------------------------------ 17 0 5 22 43 0.036 20.2 1 -------------------------------------------------------------------------- East: Warrego Hwy (East) 1 L 5 5 0 0.003 11.0 0 80 2 T 361 361 27 0.218 0.0 0 500 ------------------------------------------------------------------ 5 361 0 366 27 0.218 0.2 -------------------------------------------------------------------------- West: Warrego Hwy (West) 1 TR 464 5 469 26 0.288 6.7 37 500 ------------------------------------------------------------------ 0 464 5 469 26 0.288 6.7 37 ========================================================================== ALL VEHICLES Total % Max Aver. Max Flow HV X Delay Queue 858 27 0.288 4.2 37 ========================================================================== Peak flow period = 30 minutes. Queue values in this table are 95% queue (metres) Note: Basic Saturation Flows are not adjusted at roundabouts or sign- controlled intersections and apply only to continuous lanes.
Geometry
Warrego Highway / West Duke Street AM Peak
10 Year Horizon (2027) – Background Traffic Only
Demand flows
Average delay Queue distance (m)
Degree of saturation
New Acland Coal Mine Stage 3 Project AEIS SIDRA summary results
(12/06/2014 9:49:15 AM)
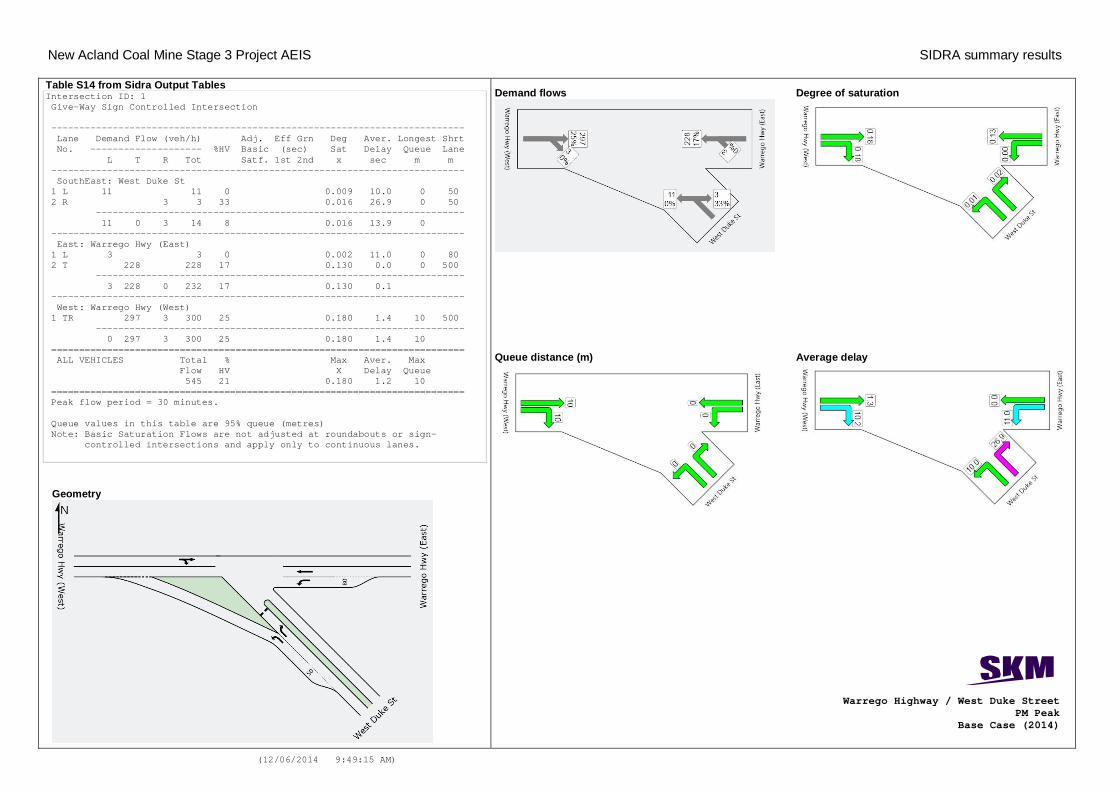
Table S14 from Sidra Output Tables Intersection ID: 1 Give-Way Sign Controlled Intersection -------------------------------------------------------------------------- Lane Demand Flow (veh/h) Adj. Eff Grn Deg Aver. Longest Shrt No. -------------------- %HV Basic (sec) Sat Delay Queue Lane L T R Tot Satf. 1st 2nd x sec m m -------------------------------------------------------------------------- SouthEast: West Duke St 1 L 11 11 0 0.009 10.0 0 50 2 R 3 3 33 0.016 26.9 0 50 ------------------------------------------------------------------ 11 0 3 14 8 0.016 13.9 0 -------------------------------------------------------------------------- East: Warrego Hwy (East) 1 L 3 3 0 0.002 11.0 0 80 2 T 228 228 17 0.130 0.0 0 500 ------------------------------------------------------------------ 3 228 0 232 17 0.130 0.1 -------------------------------------------------------------------------- West: Warrego Hwy (West) 1 TR 297 3 300 25 0.180 1.4 10 500 ------------------------------------------------------------------ 0 297 3 300 25 0.180 1.4 10 ========================================================================== ALL VEHICLES Total % Max Aver. Max Flow HV X Delay Queue 545 21 0.180 1.2 10 ========================================================================== Peak flow period = 30 minutes. Queue values in this table are 95% queue (metres) Note: Basic Saturation Flows are not adjusted at roundabouts or sign- controlled intersections and apply only to continuous lanes.
Geometry
Warrego Highway / West Duke Street PM Peak
Base Case (2014)
Demand flows
Average delay Queue distance (m)
Degree of saturation
New Acland Coal Mine Stage 3 Project AEIS SIDRA summary results
(12/06/2014 9:49:15 AM)
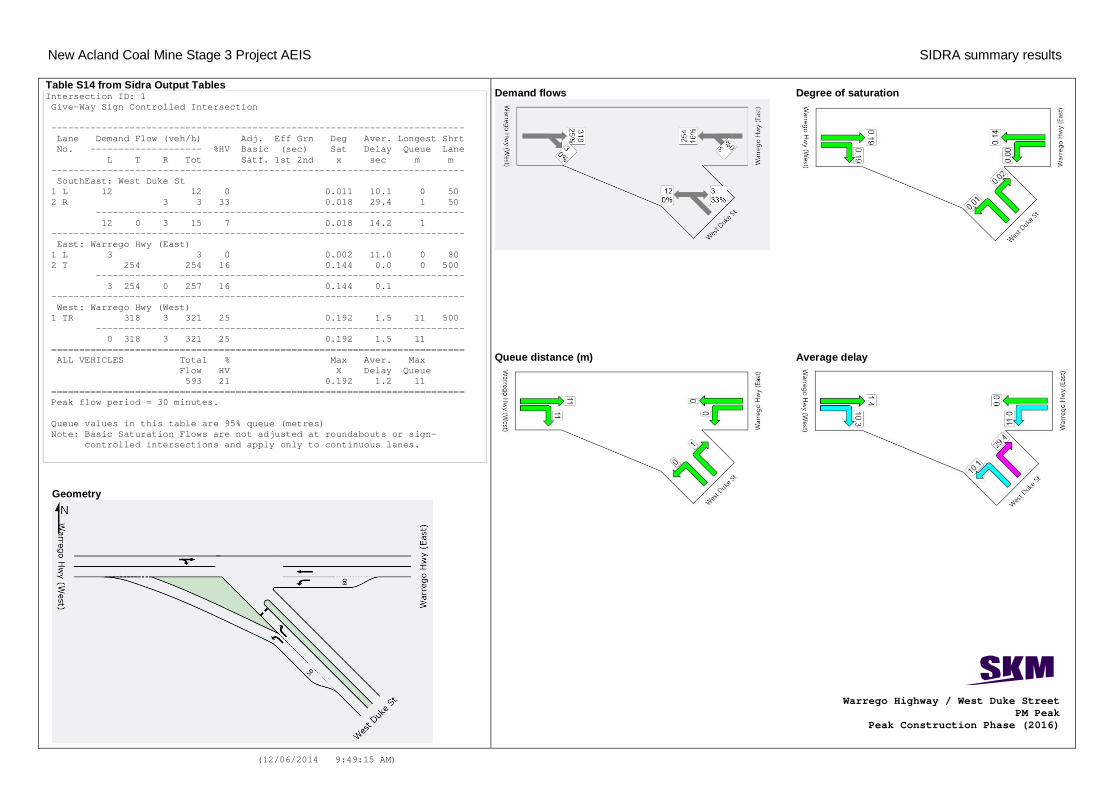
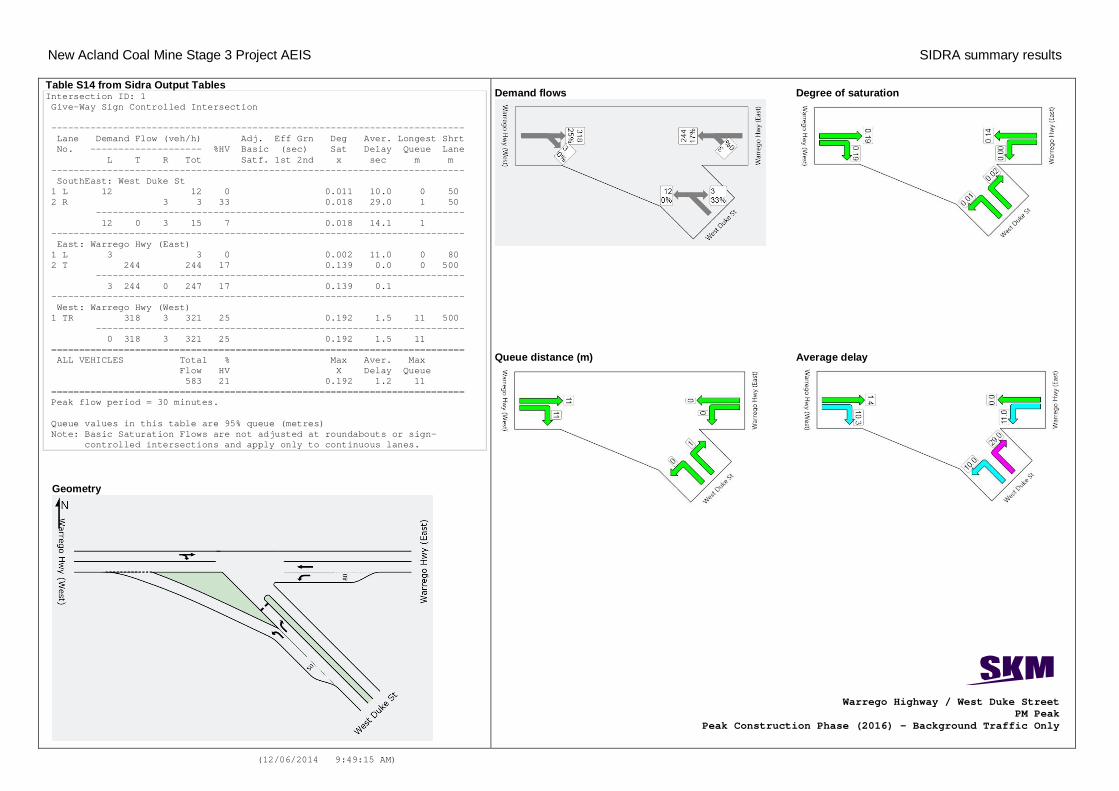
Table S14 from Sidra Output Tables Intersection ID: 1 Give-Way Sign Controlled Intersection -------------------------------------------------------------------------- Lane Demand Flow (veh/h) Adj. Eff Grn Deg Aver. Longest Shrt No. -------------------- %HV Basic (sec) Sat Delay Queue Lane L T R Tot Satf. 1st 2nd x sec m m -------------------------------------------------------------------------- SouthEast: West Duke St 1 L 12 12 0 0.011 10.1 0 50 2 R 3 3 33 0.018 29.4 1 50 ------------------------------------------------------------------ 12 0 3 15 7 0.018 14.2 1 -------------------------------------------------------------------------- East: Warrego Hwy (East) 1 L 3 3 0 0.002 11.0 0 80 2 T 254 254 16 0.144 0.0 0 500 ------------------------------------------------------------------ 3 254 0 257 16 0.144 0.1 -------------------------------------------------------------------------- West: Warrego Hwy (West) 1 TR 318 3 321 25 0.192 1.5 11 500 ------------------------------------------------------------------ 0 318 3 321 25 0.192 1.5 11 ========================================================================== ALL VEHICLES Total % Max Aver. Max Flow HV X Delay Queue 593 21 0.192 1.2 11 ========================================================================== Peak flow period = 30 minutes. Queue values in this table are 95% queue (metres) Note: Basic Saturation Flows are not adjusted at roundabouts or sign- controlled intersections and apply only to continuous lanes.
Geometry
Warrego Highway / West Duke Street PM Peak
Peak Construction Phase (2016)
Demand flows
Average delay Queue distance (m)
Degree of saturation
New Acland Coal Mine Stage 3 Project AEIS SIDRA summary results
(12/06/2014 9:49:15 AM)
Table S14 from Sidra Output Tables Intersection ID: 1 Give-Way Sign Controlled Intersection -------------------------------------------------------------------------- Lane Demand Flow (veh/h) Adj. Eff Grn Deg Aver. Longest Shrt No. -------------------- %HV Basic (sec) Sat Delay Queue Lane L T R Tot Satf. 1st 2nd x sec m m -------------------------------------------------------------------------- SouthEast: West Duke St 1 L 12 12 0 0.011 10.0 0 50 2 R 3 3 33 0.018 29.0 1 50 ------------------------------------------------------------------ 12 0 3 15 7 0.018 14.1 1 -------------------------------------------------------------------------- East: Warrego Hwy (East) 1 L 3 3 0 0.002 11.0 0 80 2 T 244 244 17 0.139 0.0 0 500 ------------------------------------------------------------------ 3 244 0 247 17 0.139 0.1 -------------------------------------------------------------------------- West: Warrego Hwy (West) 1 TR 318 3 321 25 0.192 1.5 11 500 ------------------------------------------------------------------ 0 318 3 321 25 0.192 1.5 11 ========================================================================== ALL VEHICLES Total % Max Aver. Max Flow HV X Delay Queue 583 21 0.192 1.2 11 ========================================================================== Peak flow period = 30 minutes. Queue values in this table are 95% queue (metres) Note: Basic Saturation Flows are not adjusted at roundabouts or sign- controlled intersections and apply only to continuous lanes.
Geometry
Warrego Highway / West Duke Street PM Peak
Peak Construction Phase (2016) – Background Traffic Only
Demand flows
Average delay Queue distance (m)
Degree of saturation
New Acland Coal Mine Stage 3 Project AEIS SIDRA summary results
(12/06/2014 9:49:15 AM)
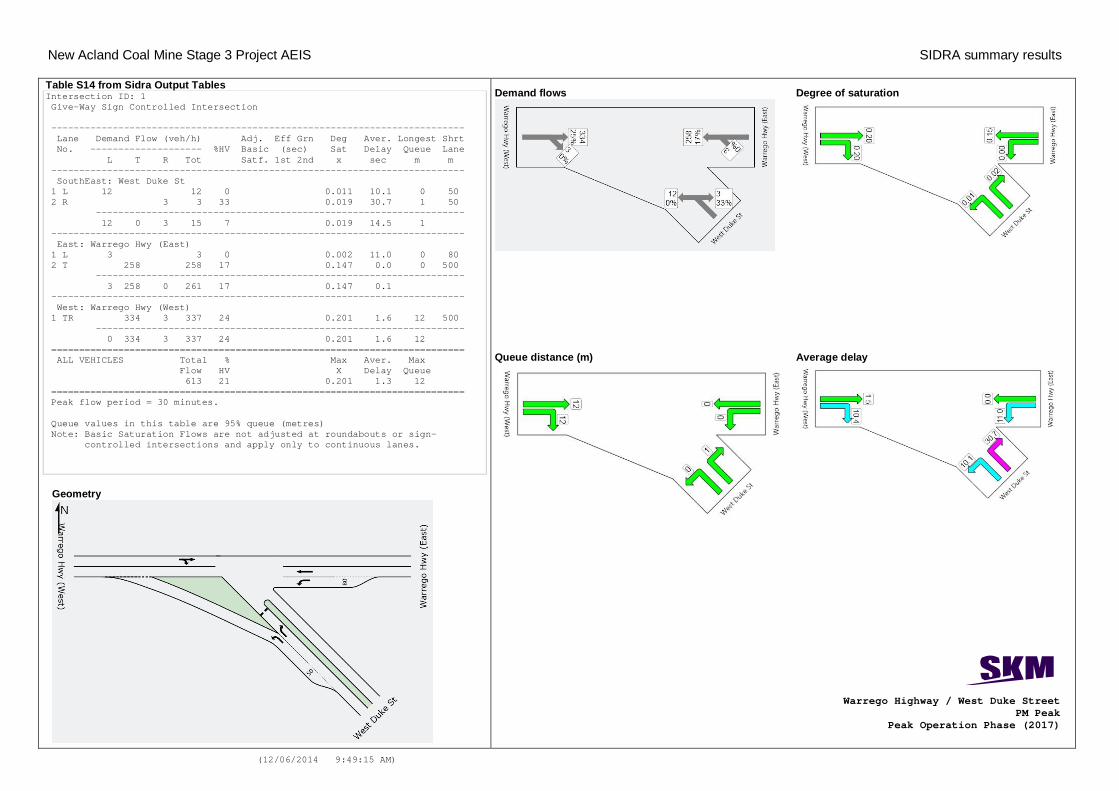
Table S14 from Sidra Output Tables Intersection ID: 1 Give-Way Sign Controlled Intersection -------------------------------------------------------------------------- Lane Demand Flow (veh/h) Adj. Eff Grn Deg Aver. Longest Shrt No. -------------------- %HV Basic (sec) Sat Delay Queue Lane L T R Tot Satf. 1st 2nd x sec m m -------------------------------------------------------------------------- SouthEast: West Duke St 1 L 12 12 0 0.011 10.1 0 50 2 R 3 3 33 0.019 30.7 1 50 ------------------------------------------------------------------ 12 0 3 15 7 0.019 14.5 1 -------------------------------------------------------------------------- East: Warrego Hwy (East) 1 L 3 3 0 0.002 11.0 0 80 2 T 258 258 17 0.147 0.0 0 500 ------------------------------------------------------------------ 3 258 0 261 17 0.147 0.1 -------------------------------------------------------------------------- West: Warrego Hwy (West) 1 TR 334 3 337 24 0.201 1.6 12 500 ------------------------------------------------------------------ 0 334 3 337 24 0.201 1.6 12 ========================================================================== ALL VEHICLES Total % Max Aver. Max Flow HV X Delay Queue 613 21 0.201 1.3 12 ========================================================================== Peak flow period = 30 minutes. Queue values in this table are 95% queue (metres) Note: Basic Saturation Flows are not adjusted at roundabouts or sign- controlled intersections and apply only to continuous lanes.
Geometry
Warrego Highway / West Duke Street PM Peak
Peak Operation Phase (2017)
Demand flows
Average delay Queue distance (m)
Degree of saturation
New Acland Coal Mine Stage 3 Project AEIS SIDRA summary results
(12/06/2014 9:49:15 AM)
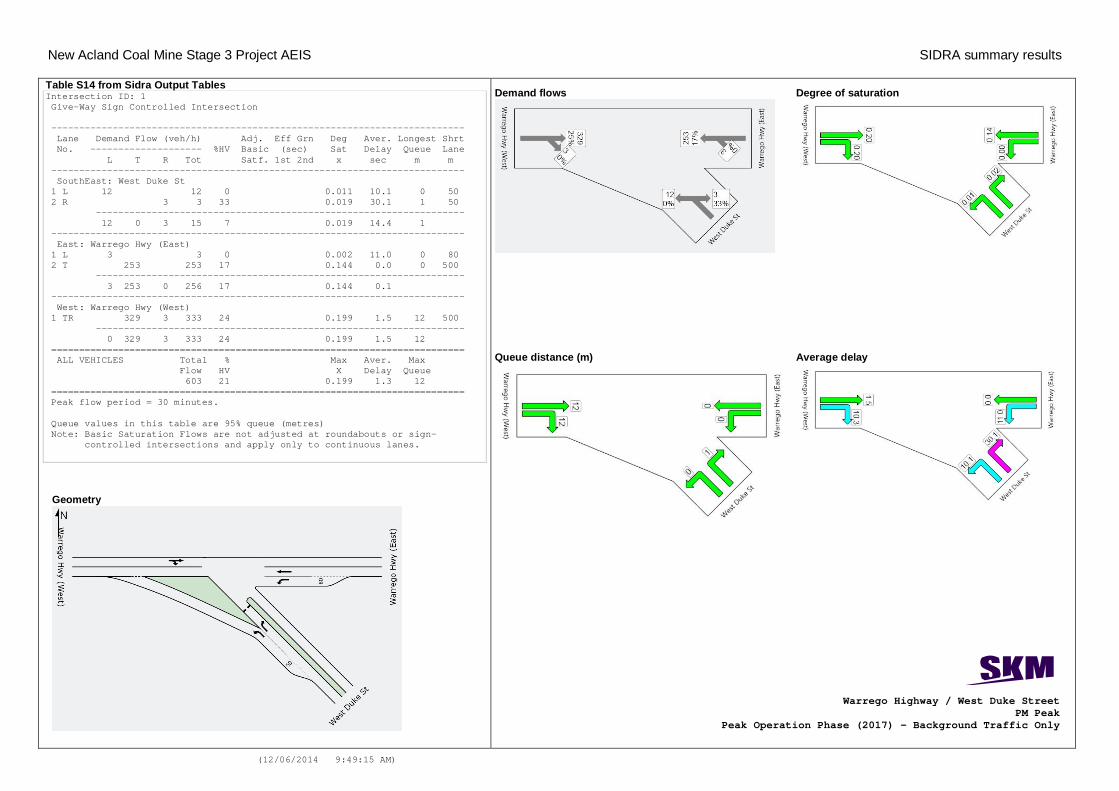
Table S14 from Sidra Output Tables Intersection ID: 1 Give-Way Sign Controlled Intersection -------------------------------------------------------------------------- Lane Demand Flow (veh/h) Adj. Eff Grn Deg Aver. Longest Shrt No. -------------------- %HV Basic (sec) Sat Delay Queue Lane L T R Tot Satf. 1st 2nd x sec m m -------------------------------------------------------------------------- SouthEast: West Duke St 1 L 12 12 0 0.011 10.1 0 50 2 R 3 3 33 0.019 30.1 1 50 ------------------------------------------------------------------ 12 0 3 15 7 0.019 14.4 1 -------------------------------------------------------------------------- East: Warrego Hwy (East) 1 L 3 3 0 0.002 11.0 0 80 2 T 253 253 17 0.144 0.0 0 500 ------------------------------------------------------------------ 3 253 0 256 17 0.144 0.1 -------------------------------------------------------------------------- West: Warrego Hwy (West) 1 TR 329 3 333 24 0.199 1.5 12 500 ------------------------------------------------------------------ 0 329 3 333 24 0.199 1.5 12 ========================================================================== ALL VEHICLES Total % Max Aver. Max Flow HV X Delay Queue 603 21 0.199 1.3 12 ========================================================================== Peak flow period = 30 minutes. Queue values in this table are 95% queue (metres) Note: Basic Saturation Flows are not adjusted at roundabouts or sign- controlled intersections and apply only to continuous lanes.
Geometry
Warrego Highway / West Duke Street PM Peak
Peak Operation Phase (2017) – Background Traffic Only
Demand flows
Average delay Queue distance (m)
Degree of saturation
New Acland Coal Mine Stage 3 Project AEIS SIDRA summary results
(12/06/2014 9:49:15 AM)
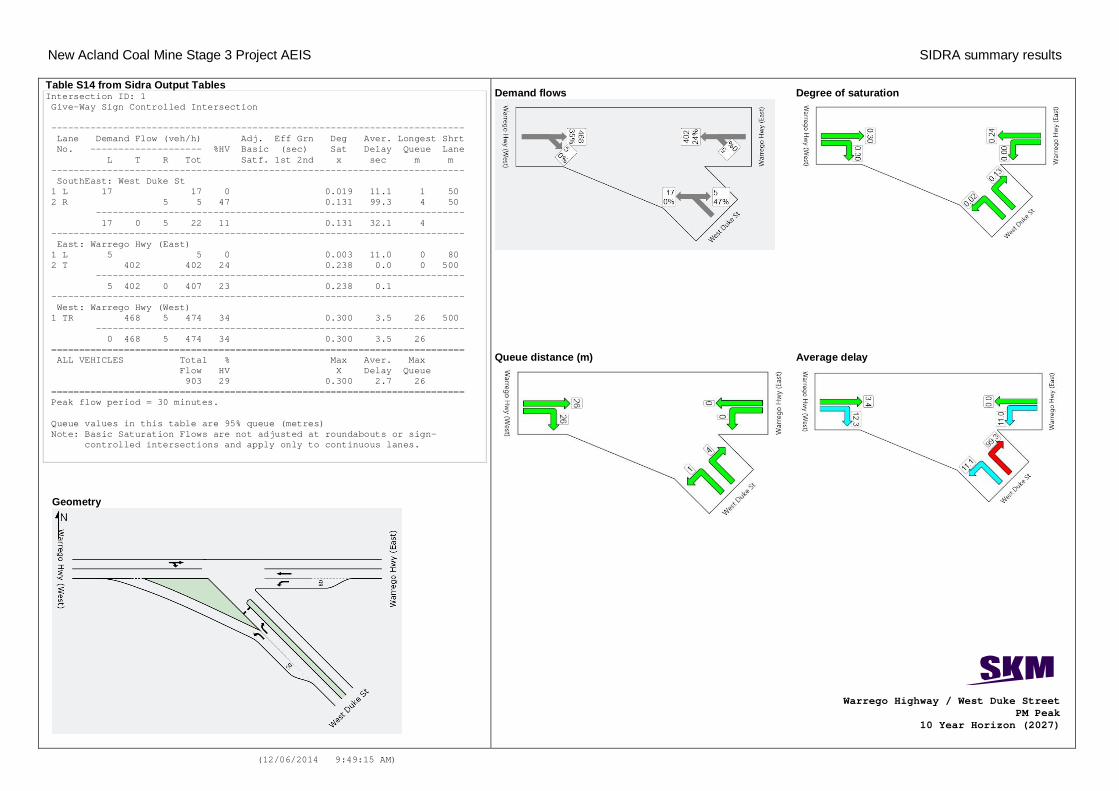
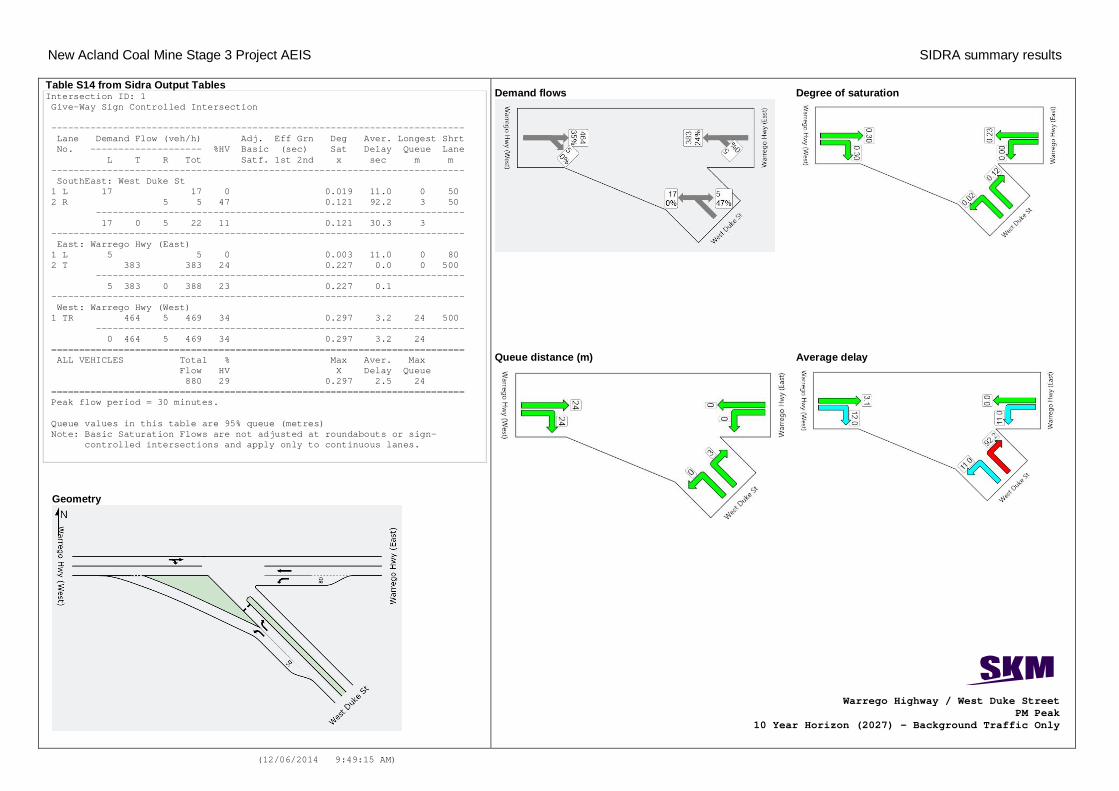
Table S14 from Sidra Output Tables Intersection ID: 1 Give-Way Sign Controlled Intersection -------------------------------------------------------------------------- Lane Demand Flow (veh/h) Adj. Eff Grn Deg Aver. Longest Shrt No. -------------------- %HV Basic (sec) Sat Delay Queue Lane L T R Tot Satf. 1st 2nd x sec m m -------------------------------------------------------------------------- SouthEast: West Duke St 1 L 17 17 0 0.019 11.1 1 50 2 R 5 5 47 0.131 99.3 4 50 ------------------------------------------------------------------ 17 0 5 22 11 0.131 32.1 4 -------------------------------------------------------------------------- East: Warrego Hwy (East) 1 L 5 5 0 0.003 11.0 0 80 2 T 402 402 24 0.238 0.0 0 500 ------------------------------------------------------------------ 5 402 0 407 23 0.238 0.1 -------------------------------------------------------------------------- West: Warrego Hwy (West) 1 TR 468 5 474 34 0.300 3.5 26 500 ------------------------------------------------------------------ 0 468 5 474 34 0.300 3.5 26 ========================================================================== ALL VEHICLES Total % Max Aver. Max Flow HV X Delay Queue 903 29 0.300 2.7 26 ========================================================================== Peak flow period = 30 minutes. Queue values in this table are 95% queue (metres) Note: Basic Saturation Flows are not adjusted at roundabouts or sign- controlled intersections and apply only to continuous lanes.
Geometry
Warrego Highway / West Duke Street PM Peak
10 Year Horizon (2027)
Demand flows
Average delay Queue distance (m)
Degree of saturation
New Acland Coal Mine Stage 3 Project AEIS SIDRA summary results
(12/06/2014 9:49:15 AM)
Table S14 from Sidra Output Tables Intersection ID: 1 Give-Way Sign Controlled Intersection -------------------------------------------------------------------------- Lane Demand Flow (veh/h) Adj. Eff Grn Deg Aver. Longest Shrt No. -------------------- %HV Basic (sec) Sat Delay Queue Lane L T R Tot Satf. 1st 2nd x sec m m -------------------------------------------------------------------------- SouthEast: West Duke St 1 L 17 17 0 0.019 11.0 0 50 2 R 5 5 47 0.121 92.2 3 50 ------------------------------------------------------------------ 17 0 5 22 11 0.121 30.3 3 -------------------------------------------------------------------------- East: Warrego Hwy (East) 1 L 5 5 0 0.003 11.0 0 80 2 T 383 383 24 0.227 0.0 0 500 ------------------------------------------------------------------ 5 383 0 388 23 0.227 0.1 -------------------------------------------------------------------------- West: Warrego Hwy (West) 1 TR 464 5 469 34 0.297 3.2 24 500 ------------------------------------------------------------------ 0 464 5 469 34 0.297 3.2 24 ========================================================================== ALL VEHICLES Total % Max Aver. Max Flow HV X Delay Queue 880 29 0.297 2.5 24 ========================================================================== Peak flow period = 30 minutes. Queue values in this table are 95% queue (metres) Note: Basic Saturation Flows are not adjusted at roundabouts or sign- controlled intersections and apply only to continuous lanes.
Geometry
Warrego Highway / West Duke Street PM Peak
10 Year Horizon (2027) – Background Traffic Only
Demand flows
Average delay Queue distance (m)
Degree of saturation
New Acland Coal Mine Stage 3 Project AEIS SIDRA summary results
(12/06/2014 9:49:15 AM)
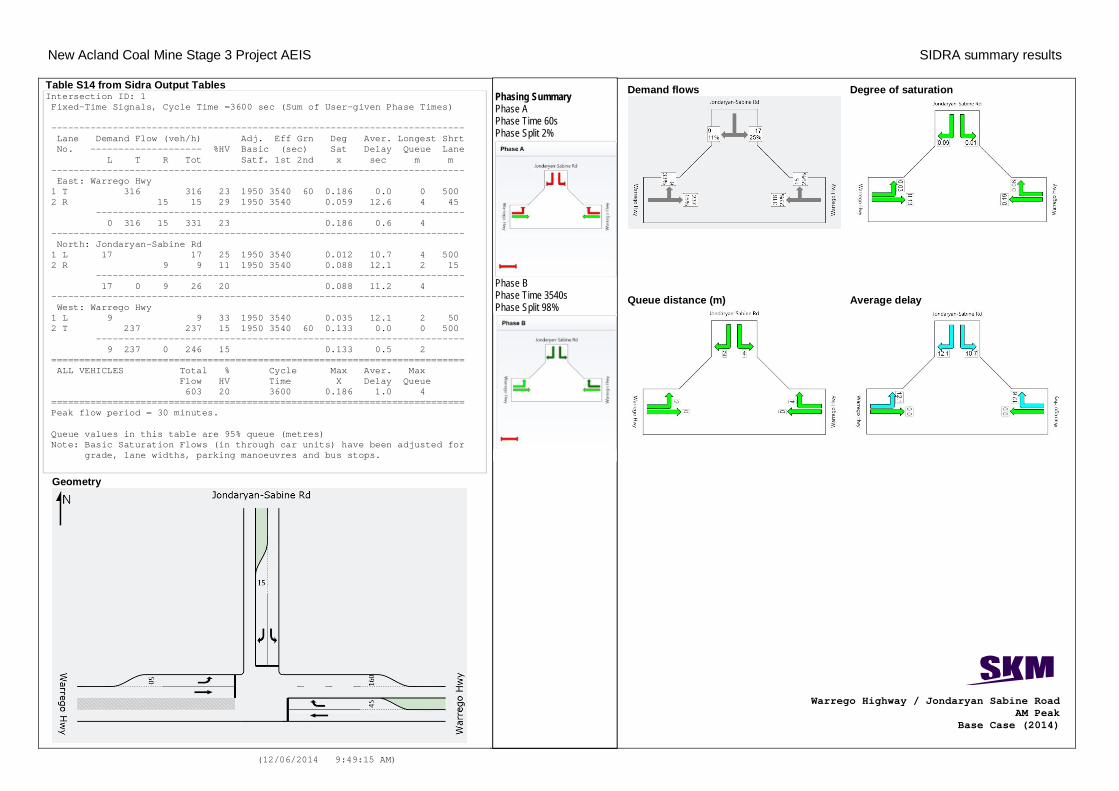
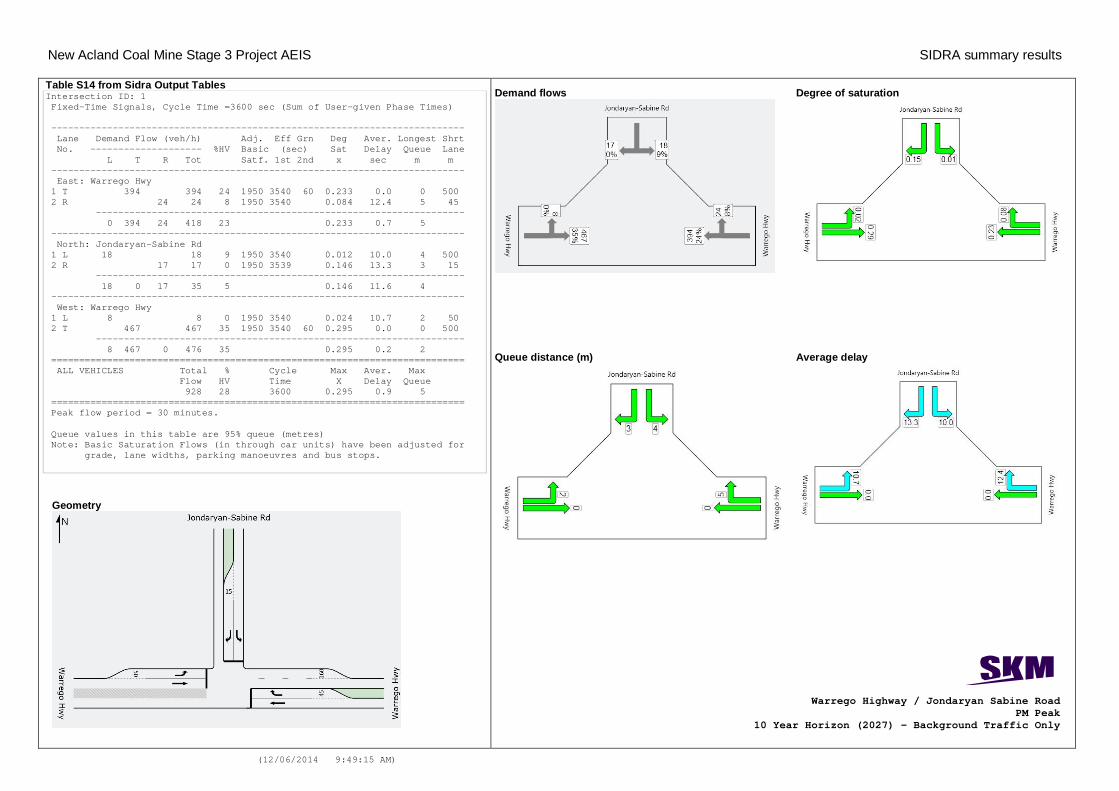
Table S14 from Sidra Output Tables Intersection ID: 1 Fixed-Time Signals, Cycle Time =3600 sec (Sum of User-given Phase Times) -------------------------------------------------------------------------- Lane Demand Flow (veh/h) Adj. Eff Grn Deg Aver. Longest Shrt No. -------------------- %HV Basic (sec) Sat Delay Queue Lane L T R Tot Satf. 1st 2nd x sec m m -------------------------------------------------------------------------- East: Warrego Hwy 1 T 316 316 23 1950 3540 60 0.186 0.0 0 500 2 R 15 15 29 1950 3540 0.059 12.6 4 45 ------------------------------------------------------------------ 0 316 15 331 23 0.186 0.6 4 -------------------------------------------------------------------------- North: Jondaryan-Sabine Rd 1 L 17 17 25 1950 3540 0.012 10.7 4 500 2 R 9 9 11 1950 3540 0.088 12.1 2 15 ------------------------------------------------------------------ 17 0 9 26 20 0.088 11.2 4 -------------------------------------------------------------------------- West: Warrego Hwy 1 L 9 9 33 1950 3540 0.035 12.1 2 50 2 T 237 237 15 1950 3540 60 0.133 0.0 0 500 ------------------------------------------------------------------ 9 237 0 246 15 0.133 0.5 2 ========================================================================== ALL VEHICLES Total % Cycle Max Aver. Max Flow HV Time X Delay Queue 603 20 3600 0.186 1.0 4 ========================================================================== Peak flow period = 30 minutes. Queue values in this table are 95% queue (metres) Note: Basic Saturation Flows (in through car units) have been adjusted for grade, lane widths, parking manoeuvres and bus stops.
Geometry
Warrego Highway / Jondaryan Sabine Road AM Peak
Base Case (2014)
Phasing Summary Phase A Phase Time 60s Phase Split 2%
Phase B Phase Time 3540s Phase Split 98%
Average delay
Demand flows
Queue distance (m)
Degree of saturation
New Acland Coal Mine Stage 3 Project AEIS SIDRA summary results
(12/06/2014 9:49:15 AM)
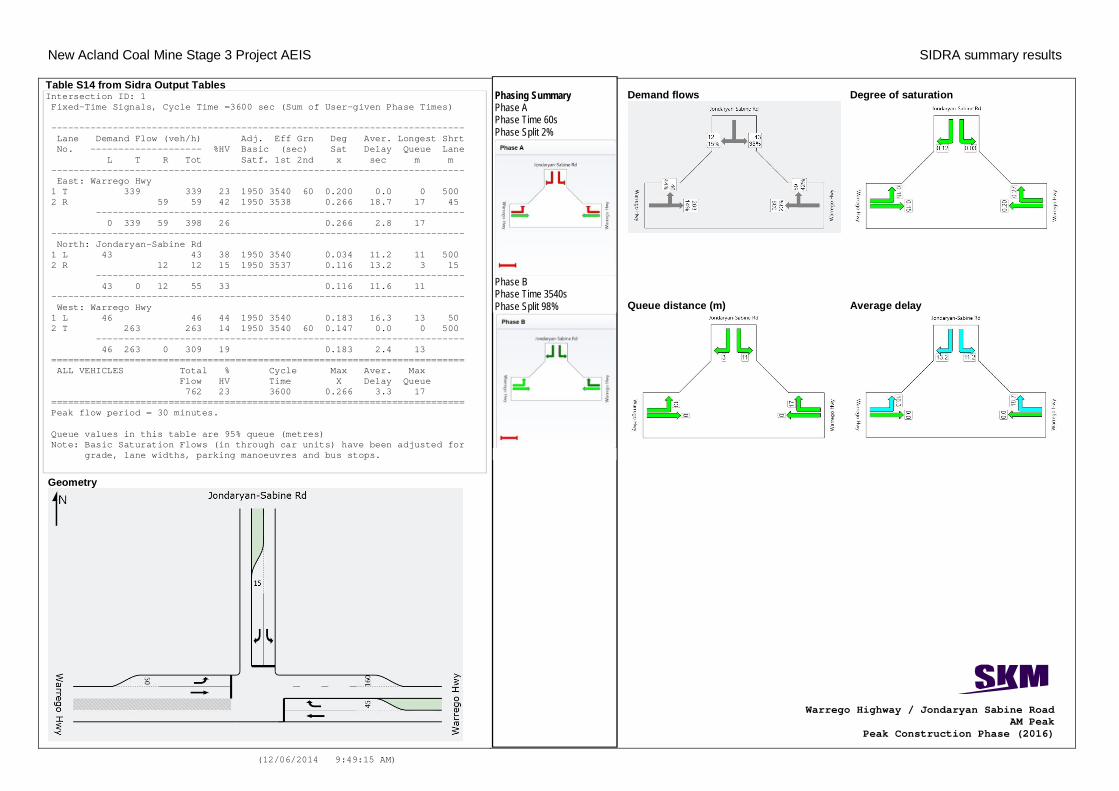
Table S14 from Sidra Output Tables Intersection ID: 1 Fixed-Time Signals, Cycle Time =3600 sec (Sum of User-given Phase Times) -------------------------------------------------------------------------- Lane Demand Flow (veh/h) Adj. Eff Grn Deg Aver. Longest Shrt No. -------------------- %HV Basic (sec) Sat Delay Queue Lane L T R Tot Satf. 1st 2nd x sec m m -------------------------------------------------------------------------- East: Warrego Hwy 1 T 339 339 23 1950 3540 60 0.200 0.0 0 500 2 R 59 59 42 1950 3538 0.266 18.7 17 45 ------------------------------------------------------------------ 0 339 59 398 26 0.266 2.8 17 -------------------------------------------------------------------------- North: Jondaryan-Sabine Rd 1 L 43 43 38 1950 3540 0.034 11.2 11 500 2 R 12 12 15 1950 3537 0.116 13.2 3 15 ------------------------------------------------------------------ 43 0 12 55 33 0.116 11.6 11 -------------------------------------------------------------------------- West: Warrego Hwy 1 L 46 46 44 1950 3540 0.183 16.3 13 50 2 T 263 263 14 1950 3540 60 0.147 0.0 0 500 ------------------------------------------------------------------ 46 263 0 309 19 0.183 2.4 13 ========================================================================== ALL VEHICLES Total % Cycle Max Aver. Max Flow HV Time X Delay Queue 762 23 3600 0.266 3.3 17 ========================================================================== Peak flow period = 30 minutes. Queue values in this table are 95% queue (metres) Note: Basic Saturation Flows (in through car units) have been adjusted for grade, lane widths, parking manoeuvres and bus stops.
Geometry
Phasing Summary Phase A Phase Time 60s Phase Split 2%
Phase B Phase Time 3540s Phase Split 98%
Average delay
Demand flows
Queue distance (m)
Degree of saturation
Warrego Highway / Jondaryan Sabine Road AM Peak
Peak Construction Phase (2016)
New Acland Coal Mine Stage 3 Project AEIS SIDRA summary results
(12/06/2014 9:49:15 AM)
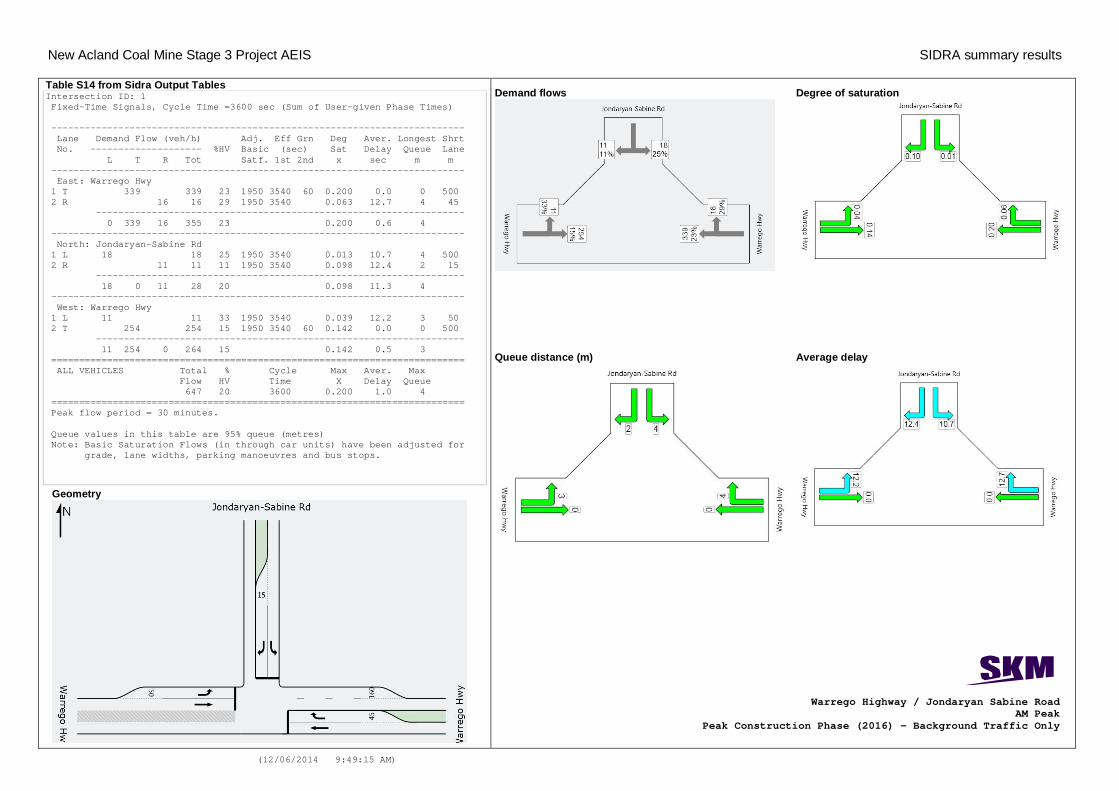
Table S14 from Sidra Output Tables Intersection ID: 1 Fixed-Time Signals, Cycle Time =3600 sec (Sum of User-given Phase Times) -------------------------------------------------------------------------- Lane Demand Flow (veh/h) Adj. Eff Grn Deg Aver. Longest Shrt No. -------------------- %HV Basic (sec) Sat Delay Queue Lane L T R Tot Satf. 1st 2nd x sec m m -------------------------------------------------------------------------- East: Warrego Hwy 1 T 339 339 23 1950 3540 60 0.200 0.0 0 500 2 R 16 16 29 1950 3540 0.063 12.7 4 45 ------------------------------------------------------------------ 0 339 16 355 23 0.200 0.6 4 -------------------------------------------------------------------------- North: Jondaryan-Sabine Rd 1 L 18 18 25 1950 3540 0.013 10.7 4 500 2 R 11 11 11 1950 3540 0.098 12.4 2 15 ------------------------------------------------------------------ 18 0 11 28 20 0.098 11.3 4 -------------------------------------------------------------------------- West: Warrego Hwy 1 L 11 11 33 1950 3540 0.039 12.2 3 50 2 T 254 254 15 1950 3540 60 0.142 0.0 0 500 ------------------------------------------------------------------ 11 254 0 264 15 0.142 0.5 3 ========================================================================== ALL VEHICLES Total % Cycle Max Aver. Max Flow HV Time X Delay Queue 647 20 3600 0.200 1.0 4 ========================================================================== Peak flow period = 30 minutes. Queue values in this table are 95% queue (metres) Note: Basic Saturation Flows (in through car units) have been adjusted for grade, lane widths, parking manoeuvres and bus stops.
Geometry
Warrego Highway / Jondaryan Sabine Road AM Peak
Peak Construction Phase (2016) – Background Traffic Only
Demand flows
Average delay Queue distance (m)
Degree of saturation

New Acland Coal Mine Stage 3 Project AEIS SIDRA summary results
(12/06/2014 9:49:15 AM)
Table S14 from Sidra Output Tables Intersection ID: 1 Fixed-Time Signals, Cycle Time =3600 sec (Sum of User-given Phase Times) -------------------------------------------------------------------------- Lane Demand Flow (veh/h) Adj. Eff Grn Deg Aver. Longest Shrt No. -------------------- %HV Basic (sec) Sat Delay Queue Lane L T R Tot Satf. 1st 2nd x sec m m -------------------------------------------------------------------------- East: Warrego Hwy 1 T 351 351 23 1950 3540 60 0.207 0.0 0 500 2 R 41 41 31 1950 3539 0.170 15.6 10 45 ------------------------------------------------------------------ 0 351 41 392 24 0.207 1.6 10 -------------------------------------------------------------------------- North: Jondaryan-Sabine Rd 1 L 43 43 30 1950 3540 0.033 10.9 11 500 2 R 27 27 25 1950 3539 0.286 18.5 7 15 ------------------------------------------------------------------ 43 0 27 71 28 0.286 13.8 11 -------------------------------------------------------------------------- West: Warrego Hwy 1 L 27 27 33 1950 3540 0.101 13.8 7 50 2 T 262 262 15 1950 3540 60 0.147 0.0 0 500 ------------------------------------------------------------------ 27 262 0 289 16 0.147 1.3 7 ========================================================================== ALL VEHICLES Total % Cycle Max Aver. Max Flow HV Time X Delay Queue 752 21 3600 0.286 2.6 11 ========================================================================== Peak flow period = 30 minutes. Queue values in this table are 95% queue (metres) Note: Basic Saturation Flows (in through car units) have been adjusted for grade, lane widths, parking manoeuvres and bus stops.
Geometry
Warrego Highway / Jondaryan Sabine Road AM Peak
Peak Operation Phase (2017)
Demand flows
Average delay Queue distance (m)
Degree of saturation
New Acland Coal Mine Stage 3 Project AEIS SIDRA summary results
(12/06/2014 9:49:15 AM)
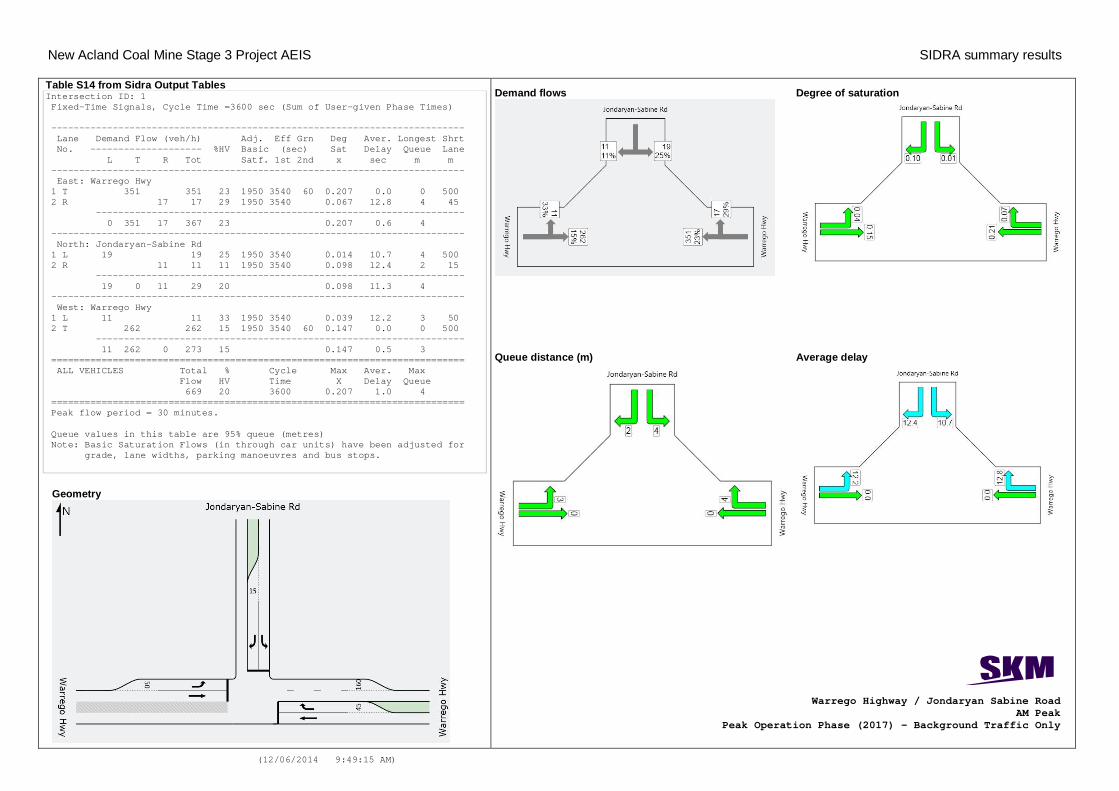
Table S14 from Sidra Output Tables Intersection ID: 1 Fixed-Time Signals, Cycle Time =3600 sec (Sum of User-given Phase Times) -------------------------------------------------------------------------- Lane Demand Flow (veh/h) Adj. Eff Grn Deg Aver. Longest Shrt No. -------------------- %HV Basic (sec) Sat Delay Queue Lane L T R Tot Satf. 1st 2nd x sec m m -------------------------------------------------------------------------- East: Warrego Hwy 1 T 351 351 23 1950 3540 60 0.207 0.0 0 500 2 R 17 17 29 1950 3540 0.067 12.8 4 45 ------------------------------------------------------------------ 0 351 17 367 23 0.207 0.6 4 -------------------------------------------------------------------------- North: Jondaryan-Sabine Rd 1 L 19 19 25 1950 3540 0.014 10.7 4 500 2 R 11 11 11 1950 3540 0.098 12.4 2 15 ------------------------------------------------------------------ 19 0 11 29 20 0.098 11.3 4 -------------------------------------------------------------------------- West: Warrego Hwy 1 L 11 11 33 1950 3540 0.039 12.2 3 50 2 T 262 262 15 1950 3540 60 0.147 0.0 0 500 ------------------------------------------------------------------ 11 262 0 273 15 0.147 0.5 3 ========================================================================== ALL VEHICLES Total % Cycle Max Aver. Max Flow HV Time X Delay Queue 669 20 3600 0.207 1.0 4 ========================================================================== Peak flow period = 30 minutes. Queue values in this table are 95% queue (metres) Note: Basic Saturation Flows (in through car units) have been adjusted for grade, lane widths, parking manoeuvres and bus stops.
Geometry
Warrego Highway / Jondaryan Sabine Road AM Peak
Peak Operation Phase (2017) – Background Traffic Only
Demand flows
Average delay Queue distance (m)
Degree of saturation
New Acland Coal Mine Stage 3 Project AEIS SIDRA summary results
(12/06/2014 9:49:15 AM)
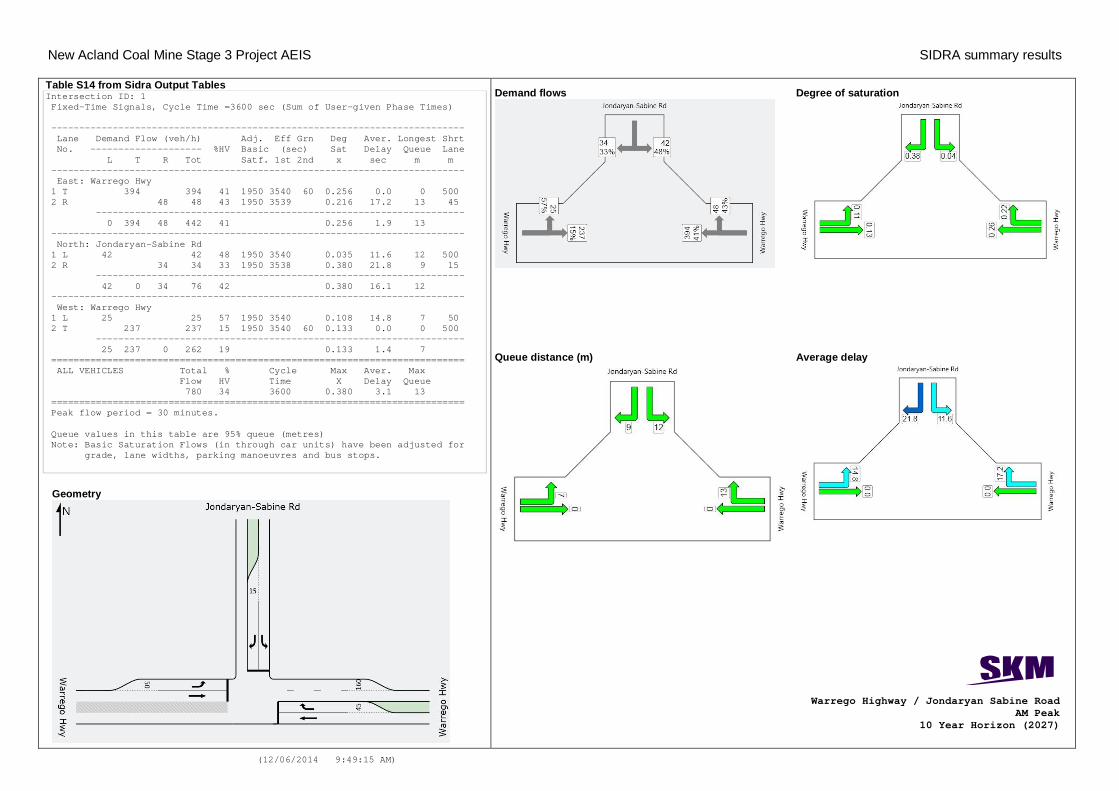
Table S14 from Sidra Output Tables Intersection ID: 1 Fixed-Time Signals, Cycle Time =3600 sec (Sum of User-given Phase Times) -------------------------------------------------------------------------- Lane Demand Flow (veh/h) Adj. Eff Grn Deg Aver. Longest Shrt No. -------------------- %HV Basic (sec) Sat Delay Queue Lane L T R Tot Satf. 1st 2nd x sec m m -------------------------------------------------------------------------- East: Warrego Hwy 1 T 394 394 41 1950 3540 60 0.256 0.0 0 500 2 R 48 48 43 1950 3539 0.216 17.2 13 45 ------------------------------------------------------------------ 0 394 48 442 41 0.256 1.9 13 -------------------------------------------------------------------------- North: Jondaryan-Sabine Rd 1 L 42 42 48 1950 3540 0.035 11.6 12 500 2 R 34 34 33 1950 3538 0.380 21.8 9 15 ------------------------------------------------------------------ 42 0 34 76 42 0.380 16.1 12 -------------------------------------------------------------------------- West: Warrego Hwy 1 L 25 25 57 1950 3540 0.108 14.8 7 50 2 T 237 237 15 1950 3540 60 0.133 0.0 0 500 ------------------------------------------------------------------ 25 237 0 262 19 0.133 1.4 7 ========================================================================== ALL VEHICLES Total % Cycle Max Aver. Max Flow HV Time X Delay Queue 780 34 3600 0.380 3.1 13 ========================================================================== Peak flow period = 30 minutes. Queue values in this table are 95% queue (metres) Note: Basic Saturation Flows (in through car units) have been adjusted for grade, lane widths, parking manoeuvres and bus stops.
Geometry
Warrego Highway / Jondaryan Sabine Road AM Peak
10 Year Horizon (2027)
Demand flows
Average delay Queue distance (m)
Degree of saturation
New Acland Coal Mine Stage 3 Project AEIS SIDRA summary results
(12/06/2014 9:49:15 AM)
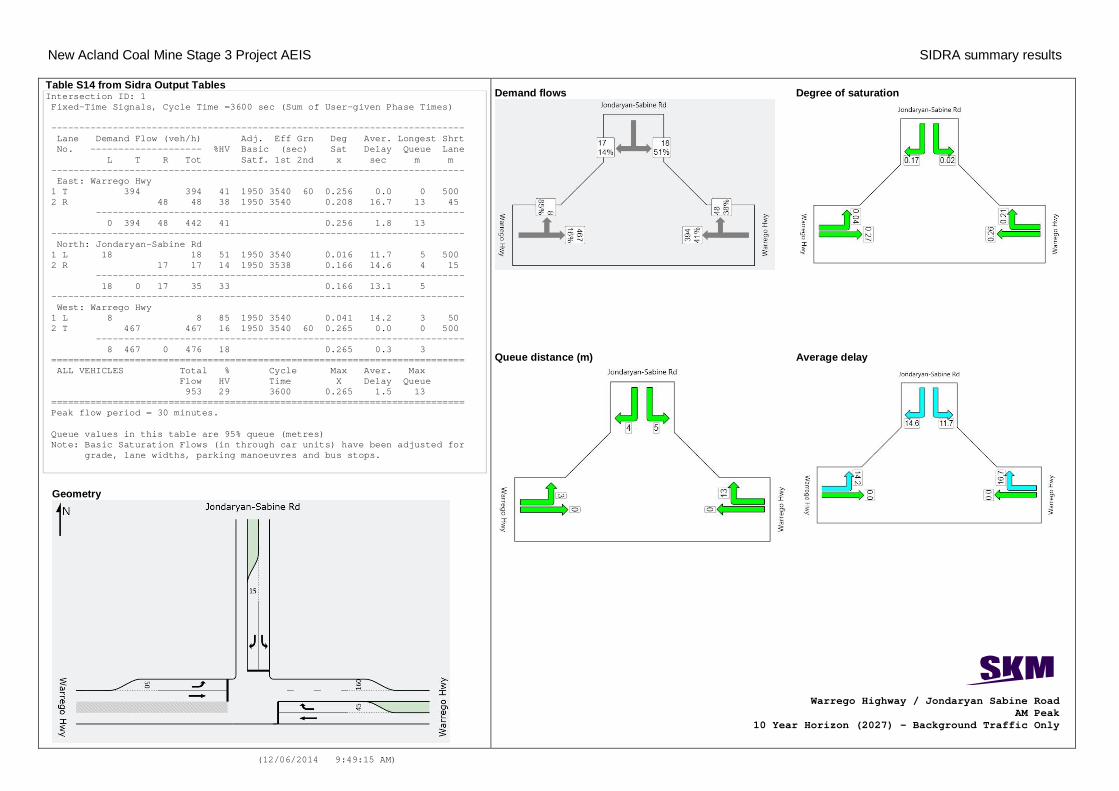
Table S14 from Sidra Output Tables Intersection ID: 1 Fixed-Time Signals, Cycle Time =3600 sec (Sum of User-given Phase Times) -------------------------------------------------------------------------- Lane Demand Flow (veh/h) Adj. Eff Grn Deg Aver. Longest Shrt No. -------------------- %HV Basic (sec) Sat Delay Queue Lane L T R Tot Satf. 1st 2nd x sec m m -------------------------------------------------------------------------- East: Warrego Hwy 1 T 394 394 41 1950 3540 60 0.256 0.0 0 500 2 R 48 48 38 1950 3540 0.208 16.7 13 45 ------------------------------------------------------------------ 0 394 48 442 41 0.256 1.8 13 -------------------------------------------------------------------------- North: Jondaryan-Sabine Rd 1 L 18 18 51 1950 3540 0.016 11.7 5 500 2 R 17 17 14 1950 3538 0.166 14.6 4 15 ------------------------------------------------------------------ 18 0 17 35 33 0.166 13.1 5 -------------------------------------------------------------------------- West: Warrego Hwy 1 L 8 8 85 1950 3540 0.041 14.2 3 50 2 T 467 467 16 1950 3540 60 0.265 0.0 0 500 ------------------------------------------------------------------ 8 467 0 476 18 0.265 0.3 3 ========================================================================== ALL VEHICLES Total % Cycle Max Aver. Max Flow HV Time X Delay Queue 953 29 3600 0.265 1.5 13 ========================================================================== Peak flow period = 30 minutes. Queue values in this table are 95% queue (metres) Note: Basic Saturation Flows (in through car units) have been adjusted for grade, lane widths, parking manoeuvres and bus stops.
Geometry
Warrego Highway / Jondaryan Sabine Road AM Peak
10 Year Horizon (2027) – Background Traffic Only
Demand flows
Average delay Queue distance (m)
Degree of saturation

New Acland Coal Mine Stage 3 Project AEIS SIDRA summary results
(12/06/2014 9:49:15 AM)
Table S14 from Sidra Output Tables Intersection ID: 1 Fixed-Time Signals, Cycle Time =3600 sec (Sum of User-given Phase Times) -------------------------------------------------------------------------- Lane Demand Flow (veh/h) Adj. Eff Grn Deg Aver. Longest Shrt No. -------------------- %HV Basic (sec) Sat Delay Queue Lane L T R Tot Satf. 1st 2nd x sec m m -------------------------------------------------------------------------- East: Warrego Hwy 1 T 252 252 17 1950 3540 60 0.143 0.0 0 500 2 R 16 16 13 1950 3540 0.057 11.9 3 45 ------------------------------------------------------------------ 0 252 16 267 17 0.143 0.7 3 -------------------------------------------------------------------------- North: Jondaryan-Sabine Rd 1 L 12 12 18 1950 3540 0.008 10.4 3 500 2 R 11 11 0 1950 3540 0.089 11.6 2 15 ------------------------------------------------------------------ 12 0 11 22 10 0.089 11.0 3 -------------------------------------------------------------------------- West: Warrego Hwy 1 L 5 5 0 1950 3540 0.015 10.6 1 50 2 T 299 299 21 1950 3540 60 0.174 0.0 0 500 ------------------------------------------------------------------ 5 299 0 304 21 0.174 0.2 1 ========================================================================== ALL VEHICLES Total % Cycle Max Aver. Max Flow HV Time X Delay Queue 594 18 3600 0.174 0.8 3 ========================================================================== Peak flow period = 30 minutes. Queue values in this table are 95% queue (metres) Note: Basic Saturation Flows (in through car units) have been adjusted for grade, lane widths, parking manoeuvres and bus stops.
Geometry
Warrego Highway / Jondaryan Sabine Road PM Peak
Base Case (2014)
Demand flows
Average delay Queue distance (m)
Degree of saturation
New Acland Coal Mine Stage 3 Project AEIS SIDRA summary results
(12/06/2014 9:49:15 AM)
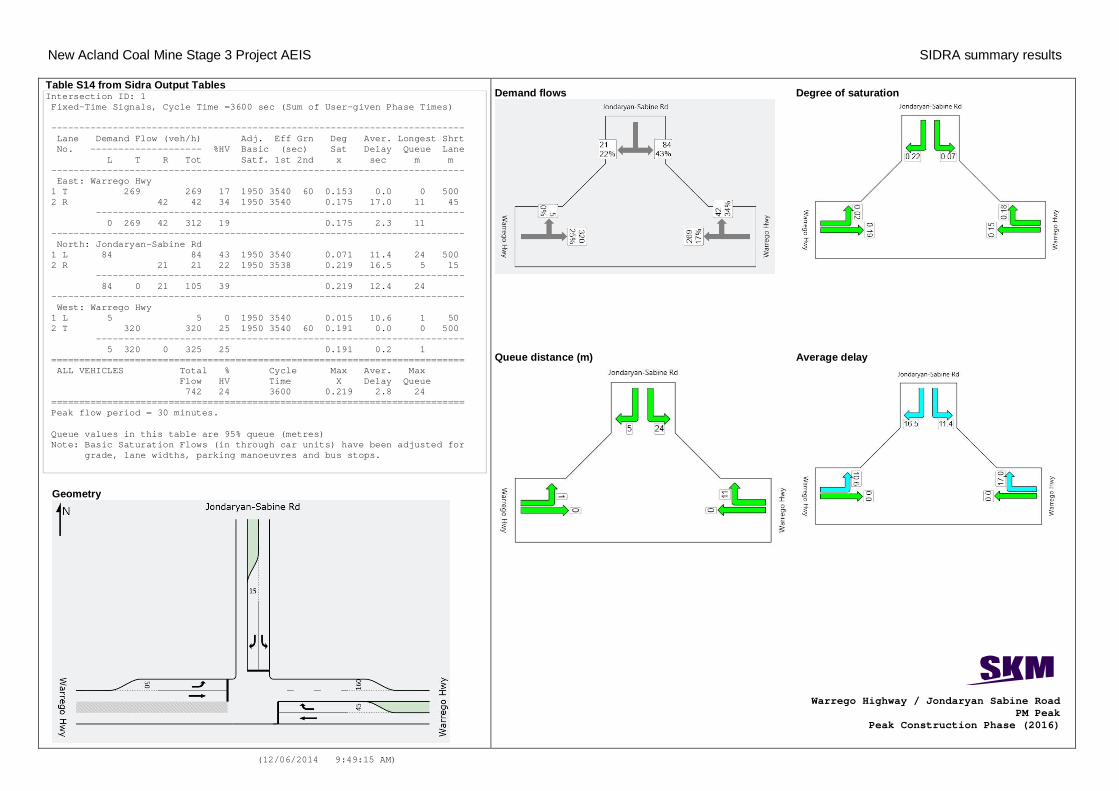
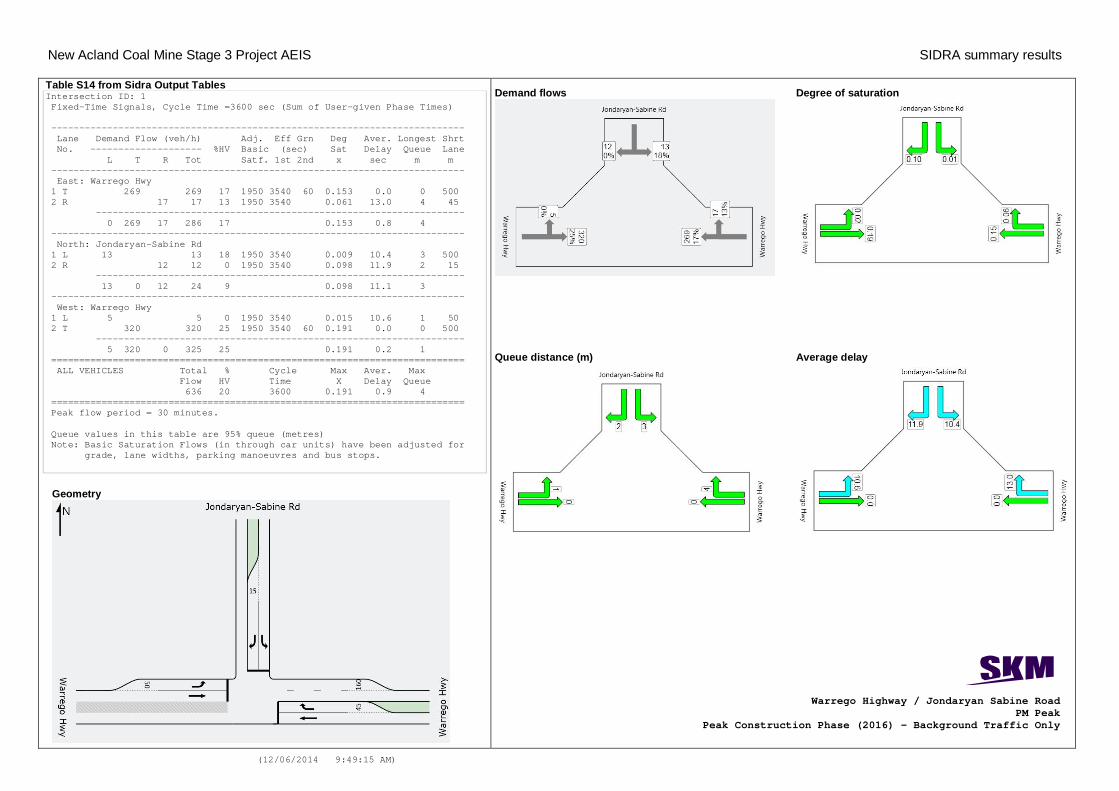
Table S14 from Sidra Output Tables Intersection ID: 1 Fixed-Time Signals, Cycle Time =3600 sec (Sum of User-given Phase Times) -------------------------------------------------------------------------- Lane Demand Flow (veh/h) Adj. Eff Grn Deg Aver. Longest Shrt No. -------------------- %HV Basic (sec) Sat Delay Queue Lane L T R Tot Satf. 1st 2nd x sec m m -------------------------------------------------------------------------- East: Warrego Hwy 1 T 269 269 17 1950 3540 60 0.153 0.0 0 500 2 R 42 42 34 1950 3540 0.175 17.0 11 45 ------------------------------------------------------------------ 0 269 42 312 19 0.175 2.3 11 -------------------------------------------------------------------------- North: Jondaryan-Sabine Rd 1 L 84 84 43 1950 3540 0.071 11.4 24 500 2 R 21 21 22 1950 3538 0.219 16.5 5 15 ------------------------------------------------------------------ 84 0 21 105 39 0.219 12.4 24 -------------------------------------------------------------------------- West: Warrego Hwy 1 L 5 5 0 1950 3540 0.015 10.6 1 50 2 T 320 320 25 1950 3540 60 0.191 0.0 0 500 ------------------------------------------------------------------ 5 320 0 325 25 0.191 0.2 1 ========================================================================== ALL VEHICLES Total % Cycle Max Aver. Max Flow HV Time X Delay Queue 742 24 3600 0.219 2.8 24 ========================================================================== Peak flow period = 30 minutes. Queue values in this table are 95% queue (metres) Note: Basic Saturation Flows (in through car units) have been adjusted for grade, lane widths, parking manoeuvres and bus stops.
Geometry
Warrego Highway / Jondaryan Sabine Road PM Peak
Peak Construction Phase (2016)
Demand flows
Average delay Queue distance (m)
Degree of saturation
New Acland Coal Mine Stage 3 Project AEIS SIDRA summary results
(12/06/2014 9:49:15 AM)
Table S14 from Sidra Output Tables Intersection ID: 1 Fixed-Time Signals, Cycle Time =3600 sec (Sum of User-given Phase Times) -------------------------------------------------------------------------- Lane Demand Flow (veh/h) Adj. Eff Grn Deg Aver. Longest Shrt No. -------------------- %HV Basic (sec) Sat Delay Queue Lane L T R Tot Satf. 1st 2nd x sec m m -------------------------------------------------------------------------- East: Warrego Hwy 1 T 269 269 17 1950 3540 60 0.153 0.0 0 500 2 R 17 17 13 1950 3540 0.061 13.0 4 45 ------------------------------------------------------------------ 0 269 17 286 17 0.153 0.8 4 -------------------------------------------------------------------------- North: Jondaryan-Sabine Rd 1 L 13 13 18 1950 3540 0.009 10.4 3 500 2 R 12 12 0 1950 3540 0.098 11.9 2 15 ------------------------------------------------------------------ 13 0 12 24 9 0.098 11.1 3 -------------------------------------------------------------------------- West: Warrego Hwy 1 L 5 5 0 1950 3540 0.015 10.6 1 50 2 T 320 320 25 1950 3540 60 0.191 0.0 0 500 ------------------------------------------------------------------ 5 320 0 325 25 0.191 0.2 1 ========================================================================== ALL VEHICLES Total % Cycle Max Aver. Max Flow HV Time X Delay Queue 636 20 3600 0.191 0.9 4 ========================================================================== Peak flow period = 30 minutes. Queue values in this table are 95% queue (metres) Note: Basic Saturation Flows (in through car units) have been adjusted for grade, lane widths, parking manoeuvres and bus stops.
Geometry
Warrego Highway / Jondaryan Sabine Road PM Peak
Peak Construction Phase (2016) – Background Traffic Only
Demand flows
Average delay Queue distance (m)
Degree of saturation
New Acland Coal Mine Stage 3 Project AEIS SIDRA summary results
(12/06/2014 9:49:15 AM)
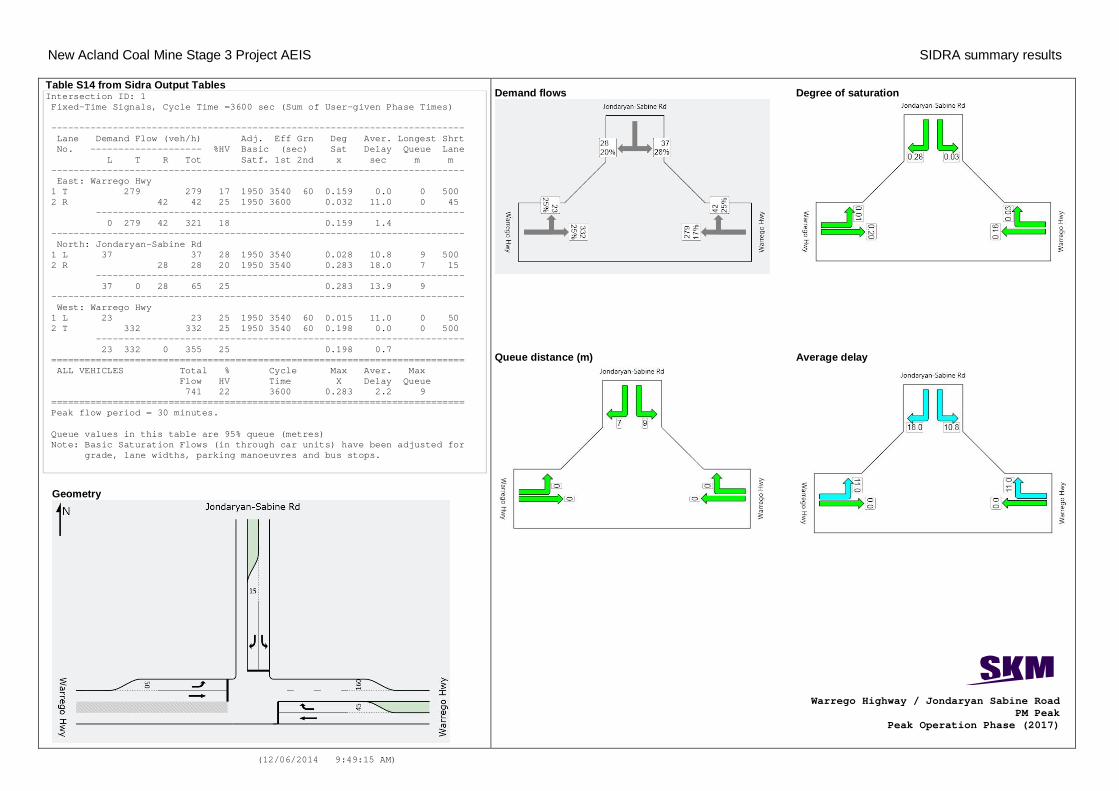
Table S14 from Sidra Output Tables Intersection ID: 1 Fixed-Time Signals, Cycle Time =3600 sec (Sum of User-given Phase Times) -------------------------------------------------------------------------- Lane Demand Flow (veh/h) Adj. Eff Grn Deg Aver. Longest Shrt No. -------------------- %HV Basic (sec) Sat Delay Queue Lane L T R Tot Satf. 1st 2nd x sec m m -------------------------------------------------------------------------- East: Warrego Hwy 1 T 279 279 17 1950 3540 60 0.159 0.0 0 500 2 R 42 42 25 1950 3600 0.032 11.0 0 45 ------------------------------------------------------------------ 0 279 42 321 18 0.159 1.4 -------------------------------------------------------------------------- North: Jondaryan-Sabine Rd 1 L 37 37 28 1950 3540 0.028 10.8 9 500 2 R 28 28 20 1950 3540 0.283 18.0 7 15 ------------------------------------------------------------------ 37 0 28 65 25 0.283 13.9 9 -------------------------------------------------------------------------- West: Warrego Hwy 1 L 23 23 25 1950 3540 60 0.015 11.0 0 50 2 T 332 332 25 1950 3540 60 0.198 0.0 0 500 ------------------------------------------------------------------ 23 332 0 355 25 0.198 0.7 ========================================================================== ALL VEHICLES Total % Cycle Max Aver. Max Flow HV Time X Delay Queue 741 22 3600 0.283 2.2 9 ========================================================================== Peak flow period = 30 minutes. Queue values in this table are 95% queue (metres) Note: Basic Saturation Flows (in through car units) have been adjusted for grade, lane widths, parking manoeuvres and bus stops.
Geometry
Warrego Highway / Jondaryan Sabine Road PM Peak
Peak Operation Phase (2017)
Demand flows
Average delay Queue distance (m)
Degree of saturation
New Acland Coal Mine Stage 3 Project AEIS SIDRA summary results
(12/06/2014 9:49:15 AM)
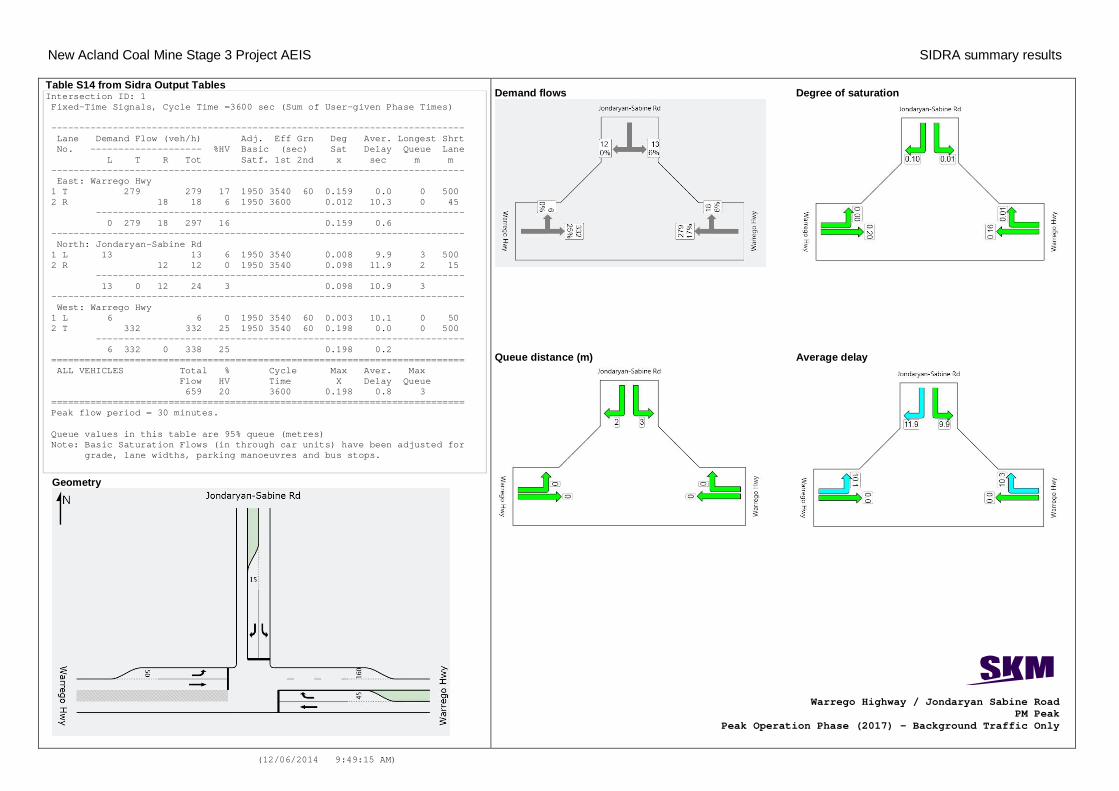
Table S14 from Sidra Output Tables Intersection ID: 1 Fixed-Time Signals, Cycle Time =3600 sec (Sum of User-given Phase Times) -------------------------------------------------------------------------- Lane Demand Flow (veh/h) Adj. Eff Grn Deg Aver. Longest Shrt No. -------------------- %HV Basic (sec) Sat Delay Queue Lane L T R Tot Satf. 1st 2nd x sec m m -------------------------------------------------------------------------- East: Warrego Hwy 1 T 279 279 17 1950 3540 60 0.159 0.0 0 500 2 R 18 18 6 1950 3600 0.012 10.3 0 45 ------------------------------------------------------------------ 0 279 18 297 16 0.159 0.6 -------------------------------------------------------------------------- North: Jondaryan-Sabine Rd 1 L 13 13 6 1950 3540 0.008 9.9 3 500 2 R 12 12 0 1950 3540 0.098 11.9 2 15 ------------------------------------------------------------------ 13 0 12 24 3 0.098 10.9 3 -------------------------------------------------------------------------- West: Warrego Hwy 1 L 6 6 0 1950 3540 60 0.003 10.1 0 50 2 T 332 332 25 1950 3540 60 0.198 0.0 0 500 ------------------------------------------------------------------ 6 332 0 338 25 0.198 0.2 ========================================================================== ALL VEHICLES Total % Cycle Max Aver. Max Flow HV Time X Delay Queue 659 20 3600 0.198 0.8 3 ========================================================================== Peak flow period = 30 minutes. Queue values in this table are 95% queue (metres) Note: Basic Saturation Flows (in through car units) have been adjusted for grade, lane widths, parking manoeuvres and bus stops.
Geometry
Warrego Highway / Jondaryan Sabine Road PM Peak
Peak Operation Phase (2017) – Background Traffic Only
Demand flows
Average delay Queue distance (m)
Degree of saturation
New Acland Coal Mine Stage 3 Project AEIS SIDRA summary results
(12/06/2014 9:49:15 AM)
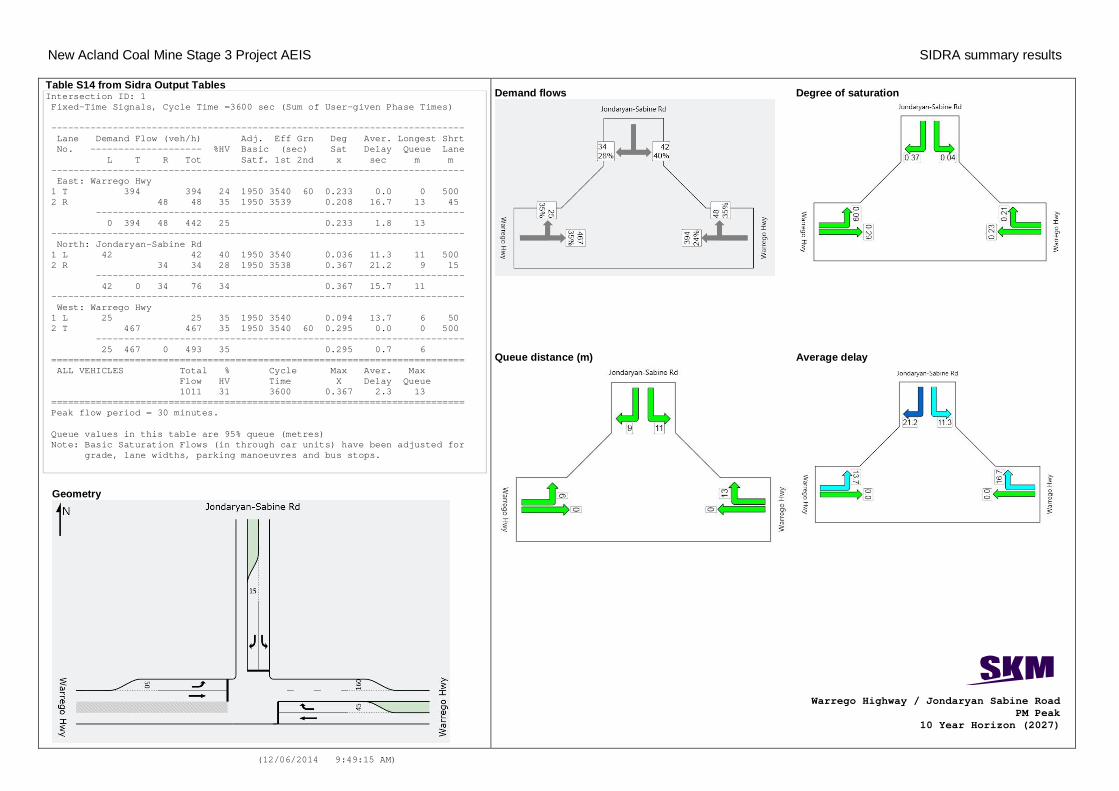
Table S14 from Sidra Output Tables Intersection ID: 1 Fixed-Time Signals, Cycle Time =3600 sec (Sum of User-given Phase Times) -------------------------------------------------------------------------- Lane Demand Flow (veh/h) Adj. Eff Grn Deg Aver. Longest Shrt No. -------------------- %HV Basic (sec) Sat Delay Queue Lane L T R Tot Satf. 1st 2nd x sec m m -------------------------------------------------------------------------- East: Warrego Hwy 1 T 394 394 24 1950 3540 60 0.233 0.0 0 500 2 R 48 48 35 1950 3539 0.208 16.7 13 45 ------------------------------------------------------------------ 0 394 48 442 25 0.233 1.8 13 -------------------------------------------------------------------------- North: Jondaryan-Sabine Rd 1 L 42 42 40 1950 3540 0.036 11.3 11 500 2 R 34 34 28 1950 3538 0.367 21.2 9 15 ------------------------------------------------------------------ 42 0 34 76 34 0.367 15.7 11 -------------------------------------------------------------------------- West: Warrego Hwy 1 L 25 25 35 1950 3540 0.094 13.7 6 50 2 T 467 467 35 1950 3540 60 0.295 0.0 0 500 ------------------------------------------------------------------ 25 467 0 493 35 0.295 0.7 6 ========================================================================== ALL VEHICLES Total % Cycle Max Aver. Max Flow HV Time X Delay Queue 1011 31 3600 0.367 2.3 13 ========================================================================== Peak flow period = 30 minutes. Queue values in this table are 95% queue (metres) Note: Basic Saturation Flows (in through car units) have been adjusted for grade, lane widths, parking manoeuvres and bus stops.
Geometry
Warrego Highway / Jondaryan Sabine Road PM Peak
10 Year Horizon (2027)
Demand flows
Average delay Queue distance (m)
Degree of saturation
New Acland Coal Mine Stage 3 Project AEIS SIDRA summary results
(12/06/2014 9:49:15 AM)
Table S14 from Sidra Output Tables Intersection ID: 1 Fixed-Time Signals, Cycle Time =3600 sec (Sum of User-given Phase Times) -------------------------------------------------------------------------- Lane Demand Flow (veh/h) Adj. Eff Grn Deg Aver. Longest Shrt No. -------------------- %HV Basic (sec) Sat Delay Queue Lane L T R Tot Satf. 1st 2nd x sec m m -------------------------------------------------------------------------- East: Warrego Hwy 1 T 394 394 24 1950 3540 60 0.233 0.0 0 500 2 R 24 24 8 1950 3540 0.084 12.4 5 45 ------------------------------------------------------------------ 0 394 24 418 23 0.233 0.7 5 -------------------------------------------------------------------------- North: Jondaryan-Sabine Rd 1 L 18 18 9 1950 3540 0.012 10.0 4 500 2 R 17 17 0 1950 3539 0.146 13.3 3 15 ------------------------------------------------------------------ 18 0 17 35 5 0.146 11.6 4 -------------------------------------------------------------------------- West: Warrego Hwy 1 L 8 8 0 1950 3540 0.024 10.7 2 50 2 T 467 467 35 1950 3540 60 0.295 0.0 0 500 ------------------------------------------------------------------ 8 467 0 476 35 0.295 0.2 2 ========================================================================== ALL VEHICLES Total % Cycle Max Aver. Max Flow HV Time X Delay Queue 928 28 3600 0.295 0.9 5 ========================================================================== Peak flow period = 30 minutes. Queue values in this table are 95% queue (metres) Note: Basic Saturation Flows (in through car units) have been adjusted for grade, lane widths, parking manoeuvres and bus stops.
Geometry
Warrego Highway / Jondaryan Sabine Road PM Peak
10 Year Horizon (2027) – Background Traffic Only
Demand flows
Average delay Queue distance (m)
Degree of saturation
New Acland Coal Mine Stage 3 Project AEIS SIDRA summary results
(12/06/2014 9:49:15 AM)
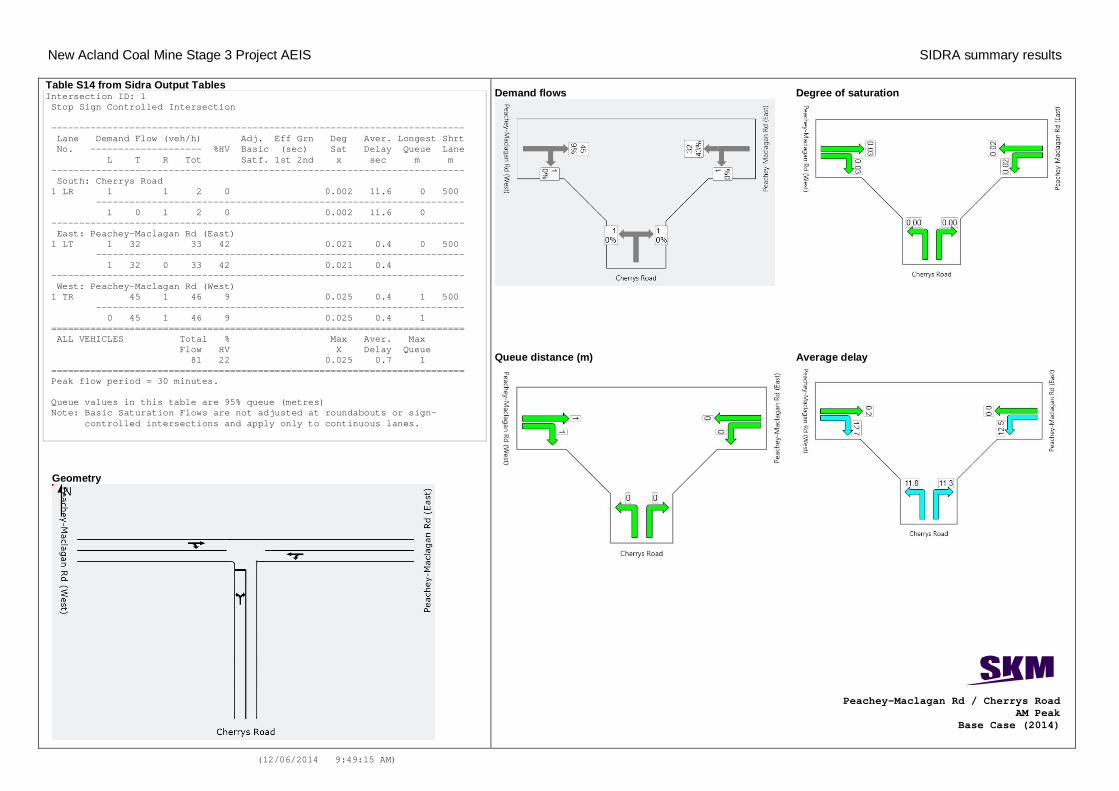
Table S14 from Sidra Output Tables Intersection ID: 1 Stop Sign Controlled Intersection -------------------------------------------------------------------------- Lane Demand Flow (veh/h) Adj. Eff Grn Deg Aver. Longest Shrt No. -------------------- %HV Basic (sec) Sat Delay Queue Lane L T R Tot Satf. 1st 2nd x sec m m -------------------------------------------------------------------------- South: Cherrys Road 1 LR 1 1 2 0 0.002 11.6 0 500 ------------------------------------------------------------------ 1 0 1 2 0 0.002 11.6 0 -------------------------------------------------------------------------- East: Peachey-Maclagan Rd (East) 1 LT 1 32 33 42 0.021 0.4 0 500 ------------------------------------------------------------------ 1 32 0 33 42 0.021 0.4 -------------------------------------------------------------------------- West: Peachey-Maclagan Rd (West) 1 TR 45 1 46 9 0.025 0.4 1 500 ------------------------------------------------------------------ 0 45 1 46 9 0.025 0.4 1 ========================================================================== ALL VEHICLES Total % Max Aver. Max Flow HV X Delay Queue 81 22 0.025 0.7 1 ========================================================================== Peak flow period = 30 minutes. Queue values in this table are 95% queue (metres) Note: Basic Saturation Flows are not adjusted at roundabouts or sign- controlled intersections and apply only to continuous lanes.
Geometry
Peachey-Maclagan Rd / Cherrys Road AM Peak
Base Case (2014)
Demand flows
Average delay Queue distance (m)
Degree of saturation
New Acland Coal Mine Stage 3 Project AEIS SIDRA summary results
(12/06/2014 9:49:15 AM)
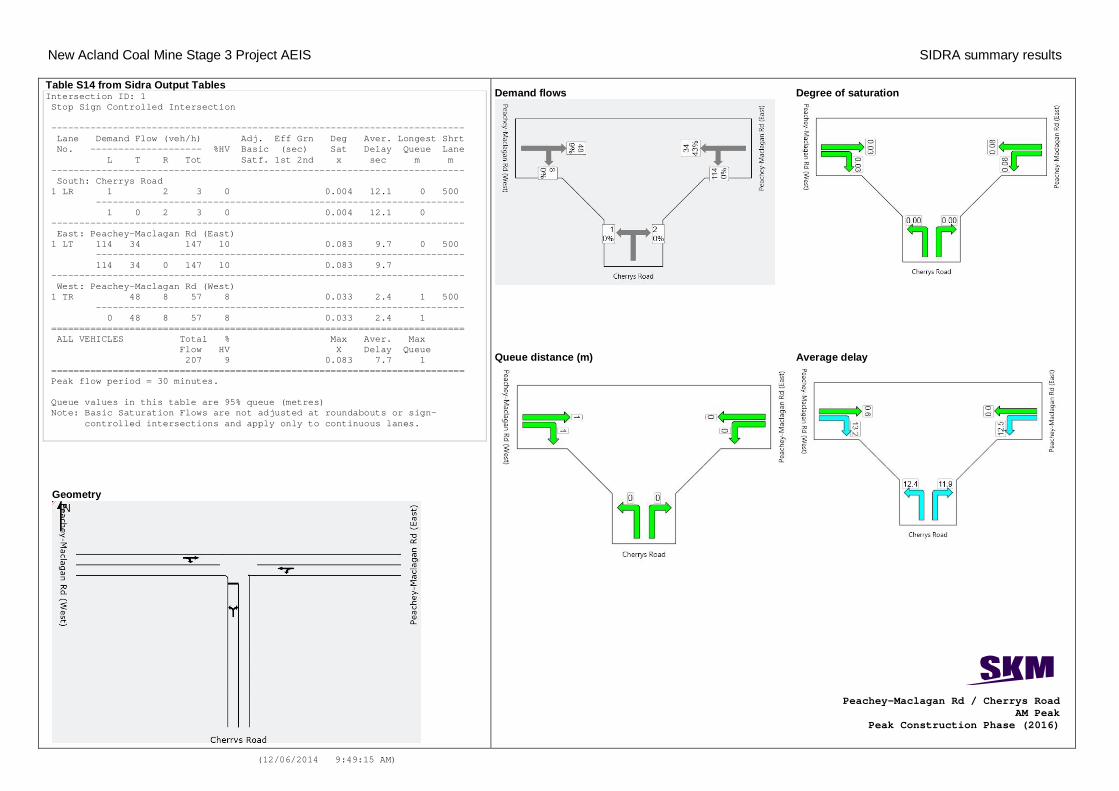
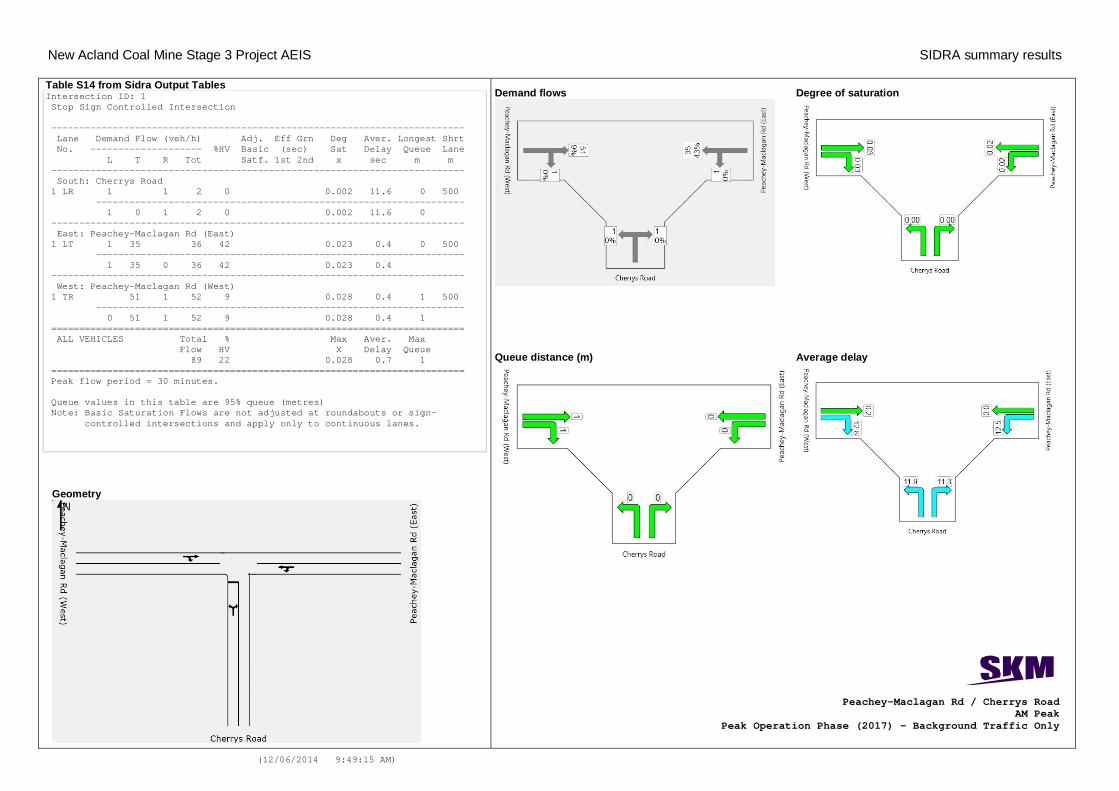
Table S14 from Sidra Output Tables Intersection ID: 1 Stop Sign Controlled Intersection -------------------------------------------------------------------------- Lane Demand Flow (veh/h) Adj. Eff Grn Deg Aver. Longest Shrt No. -------------------- %HV Basic (sec) Sat Delay Queue Lane L T R Tot Satf. 1st 2nd x sec m m -------------------------------------------------------------------------- South: Cherrys Road 1 LR 1 2 3 0 0.004 12.1 0 500 ------------------------------------------------------------------ 1 0 2 3 0 0.004 12.1 0 -------------------------------------------------------------------------- East: Peachey-Maclagan Rd (East) 1 LT 114 34 147 10 0.083 9.7 0 500 ------------------------------------------------------------------ 114 34 0 147 10 0.083 9.7 -------------------------------------------------------------------------- West: Peachey-Maclagan Rd (West) 1 TR 48 8 57 8 0.033 2.4 1 500 ------------------------------------------------------------------ 0 48 8 57 8 0.033 2.4 1 ========================================================================== ALL VEHICLES Total % Max Aver. Max Flow HV X Delay Queue 207 9 0.083 7.7 1 ========================================================================== Peak flow period = 30 minutes. Queue values in this table are 95% queue (metres) Note: Basic Saturation Flows are not adjusted at roundabouts or sign- controlled intersections and apply only to continuous lanes.
Geometry
Peachey-Maclagan Rd / Cherrys Road AM Peak
Peak Construction Phase (2016)
Demand flows
Average delay Queue distance (m)
Degree of saturation
New Acland Coal Mine Stage 3 Project AEIS SIDRA summary results
(12/06/2014 9:49:15 AM)
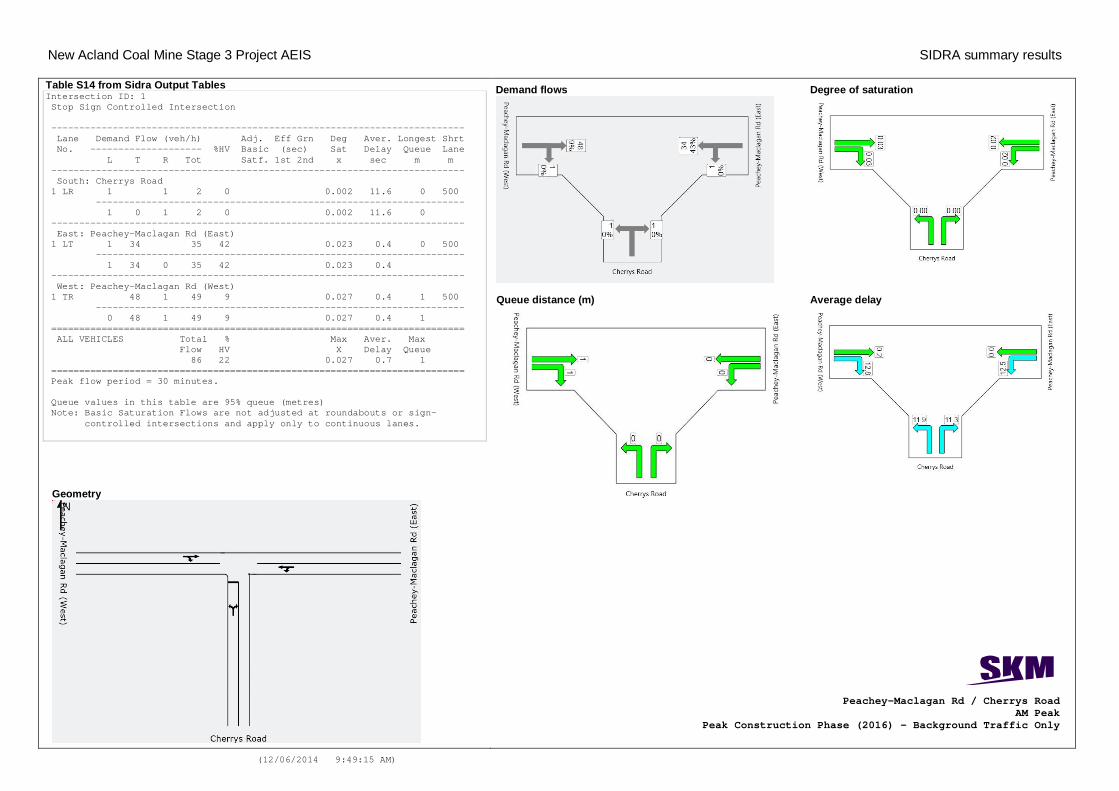
Table S14 from Sidra Output Tables Intersection ID: 1 Stop Sign Controlled Intersection -------------------------------------------------------------------------- Lane Demand Flow (veh/h) Adj. Eff Grn Deg Aver. Longest Shrt No. -------------------- %HV Basic (sec) Sat Delay Queue Lane L T R Tot Satf. 1st 2nd x sec m m -------------------------------------------------------------------------- South: Cherrys Road 1 LR 1 1 2 0 0.002 11.6 0 500 ------------------------------------------------------------------ 1 0 1 2 0 0.002 11.6 0 -------------------------------------------------------------------------- East: Peachey-Maclagan Rd (East) 1 LT 1 34 35 42 0.023 0.4 0 500 ------------------------------------------------------------------ 1 34 0 35 42 0.023 0.4 -------------------------------------------------------------------------- West: Peachey-Maclagan Rd (West) 1 TR 48 1 49 9 0.027 0.4 1 500 ------------------------------------------------------------------ 0 48 1 49 9 0.027 0.4 1 ========================================================================== ALL VEHICLES Total % Max Aver. Max Flow HV X Delay Queue 86 22 0.027 0.7 1 ========================================================================== Peak flow period = 30 minutes. Queue values in this table are 95% queue (metres) Note: Basic Saturation Flows are not adjusted at roundabouts or sign- controlled intersections and apply only to continuous lanes.
Geometry
Peachey-Maclagan Rd / Cherrys Road AM Peak
Peak Construction Phase (2016) – Background Traffic Only
Average delay
Demand flows
Queue distance (m)
Degree of saturation
New Acland Coal Mine Stage 3 Project AEIS SIDRA summary results
(12/06/2014 9:49:15 AM)
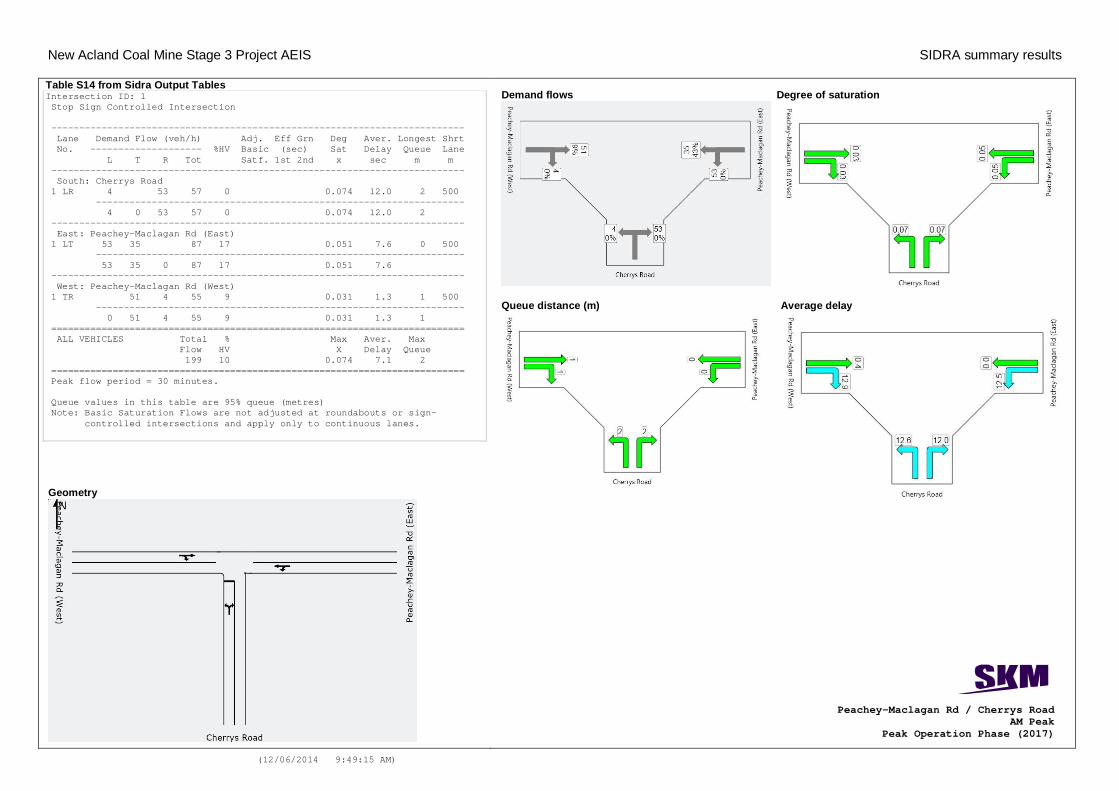
Table S14 from Sidra Output Tables Intersection ID: 1 Stop Sign Controlled Intersection -------------------------------------------------------------------------- Lane Demand Flow (veh/h) Adj. Eff Grn Deg Aver. Longest Shrt No. -------------------- %HV Basic (sec) Sat Delay Queue Lane L T R Tot Satf. 1st 2nd x sec m m -------------------------------------------------------------------------- South: Cherrys Road 1 LR 4 53 57 0 0.074 12.0 2 500 ------------------------------------------------------------------ 4 0 53 57 0 0.074 12.0 2 -------------------------------------------------------------------------- East: Peachey-Maclagan Rd (East) 1 LT 53 35 87 17 0.051 7.6 0 500 ------------------------------------------------------------------ 53 35 0 87 17 0.051 7.6 -------------------------------------------------------------------------- West: Peachey-Maclagan Rd (West) 1 TR 51 4 55 9 0.031 1.3 1 500 ------------------------------------------------------------------ 0 51 4 55 9 0.031 1.3 1 ========================================================================== ALL VEHICLES Total % Max Aver. Max Flow HV X Delay Queue 199 10 0.074 7.1 2 ========================================================================== Peak flow period = 30 minutes. Queue values in this table are 95% queue (metres) Note: Basic Saturation Flows are not adjusted at roundabouts or sign- controlled intersections and apply only to continuous lanes.
Geometry
Average delay
Demand flows
Queue distance (m)
Degree of saturation
Peachey-Maclagan Rd / Cherrys Road AM Peak
Peak Operation Phase (2017)
New Acland Coal Mine Stage 3 Project AEIS SIDRA summary results
(12/06/2014 9:49:15 AM)
Table S14 from Sidra Output Tables Intersection ID: 1 Stop Sign Controlled Intersection -------------------------------------------------------------------------- Lane Demand Flow (veh/h) Adj. Eff Grn Deg Aver. Longest Shrt No. -------------------- %HV Basic (sec) Sat Delay Queue Lane L T R Tot Satf. 1st 2nd x sec m m -------------------------------------------------------------------------- South: Cherrys Road 1 LR 1 1 2 0 0.002 11.6 0 500 ------------------------------------------------------------------ 1 0 1 2 0 0.002 11.6 0 -------------------------------------------------------------------------- East: Peachey-Maclagan Rd (East) 1 LT 1 35 36 42 0.023 0.4 0 500 ------------------------------------------------------------------ 1 35 0 36 42 0.023 0.4 -------------------------------------------------------------------------- West: Peachey-Maclagan Rd (West) 1 TR 51 1 52 9 0.028 0.4 1 500 ------------------------------------------------------------------ 0 51 1 52 9 0.028 0.4 1 ========================================================================== ALL VEHICLES Total % Max Aver. Max Flow HV X Delay Queue 89 22 0.028 0.7 1 ========================================================================== Peak flow period = 30 minutes. Queue values in this table are 95% queue (metres) Note: Basic Saturation Flows are not adjusted at roundabouts or sign- controlled intersections and apply only to continuous lanes.
Geometry
Peachey-Maclagan Rd / Cherrys Road AM Peak
Peak Operation Phase (2017) – Background Traffic Only
Demand flows
Average delay Queue distance (m)
Degree of saturation

New Acland Coal Mine Stage 3 Project AEIS SIDRA summary results
(12/06/2014 9:49:15 AM)
Table S14 from Sidra Output Tables Intersection ID: 1 Stop Sign Controlled Intersection -------------------------------------------------------------------------- Lane Demand Flow (veh/h) Adj. Eff Grn Deg Aver. Longest Shrt No. -------------------- %HV Basic (sec) Sat Delay Queue Lane L T R Tot Satf. 1st 2nd x sec m m -------------------------------------------------------------------------- South: Cherrys Road 1 LR 6 56 62 0 0.100 13.7 3 500 ------------------------------------------------------------------ 6 0 56 62 0 0.100 13.7 3 -------------------------------------------------------------------------- East: Peachey-Maclagan Rd (East) 1 LT 231 53 283 8 0.158 10.2 0 500 ------------------------------------------------------------------ 231 53 0 283 8 0.158 10.2 -------------------------------------------------------------------------- West: Peachey-Maclagan Rd (West) 1 TR 76 18 94 7 0.058 3.7 3 500 ------------------------------------------------------------------ 0 76 18 94 7 0.058 3.7 3 ========================================================================== ALL VEHICLES Total % Max Aver. Max Flow HV X Delay Queue 439 6 0.158 9.3 3 ========================================================================== Peak flow period = 30 minutes. Queue values in this table are 95% queue (metres) Note: Basic Saturation Flows are not adjusted at roundabouts or sign- controlled intersections and apply only to continuous lanes.
Geometry
Peachey-Maclagan Rd / Cherrys Road AM Peak
10 Year Horizon (2027)
Demand flows
Average delay Queue distance (m)
Degree of saturation
New Acland Coal Mine Stage 3 Project AEIS SIDRA summary results
(12/06/2014 9:49:15 AM)
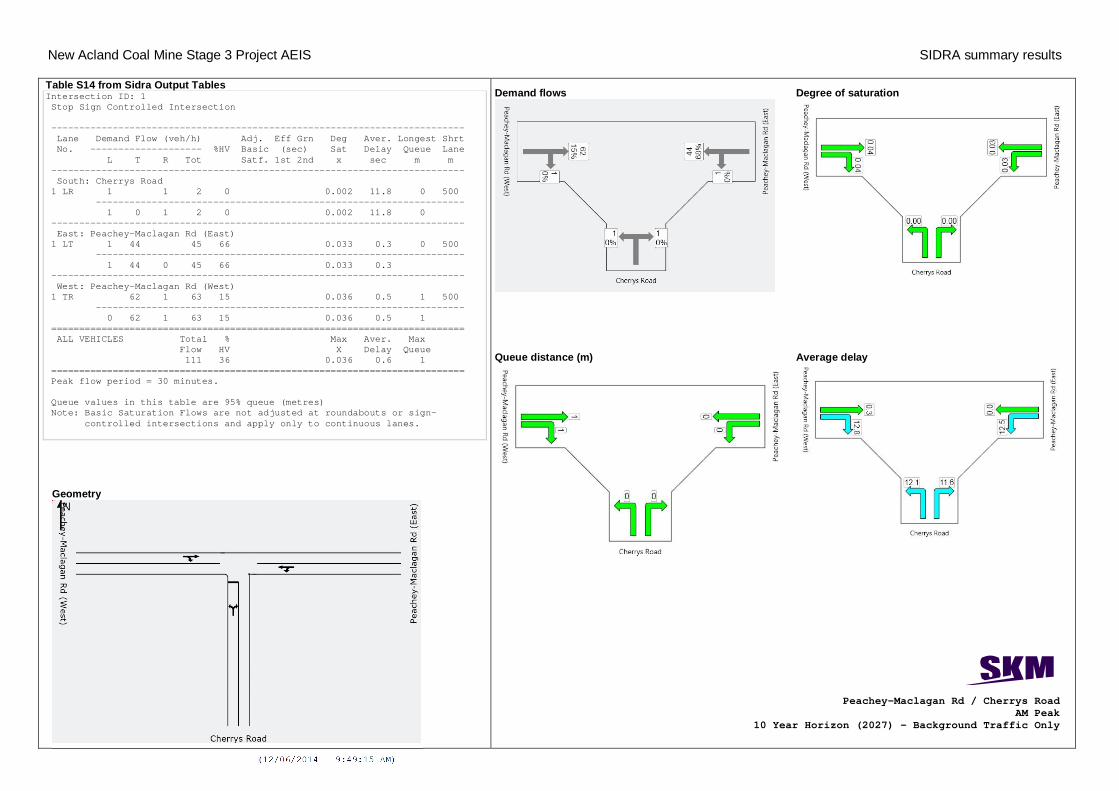
Table S14 from Sidra Output Tables Intersection ID: 1 Stop Sign Controlled Intersection -------------------------------------------------------------------------- Lane Demand Flow (veh/h) Adj. Eff Grn Deg Aver. Longest Shrt No. -------------------- %HV Basic (sec) Sat Delay Queue Lane L T R Tot Satf. 1st 2nd x sec m m -------------------------------------------------------------------------- South: Cherrys Road 1 LR 1 1 2 0 0.002 11.8 0 500 ------------------------------------------------------------------ 1 0 1 2 0 0.002 11.8 0 -------------------------------------------------------------------------- East: Peachey-Maclagan Rd (East) 1 LT 1 44 45 66 0.033 0.3 0 500 ------------------------------------------------------------------ 1 44 0 45 66 0.033 0.3 -------------------------------------------------------------------------- West: Peachey-Maclagan Rd (West) 1 TR 62 1 63 15 0.036 0.5 1 500 ------------------------------------------------------------------ 0 62 1 63 15 0.036 0.5 1 ========================================================================== ALL VEHICLES Total % Max Aver. Max Flow HV X Delay Queue 111 36 0.036 0.6 1 ========================================================================== Peak flow period = 30 minutes. Queue values in this table are 95% queue (metres) Note: Basic Saturation Flows are not adjusted at roundabouts or sign- controlled intersections and apply only to continuous lanes.
Geometry
Peachey-Maclagan Rd / Cherrys Road AM Peak
10 Year Horizon (2027) – Background Traffic Only
Demand flows
Average delay Queue distance (m)
Degree of saturation
New Acland Coal Mine Stage 3 Project AEIS SIDRA summary results
(12/06/2014 9:49:15 AM)
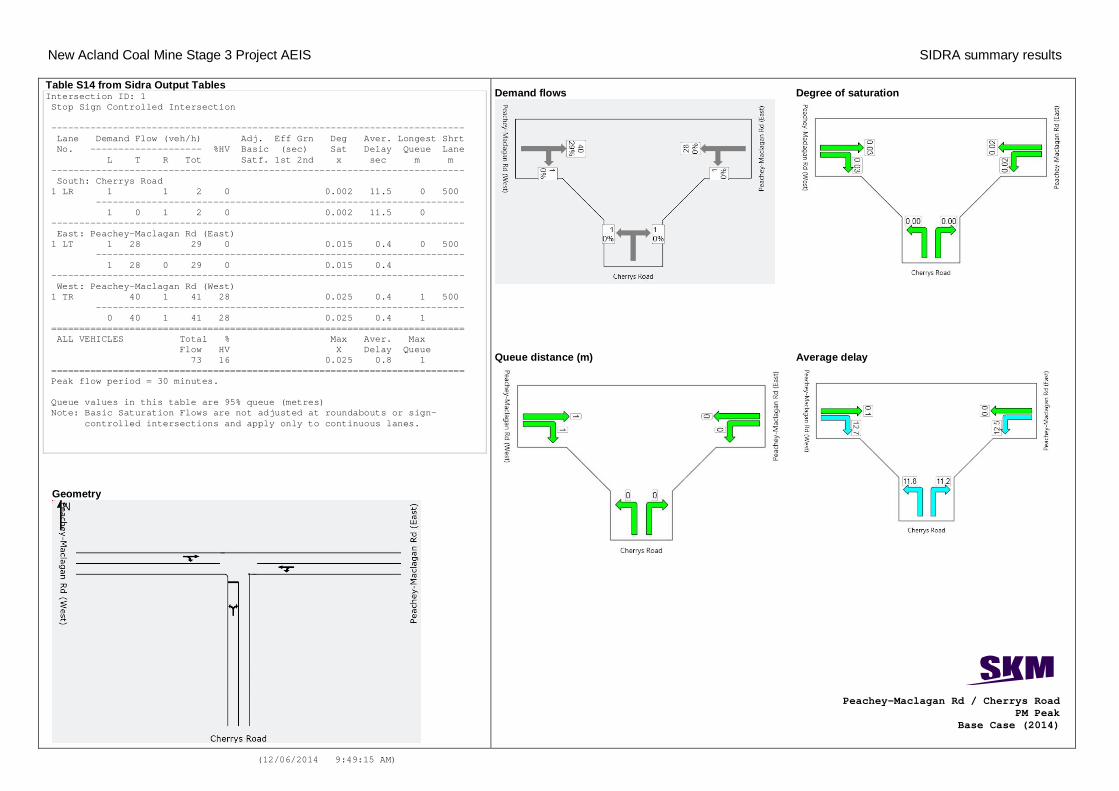
Table S14 from Sidra Output Tables Intersection ID: 1 Stop Sign Controlled Intersection -------------------------------------------------------------------------- Lane Demand Flow (veh/h) Adj. Eff Grn Deg Aver. Longest Shrt No. -------------------- %HV Basic (sec) Sat Delay Queue Lane L T R Tot Satf. 1st 2nd x sec m m -------------------------------------------------------------------------- South: Cherrys Road 1 LR 1 1 2 0 0.002 11.5 0 500 ------------------------------------------------------------------ 1 0 1 2 0 0.002 11.5 0 -------------------------------------------------------------------------- East: Peachey-Maclagan Rd (East) 1 LT 1 28 29 0 0.015 0.4 0 500 ------------------------------------------------------------------ 1 28 0 29 0 0.015 0.4 -------------------------------------------------------------------------- West: Peachey-Maclagan Rd (West) 1 TR 40 1 41 28 0.025 0.4 1 500 ------------------------------------------------------------------ 0 40 1 41 28 0.025 0.4 1 ========================================================================== ALL VEHICLES Total % Max Aver. Max Flow HV X Delay Queue 73 16 0.025 0.8 1 ========================================================================== Peak flow period = 30 minutes. Queue values in this table are 95% queue (metres) Note: Basic Saturation Flows are not adjusted at roundabouts or sign- controlled intersections and apply only to continuous lanes.
Geometry
Peachey-Maclagan Rd / Cherrys Road PM Peak
Base Case (2014)
Demand flows
Average delay Queue distance (m)
Degree of saturation

New Acland Coal Mine Stage 3 Project AEIS SIDRA summary results
(12/06/2014 9:49:15 AM)
Table S14 from Sidra Output Tables Intersection ID: 1 Stop Sign Controlled Intersection -------------------------------------------------------------------------- Lane Demand Flow (veh/h) Adj. Eff Grn Deg Aver. Longest Shrt No. -------------------- %HV Basic (sec) Sat Delay Queue Lane L T R Tot Satf. 1st 2nd x sec m m -------------------------------------------------------------------------- South: Cherrys Road 1 LR 8 114 122 0 0.150 11.7 4 500 ------------------------------------------------------------------ 8 0 114 122 0 0.150 11.7 4 -------------------------------------------------------------------------- East: Peachey-Maclagan Rd (East) 1 LT 2 31 33 0 0.017 0.8 0 500 ------------------------------------------------------------------ 2 31 0 33 0 0.017 0.8 -------------------------------------------------------------------------- West: Peachey-Maclagan Rd (West) 1 TR 43 1 44 28 0.027 0.4 1 500 ------------------------------------------------------------------ 0 43 1 44 28 0.027 0.4 1 ========================================================================== ALL VEHICLES Total % Max Aver. Max Flow HV X Delay Queue 199 6 0.150 7.4 4 ========================================================================== Peak flow period = 30 minutes. Queue values in this table are 95% queue (metres) Note: Basic Saturation Flows are not adjusted at roundabouts or sign- controlled intersections and apply only to continuous lanes.
Geometry
Peachey-Maclagan Rd / Cherrys Road PM Peak
Peak Construction Phase (2016)
Demand flows
Average delay Queue distance (m)
Degree of saturation

New Acland Coal Mine Stage 3 Project AEIS SIDRA summary results
(12/06/2014 9:49:15 AM)
Table S14 from Sidra Output Tables Intersection ID: 1 Stop Sign Controlled Intersection -------------------------------------------------------------------------- Lane Demand Flow (veh/h) Adj. Eff Grn Deg Aver. Longest Shrt No. -------------------- %HV Basic (sec) Sat Delay Queue Lane L T R Tot Satf. 1st 2nd x sec m m -------------------------------------------------------------------------- South: Cherrys Road 1 LR 1 1 2 0 0.002 11.5 0 500 ------------------------------------------------------------------ 1 0 1 2 0 0.002 11.5 0 -------------------------------------------------------------------------- East: Peachey-Maclagan Rd (East) 1 LT 1 31 32 0 0.016 0.4 0 500 ------------------------------------------------------------------ 1 31 0 32 0 0.016 0.4 -------------------------------------------------------------------------- West: Peachey-Maclagan Rd (West) 1 TR 43 1 44 28 0.027 0.4 1 500 ------------------------------------------------------------------ 0 43 1 44 28 0.027 0.4 1 ========================================================================== ALL VEHICLES Total % Max Aver. Max Flow HV X Delay Queue 78 16 0.027 0.7 1 ========================================================================== Peak flow period = 30 minutes. Queue values in this table are 95% queue (metres) Note: Basic Saturation Flows are not adjusted at roundabouts or sign- controlled intersections and apply only to continuous lanes.
Geometry
Peachey-Maclagan Rd / Cherrys Road PM Peak
Peak Construction Phase (2016) – Background Traffic Only
Demand flows
Average delay Queue distance (m)
Degree of saturation

New Acland Coal Mine Stage 3 Project AEIS SIDRA summary results
(12/06/2014 9:49:15 AM)
Table S14 from Sidra Output Tables Intersection ID: 1 Stop Sign Controlled Intersection -------------------------------------------------------------------------- Lane Demand Flow (veh/h) Adj. Eff Grn Deg Aver. Longest Shrt No. -------------------- %HV Basic (sec) Sat Delay Queue Lane L T R Tot Satf. 1st 2nd x sec m m -------------------------------------------------------------------------- South: Cherrys Road 1 LR 4 53 57 0 0.073 11.9 2 500 ------------------------------------------------------------------ 4 0 53 57 0 0.073 11.9 2 -------------------------------------------------------------------------- East: Peachey-Maclagan Rd (East) 1 LT 53 32 84 0 0.045 7.8 0 500 ------------------------------------------------------------------ 53 32 0 84 0 0.045 7.8 -------------------------------------------------------------------------- West: Peachey-Maclagan Rd (West) 1 TR 44 4 48 26 0.030 1.4 1 500 ------------------------------------------------------------------ 0 44 4 48 26 0.030 1.4 1 ========================================================================== ALL VEHICLES Total % Max Aver. Max Flow HV X Delay Queue 189 7 0.073 7.4 2 ========================================================================== Peak flow period = 30 minutes. Queue values in this table are 95% queue (metres) Note: Basic Saturation Flows are not adjusted at roundabouts or sign- controlled intersections and apply only to continuous lanes.
Geometry
Peachey-Maclagan Rd / Cherrys Road PM Peak
Peak Operation Phase (2017)
Demand flows
Average delay Queue distance (m)
Degree of saturation
New Acland Coal Mine Stage 3 Project AEIS SIDRA summary results
(12/06/2014 9:49:15 AM)
Table S14 from Sidra Output Tables Intersection ID: 1 Stop Sign Controlled Intersection -------------------------------------------------------------------------- Lane Demand Flow (veh/h) Adj. Eff Grn Deg Aver. Longest Shrt No. -------------------- %HV Basic (sec) Sat Delay Queue Lane L T R Tot Satf. 1st 2nd x sec m m -------------------------------------------------------------------------- South: Cherrys Road 1 LR 1 1 2 0 0.002 11.3 0 500 ------------------------------------------------------------------ 1 0 1 2 0 0.002 11.3 0 -------------------------------------------------------------------------- East: Peachey-Maclagan Rd (East) 1 LT 1 1 2 0 0.001 6.3 0 500 ------------------------------------------------------------------ 1 1 0 2 0 0.001 6.3 -------------------------------------------------------------------------- West: Peachey-Maclagan Rd (West) 1 TR 44 1 45 28 0.028 0.3 1 500 ------------------------------------------------------------------ 0 44 1 45 28 0.028 0.3 1 ========================================================================== ALL VEHICLES Total % Max Aver. Max Flow HV X Delay Queue 49 26 0.028 1.0 1 ========================================================================== Peak flow period = 30 minutes. Queue values in this table are 95% queue (metres) Note: Basic Saturation Flows are not adjusted at roundabouts or sign- controlled intersections and apply only to continuous lanes.
Geometry
Peachey-Maclagan Rd / Cherrys Road PM Peak
Peak Operation Phase (2017) – Background Traffic Only
Demand flows
Average delay Queue distance (m)
Degree of saturation
New Acland Coal Mine Stage 3 Project AEIS SIDRA summary results
(12/06/2014 9:49:15 AM)
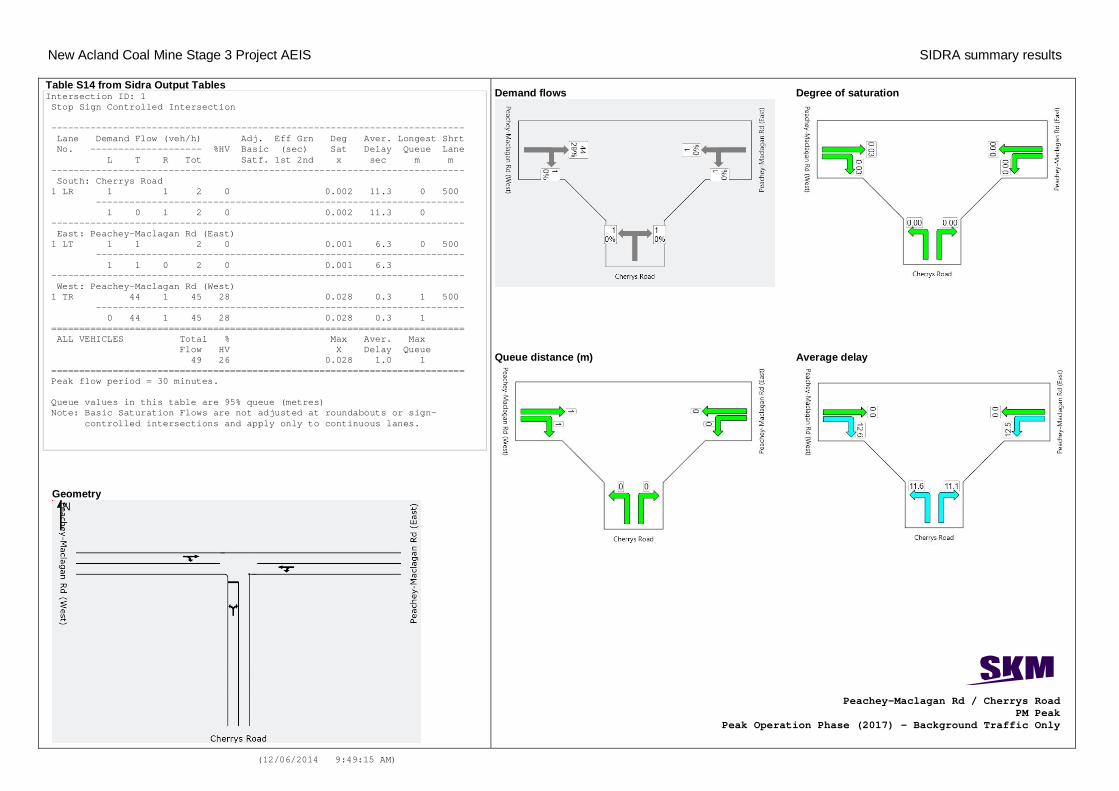
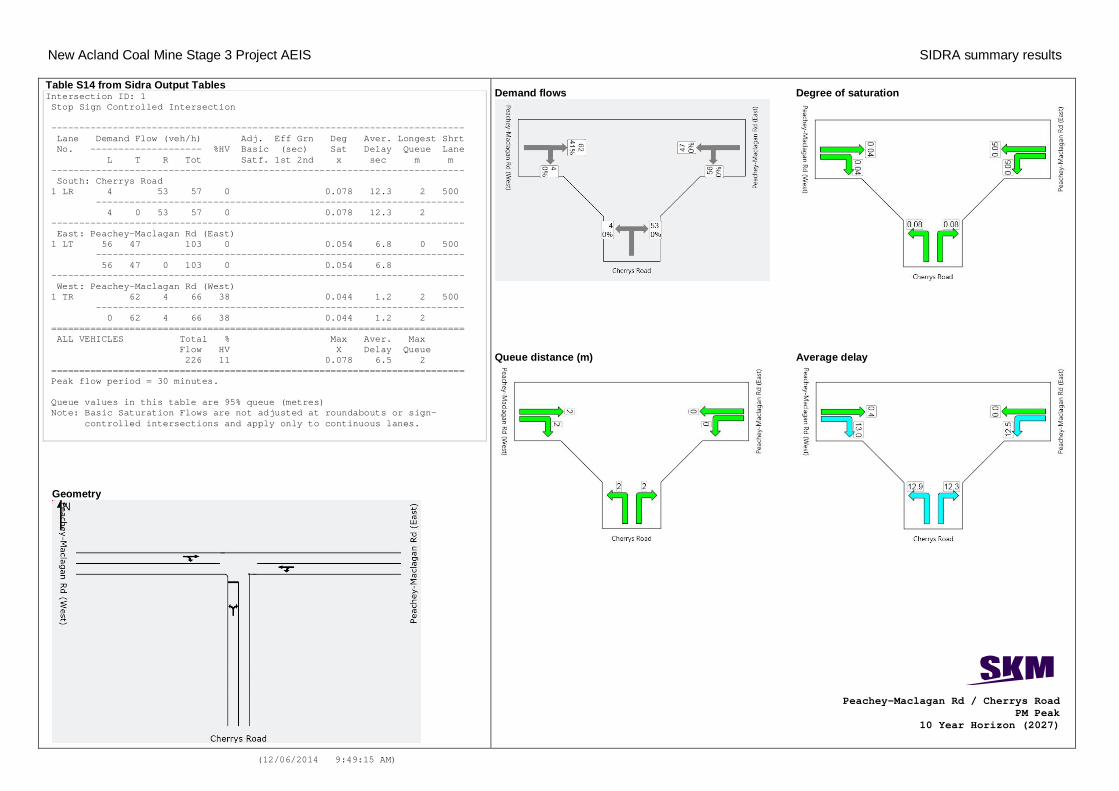
Table S14 from Sidra Output Tables Intersection ID: 1 Stop Sign Controlled Intersection -------------------------------------------------------------------------- Lane Demand Flow (veh/h) Adj. Eff Grn Deg Aver. Longest Shrt No. -------------------- %HV Basic (sec) Sat Delay Queue Lane L T R Tot Satf. 1st 2nd x sec m m -------------------------------------------------------------------------- South: Cherrys Road 1 LR 4 53 57 0 0.078 12.3 2 500 ------------------------------------------------------------------ 4 0 53 57 0 0.078 12.3 2 -------------------------------------------------------------------------- East: Peachey-Maclagan Rd (East) 1 LT 56 47 103 0 0.054 6.8 0 500 ------------------------------------------------------------------ 56 47 0 103 0 0.054 6.8 -------------------------------------------------------------------------- West: Peachey-Maclagan Rd (West) 1 TR 62 4 66 38 0.044 1.2 2 500 ------------------------------------------------------------------ 0 62 4 66 38 0.044 1.2 2 ========================================================================== ALL VEHICLES Total % Max Aver. Max Flow HV X Delay Queue 226 11 0.078 6.5 2 ========================================================================== Peak flow period = 30 minutes. Queue values in this table are 95% queue (metres) Note: Basic Saturation Flows are not adjusted at roundabouts or sign- controlled intersections and apply only to continuous lanes.
Geometry
Peachey-Maclagan Rd / Cherrys Road PM Peak
10 Year Horizon (2027)
Demand flows
Average delay Queue distance (m)
Degree of saturation
New Acland Coal Mine Stage 3 Project AEIS SIDRA summary results
(12/06/2014 9:49:15 AM)
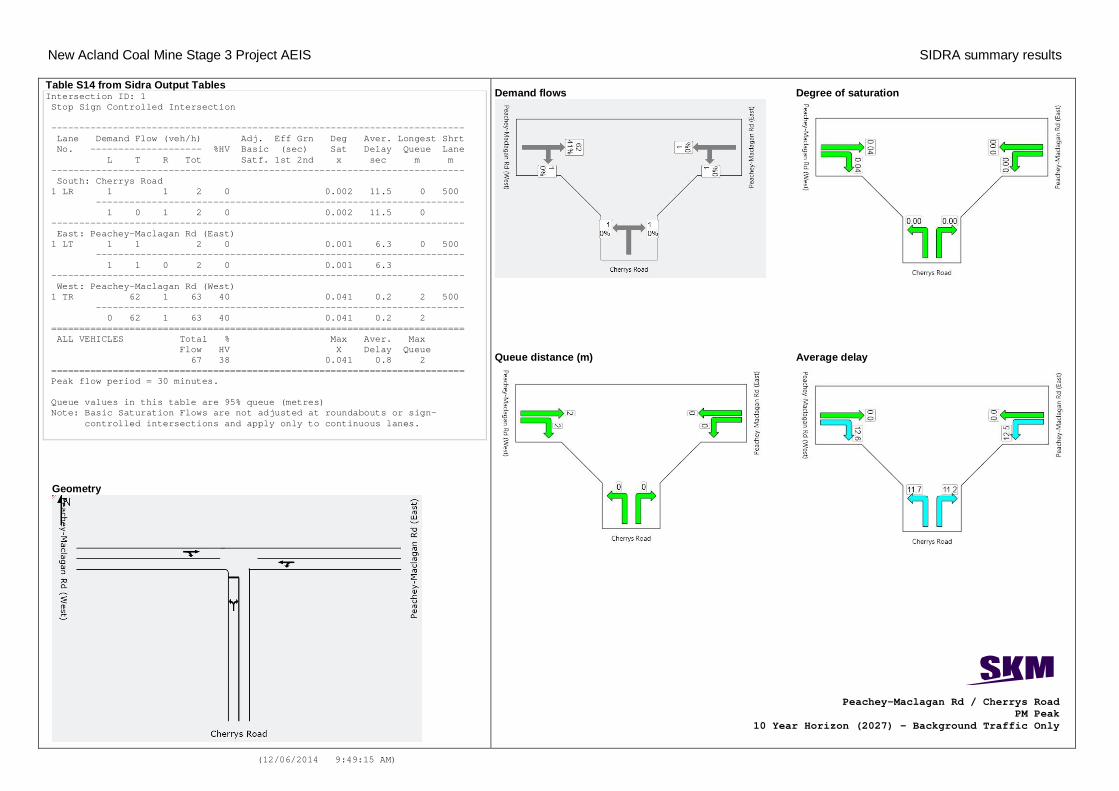
Table S14 from Sidra Output Tables Intersection ID: 1 Stop Sign Controlled Intersection -------------------------------------------------------------------------- Lane Demand Flow (veh/h) Adj. Eff Grn Deg Aver. Longest Shrt No. -------------------- %HV Basic (sec) Sat Delay Queue Lane L T R Tot Satf. 1st 2nd x sec m m -------------------------------------------------------------------------- South: Cherrys Road 1 LR 1 1 2 0 0.002 11.5 0 500 ------------------------------------------------------------------ 1 0 1 2 0 0.002 11.5 0 -------------------------------------------------------------------------- East: Peachey-Maclagan Rd (East) 1 LT 1 1 2 0 0.001 6.3 0 500 ------------------------------------------------------------------ 1 1 0 2 0 0.001 6.3 -------------------------------------------------------------------------- West: Peachey-Maclagan Rd (West) 1 TR 62 1 63 40 0.041 0.2 2 500 ------------------------------------------------------------------ 0 62 1 63 40 0.041 0.2 2 ========================================================================== ALL VEHICLES Total % Max Aver. Max Flow HV X Delay Queue 67 38 0.041 0.8 2 ========================================================================== Peak flow period = 30 minutes. Queue values in this table are 95% queue (metres) Note: Basic Saturation Flows are not adjusted at roundabouts or sign- controlled intersections and apply only to continuous lanes.
Geometry
Peachey-Maclagan Rd / Cherrys Road PM Peak
10 Year Horizon (2027) – Background Traffic Only
Demand flows
Average delay Queue distance (m)
Degree of saturation
New Acland Coal Mine Stage 3 Project AEIS SIDRA summary results
(12/06/2014 9:49:15 AM)
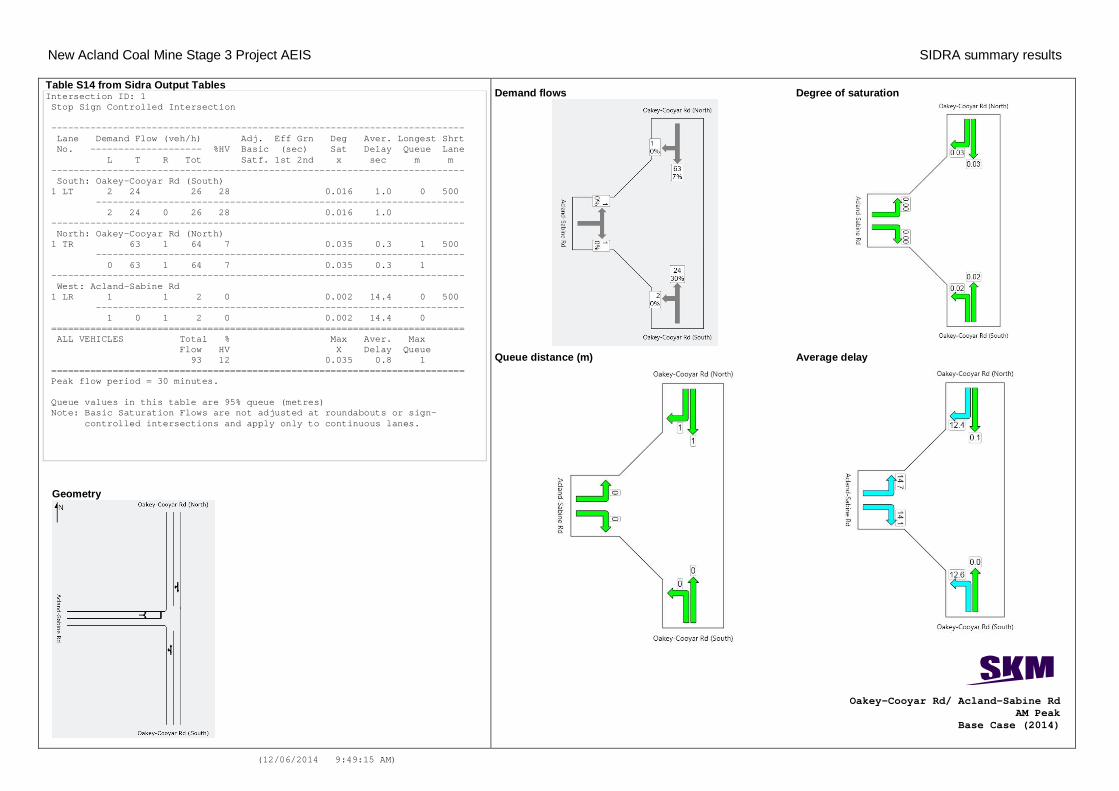
Table S14 from Sidra Output Tables Intersection ID: 1 Stop Sign Controlled Intersection -------------------------------------------------------------------------- Lane Demand Flow (veh/h) Adj. Eff Grn Deg Aver. Longest Shrt No. -------------------- %HV Basic (sec) Sat Delay Queue Lane L T R Tot Satf. 1st 2nd x sec m m -------------------------------------------------------------------------- South: Oakey-Cooyar Rd (South) 1 LT 2 24 26 28 0.016 1.0 0 500 ------------------------------------------------------------------ 2 24 0 26 28 0.016 1.0 -------------------------------------------------------------------------- North: Oakey-Cooyar Rd (North) 1 TR 63 1 64 7 0.035 0.3 1 500 ------------------------------------------------------------------ 0 63 1 64 7 0.035 0.3 1 -------------------------------------------------------------------------- West: Acland-Sabine Rd 1 LR 1 1 2 0 0.002 14.4 0 500 ------------------------------------------------------------------ 1 0 1 2 0 0.002 14.4 0 ========================================================================== ALL VEHICLES Total % Max Aver. Max Flow HV X Delay Queue 93 12 0.035 0.8 1 ========================================================================== Peak flow period = 30 minutes. Queue values in this table are 95% queue (metres) Note: Basic Saturation Flows are not adjusted at roundabouts or sign- controlled intersections and apply only to continuous lanes.
Geometry
Oakey-Cooyar Rd/ Acland-Sabine Rd AM Peak
Base Case (2014)
Demand flows
Average delay
Queue distance (m)
Degree of saturation
New Acland Coal Mine Stage 3 Project AEIS SIDRA summary results
(12/06/2014 9:49:15 AM)
Table S14 from Sidra Output Tables Intersection ID: 1 Stop Sign Controlled Intersection -------------------------------------------------------------------------- Lane Demand Flow (veh/h) Adj. Eff Grn Deg Aver. Longest Shrt No. -------------------- %HV Basic (sec) Sat Delay Queue Lane L T R Tot Satf. 1st 2nd x sec m m -------------------------------------------------------------------------- South: Oakey-Cooyar Rd (South) 1 LT 2 140 142 6 0.076 0.2 0 500 ------------------------------------------------------------------ 2 140 0 142 6 0.076 0.2 -------------------------------------------------------------------------- North: Oakey-Cooyar Rd (North) 1 TR 69 1 71 6 0.038 0.7 2 500 ------------------------------------------------------------------ 0 69 1 71 6 0.038 0.7 2 -------------------------------------------------------------------------- West: Acland-Sabine Rd 1 LR 1 1 2 0 0.003 15.2 0 500 ------------------------------------------------------------------ 1 0 1 2 0 0.003 15.2 0 ========================================================================== ALL VEHICLES Total % Max Aver. Max Flow HV X Delay Queue 215 6 0.076 0.5 2 ========================================================================== Peak flow period = 30 minutes. Queue values in this table are 95% queue (metres) Note: Basic Saturation Flows are not adjusted at roundabouts or sign- controlled intersections and apply only to continuous lanes.
Geometry
Oakey-Cooyar Rd/ Acland-Sabine Rd AM Peak
Peak Construction Phase (2016)
Demand flows
Average delay
Queue distance (m)
Degree of saturation
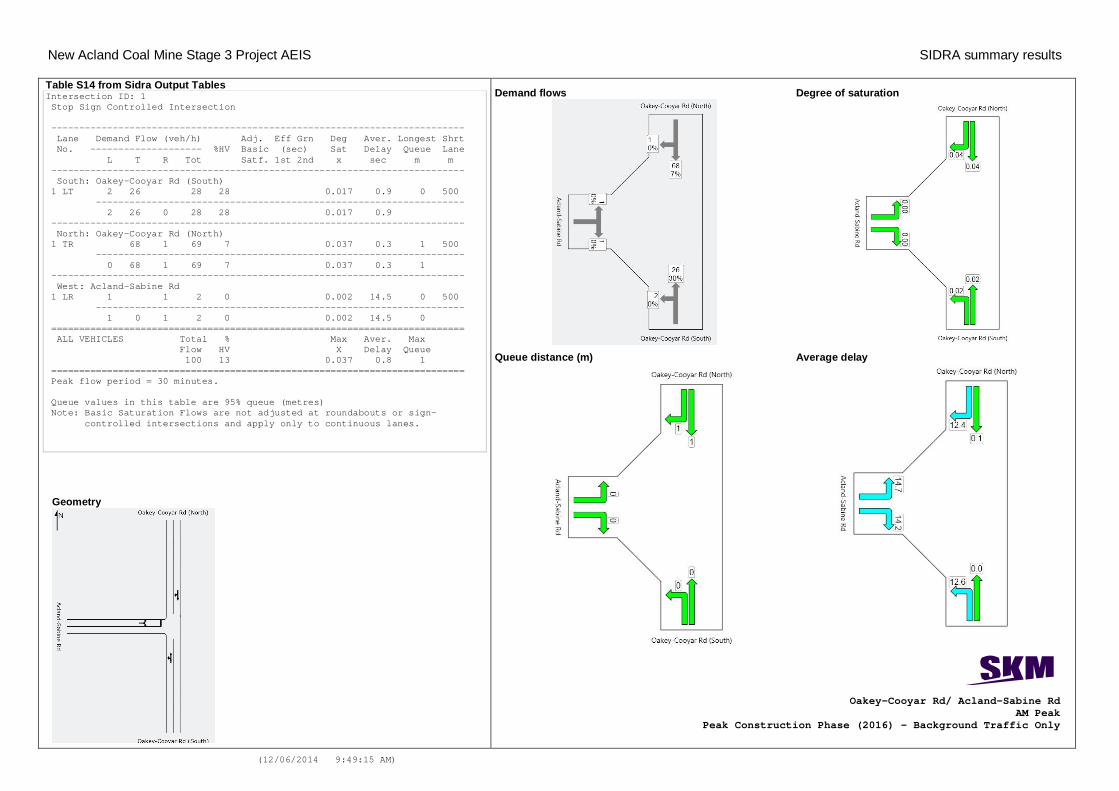
New Acland Coal Mine Stage 3 Project AEIS SIDRA summary results
(12/06/2014 9:49:15 AM)
Table S14 from Sidra Output Tables Intersection ID: 1 Stop Sign Controlled Intersection -------------------------------------------------------------------------- Lane Demand Flow (veh/h) Adj. Eff Grn Deg Aver. Longest Shrt No. -------------------- %HV Basic (sec) Sat Delay Queue Lane L T R Tot Satf. 1st 2nd x sec m m -------------------------------------------------------------------------- South: Oakey-Cooyar Rd (South) 1 LT 2 26 28 28 0.017 0.9 0 500 ------------------------------------------------------------------ 2 26 0 28 28 0.017 0.9 -------------------------------------------------------------------------- North: Oakey-Cooyar Rd (North) 1 TR 68 1 69 7 0.037 0.3 1 500 ------------------------------------------------------------------ 0 68 1 69 7 0.037 0.3 1 -------------------------------------------------------------------------- West: Acland-Sabine Rd 1 LR 1 1 2 0 0.002 14.5 0 500 ------------------------------------------------------------------ 1 0 1 2 0 0.002 14.5 0 ========================================================================== ALL VEHICLES Total % Max Aver. Max Flow HV X Delay Queue 100 13 0.037 0.8 1 ========================================================================== Peak flow period = 30 minutes. Queue values in this table are 95% queue (metres) Note: Basic Saturation Flows are not adjusted at roundabouts or sign- controlled intersections and apply only to continuous lanes.
Geometry
Oakey-Cooyar Rd/ Acland-Sabine Rd AM Peak
Peak Construction Phase (2016) – Background Traffic Only
Demand flows
Average delay
Queue distance (m)
Degree of saturation
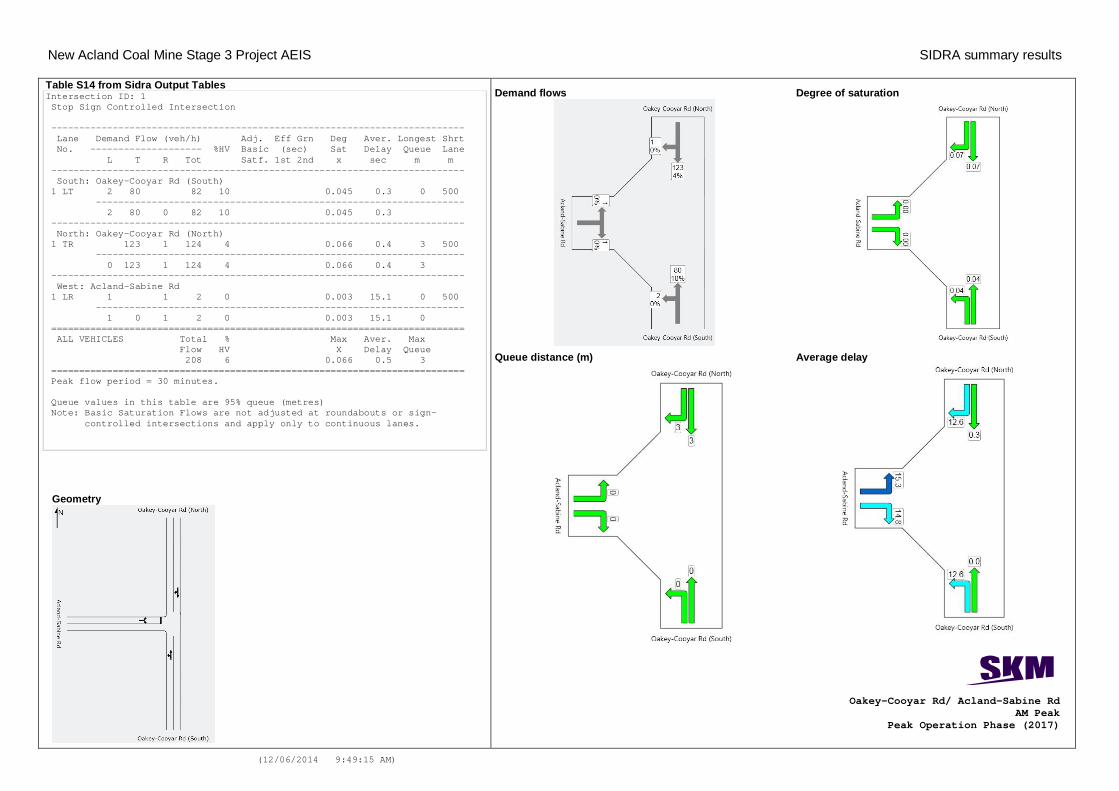
New Acland Coal Mine Stage 3 Project AEIS SIDRA summary results
(12/06/2014 9:49:15 AM)
Table S14 from Sidra Output Tables Intersection ID: 1 Stop Sign Controlled Intersection -------------------------------------------------------------------------- Lane Demand Flow (veh/h) Adj. Eff Grn Deg Aver. Longest Shrt No. -------------------- %HV Basic (sec) Sat Delay Queue Lane L T R Tot Satf. 1st 2nd x sec m m -------------------------------------------------------------------------- South: Oakey-Cooyar Rd (South) 1 LT 2 80 82 10 0.045 0.3 0 500 ------------------------------------------------------------------ 2 80 0 82 10 0.045 0.3 -------------------------------------------------------------------------- North: Oakey-Cooyar Rd (North) 1 TR 123 1 124 4 0.066 0.4 3 500 ------------------------------------------------------------------ 0 123 1 124 4 0.066 0.4 3 -------------------------------------------------------------------------- West: Acland-Sabine Rd 1 LR 1 1 2 0 0.003 15.1 0 500 ------------------------------------------------------------------ 1 0 1 2 0 0.003 15.1 0 ========================================================================== ALL VEHICLES Total % Max Aver. Max Flow HV X Delay Queue 208 6 0.066 0.5 3 ========================================================================== Peak flow period = 30 minutes. Queue values in this table are 95% queue (metres) Note: Basic Saturation Flows are not adjusted at roundabouts or sign- controlled intersections and apply only to continuous lanes.
Geometry
Oakey-Cooyar Rd/ Acland-Sabine Rd AM Peak
Peak Operation Phase (2017)
Demand flows
Average delay
Queue distance (m)
Degree of saturation
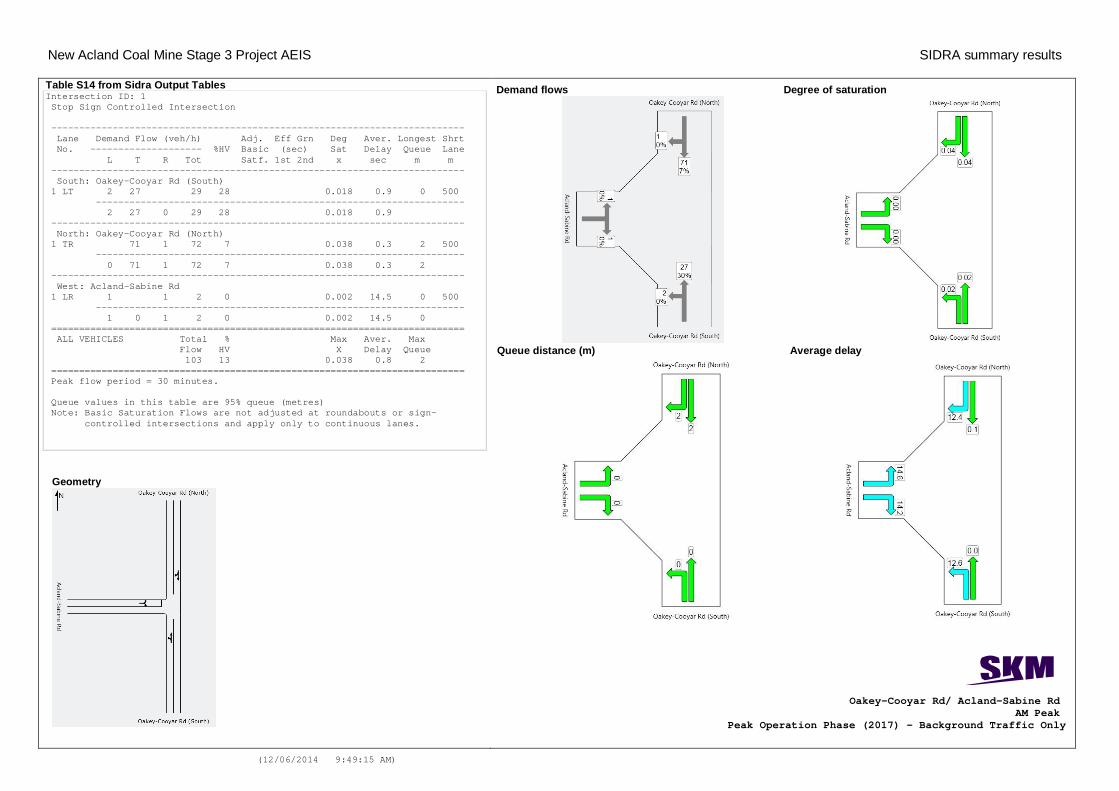
New Acland Coal Mine Stage 3 Project AEIS SIDRA summary results
(12/06/2014 9:49:15 AM)
Table S14 from Sidra Output Tables Intersection ID: 1 Stop Sign Controlled Intersection -------------------------------------------------------------------------- Lane Demand Flow (veh/h) Adj. Eff Grn Deg Aver. Longest Shrt No. -------------------- %HV Basic (sec) Sat Delay Queue Lane L T R Tot Satf. 1st 2nd x sec m m -------------------------------------------------------------------------- South: Oakey-Cooyar Rd (South) 1 LT 2 27 29 28 0.018 0.9 0 500 ------------------------------------------------------------------ 2 27 0 29 28 0.018 0.9 -------------------------------------------------------------------------- North: Oakey-Cooyar Rd (North) 1 TR 71 1 72 7 0.038 0.3 2 500 ------------------------------------------------------------------ 0 71 1 72 7 0.038 0.3 2 -------------------------------------------------------------------------- West: Acland-Sabine Rd 1 LR 1 1 2 0 0.002 14.5 0 500 ------------------------------------------------------------------ 1 0 1 2 0 0.002 14.5 0 ========================================================================== ALL VEHICLES Total % Max Aver. Max Flow HV X Delay Queue 103 13 0.038 0.8 2 ========================================================================== Peak flow period = 30 minutes. Queue values in this table are 95% queue (metres) Note: Basic Saturation Flows are not adjusted at roundabouts or sign- controlled intersections and apply only to continuous lanes.
Geometry
Oakey-Cooyar Rd/ Acland-Sabine Rd AM Peak
Peak Operation Phase (2017) – Background Traffic Only
Average delay
Demand flows
Queue distance (m)
Degree of saturation
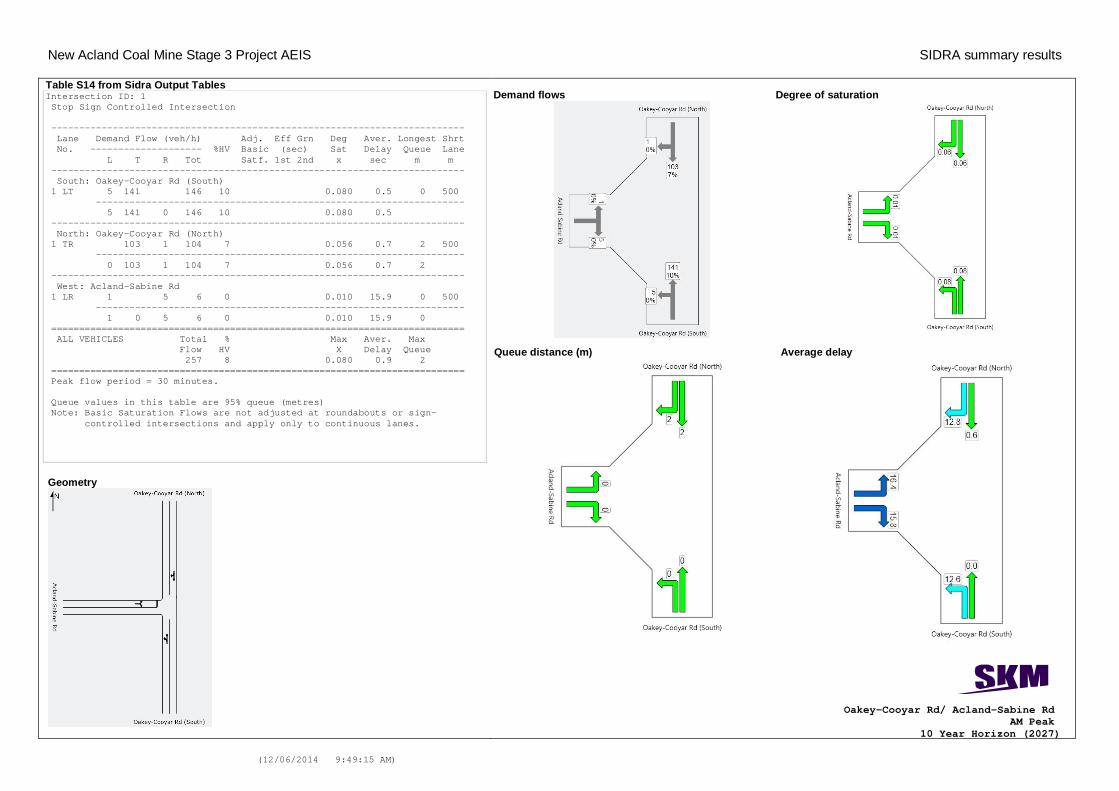
New Acland Coal Mine Stage 3 Project AEIS SIDRA summary results
(12/06/2014 9:49:15 AM)
Table S14 from Sidra Output Tables Intersection ID: 1 Stop Sign Controlled Intersection -------------------------------------------------------------------------- Lane Demand Flow (veh/h) Adj. Eff Grn Deg Aver. Longest Shrt No. -------------------- %HV Basic (sec) Sat Delay Queue Lane L T R Tot Satf. 1st 2nd x sec m m -------------------------------------------------------------------------- South: Oakey-Cooyar Rd (South) 1 LT 5 141 146 10 0.080 0.5 0 500 ------------------------------------------------------------------ 5 141 0 146 10 0.080 0.5 -------------------------------------------------------------------------- North: Oakey-Cooyar Rd (North) 1 TR 103 1 104 7 0.056 0.7 2 500 ------------------------------------------------------------------ 0 103 1 104 7 0.056 0.7 2 -------------------------------------------------------------------------- West: Acland-Sabine Rd 1 LR 1 5 6 0 0.010 15.9 0 500 ------------------------------------------------------------------ 1 0 5 6 0 0.010 15.9 0 ========================================================================== ALL VEHICLES Total % Max Aver. Max Flow HV X Delay Queue 257 8 0.080 0.9 2 ========================================================================== Peak flow period = 30 minutes. Queue values in this table are 95% queue (metres) Note: Basic Saturation Flows are not adjusted at roundabouts or sign- controlled intersections and apply only to continuous lanes.
Geometry
Average delay
Demand flows
Queue distance (m)
Degree of saturation
Oakey-Cooyar Rd/ Acland-Sabine Rd AM Peak
10 Year Horizon (2027)
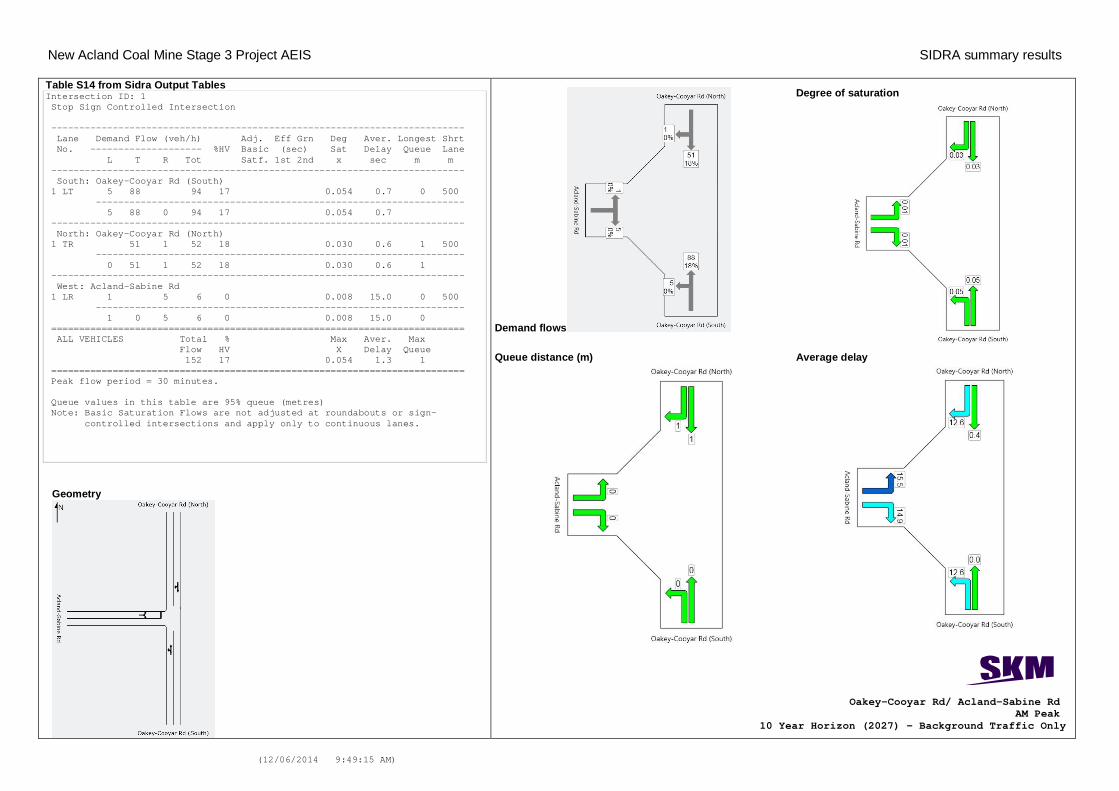
New Acland Coal Mine Stage 3 Project AEIS SIDRA summary results
(12/06/2014 9:49:15 AM)
Table S14 from Sidra Output Tables Intersection ID: 1 Stop Sign Controlled Intersection -------------------------------------------------------------------------- Lane Demand Flow (veh/h) Adj. Eff Grn Deg Aver. Longest Shrt No. -------------------- %HV Basic (sec) Sat Delay Queue Lane L T R Tot Satf. 1st 2nd x sec m m -------------------------------------------------------------------------- South: Oakey-Cooyar Rd (South) 1 LT 5 88 94 17 0.054 0.7 0 500 ------------------------------------------------------------------ 5 88 0 94 17 0.054 0.7 -------------------------------------------------------------------------- North: Oakey-Cooyar Rd (North) 1 TR 51 1 52 18 0.030 0.6 1 500 ------------------------------------------------------------------ 0 51 1 52 18 0.030 0.6 1 -------------------------------------------------------------------------- West: Acland-Sabine Rd 1 LR 1 5 6 0 0.008 15.0 0 500 ------------------------------------------------------------------ 1 0 5 6 0 0.008 15.0 0 ========================================================================== ALL VEHICLES Total % Max Aver. Max Flow HV X Delay Queue 152 17 0.054 1.3 1 ========================================================================== Peak flow period = 30 minutes. Queue values in this table are 95% queue (metres) Note: Basic Saturation Flows are not adjusted at roundabouts or sign- controlled intersections and apply only to continuous lanes.
Geometry
Oakey-Cooyar Rd/ Acland-Sabine Rd AM Peak
10 Year Horizon (2027) – Background Traffic Only
Demand flows
Average delay
Queue distance (m)
Degree of saturation
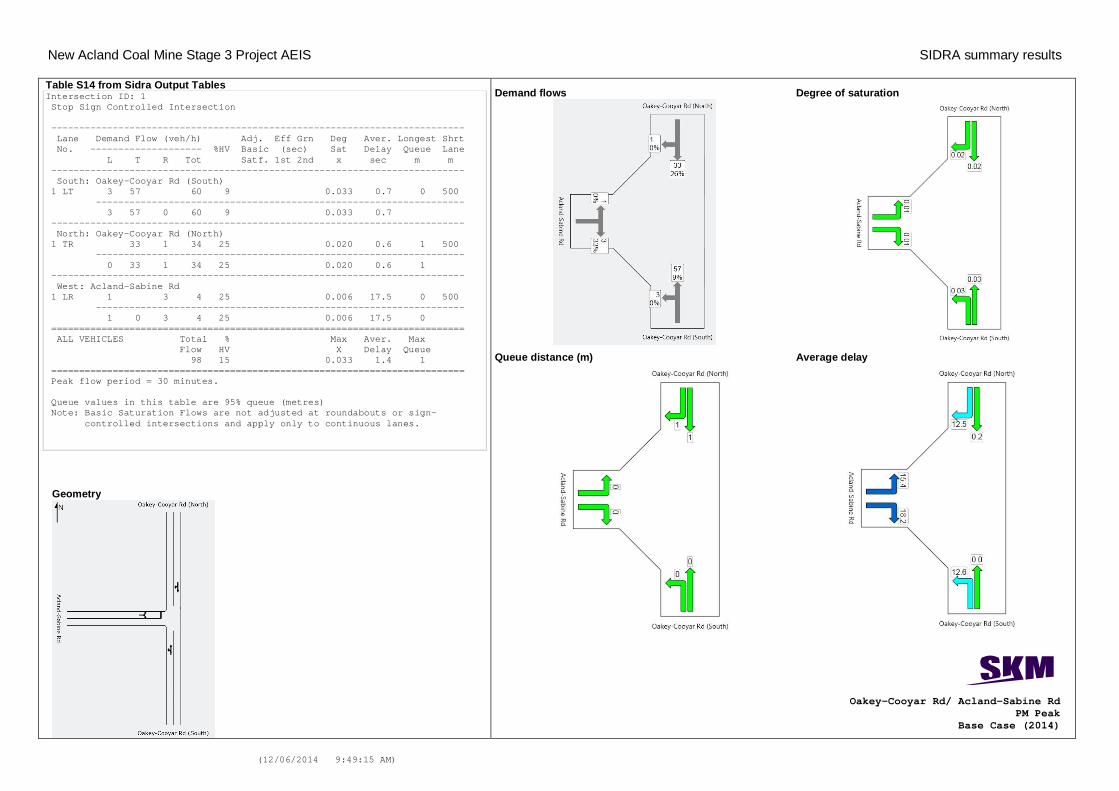
New Acland Coal Mine Stage 3 Project AEIS SIDRA summary results
(12/06/2014 9:49:15 AM)
Table S14 from Sidra Output Tables Intersection ID: 1 Stop Sign Controlled Intersection -------------------------------------------------------------------------- Lane Demand Flow (veh/h) Adj. Eff Grn Deg Aver. Longest Shrt No. -------------------- %HV Basic (sec) Sat Delay Queue Lane L T R Tot Satf. 1st 2nd x sec m m -------------------------------------------------------------------------- South: Oakey-Cooyar Rd (South) 1 LT 3 57 60 9 0.033 0.7 0 500 ------------------------------------------------------------------ 3 57 0 60 9 0.033 0.7 -------------------------------------------------------------------------- North: Oakey-Cooyar Rd (North) 1 TR 33 1 34 25 0.020 0.6 1 500 ------------------------------------------------------------------ 0 33 1 34 25 0.020 0.6 1 -------------------------------------------------------------------------- West: Acland-Sabine Rd 1 LR 1 3 4 25 0.006 17.5 0 500 ------------------------------------------------------------------ 1 0 3 4 25 0.006 17.5 0 ========================================================================== ALL VEHICLES Total % Max Aver. Max Flow HV X Delay Queue 98 15 0.033 1.4 1 ========================================================================== Peak flow period = 30 minutes. Queue values in this table are 95% queue (metres) Note: Basic Saturation Flows are not adjusted at roundabouts or sign- controlled intersections and apply only to continuous lanes.
Geometry
Oakey-Cooyar Rd/ Acland-Sabine Rd PM Peak
Base Case (2014)
Demand flows
Average delay
Queue distance (m)
Degree of saturation

New Acland Coal Mine Stage 3 Project AEIS SIDRA summary results
(12/06/2014 9:49:15 AM)
Table S14 from Sidra Output Tables Intersection ID: 1 Stop Sign Controlled Intersection -------------------------------------------------------------------------- Lane Demand Flow (veh/h) Adj. Eff Grn Deg Aver. Longest Shrt No. -------------------- %HV Basic (sec) Sat Delay Queue Lane L T R Tot Satf. 1st 2nd x sec m m -------------------------------------------------------------------------- South: Oakey-Cooyar Rd (South) 1 LT 3 63 66 9 0.036 0.6 0 500 ------------------------------------------------------------------ 3 63 0 66 9 0.036 0.6 -------------------------------------------------------------------------- North: Oakey-Cooyar Rd (North) 1 TR 148 1 149 6 0.080 0.3 3 500 ------------------------------------------------------------------ 0 148 1 149 6 0.080 0.3 3 -------------------------------------------------------------------------- West: Acland-Sabine Rd 1 LR 1 3 4 25 0.008 19.0 0 500 ------------------------------------------------------------------ 1 0 3 4 25 0.008 19.0 0 ========================================================================== ALL VEHICLES Total % Max Aver. Max Flow HV X Delay Queue 220 7 0.080 0.8 3 ========================================================================== Peak flow period = 30 minutes. Queue values in this table are 95% queue (metres) Note: Basic Saturation Flows are not adjusted at roundabouts or sign- controlled intersections and apply only to continuous lanes.
Geometry
Oakey-Cooyar Rd/ Acland-Sabine Rd PM Peak
Peak Construction Phase (2016)
Demand flows
Average delay
Queue distance (m)
Degree of saturation
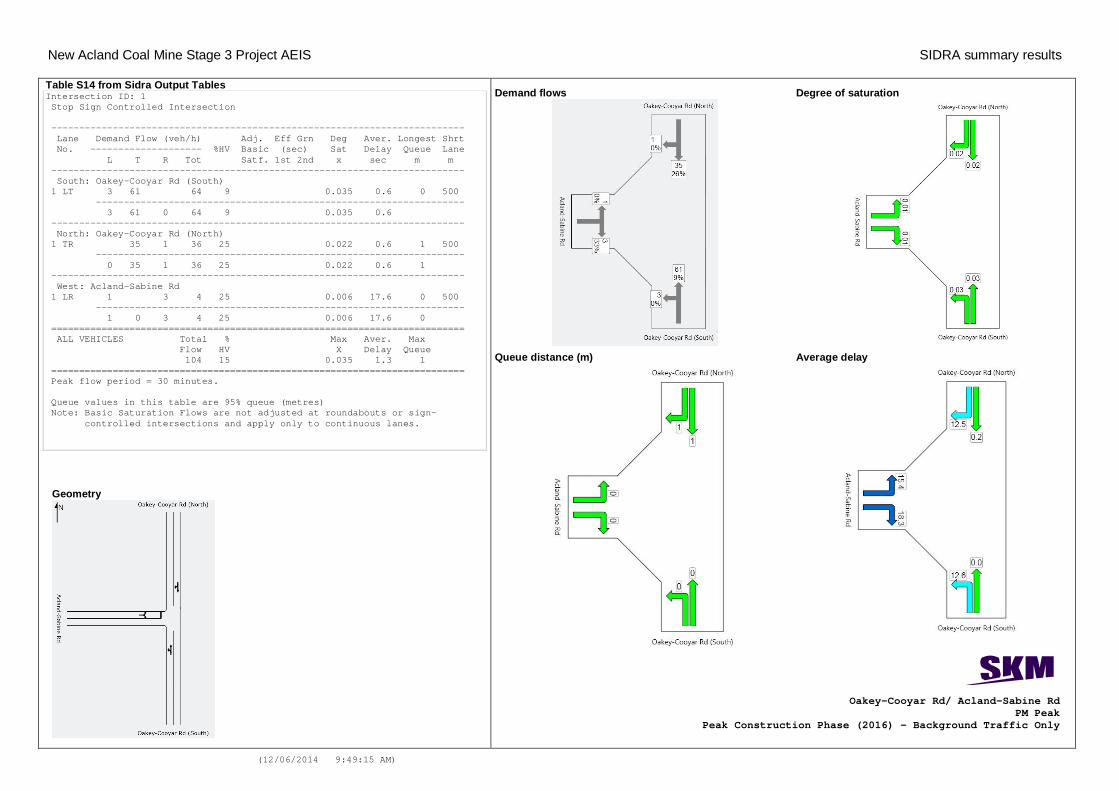
New Acland Coal Mine Stage 3 Project AEIS SIDRA summary results
(12/06/2014 9:49:15 AM)
Table S14 from Sidra Output Tables Intersection ID: 1 Stop Sign Controlled Intersection -------------------------------------------------------------------------- Lane Demand Flow (veh/h) Adj. Eff Grn Deg Aver. Longest Shrt No. -------------------- %HV Basic (sec) Sat Delay Queue Lane L T R Tot Satf. 1st 2nd x sec m m -------------------------------------------------------------------------- South: Oakey-Cooyar Rd (South) 1 LT 3 61 64 9 0.035 0.6 0 500 ------------------------------------------------------------------ 3 61 0 64 9 0.035 0.6 -------------------------------------------------------------------------- North: Oakey-Cooyar Rd (North) 1 TR 35 1 36 25 0.022 0.6 1 500 ------------------------------------------------------------------ 0 35 1 36 25 0.022 0.6 1 -------------------------------------------------------------------------- West: Acland-Sabine Rd 1 LR 1 3 4 25 0.006 17.6 0 500 ------------------------------------------------------------------ 1 0 3 4 25 0.006 17.6 0 ========================================================================== ALL VEHICLES Total % Max Aver. Max Flow HV X Delay Queue 104 15 0.035 1.3 1 ========================================================================== Peak flow period = 30 minutes. Queue values in this table are 95% queue (metres) Note: Basic Saturation Flows are not adjusted at roundabouts or sign- controlled intersections and apply only to continuous lanes.
Geometry
Oakey-Cooyar Rd/ Acland-Sabine Rd PM Peak
Peak Construction Phase (2016) – Background Traffic Only
Demand flows
Average delay
Queue distance (m)
Degree of saturation
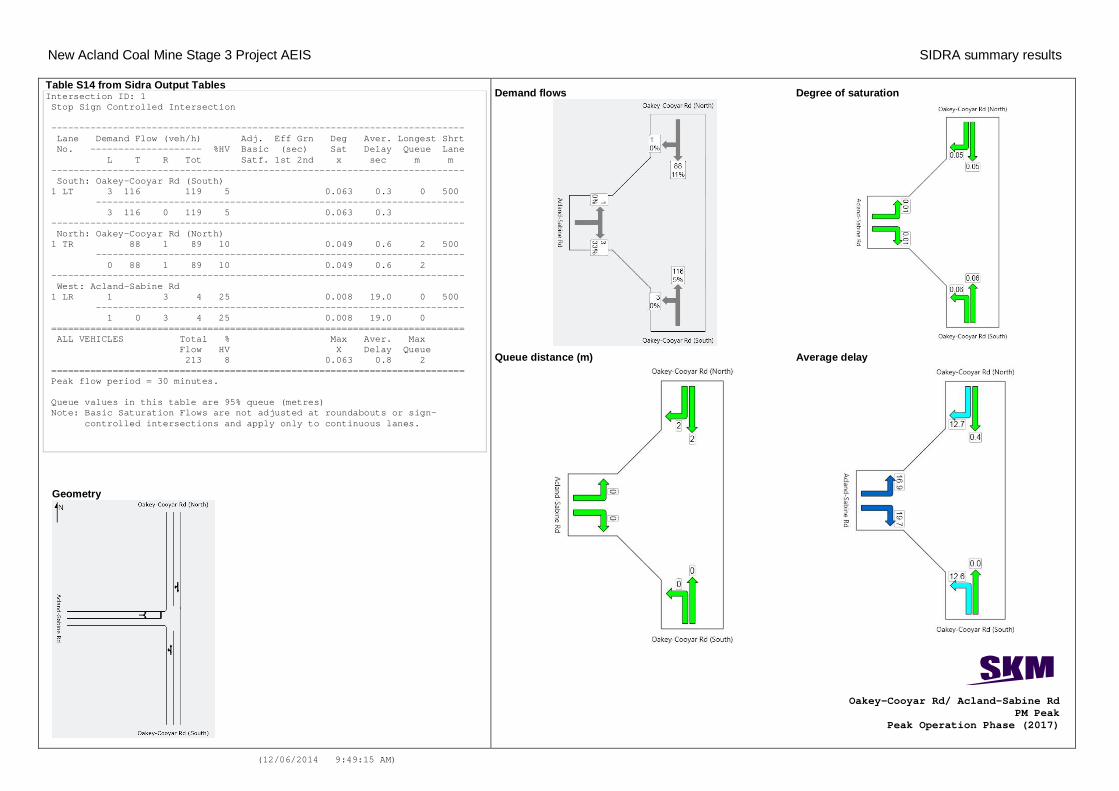
New Acland Coal Mine Stage 3 Project AEIS SIDRA summary results
(12/06/2014 9:49:15 AM)
Table S14 from Sidra Output Tables Intersection ID: 1 Stop Sign Controlled Intersection -------------------------------------------------------------------------- Lane Demand Flow (veh/h) Adj. Eff Grn Deg Aver. Longest Shrt No. -------------------- %HV Basic (sec) Sat Delay Queue Lane L T R Tot Satf. 1st 2nd x sec m m -------------------------------------------------------------------------- South: Oakey-Cooyar Rd (South) 1 LT 3 116 119 5 0.063 0.3 0 500 ------------------------------------------------------------------ 3 116 0 119 5 0.063 0.3 -------------------------------------------------------------------------- North: Oakey-Cooyar Rd (North) 1 TR 88 1 89 10 0.049 0.6 2 500 ------------------------------------------------------------------ 0 88 1 89 10 0.049 0.6 2 -------------------------------------------------------------------------- West: Acland-Sabine Rd 1 LR 1 3 4 25 0.008 19.0 0 500 ------------------------------------------------------------------ 1 0 3 4 25 0.008 19.0 0 ========================================================================== ALL VEHICLES Total % Max Aver. Max Flow HV X Delay Queue 213 8 0.063 0.8 2 ========================================================================== Peak flow period = 30 minutes. Queue values in this table are 95% queue (metres) Note: Basic Saturation Flows are not adjusted at roundabouts or sign- controlled intersections and apply only to continuous lanes.
Geometry
Oakey-Cooyar Rd/ Acland-Sabine Rd PM Peak
Peak Operation Phase (2017)
Demand flows
Average delay
Queue distance (m)
Degree of saturation
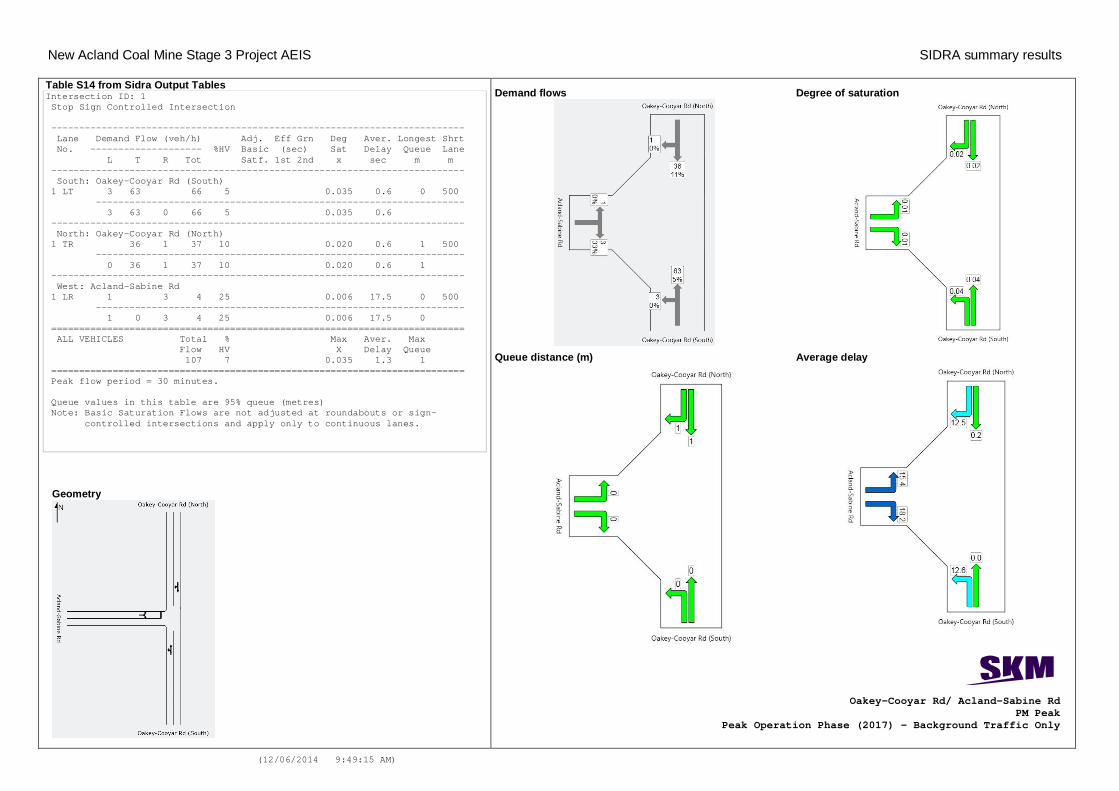
New Acland Coal Mine Stage 3 Project AEIS SIDRA summary results
(12/06/2014 9:49:15 AM)
Table S14 from Sidra Output Tables Intersection ID: 1 Stop Sign Controlled Intersection -------------------------------------------------------------------------- Lane Demand Flow (veh/h) Adj. Eff Grn Deg Aver. Longest Shrt No. -------------------- %HV Basic (sec) Sat Delay Queue Lane L T R Tot Satf. 1st 2nd x sec m m -------------------------------------------------------------------------- South: Oakey-Cooyar Rd (South) 1 LT 3 63 66 5 0.035 0.6 0 500 ------------------------------------------------------------------ 3 63 0 66 5 0.035 0.6 -------------------------------------------------------------------------- North: Oakey-Cooyar Rd (North) 1 TR 36 1 37 10 0.020 0.6 1 500 ------------------------------------------------------------------ 0 36 1 37 10 0.020 0.6 1 -------------------------------------------------------------------------- West: Acland-Sabine Rd 1 LR 1 3 4 25 0.006 17.5 0 500 ------------------------------------------------------------------ 1 0 3 4 25 0.006 17.5 0 ========================================================================== ALL VEHICLES Total % Max Aver. Max Flow HV X Delay Queue 107 7 0.035 1.3 1 ========================================================================== Peak flow period = 30 minutes. Queue values in this table are 95% queue (metres) Note: Basic Saturation Flows are not adjusted at roundabouts or sign- controlled intersections and apply only to continuous lanes.
Geometry
Oakey-Cooyar Rd/ Acland-Sabine Rd PM Peak
Peak Operation Phase (2017) – Background Traffic Only
Demand flows
Average delay
Queue distance (m)
Degree of saturation
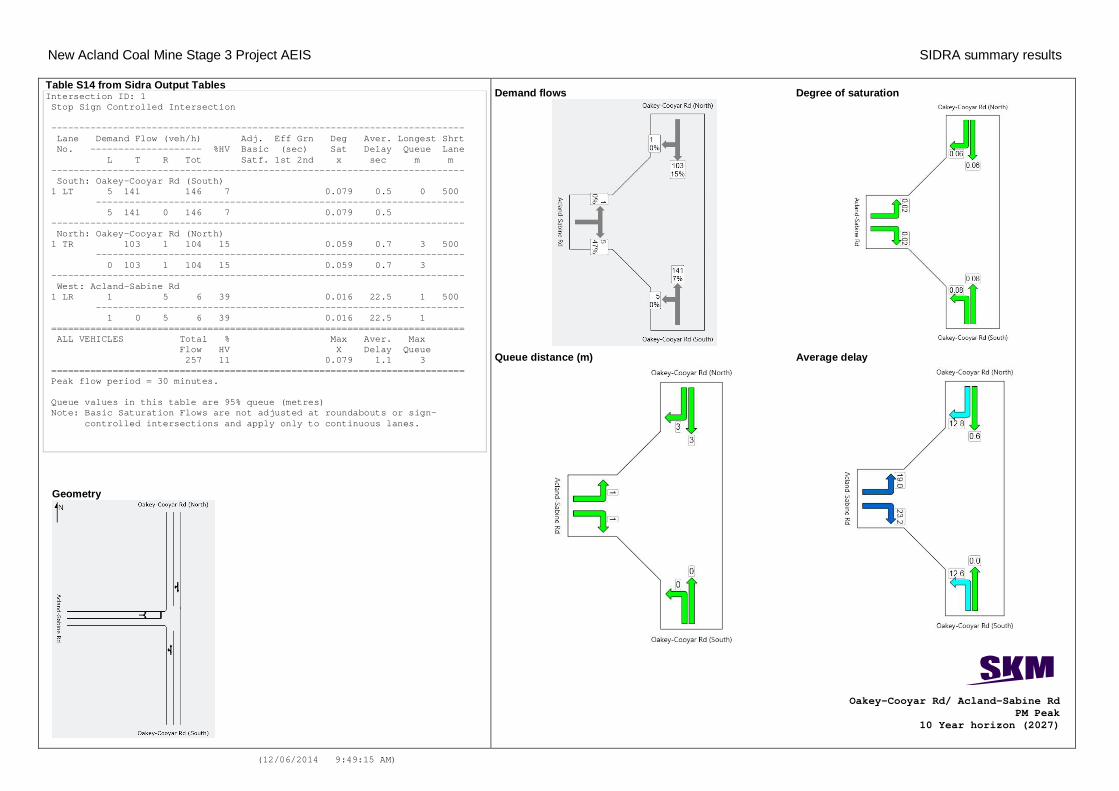
New Acland Coal Mine Stage 3 Project AEIS SIDRA summary results
(12/06/2014 9:49:15 AM)
Table S14 from Sidra Output Tables Intersection ID: 1 Stop Sign Controlled Intersection -------------------------------------------------------------------------- Lane Demand Flow (veh/h) Adj. Eff Grn Deg Aver. Longest Shrt No. -------------------- %HV Basic (sec) Sat Delay Queue Lane L T R Tot Satf. 1st 2nd x sec m m -------------------------------------------------------------------------- South: Oakey-Cooyar Rd (South) 1 LT 5 141 146 7 0.079 0.5 0 500 ------------------------------------------------------------------ 5 141 0 146 7 0.079 0.5 -------------------------------------------------------------------------- North: Oakey-Cooyar Rd (North) 1 TR 103 1 104 15 0.059 0.7 3 500 ------------------------------------------------------------------ 0 103 1 104 15 0.059 0.7 3 -------------------------------------------------------------------------- West: Acland-Sabine Rd 1 LR 1 5 6 39 0.016 22.5 1 500 ------------------------------------------------------------------ 1 0 5 6 39 0.016 22.5 1 ========================================================================== ALL VEHICLES Total % Max Aver. Max Flow HV X Delay Queue 257 11 0.079 1.1 3 ========================================================================== Peak flow period = 30 minutes. Queue values in this table are 95% queue (metres) Note: Basic Saturation Flows are not adjusted at roundabouts or sign- controlled intersections and apply only to continuous lanes.
Geometry
Oakey-Cooyar Rd/ Acland-Sabine Rd PM Peak
10 Year horizon (2027)
Demand flows
Average delay
Queue distance (m)
Degree of saturation
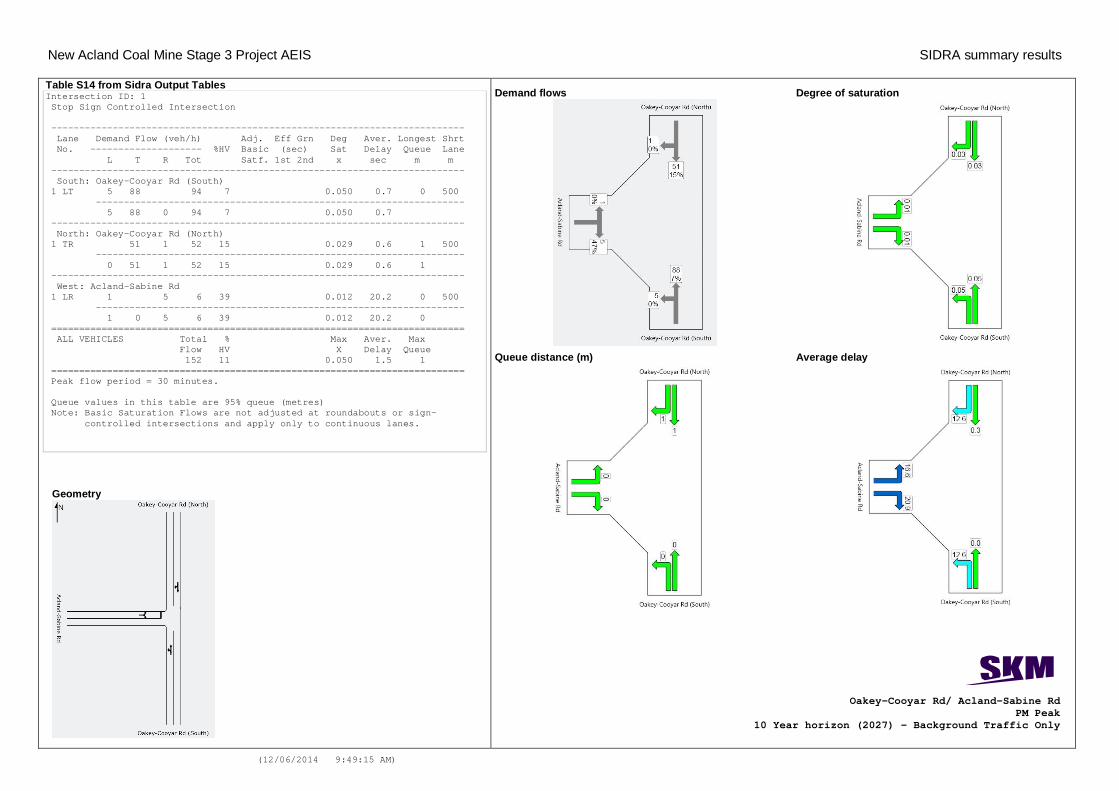
New Acland Coal Mine Stage 3 Project AEIS SIDRA summary results
(12/06/2014 9:49:15 AM)
Table S14 from Sidra Output Tables Intersection ID: 1 Stop Sign Controlled Intersection -------------------------------------------------------------------------- Lane Demand Flow (veh/h) Adj. Eff Grn Deg Aver. Longest Shrt No. -------------------- %HV Basic (sec) Sat Delay Queue Lane L T R Tot Satf. 1st 2nd x sec m m -------------------------------------------------------------------------- South: Oakey-Cooyar Rd (South) 1 LT 5 88 94 7 0.050 0.7 0 500 ------------------------------------------------------------------ 5 88 0 94 7 0.050 0.7 -------------------------------------------------------------------------- North: Oakey-Cooyar Rd (North) 1 TR 51 1 52 15 0.029 0.6 1 500 ------------------------------------------------------------------ 0 51 1 52 15 0.029 0.6 1 -------------------------------------------------------------------------- West: Acland-Sabine Rd 1 LR 1 5 6 39 0.012 20.2 0 500 ------------------------------------------------------------------ 1 0 5 6 39 0.012 20.2 0 ========================================================================== ALL VEHICLES Total % Max Aver. Max Flow HV X Delay Queue 152 11 0.050 1.5 1 ========================================================================== Peak flow period = 30 minutes. Queue values in this table are 95% queue (metres) Note: Basic Saturation Flows are not adjusted at roundabouts or sign- controlled intersections and apply only to continuous lanes.
Geometry
Oakey-Cooyar Rd/ Acland-Sabine Rd PM Peak
10 Year horizon (2027) – Background Traffic Only
Demand flows
Average delay
Queue distance (m)
Degree of saturation