Annual Report and Accounts 2016 - SEGRO/media/Files/S/Segro/documents/2017/SEGRO_AR16... · SEGRO...
176
Annual Report and Accounts 2016
Transcript of Annual Report and Accounts 2016 - SEGRO/media/Files/S/Segro/documents/2017/SEGRO_AR16... · SEGRO...

Annual Report and Accounts 2016

SEGRO Annual Report and Accounts 2016
Financial Recordp08
Board of Directorsp64
Overview
The right assets in the right places 01 Strategic Report
Financial Record 08Chairman’s Statement 09Business Review 10Market Overview 12Business Model 16Key Performance Indicators 20Chief Executive’s Review 22Regional Summary 32Operational Review 34Corporate Social Responsibility 40Financial Review 48Principal Risks 54 Governance
Chairman’s Introduction 63Board of Directors 64Governance Framework 66Governance Report 67Nomination Committee Report 73Audit Committee Report 77Remuneration Committee Report 85Remuneration Policy 98Directors’ Report 103Statement of Directors’ Responsibilities 105 Financial Statements
Independent Auditor’s Report 107 to the Members of SEGRO plcGroup Income Statement 113Group Statement of 113 Comprehensive IncomeBalance Sheets 114Statements of Changes in Equity 115Cash Flow Statements 117Notes to the Financial Statements 118Five-Year Financial Results 169 Further Information
Financial Information 170Shareholder Information 171Glossary of Terms 172
The Directors present the Annual Report for the year ended 31 December 2016 which includes the strategic report, governance report and audited financial statements for the year. References to ‘SEGRO’, the ‘Group’, the ‘Company’, ‘we’ or ‘our’ are to SEGRO plc and/or its subsidiaries, or any of them as the context may require. Pages 08 to 61 inclusive, comprise the Strategic Report, pages 103 to 104 inclusive comprise the Directors’ Report and pages 85 to 97 inclusive comprise the Directors’ Remuneration Report, each of which have been drawn up and presented in accordance with English company law and the liabilities of the Directors in connection with these sections shall be subject to the limitations and restrictions provided by such law.
The Annual Report contains forward-looking statements.For further information see inside back cover.
Financial Statementsp106
Business Reviewp10
Chief Executive’s Reviewp22
Governancep62
Chairman’s Statementp09

01Strategic Report Governance Financial Statements
Overview
The right assets in the right placesOur warehouses play a crucial role in the operations of our
customers, enabling extraordinary things to happen.
Our big box warehouses are located on Europe’s major transport corridors, from which goods are distributed regionally, nationally and internationally. Our urban warehouses are located in and
around Europe’s major cities, allowing quick access to customers and easy access for companies’ workforces, and include workshops,
laboratories, data centres, showrooms and distribution facilities, among a wide variety of other uses.
The rise of e-commerce, in particular, has had a major influence on investor and occupier demand for warehousing: retailers are
having to reconfigure their supply chains to cater for both their store networks and consumers who buy products online and expect them
to be delivered quickly to locations convenient to them.
SEGRO is the only listed company to offer this combination and scale of big box and urban warehouses on a pan-European basis.
In response to this demand, we are reporting some of the strongest metrics in our recent history, with a record delivery of new
developments and a strong pipeline of new space under construction capable of driving growth for the coming years.
More information
° More information on SEGRO’s activities and performance can be found at www.SEGRO.com, including investor presentations and the 2016 Property Analysis Report which contains details of the portfolio.
° More details on our Responsible SEGRO initiatives, as well as our Corporate Social Responsibility Reports, can be found at www.SEGRO.com/csr.

02SEGRO Annual Report and Accounts 2016
An award winning design...
By being in the right placeBrompton’s workshop is located close to the A40, M40 and M25, with direct access to the heart of London – home to Brompton’s flagship store – as well as easy access to Heathrow from which the company can reach its 44 export markets.
° Brompton is a British success story, exporting its iconic folding bikes all over the world.
° Its headquarters, in Greenford, West London, ensures that Brompton maintains its historic links to London, is easily reached by its highly skilled workforce and allows the company to consolidate four parts of its business into a single property.
° The facility includes a viewing platform which allows Brompton customers to watch their personally-specified bikes being built.

03Strategic Report Governance Financial Statements
Overview
...accessible to millions

SEGRO Annual Report and Accounts 2016
04
° The 16,200 sq m facility was completed in 2016 and is fully let.
° The warehouse boasts strong sustainability credentials. Photovoltaic panels, water saving measures and air source heat pumps ensure that CO2 emissions are 40% less than building regulation requirements.
By being in the right placeGetting distribution centre configuration and location right is crucial for parcel delivery companies. This warehouse, minutes away from Heathrow Airport, allows rapid delivery to London and the South-East region, as well as easy and efficient distribution of international parcels.
Last minute gift...
05Strategic Report Governance Financial Statements
Overview
...last mile delivery

Supply chain efficiency...
06SEGRO Annual Report and Accounts 2016
° Volkswagen Group Polska is an importer of six car brands and is the official original spare parts supplier for Poland and Belarus.
° This new facility, ideally located next to the A2 motorway, has allowed Volkswagen Group Polska to increase the efficiency of its distribution network and to extend its Same Day Delivery service.
By being in the right placeSEGRO built a brand new, 32,000 sq m distribution facility for Volkswagen Group Polska in Poznan, Poland, within easy reach of its Polish dealership network.
SamochodyUżytkowe

...to keep Europe moving
Strategic Report Governance Financial Statements07
Overview
08SEGRO Annual Report and Accounts 2016
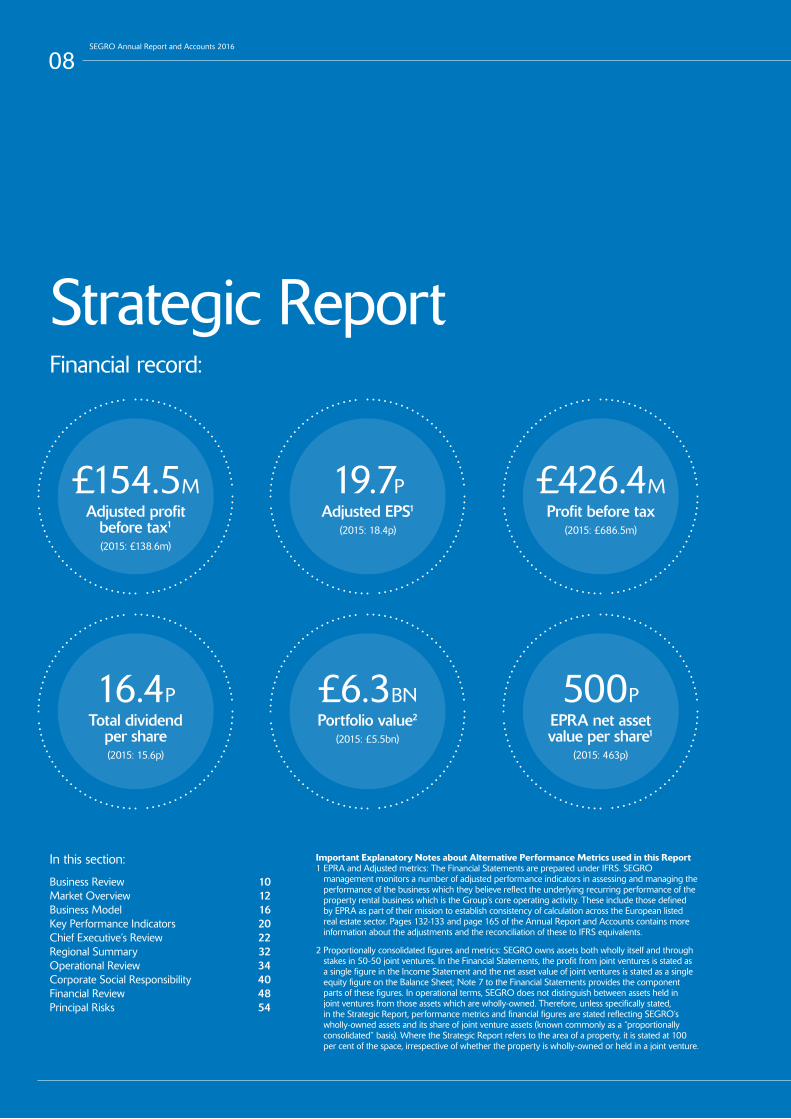
Financial record:
Important Explanatory Notes about Alternative Performance Metrics used in this Report1 EPRA and Adjusted metrics: The Financial Statements are prepared under IFRS. SEGRO
management monitors a number of adjusted performance indicators in assessing and managing the performance of the business which they believe reflect the underlying recurring performance of the property rental business which is the Group’s core operating activity. These include those defined by EPRA as part of their mission to establish consistency of calculation across the European listed real estate sector. Pages 132-133 and page 165 of the Annual Report and Accounts contains more information about the adjustments and the reconciliation of these to IFRS equivalents.
2 Proportionally consolidated figures and metrics: SEGRO owns assets both wholly itself and through stakes in 50-50 joint ventures. In the Financial Statements, the profit from joint ventures is stated as a single figure in the Income Statement and the net asset value of joint ventures is stated as a single equity figure on the Balance Sheet; Note 7 to the Financial Statements provides the component parts of these figures. In operational terms, SEGRO does not distinguish between assets held in joint ventures from those assets which are wholly-owned. Therefore, unless specifically stated, in the Strategic Report, performance metrics and financial figures are stated reflecting SEGRO’s wholly-owned assets and its share of joint venture assets (known commonly as a “proportionally consolidated” basis). Where the Strategic Report refers to the area of a property, it is stated at 100 per cent of the space, irrespective of whether the property is wholly-owned or held in a joint venture.
£154.5MAdjusted profit
before tax1 (2015: £138.6m)
19.7PAdjusted EPS1
(2015: 18.4p)
£426.4MProfit before tax
(2015: £686.5m)
500PEPRA net asset value per share1
(2015: 463p)
£6.3BNPortfolio value2
(2015: £5.5bn)
16.4PTotal dividend
per share (2015: 15.6p)
In this section:
Business Review 10Market Overview 12Business Model 16Key Performance Indicators 20Chief Executive’s Review 22Regional Summary 32Operational Review 34Corporate Social Responsibility 40Financial Review 48Principal Risks 54
Strategic Report
09Overview Governance Financial Statements
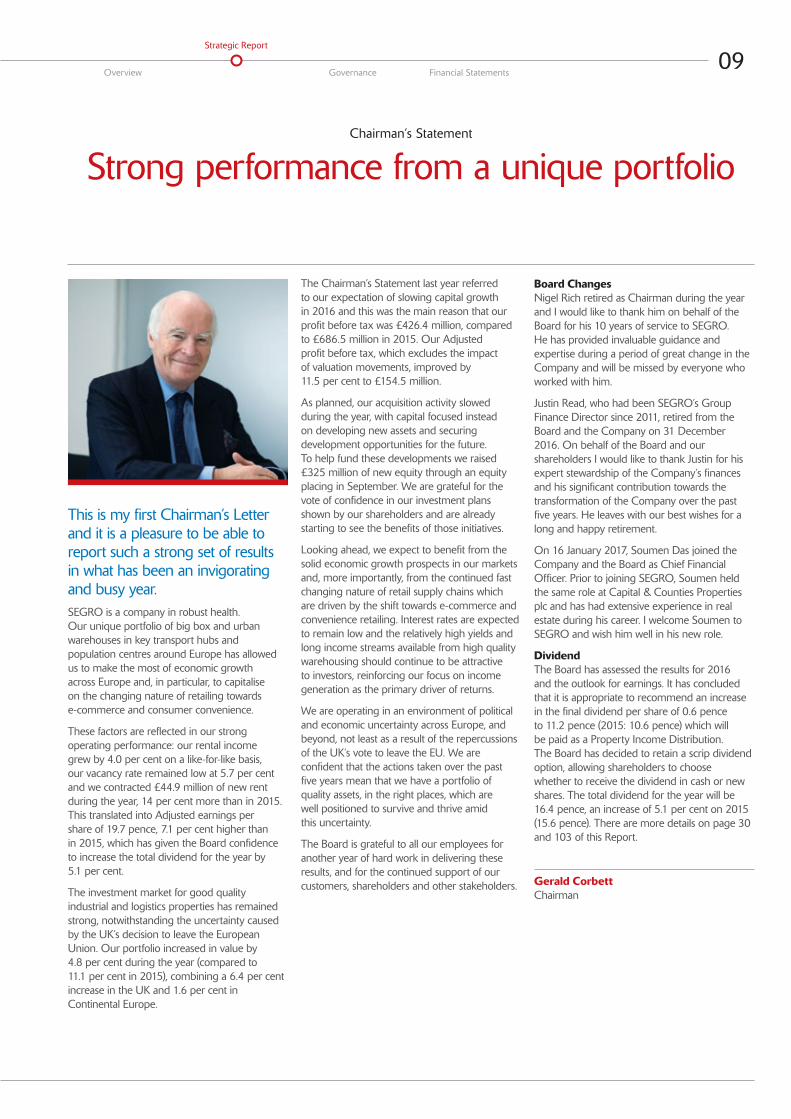
Strategic Report
This is my first Chairman’s Letter and it is a pleasure to be able to report such a strong set of results in what has been an invigorating and busy year. SEGRO is a company in robust health. Our unique portfolio of big box and urban warehouses in key transport hubs and population centres around Europe has allowed us to make the most of economic growth across Europe and, in particular, to capitalise on the changing nature of retailing towards e-commerce and consumer convenience.
These factors are reflected in our strong operating performance: our rental income grew by 4.0 per cent on a like-for-like basis, our vacancy rate remained low at 5.7 per cent and we contracted £44.9 million of new rent during the year, 14 per cent more than in 2015. This translated into Adjusted earnings per share of 19.7 pence, 7.1 per cent higher than in 2015, which has given the Board confidence to increase the total dividend for the year by 5.1 per cent.
The investment market for good quality industrial and logistics properties has remained strong, notwithstanding the uncertainty caused by the UK’s decision to leave the European Union. Our portfolio increased in value by 4.8 per cent during the year (compared to 11.1 per cent in 2015), combining a 6.4 per cent increase in the UK and 1.6 per cent in Continental Europe.
The Chairman’s Statement last year referred to our expectation of slowing capital growth in 2016 and this was the main reason that our profit before tax was £426.4 million, compared to £686.5 million in 2015. Our Adjusted profit before tax, which excludes the impact of valuation movements, improved by 11.5 per cent to £154.5 million.
As planned, our acquisition activity slowed during the year, with capital focused instead on developing new assets and securing development opportunities for the future. To help fund these developments we raised £325 million of new equity through an equity placing in September. We are grateful for the vote of confidence in our investment plans shown by our shareholders and are already starting to see the benefits of those initiatives.
Looking ahead, we expect to benefit from the solid economic growth prospects in our markets and, more importantly, from the continued fast changing nature of retail supply chains which are driven by the shift towards e-commerce and convenience retailing. Interest rates are expected to remain low and the relatively high yields and long income streams available from high quality warehousing should continue to be attractive to investors, reinforcing our focus on income generation as the primary driver of returns.
We are operating in an environment of political and economic uncertainty across Europe, and beyond, not least as a result of the repercussions of the UK’s vote to leave the EU. We are confident that the actions taken over the past five years mean that we have a portfolio of quality assets, in the right places, which are well positioned to survive and thrive amid this uncertainty.
The Board is grateful to all our employees for another year of hard work in delivering these results, and for the continued support of our customers, shareholders and other stakeholders.
Board ChangesNigel Rich retired as Chairman during the year and I would like to thank him on behalf of the Board for his 10 years of service to SEGRO. He has provided invaluable guidance and expertise during a period of great change in the Company and will be missed by everyone who worked with him.
Justin Read, who had been SEGRO’s Group Finance Director since 2011, retired from the Board and the Company on 31 December 2016. On behalf of the Board and our shareholders I would like to thank Justin for his expert stewardship of the Company’s finances and his significant contribution towards the transformation of the Company over the past five years. He leaves with our best wishes for a long and happy retirement.
On 16 January 2017, Soumen Das joined the Company and the Board as Chief Financial Officer. Prior to joining SEGRO, Soumen held the same role at Capital & Counties Properties plc and has had extensive experience in real estate during his career. I welcome Soumen to SEGRO and wish him well in his new role.
DividendThe Board has assessed the results for 2016 and the outlook for earnings. It has concluded that it is appropriate to recommend an increase in the final dividend per share of 0.6 pence to 11.2 pence (2015: 10.6 pence) which will be paid as a Property Income Distribution. The Board has decided to retain a scrip dividend option, allowing shareholders to choose whether to receive the dividend in cash or new shares. The total dividend for the year will be 16.4 pence, an increase of 5.1 per cent on 2015 (15.6 pence). There are more details on page 30 and 103 of this Report.
Gerald CorbettChairman
Chairman’s Statement
Strong performance from a unique portfolio

10SEGRO Annual Report and Accounts 2016
Business Review
The right assets in the right places
Urban warehouses (generally less than 10,000 sq m)
Proximity to major urban areas is of critical importance to many occupiers: retailers and parcel delivery companies must distribute goods efficiently to both store networks and homes and offices (the ‘last mile delivery’); businesses need premises which are easily accessible for both their customers and their employees; data centre operators need to be located close to users of the data (particularly financial services) to ensure the fastest possible data transfer speeds; and air cargo companies must be located close to major airports. Our smaller warehouses located in, or on the edge of, major cities in the UK and Continental Europe cater for all of these requirements.
Our products:
Big box warehouses (generally 10,000+ sq m)
Demand for large warehouses for inventory storage and regional, national and international distribution is growing, particularly amongst retailers. The cost of efficiently servicing both a store network and delivery of items direct to homes and offices, along with competitive pressures from discount and online-only retailers, has forced companies to restructure their supply chains. Our big box warehouse portfolio is situated in the major logistics corridors and hubs in the UK and Continental Europe to ensure efficient and rapid transport to our customers’ major markets.
11Overview Governance Financial Statements
Strategic Report
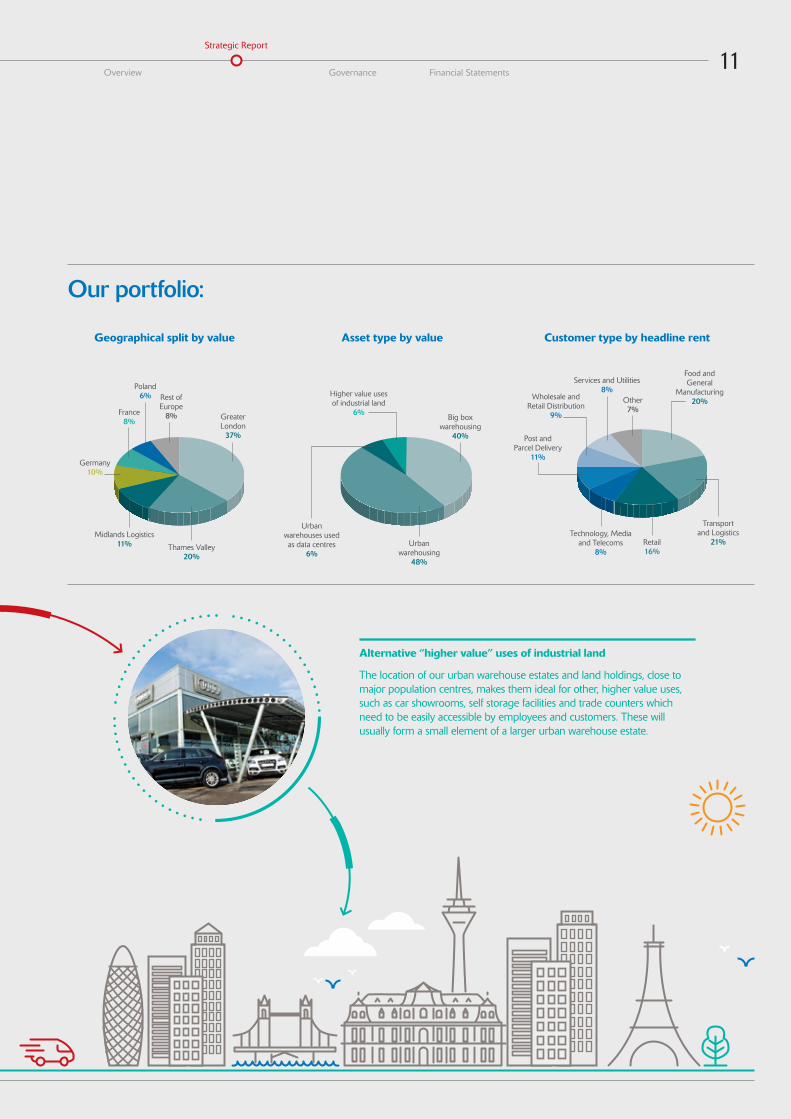
Our portfolio:
Geographical split by value
Rest of Europe
8%France 8%
Poland 6%
Thames Valley 20%
Germany 10%
Greater London
37%
Midlands Logistics 11%
Asset type by value
Urban warehousing
48%
Urban warehouses used as data centres
6%
Big box warehousing
40%
Higher value uses of industrial land
6%
Customer type by headline rent
Other 7%
Wholesale andRetail Distribution
9%
Services and Utilities 8%
Retail 16%
Transport and Logistics
21%
Post and Parcel Delivery
11%
Food and General
Manufacturing 20%
Technology, Media and Telecoms
8%
Alternative “higher value” uses of industrial land
The location of our urban warehouse estates and land holdings, close to major population centres, makes them ideal for other, higher value uses, such as car showrooms, self storage facilities and trade counters which need to be easily accessible by employees and customers. These will usually form a small element of a larger urban warehouse estate.

12SEGRO Annual Report and Accounts 2016
Market Overview
Our market drivers
The performance of real estate, like all asset classes, is driven by the interplay of demand and supply: investor demand for property assets and occupier demand for space, with performance dependent on the supply of properties to buy or lease to satisfy that demand.
Real estate as an investment assetIf investor demand increases, in the absence of additional supply, the value of real estate will rise; if demand wanes or supply increases, the value will fall. Real estate pricing is commonly expressed as a yield which is the rent payable for a building as a percentage of its value. Assuming rents remain static, as the value of real estate rises, its yield falls (often referred to as ‘yield compression’) and vice versa.
Real estate as an operating necessity As occupier demand increases, in the absence of additional supply, overall lease terms will become more expensive for the occupier, including (but not exclusively) an increase in rents. If demand for space falls, or supply increases ahead of occupier demand, overall lease terms, including rent, will become cheaper.
It is for this reason that the property market is considered cyclical: as investor or occupier demand increases, the returns from real estate improve and the supply of assets or space tends to increase to meet that demand. If supply increases too much, or demand starts to fall, supply can exceed demand and asset values and rents will fall until such time as demand matches or exceeds supply, at which point the cycle turns.
We are acutely aware of the cyclical nature of real estate and believe there are six main market factors which influence the performance of our portfolio.
Commentary:
Economic growth is an important driver of demand for space by occupiers, and our customer base spans most economic sectors. A supportive economic environment encourages businesses to grow and require additional space in which to operate. We expect the economies of all our markets to grow steadily, albeit forecasts are for the pace of UK economic growth to slow in the near-term compared to recent years. The UK vote to leave the European Union has undoubtedly caused greater uncertainty over the economic outlook for both the UK and the EU as a whole.
What it means for SEGRO:
° Continuing low vacancy rates.
° Good rental growth prospects, particularly in our urban warehouse portfolios in and on the edge of major European cities which often outperform national economies.
° Healthy occupier demand for newly developed space, both pre-let and speculatively built.
Steady economic outlook
GDP growth forecast for our major markets% p.a., 2016–18e
Source: OECD (16 February 2017)
Poland Germany EuroArea
UK ItalyFrance
1.6% 1.4% 1.1% 1.0%1.7%3.2%
13Overview Governance Financial Statements
Strategic Report
Commentary:
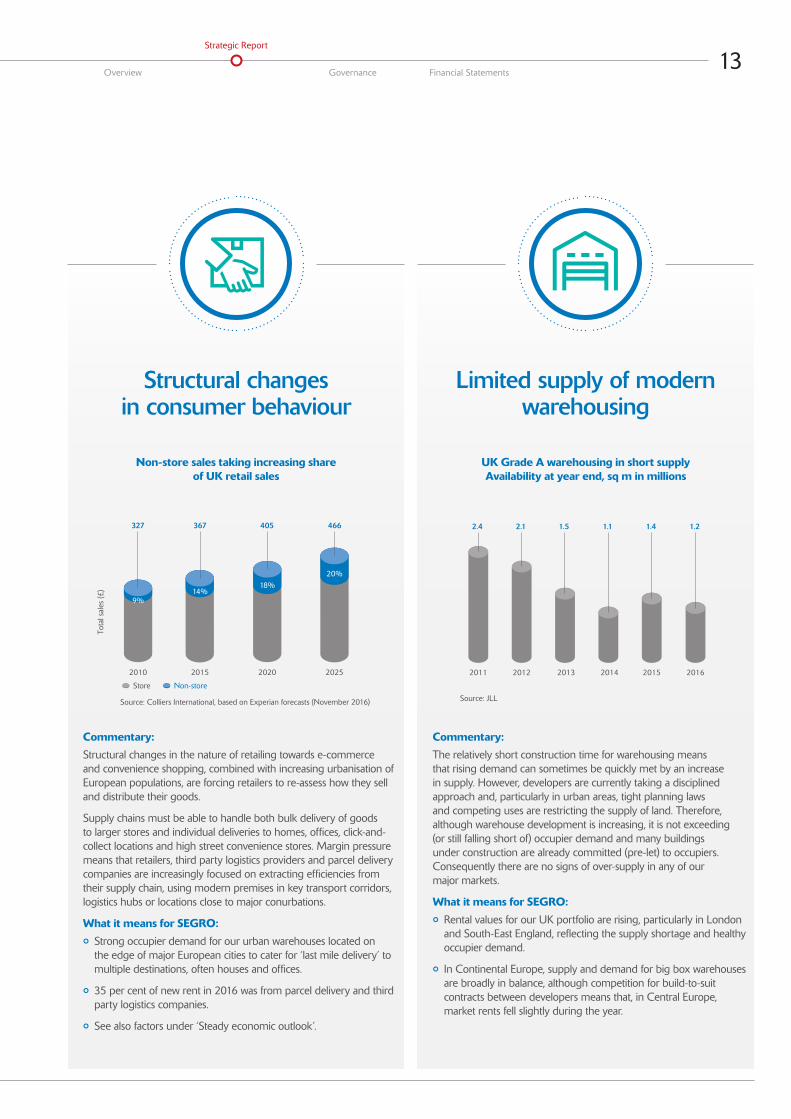
Structural changes in the nature of retailing towards e-commerce and convenience shopping, combined with increasing urbanisation of European populations, are forcing retailers to re-assess how they sell and distribute their goods.
Supply chains must be able to handle both bulk delivery of goods to larger stores and individual deliveries to homes, offices, click-and-collect locations and high street convenience stores. Margin pressure means that retailers, third party logistics providers and parcel delivery companies are increasingly focused on extracting efficiencies from their supply chain, using modern premises in key transport corridors, logistics hubs or locations close to major conurbations.
What it means for SEGRO:
° Strong occupier demand for our urban warehouses located on the edge of major European cities to cater for ‘last mile delivery’ to multiple destinations, often houses and offices.
° 35 per cent of new rent in 2016 was from parcel delivery and third party logistics companies.
° See also factors under ‘Steady economic outlook’.
Commentary:
The relatively short construction time for warehousing means that rising demand can sometimes be quickly met by an increase in supply. However, developers are currently taking a disciplined approach and, particularly in urban areas, tight planning laws and competing uses are restricting the supply of land. Therefore, although warehouse development is increasing, it is not exceeding (or still falling short of) occupier demand and many buildings under construction are already committed (pre-let) to occupiers. Consequently there are no signs of over-supply in any of our major markets.
What it means for SEGRO:
° Rental values for our UK portfolio are rising, particularly in London and South-East England, reflecting the supply shortage and healthy occupier demand.
° In Continental Europe, supply and demand for big box warehouses are broadly in balance, although competition for build-to-suit contracts between developers means that, in Central Europe, market rents fell slightly during the year.
Structural changes in consumer behaviour
Limited supply of modern warehousing
Non-store sales taking increasing share of UK retail sales
UK Grade A warehousing in short supply Availability at year end, sq m in millions
Source: JLLSource: Colliers International, based on Experian forecasts (November 2016)
Tota
l sal
es (£
)
2015
14%
2010
9%
2020
18%
2025
20%
Store Non-store
20122011 2013 2014 2015 2016
1.21.41.11.52.12.4466405367327
14SEGRO Annual Report and Accounts 2016
Market Overview
Our market drivers continued…
Commentary:
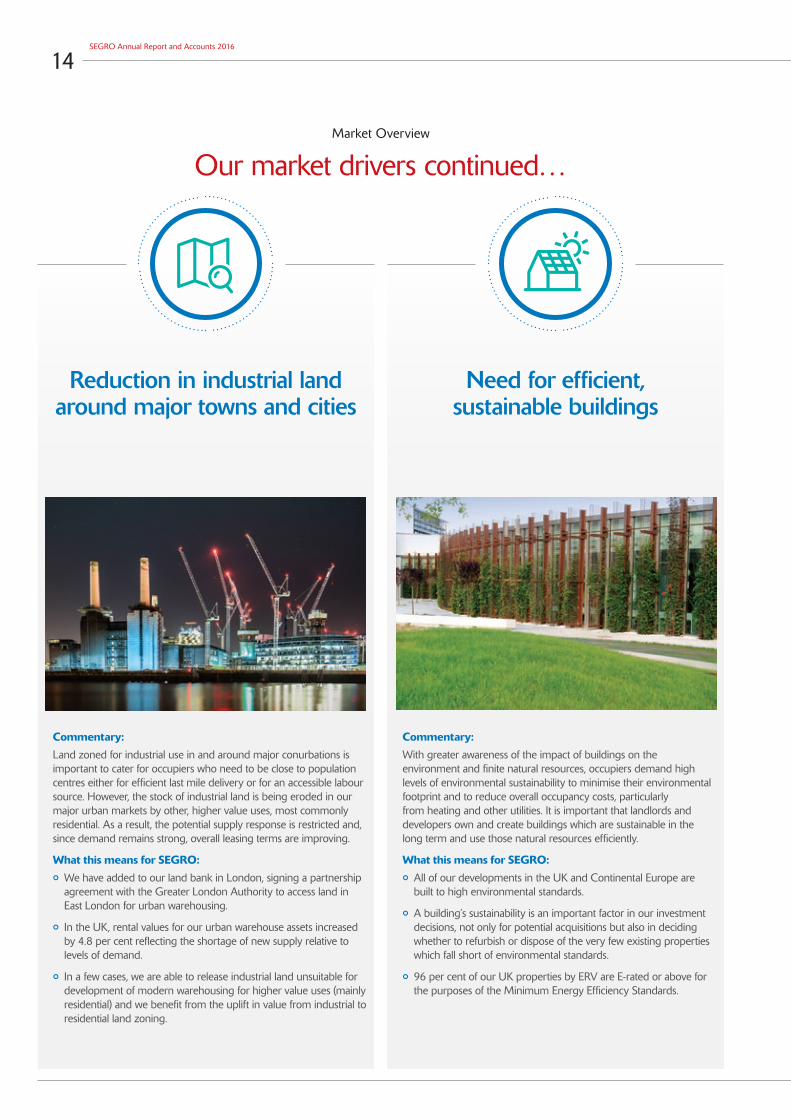
Land zoned for industrial use in and around major conurbations is important to cater for occupiers who need to be close to population centres either for efficient last mile delivery or for an accessible labour source. However, the stock of industrial land is being eroded in our major urban markets by other, higher value uses, most commonly residential. As a result, the potential supply response is restricted and, since demand remains strong, overall leasing terms are improving.
What this means for SEGRO:
° We have added to our land bank in London, signing a partnership agreement with the Greater London Authority to access land in East London for urban warehousing.
° In the UK, rental values for our urban warehouse assets increased by 4.8 per cent reflecting the shortage of new supply relative to levels of demand.
° In a few cases, we are able to release industrial land unsuitable for development of modern warehousing for higher value uses (mainly residential) and we benefit from the uplift in value from industrial to residential land zoning.
Commentary:
With greater awareness of the impact of buildings on the environment and finite natural resources, occupiers demand high levels of environmental sustainability to minimise their environmental footprint and to reduce overall occupancy costs, particularly from heating and other utilities. It is important that landlords and developers own and create buildings which are sustainable in the long term and use those natural resources efficiently.
What this means for SEGRO:
° All of our developments in the UK and Continental Europe are built to high environmental standards.
° A building’s sustainability is an important factor in our investment decisions, not only for potential acquisitions but also in deciding whether to refurbish or dispose of the very few existing properties which fall short of environmental standards.
° 96 per cent of our UK properties by ERV are E-rated or above for the purposes of the Minimum Energy Efficiency Standards.
Reduction in industrial land around major towns and cities
Need for efficient, sustainable buildings

15Overview Governance Financial Statements
Strategic Report
How are we responding? 1 Active asset management: maximising
customer retention, portfolio occupancy, rental growth and asset sustainability through strong customer service and asset maintenance and refurbishment.
2 Accelerated development programme to take advantage of growing occupier demand and limited supply of modern, sustainable warehousing, particularly in urban locations. In 2016, we raised £325 million of new capital in an equity placing to fund investment in our development programme.
3 Land acquisitions, both directly and via buying options over land, to extend our development pipeline, particularly around cities in our major markets, without having too much land on balance sheet.
4 Asset recycling, taking advantage of strong investor demand to improve our portfolio quality: selling assets no longer core to our strategy and investing the proceeds in our development programme, reducing debt and selective asset acquisitions.
Commentary:
Monetary policy across Europe – and globally – means that we are operating in a very low interest rate environment: UK gilts at 31 December 2016 yielded 1.2 per cent and German bonds yielded 0.2 per cent. Prime industrial real estate yields in the UK and Continental Europe are over 3 and over 5 percentage points higher than their respective risk-free benchmarks, making industrial real estate attractive on a relative basis. The spread between yield and risk-free rate, as well as the prospect of rental growth to come, should provide support for current yields.
What this means for SEGRO:
° The yield profile of warehouse properties remains attractive, particularly given experience and expectations of improving rental values. Our portfolio increased in value by 4.8 per cent in 2016, reflecting improving rental values.
° Greater competition for standing assets from investors has increased their prices meaning that the returns available to us from developing our own assets are often higher than from acquiring existing assets.
Attractive yield profile in a low interest rate environment
Warsaw Paris Düsseldorf London UK risk-free
Germany risk-free
4.9% 4.5% 1.2% 0.2%5.5%6.0%
Source: CBRE, Bloomberg (at 31 December 2016)
Prime yields in all our markets are comfortably above risk-free rates
16SEGRO Annual Report and Accounts 2016
Business Model
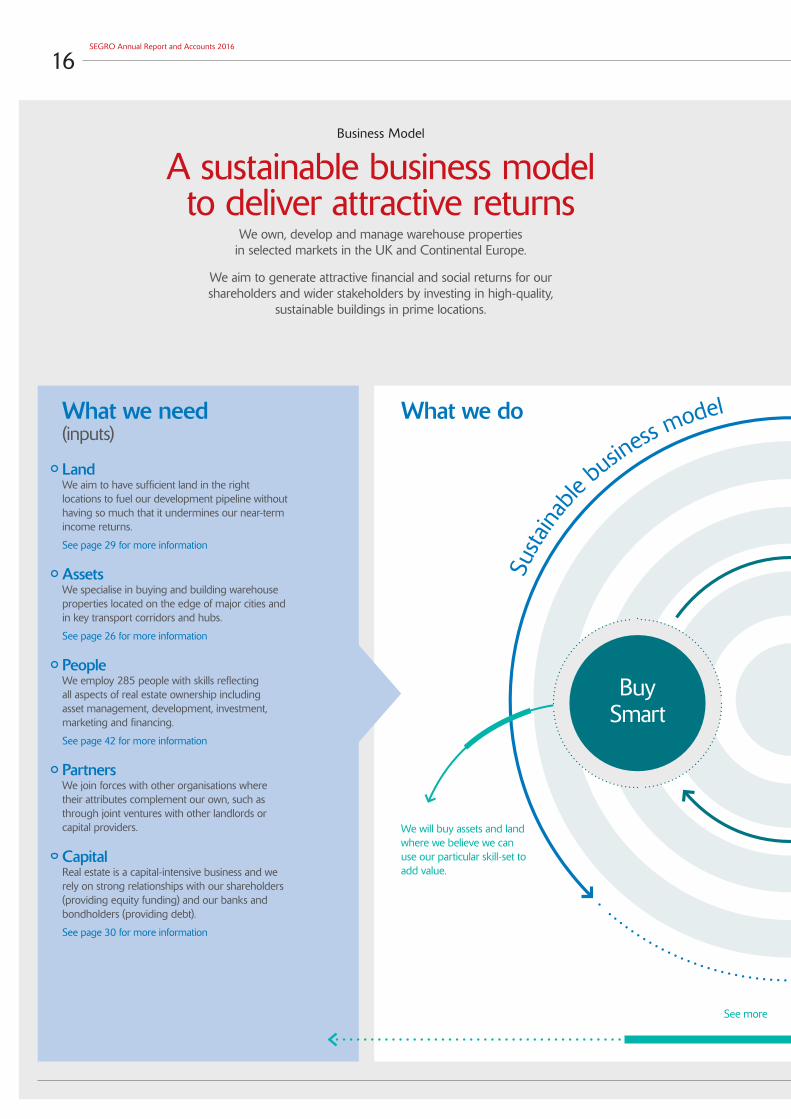
A sustainable business model to deliver attractive returns
We own, develop and manage warehouse properties in selected markets in the UK and Continental Europe.
We aim to generate attractive financial and social returns for our shareholders and wider stakeholders by investing in high-quality,
sustainable buildings in prime locations.
What we do
Susta
inable
busin
ess model
We will buy assets and land where we believe we can use our particular skill-set to add value.
What we need (inputs)
LandWe aim to have sufficient land in the right locations to fuel our development pipeline without having so much that it undermines our near-term income returns.
See page 29 for more information
AssetsWe specialise in buying and building warehouse properties located on the edge of major cities and in key transport corridors and hubs.
See page 26 for more information
PeopleWe employ 285 people with skills reflecting all aspects of real estate ownership including asset management, development, investment, marketing and financing.
See page 42 for more information
PartnersWe join forces with other organisations where their attributes complement our own, such as through joint ventures with other landlords or capital providers.
CapitalReal estate is a capital-intensive business and we rely on strong relationships with our shareholders (providing equity funding) and our banks and bondholders (providing debt).
See page 30 for more information
Buy Smart
See more detail overleaf

17Overview Governance Financial Statements
Strategic Report
We apply our strategy to maximise performanceSee page 23 for more information
Efficient capital and corporate structure
Our Goal
Disciplined Capital
AllocationOperational Excellence
The value we create(outputs)
High quality, sustainable buildingsOur aim is to create the space that enables extraordinary things to happen, and to provide space that allows our customers to service their customers efficiently and effectively. They use our space for an enormous variety of activities, from traditional warehouse uses such as parcel distribution, food manufacturing and bulk storage, to the more eclectic, including film studios, showrooms and brewing. The spaces that we provide are a vital piece of infrastructure enabling our customers to serve their own customers. Furthermore we are active managers of our properties, continuously striving to improve our customer relationships and our success in this area is measured through our operating KPIs, including the results of our annual customer satisfaction survey.
Attractive financial returnsWe aim to generate total property returns (income return and capital growth) ahead of our benchmark which, when combined with appropriate leverage and a lean cost base, should result in attractive total returns for our shareholders comprising growth in our net asset value (or resilience in a down-cycle), earnings and dividend. Variable compensation for all our employees is linked to these KPIs, while long-term incentive plans are linked to the longer-term performance of our shares relative to our peers and of our property relative to the MSCI-IPD benchmark.
Investing in our communitiesWe play an active role in the communities in which we operate. Many of our developments are on brownfield sites which help to regenerate previously redundant areas of towns and cities. We work in partnership with our customers, local authorities, municipalities and educational institutions to facilitate training and employment of people from local communities as part of that regeneration, as well as providing space on flexible terms for local small businesses and start-ups.
Susta
inable
busin
ess model
We will sell assets where we believe the risk-adjusted returns available to us are less attractive than other uses of our capital.
We actively manage our portfolio, improving returns through asset management, refurbishment and development.
Add Value
Sell Well
See more detail overleaf
Reinvested in the business
Shareholder dividends
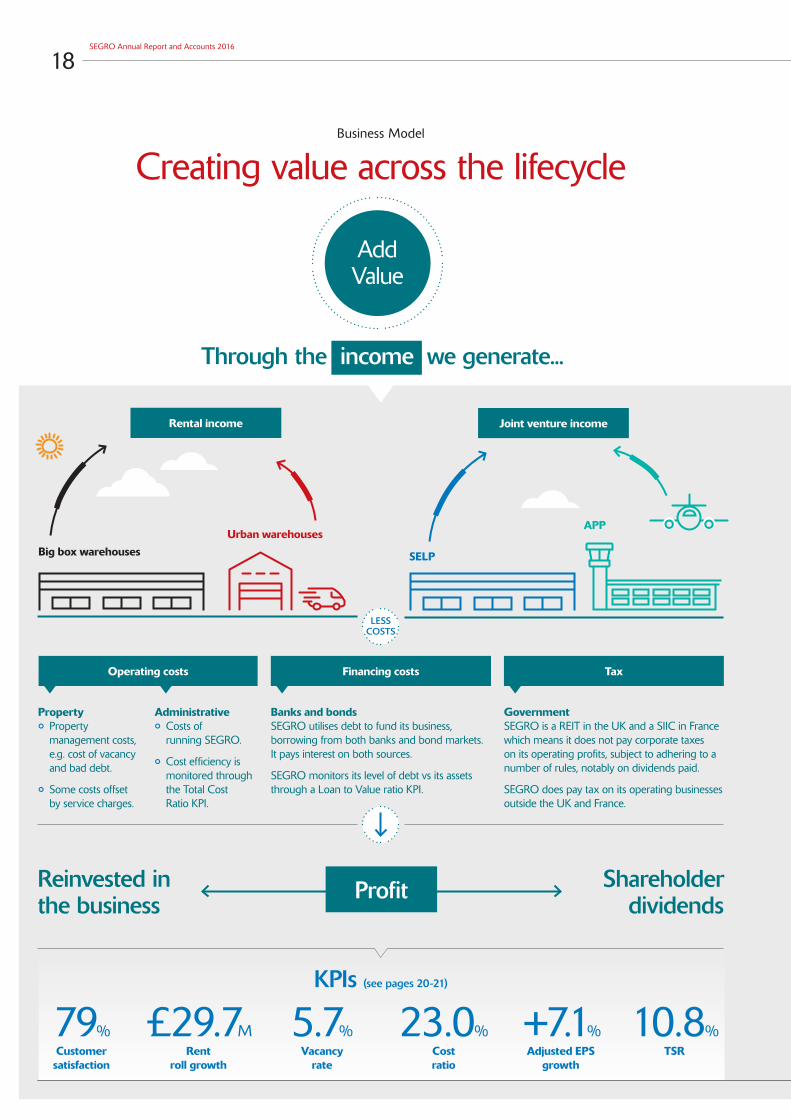
Property
° Property management costs, e.g. cost of vacancy and bad debt.
° Some costs offset by service charges.
Administrative
° Costs of running SEGRO.
° Cost efficiency is monitored through the Total Cost Ratio KPI.
Banks and bonds SEGRO utilises debt to fund its business, borrowing from both banks and bond markets. It pays interest on both sources.
SEGRO monitors its level of debt vs its assets through a Loan to Value ratio KPI.
Government SEGRO is a REIT in the UK and a SIIC in France which means it does not pay corporate taxes on its operating profits, subject to adhering to a number of rules, notably on dividends paid.
SEGRO does pay tax on its operating businesses outside the UK and France.
KPIs (see pages 20-21)
18SEGRO Annual Report and Accounts 2016
Business Model
Creating value across the lifecycle
Operating costs Financing costs Tax
Customer satisfaction
Rent roll growth
Vacancy rate
Cost ratio
Adjusted EPS growth
TSR
LESS COSTS
Profit
79% £29.7M 5.7% 23.0% +7.1% 10.8%
Add Value
Through the income we generate...
Big box warehousesUrban warehouses
APP Land bank Development Complete asset
SELP
Market impact
° Supply and demand dynamics in our markets.
° Reflected through changes in market yields and rental values.
SEGRO input
° Asset management activities including leasing and servicing customers.
° Property maintenance and refurbishment.
Joint venture income Development activityRental income Standing assets
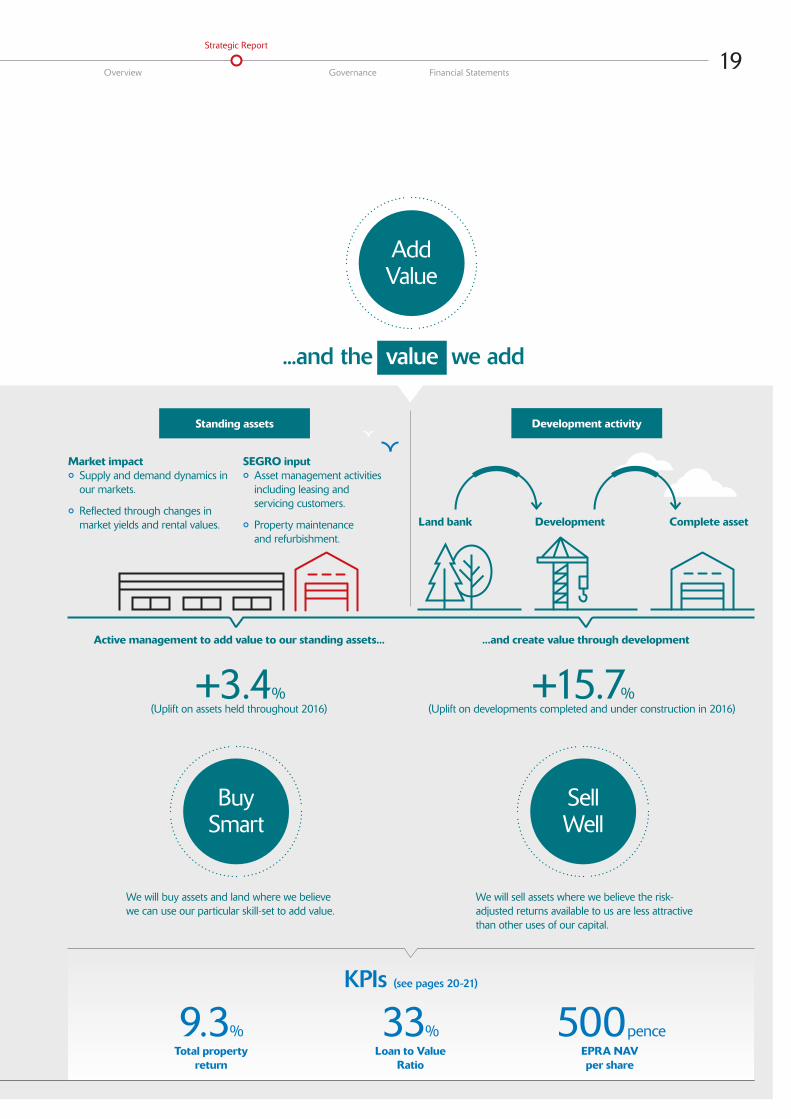
Active management to add value to our standing assets... ...and create value through development
KPIs (see pages 20-21)
19Overview Governance Financial Statements
Strategic Report
Total property return
Loan to Value Ratio
EPRA NAV per share
9.3%
+3.4% (Uplift on assets held throughout 2016)
+15.7% (Uplift on developments completed and under construction in 2016)
33% 500 pence
Sell Well
Buy Smart
We will buy assets and land where we believe we can use our particular skill-set to add value.
We will sell assets where we believe the risk-adjusted returns available to us are less attractive than other uses of our capital.
Add Value
...and the value we add
Big box warehousesUrban warehouses
APP Land bank Development Complete asset
SELP
Market impact
° Supply and demand dynamics in our markets.
° Reflected through changes in market yields and rental values.
SEGRO input
° Asset management activities including leasing and servicing customers.
° Property maintenance and refurbishment.
Joint venture income Development activityRental income Standing assets

20SEGRO Annual Report and Accounts 2016
Key Performance Indicators
Measured against our targets
EPRA NAV per share*
500 pence
Customer satisfaction
79%
Total Property Return(TPR)†
9.3%
5.7%
EPRA vacancy rate*
Our strategy (see page 23 for more details)
Our aim is to deliver attractive returns to our shareholders and stakeholders through the execution of our strategy.
We track our progress against nine Key Performance Indicators on which we report each year. They are based on proportionally consolidated metrics, incorporating our share of joint ventures.
Some of these metrics are also used to determine how management and employees are remunerated.
Further details on our remuneration policies and the metrics used to determine remuneration are set out in the Remuneration Committee Report on pages 85 to 97.
Risk management
We recognise that the management of risk has a role to play in the achievement of our strategy and nine KPIs. Risks can hinder or help us meet our desired level of performance.
The relationship between our principal risks and our KPIs is identified in the Principal Risks on pages 54 to 61.
What it is: The vacancy rate measures our ability to minimise the quantity of non income-producing built assets within our portfolio. An improving vacancy rate generally implies additional rental income and lower vacant property costs. Some level of vacancy will always exist within our portfolio in order to support our asset management activities and allow our customers the opportunity to move premises. We target a longer-term vacancy rate of 5–7 per cent.
Our performance: The portfolio vacancy rate increased to 5.7 per cent (31 December 2015: 4.8 per cent) due mainly to the completion of speculatively developed space and the expected return of a UK big box warehouse in November which we expect to re-let during the course of 2017.
What it is: The percentage of our customers who rate their experience as occupiers of our buildings as ‘good’ or ‘excellent’ as opposed to ‘poor’ or ‘average’. Our customers are at the heart of our business and we strive to ensure that we are providing the best level of service possible to maximise customer retention.
Our performance: Satisfaction as an occupier of our buildings was rated as ‘good’ or ‘excellent’ by 79 per cent of the 275 customers which participated in the 2016 survey (2015: 77 per cent). The improvement is welcome and the continued high satisfaction rate reflects our focus on communication, being responsive and understanding the needs of our customers. We continue to target similarly high levels in the future.
What it is: TPR is the ungeared combined income and capital return from the portfolio during the year. It is an important measure of the success of our strategy in terms of asset selection and asset management. MSCI Real Estate (formerly known as IPD) prepares the calculation, as well as providing benchmark TPR data for similar properties in their wider universe. We aim to outperform the benchmark over the long term. Details on how TPR impacts short- and long-term incentives are provided on pages 88 to 94.
Our performance: The TPR of the Group in 2016 was 9.3 per cent (2015: 18.4 per cent). Our UK portfolio generated a TPR of 10.2 per cent, performing ahead of the benchmark calculated by MSCI Real Estate of 7.4 per cent. The TPR of our Continental Europe portfolio was 7.3 per cent. Benchmark data for Continental Europe will be received later in the year.
What it is: EPRA Net Asset Value (NAV) is the value of our assets less the book value of our liabilities, calculated in accordance with EPRA guidelines, that is attributable to our shareholders. We aim for sustainable long term asset value growth whilst carefully managing our liabilities to maintain balance sheet strength.
Our performance: EPRA NAV increased by 37 pence per share over the year to 31 December 2016, most of which was due to a 4.8 per cent increase in the value of the Group’s property portfolio. Our UK portfolio generated a capital value uplift of 6.4 per cent and our Continental European portfolio increased by 1.6 per cent. Diluted NAV per share increased by 34 pence to 502 pence. The reconciliation between Diluted NAV per share and EPRA NAV per share can be found in Note 14(ii) on page 133.
Efficient capital and corporate structure
Our Goal
Disciplined Capital
AllocationOperational Excellence
9.316
18.415
19.414
5.716
4.815
6.314
7916
7715
8614
50016
46315
38414
21Overview Governance Financial Statements
Strategic Report
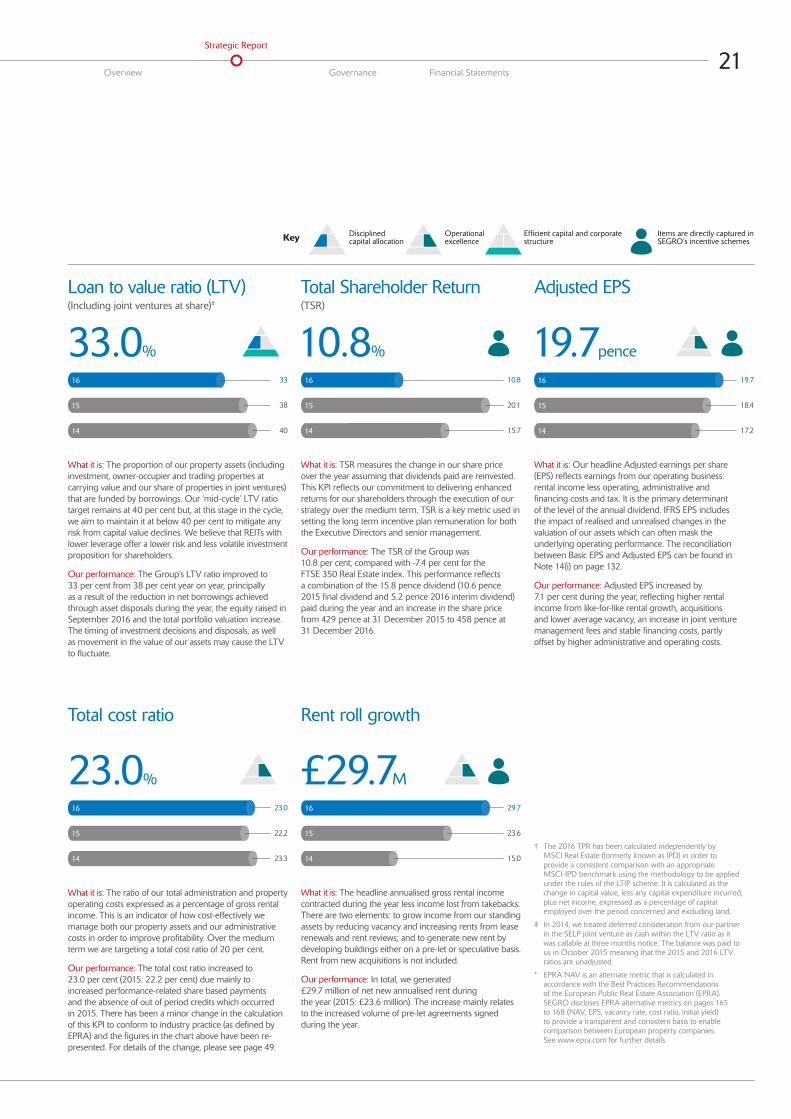
Loan to value ratio (LTV)(Including joint ventures at share)‡
33.0%
Total cost ratio
23.0%
Adjusted EPS
19.7 pence
Total Shareholder Return(TSR)
10.8%
Rent roll growth
£29.7M
What it is: The ratio of our total administration and property operating costs expressed as a percentage of gross rental income. This is an indicator of how cost-effectively we manage both our property assets and our administrative costs in order to improve profitability. Over the medium term we are targeting a total cost ratio of 20 per cent.
Our performance: The total cost ratio increased to 23.0 per cent (2015: 22.2 per cent) due mainly to increased performance-related share based payments and the absence of out of period credits which occurred in 2015. There has been a minor change in the calculation of this KPI to conform to industry practice (as defined by EPRA) and the figures in the chart above have been re-presented. For details of the change, please see page 49.
What it is: The proportion of our property assets (including investment, owner-occupier and trading properties at carrying value and our share of properties in joint ventures) that are funded by borrowings. Our ‘mid-cycle’ LTV ratio target remains at 40 per cent but, at this stage in the cycle, we aim to maintain it at below 40 per cent to mitigate any risk from capital value declines. We believe that REITs with lower leverage offer a lower risk and less volatile investment proposition for shareholders.
Our performance: The Group’s LTV ratio improved to 33 per cent from 38 per cent year on year, principally as a result of the reduction in net borrowings achieved through asset disposals during the year, the equity raised in September 2016 and the total portfolio valuation increase. The timing of investment decisions and disposals, as well as movement in the value of our assets may cause the LTV to fluctuate.
What it is: TSR measures the change in our share price over the year assuming that dividends paid are reinvested. This KPI reflects our commitment to delivering enhanced returns for our shareholders through the execution of our strategy over the medium term. TSR is a key metric used in setting the long term incentive plan remuneration for both the Executive Directors and senior management.
Our performance: The TSR of the Group was 10.8 per cent, compared with -7.4 per cent for the FTSE 350 Real Estate index. This performance reflects a combination of the 15.8 pence dividend (10.6 pence 2015 final dividend and 5.2 pence 2016 interim dividend) paid during the year and an increase in the share price from 429 pence at 31 December 2015 to 458 pence at 31 December 2016.
What it is: Our headline Adjusted earnings per share (EPS) reflects earnings from our operating business: rental income less operating, administrative and financing costs and tax. It is the primary determinant of the level of the annual dividend. IFRS EPS includes the impact of realised and unrealised changes in the valuation of our assets which can often mask the underlying operating performance. The reconciliation between Basic EPS and Adjusted EPS can be found in Note 14(i) on page 132.
Our performance: Adjusted EPS increased by 7.1 per cent during the year, reflecting higher rental income from like-for-like rental growth, acquisitions and lower average vacancy, an increase in joint venture management fees and stable financing costs, partly offset by higher administrative and operating costs.
What it is: The headline annualised gross rental income contracted during the year less income lost from takebacks. There are two elements: to grow income from our standing assets by reducing vacancy and increasing rents from lease renewals and rent reviews; and to generate new rent by developing buildings either on a pre-let or speculative basis. Rent from new acquisitions is not included.
Our performance: In total, we generated £29.7 million of net new annualised rent during the year (2015: £23.6 million). The increase mainly relates to the increased volume of pre-let agreements signed during the year.
23.016
22.215
23.314
29.716
23.615
15.014
3316
3815
4014
10.816
20.115
15.714
19.716
18.415
17.214
Key Disciplined capital allocation
Operational excellence
Efficient capital and corporate structure
Items are directly captured in SEGRO’s incentive schemes
† The 2016 TPR has been calculated independently by MSCI Real Estate (formerly known as IPD) in order to provide a consistent comparison with an appropriate MSCI-IPD benchmark using the methodology to be applied under the rules of the LTIP scheme. It is calculated as the change in capital value, less any capital expenditure incurred, plus net income, expressed as a percentage of capital employed over the period concerned and excluding land.
‡ In 2014, we treated deferred consideration from our partner in the SELP joint venture as cash within the LTV ratio as it was callable at three months notice. The balance was paid to us in October 2015 meaning that the 2015 and 2016 LTV ratios are unadjusted.
* EPRA NAV is an alternate metric that is calculated in accordance with the Best Practices Recommendations of the European Public Real Estate Association (EPRA). SEGRO discloses EPRA alternative metrics on pages 165 to 168 (NAV, EPS, vacancy rate, cost ratio, initial yield) to provide a transparent and consistent basis to enable comparison between European property companies. See www.epra.com for further details.

22SEGRO Annual Report and Accounts 2016
Chief Executive’s Review
Delivering on the strategy
In 2016, SEGRO has delivered strong operating metrics, a record year for development and a strengthened financial structure. It is well placed to thrive in 2017 and beyond, despite some of the macro uncertainties.
David Sleath Chief Executive
23Overview Governance Financial Statements
Strategic Report
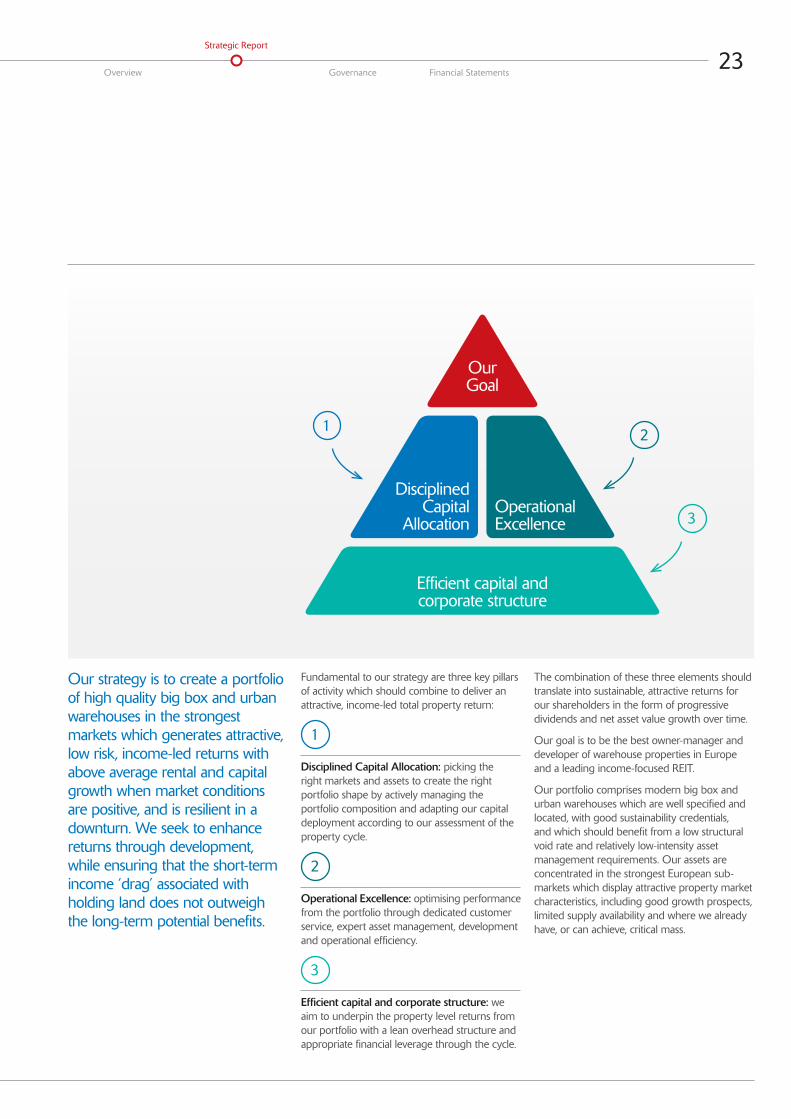
Our strategy is to create a portfolio of high quality big box and urban warehouses in the strongest markets which generates attractive, low risk, income-led returns with above average rental and capital growth when market conditions are positive, and is resilient in a downturn. We seek to enhance returns through development, while ensuring that the short-term income ‘drag’ associated with holding land does not outweigh the long-term potential benefits.
Fundamental to our strategy are three key pillars of activity which should combine to deliver an attractive, income-led total property return:
1
Disciplined Capital Allocation: picking the right markets and assets to create the right portfolio shape by actively managing the portfolio composition and adapting our capital deployment according to our assessment of the property cycle.
2
Operational Excellence: optimising performance from the portfolio through dedicated customer service, expert asset management, development and operational efficiency.
3
Efficient capital and corporate structure: we aim to underpin the property level returns from our portfolio with a lean overhead structure and appropriate financial leverage through the cycle.
The combination of these three elements should translate into sustainable, attractive returns for our shareholders in the form of progressive dividends and net asset value growth over time.
Our goal is to be the best owner-manager and developer of warehouse properties in Europe and a leading income-focused REIT.
Our portfolio comprises modern big box and urban warehouses which are well specified and located, with good sustainability credentials, and which should benefit from a low structural void rate and relatively low-intensity asset management requirements. Our assets are concentrated in the strongest European sub-markets which display attractive property market characteristics, including good growth prospects, limited supply availability and where we already have, or can achieve, critical mass.
1 2
3
Efficient capital and corporate structure
Our Goal
Disciplined Capital
AllocationOperational Excellence

24SEGRO Annual Report and Accounts 2016
Chief Executive’s Review
Disciplined Capital AllocationOwning the right properties in the right places
What we said we would do in 2016We expected to acquire less in 2016 than in 2015, taking advantage instead of the strengthening occupier market and lack of modern, well-located space to accelerate development activity.
What we achieved in 2016We invested £547 million in our portfolio, of which 16 per cent was in acquisitions, with the remainder in developing new assets and adding to our land bank for future development.
What to expect in 2017Investor demand for high quality assets and land remains competitive so we expect to continue to focus our investment activities mainly on developing new assets than on acquiring existing ones.
Our modern portfolio is located in the right places for our customers to be within easy reach of their customers and workforce.
Phil Redding Chief Investment Officer
Acquiring high quality warehouse assets in EuropeWe acquired £90 million of assets during the year at an average topped-up net initial yield of 6.3 per cent.
Our acquisition activities which, as expected, were lower than in 2015, have focused on building scale in our newer geographies, including big box and urban warehouses in the major logistics and urban markets of Spain (Barcelona and Madrid) and Northern Italy.
We also acquired £155 million of development land which is discussed under “Enhancing growth through development” on page 29.
Acquisitions: What to expect in 2017We will continue to undertake asset acquisitions, preferably on an off-market basis, where we believe we can add value. Competition for high quality warehouse properties remains strong so we expect to focus our investment on developing new assets, as we did in 2016.
Disposing of non-strategic assetsWe received gross proceeds of £565 million and £24 million from disposals of assets and land respectively, reflecting an average 2.7 per cent premium to 31 December 2015 book values. The asset sales reflect an average topped-up initial yield of 5.9 per cent.
Our disposal activity during the year focused on selling non-strategic assets to third parties, including the £325 million Bath Road office portfolio in the UK and a number of more management-intensive industrial estates in the UK and Germany.
Within the disposals were €179 million of wholly-owned Continental Europe big box warehouses which we sold to the SEGRO European Logistics Partnership (SELP) joint venture (SEGRO has a 50 per cent interest in SELP so the disposal is treated as a sale of 50 per cent of the assets in the total disposals figure). Under the terms of the joint venture, we offer SELP the Continental European big box warehouses which have either been bought or developed by SEGRO. SELP has the option but not the obligation to buy these assets. There are a number of such assets which would be suitable for future sale to SELP and we intend to offer these for sale to the joint venture during 2017.
Disposals: What to expect in 2017We will continue to identify assets for disposal where we believe that the expected risk-adjusted returns from retaining them are less appealing than the returns offered by other investment opportunities, not least by those from investing in our own development pipeline. We will balance disposal activity with appropriate investment in line with our goal to generate a growing and resilient income stream.
Asset value appreciation reflects returns from asset management in a stable yield environmentValues of UK commercial real estate fell in the months immediately after the EU referendum but the impact was relatively minor for industrial assets compared to other real estate sectors. Pricing has recently shown signs of improving and investment volumes recovered strongly in the fourth quarter of 2016 after a lull in the third quarter. Investor demand for big box warehouses in Continental Europe held up well throughout the year and pricing in some regions has continued to improve, amid a generally benign economic environment, favourable structural trends driving occupier demand and yields which remain attractive compared to low interest rates.
The Group’s property portfolio totalled £6.3 billion (£8.0 billion of assets under management) at 31 December 2016. The portfolio valuation, including completed assets, buildings under construction and land, increased by 4.8 per cent on a like-for-like basis (adjusted for capital expenditure and asset recycling during the year). This comprises a 4.5 per cent increase in the value of our completed properties, a 7.6 per cent increase in the value of properties under development and an 11.5 per cent increase in the value of our land bank. The valuation was also impacted by a rise in stamp duty taxes in both the UK and France during the year.
The largest component of the uplift in the value of our land bank was the increase in the value of a former industrial estate in West London which we have committed to sell to a residential developer. We expect this transaction to complete before the end of the first quarter of 2017.

25Overview Governance Financial Statements
Strategic Report
GreaterLondon
Unr
ealis
ed g
ains
and
loss
es (£
milli
ons)
250
0
50
100
150
200
ThamesValley & NationalLogistics
NorthernEurope
SouthernEurope
CentralEurope
Total
The UK completed portfolio (including assets held throughout the year, assets acquired during the year and developments completed during the year) was the strongest component of performance, delivering a 5.6 per cent valuation uplift (2015: 13.1 per cent), despite the rise in stamp duty on commercial properties during the year, outperforming the MSCI-IPD UK Industrial Quarterly Index which increased by 2.0 per cent. This outperformance reflects the high quality of our portfolio and the continued impact of our asset management initiatives across the business. The capital return on our UK portfolio was driven by the combination of a 4.7 per cent improvement in estimated rental values (2015: 4.4 per cent) and a 17.5 per cent increase in the value of completed developments. The equivalent yield on the portfolio improved to 5.6 per cent (31 December 2015: 5.8 per cent).
In Continental Europe, the completed portfolio value increased by 2.0 per cent during 2016 (2015: 7.9 per cent). The portfolio equivalent yield improved to 6.6 per cent (31 December 2015: 6.8 per cent), while rental values posted a modest positive return of 0.3 per cent after a 0.9 per cent decline in 2015. This reflected broadly stable rental values for big box warehouses across our geographies and some signs of improvement in our modern urban warehouses, particularly in Germany. The Continental European developments we completed during the year increased in value by 20 per cent.
More details of our property portfolio can be found in Note 15 to the financial statements and in the 2016 Property Analysis Report available at www.SEGRO.com/investors.
Valuations: What to expect in 2017While investor demand for high quality warehouses in core urban and transport locations remains strong, it also remains selective on pricing and quality. We expect to add value through active management of our existing assets and development.
Prime yields continue to appear attractive compared to government (risk-free) bond yields, enhanced by the prospect of rental growth to come, although this should be considered in the context of heightened political and economic uncertainty.
+9.4% +3.2% +1.1% +2.8% +0.6% +4.8%
Unrealised gains and losses on portfolio (£ millions) and like-for-like value change (%)1
(excluding capital expenditure)
Acquisitions completed in 2016
Asset TypePurchase price
(£m, SEGRO share)¹Net initial yield (%)
Topped-up net initial yield (%)
Big box logistics 82.6 6.2 6.2
Urban warehousing 7.4 7.0 7.0
Land3 155.1 n/a n/a
Acquisitions completed in 2016 245.1 6.32 6.32
1 Excluding acquisition costs. 2 Yield excludes land transactions. 3 Land acquisitions are discussed in Future Development Projects.
Disposals completed in 2016
Asset TypeDisposal proceeds
(£m, SEGRO share)Net initial yield (%)
Topped-up net initial yield (%)
Big box logistics 103.5 5.4 5.4
Light industrial 112.8 4.6 5.4
Higher value use buildings 349.1 5.6 6.2
Land 24.0 n/a n/a
Disposals completed in 2016 589.4 5.42 5.92
1 Percentage change relates to the whole portfolio including completed properties, development and land.

26SEGRO Annual Report and Accounts 2016
Chief Executive’s Review
Operational ExcellenceOptimising performance through customer focus, active asset management and development
Optimising the performance of our portfolioWhat we said we would do in 2016We continued to focus on generating rent roll growth from standing assets and development while also managing and, where possible, reducing the cost base.
What we achieved in 2016We are reporting another year of strong operating metrics, including rent roll growth of £2.0 million on standing assets, a low vacancy rate of 5.7 per cent, a cost ratio of 23.0 per cent, and 79 per cent of customers rated us ‘good’ or ‘excellent’.
What to expect in 2017We expect positive rent roll growth in 2017 although driven more by development completions than by standing assets due to the limited amount of vacancy in the portfolio. We expect to make progress on reducing the cost ratio towards our target of 20 per cent of gross rents, mainly reflecting the growing size of the portfolio.
We focus our development activities in micro locations of strongest demand for, and limited supply of, modern warehouse properties.
Andy Gulliford Chief Operating Officer
Improving returns from our existing assetsAt 31 December 2016, our portfolio comprised two main asset types: urban warehouses and big box warehouses. The demand-supply dynamics differ, varying by both type and by geography.
Urban warehouses account for 54 per cent of our portfolio value and are used for a wide variety of purposes, including light industrial, urban distribution (particularly “last mile delivery”) and data centres, by a wide variety of businesses, united by the need to be close to both their customers and their workforce. They are located mainly on the edges of London, Paris, Düsseldorf, Berlin and Warsaw, where land supply is most restricted and demand for warehouse space is strongest. The supply shortage is most apparent in London where industrial land is being lost, in particular, to infrastructure projects and residential development. The Greater London Authority issued a report during the year forecasting that one-third of London’s industrial land will be lost over the next 25 years. The combination of this lack of land and strong demand from businesses needing warehousing to service their customers is manifesting itself in improving lease terms and higher rental values.
Big box warehouses, classed as those over 10,000 sq m in size, account for 40 per cent of our portfolio value. These are focused on the major logistics hubs and corridors in the UK (South-East and Midlands regions), France (the logistics ‘spine’ linking Lille, Paris, Lyon and Marseille), Germany (Düsseldorf, Berlin, Leipzig and Hamburg) and Poland (Warsaw, Łódz and Poznan).
Although occupier demand is healthy across all of our markets, the availability of land and competition for customers outside the UK means that new supply of big box warehousing often keeps pace with demand, resulting in limited rental growth.
In the UK, the availability of high quality big box warehousing in core logistics locations has been particularly low and this has resulted in significant rental growth over the past two years. Speculative development has increased over the past year, although we believe this has slowed in the aftermath of the EU referendum. In Continental Europe, there is some speculative construction underway but big box logistics
rents are broadly stable. In Central Europe, headline rents are stable but competition for pre-let agreements has caused incentive levels to rise. Importantly, we do not see any evidence of oversupply in any of our markets.
Growing rental income from letting existing space and new developmentsDuring 2016, we contracted new leases and pre-let agreements totalling £44.9 million of headline rent (2015: £39.3 million). We generated £16.1 million from leases on existing space, offset by £14.1 million of rent lost from space returned to us, resulting in net take-up of £2.0 million of existing space (2015: £5.2 million).
Additionally, we contracted £27.1 million of rent from letting up developments completed during 2016 (of which £21.7 million was agreed in prior years) and £23.4 million from pre-let agreements.
Our customers represent a wide range of industries, allowing us to avoid over-reliance on any single sector or individual customer. Our top 20 customers represent 27 per cent of our rent roll, and our largest customer represents 4.8 per cent.
Take-up reflects the economic and structural trends in our major markets, with 35 per cent of new rent from parcel delivery companies and third party logistics providers, while retailers and manufacturers accounted for 16 per cent and 18 per cent respectively.
Changes in the rent roll from our standing assets is influenced by three main factors: rent agreed at rent reviews and lease renewals, the portfolio’s vacancy rate and space returned to us. Overall operating performance is also dependent on pre-let agreements, lease terms agreed and operating cost efficiencies. These are examined in more detail opposite.
Asset management: What to expect in 2017We expect rent roll growth from standing assets to remain positive in 2017. Our vacancy rate will continue to be impacted by the completion of speculatively developed space but the higher level of pre-let developments should ensure that it remains within our range of between 5 and 7 per cent. We will continue to focus on maintaining an efficient cost base.

27Overview Governance Financial Statements
Strategic Report
Rent reviews and lease renewalsIn the UK, most of our leases over five years in length are subject to five yearly, upwards-only rent reviews: if market rent levels for a particular property and location are higher than the rent being paid, the rent payable is adjusted upwards; if market rents are lower, then the rent payable is maintained. In Continental Europe, indexation provisions apply on an annual basis (and can, in limited cases, cause rents to fall). Where a customer renews a lease, the rent is subject to full negotiation. Rent changes on review (in the UK only) and renewal are a good indication of rental trends as they involve the same customer and the same building. We calculate the change based on headline rents excluding incentives.
Uplift of 5.4 per centRents improved in our UK markets, especially in London and South-East England. During the year, new headline rents on review and renewal were 6.4 per cent higher in the UK (in tandem with an improvement in lease terms) and 0.1 per cent lower in our Continental European portfolio. In Continental Europe, higher rents on renewal in our Southern Europe portfolio were offset by lower rents in Central Europe from lease renewals due to greater competition for customers.
Portfolio vacancyWe aim to keep vacancy low: not only do vacant buildings earn no rent, but they also cost us money in terms of insuring and securing them and, in the UK, we must pay business rates on empty space. We measure vacancy based on our valuers’ Estimated Rental Values (ERV). Every building, whether occupied or not, has a rental value. Our vacancy rate is calculated by dividing the ERV of vacant buildings by the ERV of our whole portfolio. A small number of our buildings may be subject to short-term leases (less than one year) where we are preparing them for redevelopment or where a customer wants seasonal space. We treat this short-term space as being occupied but also disclose a vacancy rate including short-term space.
Vacancy remains low at 5.7 per cent The vacancy rate at 31 December 2016 was 5.7 per cent (31 December 2015: 4.8 per cent), of which approximately a quarter represents speculative developments completed in 2015 and 2016. The increase in the vacancy rate was primarily the result of a higher level of speculative development completions during the year and the expected take-back of a large UK warehouse in November which added 0.8 percentage points to the rate. Treating short-term lettings as vacant space would increase the vacancy rate to 6.3 per cent (31 December 2015: 6.3 per cent). The average vacancy rate during the year was lower, at 5.2 per cent compared to 6.5 per cent in 2015. We target a vacancy rate of between 5 and 7 per cent to allow for temporary volatility arising from the timing of speculative development completions and take-backs of space.
Space returned on lease terminationWhile we work hard to retain our customers, inevitably some will choose to leave our properties. In most cases, we are able to anticipate the vacation and will work to re-lease the building as soon as possible thereafter. In some cases, the return of a building may offer us the opportunity to refurbish it and let it out at a higher rent. We employ an independent company to carry out an annual survey of our customers to give them a formal opportunity to provide feedback on our customer service and to let us know what we do well and where we need to improve.
Retention rate of 75 per cent During the year, space equating to £14.1 million (2015: £14.1 million) of headline rent was returned to us, including £1.4 million of rent lost due to insolvency (2015: £1.3 million). We retained 75 per cent of rent at risk from break or expiry during the year (2015: 68 per cent). During 2017, £26.1 million of rent is at risk from lease break or expiry and, at 31 December 2016, customers in administration represented £0.4 million of annualised rent (31 December 2015: £0.3 million).
79 per cent of customers rated us ‘good’ or ‘excellent’ in our annual customer survey, a welcome improvement from 2015 (77 per cent). We continually seek to improve our customer service and the survey is a useful tool to direct our focus.
28SEGRO Annual Report and Accounts 2016
Chief Executive’s Review
Operational Excellence continued…
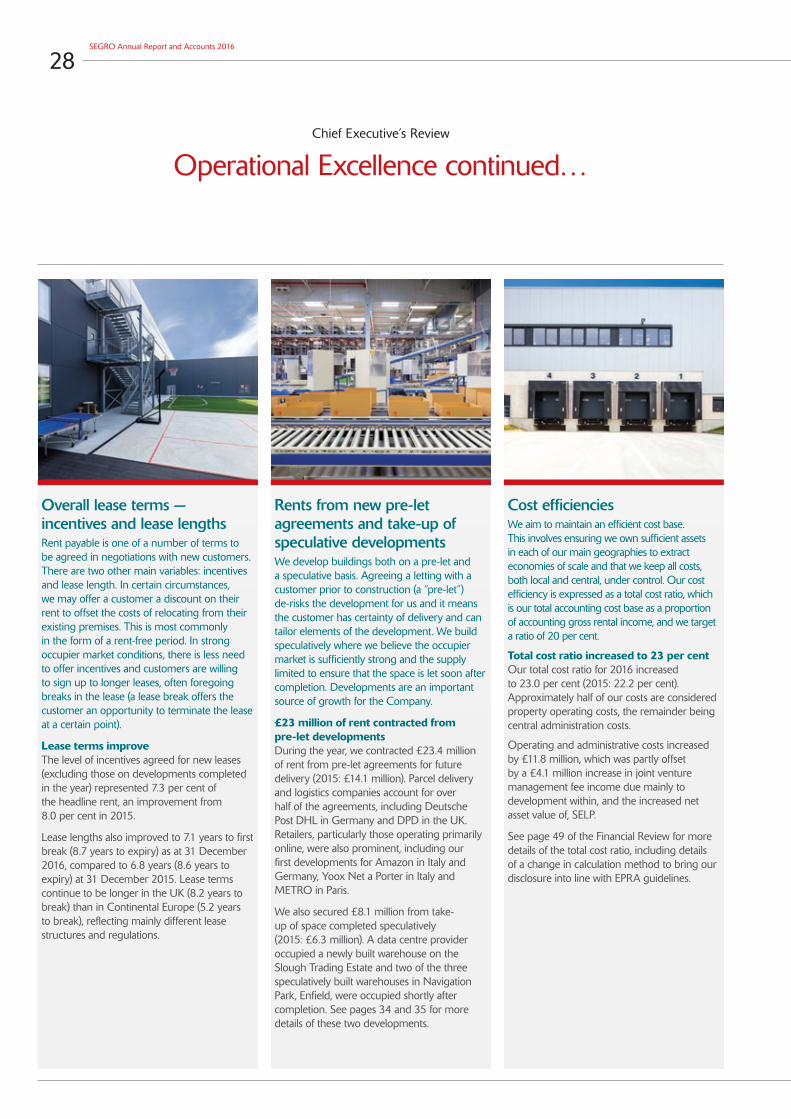
Overall lease terms — incentives and lease lengthsRent payable is one of a number of terms to be agreed in negotiations with new customers. There are two other main variables: incentives and lease length. In certain circumstances, we may offer a customer a discount on their rent to offset the costs of relocating from their existing premises. This is most commonly in the form of a rent-free period. In strong occupier market conditions, there is less need to offer incentives and customers are willing to sign up to longer leases, often foregoing breaks in the lease (a lease break offers the customer an opportunity to terminate the lease at a certain point).
Lease terms improve The level of incentives agreed for new leases (excluding those on developments completed in the year) represented 7.3 per cent of the headline rent, an improvement from 8.0 per cent in 2015.
Lease lengths also improved to 7.1 years to first break (8.7 years to expiry) as at 31 December 2016, compared to 6.8 years (8.6 years to expiry) at 31 December 2015. Lease terms continue to be longer in the UK (8.2 years to break) than in Continental Europe (5.2 years to break), reflecting mainly different lease structures and regulations.
Rents from new pre-let agreements and take-up of speculative developmentsWe develop buildings both on a pre-let and a speculative basis. Agreeing a letting with a customer prior to construction (a “pre-let”) de-risks the development for us and it means the customer has certainty of delivery and can tailor elements of the development. We build speculatively where we believe the occupier market is sufficiently strong and the supply limited to ensure that the space is let soon after completion. Developments are an important source of growth for the Company.
£23 million of rent contracted from pre-let developments During the year, we contracted £23.4 million of rent from pre-let agreements for future delivery (2015: £14.1 million). Parcel delivery and logistics companies account for over half of the agreements, including Deutsche Post DHL in Germany and DPD in the UK. Retailers, particularly those operating primarily online, were also prominent, including our first developments for Amazon in Italy and Germany, Yoox Net a Porter in Italy and METRO in Paris.
We also secured £8.1 million from take-up of space completed speculatively (2015: £6.3 million). A data centre provider occupied a newly built warehouse on the Slough Trading Estate and two of the three speculatively built warehouses in Navigation Park, Enfield, were occupied shortly after completion. See pages 34 and 35 for more details of these two developments.
Cost efficienciesWe aim to maintain an efficient cost base. This involves ensuring we own sufficient assets in each of our main geographies to extract economies of scale and that we keep all costs, both local and central, under control. Our cost efficiency is expressed as a total cost ratio, which is our total accounting cost base as a proportion of accounting gross rental income, and we target a ratio of 20 per cent.
Total cost ratio increased to 23 per cent Our total cost ratio for 2016 increased to 23.0 per cent (2015: 22.2 per cent). Approximately half of our costs are considered property operating costs, the remainder being central administration costs.
Operating and administrative costs increased by £11.8 million, which was partly offset by a £4.1 million increase in joint venture management fee income due mainly to development within, and the increased net asset value of, SELP.
See page 49 of the Financial Review for more details of the total cost ratio, including details of a change in calculation method to bring our disclosure into line with EPRA guidelines.

29Overview Governance Financial Statements
Strategic Report
Enhancing growth through developmentAs competition to acquire standing warehouse assets has increased, the risk-adjusted returns have shifted firmly in favour of development compared to acquiring existing assets. There are relatively few competitors with the land, the development expertise and the financial capacity to develop warehouse assets. We invested £302 million in new developments during 2016 (2015: £164 million) and acquired £155 million of land to extend the longevity of our development pipeline.
The strength of demand for pre-let developments in particular was the reason behind the decision to raise £325 million of new equity to fund a number of these projects. There is more detail on this on page 103.
Development projects completedWe completed 421,600 sq m of new space during the year. These projects were 80 per cent let as at 31 December 2016, generating £23.5 million of annualised gross rent, with a potential further £5.8 million to come when the remainder of the space is let. This translates into a yield on total development cost (including land, construction and finance costs) of 8.2 per cent when fully let, substantially higher than yields available from acquiring similar quality assets.
Amongst the developments completed in 2016 were three big box warehouses in Rugby Gateway, one of which has been let to parcel delivery and logistics company Hermes. We completed new urban last mile distribution warehouses for Deutsche Post DHL in London, Düsseldorf and Vienna, and for FedEx/TNT in Paris.
Current development pipelineAt 31 December 2016, we had development projects approved, contracted or under construction totalling 540,500 sq m, representing £171 million of future capital expenditure and £27 million of headline rent when fully let. The projects, all of which are due to complete in 2017 and 2018, are 61 per cent pre-let and will yield 7.7 per cent on total development cost when fully occupied.
We will usually build urban warehouses speculatively as occupiers often prefer to see the space before committing to a lease. We are more cautious about building big box warehouses speculatively unless they can be
leased to multiple parties or are in areas of particular supply constraint.
We have seven pre-let big box warehouses under construction including our largest ever development: a 155,000 sq m warehouse for Amazon in Rome. We are also building a 57,400 sq m big box warehouse for international retailer, METRO, in Paris.
We have also commenced speculative development of a number of multi-let industrial estates, of which are all close to population centres, allowing occupiers to access their customers quickly and easily.
Future development projectsOur land bank identified for future development was valued at £392 million at 31 December 2016, equating to 6 per cent of our total portfolio. Land is an important source of future growth for us but, until it is developed, it produces no income and reduces the income returns we generate. As a result, where we acquire land, we normally expect to be able to develop it fully within five years, or we seek to secure the land through option agreements, allowing us to buy the land only when we are ready to begin developing it.
During the year, we invested £155 million in development land, most of which was for sites which are already being developed or where infrastructure works have begun. Within these were plots of land bought as a result of two significant agreements secured during 2016.
We secured a 10 year agreement with the Greater London Authority to develop 35 hectares of industrial land across five sites in East London known collectively as East Plus. We estimate that the sites, which we will acquire over the course of the ten year agreement, will support around 140,000 sq m of urban distribution and light industrial space. The combination of these sites, along the A13 main road between London’s inner and outer ring-roads, should provide us with an enviable position in this regenerating area. We have started development of two sites, including a warehouse pre-let to DPD.
We entered a development partnership with Roxhill in February 2016 which gave us access to 12 sites for big box warehouse development in the Midlands and South-East regions of the UK. These sites, over which SEGRO holds option agreements, could support development of over 1 million sq m of big box warehousing over 10 years, which would enable us to achieve
the scale we desire in this attractive asset class and location. We subsequently exercised two options during the year including one to develop a 550,000 sq m rail-connected logistics park, known as SEGRO Logistics Park East Midlands Gateway, directly adjacent to the M1 motorway and East Midlands International Airport, the UK’s second largest cargo airport. We have started infrastructure works and will approach potential customers for pre-let agreements during 2017.
We estimate that our land bank can support 2.7 million sq m of development. The prospective capital expenditure associated with these projects is £1.2 billion and we estimate that they could generate £128 million of headline rent, representing a yield on total development cost (including land and notional finance costs) of 8.2 per cent.
Within this land bank are projects which we expect to commence in the next 6 to 12 months, including pre-let agreements subject to final approval and/or planning permission and speculative developments we expect to approve shortly. At 31 December 2016, these near-term opportunities have the ability to generate approximately £27 million of new headline rent (around 69 per cent of which is associated with potential pre-let agreements) from capital expenditure of approximately £245 million.
These figures are indicative of our current expectations but are dependent on our ability to secure pre-let agreements, planning permission, construction contracts and on our outlook for occupier conditions in local markets.
Within our land bank are sites identified for alternative use valued at £102 million and comprise part of a site we acquired in West London in 2015, as well as the former Northfields Industrial Estate, on both of which we have conditional agreements to sell to residential developers. We expect to dispose of both sites in 2017 or early 2018.
Development: What to expect in 2017We expect to invest in excess of £300 million in development during 2017, which includes both our committed pipeline and further development opportunities under discussion, including a number of pre-let projects under negotiation or subject to planning.
Further details of our completed and active development projects are available in the 2016 Property Analysis Report, which is available to download at www.SEGRO.com/investors.

30SEGRO Annual Report and Accounts 2016
Chief Executive’s Review
Efficient Capital StructureCreating a strong and resilient capital base
Creating a strong and resilient capital baseWhat we said we would do in 2016To manage our levels of net debt to maintain our look-through loan to value ratio (LTV) below our mid-cycle target of 40 per cent.
What we achieved in 2016Net debt, including SEGRO’s share of debt in joint ventures, fell by £102 million due to net disposal activity and the proceeds of the equity placing in September, partly offset by the impact of the strengthening euro exchange rate during the year. These, combined with the increase in the value of our portfolio, resulted in a look-through LTV of 33 per cent at 31 December 2016.
What to expect in 2017We intend to keep our look-through LTV below our mid-cycle target of 40 per cent. We believe that this ensures significant headroom to our tightest gearing covenant should property values decline, as well as providing the flexibility to take advantage of any opportunities arising.
Our capital structure gives us resilience and capacity to invest in our portfolio.
Soumen Das Chief Financial Officer
Improved financial leverageNet debt, including our share of joint venture net debt, fell by £102 million during the year to £2.1 billion. The movement in net debt is mainly a function of net divestment during the year and £325 million (gross) of new equity, partly offset by the impact of our strategy to protect our balance sheet against exchange rate volatility.
The look-through LTV ratio improved to 33 per cent (31 December 2015: 38 per cent) as a result of lower net debt and rising asset values. We estimate that our portfolio would have to fall in value by approximately 50 per cent before breaching the tightest covenants on our debt. This risk is considered in more detail on page 59.
The euro strengthened by 16 per cent against sterling during the year. We have maintained a high degree of hedging to protect our balance sheet and earnings from the impact of future volatility. Our net assets are 69 per cent hedged and our euro earnings are 47 per cent hedged against movements in the euro-sterling exchange rate. Further details can be found in the Financial Review.
During the year, we carried out approximately £2 billion of financing including refinancing £400 million of bank facilities in the APP joint venture and €780 million of Group bank facilities. We raised £325 million of gross proceeds from an equity placing and launched the first bond within SELP, raising €500 million with an additional €200 million of revolving credit facilities. This activity improved the cost, efficiency and duration of our capital structure.
The equity placing was carried out in September to fund £456 million of capital expenditure associated with identified development projects either underway or expected to commence over the following 12 months. At 31 December 2016, approximately 75 per cent of the expected investment had been deployed or committed to our development pipeline and the remaining projects are progressing according to plan.
Capital structure: what to expect in 2017We expect to invest in excess of £300 million in development capital expenditure during 2017. At 31 December 2016, we had £32 million of cash and £535 million of bank credit facilities available to us to fund this intended expenditure.
Approximately £200 million of SEGRO bonds mature in 2018 and we will assess refinancing options for these during 2017.
Dividend increase reflects a strong year and confidence for the futureUnder the UK REIT rules, we are required to pay out 90 per cent of UK-sourced, tax-exempt rental profits as a ‘Property Income Distribution’ (PID). Since we also receive income from our properties in Continental Europe, our total dividend should normally exceed this minimum level and we target a payout ratio of 85 to 95 per cent of Adjusted profit after tax. We aim to deliver a progressive and sustainable dividend which grows in line with our profitability in order to achieve our goal of being a leading income-focused REIT.
The Board has concluded that it is appropriate to recommend an increase in the final dividend per share of 0.6 pence to 11.2 pence (2015: 10.6 pence) which will be paid as a PID. The Board’s recommendation is subject to approval by shareholders at the Annual General Meeting, in which event the final dividend will be paid on 4 May 2017 to shareholders on the register at the close of business on 24 March 2017.
In considering the final dividend, the Board took into account:
° the policy of targeting a payout ratio of between 85 and 95 per cent of Adjusted profit after tax;
° the desire to ensure that the dividend is sustainable and progressive throughout the cycle; and
° the results for 2016 and the outlook for earnings.
The total dividend for the year will, therefore, be 16.4 pence, a rise of 5.1 per cent on 2015 (15.6 pence) and represents payment of 87 per cent of Adjusted profit after tax and 83 per cent of Adjusted EPS.
The Board has decided to retain a scrip dividend option for the 2016 final dividend, allowing shareholders to choose whether to receive the dividend in cash or new shares. In 2016, 32 per cent of the 2015 final dividend and 19 per cent of the 2016 interim dividend was paid in new shares, equating to £29.5 million of cash retained on the balance sheet and 7.1 million new shares being issued.

31Overview Governance Financial Statements
Strategic Report
Outlook for SEGRO in 2017 and beyond
I am proud of what SEGRO has achieved in 2016: the sale of the Bath Road office portfolio means that we are now a pure-play warehouse REIT; we have continued to grow our rent roll on both a like-for-like basis and from letting up our high quality developments; our portfolio is well occupied by a diverse range of customers on improving lease terms; and we have secured approximately £2 billion of new financing on our own behalf and on behalf of our joint ventures in the form of new equity and new debt, most particularly the equity placing and the inaugural SELP bond.
Our investment activity in 2016 was focused on building scale in our major markets, through development and modest acquisitions of high quality warehouses. In particular, we have increased our exposure to Italy where we have an operating base capable of servicing a larger portfolio. This scale has helped us both to establish SEGRO as an influential participant in these markets and to become more operationally efficient.
The UK’s decision to leave the European Union has undoubtedly caused uncertainty for the property industry generally. It is likely to take months, if not years, for occupier demand to adjust to the new situation, so we are not complacent about the impact it could have on our business. Indeed, the work done to reposition our portfolio over the past five years was designed to ensure it would be resilient in times of market uncertainty or weakness.
The early signs are encouraging: we have seen little, if any, impact on occupier and investor demand for our warehouse properties since the referendum result.
We welcome the UK government’s decision to support a third runway at Heathrow Airport, allowing us to progress our long-term development plans for the airport’s cargo centres which are owned by the APP joint venture.
We enter 2017 with confidence. Occupier demand is holding up well and there is no evidence of over-supply in any of our markets, meaning that the prospects are good for further rental growth in the UK and stable or improving rents in Continental Europe. The persistent low interest rate environment continues to cast warehouse yields in a favourable light and we see evidence of a healthy appetite for modern, well located assets among investors. While the scope for further yield compression is limited, both rental growth and development profits should provide support for the value of our portfolio in 2017.
While there are a number of broader economic and geopolitical uncertainties, we are confident that our portfolio is well positioned to be able to outperform the wider property market.
Our priorities for 2017 and beyondOur strategy is directed at delivering attractive total returns for shareholders in the form of a sustainable, progressive dividend stream and net asset value growth over time. The three pillars of our strategy are designed to achieve this and we will continue to focus on growing and improving our portfolio in a disciplined and focused way.
° Disciplined Capital Allocation. As in 2016, we expect to invest more in development than in acquisitions, although we will remain open to acquisitions where the pricing and returns are attractive. We continue to identify assets which may be suitable for disposal although the volume will likely be considerably slower than in 2016. We will seek to divest these assuming investment market conditions remain supportive.
° Operational Excellence – Development and Asset Management. Our development pipeline is an important source of enhanced returns. We expect to continue to develop over half of our buildings on a pre-let basis during 2017, although we will continue to develop speculatively in areas where occupier demand is strong and supply is constrained. We remain alert to any changes in occupier demand and the speed of warehouse construction allows us to increase or reduce speculative development relatively quickly should conditions warrant it. We continue to strive to deliver excellent asset management, maintaining a well occupied portfolio and an efficiently run company.
° Efficient and resilient capital structure. Our balance sheet has been strengthened by proceeds from disposals and the equity placing in September providing capacity for further investment in our portfolio. We intend to maintain our LTV ratio at comfortably below 40 per cent to provide appropriate resilience in the event of any property market correction.
Our business is well positioned, notwithstanding the current degree of political and economic uncertainty. We have had an active start to 2017, and we continue to see opportunities to grow our business through further disciplined investment, matched by a prudent approach to financing.
David SleathChief Executive
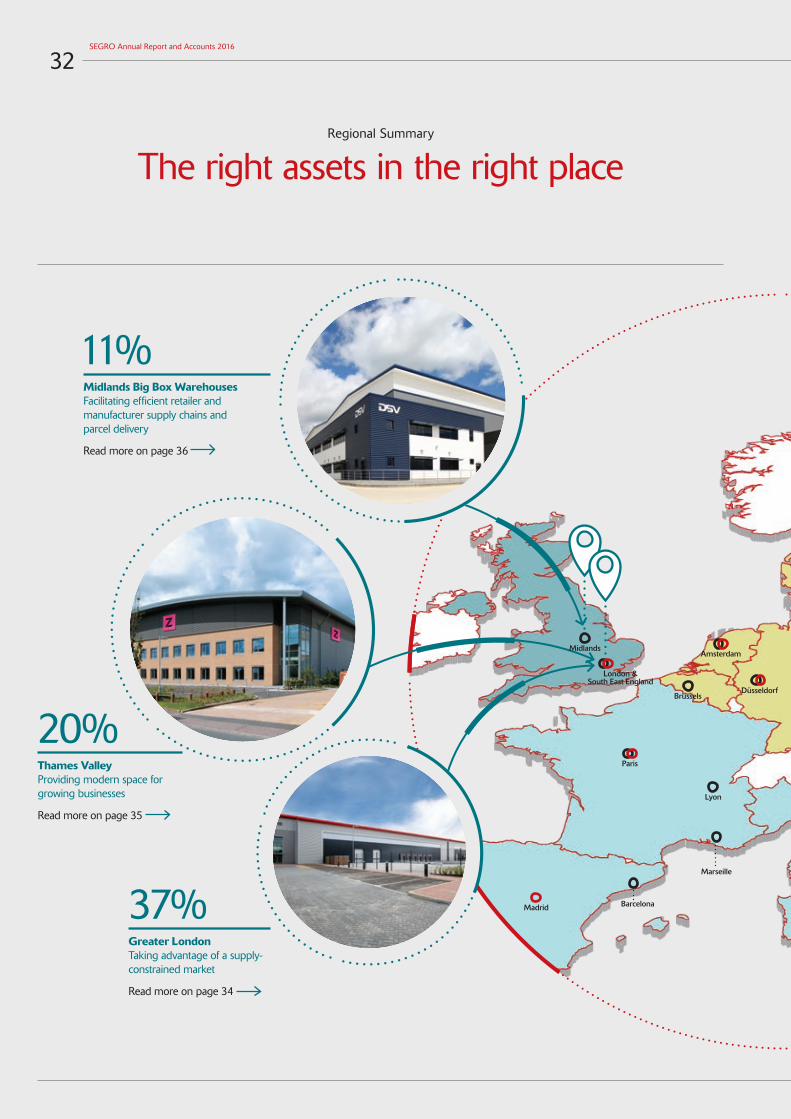
32SEGRO Annual Report and Accounts 2016
Regional Summary
The right assets in the right place
Paris
Lyon
Madrid
Brussels
Amsterdam
Düsseldorf
Marseille
London & South East England
Midlands Big Box Warehouses Facilitating efficient retailer and manufacturer supply chains and parcel delivery
Read more on page 36
Thames Valley Providing modern space for growing businesses
Read more on page 35
Greater London Taking advantage of a supply-constrained market
Read more on page 34
11%
20%
37% Barcelona
Midlands
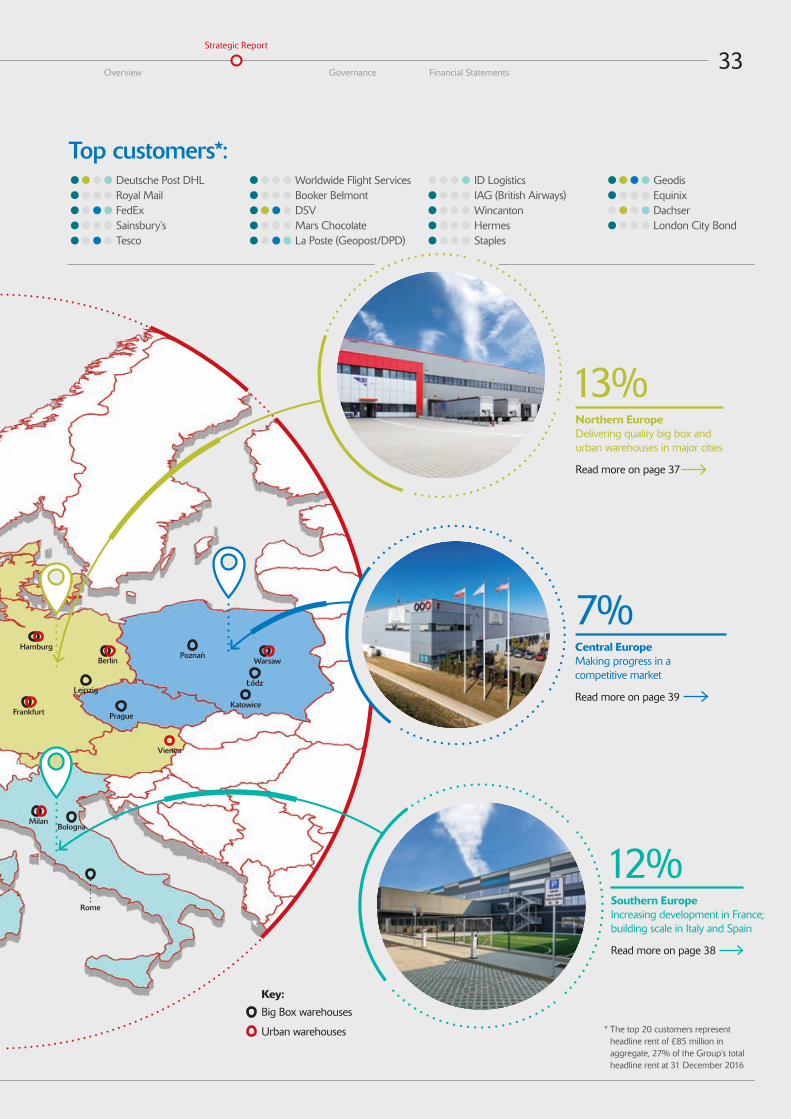
33Overview Governance Financial Statements
Strategic Report
Top customers*:Deutsche Post DHL Worldwide Flight Services ID Logistics GeodisRoyal Mail Booker Belmont IAG (British Airways) EquinixFedEx DSV Wincanton DachserSainsbury’s Mars Chocolate Hermes London City BondTesco La Poste (Geopost/DPD) Staples
Key:
Big Box warehouses
Urban warehouses
Milan
Rome
Bologna
Hamburg
Frankfurt
Leipzig
Berlin
Prague
Vienna
Poznan
Katowice
Łódz
Warsaw
Southern Europe Increasing development in France; building scale in Italy and Spain
Read more on page 38
12%
Central Europe Making progress in a competitive market
Read more on page 39
7%
Northern Europe Delivering quality big box and urban warehouses in major cities
Read more on page 37
13%
* The top 20 customers represent headline rent of £85 million in aggregate, 27% of the Group’s total headline rent at 31 December 2016
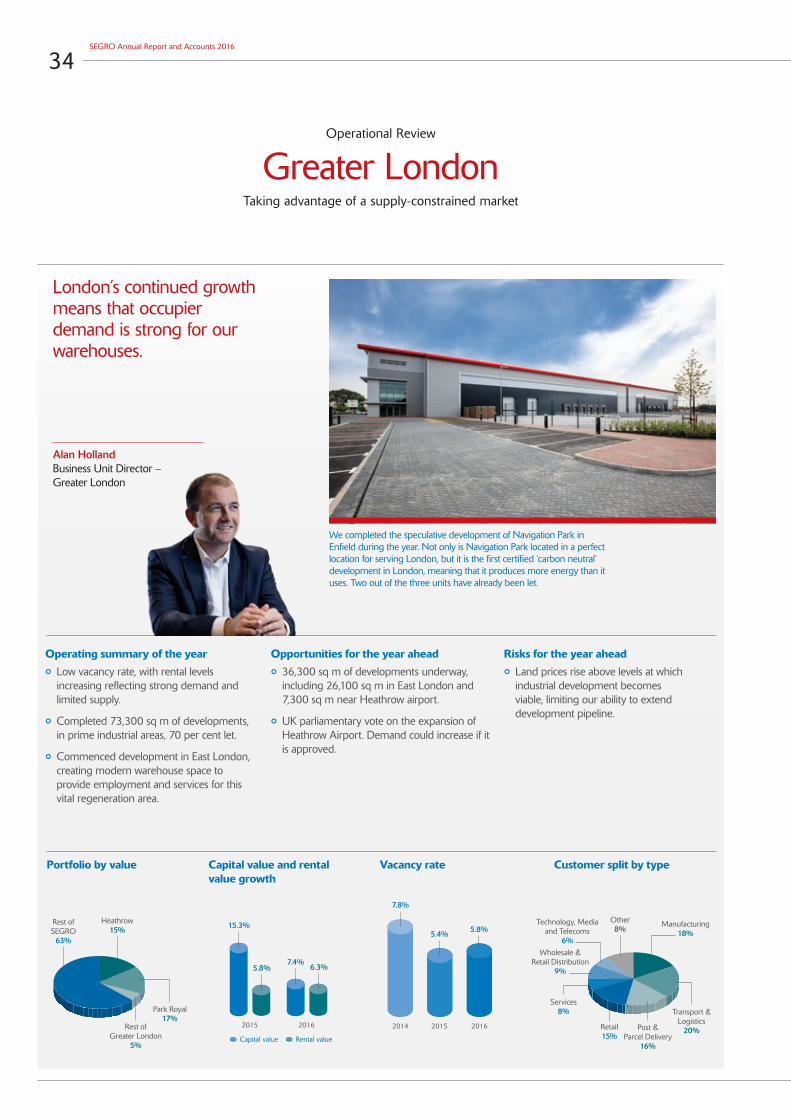
34SEGRO Annual Report and Accounts 2016
Operational Review
Greater LondonTaking advantage of a supply-constrained market
Operating summary of the year
° Low vacancy rate, with rental levels increasing reflecting strong demand and limited supply.
° Completed 73,300 sq m of developments, in prime industrial areas, 70 per cent let.
° Commenced development in East London, creating modern warehouse space to provide employment and services for this vital regeneration area.
Opportunities for the year ahead
° 36,300 sq m of developments underway, including 26,100 sq m in East London and 7,300 sq m near Heathrow airport.
° UK parliamentary vote on the expansion of Heathrow Airport. Demand could increase if it is approved.
Risks for the year ahead
° Land prices rise above levels at which industrial development becomes viable, limiting our ability to extend development pipeline.
Other 8%
Retail 15%
Transport & Logistics
20%
Technology, Media and Telecoms
6%Wholesale &
Retail Distribution 9%
Manufacturing 18%
Post & Parcel Delivery
16%
Services 8%
Customer split by type
2014 2015 2016
5.8%5.4%
7.8%
Vacancy rate
Rest of SEGRO
63%
Heathrow 15%
Rest of Greater London
5%
Park Royal 17%
Portfolio by value
2015 2016
Capital value Rental value
15.3%
5.8% 6.3%7.4%
Capital value and rental value growth
London’s continued growth means that occupier demand is strong for our warehouses.
Alan HollandBusiness Unit Director – Greater London
We completed the speculative development of Navigation Park in Enfield during the year. Not only is Navigation Park located in a perfect location for serving London, but it is the first certified ‘carbon neutral’ development in London, meaning that it produces more energy than it uses. Two out of the three units have already been let.

2015 2016
Capital value Rental value
35Overview Governance Financial Statements
Strategic Report
Thames ValleyProviding modern space for growing businesses
Customer split by typeVacancy rate Portfolio by value
12.0%
3.4%2.3%
3.7%
Capital value and rental value growth
The redevelopment of the Slough Trading Estate, together with infrastructure upgrades, has created the leading modern industrial location for businesses in the Thames Valley.
Gareth OsbornBusiness Unit Director – Thames Valley & National Logistics
12 Liverpool Road was another step in our strategy of rejuvenating the Slough Trading Estate. It was built as a generic warehouse but, like many of our other warehouses on the Trading Estate, it has been let as a data centre. The Trading Estate is the foremost location in Europe for data centres due to its access to power and network connections, and its proximity to London, which are crucial for data centre operators.
Operating summary of the year
° Vacancy has fallen due to continued occupier demand for high quality warehouses.
° Completed 23,700 sq m of speculative development in the Thames Valley, mainly on the Slough Trading Estate, all of which has been let.
° Almost half of the rent on the Trading Estate is generated from buildings constructed over the past 16 years.
Opportunities for the year ahead
° 27,950 sq m of developments underway including on a site in Bracknell acquired in 2015.
° Commence demolition of the former Unilever factory opposite the Slough Trading Estate to prepare it for development.
Risks for the year ahead
° The current low vacancy is restricting relocation options for our customers who may choose to leave our buildings if we cannot offer them alternative, often larger, facilities.
Slough Trading Estate
18%Rest of SEGRO 80%
2014 2015 2016
Other 9%
4.7%5.2%
7.8%
Technology, Media and Telecoms
24%
Transport & Logistics
4%
Wholesale & Retail Distribution
9%
Manufacturing 25%
Retail 6%
Services 19%
Post & Parcel Delivery
4%
Rest of Thames
Valley 2%

2015 2016
Capital value Rental value
2014 2015 2016
Other 6%
Wholesale & Retail Distribution
8%
Transport & Logistics
35%
Manufacturing 2%
Retail 26%
Post & Parcel Delivery
22%
Services 1%
36SEGRO Annual Report and Accounts 2016
Operational Review
UK Big Box Logistics WarehousesFacilitating efficient retailer and manufacturer supply chains and parcel delivery
Operating summary of the year
° Completed a 25,000 sq m warehouse for Hermes for national parcel delivery and two speculative warehouses, which completes our Rugby Gateway logistics park.
° Increase in vacancy reflects this and the vacation of a prime warehouse in Magna Park which was fully let when we bought it in 2014 at a price which reflected the expected take-back.
Opportunities for the year ahead
° The priority is to let the three vacant warehouses in our portfolio during the year. All three are of high quality and in excellent locations.
° We have begun infrastructure works on two sites — in Kettering and at East Midlands Gateway — purchased using options we bought through the agreement with Roxhill signed during 2016. Our commitment to these two projects means we can start seeking pre-let agreements to begin development.
Risks for the year ahead
° Speculative development of big box warehouses in the UK could increase. If levels of supply are greater than demand, rents can fall. However, access to suitable development land is limited and availability of built space in our markets is still well below historic levels and current take-up.
° Uncertainty as a result of the UK referendum to leave the EU.
Customer split by typeVacancy rate Portfolio by value Capital value and rental value growth
Modern, big box logistics warehouses in major transport hubs and corridors are crucial to an efficient supply chain.
Gareth OsbornBusiness Unit Director – Thames Valley & National Logistics
DSV is a global supplier of transport and logistics solutions and its warehouse in Raunds, near Northampton, is perfectly located for national distribution within the UK. Like many of our customers, DSV occupies our buildings in more than one country: it is also a major occupier on the SEGRO Logistics Park in Krefeld, outside Düsseldorf.
Rest of SEGRO 82%
Midlands 11%
South-East 7%
10.4%
4.6%
2.9%2.8%
0.0%0.6%
9.1%

2015 2016
Capital value Rental value
2014 2015 2016
37Overview Governance Financial Statements
Strategic Report
Northern Europe (Germany, Netherlands, Belgium and Austria)
Delivering quality big box and urban warehouses in major cities
Customer split by typeVacancy rate Portfolio by value Capital value and rental value growth
SEGRO’s expertise in urban industrial development is a real differentiator. Our developments on brownfield sites bring modern space and employment opportunities.
Andreas FleischerBusiness Unit Director – Northern Europe
Our big box warehouse at Alzenau in Germany, owned by our SELP joint venture, provides 75,000 sq m of space primarily for B+S Logistics. Alzenau, located just outside Frankfurt, is ideally placed for national distribution.
Operating summary of the year
° Our vacancy rate remains very low, reflecting continuing demand for our properties.
° Completed 75,700 sq m of developments, all of which were pre-let or have been let shortly after completion, including two parcel delivery warehouses for Deutsche Post DHL in Düsseldorf and Vienna.
Opportunities for the year ahead
° 140,000 sq m of mainly urban warehouse developments, 38 per cent of which are pre-let, utilising recently-acquired land.
° New developments include increasing the amount of warehouse space in Berlin and starting a new development on land directly neighbouring Amsterdam’s Schiphol Airport.
° We will establish a position in Munich where we are building a new two-storey warehouse for Amazon and have acquired land close to the airport.
Risks for the year ahead
° Macro uncertainty in the Eurozone could undermine occupier confidence and, therefore, demand for warehouse space.
° Geopolitical uncertainty in Europe, and Germany and the Netherlands specifically, due to forthcoming elections.
Rest of SEGRO
87%
Germany 10%
Belgium & Austria
1%
Netherlands 2%
–0.8% 0.7%
1.9%
7.1%
4.1%4.3%
10.2% Other 6%
Manufacturing 26%
Wholesale & Retail Distribution
6%
Transport & Logistics
36%
Services 4%
Post & Parcel Delivery
8%
Technology, Media and Telecoms
5%Retail 9%
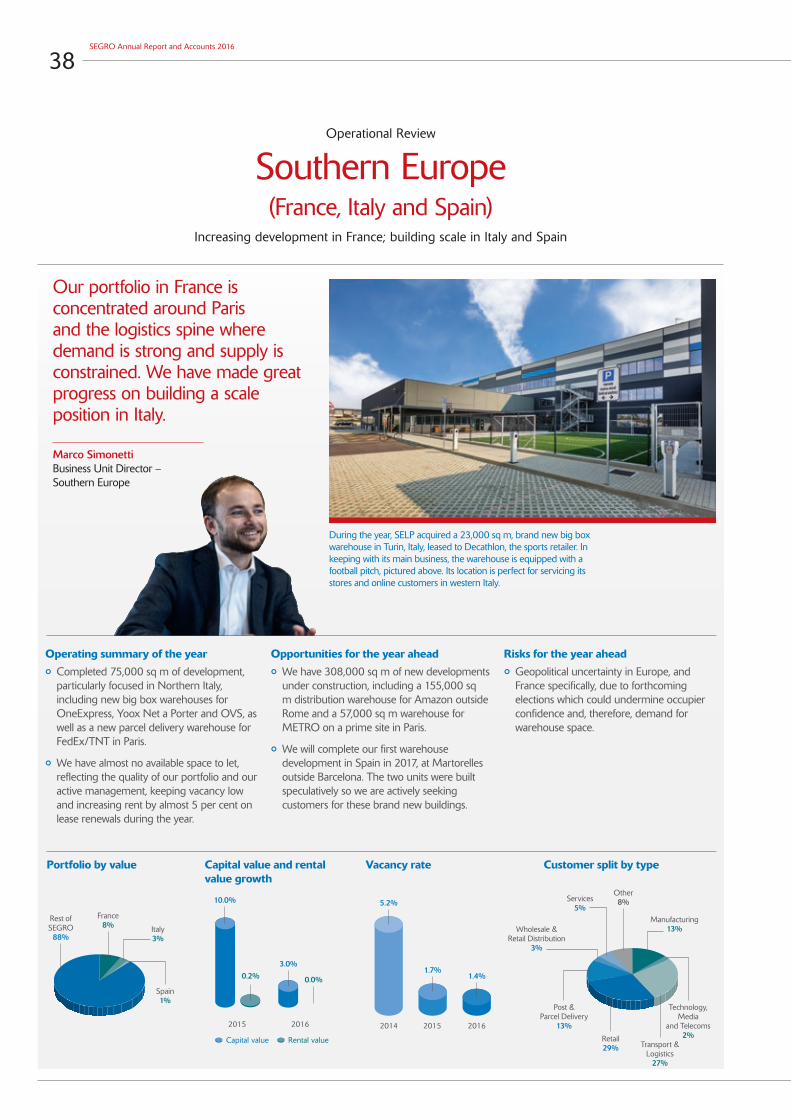
2015 2016
Capital value Rental value
2014 2015 2016
38SEGRO Annual Report and Accounts 2016
Operational Review
Southern Europe (France, Italy and Spain)
Increasing development in France; building scale in Italy and Spain
Operating summary of the year
° Completed 75,000 sq m of development, particularly focused in Northern Italy, including new big box warehouses for OneExpress, Yoox Net a Porter and OVS, as well as a new parcel delivery warehouse for FedEx/TNT in Paris.
° We have almost no available space to let, reflecting the quality of our portfolio and our active management, keeping vacancy low and increasing rent by almost 5 per cent on lease renewals during the year.
Opportunities for the year ahead
° We have 308,000 sq m of new developments under construction, including a 155,000 sq m distribution warehouse for Amazon outside Rome and a 57,000 sq m warehouse for METRO on a prime site in Paris.
° We will complete our first warehouse development in Spain in 2017, at Martorelles outside Barcelona. The two units were built speculatively so we are actively seeking customers for these brand new buildings.
Risks for the year ahead
° Geopolitical uncertainty in Europe, and France specifically, due to forthcoming elections which could undermine occupier confidence and, therefore, demand for warehouse space.
Customer split by typeVacancy rate Portfolio by value Capital value and rental value growth
Our portfolio in France is concentrated around Paris and the logistics spine where demand is strong and supply is constrained. We have made great progress on building a scale position in Italy.
Marco SimonettiBusiness Unit Director – Southern Europe
During the year, SELP acquired a 23,000 sq m, brand new big box warehouse in Turin, Italy, leased to Decathlon, the sports retailer. In keeping with its main business, the warehouse is equipped with a football pitch, pictured above. Its location is perfect for servicing its stores and online customers in western Italy.
France 8%
Rest of SEGRO 88%
Spain 1%
Italy 3%
10.0%
0.2% 0.0%
3.0%
1.4%1.7%
5.2%
Manufacturing 13%
Transport & Logistics
27%
Post & Parcel Delivery
13%
Wholesale & Retail Distribution
3%
Other 8%
Retail 29%
Technology, Media
and Telecoms 2%
Services 5%
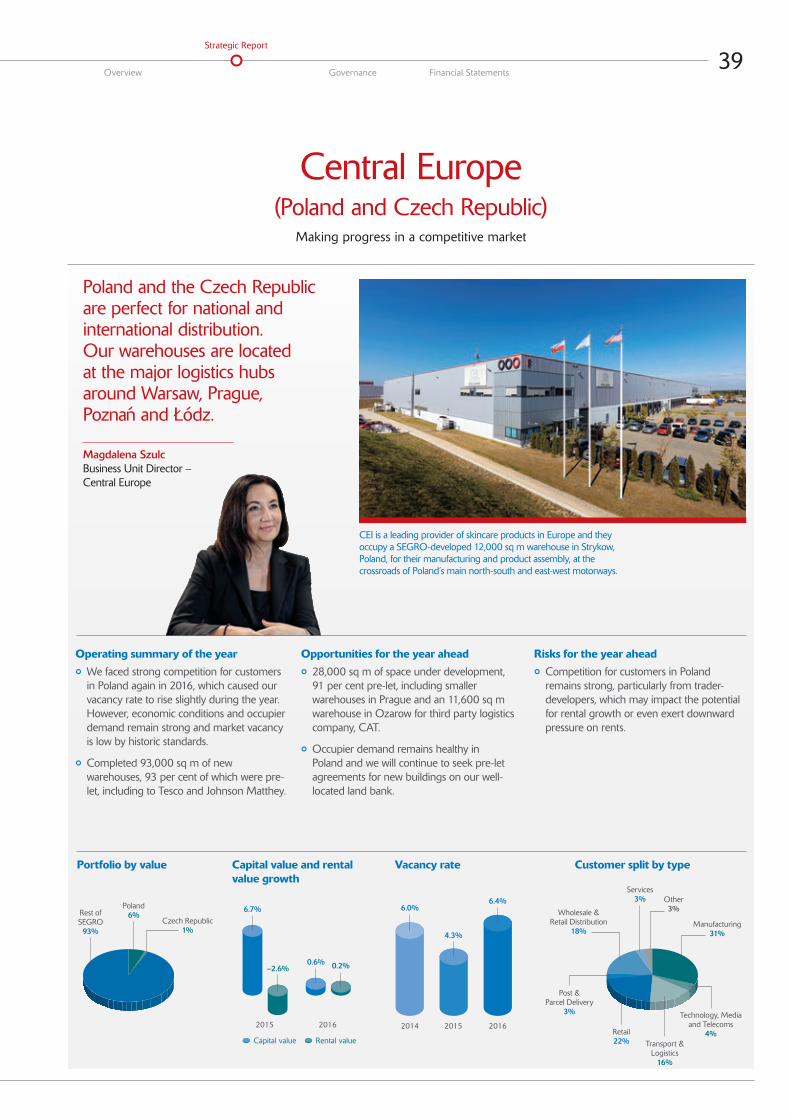
2015 2016
Capital value Rental value
2014 2015 2016
39Overview Governance Financial Statements
Strategic Report
Central Europe (Poland and Czech Republic)
Making progress in a competitive market
Customer split by typeVacancy rate Portfolio by value Capital value and rental value growth
Poland and the Czech Republic are perfect for national and international distribution. Our warehouses are located at the major logistics hubs around Warsaw, Prague, Poznan and Łódz.
Magdalena SzulcBusiness Unit Director – Central Europe
CEI is a leading provider of skincare products in Europe and they occupy a SEGRO-developed 12,000 sq m warehouse in Strykow, Poland, for their manufacturing and product assembly, at the crossroads of Poland’s main north-south and east-west motorways.
Operating summary of the year
° We faced strong competition for customers in Poland again in 2016, which caused our vacancy rate to rise slightly during the year. However, economic conditions and occupier demand remain strong and market vacancy is low by historic standards.
° Completed 93,000 sq m of new warehouses, 93 per cent of which were pre-let, including to Tesco and Johnson Matthey.
Opportunities for the year ahead
° 28,000 sq m of space under development, 91 per cent pre-let, including smaller warehouses in Prague and an 11,600 sq m warehouse in Ozarow for third party logistics company, CAT.
° Occupier demand remains healthy in Poland and we will continue to seek pre-let agreements for new buildings on our well-located land bank.
Risks for the year ahead
° Competition for customers in Poland remains strong, particularly from trader-developers, which may impact the potential for rental growth or even exert downward pressure on rents.
Rest of SEGRO
93%
Poland 6%
Czech Republic 1%
6.7%
–2.6% 0.2%0.6%
6.4%
4.3%
6.0%
Retail 22%
Technology, Media and Telecoms
4%
Manufacturing 31%
Services 3%
Post & Parcel Delivery
3%
Other 3%Wholesale &
Retail Distribution 18%
Transport & Logistics
16%
40SEGRO Annual Report and Accounts 2016
Corporate Social Responsibility
Overview
Responsible SEGROSEGRO’s core business involves being a landlord to our customers, but we are much more than this. We have employees, suppliers, communities, governmental bodies and investors who have their own expectations about how we interact with them. We also have a responsibility to protect the environment in which we operate, owning and developing buildings which use natural resources efficiently, both during construction and occupation.
Responsible SEGRO, introduced in 2016, provides a framework around which we describe and report on our responsibilities to all of our stakeholders.
With responsibility embedded within our strategic thinking, we prioritise taking time to listen to our people, communities and stakeholders and ensure that we exceed their expectations.
We believe that this collaborative approach enables us to make informed decisions which are beneficial to all of our stakeholders and to the environment.
One of our core Values is to keep one eye on the horizon. Real estate is a long-term investment and we need to ensure that it can thrive in a fast-moving business environment. It is vital that we understand our changing environment and adjust our business accordingly in order to make it future–proof: changing demographics, the impact of technology and the continuing rise of ecommerce are just a few factors which are currently affecting our business and the businesses of our customers. By investigating and understanding these trends, we aim to position our business for success in the long term.
Our PeopleWithout our employees, the success that we achieve would not be possible so we invest substantially in our people and in making working at SEGRO an enjoyable and rewarding experience.
In 2016, we continued to embed our Purpose and Values into the Company’s culture and to make them tangible through a number of Company-wide initiatives which have enabled our Values to be integral to the way we work.
Our CommunitySEGRO continues to invest in the communities in which we operate. Our commitment in this area is based on collaboration and partnership and is fundamental to our business.
We are proud of our contribution towards enhancing communities through the creation of skills and employment schemes in 2016. The successful outcomes from the London Community Fund are an excellent example of our commitment in this area and can be seen in further detail on page 44.
Our EnvironmentBy focusing on materials, energy and waste, we have made significant progress on our 2020 targets in 2016.
An example of SEGRO’s level of commitment to the environment can be seen in our Navigation Park scheme (London’s first ‘carbon neutral’ industrial scheme) which was launched in 2016. The project (which is explored further on
page 46) sets a fantastic benchmark of what we can achieve as a business and gives an idea of how we intend to develop in the future.
Our StakeholdersOur relationships with our customers, suppliers and investors as well as our involvement with industry bodies enables us to make informed strategic decisions for the benefit of all our stakeholders.
2016 saw an investment in new systems and practices aimed to enhance our commitment to our stakeholders.
What to expect in 2017We have the following objectives for 2017:
° We will engage with our teams around the results of our Employee Survey to create meaningful local action plans which are underpinned by our Purpose and Values.
° We will set up a Berkshire Community Fund to replicate the success of the London Community Fund.
° Having achieved our operational efficiency targets for Carbon, Water and Waste, ahead of our 2020 deadline, we will be reviewing our SEGRO 2020 targets in 2017 to reflect the changing demands on our environment.
° We will fully consider the results of our annual survey, take on board the feedback received and then implement improvements aimed at delivering a better product and service to our customers
David Sleath Chief Executive
Health and SafetyStandards of health and safety are of critical importance to SEGRO. Throughout 2016, we have continued our work to embed our Health and Safety policy into our company culture, managing risks through tight controls, training and raising awareness.
SEGRO has thorough health and safety management procedures in operation across the Group allowing our excellent record in this area to be maintained. As part of our monthly reporting, all updates, incidents or health and safety related issues are reported to senior management and the Board, with any serious incidents being fully investigated as soon as we are made aware of them.
Our Group Health and Safety policy can be accessed on our website – www.SEGRO.com/csr/policies.
For the second consecutive year, our Accident Frequency Rate for SEGRO employees was zero and there were no health and safety prosecutions, enforcement actions or fatalities.
For the fourth consecutive year, SEGRO was awarded a RoSPA Gold Award in 2016. This award reflects our commitment to, and practical application of, exceptional health and safety procedures across all our Business operations.
Our focus in 2016 was to fully implement our recently introduced Construction Standard and launch a new online tool called Safety Matters. More details on these initiatives are in our Responsible SEGRO Report – www.SEGRO.com/csr/reports.

41Overview Governance Financial Statements
Strategic Report
Code of EthicsSEGRO seeks to maintain the highest ethical standards in our business activities. Our Code of Ethics is aligned both to the laws and regulations that control our operations and to our Purpose and Values. The Code is a condition of each employee’s terms of employment and reflects the basic level of acceptable behaviour to help ensure that our employees always act in the Company’s best interests.
The Code incorporates policies on bribery, corruption and fraud, gifts and hospitality, insider trading, confidentiality, conflicts of interest, relationships with our stakeholders, political and charitable donations and raising serious concerns.
All employees receive information on our Code of Ethics when starting work at SEGRO and are required to complete a training course as part of their induction. On an annual basis, employees are required to certify that they continue to understand and adhere to the Code.
Our policies are regularly reviewed to reflect the requirements of the Company and the concerns of our employees to ensure they remain relevant. Any changes made to policies are communicated across the Group.
Any breaches of the Code of Ethics are fully investigated and managed accordingly by the General Counsel or Group HR Director as necessary.
Furthermore, as a business we recognise our responsibility to be aware of the potential risks of slavery and human trafficking within our organisation and supply chain. In order to ensure compliance with the Modern Slavery Act 2015, we have started to amend our existing policies and to create new policies. We will publish a statement in the first half of 2017 to reflect our zero tolerance approach, in accordance with the legislation.
PartnershipsPurpose & Values
WasteCustomers
Jobs & SkillsDiversity
EnergyInvestors
CharityTalent
MaterialsSuppliers

42SEGRO Annual Report and Accounts 2016
SEGRO employs 285 people across Europe who work together to serve our 1,200 customers. Whilst our employee network is spread over ten countries, our strong culture means that we are able to operate successfully as one cohesive, collaborative and inclusive team.
Purpose and ValuesOur core beliefs about how we do business and our expert people set us apart from our peers. Whilst our culture has evolved over our long history, we have retained our entrepreneurial spirit and our pride in our customers and our teams.
Our Purpose — ‘We create the space that enables extraordinary things to happen’ — is a differentiating statement that energises us as a team, whilst our Values guide our decision making.
Throughout 2016 we continued with the journey we started in 2014 to bring our Purpose and Values to life. We have launched a number of initiatives to make the Values tangible to our business, including delivering five corporate actions (see table below for details).
The success of our programme is evident in the improved employee survey results achieved in 2016 in which our employee engagement score reached 90 per cent. Highlights from the survey include 97 per cent of employees caring about the future of SEGRO and 93 per cent being proud to say they work for SEGRO.
DiversityWe believe that being fair, open minded and free from bias helps us to attract and retain the best people and ultimately leads to better business decisions.
We have stringent policies in place with regard to equal opportunities and human rights which assist us in achieving our strategic goals in this area.
Every employee receives diversity training as part of the induction process, which highlights the importance we place on equal opportunities. Our Gender Diversity policy recognises the recommendations of the UK Davies Report on Women on Boards and agrees with the conclusion that greater efforts should be made to improve the gender balance of corporate boards. SEGRO has a good record of promoting and appointing women to senior roles and we offer flexible training and mentoring programmes to ensure that all our employees achieve their potential, taking account of their diverse development needs.
In 2016, our Executive Directors and Leadership Team completed Unconscious Bias training as a group. This led to an improved understanding and awareness of this important subject among the leaders of our business.
TalentOur approach to developing talent is quite simple – we want everyone to be able to maximise their potential whilst with SEGRO.
SEGRO continued to invest in a robust training programme in 2016. Our ‘Space to grow’ programme offers a broad range of online and off-line training courses in practical and softer skills, alongside dynamic learning opportunities in a wide number of languages.
In 2016, 81 per cent of employees said they had relevant access to training and development.
285employees serving 1,200 customers
4%staff turnover in 2016
6,422hours of training delivered in 2016
Liz Reilly Group HR Director
Gender diversity
Board
Female 10%
Male 90%
Leadership Team
Female 26%
Male 74%
Workforce
Female 44%
Male 56%
Corporate Social Responsibility
Our People
Executive Directors 360 Feedback
Say it like it is. The Executive Directors led from the front by giving each other feedback and getting feedback from their direct reports through in-depth 360 feedback interviews.
Customer Relationship Management
Stand side by side. We invested in a new Customer Relationship Management system and customer engagement programme to harness our networks across SEGRO and enhance our customer relationships.
Remuneration Alignment
Stand side by side. We launched a consultation programme amongst a cross section of employees to assess whether our all-employee Bonus Scheme was aligned to our Purpose and Values. We made changes to the Scheme as a result to include a common Group measure for all employees (Total Property Return).
Creation of our Futures Group/Customers’ Futures Forum
Keeping one eye on the horizon/If the door is closed... We brought together a group of employees to assess the potential ‘disruptors and opportunities’ in our sector. The group reported their findings to the Board. We also hosted a Customers’ Futures Forum with a number of our customers to share our research and gain insight into some of the trends impacting their businesses.
Reduction in Reporting Make the boat go faster. We challenged ourselves to consider whether we could improve the efficiency of our reporting. The Chief Executive wrote to all employees to ask them for their thoughts and feedback and as a result we were able to remove a number of reports and reduced the frequency of others.
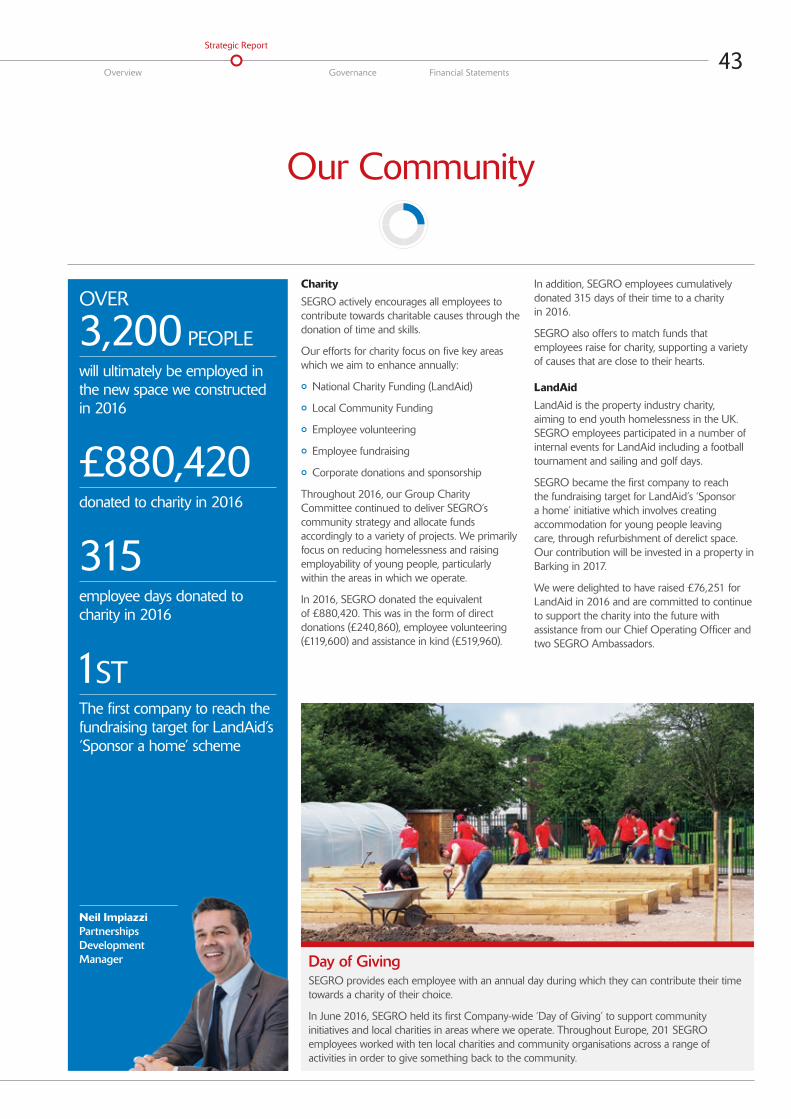
43Overview Governance Financial Statements
Strategic Report
Our Community
Charity
SEGRO actively encourages all employees to contribute towards charitable causes through the donation of time and skills.
Our efforts for charity focus on five key areas which we aim to enhance annually:
° National Charity Funding (LandAid)
° Local Community Funding
° Employee volunteering
° Employee fundraising
° Corporate donations and sponsorship
Throughout 2016, our Group Charity Committee continued to deliver SEGRO’s community strategy and allocate funds accordingly to a variety of projects. We primarily focus on reducing homelessness and raising employability of young people, particularly within the areas in which we operate.
In 2016, SEGRO donated the equivalent of £880,420. This was in the form of direct donations (£240,860), employee volunteering (£119,600) and assistance in kind (£519,960).
In addition, SEGRO employees cumulatively donated 315 days of their time to a charity in 2016.
SEGRO also offers to match funds that employees raise for charity, supporting a variety of causes that are close to their hearts.
LandAid
LandAid is the property industry charity, aiming to end youth homelessness in the UK. SEGRO employees participated in a number of internal events for LandAid including a football tournament and sailing and golf days.
SEGRO became the first company to reach the fundraising target for LandAid’s ‘Sponsor a home’ initiative which involves creating accommodation for young people leaving care, through refurbishment of derelict space. Our contribution will be invested in a property in Barking in 2017.
We were delighted to have raised £76,251 for LandAid in 2016 and are committed to continue to support the charity into the future with assistance from our Chief Operating Officer and two SEGRO Ambassadors.
OVER
3,200 PEOPLE
will ultimately be employed in the new space we constructed in 2016
£880,420 donated to charity in 2016
315employee days donated to charity in 2016
1STThe first company to reach the fundraising target for LandAid’s ‘Sponsor a home’ scheme
Day of GivingSEGRO provides each employee with an annual day during which they can contribute their time towards a charity of their choice.
In June 2016, SEGRO held its first Company-wide ‘Day of Giving’ to support community initiatives and local charities in areas where we operate. Throughout Europe, 201 SEGRO employees worked with ten local charities and community organisations across a range of activities in order to give something back to the community.
Neil Impiazzi Partnerships Development Manager
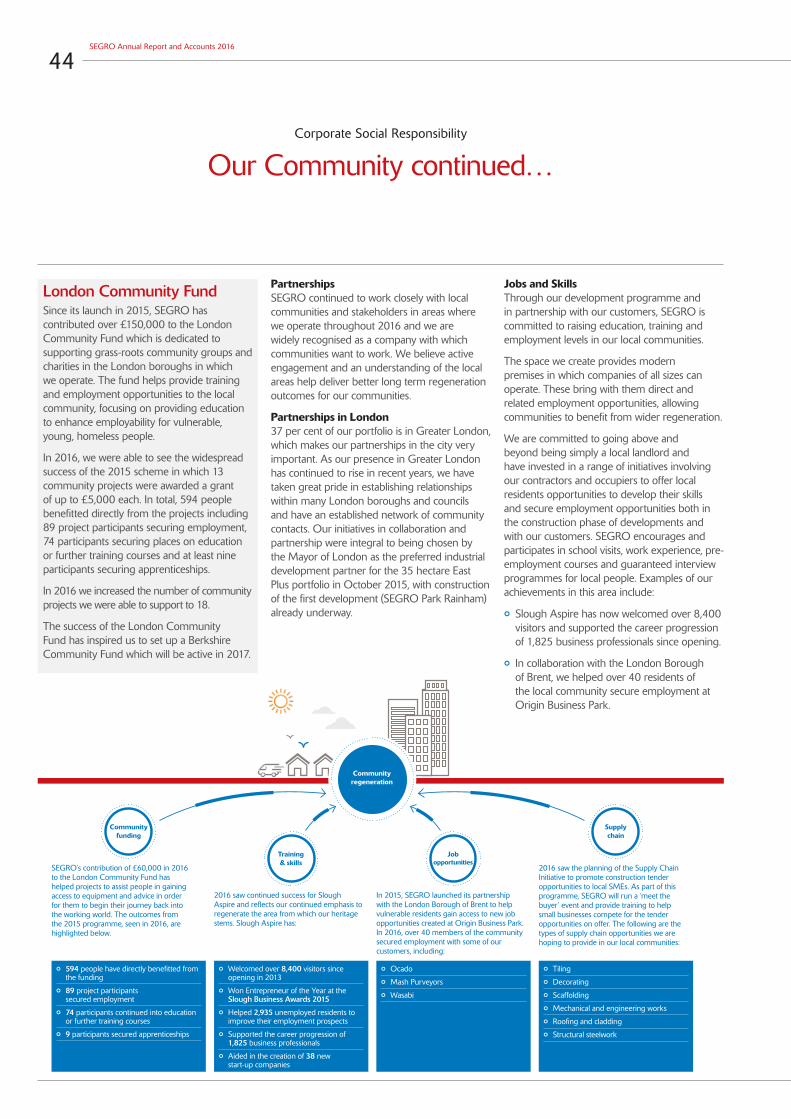
44SEGRO Annual Report and Accounts 2016
Corporate Social Responsibility
Our Community continued…
London Community FundSince its launch in 2015, SEGRO has contributed over £150,000 to the London Community Fund which is dedicated to supporting grass-roots community groups and charities in the London boroughs in which we operate. The fund helps provide training and employment opportunities to the local community, focusing on providing education to enhance employability for vulnerable, young, homeless people.
In 2016, we were able to see the widespread success of the 2015 scheme in which 13 community projects were awarded a grant of up to £5,000 each. In total, 594 people benefitted directly from the projects including 89 project participants securing employment, 74 participants securing places on education or further training courses and at least nine participants securing apprenticeships.
In 2016 we increased the number of community projects we were able to support to 18.
The success of the London Community Fund has inspired us to set up a Berkshire Community Fund which will be active in 2017.
Jobs and SkillsThrough our development programme and in partnership with our customers, SEGRO is committed to raising education, training and employment levels in our local communities.
The space we create provides modern premises in which companies of all sizes can operate. These bring with them direct and related employment opportunities, allowing communities to benefit from wider regeneration.
We are committed to going above and beyond being simply a local landlord and have invested in a range of initiatives involving our contractors and occupiers to offer local residents opportunities to develop their skills and secure employment opportunities both in the construction phase of developments and with our customers. SEGRO encourages and participates in school visits, work experience, pre-employment courses and guaranteed interview programmes for local people. Examples of our achievements in this area include:
° Slough Aspire has now welcomed over 8,400 visitors and supported the career progression of 1,825 business professionals since opening.
° In collaboration with the London Borough of Brent, we helped over 40 residents of the local community secure employment at Origin Business Park.
° 594 people have directly benefitted from the funding
° 89 project participants secured employment
° 74 participants continued into education or further training courses
° 9 participants secured apprenticeships
° Ocado
° Mash Purveyors
° Wasabi
° Tiling
° Decorating
° Scaffolding
° Mechanical and engineering works
° Roofing and cladding
° Structural steelwork
° Welcomed over 8,400 visitors since opening in 2013
° Won Entrepreneur of the Year at the Slough Business Awards 2015
° Helped 2,935 unemployed residents to improve their employment prospects
° Supported the career progression of 1,825 business professionals
° Aided in the creation of 38 new start-up companies
Supply chain
Community regeneration
Community funding
SEGRO’s contribution of £60,000 in 2016 to the London Community Fund has helped projects to assist people in gaining access to equipment and advice in order for them to begin their journey back into the working world. The outcomes from the 2015 programme, seen in 2016, are highlighted below.
2016 saw the planning of the Supply Chain Initiative to promote construction tender opportunities to local SMEs. As part of this programme, SEGRO will run a ‘meet the buyer’ event and provide training to help small businesses compete for the tender opportunities on offer. The following are the types of supply chain opportunities we are hoping to provide in our local communities:
Training & skills
Job opportunities
2016 saw continued success for Slough Aspire and reflects our continued emphasis to regenerate the area from which our heritage stems. Slough Aspire has:
In 2015, SEGRO launched its partnership with the London Borough of Brent to help vulnerable residents gain access to new job opportunities created at Origin Business Park. In 2016, over 40 members of the community secured employment with some of our customers, including:
PartnershipsSEGRO continued to work closely with local communities and stakeholders in areas where we operate throughout 2016 and we are widely recognised as a company with which communities want to work. We believe active engagement and an understanding of the local areas help deliver better long term regeneration outcomes for our communities.
Partnerships in London37 per cent of our portfolio is in Greater London, which makes our partnerships in the city very important. As our presence in Greater London has continued to rise in recent years, we have taken great pride in establishing relationships within many London boroughs and councils and have an established network of community contacts. Our initiatives in collaboration and partnership were integral to being chosen by the Mayor of London as the preferred industrial development partner for the 35 hectare East Plus portfolio in October 2015, with construction of the first development (SEGRO Park Rainham) already underway.
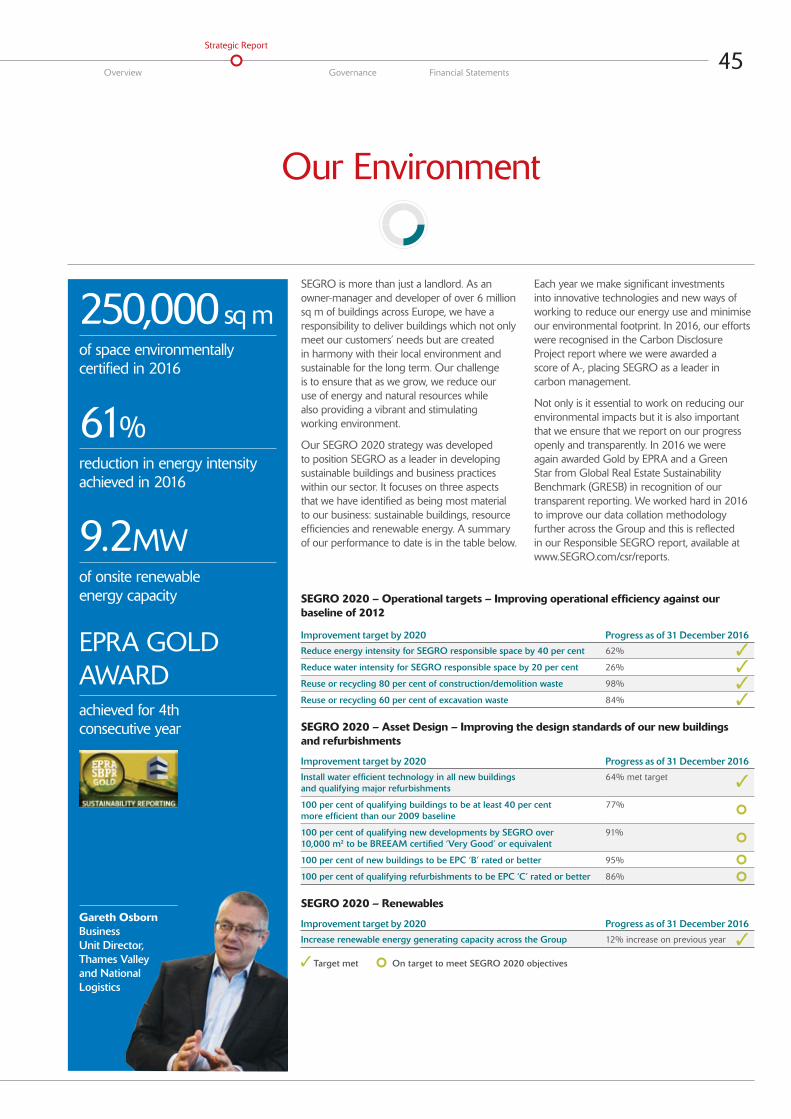
45Overview Governance Financial Statements
Strategic Report
Our Environment
SEGRO is more than just a landlord. As an owner-manager and developer of over 6 million sq m of buildings across Europe, we have a responsibility to deliver buildings which not only meet our customers’ needs but are created in harmony with their local environment and sustainable for the long term. Our challenge is to ensure that as we grow, we reduce our use of energy and natural resources while also providing a vibrant and stimulating working environment.
Our SEGRO 2020 strategy was developed to position SEGRO as a leader in developing sustainable buildings and business practices within our sector. It focuses on three aspects that we have identified as being most material to our business: sustainable buildings, resource efficiencies and renewable energy. A summary of our performance to date is in the table below.
Each year we make significant investments into innovative technologies and new ways of working to reduce our energy use and minimise our environmental footprint. In 2016, our efforts were recognised in the Carbon Disclosure Project report where we were awarded a score of A-, placing SEGRO as a leader in carbon management.
Not only is it essential to work on reducing our environmental impacts but it is also important that we ensure that we report on our progress openly and transparently. In 2016 we were again awarded Gold by EPRA and a Green Star from Global Real Estate Sustainability Benchmark (GRESB) in recognition of our transparent reporting. We worked hard in 2016 to improve our data collation methodology further across the Group and this is reflected in our Responsible SEGRO report, available at www.SEGRO.com/csr/reports.
SEGRO 2020 – Operational targets – Improving operational efficiency against our baseline of 2012 Improvement target by 2020 Progress as of 31 December 2016
Reduce energy intensity for SEGRO responsible space by 40 per cent 62%
Reduce water intensity for SEGRO responsible space by 20 per cent 26%
Reuse or recycling 80 per cent of construction/demolition waste 98%
Reuse or recycling 60 per cent of excavation waste 84% SEGRO 2020 – Asset Design – Improving the design standards of our new buildings and refurbishments Improvement target by 2020 Progress as of 31 December 2016
Install water efficient technology in all new buildings and qualifying major refurbishments
64% met target
100 per cent of qualifying buildings to be at least 40 per cent more efficient than our 2009 baseline
77%
100 per cent of qualifying new developments by SEGRO over 10,000 m2 to be BREEAM certified ‘Very Good’ or equivalent
91%
100 per cent of new buildings to be EPC ‘B’ rated or better 95%
100 per cent of qualifying refurbishments to be EPC ‘C’ rated or better 86% SEGRO 2020 – Renewables Improvement target by 2020 Progress as of 31 December 2016
Increase renewable energy generating capacity across the Group 12% increase on previous year
Target met On target to meet SEGRO 2020 objectives
250,000 sq mof space environmentally certified in 2016
61%reduction in energy intensity achieved in 2016
9.2MWof onsite renewable energy capacity
EPRA GOLD AWARD achieved for 4th consecutive year
Gareth Osborn Business Unit Director, Thames Valley and National Logistics

46SEGRO Annual Report and Accounts 2016
Corporate Social Responsibility
Our Environment continued…
GHG Reporting GLOBAL GHG EMISSIONS DATA IN TONNES CO2eEmissions from: 2016 2015
Scope 1 emissions – combustion of fuels 7,227 ∆ 5,964
Scope 2 emissions – purchased energy (location based)* 12,959 ∆ 21,438
Scope 2 emissions – purchased energy (market based)** 13,049 ∆ 19,096
Total CO2e footprint (using location based) 20,186 ∆ 27,403
Chosen intensity Measurement***
Emissions from like-for-like estate normalised to tonnes CO2e/m2 of responsible space 0.008 ∆ 0.011
* Electricity emissions are calculated using location based methods. Emissions calculations are taken from GRI guidance used here for illustration purposes only.
** Market based Electricity emissions are included here for comparison purposes only.
*** SEGRO’s chosen intensity measure is a like-for-like comparison for sites in the portfolio in both 2015 and 2016. This comparison uses EPRA guidance on best practice for real estate companies.
∆ Selected information within the scope of KPMG limited assurance.
Mandatory Greenhouse Gas (GHG) Emissions StatementThis section has been prepared in accordance with our regulatory obligation to report greenhouse gas emissions pursuant to Section 7 of The Companies Act 2006 (Strategic Report and Directors’ Report) Regulations 2013. As well as fulfilling these mandatory greenhouse gas reporting requirements, SEGRO is committed to EPRA Best Practice Recommendations for Sustainability reporting, for which we have won a Gold award four years running.
The table above provides information on SEGRO’s greenhouse gas emissions for 2016, in which we are pleased to report a 26 per cent reduction in like-for-like Scope 1 and 2 emissions from 2015. The reduction is driven in Scope 2 (location-based) emissions, which is largely due to the increasingly accurate allocation of meters and greater clarity in billed data across our portfolio. Further improvements have also been made by the increased occupation of assets, predominantly in Europe, equating to a further move of emissions from Scope 2 to Scope 3.
We report our data using an operational control approach to define our organisational boundary, as per the Greenhouse Gas Protocol. The market based methodology has been applied to calculate the Scope 2 emissions, however supplier-specific emission factors have been collected for UK only. For the non-UK portfolio,
the IEA Reliable Disclosure Systems residual emission factors have been applied.
We disclose data for both our like-for-like and absolute portfolios in this report and a detailed description of our methodology and a full disclosure of emissions factors used can be found at www.SEGRO.com/csr.
As in previous years, Q4 consumption data is not available at the time of reporting due to billing cycles and is therefore estimated. Data gaps have been filled using the EPRA ‘day rate’ estimation technique. In 2016, SEGRO has sought to increase the accuracy of the EPRA ‘day rate’ estimation methodology for Q4 natural gas consumption by building in seasonal sensitivity. The ‘day rate’ for 2016 Scope 1 emissions reflects actual natural consumption during previous winter months and has resulted in a higher, but more representative, value than in previous years.
SEGRO’s chosen GHG intensity metric is calculated using the Scope 1 and 2 emissions within a like for like sub-set of SEGRO’s overall portfolio. The like-for-like portfolio is defined as currently owned sites which have both been in the portfolio for 2015 and 2016 and have remained either fully occupied or fully vacant for both years.
KPMG Limited AssuranceWe engaged KPMG LLP to undertake an independent limited assurance engagement, using the assurance standards ISAE 3000 and ISAE 3410 over Selected Information included in this Annual Report. The Selected Information within the scope of this assurance is highlighted with the symbol ∆ in the table of emissions, above. KPMG’s full statement is available on our website at www.SEGRO.com/csr/reports and KPMG has issued an unqualified opinion on the Selected Information.
In order to reach its opinion, KPMG performed a range of procedures which included interviews with management, examination of reporting systems and data testing. A summary of the work KPMG performed is included within its assurance opinion.
The level of assurance provided for a limited assurance engagement is substantially lower than a reasonable assurance engagement. Non-financial performance information, greenhouse gas quantification in particular, is subject to more inherent limitations than financial information. It is important to read the Selected Information in the context of KPMG’s full limited assurance statement and the reporting criteria as set out in the SEGRO reporting guidelines available at www.SEGRO.com/csr/reports.
Low Carbon Buildings: Navigation ParkThe Navigation Park development, which has achieved a BREEAM rating of ‘Excellent’, is London’s first ‘carbon neutral’ industrial scheme. This means the building is expected to create as much clean energy as it uses.
The scheme harnesses energy efficient initiatives including LED lighting controlled by motion and light sensors and high U-Value building fabric, outperforming building regulations by approximately 33 per cent.
The most significant component in the scheme’s ‘carbon neutral’ status has been achieved through the installation of 428 kWp of photovoltaic panels spread across the three buildings supplying clean energy to 16,286 sq m of industrial space. This involved industry-leading innovation to ensure the maximum possible size system could be installed, going materially beyond minimum requirements. This in turn guarantees considerable operational cost savings for the occupier as well as a significantly reduced carbon footprint for the development.
The system will generate 422,465 kWh of energy per year, with annual CO2 savings being in the region of 224 tonnes per year.
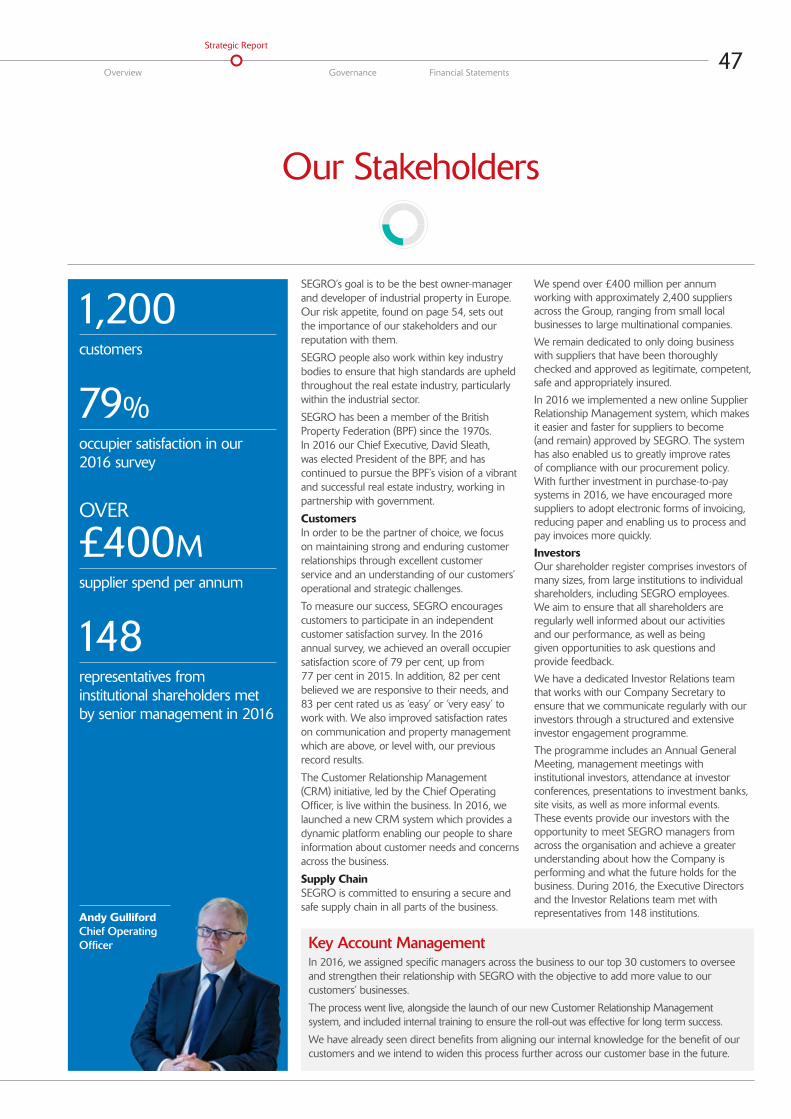
47Overview Governance Financial Statements
Strategic Report
Our Stakeholders
SEGRO’s goal is to be the best owner-manager and developer of industrial property in Europe. Our risk appetite, found on page 54, sets out the importance of our stakeholders and our reputation with them.
SEGRO people also work within key industry bodies to ensure that high standards are upheld throughout the real estate industry, particularly within the industrial sector.
SEGRO has been a member of the British Property Federation (BPF) since the 1970s. In 2016 our Chief Executive, David Sleath, was elected President of the BPF, and has continued to pursue the BPF’s vision of a vibrant and successful real estate industry, working in partnership with government.
CustomersIn order to be the partner of choice, we focus on maintaining strong and enduring customer relationships through excellent customer service and an understanding of our customers’ operational and strategic challenges.
To measure our success, SEGRO encourages customers to participate in an independent customer satisfaction survey. In the 2016 annual survey, we achieved an overall occupier satisfaction score of 79 per cent, up from 77 per cent in 2015. In addition, 82 per cent believed we are responsive to their needs, and 83 per cent rated us as ‘easy’ or ‘very easy’ to work with. We also improved satisfaction rates on communication and property management which are above, or level with, our previous record results.
The Customer Relationship Management (CRM) initiative, led by the Chief Operating Officer, is live within the business. In 2016, we launched a new CRM system which provides a dynamic platform enabling our people to share information about customer needs and concerns across the business.
Supply ChainSEGRO is committed to ensuring a secure and safe supply chain in all parts of the business.
We spend over £400 million per annum working with approximately 2,400 suppliers across the Group, ranging from small local businesses to large multinational companies.
We remain dedicated to only doing business with suppliers that have been thoroughly checked and approved as legitimate, competent, safe and appropriately insured.
In 2016 we implemented a new online Supplier Relationship Management system, which makes it easier and faster for suppliers to become (and remain) approved by SEGRO. The system has also enabled us to greatly improve rates of compliance with our procurement policy. With further investment in purchase-to-pay systems in 2016, we have encouraged more suppliers to adopt electronic forms of invoicing, reducing paper and enabling us to process and pay invoices more quickly.
InvestorsOur shareholder register comprises investors of many sizes, from large institutions to individual shareholders, including SEGRO employees. We aim to ensure that all shareholders are regularly well informed about our activities and our performance, as well as being given opportunities to ask questions and provide feedback.
We have a dedicated Investor Relations team that works with our Company Secretary to ensure that we communicate regularly with our investors through a structured and extensive investor engagement programme.
The programme includes an Annual General Meeting, management meetings with institutional investors, attendance at investor conferences, presentations to investment banks, site visits, as well as more informal events. These events provide our investors with the opportunity to meet SEGRO managers from across the organisation and achieve a greater understanding about how the Company is performing and what the future holds for the business. During 2016, the Executive Directors and the Investor Relations team met with representatives from 148 institutions.
Key Account ManagementIn 2016, we assigned specific managers across the business to our top 30 customers to oversee and strengthen their relationship with SEGRO with the objective to add more value to our customers’ businesses.
The process went live, alongside the launch of our new Customer Relationship Management system, and included internal training to ensure the roll-out was effective for long term success.
We have already seen direct benefits from aligning our internal knowledge for the benefit of our customers and we intend to widen this process further across our customer base in the future.
1,200customers
79%occupier satisfaction in our 2016 survey
OVER £400Msupplier spend per annum
148representatives from institutional shareholders met by senior management in 2016
Andy Gulliford Chief Operating Officer

48SEGRO Annual Report and Accounts 2016
Financial Review
A strong financial position
Presentation of financial informationThe Group financial statements are prepared under IFRS where the Group’s interests in joint ventures are shown as a single line item on the income statement and balance sheet and subsidiaries are consolidated at 100 per cent.
The Adjusted profit measure reflects the underlying financial performance of the Group’s property rental business, which is our core operating activity. It is based on the Best Practices Recommendations Guidelines of the European Public Real Estate Association (EPRA) which are widely used alternate metrics to their IFRS equivalents within the European real estate sector (further details on EPRA Best Practices Recommendations can be found at www.epra.com). In calculating Adjusted profit, the Directors may also exclude additional items considered to be non-recurring, unusual, or significant by virtue of size and nature. See Table 2 of the Supplementary Notes to the financial statements for further information on these adjustments, including the adjustment made in 2015.
A detailed reconciliation between Adjusted profit after tax and IFRS profit after tax is provided in Note 2 of the Financial Statements. This is not on a proportionally-consolidated basis.
Reconciliations between SEGRO Adjusted metrics and EPRA metrics are provided in the Supplementary Notes to the financial statements, which also include other EPRA metrics as well as SEGRO’s Adjusted income statement and balance sheet presented on a proportionally consolidated basis.
SEGRO monitors these alternative metrics, as well as the EPRA metrics for vacancy rate, net asset value and total cost ratio, as they provide a transparent and consistent basis to enable comparison between European property companies.
8.0%2015: 20.6%
EPRA NAV growth2
£426.4M2015: £686.5M
IFRS profit before tax
53.9P2015: 91.7P
IFRS earnings per share – basic
500P2015: 463P
EPRA NAV per share2
9.3%2015: 18.4%
Total property return1
£154.5M2015: £138.6M
Adjusted profit before tax2
19.7P2015: 18.4P
Adjusted earnings per share2
33%2015: 38%
Look-through loan to value ratio1
1 Management reviews the performance of the business and the financial structure primarily on a proportionally consolidated basis which includes the Group’s share of joint ventures on a line by line basis. The Group’s key performance indicators are therefore also presented on this basis.
2 Adjusted profit before tax, Adjusted EPS and EPRA NAV are alternate metrics to their IFRS equivalents.
The actions taken to improve the quality of our property portfolio have resulted in an 11 per cent increase in Adjusted profit before tax. EPRA NAV per share increased by 8 per cent to 500 pence and the balance sheet has been strengthened with the LTV ratio having improved from 38 per cent to 33 per cent.
Soumen Das Chief Financial Officer
2016 Highlights1

49Overview Governance Financial Statements
Strategic Report
Adjusted profit (Note 2)2016
£m2015
£mGross rental income 225.5 210.7
Property operating expenses (44.9) (37.7)
Net rental income 180.6 173.0
Joint venture management fee income 18.6 17.0
Administration expenses (31.4) (28.5)
Share of joint ventures’ Adjusted profit1 55.4 44.4
Adjusted operating profit before interest and tax 223.2 205.9
Net finance costs (including adjustments) (68.7) (67.3)
Adjusted profit before tax 154.5 138.6
Tax on Adjusted profit (1.8) (1.3)
Non-controlling interests share of Adjusted profit (0.1) –
Adjusted profit after tax 152.6 137.3
1 Comprises net property rental income less administration expenses, net interest expenses and taxation.
Adjusted profitAdjusted profit before tax increased by 11.5 per cent to £154.5 million (2015: £138.6 million) during 2016 reflecting increased gross rental income and joint venture fees offset by an increase in property operating expenses, net finance costs and administration expenses (see Note 2).
Net rental income Net rental income increased by £7.6 million to £180.6 million, reflecting the positive net impact of investment activity, development completions and the strengthening of the euro during the period, offset by the impact of disposals.
On a like-for-like basis1, before other items (primarily corporate centre and other costs not specifically allocated to a geographic business unit), net rental income increased by £8.0 million, or 4.0 per cent, compared to 2015. This is mainly due to strong rental performance in our UK portfolio more than offsetting a slight fall in Continental Europe, in particular Poland.
Net finance costsNet finance costs (including adjustments) increased by £1.4 million in 2016 to £68.7 million. The comparative period benefitted from interest income of £4.3 million paid on deferred consideration receivable in respect of the SELP transaction which was fully paid during 2015 and therefore did not similarly benefit 2016.
Income from joint venturesJoint venture management fee income increased by £1.6 million to £18.6 million. This increase was largely due to increased development and management fees from SELP (£3.2 million), part of which relates to the size of the portfolio which was £2.1 billion at 31 December 2016, compared to £1.5 billion at 31 December 2015 (at 100 per cent). This was partially offset by £1.5 million lower fee income from the Airport Property Partnership (APP) joint venture.
SEGRO’s share of joint ventures’ Adjusted profit after tax increased by £11.0 million, or 24.8 per cent (from £44.4 million at 31 December 2015 to £55.4 million at 31 December 2016), reflecting the higher net income from the Group’s largest two joint ventures SELP and APP. This was partly offset by the closing of the Heathrow Big Box (HBB) joint venture in June 2015.
TaxationThe tax charge on Adjusted profit of £1.8 million (2015: £1.3 million) reflects an effective tax rate of 1.2 per cent (2015: 0.9 per cent), consistent with a Group target tax rate of less than 3 per cent.
The Group’s target tax rate reflects the fact that over three-quarters of its assets are located in the UK and France and qualify for REIT and SIIC status respectively in those countries. This status means that income from rental profits and gains on disposals of assets in the UK and France are exempt from corporation tax, provided SEGRO meets a number of conditions including, but not limited to, distributing 90 per cent of UK taxable profits.
Administrative and operating costsThe Group is focused on managing its cost base and uses a Total Cost Ratio (TCR) as a key measure of cost management. The TCR for 2016 has increased to 23.0 per cent from 22.2 per cent for 2015. This is based on Adjusted profit and therefore excludes the non-recurring £4.8 million pension settlement costs in 2015. The calculation is set out in Table 6 of the Supplementary Notes to the financial statements. Excluding the impact of share based payments, the TCR is 21.0 per cent which is a fall of 0.4 percent from 2015.
The balance of acquisitions, development completions, rental growth and disposals has increased the gross rental income (the denominator of this ratio) by £24.1 million, while total costs have increased by £7.7 million due to higher property operating and administration expenses (including increases in share based payments), and out of period credits in 2015. In calculating the TCR, management fees of £1.2 million (2015: £1.0 million) are shown as a reduction in costs rather than as income in line with EPRA BPR Guidelines and have consequently reduced the TCR by 0.3 per cent in the current and prior periods.
19.7PEarnings per share
Adjusted earnings per share Adjusted earnings per share are 19.7 pence (2015: 18.4 pence) reflecting a £15.3 million improvement in Adjusted profit after tax and non-controlling interests, an increased average number of shares as a result of the equity placing exercise in September 2016 and the take-up of the scrip dividend option offered with the 2015 final and 2016 interim dividends.
1 The like-for-like rental growth metric is based on properties held throughout both 2016 and 2015 on a proportionally consolidated basis. This provides details of underlying rental income growth excluding the distortive impact of acquisitions, disposals and development completions. Where an asset has been sold into a joint venture (transfers into SELP, for example) the 50 per cent share owned throughout the period is included in like-for-like calculation, with the balance shown as disposals.

50SEGRO Annual Report and Accounts 2016
Total property returnThe total property return (‘TPR’) for the portfolio in 2016 (calculated by MSCI Real Estate) was 9.3 per cent, which is lower than for 2015 (18.4 per cent), reflecting a lower capital return compared to the prior year. The TPR comprises an income return of 5.4 per cent (2015: 5.3 per cent) and a capital return of 3.7 per cent (12.4 per cent).
More detail on the performance of the property portfolio can be found in the Chief Executive’s Review.
IFRS profitIFRS profit before tax in 2016 was £426.4 million (2015: £686.5 million), equating to basic post-tax IFRS earnings per share of 53.9 pence compared with 91.7 pence for 2015, principally reflecting lower realised and unrealised gains in both the wholly-owned and joint venture portfolios.
A reconciliation between Adjusted profit before tax and IFRS profit before tax is provided in Note 2 to the financial statements.
Realised and unrealised gains on wholly-owned investment and trading properties of £246.0 million in 2016 (2015: £461.5 million gain) have been recognised in the income statement as the value of our portfolio increased during the year, albeit more slowly than in 2015. These comprised an unrealised valuation surplus of £231.3 million (2015: £439.8 million surplus) and a profit of £16.7 million on asset disposals (2015: £22.9 million profit), offset by increase in impairment provisions against trading properties of £2.0 million (2015: £1.2 million increase) where their fair values are deemed to be less than their original cost.
SEGRO’s share of realised and unrealised gains on properties held in joint ventures was £42.8 million (2015: £125.6 million) and is further analysed in Note 7.
IFRS earnings were also impacted by a net fair value loss on interest rate swaps and other derivatives of £2.6 million (2015: £23.7 million loss) and a tax charge of £7.7 million (2015: £3.7 million) of which £5.9 million (2015: £2.4 million) arises in respect of adjustments, primarily in relation to property valuations and disposals.
Balance sheetAt 31 December 2016, IFRS net assets attributable to ordinary shareholders were £4,182.1 million (31 December 2015: £3,489.9 million), reflecting 502 pence per share (31 December 2015: 468 pence) on a diluted basis.
EPRA NAV per share at 31 December 2016 was 500 pence (31 December 2015: 463 pence), the 8 per cent increase mainly reflecting property gains in the period. The chart below highlights the other principal factors behind the increase. A reconciliation between IFRS and EPRA NAV is available in Note 14 to the financial statements.
Cash flow and net debt reconciliationCash flow generated from operations was £101.2 million in 2016, an increase of £13.5 million from 2015 due mainly to the impact from increased Adjusted profit in the year and positive working capital flows from the disposal of trading properties in the year. The comparative period included the receipt of a US tax refund (£33.6 million) which was partially offset by an outflow of £24.8 million in order to early close out interest rate swaps.
Financial Review
A strong financial position continued…
EPRA NAV per share
31 December 2015
Adjusted EPS Dividend Realised andunrealised gains
Equityplacing
Exchangerate
31 December 2016
463p500p20p
(16)p (5)p
35p 3p
Cash flow bridge (£m)
Netborrowings at 31 December
2015
Cash flowfrom
operatingactivities
Dividend Aquisitionsand Capex
(including optionsand investment in
joint ventures)
Disposals OtherExchangemovement
on debt
FXderivativessettlement
Equityplacing
Netborrowings at 31 December
2016
(1,806.5) (89.0)
(529.8)
(168.4) (28.6) (9.7)
101.2 614.0
318.4
(1,598.4)

51Overview Governance Financial Statements
Strategic Report
The Group made net divestments of £84.2 million of investment properties and development (including options and loans to joint ventures) during the year on a cash flow basis (2015: £272.5 million investment). The Group received cash from disposals of £614.0 million (2015: £226.3 million) primarily in respect of the disposal of the Bath Road office portfolio and spent £429.7 million (2015: £470.8 million) to purchase and develop investment properties, invested £63.4 million in joint ventures (2015: £28.0 million) and £36.7 million in other property interests (2015: £nil).
Other significant cash flows include the equity placing in September 2016 which accounted for virtually all of the share proceeds of £318.4 million during the year. Furthermore the Group paid dividends of £89.0 million (2015: £91.5 million) where cash flows are reduced by the level of scrip uptake. The settlement of foreign exchange derivatives has led to a net outflow of £168.4 million as the euro has strengthened in the year.
Overall, net debt has decreased in the year from £1,806.5 million to £1,598.4 million.
Capital expenditureTable 7 in the Supplementary Note sets out analysis of the capital expenditure during the year. This includes acquisition and development spend, on an accruals basis, in respect of the Group’s wholly-owned investment and trading property portfolios, as well as the equivalent amounts for joint ventures at share.
Total spend for the year was £709.5 million, a decrease of £172.5 million compared to 2015. More detail on acquisitions can be found in the Chief Executive’s Review, although note that, where SEGRO has bought from a joint venture, the acquisition is reflected at 50 per cent.
Development capital expenditure increased by £137.2 million to £301.6 million, reflecting our stated intention to increase the level of investment in developments, both speculative and pre-let, to take advantage of strong occupier demand for modern space in our markets. Development spend incorporates interest capitalised of £5.8 million (2015: £3.0 million) including joint ventures at share.
Spend on existing completed properties totalled £22.0 million (2015: £25.0 million), of which £13.0 million (2015: £17.9 million) was for value-enhancing major refurbishment, infrastructure and fit-out costs prior to re-letting. The balance mainly comprises more minor refurbishment and fit-out costs, which equates to less than 6 per cent of Adjusted profit before tax and 1.2 per cent of total spend.
Treasury policies and governanceThe Group Treasury function operates within a formal treasury policy covering all aspects of treasury activity, including funding, counterparty exposure and management of interest rate, currency and liquidity risks. Group Treasury policies are reviewed by the Board at least once a year, most recently in September 2016.
Group Treasury reports on compliance with these policies on a quarterly basis to the Finance Committee, which includes the Chief Executive and is chaired by the Chief Financial Officer.
Financial position and fundingAt 31 December 2016, the Group’s net borrowings (including the Group’s share of borrowings in joint ventures) were £2,091.0 million (31 December 2015: £2,193.2 million).
Excluding the Group’s share of borrowings in joint ventures, net borrowings at 31 December 2016 were £1,598.4 million comprising gross borrowings of £1,630.4 million (all but £3.9 million of which were unsecured) and cash and cash equivalent balances of £32.0 million.
The Group’s share of the net borrowings in its joint ventures was £492.6 million comprising gross borrowings of £554.6 million (all of which were advanced on a non-recourse basis to SEGRO) and cash and cash equivalent balances of £62.0 million.
Cash and cash equivalent balances, together with the Group’s interest rate and foreign exchange derivatives portfolio, are spread amongst a strong group of banks, all but one of which currently have long-term credit ratings of A– or better.
2017 2018 2019 2020 2021 2022 2023Year
2024 ........................................................ 2035
5.0
199.6174.63.785.5
248.8162.059.8
298.0135.7181.6384.6
149.4210.9 222.4
0.1
198.4
Debt profile (£m)
SEGRO bonds SEGRO bank debt JV debt at share SEGRO undrawn
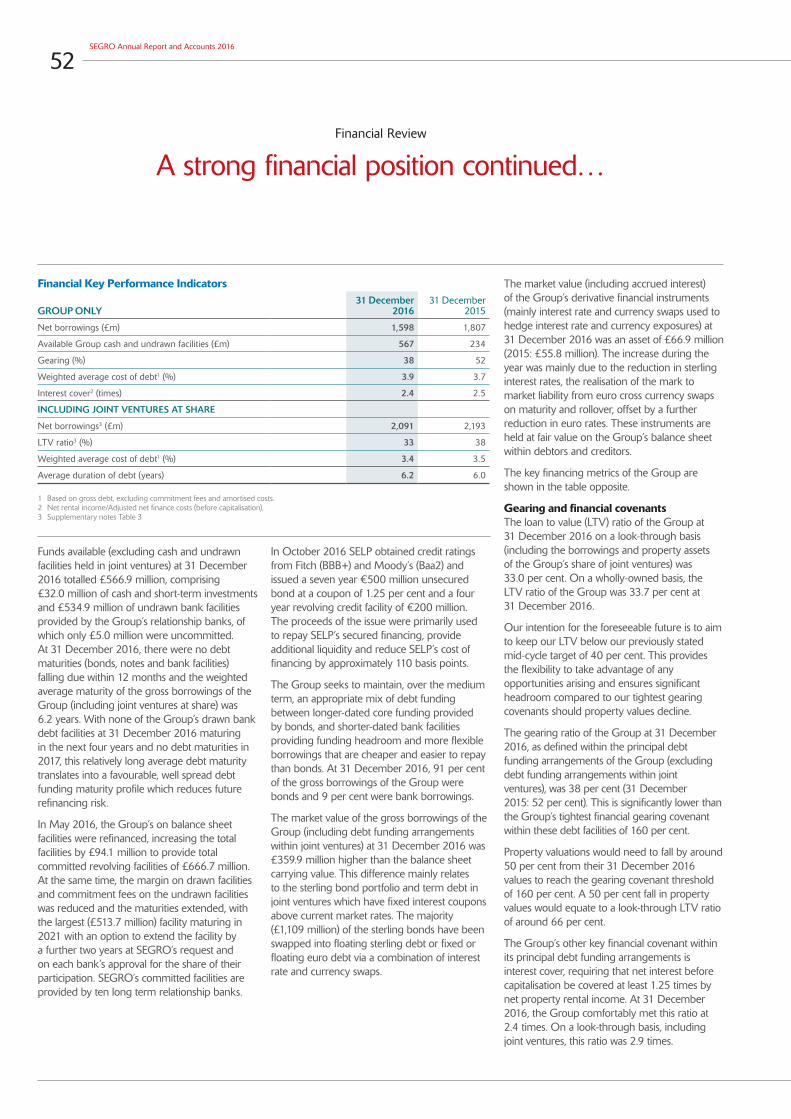
52SEGRO Annual Report and Accounts 2016
Financial Review
A strong financial position continued…
Funds available (excluding cash and undrawn facilities held in joint ventures) at 31 December 2016 totalled £566.9 million, comprising £32.0 million of cash and short-term investments and £534.9 million of undrawn bank facilities provided by the Group’s relationship banks, of which only £5.0 million were uncommitted. At 31 December 2016, there were no debt maturities (bonds, notes and bank facilities) falling due within 12 months and the weighted average maturity of the gross borrowings of the Group (including joint ventures at share) was 6.2 years. With none of the Group’s drawn bank debt facilities at 31 December 2016 maturing in the next four years and no debt maturities in 2017, this relatively long average debt maturity translates into a favourable, well spread debt funding maturity profile which reduces future refinancing risk.
In May 2016, the Group’s on balance sheet facilities were refinanced, increasing the total facilities by £94.1 million to provide total committed revolving facilities of £666.7 million. At the same time, the margin on drawn facilities and commitment fees on the undrawn facilities was reduced and the maturities extended, with the largest (£513.7 million) facility maturing in 2021 with an option to extend the facility by a further two years at SEGRO’s request and on each bank’s approval for the share of their participation. SEGRO’s committed facilities are provided by ten long term relationship banks.
In October 2016 SELP obtained credit ratings from Fitch (BBB+) and Moody’s (Baa2) and issued a seven year €500 million unsecured bond at a coupon of 1.25 per cent and a four year revolving credit facility of €200 million. The proceeds of the issue were primarily used to repay SELP’s secured financing, provide additional liquidity and reduce SELP’s cost of financing by approximately 110 basis points.
The Group seeks to maintain, over the medium term, an appropriate mix of debt funding between longer-dated core funding provided by bonds, and shorter-dated bank facilities providing funding headroom and more flexible borrowings that are cheaper and easier to repay than bonds. At 31 December 2016, 91 per cent of the gross borrowings of the Group were bonds and 9 per cent were bank borrowings.
The market value of the gross borrowings of the Group (including debt funding arrangements within joint ventures) at 31 December 2016 was £359.9 million higher than the balance sheet carrying value. This difference mainly relates to the sterling bond portfolio and term debt in joint ventures which have fixed interest coupons above current market rates. The majority (£1,109 million) of the sterling bonds have been swapped into floating sterling debt or fixed or floating euro debt via a combination of interest rate and currency swaps.
The market value (including accrued interest) of the Group’s derivative financial instruments (mainly interest rate and currency swaps used to hedge interest rate and currency exposures) at 31 December 2016 was an asset of £66.9 million (2015: £55.8 million). The increase during the year was mainly due to the reduction in sterling interest rates, the realisation of the mark to market liability from euro cross currency swaps on maturity and rollover, offset by a further reduction in euro rates. These instruments are held at fair value on the Group’s balance sheet within debtors and creditors.
The key financing metrics of the Group are shown in the table opposite.
Gearing and financial covenantsThe loan to value (LTV) ratio of the Group at 31 December 2016 on a look-through basis (including the borrowings and property assets of the Group’s share of joint ventures) was 33.0 per cent. On a wholly-owned basis, the LTV ratio of the Group was 33.7 per cent at 31 December 2016.
Our intention for the foreseeable future is to aim to keep our LTV below our previously stated mid-cycle target of 40 per cent. This provides the flexibility to take advantage of any opportunities arising and ensures significant headroom compared to our tightest gearing covenants should property values decline.
The gearing ratio of the Group at 31 December 2016, as defined within the principal debt funding arrangements of the Group (excluding debt funding arrangements within joint ventures), was 38 per cent (31 December 2015: 52 per cent). This is significantly lower than the Group’s tightest financial gearing covenant within these debt facilities of 160 per cent.
Property valuations would need to fall by around 50 per cent from their 31 December 2016 values to reach the gearing covenant threshold of 160 per cent. A 50 per cent fall in property values would equate to a look-through LTV ratio of around 66 per cent.
The Group’s other key financial covenant within its principal debt funding arrangements is interest cover, requiring that net interest before capitalisation be covered at least 1.25 times by net property rental income. At 31 December 2016, the Group comfortably met this ratio at 2.4 times. On a look-through basis, including joint ventures, this ratio was 2.9 times.
Financial Key Performance Indicators
GROUP ONLY31 December
201631 December
2015
Net borrowings (£m) 1,598 1,807
Available Group cash and undrawn facilities (£m) 567 234
Gearing (%) 38 52
Weighted average cost of debt1 (%) 3.9 3.7
Interest cover2 (times) 2.4 2.5
INCLUDING JOINT VENTURES AT SHARE
Net borrowings3 (£m) 2,091 2,193
LTV ratio3 (%) 33 38
Weighted average cost of debt1 (%) 3.4 3.5
Average duration of debt (years) 6.2 6.0
1 Based on gross debt, excluding commitment fees and amortised costs.2 Net rental income/Adjusted net finance costs (before capitalisation).3 Supplementary notes Table 3

53Overview Governance Financial Statements
Strategic Report
Policy
Sensitivity vs Adj PAT £ %
+1% (2.7m) (1.8%)
–1% +2.7m +1.8%
Fixed 50% 100%
80%
Interest rate risk exposure
The Group’s interest rate risk policy is that between 50 and 100 per cent of net borrowings (including the Group’s share of borrowings in joint ventures) should be at fixed or capped rates both at a Group level and by major borrowing currency (currently euro and sterling), including the impact of derivative financial instruments.
At 31 December 2016, including the impact of derivative instruments, 80 per cent (2015: 75 per cent) of the net borrowings of the Group (including the Group’s share of borrowings within joint ventures) were at fixed rates. By currency, 82 per cent of the euro denominated net borrowings and 75 per cent of the remaining net borrowings (predominantly sterling) were at fixed rates.
At 31 December 2016 the weighted average interest rate for gross borrowings (excluding those within joint ventures) was 3.9 per cent (2015: 3.7 per cent) before commitment fees and amortised costs (reflecting the lower quantum of drawn debt).
Including the impact, at share, of gross borrowings in joint ventures, the weighted average interest rate of the Group at 31 December 2016, before commitment fees and amortised costs, was 3.4 per cent (2015 3.5 per cent).
As a result of fixed rate cover in place, if short-term interest rates had been 1 per cent higher throughout the year to 31 December 2016, the adjusted net finance cost of the Group would have increased by approximately £2.7 million, representing around 1.8 per cent of Adjusted profit after tax.
The Group elects not to hedge account its interest rate derivatives portfolio. Therefore, movements in its fair value are taken to the income statement but, in accordance with EPRA Best Practices Recommendations Guidelines, these gains and losses are eliminated from Adjusted profit after tax.
Balance sheet hedging policy
Currencies vs £ -10% Actual +10%
NAV, £m (51) 4,182 +62
LTV, % (1.1) 33.0 +1.3
Adj profit, £m (4.4) 152.7 +5.4
Fixed 50% 100%
69%
Foreign currency translation exposure
The Group has negligible transactional foreign currency exposure, but does have a potentially significant currency translation exposure arising on the conversion of its substantial foreign currency denominated assets (mainly euro) and euro denominated earnings into sterling in the Group consolidated accounts. At 31 December 2016, the Group had gross foreign currency assets which were 69 per cent hedged by gross foreign currency denominated liabilities (including the impact of derivative financial instruments). Translation hedging has been reduced from the upper end of the policy range of between 50 per cent and 100 per cent to provide a more balanced impact on movements in the sterling/euro exchange rate on NAV and LTV.
Including the impact of forward foreign exchange and currency swap contracts used to hedge foreign currency denominated net assets, if the value of the other currencies in which the Group operates at 31 December 2016 weakened by 10 per cent against sterling (€1.29, in the case of euros), net assets would have decreased by approximately £51 million and there would have been a reduction in gearing of approximately 1.9 per cent and in the look-through LTV of 1.1 per cent.
The average exchange rate used to translate euro denominated earnings generated during 2016 into sterling within the consolidated income statement of the Group was €1.22: £1. Based on the hedging position at 31 December 2016, and assuming that this position had applied throughout 2016, if the euro had been 10 per cent weaker than it was against sterling throughout the year (€1.34: £1), Adjusted profit after tax for the year would have been approximately £4.4 million (2.9 per cent) lower than reported.
In the event of the euro strengthening by 10 per cent, the impact on income, net assets and LTV is as shown in the adjacent table.
Going concernAs noted in the Financial Position and Funding section, the Group has a strong liquidity position, a favourable debt maturity profile and substantial headroom against financial covenants. Accordingly, it can reasonably expect to continue to have good access to capital markets and other sources of funding.
Having made enquiries and having considered the principal risks facing the Group, including liquidity and solvency risks, and material uncertainties, the Directors have a reasonable expectation that the Company and the Group have adequate resources to continue in operational existence for the foreseeable future (a period of at least 12 months from the date of approval of the financial statements). Accordingly, they continue to adopt the going concern basis in preparing the Annual Report.
Soumen DasChief Financial Officer

54SEGRO Annual Report and Accounts 2016
Principal Risks
Effective risk management is central to our long-term success
The Group recognises that its ability to manage risk effectively throughout the organisation continues to be central to its success. Our approach to risk management aims to bring controllable risks within our appetite, and to enable our decision making to balance uncertainty against the objective of creating value for our shareholders.
Risk appetiteWe have put risk appetite at the heart of our risk management processes. Risk appetite is integral both to our consideration of strategy and to our medium-term planning process. Risk appetite also defines the criteria for assessing the potential impact of risks and our mitigation of them.
The Group’s risk appetite is reviewed annually and approved by the Board in order to guide management. As well as qualitative descriptions, the risk appetite defines specific tolerances and targets for key metrics. It is equally applicable to wholly-owned operations and joint ventures.
While our appetite for risk will vary over time and during the course of the property cycle, in general the Group maintains a fairly low appetite for risk, appropriate to our strategic objectives of delivering a sustainable progressive dividend stream, supported by long-term growth in net asset value per share.
Property riskWe recognise that, in seeking outperformance from our portfolio, the Group must accept a balanced level of property risk – with diversity in geographic locations and asset types and an appropriate mixture of stabilised income producing and opportunity assets – in order to provide opportunities for superior returns.
Our target portfolio should deliver attractive, low risk income returns with strong rental and capital growth when market conditions are positive and show relative resilience in a downturn. We aim to enhance these returns through development, but we seek both to ensure that the ‘drag’ associated with holding development land does not outweigh the potential benefits and also to mitigate the risks – including letting and construction risks – inherent in development.
In line with our income focus, we have a low appetite for risks to income from customers, and accordingly seek a diverse occupier base with strong covenants and avoid over-exposure to individual occupiers in specialist properties.
Financial riskThe Group maintains a low to moderate appetite for financial risk in general, with a very low appetite for risks to solvency and gearing covenant breaches.
As an income-focused REIT we have a low appetite for risks to maintaining stable progression in earnings and dividends over the long term. We are, however, prepared to tolerate fluctuations in dividend cover as a consequence of capital recycling activity.
We also seek long-term growth in net asset value per share. Our appetite for risks to net asset value from the factors within our control is low, albeit acknowledging that our appetite for moderate leverage across the cycle amplifies the impact of asset valuation movements on net asset value.
Corporate riskWe have a very low appetite for risks to our good reputation and risks to being well-regarded by our investors, regulators, employees, customers, business partners, suppliers, lenders and by the wider communities and environments in which we operate.
Our responsibilities to these stakeholders include compliance with all relevant laws; accurate and timely reporting of financial and other regulatory information; safeguarding the health and safety of employees, suppliers, customers and other users of our assets; safeguarding the environment; compliance with codes of conduct and ethics; ensuring business continuity; and making a positive contribution to the communities in which we operate.
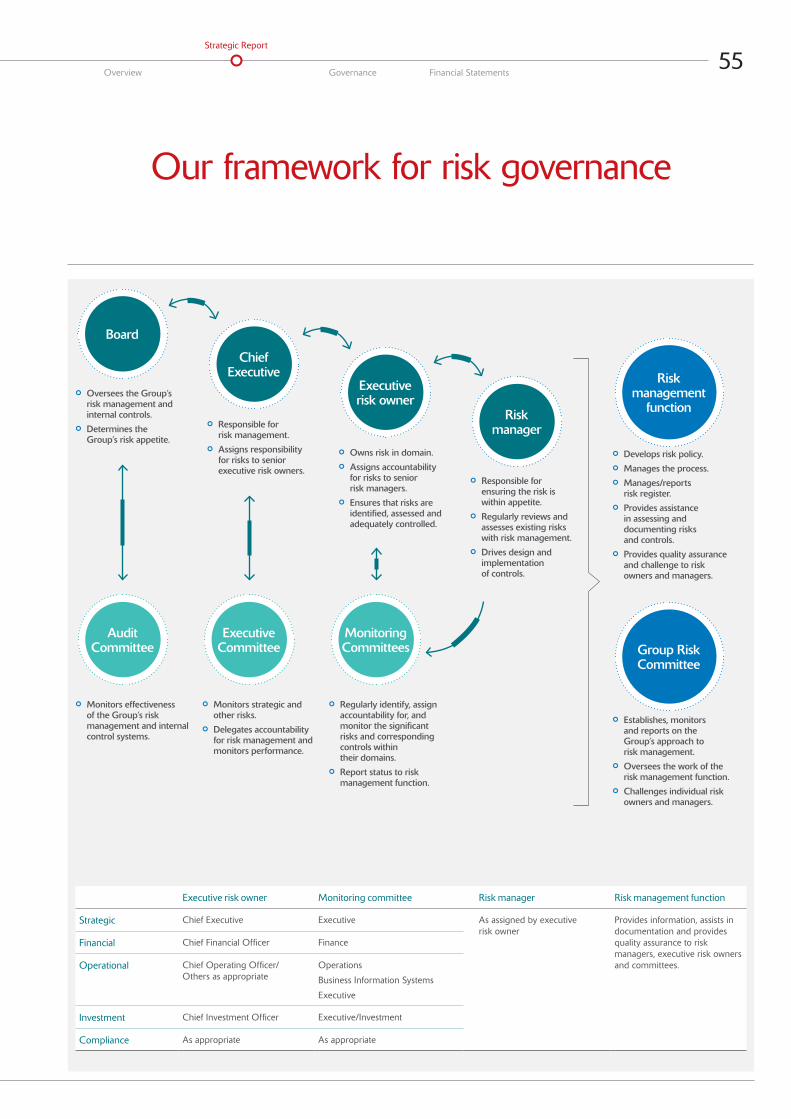
55Overview Governance Financial Statements
Strategic Report
Risk management
function
Our framework for risk governance
° Responsible for risk management.
° Assigns responsibility for risks to senior executive risk owners.
° Owns risk in domain.
° Assigns accountability for risks to senior risk managers.
° Ensures that risks are identified, assessed and adequately controlled.
° Regularly identify, assign accountability for, and monitor the significant risks and corresponding controls within their domains.
° Report status to risk management function.
° Responsible for ensuring the risk is within appetite.
° Regularly reviews and assesses existing risks with risk management.
° Drives design and implementation of controls.
Board
Audit Committee
Chief Executive
Executive Committee
Executive risk owner
Monitoring Committees
Risk manager
Group Risk Committee
° Oversees the Group’s risk management and internal controls.
° Determines the Group’s risk appetite.
° Monitors strategic and other risks.
° Delegates accountability for risk management and monitors performance.
° Monitors effectiveness of the Group’s risk management and internal control systems.
° Develops risk policy.
° Manages the process.
° Manages/reports risk register.
° Provides assistance in assessing and documenting risks and controls.
° Provides quality assurance and challenge to risk owners and managers.
° Establishes, monitors and reports on the Group’s approach to risk management.
° Oversees the work of the risk management function.
° Challenges individual risk owners and managers.
Executive risk owner Monitoring committee Risk manager Risk management function
Strategic Chief Executive Executive As assigned by executive risk owner
Provides information, assists in documentation and provides quality assurance to risk managers, executive risk owners and committees.
Financial Chief Financial Officer Finance
Operational Chief Operating Officer/ Others as appropriate
Operations
Business Information Systems
Executive
Investment Chief Investment Officer Executive/Investment
Compliance As appropriate As appropriate

56SEGRO Annual Report and Accounts 2016
Principal Risks
Our integrated and robust approach to risk management
An integrated approach to managing riskThe Board has overall responsibility for ensuring that risk is effectively managed across the Group. The Audit Committee reviews the effectiveness of the Group’s risk management process on behalf of the Board. Further information on compliance with the risk management provisions of the UK Corporate Governance Code can be found in the Governance section on pages 62 to 105.
The risk management process is designed to identify, evaluate and mitigate the significant risks that the Group faces. The process aims to understand and mitigate, rather than eliminate, the risk of failure to achieve business objectives, and therefore can only provide reasonable and not absolute assurance.
Accountabilities for the Group’s risk management are outlined in the diagram on page 55.
Appetite towards risk is considered at Board meetings whenever significant strategic, financial or operational decisions are made, and is a key part of ongoing discussions about strategy. Risk appetite is also formally reviewed by the Board annually.
The Board recognises that it has limited control over many of the external risks it faces, such as the macro-economic environment, but it reviews the potential impact of such risks on the business and actively considers them in its decision-making. The Board also monitors internal risks and ensures that appropriate controls are in place to manage them.
Risks are considered within each area of the business to ensure that risk management is embedded within the Group’s decision-making processes and culture. Each risk in the Group Risk Register is owned by a member of the Executive Committee who works with a senior manager who is responsible for the monitoring and mitigation of that risk to within appetite. Each risk is reviewed regularly throughout the year at relevant management committees and each risk is also reviewed in depth with its risk manager and risk owner at least twice a year.
Communication across a relatively small management team, and regular consideration of risk at key management committees, allows management to respond quickly to changing events so as to reduce adverse effects on the Group’s risk profile.
Risks are assessed in both unmitigated (assuming that no controls are in place) and residual (with mitigating controls operating normally) states. This assessment directly relates potential impact to risk appetite so that it is clear whether each risk is comfortably within appetite, tolerable, intolerable or below appetite. We also formally assess the velocity of the most significant risks to better understand how quickly they might cause an intolerable impact on us.
In addition to reports detailing risks individually and in aggregate, in 2016 we produced a monthly Key Risk Indicator dashboard to show actual and forecast performance against risk appetite metrics.
The most significant risks and mitigating controls are detailed in the Group Risk Register.
Controls relevant to each risk are also documented and monitored in the Group Risk Register. The risks and controls in the Register are used as a key input to determine priorities for the Group’s internal audit assurance programme. Management’s annual assessment of control effectiveness is driven by the risks and controls drawn from the Group’s Risk Register.
The Group has a Risk Management Committee responsible for regularly reviewing the Group Risk Register, monitoring the most important controls and prioritising risk management activities. The Group’s approach to risk
management is documented and formalised in a policy, reviewed annually by the Executive Committee and approved by the Board.
The Executive Committee considers emerging risks and their impact on the Group Risk Register formally four times per year.
BrexitA special Group Risk Committee meeting was held in July to consider our response to the UK referendum decision.
Since then we have monitored the situation closely and the matter is considered at Executive Committee and standing committee meetings each month to identify and monitor emerging issues.
A robust assessmentIn order to robustly assess the principal risks facing the Group, the Board has taken a number of measures. The Board has formally reviewed the principal risks twice during the year. The Board has also completed its annual review and approval of the Group’s risk appetite, and has approved the Group’s risk management policy.
Furthermore, the Audit Committee receives a report twice a year on how the Group Risk Register has been compiled.
Viability statementThe Group’s principal risks, and its approach to managing them, as described in this section, have formed the basis of our assessment of longer term viability. The process for conducting this assessment is summarised in the Audit Committee’s Report on page 80.
The Directors confirm that they have a reasonable expectation that the Group will be able to continue in operation and has adequate resources to meet its liabilities as they fall due over the next five years.
The five year assessment period is the same time horizon as covered by the Group’s annual rolling five year strategic financial plan. This is considered to be the optimum balance between our need to plan for the long term (as property investment is a long-term business) and the progressively unreliable nature of forecasting in later years, particularly given the historically cyclical nature of the property industry. The Directors confirm that they have no reason to expect a step-change in the Group’s viability immediately following the five year period assessed.

57Overview Governance Financial Statements
Strategic Report
In addition to the robust ongoing assessment and management of the risks facing the Group, as already set out in this section, the Group has stress tested its five year strategic financial plan. This stress test has considered the risks that could either individually, or in aggregate, threaten the viability of the Group. The process for conducting the Group’s assessment is the responsibility of the Chief Financial Officer and is overseen by the Audit Committee.
In particular the stress test has considered the potential impacts of:
° A systemic crisis, such as a major dislocation or failure of capital markets or a failure of the insurance market;
° An acute deterioration in occupier or property investment market conditions;
° Significant movements in interest rates and foreign exchange rates;
° A sustained interruption to the Group’s business continuity; and
° An inability to refinance maturing debt.
In stress testing we assessed the limits at which key financial ratios and covenants would be breached, causing a threat to the Group’s viability. We then assessed the likelihood of that limit being reached as a result of the individual event or combination of events occurring, using a combination of historic data (for example the acute property valuation decline in 2007–2009) and forward-looking probability analysis where available.
In the case of an inability to refinance maturing debt, we have assumed that we would reduce development and investment levels and/or sell assets in order to avoid the need for refinancing during the assessment period. The short development lead times for both urban and big box warehouse assets and the proven liquidity of these assets make this an effective measure in reducing our financing requirements.
Within the above stress testing we have included a ‘Brexit’ scenario that resulted in a systemic crisis and an acute deterioration in investment and occupier conditions.
Principal risksThe principal risks have the potential to affect SEGRO’s business materially – either favourably or unfavourably. Risks are classified as ‘principal’ according to their potential to intolerably exceed our appetite (considering both inherent and residual impact) and cause material harm to the Group.
Some risks that may be unknown at present, as well as other risks that are currently regarded as immaterial and therefore not detailed here, could turn out to be material in the future.
The current principal risks facing the Group are summarised in the diagram below and described across the following pages.
The descriptions indicate the potential areas of impact on the Group’s strategy and the principal activities that are in place to mitigate and manage such risks.
The direction of change in the level of the risk during the course of 2016, along with an assessment of whether the risk is within our appetite following the application of our mitigating controls, is indicated along with links to further relevant information provided in other sections of this report.
The principal risks that the Group reported last year have evolved in nature, as has the Group’s response to them. No new additional risks have been classified as principal since 2015, and no principal risks have been de-classified since that time.
IMPACT
Intolerable
Hig
h
Within appetite
PRO
BABI
LITY
Below appetite
Property risks
UK EU Exit
Market cycle
Portfolio strategy
European economic environment
Execution of investment plans
Operational delivery
Counterparty default
Financial leverage
Interest rates
Health & safety
Regulatory environment
Solvency & covenant breach
Financial risks Corporate risks Movement since 2015Key:
Low
Residual Risk

58SEGRO Annual Report and Accounts 2016
Principal Risks
Property risksRisks to achieving above average rental and capital growth from our portfolio,
including external market and competitive conditions, portfolio strategy, and execution of acquisitions and disposals.
Further informationThe market outlook is detailed in the Chief Executive’s Review on pages 22 to 31.
Further informationFurther information is contained in the Chief Executive’s Review on pages 22 to 31.
Further informationFurther information is contained in the Chief Executive’s Review on pages 22 to 31.
Impact on strategy
Change in 2016
Residual risk within appetite?
Impact on strategy
Change in 2016
Residual risk within appetite?
Impact on strategy
Change in 2016
Residual risk within appetite?
Market cycle
The property market is cyclical and there is a continuous risk that the Group could either misinterpret the market or fail to react appropriately to changing market conditions, which could result in capital being invested or disposals taking place at the wrong price or time in the cycle.
This is continuous risk with a moderate likelihood.
MitigationsThe Board, Executive Committee and Investment Committee monitor the property market cycle on a continual basis and adapt the Group’s investment/divestment strategy in anticipation of changing market conditions.
Independent diverse sources of investment and occupier market intelligence are regularly received and considered.
Upside and downside scenarios are incorporated into Investment Committee papers to assess the impact of differing market conditions.
Portfolio strategy
The Group’s Total Property and/or Shareholder Returns could underperform in absolute or relative terms as a result of an inappropriate portfolio strategy. This could result from:
° Holding the wrong balance of prime or secondary assets;
° Holding the wrong amounts or types of land, leading to diluted returns and/or constraints on development opportunities;
° Holding the wrong level of higher risk ‘opportunity’ assets or too many old or obsolete assets which dilute returns; and
° Holding assets in the wrong geographical markets; missing opportunities in new markets or lacking critical mass in existing markets.
This is continuous risk with a moderate likelihood.
MitigationsThe Group’s portfolio strategy is subject to regular review by the Board to consider the desired shape of the portfolio in order to meet the Group’s overall objectives and to determine our response to changing opportunities and market conditions.
The Group’s disciplined capital allocation is informed by comprehensive asset plans and independent external assessments of market conditions and forecasts.
Regular portfolio analysis ensures the portfolio is correctly positioned in terms of location and asset type, and retains the right balance of core and opportunity assets. The annual asset planning exercise provides a bottom-up assessment of the performance and potential for all assets to identify underperforming assets that are considered for sale.
Execution of investment plansDecisions to buy, hold, sell or develop assets could be flawed due to uncertainty in analysis, quality of assumptions, poor due diligence or unexpected changes in the economic or operating environment.
Our investment decisions could be insufficiently responsive to implement our strategy effectively.
This is continuous risk with a moderate likelihood as changing investment and occupier market conditions require constant adaptation.
MitigationsAsset plans are prepared annually for all estates to determine where to invest capital in existing assets and to identify assets for disposal.
Locally-based property investment and operational teams provide market intelligence and networking to source attractive opportunities.
Policies are in place to govern evaluation, due diligence, approval, execution and subsequent review of investment activity.
The Investment Committee meets frequently to review investment and disposal proposals and to consider appropriate capital allocation.
Investment hurdle rates are regularly reappraised taking into account estimates of our weighted average cost of capital.
Major capital investment and disposal decisions are subject to Board approval.
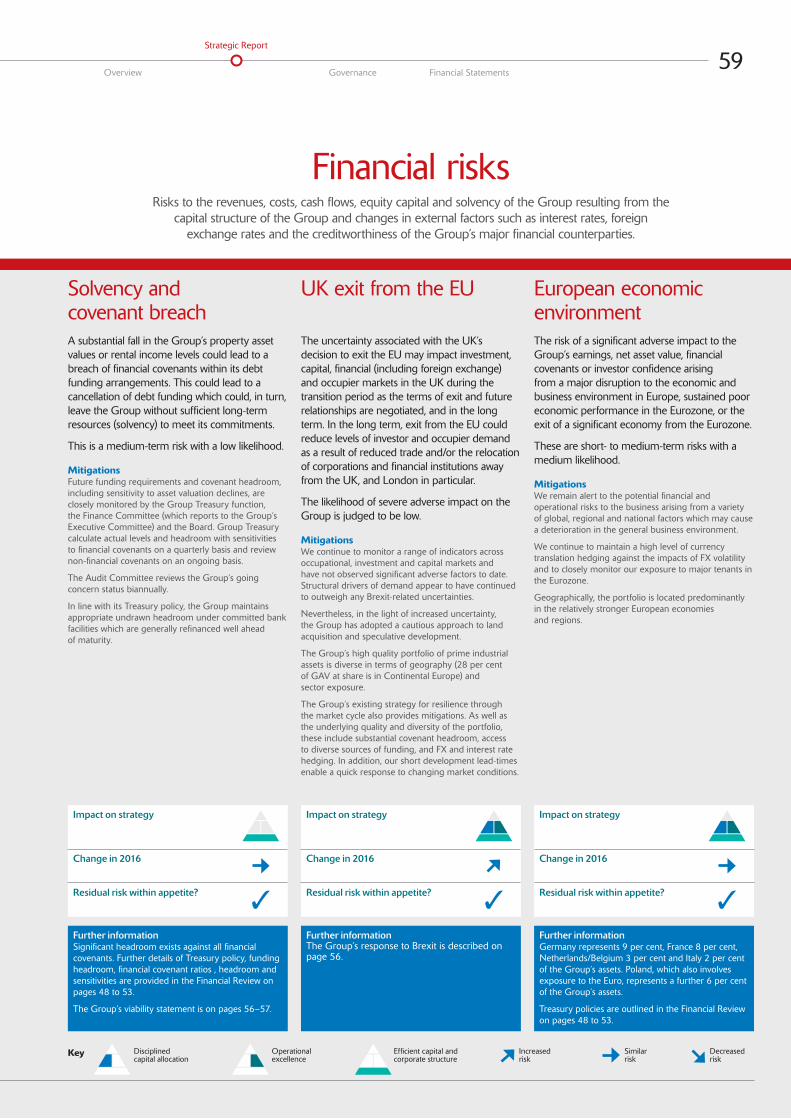
59Overview Governance Financial Statements
Strategic Report
Financial risksRisks to the revenues, costs, cash flows, equity capital and solvency of the Group resulting from the
capital structure of the Group and changes in external factors such as interest rates, foreign exchange rates and the creditworthiness of the Group’s major financial counterparties.
Key Efficient capital and corporate structure
Operational excellence
Disciplined capital allocation
Similar risk
Decreased risk
Increased risk
Further informationSignificant headroom exists against all financial covenants. Further details of Treasury policy, funding headroom, financial covenant ratios , headroom and sensitivities are provided in the Financial Review on pages 48 to 53.
The Group’s viability statement is on pages 56–57.
Further informationThe Group’s response to Brexit is described on page 56.
Further informationGermany represents 9 per cent, France 8 per cent, Netherlands/Belgium 3 per cent and Italy 2 per cent of the Group’s assets. Poland, which also involves exposure to the Euro, represents a further 6 per cent of the Group’s assets.
Treasury policies are outlined in the Financial Review on pages 48 to 53.
Impact on strategy
Change in 2016
Residual risk within appetite?
Impact on strategy
Change in 2016
Residual risk within appetite?
Impact on strategy
Change in 2016
Residual risk within appetite?
Solvency and covenant breachA substantial fall in the Group’s property asset values or rental income levels could lead to a breach of financial covenants within its debt funding arrangements. This could lead to a cancellation of debt funding which could, in turn, leave the Group without sufficient long-term resources (solvency) to meet its commitments.
This is a medium-term risk with a low likelihood.
MitigationsFuture funding requirements and covenant headroom, including sensitivity to asset valuation declines, are closely monitored by the Group Treasury function, the Finance Committee (which reports to the Group’s Executive Committee) and the Board. Group Treasury calculate actual levels and headroom with sensitivities to financial covenants on a quarterly basis and review non-financial covenants on an ongoing basis.
The Audit Committee reviews the Group’s going concern status biannually.
In line with its Treasury policy, the Group maintains appropriate undrawn headroom under committed bank facilities which are generally refinanced well ahead of maturity.
UK exit from the EU
The uncertainty associated with the UK’s decision to exit the EU may impact investment, capital, financial (including foreign exchange) and occupier markets in the UK during the transition period as the terms of exit and future relationships are negotiated, and in the long term. In the long term, exit from the EU could reduce levels of investor and occupier demand as a result of reduced trade and/or the relocation of corporations and financial institutions away from the UK, and London in particular.
The likelihood of severe adverse impact on the Group is judged to be low.
MitigationsWe continue to monitor a range of indicators across occupational, investment and capital markets and have not observed significant adverse factors to date. Structural drivers of demand appear to have continued to outweigh any Brexit-related uncertainties.
Nevertheless, in the light of increased uncertainty, the Group has adopted a cautious approach to land acquisition and speculative development.
The Group’s high quality portfolio of prime industrial assets is diverse in terms of geography (28 per cent of GAV at share is in Continental Europe) and sector exposure.
The Group’s existing strategy for resilience through the market cycle also provides mitigations. As well as the underlying quality and diversity of the portfolio, these include substantial covenant headroom, access to diverse sources of funding, and FX and interest rate hedging. In addition, our short development lead-times enable a quick response to changing market conditions.
European economic environmentThe risk of a significant adverse impact to the Group’s earnings, net asset value, financial covenants or investor confidence arising from a major disruption to the economic and business environment in Europe, sustained poor economic performance in the Eurozone, or the exit of a significant economy from the Eurozone.
These are short- to medium-term risks with a medium likelihood.
MitigationsWe remain alert to the potential financial and operational risks to the business arising from a variety of global, regional and national factors which may cause a deterioration in the general business environment.
We continue to maintain a high level of currency translation hedging against the impacts of FX volatility and to closely monitor our exposure to major tenants in the Eurozone.
Geographically, the portfolio is located predominantly in the relatively stronger European economies and regions.

60SEGRO Annual Report and Accounts 2016
Principal Risks
Financial risks continued…
Further informationGearing is discussed in the Financial Review on pages 48 to 53.
Further informationAt 31 December 2016, fixed interest cover was 80 per cent of the net borrowings of the Group (including the Group’s share of borrowings within joint ventures).
Interest rate hedging is detailed in the Financial Review on page 53.
Further informationTreasury policies are outlined in the Financial Review on pages 48 to 53.
Impact on strategy
Change in 2016
Residual risk within appetite?
Impact on strategy
Change in 2016
Residual risk within appetite?
Impact on strategy
Change in 2016
Residual risk within appetite?
Financial leverage
The Group could maintain an inappropriate capital structure. Financial leverage (usually expressed as the LTV ratio, but in financial covenants defined as gearing) needs to be managed depending on the direction of the economic and property market cycle. If gearing is too high when property valuations are falling, net asset value movements can be exacerbated and financial covenants put at risk. Equally, if gearing is too conservative, there is a risk that attractive growth opportunities could be missed and the benefits of leverage not maximised.
This is a medium- to long-term risk with a low likelihood.
MitigationsThe Group has targeted a mid-cycle look-through LTV ratio of around 40 per cent. Gearing levels are also tracked and forecast internally to monitor headroom against financial covenants. The LTV target is regularly considered in strategic planning and in asset recycling decisions.
Interest rates
A significant adverse movement in interest rates could have an unacceptable impact on the Group’s earnings, on investment market conditions or on tenant covenant strength.
This is a long-term risk with a moderate likelihood.
MitigationsIn accordance with the Group’s Treasury policy, fixed interest cover is maintained between 50 per cent and 100 per cent of net look-through debt in order to balance the cost and certainty of interest rates. The position is formally reviewed biannually by the Finance Committee.
Counterparty default
A bank or other counterparty could default while holding SEGRO deposits or derivative assets, resulting in a significant financial loss to the Group. This could also include the loss of solvency headroom from lost undrawn committed bank facilities.
This is considered to be a long-term risk with a low likelihood.
MitigationsCounterparties are accepted based on a strict credit rating criteria. Compliance with the policy is monitored daily by both front and back-office staff within Group Treasury.

61Overview Governance Financial Statements
Strategic Report
Corporate risksRisks to business performance, legal and regulatory compliance, health and safety,
environmental impact, reputation and business continuity arising from external factors or inadequate internal processes, people or systems.
Key Efficient capital and corporate structure
Operational excellence
Disciplined capital allocation
Similar risk
Decreased risk
Increased risk
Further informationHealth and safety in our supply chain is discussed on page 40.
Impact on strategy
Change in 2016
Residual risk within appetite?
Impact on strategy
Change in 2016
Residual risk within appetite?
Impact on strategy
Change in 2016
Residual risk within appetite?
Operational delivery and complianceThe Group’s ability to protect its reputation, revenues and shareholder value could be damaged by operational failures such as: environmental damage; failing to attract, retain and motivate key staff; a breach of anti-bribery and corruption or other legislation; major customer default; supply chain failure; the structural failure of one of our assets; a major high-profile incident involving one of our assets; or a cyber-security failure.
Compliance failures, such as breaches of joint venture shareholders’ agreements, secured loan agreements or tax legislation could also damage reputation, revenue and shareholder value.
This is a continuous risk with a low likelihood of causing significant harm to the Group.
MitigationsThe Group maintains a strong focus on Operational Excellence. The Executive, Operations and Information Systems Committees regularly monitor the range of risks to property management, construction, compliance, business continuity, organisational effectiveness, customer management and cyber security.
The Group’s tax compliance is managed by an experienced internal tax team. REIT and SIIC tax regime compliance is demonstrated at least bi-annually. Compliance with joint venture shareholder agreements is managed by experienced property operations, finance and legal staff. The SELP JV additionally has comprehensive governance and compliance arrangements in place, including dedicated management, operating manuals, and specialist third-party compliance support.
Health and safety
Health and safety management processes could fail, leading to a loss of life, litigation, fines and serious reputational damage to the Group.
This is a continuous risk with a low likelihood of causing significant harm to the Group. Nevertheless, we note that this risk is somewhat increased by the scale of the Group’s development activity.
MitigationsThe Group manages an active health and safety management system, with a particular focus on managing the quality and compliance to good health and safety practice of construction and maintenance contractors.
A published Health and Safety policy is backed up by independent site inspections of both existing assets as well as development projects against SEGRO’s Health & Safety Construction Standard.
A new online Health & Safety system, named Safety Matters, has been launched to enhance tracking, trend analysis, and compliance monitoring against agreed safety standards.
Regulatory environment
The Group could fail to anticipate legal or regulatory changes, leading to a significant un-forecasted financial or reputational impact.
In general, these are medium- to long-term risks with a low likelihood of causing significant harm to the Group. Some, such as the OECD’s Base Erosion and Profit Shifting (BEPS) project, could have an earlier impact.
MitigationsEmerging risks in this category are reviewed regularly by the Executive Committee, Finance Committee and Group Risk Management Committee.
Corporate heads of function consult with external advisers, attend industry and specialist briefings, and sit on key industry bodies such as EPRA and BPF.
A number of potential risks were identified, assessed and managed during the course of the year. None were considered to be material enough to be classified as principal risks.
Nevertheless, we continue to maintain a close interest in the BEPS project. Our current assessment is that the direct impact on the Group is likely to be low, but we will monitor the potential indirect impacts on the investment market and on valuations if BEPS affects more highly leveraged property investors.

Board
Nomination Comm
ittee
Audit Committee
Rem
uner
atio
n Co
mmittee
Investment Committee
Fina
nce
Com
mitte
e
Executive Committee
Operations C
omm
ittee
Risk Com
mittee
SEGRO Annual Report and Accounts 2016
62
In this section:
Chairman’s Introduction 63Board of Directors 64Governance Framework 66Governance Report 67Nomination Committee Report 73Audit Committee Report 77Remuneration Committee Report 85Remuneration Policy 98Directors’ Report 103Statement of Directors’ Responsibilities 105
GovernanceOur approach to governance Long-term business success and good governance go hand in hand. The Board, as custodian of the business, seeks to secure the long-term future of the Company. We are responsible to our shareholders, customers, employees and other stakeholders for the performance of the Company and for promoting its long-term success.
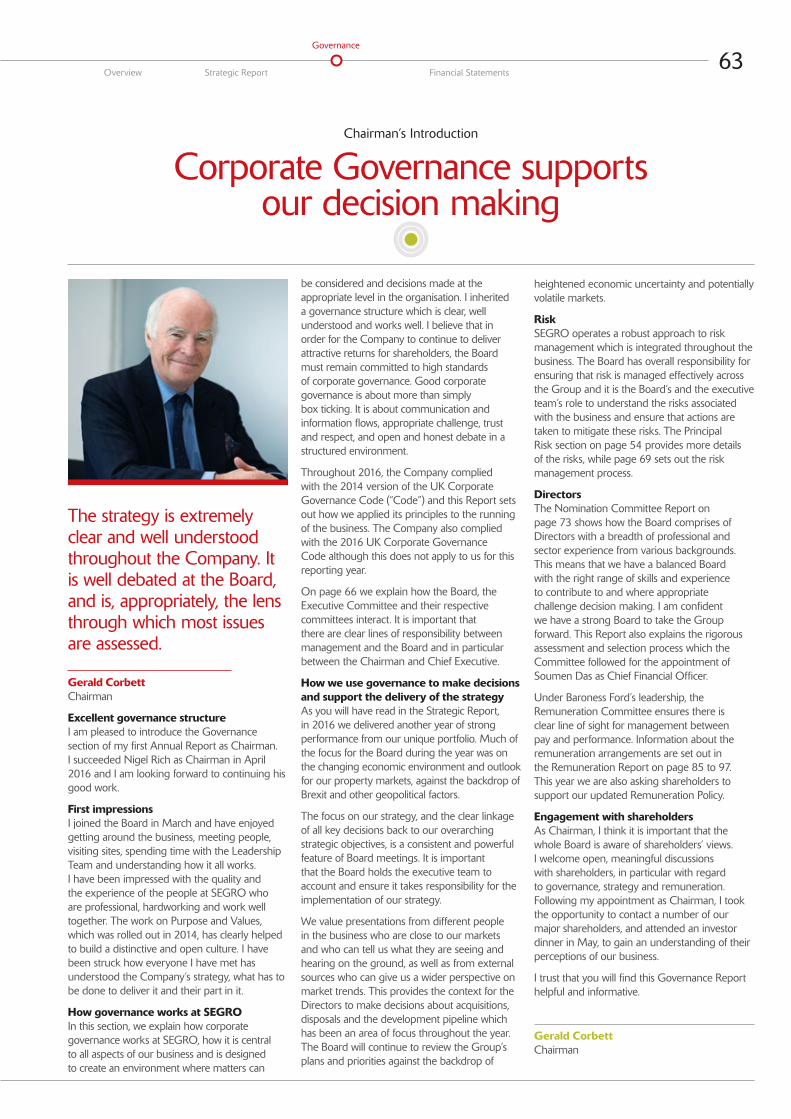
63Overview Strategic Report Financial Statements
Governance
The strategy is extremely clear and well understood throughout the Company. It is well debated at the Board, and is, appropriately, the lens through which most issues are assessed.
Gerald Corbett Chairman
Excellent governance structureI am pleased to introduce the Governance section of my first Annual Report as Chairman. I succeeded Nigel Rich as Chairman in April 2016 and I am looking forward to continuing his good work.
First impressionsI joined the Board in March and have enjoyed getting around the business, meeting people, visiting sites, spending time with the Leadership Team and understanding how it all works. I have been impressed with the quality and the experience of the people at SEGRO who are professional, hardworking and work well together. The work on Purpose and Values, which was rolled out in 2014, has clearly helped to build a distinctive and open culture. I have been struck how everyone I have met has understood the Company’s strategy, what has to be done to deliver it and their part in it.
How governance works at SEGROIn this section, we explain how corporate governance works at SEGRO, how it is central to all aspects of our business and is designed to create an environment where matters can
be considered and decisions made at the appropriate level in the organisation. I inherited a governance structure which is clear, well understood and works well. I believe that in order for the Company to continue to deliver attractive returns for shareholders, the Board must remain committed to high standards of corporate governance. Good corporate governance is about more than simply box ticking. It is about communication and information flows, appropriate challenge, trust and respect, and open and honest debate in a structured environment.
Throughout 2016, the Company complied with the 2014 version of the UK Corporate Governance Code (“Code”) and this Report sets out how we applied its principles to the running of the business. The Company also complied with the 2016 UK Corporate Governance Code although this does not apply to us for this reporting year.
On page 66 we explain how the Board, the Executive Committee and their respective committees interact. It is important that there are clear lines of responsibility between management and the Board and in particular between the Chairman and Chief Executive.
How we use governance to make decisions and support the delivery of the strategyAs you will have read in the Strategic Report, in 2016 we delivered another year of strong performance from our unique portfolio. Much of the focus for the Board during the year was on the changing economic environment and outlook for our property markets, against the backdrop of Brexit and other geopolitical factors.
The focus on our strategy, and the clear linkage of all key decisions back to our overarching strategic objectives, is a consistent and powerful feature of Board meetings. It is important that the Board holds the executive team to account and ensure it takes responsibility for the implementation of our strategy.
We value presentations from different people in the business who are close to our markets and who can tell us what they are seeing and hearing on the ground, as well as from external sources who can give us a wider perspective on market trends. This provides the context for the Directors to make decisions about acquisitions, disposals and the development pipeline which has been an area of focus throughout the year. The Board will continue to review the Group’s plans and priorities against the backdrop of
heightened economic uncertainty and potentially volatile markets.
RiskSEGRO operates a robust approach to risk management which is integrated throughout the business. The Board has overall responsibility for ensuring that risk is managed effectively across the Group and it is the Board’s and the executive team’s role to understand the risks associated with the business and ensure that actions are taken to mitigate these risks. The Principal Risk section on page 54 provides more details of the risks, while page 69 sets out the risk management process.
DirectorsThe Nomination Committee Report on page 73 shows how the Board comprises of Directors with a breadth of professional and sector experience from various backgrounds. This means that we have a balanced Board with the right range of skills and experience to contribute to and where appropriate challenge decision making. I am confident we have a strong Board to take the Group forward. This Report also explains the rigorous assessment and selection process which the Committee followed for the appointment of Soumen Das as Chief Financial Officer.
Under Baroness Ford’s leadership, the Remuneration Committee ensures there is clear line of sight for management between pay and performance. Information about the remuneration arrangements are set out in the Remuneration Report on page 85 to 97. This year we are also asking shareholders to support our updated Remuneration Policy.
Engagement with shareholdersAs Chairman, I think it is important that the whole Board is aware of shareholders’ views. I welcome open, meaningful discussions with shareholders, in particular with regard to governance, strategy and remuneration. Following my appointment as Chairman, I took the opportunity to contact a number of our major shareholders, and attended an investor dinner in May, to gain an understanding of their perceptions of our business.
I trust that you will find this Governance Report helpful and informative.
Gerald CorbettChairman
Chairman’s Introduction
Corporate Governance supports our decision making

SEGRO Annual Report and Accounts 2016
64
Board of Directors
Mark RobertshawIndependent Non-Executive Director
Appointed 1 June 2010
Skills and ExperienceMark has extensive experience of working across the finance and consultancy sectors. His perspective as the Chief Executive Officer of a large multi-national industrial business brings additional insight to SEGRO as an industrial landlord.
Current AppointmentsMark was appointed as a Non-Executive Director in June 2010. He is currently Group Chief Executive of Innovia Group.
Previous AppointmentsHe was previously Chief Executive Officer of Morgan Advanced Materials plc, a post he held for eight years, having previously been Chief Operating Officer and Chief Financial Officer. Prior to this he was Chief Financial Officer of Gartmore Investment Management plc, and spent nine years with Marakon Associates, a leading management consultancy headquartered in the US.
He is a member of the Remuneration Committee.
Age 48
Soumen DasChief Financial Officer
Appointed 16 January 2017
Skills and ExperienceSoumen is an experienced corporate financier and former Managing Director of Capital and Counties Properties PLC (Capco), where he led the finance function of one of the largest listed central London property companies.
Current AppointmentsSoumen was appointed as Chief Financial Officer at SEGRO in January 2017.
Previous AppointmentsSoumen joined Capco from Liberty International, having coordinated the demerger of the companies in 2010. Prior to this, he spent two years as a partner in Mountgrange Investment Management LLP (now Clearbell Capital) and nine years at UBS where he was an Executive Director specialising in real estate.
Age 40
Phil ReddingChief Investment Officer
Appointed 1 May 2013
Skills and ExperiencePhil has over 25 years’ experience in real estate. He has held a variety of appointments within SEGRO and has been instrumental in a number of key transactions for the Group. He is a member of the Royal Institution of Chartered Surveyors.
Current AppointmentsPhil was appointed Chief Investment Officer of SEGRO in November 2011, having joined the Company in 1995. He joined the Board as an Executive Director in May 2013.
Previous AppointmentsPhil started his career in 1990 in the Industrial Agency and Development team of King Sturge, where he held a variety of positions. Prior to becoming an Executive Director at SEGRO, he was Business Unit Director for London Markets.
Age 48
David SleathChief Executive Officer
Appointed 1 January 2006
Skills and ExperienceDavid has considerable knowledge of the Company and the real estate sector and has broad experience of financial and general management and of the professional services industry. He is a Fellow of the Institute of Chartered Accountants in England and Wales.
Current AppointmentsDavid was appointed Chief Executive in April 2011, having served as Finance Director since 2006. He is Senior Independent Director of Bunzl plc, a Board member of the European Public Real Estate Association, and President and Board member of the British Property Federation.
Previous AppointmentsHe has previously held a number of senior finance roles, including Finance Director of Wagon plc and partner at Arthur Andersen, where he worked for 17 years.
He is a member of the Nomination Committee.
Age 55
Gerald CorbettChairman
Appointed 1 March 2016
Skills and ExperienceGerald has been a director of 13 public companies, seven of which he has chaired. His executive career included periods as Finance Director of Redland and Grand Metropolitan and he was Chief Executive of Railtrack.
Current AppointmentsGerald was appointed Chairman of SEGRO in April 2016. He is currently Chairman of Britvic PLC, the Marylebone Cricket Club and Numis Corporation PLC.
Previous AppointmentsPreviously he was Chairman of Betfair Group plc, Moneysupermarket.com PLC and SSL International plc, and has served as a non-executive director of MEPC, Greencore Group and Burmah Castrol.
He is Chairman of the Nomination Committee.
Age 65
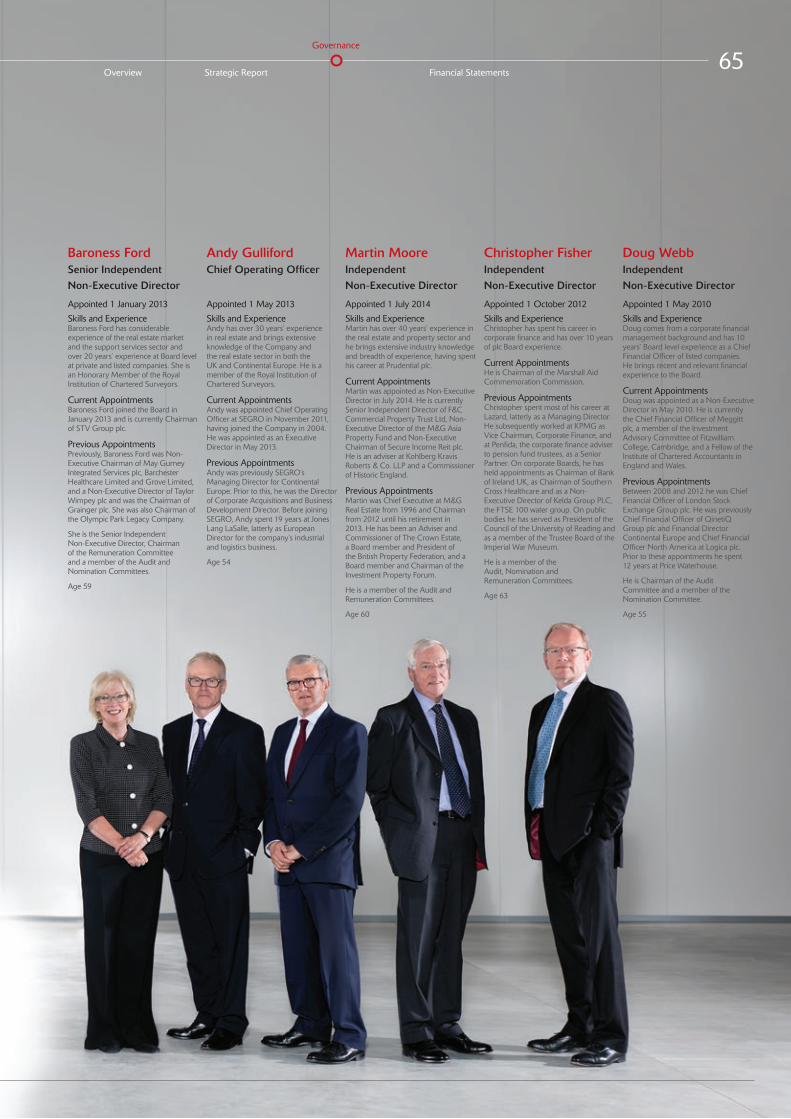
65Overview Strategic Report Financial Statements
Governance
Baroness FordSenior Independent Non-Executive Director
Appointed 1 January 2013
Skills and ExperienceBaroness Ford has considerable experience of the real estate market and the support services sector and over 20 years’ experience at Board level at private and listed companies. She is an Honorary Member of the Royal Institution of Chartered Surveyors.
Current AppointmentsBaroness Ford joined the Board in January 2013 and is currently Chairman of STV Group plc.
Previous AppointmentsPreviously, Baroness Ford was Non-Executive Chairman of May Gurney Integrated Services plc, Barchester Healthcare Limited and Grove Limited, and a Non-Executive Director of Taylor Wimpey plc and was the Chairman of Grainger plc. She was also Chairman of the Olympic Park Legacy Company.
She is the Senior Independent Non-Executive Director, Chairman of the Remuneration Committee and a member of the Audit and Nomination Committees.
Age 59
Andy GullifordChief Operating Officer
Appointed 1 May 2013
Skills and ExperienceAndy has over 30 years’ experience in real estate and brings extensive knowledge of the Company and the real estate sector in both the UK and Continental Europe. He is a member of the Royal Institution of Chartered Surveyors.
Current AppointmentsAndy was appointed Chief Operating Officer at SEGRO in November 2011, having joined the Company in 2004. He was appointed as an Executive Director in May 2013.
Previous AppointmentsAndy was previously SEGRO’s Managing Director for Continental Europe. Prior to this, he was the Director of Corporate Acquisitions and Business Development Director. Before joining SEGRO, Andy spent 19 years at Jones Lang LaSalle, latterly as European Director for the company’s industrial and logistics business.
Age 54
Martin MooreIndependent Non-Executive Director
Appointed 1 July 2014
Skills and ExperienceMartin has over 40 years’ experience in the real estate and property sector and he brings extensive industry knowledge and breadth of experience, having spent his career at Prudential plc.
Current AppointmentsMartin was appointed as Non-Executive Director in July 2014. He is currently Senior Independent Director of F&C Commercial Property Trust Ltd, Non-Executive Director of the M&G Asia Property Fund and Non-Executive Chairman of Secure Income Reit plc. He is an adviser at Kohlberg Kravis Roberts & Co. LLP and a Commissioner of Historic England.
Previous AppointmentsMartin was Chief Executive at M&G Real Estate from 1996 and Chairman from 2012 until his retirement in 2013. He has been an Adviser and Commissioner of The Crown Estate, a Board member and President of the British Property Federation, and a Board member and Chairman of the Investment Property Forum.
He is a member of the Audit and Remuneration Committees.
Age 60
Christopher FisherIndependent Non-Executive Director
Appointed 1 October 2012
Skills and ExperienceChristopher has spent his career in corporate finance and has over 10 years of plc Board experience.
Current AppointmentsHe is Chairman of the Marshall Aid Commemoration Commission.
Previous AppointmentsChristopher spent most of his career at Lazard, latterly as a Managing Director. He subsequently worked at KPMG as Vice Chairman, Corporate Finance, and at Penfida, the corporate finance adviser to pension fund trustees, as a Senior Partner. On corporate Boards, he has held appointments as Chairman of Bank of Ireland UK, as Chairman of Southern Cross Healthcare and as a Non-Executive Director of Kelda Group PLC, the FTSE 100 water group. On public bodies he has served as President of the Council of the University of Reading and as a member of the Trustee Board of the Imperial War Museum.
He is a member of the Audit, Nomination and Remuneration Committees.
Age 63
Doug WebbIndependent Non-Executive Director
Appointed 1 May 2010
Skills and ExperienceDoug comes from a corporate financial management background and has 10 years’ Board level experience as a Chief Financial Officer of listed companies. He brings recent and relevant financial experience to the Board.
Current AppointmentsDoug was appointed as a Non-Executive Director in May 2010. He is currently the Chief Financial Officer of Meggitt plc, a member of the Investment Advisory Committee of Fitzwilliam College, Cambridge, and a Fellow of the Institute of Chartered Accountants in England and Wales.
Previous AppointmentsBetween 2008 and 2012 he was Chief Financial Officer of London Stock Exchange Group plc. He was previously Chief Financial Officer of QinetiQ Group plc and Financial Director Continental Europe and Chief Financial Officer North America at Logica plc. Prior to these appointments he spent 12 years at Price Waterhouse.
He is Chairman of the Audit Committee and a member of the Nomination Committee.
Age 55

66SEGRO Annual Report and Accounts 2016
Governance
Governance Framework
Operations Committee
To assist the Chief Operating Officer to
manage the operations of the Group and to discharge
the responsibilities delegated to him by the Executive Committee.
6
Board
Nomination Comm
ittee
Audit Committee
Rem
uner
atio
n Co
mmittee
Investment Committee
Fina
nce
Com
mitte
e
Executive CommitteeO
perations Com
mittee
Risk Committe
e
Board Responsible for creating and delivering
sustainable shareholder value.
1
1
Executive Committee
To assist the Chief Executive with the development and implementation of Group strategy, the management
of the business and the discharge of responsibilities
delegated by the Board.
5
5
Investment Committee
To manage the allocation of capital across the Group and to oversee all major
investment and divestment decisions on behalf of the
Executive Committee.
8
8
Risk Committee
To establish, monitor and report to the Executive
Committee and ultimately the Board and Audit Committee on the
Group’s approach to risk management.
7 Finance Committee
To monitor compliance with the Group’s Treasury Policies and the Group’s solvency, funding and
hedging positions.
9
Audit Committee
Monitors the integrity of the Group’s financial statements, reviews the relationship with the auditor and the role and effectiveness
of the internal audit function.Oversees the risk management process
and control environment.
3
6
7
9
3
Nomination Committee
Ensures that the Board and the senior management team have the appropriate skills,
knowledge and experience to operate effectively and to deliver the strategy.
2
2
Remuneration Committee
Determines the reward strategy for the Executive Directors to align their interests
with those of shareholders.
4
4
Board Committees
Management Committees
67Overview Strategic Report Financial Statements
Governance
Governance Report
Responsibilities of the Board The Board is responsible for creating and delivering sustainable shareholder value. The Directors act in a way they consider will promote the long-term success of the Company for the benefit of shareholders, with regard to the interests of the Group’s employees, and the impact of the business on the community, the environment and the interests of other stakeholders.
Board membershipDetails of the Directors, including the skills and experience they each bring to the Board, are on pages 64 and 65. The Board comprises a Non-Executive Chairman, four Executive Directors and five Independent Non-Executive Directors, all of whom are equally responsible for the proper stewardship of the Group. Taking into account the provisions of the Code, each of the Non-Executive Directors is considered independent in character and judgement. The Chairman was considered independent on appointment and the Board still considers him to be so. Further information is provided in the Nomination Committee Report on pages 73 to 76.
AttendanceAll Directors are expected to attend Board and Committee meetings of which they are a member. During 2016, there were seven scheduled Board meetings.
None of the Non-Executive Directors had raised concerns over the time commitment required of them to fulfil their duties.
Attendance at Board meetings during 2016 is set out in the table on the following page.
Roles and responsibilities of the DirectorsThe Board is responsible collectively for the success of the Group. The table below explains the responsibility of each of the Board members. The division of responsibilities of the Chairman, Chief Executive and Senior Independent Director are set out in writing and approved by the Board.
Role Name Responsibilities
Chairman Gerald Corbett ° Leads the Board and ensures its effectiveness.
° Sets the agenda, style and tone of Board discussions to promote constructive debate and effective decision making.
° Ensures that the corporate governance of the Group is maintained in line with current best practice.
° Takes the necessary steps to ensure that all Directors receive the accurate, clear and timely information which they require to enable them to make sound decisions, to monitor the business effectively and to fulfil their duty to promote the success of the Company.
° Ensures effective communication with shareholders and stakeholders and makes sure that the members of the Board develop an understanding of the views of major investors.
Chief Executive Officer David Sleath ° Manages the business of the Group.
° Recommends the Group’s strategy to the Board and is responsible for the implementation of that strategy and for the Group’s overall performance.
Executive Directors Soumen Das
Andy Gulliford
Phil Redding
° Manage the business operations within each Director’s area of responsibility in accordance with the Group’s strategy.
Independent Non-Executive Directors
Christopher Fisher
Martin Moore
Mark Robertshaw
Doug Webb
° Bring independent judgement and scrutiny to the decisions taken by the Board.
° Monitor the success of management in delivering the agreed strategy within the risk appetite and control framework set by the Board.
Senior Independent Non-Executive Director
Margaret Ford ° Acts as a sounding board to the Chairman and serves as an intermediary for other Directors when necessary.
° Available to shareholders should the occasion arise where there is a need to convey concerns to the Board other than through the Chairman or the Chief Executive.
Group Company Secretary
Elizabeth Blease ° Responsible for advising the Board on all governance matters.
° Ensures timely and appropriate information flows within the Board, the Board Committees and between the Directors and senior management.
° Ensures compliance with all relevant statutory and regulatory requirements.
° Gives guidance and advice within the Company on matters of business ethics and good governance.
° Is available to give detailed practical support and guidance to Directors both individually and collectively.

68SEGRO Annual Report and Accounts 2016
Governance
Governance Report continued…
Table of attendance Board
Nigel Rich1 3/3
Gerald Corbett2 5/5
Christopher Fisher 7/7
Margaret Ford3 6/7
Andy Gulliford 7/7
Martin Moore 7/7
Justin Read 7/7
Phil Redding 7/7
Mark Robertshaw 7/7
David Sleath 7/7
Doug Webb 7/7
Total number of meetings 7
1 Retired from the Board at AGM in April 2016
2 Joined the Board on 1 March 2016
3 Unable to attend one Board meeting due to family illness
A number of other unscheduled Board meetings and telephone conference calls were also held during the year, as the need arose. Each of the Directors has committed to attend all scheduled Board and Committee meetings and would not do so only in exceptional circumstances. Similarly, every effort is made by Directors to attend ad hoc meetings either in person or by using conference facilities.
On the rare occasion that a Director cannot attend a meeting they are still provided with the papers in advance of the meeting and are given an opportunity to discuss them with the Chairman or the Chief Executive.
The work of the BoardRole of the Board The principal role of the Board is to ensure that the Group’s strategy creates and sustains long-term value for its investors. Details of how the Company generates and preserves value are set out in the Strategic Report. The Board retains responsibility for the approval of certain matters which include: Group strategy; the annual budget; the dividend policy; major investments and disposals; and the financial structure. There is an approved Schedule of Matters Reserved for Decision by the Board, which is reviewed each year.
The day-to-day running of the Group is delegated by the Board to the Chief Executive who is supported by the Executive Committee.
Key activities of the Board during 2016 Routine Business
Q1 Q2 Q3 Q4
° Review of the Medium-Term Financial Plan and setting of medium-term objectives
° Presentation from the Company’s independent valuers on the 2015 full-year valuation
° Approval of the 2016 budget
° Approval of 2015 financial results and final dividend
° Approval of Principal Risks and risk appetite
° Review of people strategy, succession planning and talent management
° Annual reports on community engagement, charitable giving, customer satisfaction survey, insurance and sustainability strategy
° Review of the conclusions of the Board evaluation
° Rolling reviews of the performance of investments and developments over the previous three years
° Consideration of the outlook for the property market, both occupier and investment, and the economic climate
° Presentations from the Company’s brokers on shareholders’/analysts’ attitudes to the Company
° Presentation from the Company’s independent valuers on the 2016 half-year valuation
° Approval of the 2016 half-year financial results and interim dividend
° Approval of Principal Risks
° Annual review of corporate governance and an update on corporate and regulatory changes and reporting requirements
° A Review of investor feedback
° Annual review of Treasury Policies
° Rolling reviews of the performance of investments and developments over the previous three years
° Consideration of the outlook for the property market, both occupier and investment, and the economic climate
° Annual update on the performance of the SELP joint venture
° Annual strategy day including asset plans, portfolio planning and the Medium-Term Financial Plan
Matters specific to 2016
° Approval of a 184,000 sq m pre-let in Rome
° Debt financing – 2016 recommendations and future strategy
° Approval to enter into joint venture with Roxhill
° Training on the Market Abuse Regulations
° Approval of the sale of Heston and Airlinks industrial Estate
° Review of the proposal for the SELP joint venture to launch a €500 million bond
° Approval of investment and infrastructure works at SEGRO Logistics Park East Midlands Gateway
° Approval of £325 million equity placing
° Approval of the sale of land in west London to a residential developer

69Overview Strategic Report Financial Statements
Governance
Committee structure The Board has delegated a number of its responsibilities to the Audit, Nomination and Remuneration Committees, details of which are set out below. The Terms of Reference of these Committees can be found at www.SEGRO.com. The Company ensures that these Committees are provided with sufficient resources to undertake their duties.
Responsibility for all operational matters, including the implementation of Group strategy, is delegated to the Chief Executive. The Executive Committee supports the Chief Executive in the delivery of strategy, establishing financial and operating targets and monitoring performance against those targets. At each meeting the Committee reviews financial and operational performance, considers any health and safety incidents, carries out a pre-approval review of items requiring Board approval and acts as a primary approval channel for matters below Board-approval level. The Executive Committee has its own Terms of Reference. This Committee meets formally each month but also meets each week for an informal discussion of day-to-day issues.
The Executive Committee delegates some of its responsibilities to a further four Committees:
° the Investment Committee;
° the Operations Committee;
° the Risk Committee; and
° the Finance Committee.
These Committees have their own Terms of Reference and membership includes at least one member of the Executive Committee. For further details see page 66.
Re-election of DirectorsIn accordance with the Code, each of the Directors will submit themselves for re-election at the 2017 AGM, save for Soumen Das who will be submitting himself for election as this will be his first meeting since his appointment. The Nomination Committee Report on pages 73 to 76 provides more information about the Directors’ appraisal process, while their skills and expertise are set out in the Directors’ biographies on pages 64 and 65.
RiskThe Board recognises that effective risk management is central to the achievement of the Group’s strategic objectives and the long-term sustainable growth of the business. The Board has overall accountability for ensuring that risk is managed effectively across the Group, and the Audit Committee reviews the effectiveness of the risk management process on behalf of the Board. Further details about the risk management process and the Group’s Principal Risks are set out on pages 54 to 61.
Please see page 56 for details about how the Board has complied with the provisions in the Code to carry out a robust assessment of the principal risks facing the Company.
EvaluationThe Board has a policy of undertaking externally facilitated evaluations every three years and internal reviews in the intervening two years. External evaluations took place in 2008, 2011 and 2014.
In 2016, the Chairman, with the assistance of the Group Company Secretary, led an internal review process. Questionnaires for the Board and the three Board Committees were prepared that encouraged the Directors to provide written comments on a number of themes rather than simply tick boxes.
The questionnaires covered nine themes:
° composition of the Board;
° balance of power within the Board and across its Committees;
° knowledge of the business;
° role of the Chairman;
° strategy and decision making;
° relationship with shareholders;
° Board administration;
° risk management; and
° effectiveness.
The Directors were unanimous in their view that the Board was operating effectively. There was agreement that the Board was the right size and had the appropriate range of skills and experience. The quality of Board discussions was good and there was a climate of trust and transparency. The Executive Directors were seen as being open and engaged, while the Non-Executive Directors brought a range of skills and experience, and ensured constructive debate.
The Board followed up on each of the action plans from 2015, which included spending time considering diversity on the Board (see Nomination Committee Report), the impact on Brexit (see Principal Risks) and altering the 2018 Board calendar to balance the intervals between meetings throughout the year.
The performance of the three Board Committees was also reviewed and it was noted that each was performing effectively.
The Board, and each of its Committees, considered the feedback and agreed action plans for the forthcoming year.
As part of the appraisal process, the Senior Independent Director meets annually with the Non-Executive Directors to discuss the performance of the Chairman. The Chairman, with the Non-Executive Directors, also conducted a performance evaluation of the Chief Executive.
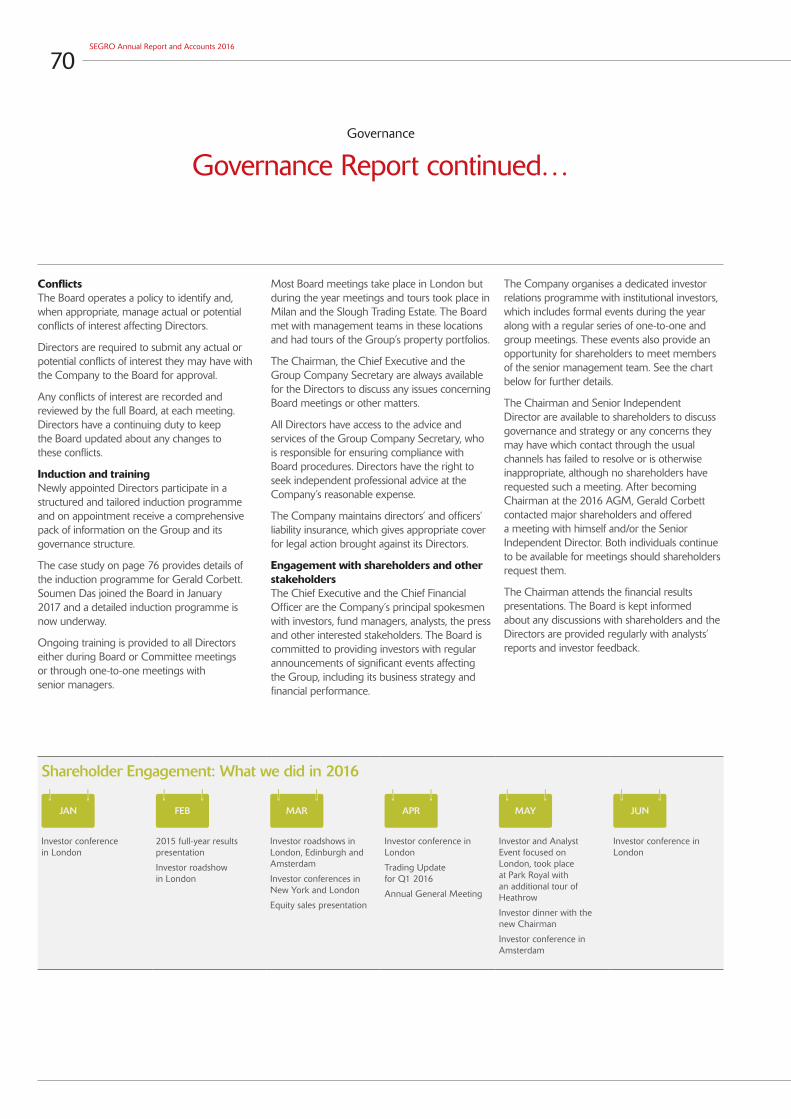
70SEGRO Annual Report and Accounts 2016
Governance
Governance Report continued…
ConflictsThe Board operates a policy to identify and, when appropriate, manage actual or potential conflicts of interest affecting Directors.
Directors are required to submit any actual or potential conflicts of interest they may have with the Company to the Board for approval.
Any conflicts of interest are recorded and reviewed by the full Board, at each meeting. Directors have a continuing duty to keep the Board updated about any changes to these conflicts.
Induction and trainingNewly appointed Directors participate in a structured and tailored induction programme and on appointment receive a comprehensive pack of information on the Group and its governance structure.
The case study on page 76 provides details of the induction programme for Gerald Corbett. Soumen Das joined the Board in January 2017 and a detailed induction programme is now underway.
Ongoing training is provided to all Directors either during Board or Committee meetings or through one-to-one meetings with senior managers.
Most Board meetings take place in London but during the year meetings and tours took place in Milan and the Slough Trading Estate. The Board met with management teams in these locations and had tours of the Group’s property portfolios.
The Chairman, the Chief Executive and the Group Company Secretary are always available for the Directors to discuss any issues concerning Board meetings or other matters.
All Directors have access to the advice and services of the Group Company Secretary, who is responsible for ensuring compliance with Board procedures. Directors have the right to seek independent professional advice at the Company’s reasonable expense.
The Company maintains directors’ and officers’ liability insurance, which gives appropriate cover for legal action brought against its Directors.
Engagement with shareholders and other stakeholdersThe Chief Executive and the Chief Financial Officer are the Company’s principal spokesmen with investors, fund managers, analysts, the press and other interested stakeholders. The Board is committed to providing investors with regular announcements of significant events affecting the Group, including its business strategy and financial performance.
The Company organises a dedicated investor relations programme with institutional investors, which includes formal events during the year along with a regular series of one-to-one and group meetings. These events also provide an opportunity for shareholders to meet members of the senior management team. See the chart below for further details.
The Chairman and Senior Independent Director are available to shareholders to discuss governance and strategy or any concerns they may have which contact through the usual channels has failed to resolve or is otherwise inappropriate, although no shareholders have requested such a meeting. After becoming Chairman at the 2016 AGM, Gerald Corbett contacted major shareholders and offered a meeting with himself and/or the Senior Independent Director. Both individuals continue to be available for meetings should shareholders request them.
The Chairman attends the financial results presentations. The Board is kept informed about any discussions with shareholders and the Directors are provided regularly with analysts’ reports and investor feedback.
Shareholder Engagement: What we did in 2016
JAN FEB
MAR
APR
MAY
JUN
Investor conference in London
2015 full-year results presentation
Investor roadshow in London
Investor roadshows in London, Edinburgh and Amsterdam
Investor conferences in New York and London
Equity sales presentation
Investor conference in London
Trading Update for Q1 2016
Annual General Meeting
Investor and Analyst Event focused on London, took place at Park Royal with an additional tour of Heathrow
Investor dinner with the new Chairman
Investor conference in Amsterdam
Investor conference in London

71Overview Strategic Report Financial Statements
Governance
The Company’s website, www.SEGRO.com, provides shareholders with comprehensive information on the Group’s recent business activities and financial developments, including webcasts, press releases and recordings of interviews with the Chief Executive.
We have a dedicated Investor Relations team which reports to the Chief Financial Officer. Communication with investors and analysts is an ongoing process throughout the year on a proactive and reactive basis. This includes regular scheduled Investor Relations events, outlined in the calendar below, as well as one-to-one and group meetings with Executive Directors, tours of our properties and equity sales team presentations at global and local investment banks. During the year, the Chief Executive, along with the Executive Directors and senior management along with our Investor Relations team met with representatives from 148 institutions.
Debt investors programme Banks and BondholdersA regular dialogue is maintained with our key relationship banks, bondholders and secured lenders, during 2016 this included:
° at least bi-annual meetings between lending banks and our Treasury team and Group Finance Director;
° an annual Bank and Bondholders’ meeting, which was attended by approximately 10 of our banks and bondholders;
° meeting with a number of bondholders at a Fixed Investor Conference; and
° active engagement between our Treasury team and potential lenders/debt investors.
Credit rating agenciesDuring the year, updates and meetings were held by our Treasury team with Fitch Ratings, Inc rating agency.
Constructive use of the AGMThe AGM is an opportunity for the Directors to communicate with, and answer questions from, shareholders. All Directors are available to meet informally with shareholders before and after the meeting. Prior to the formal business of the meeting, the Chief Executive makes a presentation on the progress and performance of the Group.
The Notice of AGM is posted to shareholders at least 20 working days before the meeting. The Company proposes separate resolutions on each substantially separate issue, with voting conducted by poll. The Board believes this voting process is more democratic than a show of hands since all shares voted at the meeting, as well as proxy votes lodged before the meeting, are counted. For each resolution, shareholders will have the option to vote either for or against a resolution, or to withhold their vote. Following the meeting, the results of votes lodged for and against each resolution are announced to the London Stock Exchange and displayed on the Company’s website.
Shareholder Engagement: What we did in 2016 continued...
JUL AUG
SEP
OCT
NOV
DEC
2016 half-year results
Investor roadshows in London and Amsterdam
Equity sales presentations in London
Investor roadshows in London and Amsterdam
Investor conferences in New York and London
Investor roadshow in Toronto
Retail investor roadshow in London
Equity sales presentations in London
Trading Update for Q3 2016
Investor roadshows in Paris
Investor conference in London
Investor conference in Cape Town

72SEGRO Annual Report and Accounts 2016
Off SiteEach year the Board takes some time to stand back from its more regular work and reflect on some of the wider issues facing the business. This year more than ever there has been political change at home and abroad which may lead to economic uncertainty. Alongside this, there are global business trends such as internet retailing, disruptive technologies and the continued demand for space in already highly populated regions which can all have an impact on the future shape of our business.
The day is also an opportunity for the Non-Executive Directors to hear from members of the Senior Leadership Team and external speakers. It was also a good opportunity for the Non-Executive Directors to hear from individuals below Board level, including some of the Group’s younger talent.
Here is a snap shot of what the Board talked about at its Off Site this year.
° The Board discussed the 5 year financial plan which is built upon detailed asset and development plans, our overall portfolio ‘master plan’ and our assessment of the most likely economic and property market scenarios and our funding assumptions. The plan was also stress tested, for a number of alternative scenarios to assess the resilience of our business in the event of an economic downturn.
° Like any Board we constantly monitor competitor activity in our markets but during the Off Site there is time to stand back and to review our business model, to assess our own competitive position and challenge ourselves as to whether there is anything we could be doing differently or better.
° The extent of our geographic footprint and the challenge of achieving critical mass in some markets remains a key focus. The Board has recognised the benefits from being a multi-jurisdictional provider of warehouse and logistics facilities in Europe, provided we pick the right markets and can achieve scale in all of the markets in which we operate. The Board heard about the progress in our new markets of Spain and Italy, along with thoughts about other Continental European markets for the medium to longer term.
° CBRE’s UK and EMEA Heads of Research presented the Board with their assessment of the economic environment and outlook for our property markets, including their expectations of the impact of heightened geopolitical uncertainty, including Brexit, on our markets.
° Aligning itself with one of our values (‘Keeping one eye on the horizon’), the Directors spent part of the day thinking about future threats and opportunities. The ‘Futures Group’, a cross-business team of eight of our young leaders gave a presentation on potential future trends and disruptive technologies and how they could affect our business and our customers.
Although this is quite deliberately not a day for approvals, the presentations, the challenges and the discussions will help to provide a context for decisions the Board will have to take over the forthcoming year. A number of actions were agreed which included continuing to remain alert to the changing environment.
Gerald CorbettChairman
Board tour of assets around Milan

73Overview Strategic Report Financial Statements
Governance
Nomination Committee Report
Succession planning and diversity will be key agenda items during 2017.
Gerald Corbett Chairman of the Nomination Committee
I am pleased to present my first report as Chairman of the Nomination Committee having succeeded Nigel Rich as Chairman in April 2016.
The Committee’s key role is to ensure that the Board has the appropriate skills, knowledge and experience to operate effectively and deliver our strategy. The Committee is responsible for reviewing the size, structure and composition of the Board, making recommendations about new appointments and ensuring that appointment processes are formal, rigorous and transparent.
I joined the Board in March and was appointed Chairman at the 2016 AGM in April. The process which was followed for my appointment was fully explained in the 2015 Nomination Committee report so I will not repeat it here. During the year, the Committee re-appointed Doug Webb and Mark Robertshaw each for a third, three-year term, and Margaret Ford for a second, three-year term. The Committee considered the performance of each of these Directors, and the review was particularly rigorous in respect of Mr Webb and Mr Robertshaw, as both would have served six years as Directors. It was agreed that each of these Directors continued to be effective, made a valuable contribution to the meetings and continued to demonstrate commitment to the role. I am pleased to report that each of them agreed to continue to serve as Directors for further three-year terms.
In April, we announced that Justin Read would be retiring from the Board and his position as Group Finance Director. Following an extensive process, as explained on page 74 and 75, we were pleased to welcome Soumen Das to the Board as our new Chief Financial Officer in January this year.
The Committee’s role in considering the succession planning needs of the Board and its Committees as well as understanding the succession plans for the Leadership Team, should ensure that a strong pipeline of talented individuals is available to support the Company, meet its future business objectives and achieve its strategic goals. For 2017, longer-term succession planning for the Non-Executive Directors will be a particular area of focus.
Gerald CorbettChairman of the Nomination Committee
Areas of focus 2016 ° the appointment of the Chief Financial Officer;
° the size, structure and composition of the Board; and
° the proposal for the reappointment of Directors at the 2017 AGM.
Areas of focus 2017 ° the Company’s diversity policy;
° succession planning for the Non-Executive Directors; and
° the size, structure and composition of the Board.
Attendance at Committee meetingsGerald Corbett (Chairman)1 3/3
Nigel Rich (Former Chairman)2 3/3
Christopher Fisher 5/5
Margaret Ford3 4/5
David Sleath 5/5
Doug Webb 5/5
Total 5
1 Gerald Corbett joined the Nomination Committee on his appointment to the Board in March 2016.
2 Nigel Rich did not attend the Nomination Committee meetings when his own succession was considered. He stepped down from the Nomination Committee on his retirement from the Board in April 2016.
3 Margaret Ford was unable to attend the May 2016 Nomination Committee meeting due to another business commitment.
=

74SEGRO Annual Report and Accounts 2016
Governance
Nomination Committee Report continued…
Role of the Committee The key roles and responsibilities of the Committee are to:
° Regularly review the skills and experience of the Board to ensure that it is the right structure, size and composition (taking account of skills, experience, independence, knowledge and diversity) to operate effectively and to deliver our strategy;
° To lead the process for Board appointments. To identify and nominate for Board approval, candidates to fill Board vacancies, identifying the skills required for the role, appointing a search firm, recognising the benefits of diversity, and in the case of Non-Executive Directors ensuring they will have sufficient time for the role;
° Ensuring the Company’s leadership skills are fully aligned with the Company’s long-term strategy;
° Consider succession planning for the Executive and Non-Executive Directors and to ensure succession planning is in place for members of the Leadership Team;
° Consider the diversity policy; and
° Recommend the election by shareholders of the Directors, having due regard to their performance and ability to continue to contribute to the Board, taking into consideration the skill, experience and knowledge required along with the need for progressive refreshing of the Board.
Experience of the Board See chart below which summarises the experience of the Directors.
Appraisal processThe annual appraisal of the Chairman is led by the Senior Independent Director.
The Chairman leads the appraisal of the Chief Executive by arranging a meeting of Non-Executive Directors to discuss his performance. The Non-Executive Directors agreed that the Chief Executive was performing well, executing his tasks with energy and leading the executive team in an effective way. It was a credit to the Chief Executive that the Company had had a good year with his team delivering all their agreed objectives.
The performance of the other Executive Directors is appraised by the Chief Executive, with feedback from the other Directors where appropriate.
Appointment of Directors Following these appraisal processes, the Committee concluded that each of the Directors continue to make an effective contribution to the Board. It also considered the time commitments of the Non-Executive Directors, and concluded that each of the Directors had sufficient time to commit to the Company. In particular, the Committee reviewed the time commitments for Gerald Corbett, who became the Company’s Chairman in April 2016. He is the Chairman of Numis Corporation plc (‘Numis’), an AIM company and of Britvic plc.
The most recent accounts for both of these companies confirm that he attended every Board meeting and relevant Committee meeting. He has previously announced that he will retire from Numis once a successor has been appointed. He has agreed to remain in place until a new chairman is appointed in order to ensure an orderly succession. The Committee further noted that he has been Chairman of Britvic for 11 years and that a search is underway to identify his successor. He will continue as Chairman in 2017 to ensure a smooth handover. The Committee concluded that he would have sufficient time to commit to the Company including recognising the need for availability in the event of crises.
Details of the Non-Executive Directors’ letters of appointment and their fees are set out in the Remuneration Report and the Remuneration Policy.
Appointment of Soumen DasFollowing Justin Read’s announcement to the Board of his intention to take early retirement, the Nomination Committee met to agree the process to identify his successor. It decided to appoint Russell Reynolds Associates to lead the search as they had an established reputation for leading financial executive searches. Russell Reynolds Associates do not have any other connection with the Company.
Experience of the Board
International Corporate experience
Real Estate experience Banking/City experience Finance experience in line management or audit capacity
60% 40% 70% 40%40% 60% 30% 60%
Experienced Not experienced
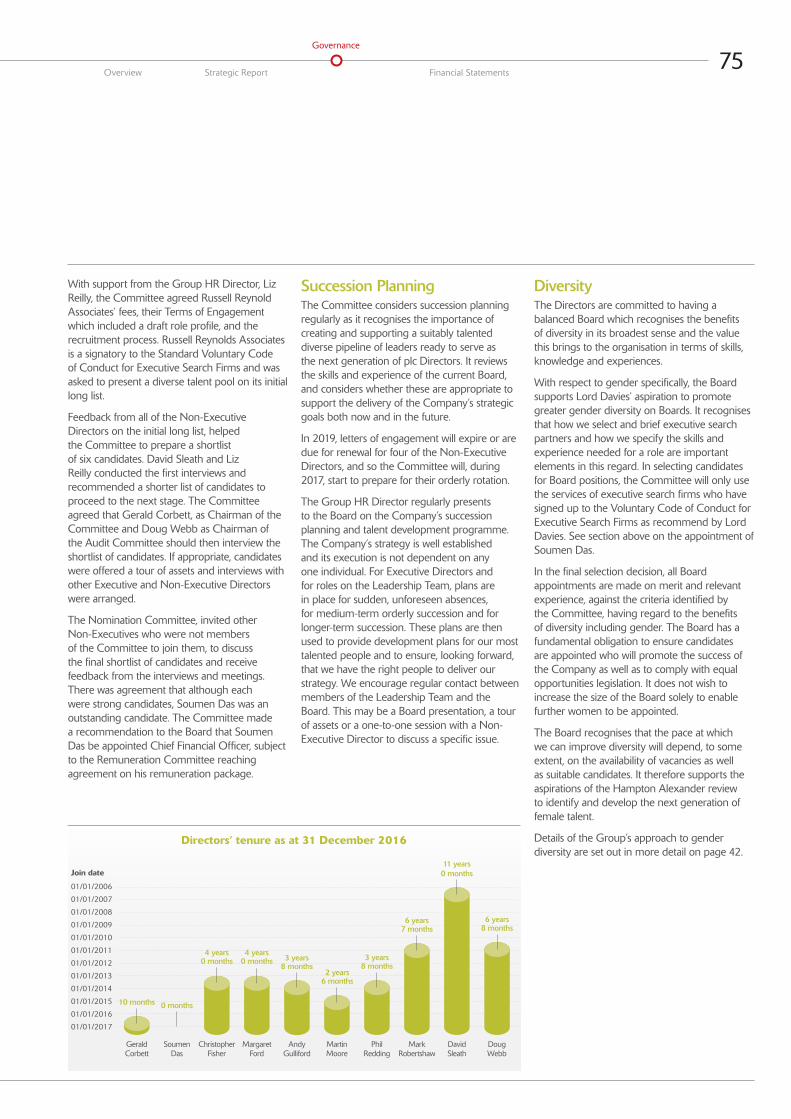
75Overview Strategic Report Financial Statements
Governance
With support from the Group HR Director, Liz Reilly, the Committee agreed Russell Reynold Associates’ fees, their Terms of Engagement which included a draft role profile, and the recruitment process. Russell Reynolds Associates is a signatory to the Standard Voluntary Code of Conduct for Executive Search Firms and was asked to present a diverse talent pool on its initial long list.
Feedback from all of the Non-Executive Directors on the initial long list, helped the Committee to prepare a shortlist of six candidates. David Sleath and Liz Reilly conducted the first interviews and recommended a shorter list of candidates to proceed to the next stage. The Committee agreed that Gerald Corbett, as Chairman of the Committee and Doug Webb as Chairman of the Audit Committee should then interview the shortlist of candidates. If appropriate, candidates were offered a tour of assets and interviews with other Executive and Non-Executive Directors were arranged.
The Nomination Committee, invited other Non-Executives who were not members of the Committee to join them, to discuss the final shortlist of candidates and receive feedback from the interviews and meetings. There was agreement that although each were strong candidates, Soumen Das was an outstanding candidate. The Committee made a recommendation to the Board that Soumen Das be appointed Chief Financial Officer, subject to the Remuneration Committee reaching agreement on his remuneration package.
Succession PlanningThe Committee considers succession planning regularly as it recognises the importance of creating and supporting a suitably talented diverse pipeline of leaders ready to serve as the next generation of plc Directors. It reviews the skills and experience of the current Board, and considers whether these are appropriate to support the delivery of the Company’s strategic goals both now and in the future.
In 2019, letters of engagement will expire or are due for renewal for four of the Non-Executive Directors, and so the Committee will, during 2017, start to prepare for their orderly rotation.
The Group HR Director regularly presents to the Board on the Company’s succession planning and talent development programme. The Company’s strategy is well established and its execution is not dependent on any one individual. For Executive Directors and for roles on the Leadership Team, plans are in place for sudden, unforeseen absences, for medium-term orderly succession and for longer-term succession. These plans are then used to provide development plans for our most talented people and to ensure, looking forward, that we have the right people to deliver our strategy. We encourage regular contact between members of the Leadership Team and the Board. This may be a Board presentation, a tour of assets or a one-to-one session with a Non-Executive Director to discuss a specific issue.
DiversityThe Directors are committed to having a balanced Board which recognises the benefits of diversity in its broadest sense and the value this brings to the organisation in terms of skills, knowledge and experiences.
With respect to gender specifically, the Board supports Lord Davies’ aspiration to promote greater gender diversity on Boards. It recognises that how we select and brief executive search partners and how we specify the skills and experience needed for a role are important elements in this regard. In selecting candidates for Board positions, the Committee will only use the services of executive search firms who have signed up to the Voluntary Code of Conduct for Executive Search Firms as recommend by Lord Davies. See section above on the appointment of Soumen Das.
In the final selection decision, all Board appointments are made on merit and relevant experience, against the criteria identified by the Committee, having regard to the benefits of diversity including gender. The Board has a fundamental obligation to ensure candidates are appointed who will promote the success of the Company as well as to comply with equal opportunities legislation. It does not wish to increase the size of the Board solely to enable further women to be appointed.
The Board recognises that the pace at which we can improve diversity will depend, to some extent, on the availability of vacancies as well as suitable candidates. It therefore supports the aspirations of the Hampton Alexander review to identify and develop the next generation of female talent.
Details of the Group’s approach to gender diversity are set out in more detail on page 42.
Directors’ tenure as at 31 December 2016
GeraldCorbett
ChristopherFisher
SoumenDas
MargaretFord
AndyGulliford
MartinMoore
PhilRedding
MarkRobertshaw
DavidSleath
DougWebb
10 months 0 months
4 years0 months
4 years0 months 3 years
8 months2 years
6 months
3 years8 months
6 years7 months
11 years0 months
6 years8 months
01/01/2006
Join date
01/01/2007
01/01/2008
01/01/2009
01/01/2010
01/01/2011
01/01/2012
01/01/2013
01/01/2014
01/01/2015
01/01/2016
01/01/2017
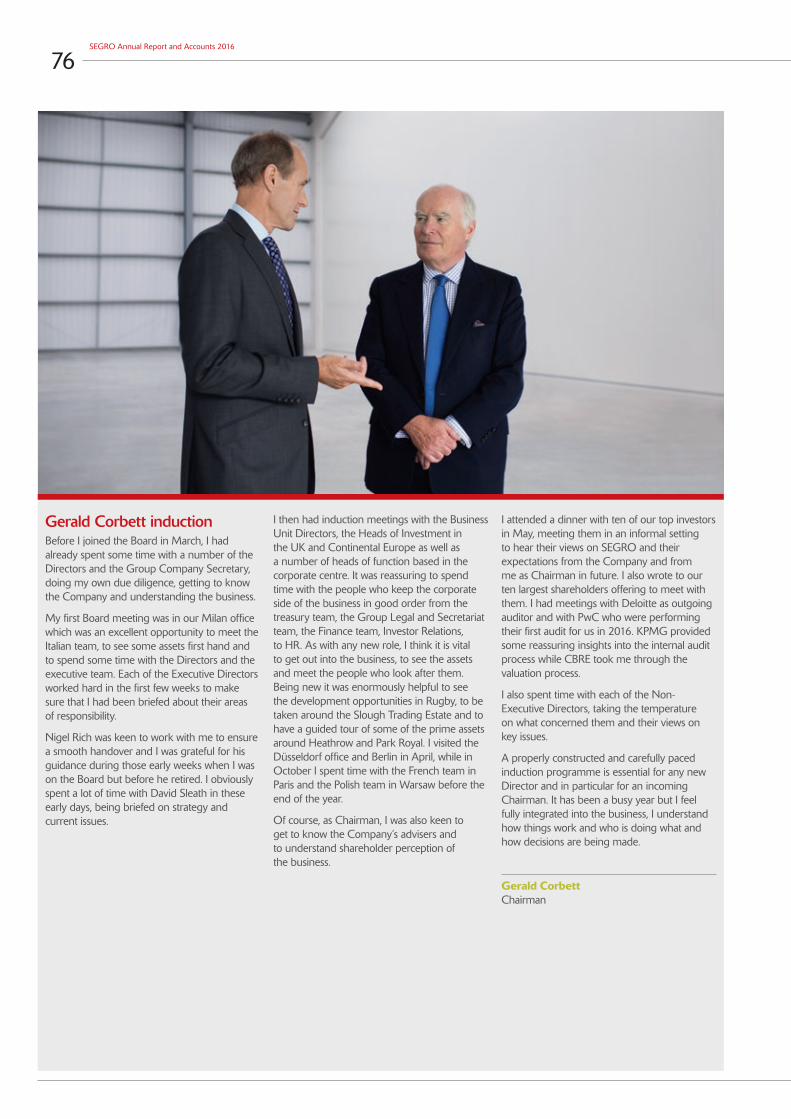
76SEGRO Annual Report and Accounts 2016
Gerald Corbett inductionBefore I joined the Board in March, I had already spent some time with a number of the Directors and the Group Company Secretary, doing my own due diligence, getting to know the Company and understanding the business.
My first Board meeting was in our Milan office which was an excellent opportunity to meet the Italian team, to see some assets first hand and to spend some time with the Directors and the executive team. Each of the Executive Directors worked hard in the first few weeks to make sure that I had been briefed about their areas of responsibility.
Nigel Rich was keen to work with me to ensure a smooth handover and I was grateful for his guidance during those early weeks when I was on the Board but before he retired. I obviously spent a lot of time with David Sleath in these early days, being briefed on strategy and current issues.
I then had induction meetings with the Business Unit Directors, the Heads of Investment in the UK and Continental Europe as well as a number of heads of function based in the corporate centre. It was reassuring to spend time with the people who keep the corporate side of the business in good order from the treasury team, the Group Legal and Secretariat team, the Finance team, Investor Relations, to HR. As with any new role, I think it is vital to get out into the business, to see the assets and meet the people who look after them. Being new it was enormously helpful to see the development opportunities in Rugby, to be taken around the Slough Trading Estate and to have a guided tour of some of the prime assets around Heathrow and Park Royal. I visited the Düsseldorf office and Berlin in April, while in October I spent time with the French team in Paris and the Polish team in Warsaw before the end of the year.
Of course, as Chairman, I was also keen to get to know the Company’s advisers and to understand shareholder perception of the business.
I attended a dinner with ten of our top investors in May, meeting them in an informal setting to hear their views on SEGRO and their expectations from the Company and from me as Chairman in future. I also wrote to our ten largest shareholders offering to meet with them. I had meetings with Deloitte as outgoing auditor and with PwC who were performing their first audit for us in 2016. KPMG provided some reassuring insights into the internal audit process while CBRE took me through the valuation process.
I also spent time with each of the Non-Executive Directors, taking the temperature on what concerned them and their views on key issues.
A properly constructed and carefully paced induction programme is essential for any new Director and in particular for an incoming Chairman. It has been a busy year but I feel fully integrated into the business, I understand how things work and who is doing what and how decisions are being made.
Gerald CorbettChairman

77Overview Strategic Report Financial Statements
Governance
Audit Committee Report
The Audit Committee’s key role is to challenge and gain assurance around the processes that support financial reporting, including the valuation of the property portfolio; risk management; internal control; and legal and regulatory compliance in relation to the work of the Committee, together with the financial reporting itself.
Doug Webb Chairman of the Audit Committee
I am pleased to present the Audit Committee’s Report. This Report details the work of the Committee over the past 12 months and provides an oversight of the significant matters that have been considered during the year. Main focus of 2016During 2016, the Committee has, on behalf of the Board, provided independent scrutiny of the processes in place to monitor the Company’s financial and non-financial reporting including overseeing the viability statement process. We have examined the valuation process; overseen the robustness of the Group’s systems of internal control as well as its risk management process, and ensured that those processes adequately considered and mitigated against existing and new risks; and probed the performance of both the external and internal audit functions. Our work is described in more detail in the remainder of this Report.
New Audit TeamI am delighted to welcome PwC as the Company’s external auditor, led by lead audit partner, Craig Hughes, and look forward to the fresh perspective and new challenge that they are already beginning to bring. A key focus of our work this year has been to ensure that they were embedded into the business and a case study on how this has been achieved is set out on page 84.
Committee MembersEach Committee member is independent and has senior office experience in business and we all have the knowledge to properly discharge our duties, providing independent experience and understanding of the issues under consideration. I am pleased to report that the Board endorsed this conviction during its annual review of the Committee when it confirmed that we remained effective. Further information on the Board evaluation is set out on page 69.
Areas of focus 2016 ° ensuring the quality and consistency of the financial reporting;
° gaining assurance around the robustness of the valuation process;
° the effective transition to PricewaterhouseCoopers LLP (PwC) as the new external auditor;
° updating the policy for the use of the external auditor for non-audit services; and
° assessing the sufficiency of risk management and viability statement processes and internal controls.
Areas of focus 2017 ° monitoring the integrity of the financial statements, and reviewing and challenging them as appropriate;
° assessing the independence of the valuers and reviewing the robustness of the valuation process; and
° evaluating evolving legislation and best practice around audit reform to ensure compliance.
Attendance at Committee meetingsDoug Webb (Chairman) 4/4
Christopher Fisher 4/4
Margaret Ford 4/4
Martin Moore 4/4
Total 4

78SEGRO Annual Report and Accounts 2016
Governance
Audit Committee Report continued…
In addition, I believe that Margaret Ford and Martin Moore have the relevant property experience, and Christopher Fisher and I have the relevant financial experience required to ensure that the Committee’s members have competency in the sector that the Company operates in. In line with the Code and the Disclosure Guidance and Transparency Rules, as the Chief Financial Officer of Meggitt PLC and a Chartered Accountant, I also satisfy the requirement to bring recent and relevant financial experience, and experience in accounting to the Committee.
More information on the Committee members can be found on pages 64 and 65.
Committee MeetingsTo give more flavour to the matters under consideration, during the year there were a number of additional attendees at each of our meetings, including the Chief Executive, the Group Finance Director, PwC, the external auditor, and KPMG LLP (KPMG), the internal auditor. Presentations were also given by, amongst others, the Group Financial Controller, the Head of Business Information Systems, Procurement and Risk, the Director of Tax and the General Counsel and Group Company Secretary.
I believe that it is important for the Committee to meet privately with each of PwC and KPMG to satisfy ourselves that neither has been unduly influenced by management. The Committee met with PwC and KPMG on two occasions each during the year, and I can confirm that no concerns were raised.
Since gaining assurance around the valuation process is a key task of the Committee, I also consider it prudent to privately meet with the Company’s valuer, CBRE, to ensure I am comfortable with its independence and with the overall 2016 year-end valuation process. I met with CBRE in January 2017 and have no cause for concern.
Discharge of responsibilitiesI consider that the regular discussion and challenge that the Committee has with employees, the auditors and the valuer, together with the quality of reports and information prepared for the Committee, has enabled us to appropriately discharge our duties and responsibilities.
Doug WebbChairman of the Audit Committee

79Overview Strategic Report Financial Statements
Governance
2016 principal activities ° Reviewing the integrity, consistency and key accounting judgements made by management and the external and internal auditors, to ensure that the quality of the Company’s financial reporting is maintained, including going concern, in the Company’s half- and full-year financial statements.
° Assessing the independence of the valuer of the Group’s property portfolio and gaining assurance around the valuation process.
° Ensuring an effective transition to PwC as the Group’s new external auditor.
° Refreshing the Policy for the Approval of Non-Audit Services following a review of new legislation and guidance.
° Examining the performance of the external and internal auditors, their objectivity, effectiveness and independence, as well as the terms of their engagement and scope of their audit.
° Ensuring the process followed to support the making of the viability statement was robust and correctly followed.
° Monitoring the effectiveness of the Group’s risk management and internal control systems,
including analysing and challenging the results of internal audit reviews and management’s plans to resolve any actions arising from them.
° Overseeing matters relating to tax and any potential impact they may have on the integrity of the financial statements.
° Considering emerging best practice in relation to corporate governance.
Chart 1 below sets out the significant matters considered by the Committee during the year in relation to the financial statements.
Chart 1: 2016 significant mattersSignificant matter The action taken
Valuation of the property portfolioValuation is central to the business and is a significant area of judgement for the Committee as it is inherently subjective, because the valuer must make assumptions and judgements in reaching its conclusions. This is a recurring risk for the Group as it is key to its IFRS profitability, balance sheet portfolio value, net asset value, total property return, and employee incentives. It also affects investment decisions and the implementation of the Company’s disciplined capital allocation policy. It is included on the Risk Register and the process risk map as a potential key business risk.
The Committee is responsible for the assurance of the valuation process and for assessing the independence of the valuer.
The Committee ensured that there was a robust process in place to satisfy itself that the valuation of the property portfolio by CBRE, a leading firm in the UK and Continental European property markets, was carried out appropriately and independently. In addition, PwC has an experienced real estate specialist team of chartered surveyors, who provided assurance to the Committee that the processes used by the valuer were appropriate. The Committee is familiar with the way that management provide information to the valuer, and having reviewed and challenged the valuers’ approach, assumptions and judgements, remained satisfied that the process was well run with appropriate controls in place.
The Board met twice with CBRE to review, challenge, debate and consider the valuation process; understand any particular issues encountered in the valuation; and discuss the processes and methodologies used. The Chairman of the Audit Committee also met separately with CBRE to discuss such matters which allowed him to scrutinise the valuation process and ensure the valuer remained independent, objective and effective. This is an opportunity for a full and frank discussion to take place and the Committee confirms that it is satisfied that the valuation was not subject to undue influence.
On the basis of the above, the Committee concluded that the valuation had been carried out fairly and appropriately, and in accordance with the industry valuation standards, and were therefore suitable for inclusion in the financial statements.
For details of the Group’s properties and related accounting policies see Note 15 and Note 1 of the financial statements. For details of the results of the valuation, see Note 15 of the financial statements.
80SEGRO Annual Report and Accounts 2016
Governance
Audit Committee Report continued…
Significant matter The action taken
Accounting for significant acquisitions, disposals and investmentsDuring the year, the Company made a number of acquisitions, disposals and investments, some of which were large and complex. Certain transactions were considered to be significant because of the level of materiality involved and/or any unusual terms or conditions or judgements, and because of the risks inherent in the accounting process, including when a transaction or revenue should be recognised, and what the appropriate accounting treatment should be.
The accounting treatment of acquisitions, disposals and investments themselves, is a recurring risk for the Group and is considered to be significant, since an inappropriate approach could cause a misstatement of the Group’s financial position and/or results. The application of the accounting treatment to each particular transaction will be new and unique to the relevant transaction.
The Committee considered the accounting treatment of key, complex transactions during 2016, by reviewing and challenging management’s individual papers on accounting proposals and judgements.
Such transactions in the UK included: an acquisition in options over land in South East England and the Midlands with Roxhill; a swap of hotels in Greater London for a distribution warehouse in Northampton and the disposals of the Bath Road offices in Slough.
In Continental Europe, transactions included acquisitions of assets in the Netherlands; Italy and Spain; and the disposal of land and assets in Continental Europe to the SELP joint venture.
Following a review of the accounting treatment for these significant transactions, in particular at what point each transaction should be recognised and the treatment applied to the land options acquired as part of the Roxhill transaction, the Committee was satisfied that all relevant issues had been fully and adequately addressed and that the approach adopted by the Company was appropriate in each case, and in accordance with IFRS.
The Committee challenged the application of accounting policy and internal controls relating to revenue recognition and reviewed reports from the internal auditor, external auditor and management. The Committee also agreed with management’s treatment for the appropriate cut off for inclusion in the financial statements of a number of transactions.
For further details of the accounting treatment applied to such significant transactions, see Note 1 of the financial statements.
Regulatory ChangesThere were a number of legal, regulatory and best practice changes introduced during the year which affected the Committee and its work. The Committee believes it is important to comply with the amendments and asked the General Counsel and Group Company Secretary to give appropriate training to allow it to discharge its duties in this respect. In addition, the Committee’s Terms of Reference which set out its key responsibilities were updated to ensure compliance.
Fair, Balanced and UnderstandableThe Directors are required to confirm that they consider, taken as a whole, that the Annual Report is fair, balanced and understandable and provides the information necessary for shareholders to assess the Company’s performance, business model and strategy. In order to make this statement, the due diligence exercise reported last year, was again followed. The Committee has satisfied itself that the controls over the accuracy and consistency
of information presented in the Annual Report are robust, and has confirmed to the Board that the processes and controls around the preparation of the Annual Report are appropriate allowing the Board to make ‘the fair, balanced and understandable statement’ which is on page 105.
Viability StatementThe Committee continued to ensure that the process put in place in 2015 to allow the Board to make the viability statement, on page 56, was robust, in line with market practice and had been correctly and properly followed. In order to do this, the Committee ensured that the Group Risk Register had been assessed and reviewed so that the Company’s Principal Risks, where appropriate, were properly captured in the scenarios which would be used to stress test the Company’s viability. The Committee confirmed to the Board that it was comfortable with the process followed to make the viability statement.
Further work undertaken by the CommitteeIn addition to issues directly affecting the financial statements, the scope of the Committee’s work also encompassed many other aspects, including:
° monitoring the work of the Risk Committee, and discussing specific risk presentations which were delivered on key business areas such as the Group’s Treasury function and the risks associated with Brexit, to ensure that risk management continued to be promoted throughout the business;
° considering and assessing controls over IT, including cyber security;
° reviewing and considering internal control systems;

81Overview Strategic Report Financial Statements
Governance
° approving the internal audit programme and reviewing the implementation and progress of recommendations made by the internal audit function, together with the independence, appropriateness and effectiveness of the internal auditor; and
° reviewing the Company’s procedures on anti-bribery and corruption and whistleblowing, and ensuring that they were adequate.
Internal control frameworkThe Committee is responsible for reviewing the internal control systems on behalf of the Board. This review is consistent with the Code and covers all material areas of the Group, including risk management (see page 56 of Principal Risks) and compliance with controls. The Committee also monitored the effectiveness of the framework through reports from the Group Finance Director and Group Financial Controller, and PwC and KPMG on progress with internal control activities. The Committee reviews a schedule which lists all outstanding control points, notes the priority attaching to them and progress against agreed timeframes for resolution. The Committee confirms that it has not been advised of or identified any failings or weaknesses which it regards to be significant.
The Group has established internal controls and risk management systems in relation to the process for preparing the financial statements. Various checks on internal financial controls take place throughout the year, including internal audits, described in more detail on page 83 of this Report. Developments in accounting regulations and best practice in financial reporting are monitored by the Company and where appropriate, reflected in the financial statements. Training is also provided to the finance teams and the Committee is kept appropriately informed.
The financial reporting from each business unit is subject to review by a local finance manager prior to being submitted to the Group Finance function. The results of each business unit are subject to further review by the Group Finance function. The results are then consolidated by Group Finance and are subject to various levels of review including by senior management.
The draft consolidated statements are reviewed by various individuals including those independent of the preparer. The review includes checking internal consistency, consistency with other statements, and consistency with internal accounting records. The Committee and the Board review the draft consolidated financial statements. The Committee received reports from management and the auditor on significant judgements, changes in accounting policies, and other relevant matters relating to the consolidated financial statements. The financial statements are also subject to external audit.
As reported in the Principal Risks, there is an on-going process for identifying, evaluating and managing the principal risks faced by the Group, which has been in place for the year under review and up to the date of the approval of this Report. Risk management and internal controls are regularly reviewed by the Board as indicated on pages 68 and 69 of the Governance Report. The effectiveness of the Group’s risk management processes are frequently reviewed by the Committee. During 2016, the Committee received reports and presentations from the Head of Business Information Systems, Procurement and Risk, as well as a specific presentation from the Head of Treasury and Tax on the management of Treasury risks, which was part of a rolling programme to review risk management by the different functions of the Company. Previous presentations in this area have included investment and operational risk management. In addition, and as described in more detail on page 83, the internal audit programme is based on a consideration of the Principal Risks facing the Group which can be adapted during the year to incorporate any new or increased risks which materialise.
The Company does not tolerate fraud, impropriety or dishonesty of any kind and the Committee is responsible for overseeing and monitoring the Group’s anti-bribery and corruption policies and procedures contained in the Company’s Code of Ethics. This includes its policy on whistleblowing, which sets out the procedure by which employees and any third parties can use a confidential external service to raise concerns by email or telephone, whether in relation to financial reporting or other matters. The Committee receives an anti-bribery and corruption report at each meeting. There were no causes of concern during 2016.
External auditor tenureAs reported in the 2015 Annual Report, Deloitte LLP resigned as external auditor at the 2016 AGM and was replaced by PwC following a competitive tender which took place in 2015. The Board will recommend PwC’s reappointment to shareholders at the 2017 AGM. There are no contractual obligations which restrict the Committee’s choice of external auditor or which put in place a minimum period for their tenure. There are no current plans to re-tender the services of the external auditor.
The Company complies with the Competition and Market Authority Order 2014 relating to audit tendering and the provision of non-audit services, as discussed further in the following pages.
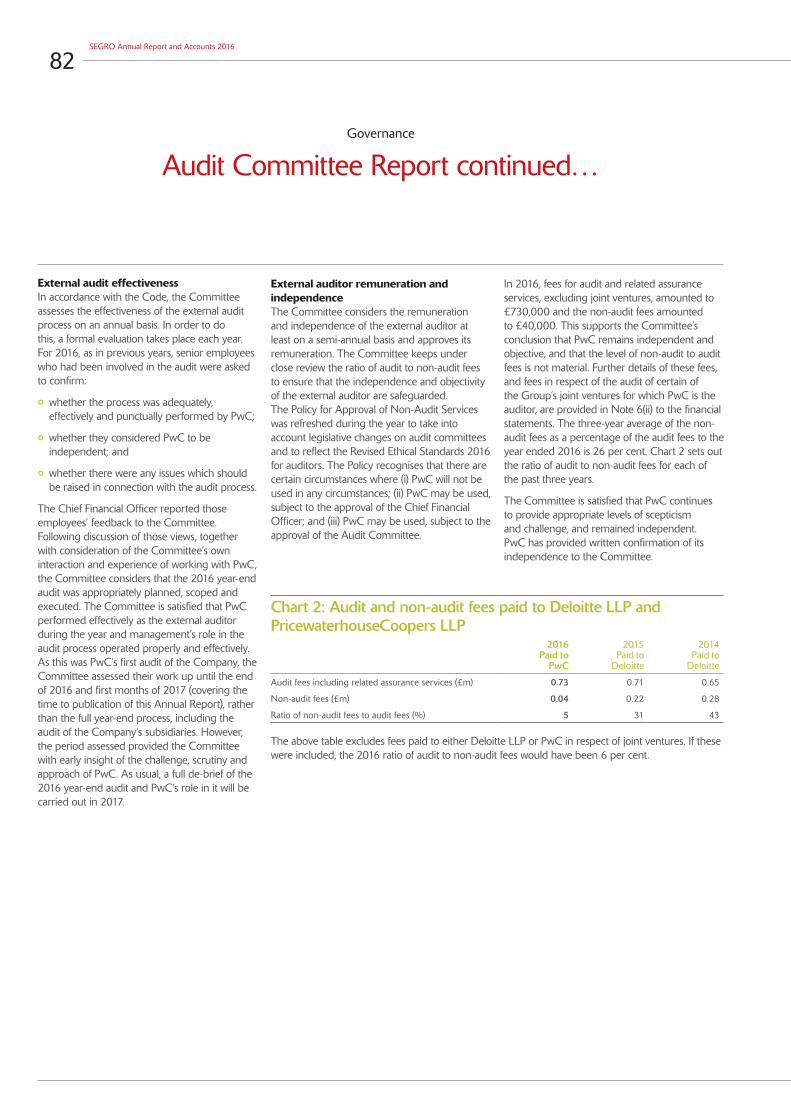
82SEGRO Annual Report and Accounts 2016
Governance
Audit Committee Report continued…
External audit effectivenessIn accordance with the Code, the Committee assesses the effectiveness of the external audit process on an annual basis. In order to do this, a formal evaluation takes place each year. For 2016, as in previous years, senior employees who had been involved in the audit were asked to confirm:
° whether the process was adequately, effectively and punctually performed by PwC;
° whether they considered PwC to be independent; and
° whether there were any issues which should be raised in connection with the audit process.
The Chief Financial Officer reported those employees’ feedback to the Committee. Following discussion of those views, together with consideration of the Committee’s own interaction and experience of working with PwC, the Committee considers that the 2016 year-end audit was appropriately planned, scoped and executed. The Committee is satisfied that PwC performed effectively as the external auditor during the year and management’s role in the audit process operated properly and effectively. As this was PwC’s first audit of the Company, the Committee assessed their work up until the end of 2016 and first months of 2017 (covering the time to publication of this Annual Report), rather than the full year-end process, including the audit of the Company’s subsidiaries. However, the period assessed provided the Committee with early insight of the challenge, scrutiny and approach of PwC. As usual, a full de-brief of the 2016 year-end audit and PwC’s role in it will be carried out in 2017.
External auditor remuneration and independenceThe Committee considers the remuneration and independence of the external auditor at least on a semi-annual basis and approves its remuneration. The Committee keeps under close review the ratio of audit to non-audit fees to ensure that the independence and objectivity of the external auditor are safeguarded. The Policy for Approval of Non-Audit Services was refreshed during the year to take into account legislative changes on audit committees and to reflect the Revised Ethical Standards 2016 for auditors. The Policy recognises that there are certain circumstances where (i) PwC will not be used in any circumstances; (ii) PwC may be used, subject to the approval of the Chief Financial Officer; and (iii) PwC may be used, subject to the approval of the Audit Committee.
In 2016, fees for audit and related assurance services, excluding joint ventures, amounted to £730,000 and the non-audit fees amounted to £40,000. This supports the Committee’s conclusion that PwC remains independent and objective, and that the level of non-audit to audit fees is not material. Further details of these fees, and fees in respect of the audit of certain of the Group’s joint ventures for which PwC is the auditor, are provided in Note 6(ii) to the financial statements. The three-year average of the non-audit fees as a percentage of the audit fees to the year ended 2016 is 26 per cent. Chart 2 sets out the ratio of audit to non-audit fees for each of the past three years.
The Committee is satisfied that PwC continues to provide appropriate levels of scepticism and challenge, and remained independent. PwC has provided written confirmation of its independence to the Committee.
Chart 2: Audit and non-audit fees paid to Deloitte LLP and PricewaterhouseCoopers LLP
2016 Paid to
PwC
2015 Paid to
Deloitte
2014 Paid to
Deloitte
Audit fees including related assurance services (£m) 0.73 0.71 0.65
Non-audit fees (£m) 0.04 0.22 0.28
Ratio of non-audit fees to audit fees (%) 5 31 43
The above table excludes fees paid to either Deloitte LLP or PwC in respect of joint ventures. If these were included, the 2016 ratio of audit to non-audit fees would have been 6 per cent.

83Overview Strategic Report Financial Statements
Governance
Internal audit The Company has a strong culture of risk awareness embedded in decision making and robust processes that support the identification and management of risk. Assurance of the risk management processes, testing of internal controls and approving the internal audit programme continued therefore to be priorities for the Committee in 2016.
In order to determine the internal audit programme, as in previous years, the Group Finance Director, the Group Financial Controller, the Head of Business Information Systems, Procurement and Risk and the Director of Finance reviewed the Group Risk Register to identify the key risks facing the Group. Topics selected for internal audit were based on this review, having taken into account those key risks which had not been subject to recent audit. The proposed internal audit programme was discussed and agreed with KPMG ahead of it being considered and subsequently approved by the Committee.
The Committee believes that both the process for determining the internal audit programme, and the programme itself, are appropriate and effective, particularly since there is scope for the Company to react to events, new information and situations which come to light during the year and include them if necessary.
During the year, internal audits were carried out on:
° procurement policies and procedures;
° compliance with the external communications policy and procedures;
° governance of the Company’s UK joint venture;
° payroll processes and procedures;
° accounts receivables policies relating to debtors, bad debt policies and payment plans, cash collection and credit control processes;
° the controls in place within the IT environment of the insurance captive;
° business continuity planning and disaster recovery;
° sales and invoicing processes to ensure that key risks associated with the sales and invoicing were appropriately controlled;
° developments (new sites and refurbishments) policies and procedures;
° the leasing governance framework and the processes and procedures in place in relation to leasing;
° employee expenses claims procedures specifically for senior staff; and
° a review of the integration and controls of Vailog, the Italian trader-developer which was acquired in 2015.
Each of these audits confirmed that these areas were appropriately controlled, although some enhancements were identified which were entered into the schedule which lists control points which require improvement actions (see internal control framework on page 81).
Once each internal audit is complete, a questionnaire is issued by KPMG to the process owner about their internal audit as well as to the other relevant employees, to ensure that real-time feedback is collected on the quality and effectiveness of its audit. The results of this feedback are provided to the Committee along with detailed findings and recommendations of the internal audits themselves. KPMG also attends the relevant Committee meeting to present its report.
The Committee believes that the value of internal audit is enhanced by having a third party perform this function, as this supports the independent challenge of management and gives greater access to expertise than an internal function could provide. KPMG has performed the role since its appointment in 2007. In 2016, new internal auditors were introduced to the Company by KPMG. To enable them to familiarise themselves with the Company, the Committee decided not to tender for internal audit services following the expiry of KPMG’s latest three-year term for the 2017 financial year but to reappoint KPMG for a further one-year term.
In 2017, the Committee will continue to follow a risk-based approach to internal audit. Items scheduled for review include: the acquisitions and disposals process; IT controls, including network, security, support and cyber security; governance of the SELP joint venture; the Company’s REIT status; the processes behind the valuation of the Group’s portfolio; accounts payable systems including an assessment of the new software introduced in 2015; property and professional indemnity insurance; insurance captive (which is required to be audited annually); the processes by which the information collated in the Property Analysis report is collected; and financial planning.

84SEGRO Annual Report and Accounts 2016
PwC IntegrationEnsuring that lead audit partner, Craig Hughes, and his team from PwC settled in quickly and became familiar with the Company’s business and practices was something that I and my colleagues on the Committee, felt important to be achieved as soon as possible in 2016. PwC shadowed the work of Deloitte during the last audit at the start of this year in both the UK and Continental Europe, and attended the February 2016 Committee meeting. The Company also provided a number of opportunities for PwC to meet key employees in the UK and Continental Europe as part of the transition at the start of 2016.
Since being appointed to carry out the 2016 year-end audit, members of the PwC team have held regular calls with the Director of Finance and Group Financial Controller to increase their familiarity and depth of knowledge about the Group. They continued to hold meetings with members of the Board, Executive Committee, Heads of Business Units as well as other key teams throughout the Group including Business Information Systems, Operations, Group Legal and Secretariat, Finance and Tax.
Throughout the year, PwC have spent time with (amongst others):
° the Finance Director for Thames Valley and National Logistics, to discuss the Roxhill transaction and treatment of land options;
° the General Counsel and Group Company Secretary to understand the Group’s policies towards anti-bribery, corruption and fraud; and
° the Head of Business Information Systems, Procurement and Risk to consider the Group’s policies on information technology including cyber security.
PwC’s local teams have also spent time with the Finance Directors for Southern Europe, Northern Europe, Central Europe and the SELP joint venture, as well as meeting their teams to better understand the key issues facing the Group throughout Continental Europe.
They have attended four Committee meetings, reviewed key documents and papers and had regular communication with the finance team to monitor the audit plan throughout the year.
Since PwC did not perform the preceding audit, a fuller review was carried out at the half year than would normally be expected, to flush out any matters or queries ahead of the full-year audit. Furthermore, detailed controls testing was undertaken when the internal controls were reviewed by PwC, supported by discussions with the internal auditor, KPMG. PwC was able to develop a close relationship with KPMG which provided more insight into the internal controls in place.
PwC has also spent time with CBRE, the Group’s valuer, to gain additional assurance around the valuation process in order to satisfy themselves that it was appropriately performed. PwC used their real estate specialist chartered surveyor team to aid their work in this area. They were also able to take advantage of the common IT environment, processes and controls for rental income used by the Group across its portfolio and joint ventures, so that they could use computer assisted audit techniques to perform substantive procedures to cover all rental income across the whole Group increasing efficiencies in the audit.
In addition, PwC and the Group’s finance teams keep in regular contact to ensure that any questions on accounting treatment and significant judgements are agreed and dealt with as soon as possible.
I am pleased with the fresh insight, wide experience and different approach brought to the audit by PwC and look forward to working with them over the coming years.
Doug Webb Chairman of the Audit Committee

85Overview Strategic Report Financial Statements
Governance
Remuneration Committee Report
We value our engagement with shareholders and appreciate their support and their input in reviewing our Remuneration Policy.
Baroness Ford Chairman of the Remuneration Committee
On behalf of the Board, I am pleased to present to you the Directors’ Remuneration Report for 2016 which was an excellent year in terms of performance of the Group. This introduction covers Remuneration Policy (the Policy), a summary of our financial performance and proposed changes to the Policy subject to shareholder approval at the 2017 AGM. By way of background to the Committee’s work, in setting the Policy, it has designed and maintained an established, sustainable and long-term structure:
° which is straightforward to understand;
° where the principles are applied consistently;
° where reward reflects performance;
° which is transparent to both executives and shareholders; and
° which is aligned with the long-term success of the business.
The Policy is founded upon total property return (TPR) and total shareholder return (TSR), with long- and short-term performance targets being focused on the drivers of these two measures.
The involvement of my colleagues on the Committee together with the engagement of our key stakeholders have been invaluable during the year.
Company performance and the impact for remunerationIn 2016, we again delivered a strong year of operating and capital performance. The quality of the Company’s portfolio, operating metrics and gearing have all improved as explained in the Strategic Report on page 8.
Against the backdrop of these strong results, the Committee has approved (subject to the final TPR data being available) the following performance related payments to the Executive Directors this year:
° The Bonus payments will be 99.2 per cent of their maximum award (see page 88); and
° The 2013 LTIP award will pay out 100 per cent (see page 94).
Areas of focus 2016 ° approval of the Executive Directors’ annual salary increases, Bonus payments and LTIP awards;
° reviewing shareholder feedback following the AGM and emerging trends in corporate governance;
° agreeing the annual salary and benefits for the new Chief Financial Officer; and
° review of Remuneration Policy and consultation with shareholders on proposed refinements.
Areas of focus 2017 ° approval of the Executive Directors’ annual salary increases, Bonus payments and LTIP awards;
° reviewing shareholder feedback following the AGM, in particular in respect of the Remuneration Policy; and
° emerging trends in corporate governance.
Attendance at Committee meetingsMargaret Ford (Chairman) 6/6
Christopher Fisher 6/6
Martin Moore 6/6
Mark Robertshaw 6/6
Total 6
86SEGRO Annual Report and Accounts 2016
Governance
Remuneration Committee Report continued…
In keeping with the Policy, 2017 base salary increases for Executive Directors are in line with (and not exceeding) the average increases for employees across the Group.
The Board has also recommended an increase in the dividend.
Proposed changes to the PolicyThe current Policy which was approved in 2014 has served us well and the Committee does not believe there is any need for major structural changes to how it operates.
However, the Committee is aware of developments in shareholders thinking around the time horizon of long-term incentive schemes, including the use of compulsory holding periods post-vesting. As I explained last year, the Committee continued to review the Policy around this theme to ensure that it remains appropriate for our business. We asked Deloitte LLP to review the current Policy given these developments, rather than Kepler Associates who usually advises the Committee, as we wished to have another independent view.
As part of the review, we consulted with institutional shareholders holding in excess of 50 per cent of the Company’s share capital along with the Investment Association (IA) and Institutional Shareholder Services (ISS) – investment advisory bodies in the UK. We asked them for their feedback and thoughts on two proposals and for comments on other aspects of the current Policy.
I would like to thank the shareholders, the IA and ISS for their feedback which was extremely helpful. We received many comments from a large proportion of our shareholders and I was pleased that the majority of them were supportive of the two main proposed changes to the Policy. These are:
° to extend the Long Term Incentive Plan (LTIP) time horizon from four to five years. We would reduce the performance period back to three years but, at the same time, introduce a mandatory two-year holding period after vesting. Shareholders may recall that in 2011, we presented a revised business strategy to reshape our portfolio. At that time, a four-year LTIP was introduced which the Committee believed was an appropriate timeframe to support the execution of the strategy. Now that the transformation of the portfolio is largely complete, and we are operating in a more normalised environment, we believe that reverting to a performance period of three years, whilst at the same time introducing a mandatory two-year holding
period, is appropriate. It will strengthen our ability to attract, retain and motivate individuals from the relevant talent market (many of whom are accustomed to three-year LTIPs elsewhere) as well as provide further alignment with shareholder interests; and
° to increase the maximum Bonus opportunity from 120 per cent to 150 per cent of salary for Executive Directors. We are not proposing any change for the Chief Executive. The Deloitte review identified that we were unusual in operating a lower annual bonus opportunity for the Executive Directors than for the Chief Executive. 50 per cent of any bonus earned will continue to be deferred into shares under the Deferred Share Bonus Plan and will vest, subject to continued employment, after three years.
In addition, as part of the feedback we received during consultation, some shareholders expressed a desire to see a reduction in the Chief Executive’s cash payment in lieu of pension contribution over time. Having considered this feedback, the Committee proposes revising the Policy for a future Chief Executive to reduce the limit for Company pension contributions to our defined contribution Group Personal Pension or cash in lieu of pension from 30 per cent to 20 per cent of salary.
Otherwise, the principles of our Policy have not changed. The Policy outlined on pages 98 to 102 of this Report reflects these proposed changes and is subject to approval at the 2017 AGM. I believe that the proposed changes to our Policy will continue to align our remuneration strategy with the long-term financial goals and the best interests of the Company, and shareholder returns. The Policy has the support of the Committee and the Board as a whole and I therefore recommend that shareholders support the changes.
Board changes and remunerationDuring the year, Justin Read announced his retirement from the Board at the end of 2016. As he was retiring from full-time executive employment, the Committee considered the circumstances and granted him ‘good leaver’ status in relation to his awards under the Company’s incentive schemes and Bonus. Further details are provided on page 96.
Soumen Das joined the Company as Chief Financial Officer on 16 January 2017. When the Committee considered his total remuneration package we were mindful that some elements of his variable pay with this previous employer were higher than those paid under our Policy.
The Committee recognised that he was an exceptional candidate and sought to balance a package that would be within the terms of our Policy as well as a sufficient incentive for Mr Das to join the Company.
His salary on joining us was £460,000, which represented a modest increase to his previous base salary (2 per cent). His next salary review will be April 2018. In line with our Policy, Mr Das will receive a cash allowance in lieu of pension of 20 per cent of salary and annual bonus opportunity of 120 per cent of salary, both of which are lower than his previous employer.
His 2017 LTIP award, for this year only, will be 300 per cent of salary and this enhanced award is to partially compensate him for the lower LTIP opportunity at SEGRO. Going forward, this LTIP opportunity will reduce to our normal level of 200 per cent of salary. As mentioned above, we are seeking shareholder approval to increase the Bonus opportunity to 150 per cent of salary, which, if approved will apply to Mr Das in line with the other Executive Directors.
Finally, to compensate Mr Das for the awards he forfeited upon leaving his last role, he will receive a buy-out award comprising a combination of cash (for bonus forfeited in 2016 only; 50 per cent of which will be deferred into SEGRO shares for 3 years) and shares. Further details are provided on page 96.
I am confident that the remuneration structure agreed is fair and the buying out of his incentive package from his previous employer is in line with our Policy on recruitment in providing fair value for his forfeited remuneration. The Committee believes that we have provided a total package which is both reasonable and balanced in order to attract the right candidate for the role.
Finally, we value our engagement with shareholders and appreciate their support and their input in reviewing our Remuneration Policy. As Senior Independent Director and Chairman of the Remuneration Committee, I am committed to ensuring that there is always an open dialogue with our shareholders.
If you have any questions about remuneration generally, or the contents of this Report, do please contact me at [email protected]. I will be attending the AGM and should be pleased to answer any questions which you may have about the Committee’s work or indeed the proposed changes to Policy.
Baroness FordChairman of the Remuneration Committee
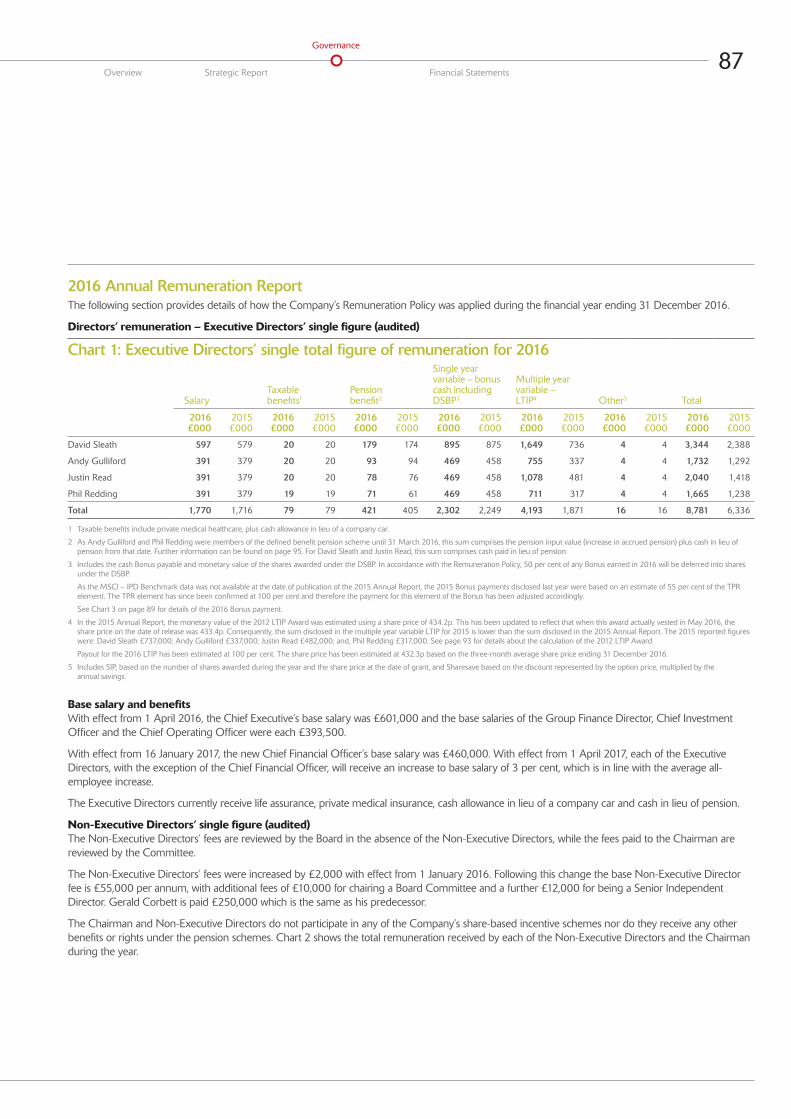
87Overview Strategic Report Financial Statements
Governance
2016 Annual Remuneration ReportThe following section provides details of how the Company’s Remuneration Policy was applied during the financial year ending 31 December 2016.
Directors’ remuneration – Executive Directors’ single figure (audited)
Chart 1: Executive Directors’ single total figure of remuneration for 2016
Salary Taxable benefits1
Pension benefit2
Single year variable – bonus cash including
DSBP3
Multiple year variable – LTIP4 Other5 Total
2016 £000
2015 £000
2016 £000
2015 £000
2016 £000
2015 £000
2016 £000
2015 £000
2016 £000
2015 £000
2016 £000
2015 £000
2016 £000
2015 £000
David Sleath 597 579 20 20 179 174 895 875 1,649 736 4 4 3,344 2,388
Andy Gulliford 391 379 20 20 93 94 469 458 755 337 4 4 1,732 1,292
Justin Read 391 379 20 20 78 76 469 458 1,078 481 4 4 2,040 1,418
Phil Redding 391 379 19 19 71 61 469 458 711 317 4 4 1,665 1,238
Total 1,770 1,716 79 79 421 405 2,302 2,249 4,193 1,871 16 16 8,781 6,336
1 Taxable benefits include private medical healthcare, plus cash allowance in lieu of a company car.
2 As Andy Gulliford and Phil Redding were members of the defined benefit pension scheme until 31 March 2016, this sum comprises the pension input value (increase in accrued pension) plus cash in lieu of pension from that date. Further information can be found on page 95. For David Sleath and Justin Read, this sum comprises cash paid in lieu of pension.
3 Includes the cash Bonus payable and monetary value of the shares awarded under the DSBP. In accordance with the Remuneration Policy, 50 per cent of any Bonus earned in 2016 will be deferred into shares under the DSBP.
As the MSCI – IPD Benchmark data was not available at the date of publication of the 2015 Annual Report, the 2015 Bonus payments disclosed last year were based on an estimate of 55 per cent of the TPR element. The TPR element has since been confirmed at 100 per cent and therefore the payment for this element of the Bonus has been adjusted accordingly.
See Chart 3 on page 89 for details of the 2016 Bonus payment.
4 In the 2015 Annual Report, the monetary value of the 2012 LTIP Award was estimated using a share price of 434.2p. This has been updated to reflect that when this award actually vested in May 2016, the share price on the date of release was 433.4p. Consequently, the sum disclosed in the multiple year variable LTIP for 2015 is lower than the sum disclosed in the 2015 Annual Report. The 2015 reported figures were: David Sleath £737,000; Andy Gulliford £337,000; Justin Read £482,000; and, Phil Redding £317,000. See page 93 for details about the calculation of the 2012 LTIP Award.
Payout for the 2016 LTIP has been estimated at 100 per cent. The share price has been estimated at 432.3p based on the three-month average share price ending 31 December 2016.
5 Includes SIP, based on the number of shares awarded during the year and the share price at the date of grant, and Sharesave based on the discount represented by the option price, multiplied by the annual savings.
Base salary and benefitsWith effect from 1 April 2016, the Chief Executive’s base salary was £601,000 and the base salaries of the Group Finance Director, Chief Investment Officer and the Chief Operating Officer were each £393,500.
With effect from 16 January 2017, the new Chief Financial Officer’s base salary was £460,000. With effect from 1 April 2017, each of the Executive Directors, with the exception of the Chief Financial Officer, will receive an increase to base salary of 3 per cent, which is in line with the average all- employee increase.
The Executive Directors currently receive life assurance, private medical insurance, cash allowance in lieu of a company car and cash in lieu of pension.
Non-Executive Directors’ single figure (audited)The Non-Executive Directors’ fees are reviewed by the Board in the absence of the Non-Executive Directors, while the fees paid to the Chairman are reviewed by the Committee.
The Non-Executive Directors’ fees were increased by £2,000 with effect from 1 January 2016. Following this change the base Non-Executive Director fee is £55,000 per annum, with additional fees of £10,000 for chairing a Board Committee and a further £12,000 for being a Senior Independent Director. Gerald Corbett is paid £250,000 which is the same as his predecessor.
The Chairman and Non-Executive Directors do not participate in any of the Company’s share-based incentive schemes nor do they receive any other benefits or rights under the pension schemes. Chart 2 shows the total remuneration received by each of the Non-Executive Directors and the Chairman during the year.

88SEGRO Annual Report and Accounts 2016
Governance
Remuneration Committee Report continued…
Chart 2: Independent Non-Executive Directors’ single total figure of remuneration for 2016Total fees
2016 £000
2015 £000
Nigel Rich1 Chairman (until 22 April 2016) 78 250
Gerald Corbett2 Chairman (from 22 April 2016) 180 –
Christopher Fisher 55 53
Margaret Ford Senior Independent Director, Chairman of the Remuneration Committee 77 75
Martin Moore 55 53
Mark Robertshaw 55 53
Doug Webb Chairman of the Audit Committee 65 63
1 Nigel Rich retired as Chairman on 22 April 2016.
2 Gerald Corbett was appointed a Director on 1 March 2016. He became Chairman on 22 April 2016.
Bonus payment 2016 For the Executive Directors, the 2016 Bonus comprised three equally weighted components: EPRA Profit Before Tax (PBT); rent roll growth (RRG); and relative TPR.
° Profit – EPRA PBT against target
For this element, a Bonus is earned for EPRA PBT performance against target. 50 per cent is earned on achieving the threshold target (£142.1 million for 2016), rising to 100 per cent for achieving the maximum target (£152.8 million for 2016). 97.7 per cent of this element was achieved in 2016, with EPRA PBT performance for bonus purposes of £152.3 million achieved.
° Rent roll growth (RRG) against target
For this element, a Bonus is earned if the rent roll growth from the existing standing stock is positive (the threshold). Once the threshold is achieved, the Bonus is determined based on total RRG (existing standing stock plus the impact of development RRG), with a sliding pay-out scale rising from 0 per cent for flat total RRG through to 100 per cent for achieving the maximum increase (£20.4 million in 2016). In 2016, RRG from standing stock was positive, thus ensuring the threshold was achieved. Total RRG including the contribution from developments was £26.9 million for Bonus purposes and, accordingly, 100 per cent of this element was achieved.
° TPR – Relative TPR against the MSCI – IPD Benchmark
For this element, 25 per cent is earned when the Company’s TPR (for the UK and Continental Europe) equals the TPR of a comparable MSCI-IPD Benchmark, as calculated by MSCI Real Estate, rising on a straight line basis to 100 per cent when the Company’s TPR exceeds the MSCI-IPD Benchmark by 1.5 per cent.
TPR performance for the Company’s assets for bonus purposes in 2016 was 10.1 per cent, being 10.6 per cent for the UK and 9.0 per cent for Continental Europe. The MSCI-IPD Benchmark was only available at the date of this Report for the Company’s UK assets. This UK Benchmark (The MSCI-IPD Quarterly UK All Industrial Benchmark) was 7.4 per cent in 2016.
On the basis of the TPR of the Company’s UK assets against Benchmark as noted above, and for the purposes of this Report, the Committee has estimated that 100 per cent of the overall TPR will be achieved for 2016 Bonus payments. This element of the Bonus will not be paid until the MSCI-IPD benchmark data for Continental Europe is available. Please note that the TPR figures (both actual and Benchmark) stated above are different to those stated in the KPls on page 20 because the MSCI-IPD benchmark for remuneration payments is based on a TPR with UK/European all industrial benchmarks weighted to reflect the approximate geographical mix of the Group’s portfolio, unlike the KPI equivalent which is based on to the MSCI-IPD Quarterly UK All Industrial standing assets benchmark and similarly the Company’s TPR in the KPI section is the Company’s standing assets.
Bonus targets for EPRA PBT and RRG are set at the start of the year using the prevailing exchange rate at the time and are adjusted to reflect changes in the business such as acquisitions and disposals. The EPRA PBT and RRG outturns which have been used to compare to the 2016 targets were calculated using a consistent exchange rate to that used when the target was set and also include adjustments for specific items in accordance with the Bonus scheme rules as approved by the Committee.
The EPRA PBT and RRG element of the 2016 Bonus will be paid in April 2017, less a 50 per cent deduction for the DSBP. Payment of the TPR element will be deferred until summer 2017, when the pan-European MSCI–IPD data becomes available. Accordingly, the actual payment made under the TPR element of the 2016 Bonus, together with the deferral under the DSBP, may differ from the amount disclosed in this Report. The DSBP award will be made once the final Bonus figures can be calculated. The vesting of the 2016 DSBP will be in April 2020, the third anniversary of the payment of the profit and RRG element of the 2016 Bonus. Any payments under the 2017 Bonus and the DSBP will be made in accordance with the updated Remuneration Policy subject to shareholder approval at the 2017 AGM.
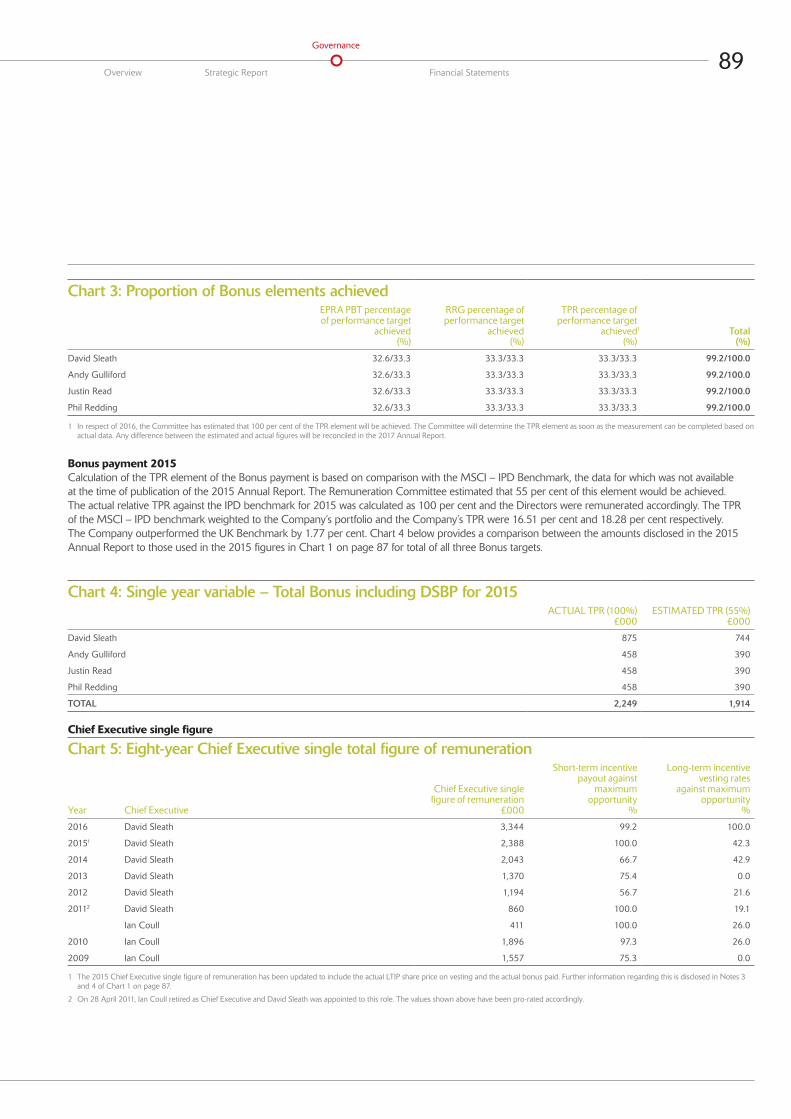
89Overview Strategic Report Financial Statements
Governance
Chart 3: Proportion of Bonus elements achievedEPRA PBT percentage of performance target
achieved (%)
RRG percentage of performance target
achieved (%)
TPR percentage of performance target
achieved1
(%)Total
(%)
David Sleath 32.6/33.3 33.3/33.3 33.3/33.3 99.2/100.0
Andy Gulliford 32.6/33.3 33.3/33.3 33.3/33.3 99.2/100.0
Justin Read 32.6/33.3 33.3/33.3 33.3/33.3 99.2/100.0
Phil Redding 32.6/33.3 33.3/33.3 33.3/33.3 99.2/100.0
1 In respect of 2016, the Committee has estimated that 100 per cent of the TPR element will be achieved. The Committee will determine the TPR element as soon as the measurement can be completed based on actual data. Any difference between the estimated and actual figures will be reconciled in the 2017 Annual Report.
Bonus payment 2015Calculation of the TPR element of the Bonus payment is based on comparison with the MSCI – IPD Benchmark, the data for which was not available at the time of publication of the 2015 Annual Report. The Remuneration Committee estimated that 55 per cent of this element would be achieved. The actual relative TPR against the IPD benchmark for 2015 was calculated as 100 per cent and the Directors were remunerated accordingly. The TPR of the MSCI – IPD benchmark weighted to the Company’s portfolio and the Company’s TPR were 16.51 per cent and 18.28 per cent respectively. The Company outperformed the UK Benchmark by 1.77 per cent. Chart 4 below provides a comparison between the amounts disclosed in the 2015 Annual Report to those used in the 2015 figures in Chart 1 on page 87 for total of all three Bonus targets.
Chart 4: Single year variable – Total Bonus including DSBP for 2015 ACTUAL TPR (100%)
£000ESTIMATED TPR (55%)
£000
David Sleath 875 744
Andy Gulliford 458 390
Justin Read 458 390
Phil Redding 458 390
TOTAL 2,249 1,914
Chief Executive single figure
Chart 5: Eight-year Chief Executive single total figure of remuneration
Year Chief Executive
Chief Executive single figure of remuneration
£000
Short-term incentive payout against
maximum opportunity
%
Long-term incentive vesting rates
against maximum opportunity
%
2016 David Sleath 3,344 99.2 100.0
20151 David Sleath 2,388 100.0 42.3
2014 David Sleath 2,043 66.7 42.9
2013 David Sleath 1,370 75.4 0.0
2012 David Sleath 1,194 56.7 21.6
20112 David Sleath 860 100.0 19.1
Ian Coull 411 100.0 26.0
2010 Ian Coull 1,896 97.3 26.0
2009 Ian Coull 1,557 75.3 0.0
1 The 2015 Chief Executive single figure of remuneration has been updated to include the actual LTIP share price on vesting and the actual bonus paid. Further information regarding this is disclosed in Notes 3 and 4 of Chart 1 on page 87.
2 On 28 April 2011, Ian Coull retired as Chief Executive and David Sleath was appointed to this role. The values shown above have been pro-rated accordingly.

90SEGRO Annual Report and Accounts 2016
Governance
Remuneration Committee Report continued…
Chart 7: Percentage increase in Chief Executive remuneration compared to the average per employeeChief
ExecutiveAverage per
employee1
2016 £000
2015 £000
Increase %
2016 £000
2015 £000
Increase %
Salary received during year 597 579 3 82 80 3
Taxable benefits received during year 20 20 0 5 5 0
Annual variable pay received during year (Bonus and DSBP) 895 8752 2 35 34 3
Total 1,512 1,474 3 122 119 3
1 Comparable data based on UK employees which represents approximately 56 per cent of the workforce.
2 The 2015 Bonus payment was based on an estimate of 55 per cent of the TPR element. The TPR element has since been confirmed at 100 per cent and therefore the payment for this element has been updated accordingly. See Chart 4.
Chart 8: Relative importance of spend on pay
Year
Total dividend paid (£m)
Total employee expenditure
(£m)
2016 (2015 final and 2016 interim) 118.5 32.9
2015 (2014 final and 2015 interim) 113.1 28.8
JAN2009
DEC2010
DEC2009
200
150
100
50
250
300
400
350
SEGRO
DEC2011
DEC2012
DEC2013
DEC2014
DEC2016
DEC2015
FTSE 100 FTSE 250 FTSE 350 REITs
JAN2011
200
150
100
50
250
300
400
350
SEGRO
DEC2012
DEC2013
DEC2014
DEC2016
DEC2015
FTSE 100 FTSE 250 FTSE 350 REITs
Chart 6i: Eight-year TSR chart Chart 6ii: Five-year TSR chart
Chart 6: TSR chartsChart 6i shows TSR for the Company over the last eight financial years compared with the FTSE 350 Real Estate Investment Trusts, FTSE 100 Index and the FTSE 250 Index. The Committee has determined that these indices provide useful comparators as the Company, or its peers, are constituents of them. Chart 6ii shows TSR for the Company over the last five financial years since it began its portfolio restructuring in 2011, compared with the same benchmarks as Chart 6i.
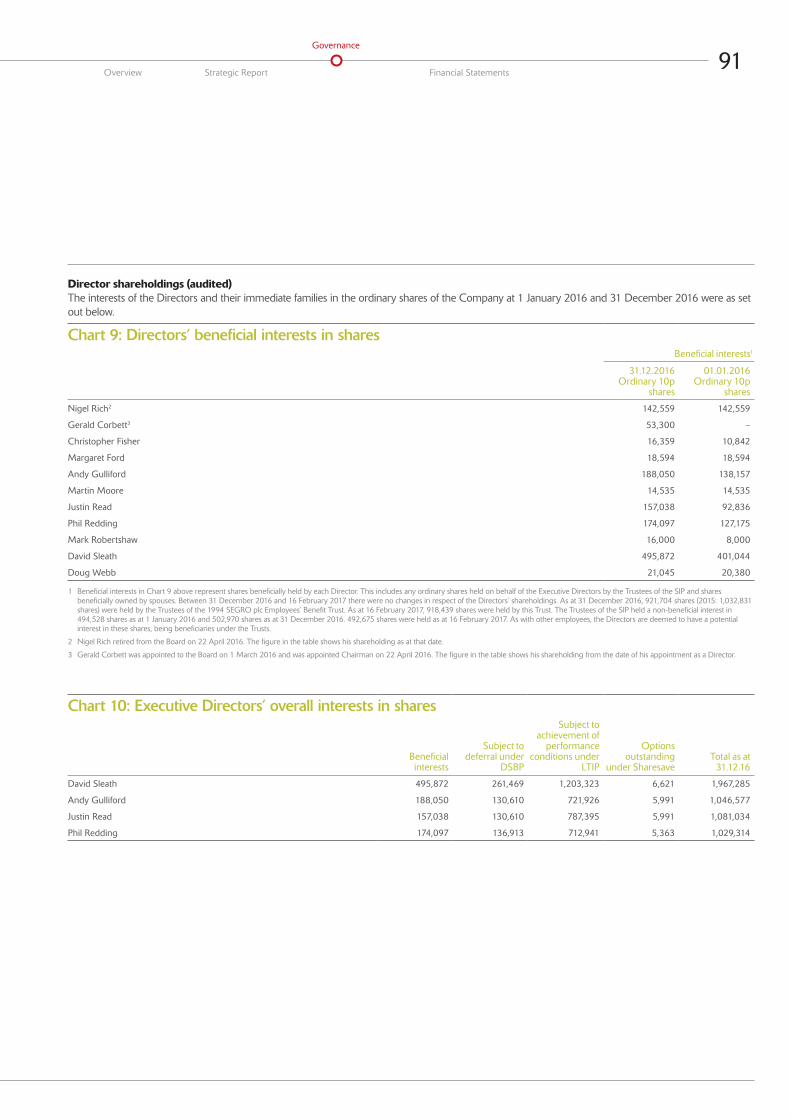
91Overview Strategic Report Financial Statements
Governance
Director shareholdings (audited)The interests of the Directors and their immediate families in the ordinary shares of the Company at 1 January 2016 and 31 December 2016 were as set out below.
Chart 9: Directors’ beneficial interests in sharesBeneficial interests1
31.12.2016 Ordinary 10p
shares
01.01.2016 Ordinary 10p
shares
Nigel Rich2 142,559 142,559
Gerald Corbett3 53,300 –
Christopher Fisher 16,359 10,842
Margaret Ford 18,594 18,594
Andy Gulliford 188,050 138,157
Martin Moore 14,535 14,535
Justin Read 157,038 92,836
Phil Redding 174,097 127,175
Mark Robertshaw 16,000 8,000
David Sleath 495,872 401,044
Doug Webb 21,045 20,380
1 Beneficial interests in Chart 9 above represent shares beneficially held by each Director. This includes any ordinary shares held on behalf of the Executive Directors by the Trustees of the SIP and shares beneficially owned by spouses. Between 31 December 2016 and 16 February 2017 there were no changes in respect of the Directors’ shareholdings. As at 31 December 2016, 921,704 shares (2015: 1,032,831 shares) were held by the Trustees of the 1994 SEGRO plc Employees’ Benefit Trust. As at 16 February 2017, 918,439 shares were held by this Trust. The Trustees of the SIP held a non-beneficial interest in 494,528 shares as at 1 January 2016 and 502,970 shares as at 31 December 2016. 492,675 shares were held as at 16 February 2017. As with other employees, the Directors are deemed to have a potential interest in these shares, being beneficiaries under the Trusts.
2 Nigel Rich retired from the Board on 22 April 2016. The figure in the table shows his shareholding as at that date.
3 Gerald Corbett was appointed to the Board on 1 March 2016 and was appointed Chairman on 22 April 2016. The figure in the table shows his shareholding from the date of his appointment as a Director.
Chart 10: Executive Directors’ overall interests in shares
Beneficial interests
Subject to deferral under
DSBP
Subject to achievement of
performance conditions under
LTIP
Options outstanding
under SharesaveTotal as at 31.12.16
David Sleath 495,872 261,469 1,203,323 6,621 1,967,285
Andy Gulliford 188,050 130,610 721,926 5,991 1,046,577
Justin Read 157,038 130,610 787,395 5,991 1,081,034
Phil Redding 174,097 136,913 712,941 5,363 1,029,314
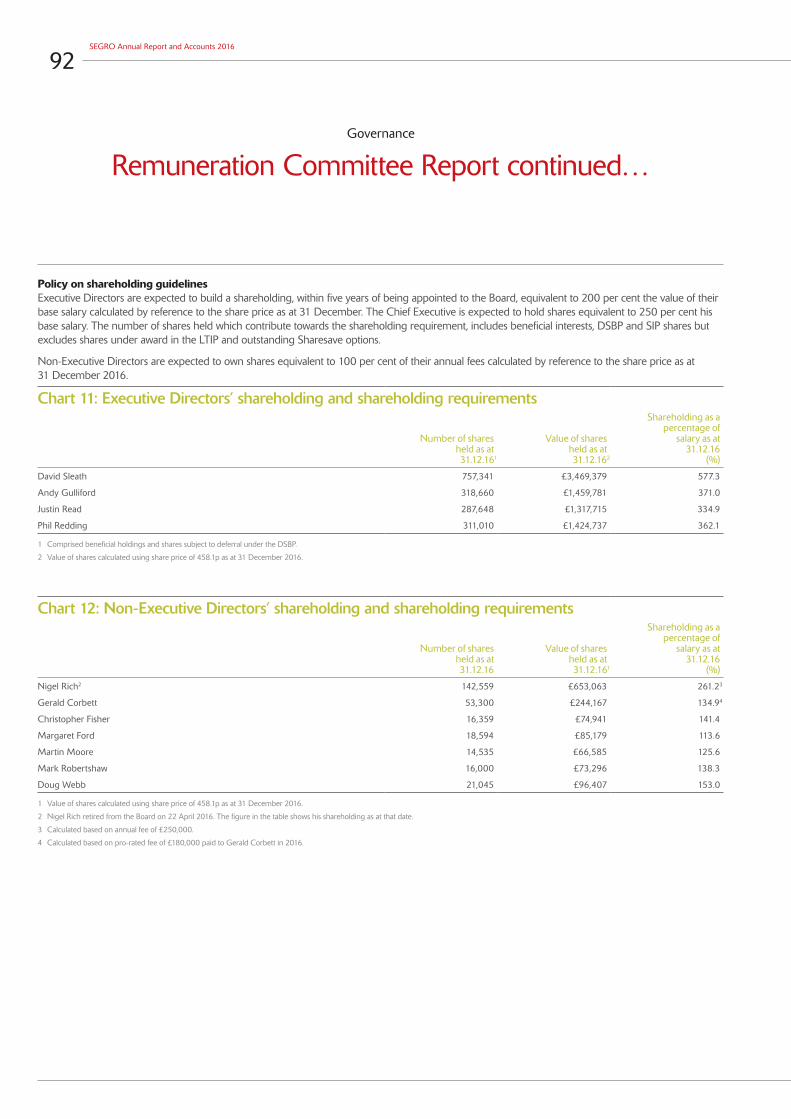
92SEGRO Annual Report and Accounts 2016
Governance
Remuneration Committee Report continued…
Policy on shareholding guidelinesExecutive Directors are expected to build a shareholding, within five years of being appointed to the Board, equivalent to 200 per cent the value of their base salary calculated by reference to the share price as at 31 December. The Chief Executive is expected to hold shares equivalent to 250 per cent his base salary. The number of shares held which contribute towards the shareholding requirement, includes beneficial interests, DSBP and SIP shares but excludes shares under award in the LTIP and outstanding Sharesave options.
Non-Executive Directors are expected to own shares equivalent to 100 per cent of their annual fees calculated by reference to the share price as at 31 December 2016.
Chart 11: Executive Directors’ shareholding and shareholding requirements
Number of shares held as at 31.12.161
Value of shares held as at 31.12.162
Shareholding as a percentage of
salary as at 31.12.16
(%)
David Sleath 757,341 £3,469,379 577.3
Andy Gulliford 318,660 £1,459,781 371.0
Justin Read 287,648 £1,317,715 334.9
Phil Redding 311,010 £1,424,737 362.1
1 Comprised beneficial holdings and shares subject to deferral under the DSBP.
2 Value of shares calculated using share price of 458.1p as at 31 December 2016.
Chart 12: Non-Executive Directors’ shareholding and shareholding requirements
Number of shares held as at 31.12.16
Value of shares held as at 31.12.161
Shareholding as a percentage of
salary as at 31.12.16
(%)
Nigel Rich2 142,559 £653,063 261.23
Gerald Corbett 53,300 £244,167 134.94
Christopher Fisher 16,359 £74,941 141.4
Margaret Ford 18,594 £85,179 113.6
Martin Moore 14,535 £66,585 125.6
Mark Robertshaw 16,000 £73,296 138.3
Doug Webb 21,045 £96,407 153.0
1 Value of shares calculated using share price of 458.1p as at 31 December 2016.
2 Nigel Rich retired from the Board on 22 April 2016. The figure in the table shows his shareholding as at that date.
3 Calculated based on annual fee of £250,000.
4 Calculated based on pro-rated fee of £180,000 paid to Gerald Corbett in 2016.

93Overview Strategic Report Financial Statements
Governance
Executive Director share scheme holdings (audited)DSBPThe DSBP was implemented for the 2010 Bonus payment onwards for the Executive Directors and certain other members of the Leadership Team. For the 2010, 2011 and 2012 Bonus, 25 per cent of any payment was deferred into shares. After 2013, the deferral percentage is 50 per cent for Executive Directors. The shares held under the DSBP are shown in Chart 13 below. On vesting, a cash sum equivalent to the value of dividends that would have been paid on shares during the three years they were under award may also be paid to participants.
Chart 13: DSBP
Date of grant
No. of shares under award
01.01.16
No. of shares granted
during the year
Share price of shares on grant (pence)1
Face value of award
made in 2016
(£)
No. of shares released
during the year
Share price on date of
release (pence)
No. of shares under award
31.12.16
End of holding period
DAVID SLEATH
2012 DSBP 06.08.13 28,369 311.6 28,369 415.4 – –
2013 DSBP 30.06.14 90,768 342.7 – – 90,768 07.04.17
2014 DSBP 30.06.15 69,424 408.0 – – 69,424 28.04.18
2015 DSBP 26.05.16 – 101,277 432.1 437,618 – – 101,277 28.04.19
TOTAL 188,561 261,469
ANDY GULLIFORD
2012 DSBP 06.08.13 15,457 311.6 15,457 415.4 – –
2013 DSBP 30.06.14 41,226 342.7 – – 41,226 07.04.17
2014 DSBP 30.06.15 36,352 408.0 – – 36,352 28.04.18
2015 DSBP 26.05.16 – 53,032 432.1 229,151 – – 53,032 28.04.19
TOTAL 93,035 130,610
JUSTIN READ
2012 DSBP 06.08.13 15,457 311.6 15,457 415.4 – –
2013 DSBP 30.06.14 41,226 342.7 – – 41,226 07.04.17
2014 DSBP 30.06.15 36,352 408.0 – – 36,352 28.04.18
2015 DSBP 26.05.16 – 53,032 432.1 229,151 – – 53,032 28.04.19
TOTAL 93,035 130,610
PHIL REDDING
2012 DSBP 06.08.13 14,548 311.6 14,548 415.4 – –
2013 DSBP 30.06.14 47,529 342.7 – – 47,529 07.04.17
2014 DSBP 30.06.15 36,352 408.0 – – 36,352 28.04.18
2015 DSBP 26.05.16 – 53,032 432.1 229,151 – – 53,032 28.04.19
TOTAL 98,429 136,913
1 The share price of shares on grant is based on the mid-market quotation price for the day before the award.
LTIPLTIP awards are subject to TSR and TPR performance conditions, which are equally weighted and measured over a four-year performance period.
TSR – this benchmark is based on the weighted mean TSR of other FTSE 350 REITs. 25 per cent of this element vests if the Company’s four-year TSR is in line with benchmark TSR, rising on a straight-line basis to 100 per cent vesting if the benchmark is exceeded by 5 per cent per year.
TPR – this benchmark is based on the MSCI – IPD Benchmark with UK/European industrials weighted to reflect the approximate geographical mix of the Group’s portfolio (75/25 UK/Continental Europe). 25 per cent of this element vests if the Company’s four-year TPR is in line with the MSCI – IPD Benchmark, rising on a straight-line basis to 100 per cent if the MSCI – IPD Benchmark is exceeded by at least 1.5 per cent per year.
On vesting, calculations are reviewed by the auditor and are approved by the Committee. The Committee retains the discretion to withhold vesting of awards should such payments be deemed inappropriate.
The 2012 Award vested on 7 June 2016, subject to the TSR and TPR performance conditions over the four-year performance period to 31 December 2015. The Company’s TSR over the performance period was 137.2 per cent and the benchmarck was 103.0 per cent. The Company’s TSR outperformance of 4.0 per cent per annum compared with the benchmark led to an 84.6 per cent vesting of the TSR element and, as estimated in the 2015 Annual Remuneration Report, the TPR element did not vest. Overall, this resulted in a total payout of 42.3 per cent.

94SEGRO Annual Report and Accounts 2016
Governance
Remuneration Committee Report continued…
The 2013 LTIP award will vest on 6 August 2017, subject to relative TSR and TPR over the four-year performance period to 31 December 2016. The Company’s TSR over the performance period was 117.7 per cent and the benchmark TSR was 40.3 per cent. The Company’s TSR outperformance of 11.6 per cent per annum compared with the benchmark will lead to 100 per cent of the TSR element vesting. For the 2013 LTIP, the full TPR data will not be available until after the date of this Report. For the purposes of the Director’s single figure calculations (Chart 1), the performance for the TPR element has been estimated. The estimated calculation is based on the Company’s actual annualised TPR (for both Continental European and UK assets) between 2013 and 2016 of 14.7 per cent and an estimated MSCI – IPD Benchmark over the same period of 12.9 per cent. On this basis, the Company’s four year TPR to 31 December 2016 has exceeded the estimated MSCI – IPD Benchmark by more than 1.5 per cent per year which would lead to 100 per cent of the TPR element vesting.
The 2013 LTIP will vest in August 2017 by which time the MSCI – IPD Benchmark will be available.
Details of the LTIP awards granted to the Executive Directors are set out in Chart 14. Any awards made under the LTIP in 2017 will be made in accordance with the Remuneration Policy.
Chart 14: LTIP awards outstanding
No. of shares under award
01.01.16
No. of shares over which
awards granted during
the year
Share price of shares on grant (pence)1
Face value of award
made in 2016
(£)
No. of shares lapsed/not
released during
the year
No. of shares released
during the year
Share price on date of
release (pence)
No. of shares under award
31.12.16
End of performance
period over which
performance conditions
have to be met
DAVID SLEATH
01.05.12 352,781 – 221.1 203,555 149,226 433.4 – 31.12.15
06.08.13 333,761 – 311.6 – – – 333,761 31.12.16
09.04.14 324,005 – 339.5 – – – 324,005 31.12.17
22.05.15 268,165 – 422.5 – – – 268,165 31.12.18
07.04.16 – 277,392 420.7 1,166,988 – – – 277,392 31.12.19
TOTAL 1,278,712 1,203,323
ANDY GULLIFORD
01.05.12 161,465 – 221.1 93,166 68,299 433.4 – 31.12.15
06.08.13 152,759 – 311.6 – – – 152,759 31.12.16
09.04.14 212,076 – 339.5 – – – 212,076 31.12.17
22.05.15 175,526 – 422.5 – – – 175,526 31.12.18
07.04.16 – 181,565 420.7 763,844 – – – 181,565 31.12.19
TOTAL 701,826 721,926
JUSTIN READ
01.05.12 230,664 – 221.1 133,094 97,570 433.4 – 31.12.15
06.08.13 218,228 – 311.6 – – – 218,228 31.12.16
09.04.14 212,076 – 339.5 – – – 212,076 31.12.17
22.05.15 175,526 – 422.5 – – – 175,526 31.12.18
07.04.16 – 181,565 420.7 763,844 – – – 181,565 31.12.19
TOTAL 836,494 787,395
PHIL REDDING
01.05.12 151,967 – 221.1 87,685 64,282 433.4 – 31.12.15
06.08.13 143,774 – 311.6 – – – 143,774 31.12.16
09.04.14 212,076 – 339.5 – – – 212,076 31.12.17
22.05.15 175,526 – 422.5 – – – 175,526 31.12.18
07.04.16 – 181,565 420.7 763,844 – – – 181,565 31.12.19
TOTAL 683,343 712,941
1 The share price of shares on grant is based on the mid-market quotation price for the day before the award.
The Committee has the discretion to adjust awards downwards at vesting if it is not satisfied that the outcome is a fair reflection of underlying performance, or in the event of excessive risk-taking or misstatement. No such discretion was exercised in respect of the vesting of the 2012 Award.
Threshold vesting is 25 per cent for LTIP awards.

95Overview Strategic Report Financial Statements
Governance
Sharesave
Chart 15: Sharesave options outstanding
Date of grant
No. of shares under option
01.01.16Options granted during the year
Option price (pence)
Options exercised
during the yearOptions lapsed during the year
No. of shares under option at
31.12.16
Period in which options can be
exercised
DAVID SLEATH
2014 Sharesave 02.05.14 6,621 – 271.84 – – 6,621 01.06.17 – 30.11.17
TOTAL 6,621 6,621
ANDY GULLIFORD
2014 Sharesave 02.05.14 3,310 – 271.84 – – 3,310 01.06.17 – 30.11.17
2015 Sharesave 01.05.15 2,681 335.60 2,681 01.06.18 – 30.11.18
TOTAL 5,991 5,991
JUSTIN READ
2014 Sharesave 02.05.14 3,310 – 271.84 – – 3,310 01.06.17 – 30.11.17
2015 Sharesave 01.05.15 2,681 335.60 – – 2,681 01.06.18 – 30.11.18
TOTAL 5,991 5,991
PHIL REDDING
2015 Sharesave 01.05.15 5,363 335.60 – – 5,363 01.06.18 – 30.11.18
TOTAL 5,363 5,363
1 Between 31 December 2016 and 16 February 2017 there were no changes in these holdings.
SIP
Chart 16: SIP shares held in trustNo. of shares in trust
01.01.16Shares awarded during the year
No. of shares in trust 31.12.16
David Sleath 6,105 704 6,809
Andy Gulliford 6,922 704 7,626
Justin Read 3,987 704 4,691
Phil Redding 6,058 704 6,762
Further information about the share schemes can be found in Note 22 to the financial statements on pages 148 to 150.
Executive Directors’ pension arrangements and other fees
Chart 17: Defined benefit schemePension input amount, net of Directors’ contributions,
in the year ending 31.12.16
£
Defined benefit pension accrued
at 31.12.163 £
David Sleath1 n/a 80
Andy Gulliford4 34 43
Justin Read2 n/a n/a
Phil Redding4 12 58
1 David Sleath left the SEGRO Pension Scheme with effect from 17 April 2011 and receives a cash payment in lieu of contributions.
2 Justin Read has not been a participant in any SEGRO pension scheme and instead received a cash payment in lieu of contributions.
3 Pensions are payable from normal retirement age, which is 62, and can be taken earlier with appropriate reductions.
4 Andy Gulliford and Phil Redding left the SEGRO Pension Scheme with effect from 31 March 2016 and from that date received a cash payment in lieu of pension contributions.
96SEGRO Annual Report and Accounts 2016
Governance
Remuneration Committee Report continued…
Pension entitlement in the event of severanceThere are no contractual arrangements that would guarantee a pension with limited or no abatement on severance or early retirement.
Fees for external non-executive appointmentsSince September 2007, David Sleath has been a Non-Executive Director of Bunzl plc and during the year he received a fee of £99,500 for this role.
Exit payments and arrangementsNo exit payments were made to Directors during the year.
Justin Read retired as Group Finance Director on 31 December 2016.
Justin Read’s remuneration terms upon his retirement are in accordance with the key provisions for contract termination as set out in the Remuneration Policy approved by shareholders in April 2014. As he was retiring from full-time executive employment, the Committee awarded him ‘good leaver’ status under the Company’s incentive schemes. He was paid full salary and benefits (which include cash allowances in lieu of a company car and pension and also private medical healthcare) to 31 December 2016. He will be eligible to receive a cash bonus for 2016 to the extent that the performance targets are met. 50 per cent of any cash payment earned in 2016 will be deferred in shares under the DSBP. He will be entitled to receive shares which have been held under the DSBP. These shares will be released on the vesting date, together with a cash sum equivalent to the value of dividends that would have been paid on the shares during the three year performance period.
He will be entitled to time pro-rata shares from the LTIP, subject to the Company meeting the performance targets for these awards and in accordance with the LTIP rules.
He will be eligible to retain shares awarded under the SIP and to purchase shares in accordance with the rules of Sharesave.
Remuneration Arrangements for Chief Financial OfficerSoumen Das joined the Company as Chief Financial Officer on 16 January 2017. The Committee took professional advice and agreed his remuneration, taking into account the fact that he was an exceptional candidate and moving from an organisation where the package offered more in the way of variable remuneration. He receives a salary of £460,000 p.a. (an increase of 2 per cent from his previous employer) and he will not receive an increase in 2017, standard benefits commensurate with this position, cash allowance in lieu of pension of 20 per cent of salary, annual bonus opportunity up to 120 per cent and a LTIP opportunity for 2017 only of 300 per cent of salary. His LTIP opportunity will reduce to 200 per cent of salary in 2018.
As mentioned earlier in the report, we are seeking shareholder approval to increase the Bonus opportunity to 150 per cent of salary, which, if approved will apply to Soumen Das in line with the other Executive Directors.
In order to recruit Soumen Das it was necessary to buy out his 2016 bonus entitlement and the share awards he forfeited upon leaving his previous employer.
Details of any compensation for the loss of 2016 Bonus entitlement will be determined as soon as is practicable following the publication of his previous employer’s results, would be pro-rated for time, and structured on a like-for-like basis, with 50 per cent in cash and 50 per cent deferred into SEGRO shares, the release of which would be subject to continued employment for three years.
He will receive a buy-out award of shares to compensate him for the share awards he forfeited upon leaving his previous employer, some of which will be subject to performance conditions. In accordance with the Policy, the fair value of these replacement awards in SEGRO shares was based on the fair value of the share awards forfeited. The forfeited share awards comprised restricted shares vesting on dates from September 2016 to April 2019, and performance shares vesting on 1 April 2017, 1 April 2018, 11 March 2019 and 5 April 2019. The fair value of these awards was estimated at £1.2 million in restricted shares and £0.7 million in performance shares.
The replacement awards were structured on a like-for-like basis with 562,442 replacement shares awarded, 286,161 of which are subject to performance conditions, with a similar or longer time horizon. The 286,161 shares are structured identically to the LTIP and include performance conditions based on relative TSR and relative TPR, and vest in 2018, 2019 and 2020. 100 per cent of net shares vesting must be retained until the Company’s shareholding guidelines for share ownership are satisfied.
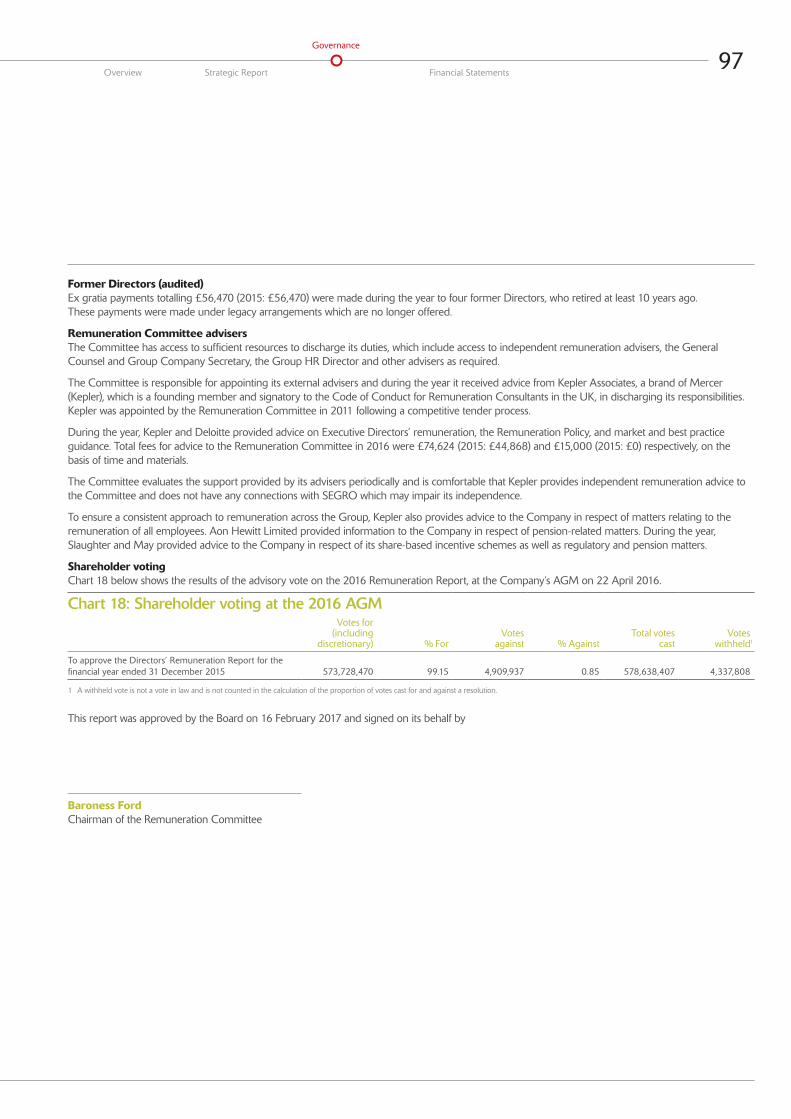
97Overview Strategic Report Financial Statements
Governance
Former Directors (audited)Ex gratia payments totalling £56,470 (2015: £56,470) were made during the year to four former Directors, who retired at least 10 years ago. These payments were made under legacy arrangements which are no longer offered.
Remuneration Committee advisersThe Committee has access to sufficient resources to discharge its duties, which include access to independent remuneration advisers, the General Counsel and Group Company Secretary, the Group HR Director and other advisers as required.
The Committee is responsible for appointing its external advisers and during the year it received advice from Kepler Associates, a brand of Mercer (Kepler), which is a founding member and signatory to the Code of Conduct for Remuneration Consultants in the UK, in discharging its responsibilities. Kepler was appointed by the Remuneration Committee in 2011 following a competitive tender process.
During the year, Kepler and Deloitte provided advice on Executive Directors’ remuneration, the Remuneration Policy, and market and best practice guidance. Total fees for advice to the Remuneration Committee in 2016 were £74,624 (2015: £44,868) and £15,000 (2015: £0) respectively, on the basis of time and materials.
The Committee evaluates the support provided by its advisers periodically and is comfortable that Kepler provides independent remuneration advice to the Committee and does not have any connections with SEGRO which may impair its independence.
To ensure a consistent approach to remuneration across the Group, Kepler also provides advice to the Company in respect of matters relating to the remuneration of all employees. Aon Hewitt Limited provided information to the Company in respect of pension-related matters. During the year, Slaughter and May provided advice to the Company in respect of its share-based incentive schemes as well as regulatory and pension matters.
Shareholder votingChart 18 below shows the results of the advisory vote on the 2016 Remuneration Report, at the Company’s AGM on 22 April 2016.
Chart 18: Shareholder voting at the 2016 AGMVotes for
(including discretionary) % For
Votes against % Against
Total votes cast
Votes withheld1
To approve the Directors’ Remuneration Report for the financial year ended 31 December 2015 573,728,470 99.15 4,909,937 0.85 578,638,407 4,337,808
1 A withheld vote is not a vote in law and is not counted in the calculation of the proportion of votes cast for and against a resolution.
This report was approved by the Board on 16 February 2017 and signed on its behalf by
Baroness FordChairman of the Remuneration Committee

98SEGRO Annual Report and Accounts 2016
Governance
Remuneration Policy
The key aim of the Remuneration Policy is to align the interests of Executive Directors with those of the shareholders by supporting the delivery of strategy. The structure of the remuneration framework is designed to reflect the strategic direction of the business and to align it with the Company’s KPIs. In setting the Remuneration Policy, the Committee takes into consideration, amongst other matters, investor guidelines and the maximum amount of remuneration the Executive Directors could receive should all targets be met. The Executive Directors’ remuneration is set within a remuneration framework which applies to all employees across the Group. Each of the key elements of the remuneration package is designed to drive the creation of long-term shareholder value, without encouraging Executive Directors to take inappropriate risk.
Each year, with the support of external advisers, the Committee undertakes a review of the remuneration of the Executive Directors. It has oversight of the remuneration of the Leadership Team, who are the senior managers immediately below Board level. It considers the responsibilities, experience and performance of the Executive Directors and pay across the Group.
Changes to the Policy since approval at the 2014 AGM are outlined in the Chairman’s letter on pages 85 and 86 and are detailed in the table below.
Subject to approval by shareholders at the 2017 AGM, this policy will be effective for the 2017 performance year and will apply to incentive awards with performance periods beginning on 1 January 2017.
Chart 1: Remuneration Policy table: Executive DirectorsElement Strategic purpose Operation Maximum potential value Performance metrics
Salary To attract and motivate high-calibre leaders in a competitive market and to recognise their skills, experience and contribution to Group performance.
The Committee reviews Executive Directors’ base salaries each year in the context of total remuneration, taking into account the Directors’ responsibilities, experience and performance, pay across the Group and market competitiveness.
The maximum annual salary increase will not normally exceed the average increase which applies across the wider workforce. However, larger increases may be awarded in certain circumstances including, but not limited to: an increase in scope or responsibilities of the role; salary progression for a newly appointed Director; and where the Director’s salary has fallen significantly below the market positioning.
Not applicable.
Pension benefits
To provide a market competitive remuneration package.
Retirement benefits are available to all UK employees and employees in certain Continental European jurisdictions dependent on local market practice and geographical differences.
Currently, the Chief Executive receives a cash allowance of 30 per cent of salary in lieu of pension and other Executive Directors receive 20 per cent of salary. Future Executive Directors will receive up to 20 per cent of salary.
The cash allowance for Directors is offered in lieu of membership of the defined contribution Group Personal Pension Plan.
None.
Bonus To focus on the delivery of annual goals, to strive for superior performance and to achieve specific targets which support strategy, in particular for income generation, total property returns and recurring profit.
Bonuses are awarded annually and paid for performance over the financial year.
The Bonus is reviewed each financial year to ensure performance measures and targets are appropriate and support the business strategy.
Payment is based on the achievement of performance targets.
The Committee retains discretion to reduce the amount of the Bonus award in the light of underlying performance during the year.
The rules of the Bonus contain malus and clawback provisions.
The maximum Bonus opportunity for Executive Directors is 150 per cent of salary.
The Bonus Scheme is based on three, equally weighted elements which the Committee may review from time-to-time, to ensure that they continue to reflect the Company’s strategic priorities: Adjusted PBT against budget including adjustments for acquisitions and disposals, constant foreign exchange rate and other adjustments allowed under the scheme rules, which supports the objective of delivering a sustainable, progressive dividend; relative TPR against an MSCI – IPD Benchmark which is the best and most important internal driver of TSR; and rent roll growth which focuses on driving the future rental income and Adjusted PBT of the business.

99Overview Strategic Report Financial Statements
Governance
Element Strategic purpose Operation Maximum potential value Performance metrics
Deferred Share Bonus Plan (‘DSBP’)
To encourage retention of senior managers and provide a long-term link between the Bonus and share price growth so as to encourage long-term decision making.
50 per cent of any Bonus awarded in the year is deferred into shares in the DSBP for three years before vesting. The award does not carry any entitlement to dividends, however the Committee may, at the time of the release of the shares, pay a cash sum equivalent to the value of the dividends that would have been paid over the three-year holding period.
The rules of the DSBP contain malus and clawback provisions.
For Executive Directors, 50 per cent of the Bonus earned in respect of the previous year’s performance.
Vesting of shares is dependent on continued employment or good leaver status.
Long Term Incentive Plan (‘LTIP’)
To reward the execution of strategy and drive long-term returns for shareholders. The awards are designed to align the most senior managers’ goals with the creation of sustainable growth in shareholder value. The awards will also increase retention of these senior managers.
For LTIP awards dividends will accrue on the LTIP shares which are released on vesting and will be paid in cash or shares. The Committee has discretion to adjust awards downwards at vesting if it is not satisfied that the outcome is a fair reflection of underlying performance, or in the event of excessive risk-taking or misstatement.
The rules of the LTIP contain malus and clawback provisions.
The normal LTIP grant for Executive Directors is 200 per cent of salary in performance shares.
The Committee may, in exceptional circumstances, make LTIP grants of up to 300 per cent of salary.
LTIP awards are subject to stretching TSR and TPR performance conditions, which are equally weighted and measured over a three-year performance period. A two-year compulsory holding period applies to these LTIP shares after vesting and subject to payment of tax and statutory deductions.
Sharesave To provide a market competitive remuneration package and to encourage employee share ownership across the Group.
Sharesave is a HMRC approved scheme open to all UK employees. Savings can be made over a three-year period to purchase shares in the Company at a price which is set at the beginning of the saving period. This price is usually set at a 20 per cent discount to the market price.
Employees may save up to the HMRC limit across all Sharesave grants.
None.
Share Incentive Plan (‘SIP’) and Global Share Incentive Plan (‘GSIP’)
To provide a market competitive remuneration package and to encourage employee share ownership across the Group.
SIP is a HMRC approved scheme open to all UK employees, subject to service. Eligible employees are awarded shares annually up to the HMRC limits. GSIP is designed on a similar basis to SIP, but is not HMRC approved and is operated for non-UK employees.
The maximum award is subject to the HMRC limit.
Award is based on achievement of prior year profit before tax against budget and is subject to a three-year holding period.
Other benefits To provide a market competitive remuneration package.
Other benefits currently include: car allowance; life assurance; disability insurance; private medical insurance; and health screening. The Committee retains the discretion to offer additional benefits as appropriate, for example, assistance with relocation.
– None.
Additional notesRemuneration Policy: the policy for the Executive Directors is designed with regard to the pay and benefits for employees across the Group. All employees are eligible for an annual Bonus on the same performance measures which are consistent with those of the Executive Directors save that those below Board level have a fourth target based on their individual performance score. The maximum Bonus opportunity is fixed according to seniority banding across the Company. The LTIP performance conditions are the same for all participants and the size of awards are determined by seniority.
Subject to consultation with major shareholders, the Committee retains the ability to adjust and/or to set different LTIP and Bonus performance measures if events occur (such as a change in strategy, a material acquisition and/or divestment of a Group business, or change in prevailing market conditions) which cause the Committee to determine that the measures are no longer appropriate and that amendment is required so that they achieve their original purpose.
Payments from existing awards: Executive Directors are eligible to receive payment from any award made prior to the approval and implementation of the Remuneration Policy.

100SEGRO Annual Report and Accounts 2016
Chart 2: Remuneration Policy Table: Chairman and Non-Executive DirectorsElement Strategic purpose Operation Maximum potential value Performance metrics
Fees To attract high-calibre Non-Executive Directors and provide market appropriate fees.
Fees are reviewed every two years taking into account relevant market data. Additional fees are payable to reflect the time commitments and additional responsibilities of the Senior Independent Director and also the Chairmen of the Remuneration and Audit Committees.
The fee paid to the Chairman is set by the Committee while the fees paid to the Non-Executive Directors are set by the Board.
No Director is involved in setting their own remuneration.
Non-Executive Directors do not participate in any performance related remuneration and they do not receive any benefits.
Any increases in the fees of the Chairman or the Non-Executive Directors will be based upon changes in roles and responsibilities and market data.
–
Policy on service contractsExecutive Directors The contracts are on a 12-month rolling basis and do not contain liquidated damages clauses.
Non-Executive DirectorsThe Chairman and the Non-Executive Directors have letters of appointment which set out their duties and anticipated time commitment to the Company. They are required to disclose to the Board any changes to their other significant commitments. The Non-Executive Directors are appointed for an initial term of three years. The appointments may be extended for further three-year periods on the recommendation of the Nomination Committee and subject to the Board’s agreement. The Non-Executive Directors’ letters of appointment contain a three-month notice period and the Chairman’s contains a six-month notice period. Further details are set out in Chart 3.
Chart 3: Dates of appointment and contractual notice period Name Date of appointment Notice period
Gerald Corbett1 1 March 2016 6 months
David Sleath2 1 January 2006 12 months by the Company 6 months by the Director
Soumen Das 16 January 2017 12 months by the Company 6 months by the Director
Andy Gulliford 1 May 2013 12 months by the Company 6 months by the Director
Phil Redding 1 May 2013 12 months by the Company 6 months by the Director
Christopher Fisher 1 October 2012 3 months
Margaret Ford 1 January 2013 3 months
Martin Moore 1 July 2014 3 months
Mark Robertshaw 1 June 2010 3 months
Doug Webb 1 May 2010 3 months
1 Appointed Chairman on 22 April 2016.
2 Appointed as Chief Executive on 28 April 2011.
Governance
Remuneration Policy continued…
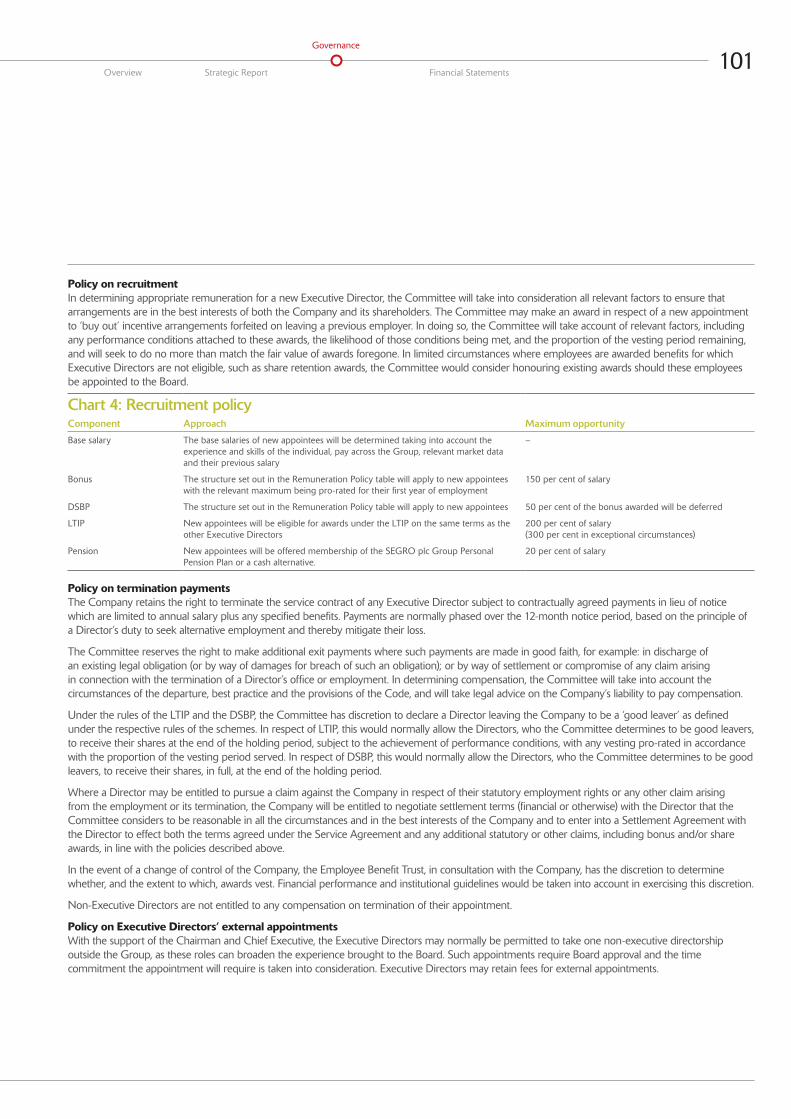
101Overview Strategic Report Financial Statements
Governance
Policy on recruitmentIn determining appropriate remuneration for a new Executive Director, the Committee will take into consideration all relevant factors to ensure that arrangements are in the best interests of both the Company and its shareholders. The Committee may make an award in respect of a new appointment to ‘buy out’ incentive arrangements forfeited on leaving a previous employer. In doing so, the Committee will take account of relevant factors, including any performance conditions attached to these awards, the likelihood of those conditions being met, and the proportion of the vesting period remaining, and will seek to do no more than match the fair value of awards foregone. In limited circumstances where employees are awarded benefits for which Executive Directors are not eligible, such as share retention awards, the Committee would consider honouring existing awards should these employees be appointed to the Board.
Chart 4: Recruitment policyComponent Approach Maximum opportunity
Base salary The base salaries of new appointees will be determined taking into account the experience and skills of the individual, pay across the Group, relevant market data and their previous salary
–
Bonus The structure set out in the Remuneration Policy table will apply to new appointees with the relevant maximum being pro-rated for their first year of employment
150 per cent of salary
DSBP The structure set out in the Remuneration Policy table will apply to new appointees 50 per cent of the bonus awarded will be deferred
LTIP New appointees will be eligible for awards under the LTIP on the same terms as the other Executive Directors
200 per cent of salary (300 per cent in exceptional circumstances)
Pension New appointees will be offered membership of the SEGRO plc Group Personal Pension Plan or a cash alternative.
20 per cent of salary
Policy on termination payments The Company retains the right to terminate the service contract of any Executive Director subject to contractually agreed payments in lieu of notice which are limited to annual salary plus any specified benefits. Payments are normally phased over the 12-month notice period, based on the principle of a Director’s duty to seek alternative employment and thereby mitigate their loss.
The Committee reserves the right to make additional exit payments where such payments are made in good faith, for example: in discharge of an existing legal obligation (or by way of damages for breach of such an obligation); or by way of settlement or compromise of any claim arising in connection with the termination of a Director’s office or employment. In determining compensation, the Committee will take into account the circumstances of the departure, best practice and the provisions of the Code, and will take legal advice on the Company’s liability to pay compensation.
Under the rules of the LTIP and the DSBP, the Committee has discretion to declare a Director leaving the Company to be a ‘good leaver’ as defined under the respective rules of the schemes. In respect of LTIP, this would normally allow the Directors, who the Committee determines to be good leavers, to receive their shares at the end of the holding period, subject to the achievement of performance conditions, with any vesting pro-rated in accordance with the proportion of the vesting period served. In respect of DSBP, this would normally allow the Directors, who the Committee determines to be good leavers, to receive their shares, in full, at the end of the holding period.
Where a Director may be entitled to pursue a claim against the Company in respect of their statutory employment rights or any other claim arising from the employment or its termination, the Company will be entitled to negotiate settlement terms (financial or otherwise) with the Director that the Committee considers to be reasonable in all the circumstances and in the best interests of the Company and to enter into a Settlement Agreement with the Director to effect both the terms agreed under the Service Agreement and any additional statutory or other claims, including bonus and/or share awards, in line with the policies described above.
In the event of a change of control of the Company, the Employee Benefit Trust, in consultation with the Company, has the discretion to determine whether, and the extent to which, awards vest. Financial performance and institutional guidelines would be taken into account in exercising this discretion.
Non-Executive Directors are not entitled to any compensation on termination of their appointment.
Policy on Executive Directors’ external appointments With the support of the Chairman and Chief Executive, the Executive Directors may normally be permitted to take one non-executive directorship outside the Group, as these roles can broaden the experience brought to the Board. Such appointments require Board approval and the time commitment the appointment will require is taken into consideration. Executive Directors may retain fees for external appointments.

102SEGRO Annual Report and Accounts 2016
Performance scenariosChart 5 below sets out an indication of the level of remuneration that would be received by each Executive Director in accordance with the incentive opportunities outlined in the Remuneration Policy for 2017 on the basis of the latest salary information.
David Sleath
Soumen Das1
Andy Gulliford
Phil Redding
Fixed
£0 £500,000 £3,000,000
Short Term Long Term
£1,000,000 £1,500,000 £2,000,000 £2,500,000
Maximum
On Target
Minimum
Maximum
On Target
Minimum
Maximum
On Target
Minimum
Maximum
On Target
Minimum
£2,991,49628%
52%
100%
22%
26%
26%
50% 30% 20%
100%
32% 42%
50% 30% 20%
100%
32% 42%
44% 27% 27%
100%
26% 52%
29% 19%
31% 41%
£1,598,679
£824,891
£2,642,067based on 300% LTIP opportunity
£1,262,067
£572,067
£1,925,086
£1,013,149
£506,518
£1,923,938
£1,012,001
£505,370
Chart 5: Indication of potential remuneration in the first year of policy application
1 Remuneration for Soumen Das is calculated based on a LTIP opportunity for 2017 of 300 per cent of salary. His LTIP opportunity will reduce to 200 per cent of salary in 2018.
based on 300% LTIP opportunity
The minimum remuneration payable comprises salary (as at 1 April 2017), benefits and Company pension contributions or cash in lieu of pension contributions as applicable. The maximum payable assumes full pay-out under the Bonus and full vesting of the LTIP. On target remuneration assumes a pay-out of 50 per cent of the maximum Bonus and a 25 per cent vesting of the LTIP. The value of the LTIP vesting is based on a 2017 award of 200 per cent of salary (300 per cent for the Chief Financial Officer, which will reduce to 200 per cent in 2018). Share price movement has not been taken into account.
Consideration of conditions elsewhere in the Group The Remuneration Policy for the Executive Directors is designed with regard to the policy for employees across the Group as a whole. The Committee has oversight of the remuneration of the Leadership Team. The Committee is kept updated through the year on general employment conditions and it approves the budget for annual salary increases. The Company did not consult with employees in formulating Executive Remuneration Policy.
Consideration of shareholder views The Committee remains committed to open dialogue with shareholders on remuneration. When determining remuneration, the Committee takes into account the guidelines of investor bodies and shareholder views. In 2016, it consulted with shareholders on changes to the Policy covered in the Chairman’s letter.
The Chairman of the Remuneration Committee is available for meetings with shareholders should they have any concerns about remuneration matters which they wish to discuss.
Governance
Remuneration Policy continued…
103Overview Strategic Report Financial Statements
Governance
Share capitalThe issued share capital for the year is set out on page 148.
There is one class of share in issue and there are no restrictions on the voting rights attached to these shares or the transfer of securities in the Company, and all shares are fully paid.
The Company made no purchases of its own shares during the year.
Equity placingOn 2 September 2016, the Company issued an additional 74,770,950 new ordinary shares at a price of 435 pence per share, by way of a placing. Unlike a rights issue, a placing of shares does not involve an offer to all existing shareholders, but an issue of shares directly to certain shareholders, most usually institutions. There are regulatory restrictions on placings which are designed to protect the rights of existing shareholders and to which the Company adhered. The Company also complied with the Pre-Emption Group’s 2015 Statement of Principles.
At the 2016 AGM, shareholders gave the Company authority to (i) allot shares up to a maximum nominal amount of £24,923,653, which represented approximately one-third of the Company’s issued share capital as at 4 March 2016, being the latest practicable date prior to the publication of the Notice of AGM; and (ii) allot shares up to a maximum nominal value of £7,477,095 which represented approximately 10 per cent of the Company’s issued share capital as at 4 March 2016, without having to first offer any of those shares to existing shareholders, provided that those shares were issued in connection with the funding of a specified capital investment.
The Company used the authorities given to it at the 2016 AGM to issue the additional 74,770,950 new ordinary shares which represented a 9.99 per cent increase to the issued share capital as at 4 March 2016. This was the only increase in issued shared capital due to a non-premptive issuance for cash over the three-year period preceding the issue. A total of £325,253,632.50 was raised which will be used to fund the Company’s development pipeline. The price reflected a 4.44 per cent discount to the closing share price on 1 September 2016 and a 7.49 per cent discount to the EPRA net asset value at 30 June 2016, after deducting the amount of the interim dividend.
DividendsSubject to approval by shareholders at the 2017 AGM, a final dividend of 11.2 pence per share will be paid (2015: 10.6 pence) bringing the total dividend for 2016 to 16.4 pence (2015: 15.6 pence). The final dividend will be paid as a Property Income Distribution. The Board proposes to offer a scrip dividend option for the 2016 final dividend.
The ex-dividend date for the final dividend will be 23 March 2017, the record date will be 24 March 2017 and the payment date will be 4 May 2017.
Change of control ° Contracts and joint venture agreements
There are a number of contracts and joint venture agreements that could allow the counterparties to terminate or alter those arrangements in the event of a change of control of the Company. These arrangements are commercially confidential and their disclosure could be seriously prejudicial to the Company.
° Borrowings and other financial instruments
The Group has a number of borrowing facilities provided by various lenders. These facilities generally include provisions that may require any outstanding borrowings to be repaid or the amendment or termination of the facilities upon the occurrence of a change of control of the Company.
° Employee share plans
The Company’s share plans contain provisions as a result of which options and awards may vest or become exercisable on change of control of the Company, in accordance with the rules of the plans.
Employees and DirectorsThere are no agreements between the Company and its Directors or employees providing for compensation for loss of office or employment that occurs specifically because of a takeover bid, with the exception of provisions of the Company’s share schemes as detailed above.
° Directors’ authorities in relation to shares
The Directors’ authorities in relation to issuing, allotting or buying back shares are governed by the Company’s Articles of Association and the resolutions passed by shareholders at a general meeting. These documents do not form part of this Report.
° Process for appointment/removal of Directors
The Company is governed by its Articles of Association, the UK Corporate Governance Code, the Companies Act 2006 and related legislation with regards to the appointment and removal of Directors. Directors are appointed by the Board and elected by shareholders. Directors may be removed by the Board or shareholders as applicable.
Directors’ Report

104SEGRO Annual Report and Accounts 2016
Substantial interests in the share capital of the CompanyThe following major interests, amounting to 3 per cent or more of the ordinary issued share capital has been notified to the Company:
As at 31 December 2016 As at 15 February 2017
ShareholderNumber of
sharesPercentage of Issued
Share CapitalNumber of
sharesPercentage of Issued
Share Capital
BlackRock Inc 70,103,593 8.44% 74,978,812 9.03%
APG Asset Mgt 52,764,583 6.36% 49,264,583 5.93%
Artemis Investment Mgt 48,072,205 5.79% 48,766,723 5.87%
State Street Global Advisors 35,805,454 4.31% 38,824,333 4.68%
Cohen & Steers Asset Mgt 36,277,025 4.37% 34,351,559 4.14%
Legal & General Investment Mgt 29,796,540 3.59% 30,318,472 3.65%
The Vanguard Group 25,720,544 3.10% 25,720,544 3.10%
Articles of AssociationShareholders may amend the Company’s Articles of Association by special resolution.
Political donationsNo political donations were made by the Company or its subsidiaries during the year.
Directors’ indemnitiesNo Company or subsidiary company Directors were indemnified during the year.
Overseas branchesThe Company has a branch in Paris, France.
Directors’ Report disclosuresCertain Directors’ Report disclosures have been made in the Strategic Report so as to increase their prominence. These disclosures include those relating to: greenhouse gas emissions; financial instruments and certain financial risks; employee involvement; the employment, training and advancement of disabled persons; the review of the Group’s business during the year and any future developments.
Auditor of the CompanyA resolution to reappoint PricewaterhouseCoopers LLP as auditor of the Company is to be proposed at the 2017 AGM.
Disclosure of information to the auditorEach of the persons who is a Director at the date of approval of this Report confirms that:
° so far as the Director is aware, there is no relevant audit information of which the Company’s auditor is unaware; and
° each Director has taken all the steps that he ought to have taken as a Director in order to make himself aware of any relevant audit information and to establish that the Company’s auditor is aware of that information.
This confirmation is given and should be interpreted in accordance with the provisions of section 418 of the Companies Act 2006.
The Directors’ Report has been approved by the Board and signed on its behalf by
Elizabeth Blease General Counsel and Group Company Secretary
16 February 2017
Governance
Directors’ Report continued…

105Overview Strategic Report Financial Statements
Governance
The Directors are responsible for preparing the Annual Report, the Directors’ Remuneration Report and the Financial Statements in accordance with applicable law and regulations.
Company law requires the Directors to prepare financial statements for each financial year. Under that law the Directors have prepared the Group and Company Financial Statements in accordance with International Financial Reporting Standards (IFRSs) as adopted by the European Union. Under company law the Directors must not approve the financial statements unless they are satisfied that they give a true and fair view of the state of affairs of the Group and the Company and of the profit or loss of the Group for that period. In preparing these Financial Statements, the Directors are required to:
° select suitable accounting policies and then apply them consistently;
° make judgements and accounting estimates that are reasonable and prudent;
° state whether applicable IFRSs as adopted by the European Union have been followed, subject to any material departures disclosed and explained in the Financial Statements;
° prepare the Financial Statements on the going concern basis unless it is inappropriate to presume that the Company will continue in business.
The Directors are responsible for keeping adequate accounting records that are sufficient to show and explain the Company’s transactions and disclose with reasonable accuracy at any time the financial position of the Company and the Group and enable them to ensure that the Financial Statements and the Directors’ Remuneration Report comply with the Companies Act 2006 and, as regards the Group Financial Statements, Article 4 of the IAS Regulation. They are also responsible for safeguarding the assets of the Company and the Group and hence for taking reasonable steps for the prevention and detection of fraud and other irregularities.
The Directors are responsible for the maintenance and integrity of the Company’s website. Legislation in the United Kingdom governing the preparation and dissemination of financial statements may differ from legislation in other jurisdictions.
The Directors consider that the Annual Report and Accounts, taken as a whole, is fair, balanced and understandable and provides the information necessary for shareholders to assess a Company’s position and performance, business model and strategy.
Each of the Directors, whose names and functions are listed in the Governance section of the Annual Report confirm that, to the best of their knowledge:
° the Group Financial Statements, which have been prepared in accordance with IFRSs as adopted by the EU, give a true and fair view of the assets, liabilities, financial position and profit or loss of the Group; and
° the Strategic Report includes a fair review of the development and performance of the business and the position of the Group, together with a description of the principal risks and uncertainties that it faces.
By order of the Board
David Sleath Soumen Das Chief Executive Chief Financial Officer
16 February 2017 16 February 2017
Statement of Directors’ Responsibilities
Financial StatementsIn this section we present our financial statements for the year, presented in accordance with International Financial Reporting Standards.
In this section:
Independent Auditor’s Report to the Members of SEGRO plc 107Group Income Statement 113Group Statement of Comprehensive Income 113Balance Sheets 114Statements of Changes in Equity 115Cash Flow Statements 117Notes to the Financial Statements 118Five-Year Financial Results 169Financial Information 170Shareholder Information 171Glossary of Terms 172
106SEGRO Annual Report and Accounts 2016

Report on the financial statementsOur opinionIn our opinion:
– SEGRO plc’s Group financial statements and Company financial statements (the “financial statements”) give a true and fair view of the state of the Group’s and of the Company’s affairs as at 31 December 2016 and of the Group’s profit and the Group’s and the Company’s cash flows for the year then ended;
– the Group financial statements have been properly prepared in accordance with International Financial Reporting Standards (“IFRSs”) as adopted by the European Union;
– the Company financial statements have been properly prepared in accordance with IFRSs as adopted by the European Union and as applied in accordance with the provisions of the Companies Act 2006; and
– the financial statements have been prepared in accordance with the requirements of the Companies Act 2006 and, as regards the Group financial statements, Article 4 of the IAS Regulation.
What we have auditedThe financial statements, included within the Annual Report, comprise:
– the Group and Company Balance Sheets as at 31 December 2016; – the Group Income Statement and Group Statement of Comprehensive Income for the year then ended; – the Group and Company Cash Flow Statements for the year then ended; – the Group and Company Statement of Changes in Equity for the year then ended; and – the Notes to the financial statements, which include a summary of significant accounting policies and other explanatory information.
Certain required disclosures have been presented elsewhere in the Annual Report, rather than in the notes to the financial statements. These are cross-referenced from the financial statements and are identified as audited.
The financial reporting framework that has been applied in the preparation of the financial statements is IFRSs as adopted by the European Union and, as regards the Company financial statements, as applied in accordance with the provisions of the Companies Act 2006, and applicable law.
Our audit approachContextThis is our first year as auditors of SEGRO plc and therefore we spent additional audit effort on, for example, opening balances and hedging arrangements.
The primary measurement attribute of the Group is the carrying value of property investments which represent the Group’s most significant asset. Valuation of investment property is subjective and involves key judgements that take into account current market conditions.
The nature of the Group’s business means it can enter into large and/or complex transactions which by definition require audit effort to deal with their size and complexity.
Overview
– Overall Group materiality: £61 million which represents 1% of total assets.
– Specific Group materiality, applied to adjusted profit before tax: £8 million which represents 5% of adjusted profit before tax.
– First year audit procedures on opening balances and hedging arrangements
– A full scope audit on all significant components within the Group, and the following joint ventures: SEGRO European Logistics Partnership (“SELP”) and Airport Property Partnership (“APP”).
– Valuation of investment properties.
– Accounting for large and/or complex transactions including:
• acquisitions and disposals of investment property • issuance of share capital; and • establishment of the Roxhill Joint Venture.
– First year audit procedures.
Independent Auditor’s Report to the Members of SEGRO plc
Areas offocus
Audit scope
Materiality
107Financial Statements
Overview Strategic Report Governance

The scope of our audit and our areas of focusWe conducted our audit in accordance with International Standards on Auditing (UK and Ireland) (“ISAs (UK & Ireland)”).
We designed our audit by determining materiality and assessing the risks of material misstatement in the financial statements. In particular, we looked at where the Directors made subjective judgements, for example in respect of significant accounting estimates that involved making assumptions and considering future events that are inherently uncertain. As in all of our audits we also addressed the risk of management override of internal controls, including evaluating whether there was evidence of bias by the Directors that represented a risk of material misstatement due to fraud.
The risks of material misstatement that had the greatest effect on our audit, including the allocation of our resources and effort, are identified as “areas of focus” in the table below. We have also set out how we tailored our audit to address these specific areas in order to provide an opinion on the financial statements as a whole, and any comments we make on the results of our procedures should be read in this context. This is not a complete list of all risks identified by our audit.
Area of focus How our audit addressed the area of focus
Valuation of investment propertiesRefer to page 79 (Audit Committee Report) and Financial Statements (including notes to the Financial Statements; Note 1, Significant accounting policies; Note 15, Investment property; and Note 30, Property valuation techniques and related quantitative information).
The Group’s investment properties were carried at £4,714m as at 31 December 2016 and a total (realised and unrealised) property gain of £246m was recognised in the Group income statement. We focused on this area due to the existence of significant judgement, coupled with the fact that only a small percentage difference in individual property valuations when aggregated could result in material misstatement.
The portfolio includes warehouses and light industrial buildings, including warehouses used as data centres and for logistics operations. These are concentrated in the UK, France, Germany, Italy and Poland. The remainder of the portfolio is located across other European countries including Spain, Belgium, the Netherlands and the Czech Republic.
The portfolio includes completed investments and properties under construction. The methodology applied in determining the valuation is set out in notes 15 and 30 of the financial statements.
The valuation of the Group’s portfolio is inherently subjective due to, among other factors, the individual nature of each property, its location and the expected future rentals for that particular property. For developments, factors include projected costs to complete, time until practical completion and the ability to let if no pre-let agreement is in place.
Valuations are carried out by third party valuers, CBRE Ltd (the “Valuers”). The Valuers were engaged by the Directors, and performed their work in accordance with the Royal Institute of Chartered Surveyors (“RICS”) Valuation – Professional Standards. The Valuers used by the Group have considerable experience of the markets in which the Group operates.
The valuations take into account the property-specific information referred to above (including the current tenancy agreements and rental income, condition and location of the property, future rental prospects), as well as prevailing market yields and market transactions.
Assessing the Valuers’ expertise and objectivityWe assessed the Valuers’ qualifications and expertise and read their terms of engagement with the Group to determine whether there were any matters that might have affected their objectivity or may have imposed scope limitations upon their work. We also considered fee and other contractual arrangements that might exist between the Group and the Valuers. We found no evidence to suggest that the objectivity of the Valuers was compromised.
Testing the valuationsAssumptions and capital movement:We obtained details of every property held by the Group and set an expected range for yield and capital value movement, determined by reference to published benchmarks and using our experience and knowledge of the market.
We then obtained and read the CBRE valuation reports for every property. We determined, based on our expertise and experience, that the valuation approach for each was in accordance with RICS standards and suitable for use in determining the carrying value for the financial statements.
We compared the investment yields used by the Valuers to the range of expected range of yields and the year on year capital movement to our expected range. We also considered the reasonableness of other assumptions that are not so readily comparable with published benchmarks, such as Estimated Rental Value.
We attended meetings with management and the Valuers, at which the valuations and the key assumptions therein were discussed. Our work covered the valuation of every property in the Group, but the discussions with management and the Valuers focused on the largest properties in the portfolio and those where the assumptions used and/or year on year capital value movement suggested a possible outlier versus externally published market data for the relevant sector.
Where assumptions were outside the expected range or otherwise appeared unusual, and/or valuations showed unexpected movements, we undertook further investigations and, when necessary, held further discussions with the Valuers and obtained evidence to support explanations received. The valuation commentaries provided by the Valuers and the supporting evidence, enabled us to consider the property specific factors that had or may have had an impact on value, including recent comparable transactions where appropriate. We also satisfied ourselves that for properties where there could be alternative use opportunities, this had been appropriately taken into account.
Information and standing data:We tested the standing data the Group provided to the Valuers for use in the performance of the valuation. This involved re-performing controls over the input of lease data for a sample of leases and testing, on a sample basis, the accuracy of lease and other property information. For development properties we also confirmed that the supporting information for construction contracts and budgets was consistent with the Group’s records, for example by inspecting original construction contracts. For developments, capitalised expenditure was tested on a sample basis to invoices, and budgeted costs to complete were compared to supporting evidence (for example construction contracts).
We agreed the amounts per the valuation reports to the accounting records and from there we agreed the related balances through to the financial statements.
Other factors that could affect valuations this year: We noted that the Valuers did not include any market uncertainty clauses for either UK or European property valuations, although such clauses were included at the half-year in the immediate aftermath of the UK’s EU Referendum. We considered this to be reasonable and in line with current market practice among valuers, there being a sufficient level of transaction activity (including in the period since the Referendum) to support valuations. We also checked that the Valuers had appropriately reflected changes to transfer land taxes (in the UK and France) which came into effect in 2016.
Overall outcomeIt was evident from our interaction with management and the Valuers, and from our review of the valuation reports, that close attention had been paid to each property’s individual characteristics and we concluded that the year end carrying values were supportable and reflected appropriately in the financial statements.
Financial Statements
Independent Auditor’s Report to the Members of SEGRO plc continued…
108SEGRO Annual Report and Accounts 2016

Area of focus How our audit addressed the area of focus
Large and/or complex transactionsRefer to page 80 (Audit Committee Report) and Financial Statements (including notes to the Financial Statements; Note 1, Significant accounting policies; Note 15, Investment property).
There were a number of transactions during the year which warranted particular additional audit focus due to the magnitude of the transactions and/or the potential for complex contractual terms that introduce judgement into how they were accounted for. Key transactions subject to additional audit focus were:
– acquisition of investment property assets for £254 million;
– disposal of investment property assets for £589 million;
– raising of £325 million via issuance of share capital; and
– establishment of the Roxhill Joint Venture.
For each transaction, we held discussions with management and obtained supporting documentation as necessary to ensure that we understood the nature of the transaction. We assessed the proposed accounting treatment in relation to the Group’s accounting policies and relevant IFRSs.
Acquisitions and disposalsFor acquisitions and disposals of investment properties, we obtained and reviewed the key supporting documentation such as Sales and Purchase Agreements and completion statements. Consideration received or paid was agreed to bank statements and deferred consideration postings (if applicable). For the disposal of assets to SELP, we additionally tested the fair value of assets used in determining the transaction price. No material issues were found as a result of these procedures. We also considered and concurred with the accounting treatments adopted by management.
Share capital issuanceFor the share capital issue, we examined placing documents, resolutions passed by the Board and cash receipts. No material issues were found as a result of these procedures.
Establishment of Joint VentureSince this was the year of establishment of the Roxhill joint venture, we spent time in understanding the transaction and the accounting entries which it would drive. Our work focused on:
Classification as joint venture: We inspected the sale and purchase agreement (“SPA”) to check that there was a single agreement with joint control established. We were satisfied based on our inspection that it was appropriate to present the arrangement as a joint venture in SEGRO’s Group’s financial statements.
Recognition and measurement of the asset within the Joint Venture: We assessed the analysis produced by management in order to determine whether the amounts paid to secure land options should be recognised as an asset. Management’s assessment that it is probable that economic benefit will flow in the future as a result of these payments appeared reasonable in light of current market conditions, supporting the carrying value at the year-end.
First year auditAs this was our first year as auditors of the Group we spent additional time in a number of areas so as to ensure that we planned our audit effectively. In particular:
– We arranged meetings with the predecessor auditor to perform a review of their working papers;
– We performed an assessment of the Group and Company accounting policies and the prior year financial statements; and
– We held discussions with management across multiple areas of the business to ensure that we obtained a full understanding of the Group’s control environment and processes.
We carried out extended audit procedures on two areas of the financial statements: opening balances and the Group’s hedging arrangements.
Opening balancesAs part of our review of the predecessor auditor’s working papers we obtained evidence for the opening position at the start of our first year as auditors. We then planned our audit to provide sufficient evidence on the closing balances taking into account this work.
Hedging arrangementsThe Group seeks to manage its exposure to changes in interest rates and to foreign exchange risk through a combination of Sterling interest rate swaps, Euro interest rate swaps and cross currency swaps. We tested the valuation of these derivatives by re-performing the valuations using independent data sources. We also evaluated the accounting treatment and disclosures for hedging arrangements reflected in the Group’s financial statements and concluded that they were in line with IFRS. Where hedge accounting had been applied in respect of instruments that hedge investments in foreign subsidiaries we read management’s hedge effectiveness documentation. We also checked the timing of the resulting cash flows and the impact on the Group’s liquidity. No material issues were found as a result of these procedures.
How we tailored the audit scopeWe tailored the scope of our audit to ensure that we performed enough work to be able to give an opinion on the financial statements as a whole, taking into account the geographic structure of the Group, the accounting processes and controls, and the industry in which the Group operates.
The Group operates a common IT environment, processes and controls for rental income and payroll across all its reported segments and the SELP and APP Joint Ventures. The related balances were therefore audited in full by the Group audit team from the UK, using Computer Assisted Audit Techniques for the work on revenue. The Group’s valuation, treasury and tax functions are also based at the corporate centre in the UK and audit work on these functions was performed by the Group audit team.
Additional procedures were performed by audit teams on location in each business unit, such that the total testing programme provided sufficient audit evidence over all financial statement line items.
Taking into account the segments and Joint Ventures subject to a full scope audit, the centralised and other testing performed, coverage over the Group Balance Sheet and Group Income Statement was as follows:
Assets 99% coverage
Liabilities 96% coverage
Income 100% coverage
Expenditure 100% coverage
109Financial Statements
Overview Strategic Report Governance

MaterialityThe scope of our audit was influenced by our application of materiality. We set certain quantitative thresholds for materiality. These, together with qualitative considerations, helped us to determine the scope of our audit and the nature, timing and extent of our audit procedures on the individual financial statement line items and disclosures and in evaluating the effect of misstatements, both individually and on the financial statements as a whole.
Based on our professional judgement, we determined materiality for the financial statements as a whole as follows:
Overall Group materiality £61 million.
How we determined it 1% of total assets.
Rationale for benchmark applied The primary measurement attribute of the Group is the carrying value of property investments. On this basis, we set an overall Group materiality level based on total assets.
In addition, we set a specific materiality level of £8 million, equating to 5% of adjusted profit before tax, for items within adjusted profit before tax. In arriving at this judgement we had regard to the fact that the adjusted profit before tax is a secondary financial indicator of the Group (refer to note 2 of the financial statements page 123 where the term is defined in full.)
We agreed with the Audit Committee that we would report to them misstatements identified during our audit above £1 million as well as misstatements below that amount that, in our view, warranted reporting for qualitative reasons.
Going concernUnder the Listing Rules we are required to review the Directors’ statement, set out on page 53, in relation to going concern. We have nothing to report having performed our review.
Under ISAs (UK & Ireland) we are required to report to you if we have anything material to add or to draw attention to in relation to the Directors’ statement about whether they considered it appropriate to adopt the going concern basis in preparing the financial statements. We have nothing material to add or to draw attention to.
As noted in the Directors’ statement, the Directors have concluded that it is appropriate to adopt the going concern basis in preparing the financial statements. The going concern basis presumes that the Group and Company have adequate resources to remain in operation, and that the Directors intend them to do so, for at least one year from the date the financial statements were signed. As part of our audit we have concluded that the Directors’ use of the going concern basis is appropriate. However, because not all future events or conditions can be predicted, these statements are not a guarantee as to the Group’s and Company’s ability to continue as a going concern.
Other required reportingConsistency of other information and compliance with applicable requirementsCompanies Act 2006 reportingIn our opinion, based on the work undertaken in the course of the audit:
– the information given in the Strategic Report and the Directors’ Report for the financial year for which the financial statements are prepared is consistent with the financial statements; and
– the Strategic Report and the Directors’ Report have been prepared in accordance with applicable legal requirements.
In addition, in light of the knowledge and understanding of the Company and its environment obtained in the course of the audit, we are required to report if we have identified any material misstatements in the Strategic Report and the Directors’ Report. We have nothing to report in this respect.
In our opinion, based on the work undertaken in the course of the audit:
– the information given in the Corporate Governance Statement set out on pages 63 to 84 with respect to internal control and risk management systems and about share capital structures is consistent with the financial statements and has been prepared in accordance with applicable legal requirements; and
– the information given in the Corporate Governance Statement set out on pages 63 to 84 with respect to the Company’s corporate governance code and practices and about its administrative, management and supervisory bodies complies with rules 7.2.2, 7.2.3 and 7.2.7 of the Disclosure Guidance and Transparency Rules sourcebook made by the Financial Conduct Authority.
In addition, in light of the knowledge and understanding of the Group, the Company and their environment obtained in the course of the audit, we are required to report if we have identified any material misstatements in the information referred to above in the Corporate Governance Statement. We have nothing to report in this respect.
Financial Statements
Independent Auditor’s Report to the Members of SEGRO plc continued…
110SEGRO Annual Report and Accounts 2016

ISAs (UK & Ireland) reporting
Under ISAs (UK & Ireland) we are required to report to you if, in our opinion:
– information in the Annual Report is:
• materially inconsistent with the information in the audited financial statements; or • apparently materially incorrect based on, or materially inconsistent with, our knowledge of the Group and Company
acquired in the course of performing our audit; or • otherwise misleading.
We have no exceptions to report.
– the statement given by the Directors on page 105, in accordance with provision C.1.1 of the UK Corporate Governance Code (the “Code”), that they consider the Annual Report taken as a whole to be fair, balanced and understandable and provides the information necessary for members to assess the Group’s and Company’s position and performance, business model and strategy is materially inconsistent with our knowledge of the Group and Company acquired in the course of performing our audit.
We have no exceptions to report.
– the section of the Annual Report on pages 77 to 84, as required by provision C.3.8 of the Code, describing the work of the Audit Committee does not appropriately address matters communicated by us to the Audit Committee.
We have no exceptions to report.
The Directors’ assessment of the prospects of the Group and of the principal risks that would threaten the solvency or liquidity of the Group
Under ISAs (UK & Ireland) we are required to report to you if we have anything material to add or to draw attention to in relation to:
– the Directors’ confirmation on page 105 of the Annual Report, in accordance with provision C.2.1 of the Code, that they have carried out a robust assessment of the principal risks facing the Group, including those that would threaten its business model, future performance, solvency or liquidity.
We have nothing material to add or to draw attention to.
– the disclosures in the Annual Report that describe those risks and explain how they are being managed or mitigated. We have nothing material to add or to draw attention to.
– the Directors’ explanation on pages 56 to 57 of the Annual Report, in accordance with provision C.2.2 of the Code, as to how they have assessed the prospects of the Group, over what period they have done so and why they consider that period to be appropriate, and their statement as to whether they have a reasonable expectation that the Group will be able to continue in operation and meet its liabilities as they fall due over the period of their assessment, including any related disclosures drawing attention to any necessary qualifications or assumptions.
We have nothing material to add or to draw attention to.
Under the Listing Rules we are required to review the Directors’ statement that they have carried out a robust assessment of the principal risks facing the Group and the Directors’ statement in relation to the longer-term viability of the Group. Our review was substantially less in scope than an audit and only consisted of making inquiries and considering the Directors’ process supporting their statements; checking that the statements are in alignment with the relevant provisions of the Code; and considering whether the statements are consistent with the knowledge acquired by us in the course of performing our audit. We have nothing to report having performed our review.
Adequacy of accounting records and information and explanations receivedUnder the Companies Act 2006 we are required to report to you if, in our opinion:
– we have not received all the information and explanations we require for our audit; or – adequate accounting records have not been kept by the Company, or returns adequate for our audit have not been received from branches not visited by us; or
– the Company financial statements and the part of the Directors’ Remuneration Report to be audited are not in agreement with the accounting records and returns.
We have no exceptions to report arising from this responsibility.
111Financial Statements
Overview Strategic Report Governance
Directors’ remunerationDirectors’ remuneration report – Companies Act 2006 opinionIn our opinion, the part of the Directors’ Remuneration Report to be audited has been properly prepared in accordance with the Companies Act 2006.
Other Companies Act 2006 reportingUnder the Companies Act 2006 we are required to report to you if, in our opinion, certain disclosures of Directors’ remuneration specified by law are not made. We have no exceptions to report arising from this responsibility.
Corporate governance statementUnder the Companies Act 2006 we are required to report to you if, in our opinion, a Corporate Governance Statement has not been prepared by the Company. We have no exceptions to report arising from this responsibility.
Under the Listing Rules we are required to review the part of the Corporate Governance Statement relating to ten further provisions of the Code. We have nothing to report having performed our review.
Responsibilities for the financial statements and the auditOur responsibilities and those of the DirectorsAs explained more fully in the Statement of Directors’ Responsibilities set out on page 105, the Directors are responsible for the preparation of the financial statements and for being satisfied that they give a true and fair view.
Our responsibility is to audit and express an opinion on the financial statements in accordance with applicable law and ISAs (UK & Ireland). Those standards require us to comply with the Auditing Practices Board’s Ethical Standards for Auditors.
This report, including the opinions, has been prepared for and only for the Company’s members as a body in accordance with Chapter 3 of Part 16 of the Companies Act 2006 and for no other purpose. We do not, in giving these opinions, accept or assume responsibility for any other purpose or to any other person to whom this report is shown or into whose hands it may come save where expressly agreed by our prior consent in writing.
What an audit of financial statements involvesAn audit involves obtaining evidence about the amounts and disclosures in the financial statements sufficient to give reasonable assurance that the financial statements are free from material misstatement, whether caused by fraud or error. This includes an assessment of:
– whether the accounting policies are appropriate to the Group’s and the Company’s circumstances and have been consistently applied and adequately disclosed;
– the reasonableness of significant accounting estimates made by the Directors; and – the overall presentation of the financial statements.
We primarily focus our work in these areas by assessing the Directors’ judgements against available evidence, forming our own judgements, and evaluating the disclosures in the financial statements.
We test and examine information, using sampling and other auditing techniques, to the extent we consider necessary to provide a reasonable basis for us to draw conclusions. We obtain audit evidence through testing the effectiveness of controls, substantive procedures or a combination of both.
In addition, we read all the financial and non-financial information in the Annual Report to identify material inconsistencies with the audited financial statements and to identify any information that is apparently materially incorrect based on, or materially inconsistent with, the knowledge acquired by us in the course of performing the audit. If we become aware of any apparent material misstatements or inconsistencies we consider the implications for our report. With respect to the Strategic Report, Directors’ Report and Corporate Governance Statement, we consider whether those reports include the disclosures required by applicable legal requirements.
Craig Hughes (Senior Statutory Auditor) for and on behalf of PricewaterhouseCoopers LLP Chartered Accountants and Statutory Auditors London 16 February 2017
– The maintenance and integrity of the SEGRO plc website is the responsibility of the Directors; the work carried out by the auditors does not involve consideration of these matters and, accordingly, the auditors accept no responsibility for any changes that may have occurred to the financial statements since they were initially presented on the website.
– Legislation in the United Kingdom governing the preparation and dissemination of financial statements may differ from legislation in other jurisdictions.
Financial Statements
Independent Auditor’s Report to the Members of SEGRO plc continued…
112SEGRO Annual Report and Accounts 2016

Notes2016
£m2015
£m
Revenue 4 283.5 248.5
Gross rental income 4 225.5 210.7
Property operating expenses 5 (44.9) (37.7)
Net rental income 180.6 173.0
Joint venture management fee income 4 18.6 17.0
Administration expenses 6 (31.4) (28.5)
Pension settlement costs 2 – (4.8)
Share of profit from joint ventures after tax 7 85.1 156.5
Realised and unrealised property gain 8 246.0 461.5
Other investment income 9 – 6.6
Goodwill and other amounts written off on acquisitions and amortisation of intangibles 10 (0.2) (3.8)
Operating profit 498.7 777.5
Finance income 11 46.7 43.4
Finance costs 11 (119.0) (134.4)
Profit before tax 426.4 686.5
Tax 12 (7.7) (3.7)
Profit after tax 418.7 682.8
Attributable to equity shareholders 417.7 682.5
Attributable to non-controlling interests 1.0 0.3
418.7 682.8
Earnings per share (pence)
Basic 14 53.9 91.7
Diluted 14 53.6 91.7
Group Statement of Comprehensive IncomeFor the year ended 31 December 2016
Notes2016
£m2015
£m
Profit for the year 418.7 682.8
Items that will not be reclassified subsequently to profit or loss
Actuarial gain on defined benefit pension schemes 21 15.0 17.9
15.0 17.9
Items that may be reclassified subsequently to profit or loss
Foreign exchange movement arising on translation of international operations 114.1 (22.3)
(Decrease)/increase in value of available-for-sale investments 16 (0.3) 0.1
Fair value movements on derivatives in effective hedge relationships (86.4) 17.9
27.4 (4.3)
Tax on components of other comprehensive income – –
Other comprehensive profit before transfers 42.4 13.6
Transfer to income statement of realised foreign exchange movements (2.0) –
Transfer to income statement on sale of available-for-sale investments 9 – (0.4)
Total comprehensive profit for the year 459.1 696.0
Attributable to equity shareholders 458.5 695.7
Attributable to non-controlling interests 0.6 0.3
Total comprehensive profit for the year 459.1 696.0
Group Income StatementFor the year ended 31 December 2016
113Financial Statements
Overview Strategic Report Governance

Notes
Group Company
2016 £m
2015 £m
2016 £m
2015 £m
Assets Non-current assets Goodwill and other intangibles 3.1 2.4 – –Investment properties 15 4,714.4 4,118.1 – –Other interests in property 9.6 – – –Plant and equipment 16.1 16.4 1.3 1.0Investments in subsidiaries 7 – – 5,391.1 4,041.8Investments in joint ventures 7 1,066.2 867.3 – –Available-for-sale investments 16 0.7 0.9 – –Derivative financial instruments 20 80.1 80.8 80.1 80.8Pension assets 21 45.7 20.2 45.7 20.2 5,935.9 5,106.1 5,518.2 4,143.8Current assets Trading properties 15 25.4 37.6 – –Trade and other receivables 17 102.8 97.8 4.5 2.8Derivative financial instruments 20 12.6 0.7 12.6 0.7Cash and cash equivalents 19 32.0 16.4 22.1 6.3Assets held for sale 15 – 305.9 – – 172.8 458.4 39.2 9.8Total assets 6,108.7 5,564.5 5,557.4 4,153.6Liabilities Non-current liabilities Borrowings 19 1,630.4 1,822.9 1,631.1 1,825.6Deferred tax liabilities 12 16.3 12.6 – –Trade and other payables 18 4.7 3.9 1,470.6 469.7Derivative financial instruments 20 14.7 1.1 14.7 1.1
1,666.1 1,840.5 3,116.4 2,296.4Current liabilities Trade and other payables 18 246.5 203.6 69.1 30.0Derivative financial instruments 20 11.1 24.6 11.1 24.6Tax liabilities 4.1 7.7 0.1 0.1 261.7 235.9 80.3 54.7Total liabilities 1,927.8 2,076.4 3,196.7 2,351.1Net assets 4,180.9 3,488.1 2,360.7 1,802.5Equity Share capital 22 83.0 74.8 83.0 74.8Share premium 23 1,431.1 1,091.4 1,431.1 1,091.4Capital redemption reserve 23 113.9 113.9 113.9 113.9Own shares held 24 (5.5) (6.3) (5.5) (6.3)Other reserves 196.2 165.8 220.5 218.8Retained earnings brought forward 2,050.3 1,467.3 309.9 611.2Profit/(loss) 417.7 682.5 312.7 (202.4)Other movements (104.6) (99.5) (104.9) (98.9)Retained earnings 2,363.4 2,050.3 517.7 309.9Total equity attributable to owners of the parent 4,182.1 3,489.9 2,360.7 1,802.5Non-controlling interests (1.2) (1.8) – –Total equity 4,180.9 3,488.1 2,360.7 1,802.5Net assets per ordinary share (pence) Basic 14 505 468 Diluted 14 502 468
The financial statements of SEGRO plc (registered number 167591) on pages 113 to 164 were approved by the Board of Directors and authorised for issue on 16 February 2017 and signed on its behalf by:
DJR Sleath S DasDirectors
Financial Statements
Balance SheetsAs at 31 December 2016
114SEGRO Annual Report and Accounts 2016

Statements of Changes in EquityFor the year ended 31 December 2016
Group
Balance 1 January
2016 £m
Exchange movement
£m
Retained profit
£m
Items taken
directlyto reserves3
£m
Shares issued
£mOther
£mDividends
£mTransfers
£m
Balance 31 December
2016 £m
Ordinary share capital 74.8 – – – 7.5 – 0.7 – 83.0
Share premium 1,091.4 – – – 310.9 – 28.8 – 1,431.1
Capital redemption reserve4 113.9 – – – – – – – 113.9
Own shares held (6.3) – – – – (2.3) – 3.1 (5.5)
Other reserves:
Share-based payments reserve 8.5 – – – – 7.0 – (2.0) 13.5
Fair value reserve for AFS1 0.1 – – (0.3) – – – – (0.2)
Translation, hedging and other reserves (11.9) 114.1 – (86.4) – (2.0) – – 13.8
Merger reserve4 169.1 – – – – – – – 169.1
Total other reserves 165.8 114.1 – (86.7) – 5.0 – (2.0) 196.2
Retained earnings 2,050.3 – 417.7 15.0 – – (118.5) (1.1) 2,363.4
Total equity attributable to owners of the parent 3,489.9 114.1 417.7 (71.7) 318.4 2.7 (89.0) – 4,182.1
Non-controlling interests2 (1.8) (0.4) 1.0 – – – – – (1.2)
Total equity 3,488.1 113.7 418.7 (71.7) 318.4 2.7 (89.0) – 4,180.9
For the year ended 31 December 2015
Group
Balance 1 January
2015 £m
Exchange movement
£m
Retained profit
£m
Items taken
directlyto reserves3
£m
Shares issued
£mOther
£mDividends
£mTransfers
£m
Balance 31 December
2015 £m
Ordinary share capital 74.2 – – – 0.1 – 0.5 – 74.8
Share premium 1,070.0 – – – 0.3 – 21.1 – 1,091.4
Capital redemption reserve4 113.9 – – – – – – – 113.9
Own shares held (6.1) – – – – (6.7) – 6.5 (6.3)
Other reserves:
Share-based payments reserve 7.5 – – – – 3.2 – (2.2) 8.5
Fair value reserve for AFS1 0.4 – – 0.1 – (0.4) – – 0.1
Translation, hedging and other reserves (7.5) (22.3) – 17.9 – – – – (11.9)
Merger reserve4 169.1 – – – – – – – 169.1
Total other reserves 169.5 (22.3) – 18.0 – 2.8 – (2.2) 165.8
Retained earnings 1,467.3 – 682.5 17.9 – – (113.1) (4.3) 2,050.3
Total equity attributable to owners of the parent 2,888.8 (22.3) 682.5 35.9 0.4 (3.9) (91.5) – 3,489.9
Non-controlling interests2 – – 0.3 – – (2.1) – – (1.8)
Total equity 2,888.8 (22.3) 682.8 35.9 0.4 (6.0) (91.5) – 3,488.1
1 AFS is the term used for ‘Available-for-sale investments’ and is shown net of deferred tax.
2 Non-controlling interests relate to Vailog S.r.l. (see Note 29(iii)).
3 Recognised in Other Comprehensive Income.
4 See Note 23.
115Financial Statements
Overview Strategic Report Governance
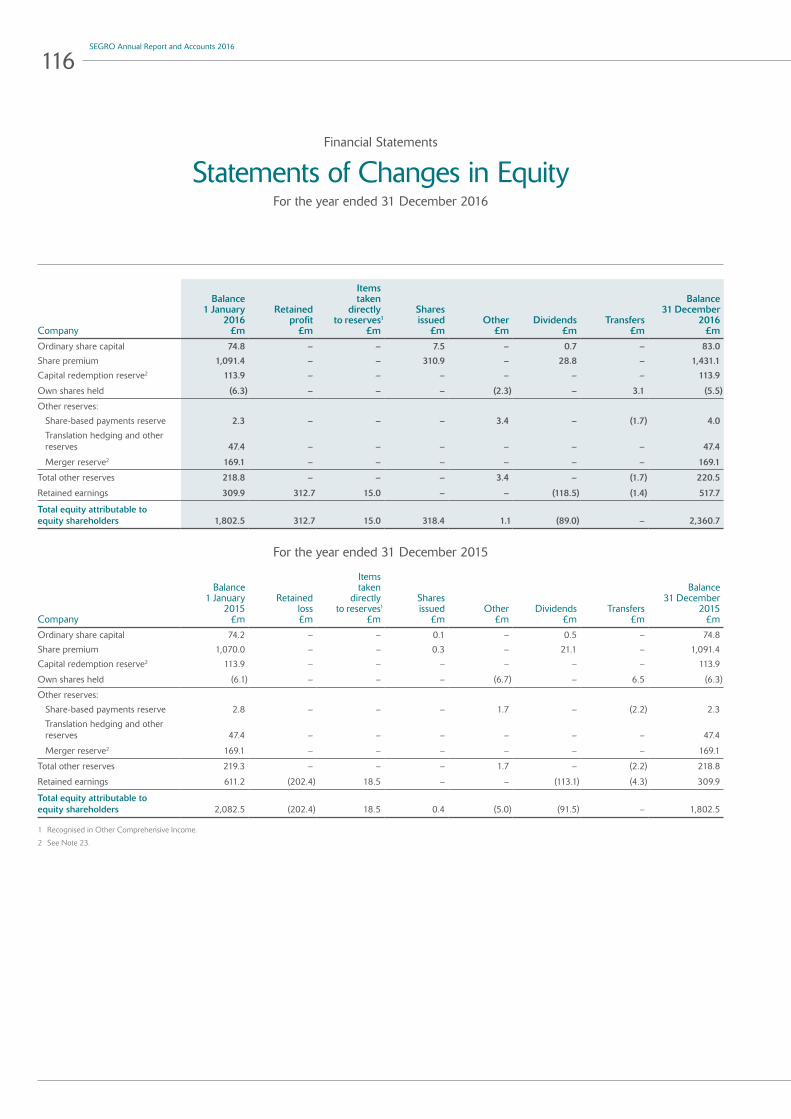
Company
Balance 1 January
2016 £m
Retained profit
£m
Items taken
directlyto reserves1
£m
Shares issued
£mOther
£mDividends
£mTransfers
£m
Balance 31 December
2016 £m
Ordinary share capital 74.8 – – 7.5 – 0.7 – 83.0
Share premium 1,091.4 – – 310.9 – 28.8 – 1,431.1
Capital redemption reserve2 113.9 – – – – – – 113.9
Own shares held (6.3) – – – (2.3) – 3.1 (5.5)
Other reserves:
Share-based payments reserve 2.3 – – – 3.4 – (1.7) 4.0
Translation hedging and other reserves 47.4 – – – – – – 47.4
Merger reserve2 169.1 – – – – – – 169.1
Total other reserves 218.8 – – – 3.4 – (1.7) 220.5
Retained earnings 309.9 312.7 15.0 – – (118.5) (1.4) 517.7
Total equity attributable to equity shareholders 1,802.5 312.7 15.0 318.4 1.1 (89.0) – 2,360.7
For the year ended 31 December 2015
Company
Balance 1 January
2015 £m
Retained loss £m
Items taken
directlyto reserves1
£m
Shares issued
£mOther
£mDividends
£mTransfers
£m
Balance 31 December
2015 £m
Ordinary share capital 74.2 – – 0.1 – 0.5 – 74.8
Share premium 1,070.0 – – 0.3 – 21.1 – 1,091.4
Capital redemption reserve2 113.9 – – – – – – 113.9
Own shares held (6.1) – – – (6.7) – 6.5 (6.3)
Other reserves:
Share-based payments reserve 2.8 – – – 1.7 – (2.2) 2.3
Translation hedging and other reserves 47.4 – – – – – – 47.4
Merger reserve2 169.1 – – – – – – 169.1
Total other reserves 219.3 – – – 1.7 – (2.2) 218.8
Retained earnings 611.2 (202.4) 18.5 – – (113.1) (4.3) 309.9
Total equity attributable to equity shareholders 2,082.5 (202.4) 18.5 0.4 (5.0) (91.5) – 1,802.5
1 Recognised in Other Comprehensive Income.
2 See Note 23.
Financial Statements
Statements of Changes in EquityFor the year ended 31 December 2016
116SEGRO Annual Report and Accounts 2016

Cash Flow StatementsFor the year ended 31 December 2016
Notes
Group Company
2016 £m
2015 £m
2016 £m
2015 £m
Cash flows from operating activities 29 156.7 123.9 (26.7) (30.6)
Interest received 69.8 87.0 128.0 188.1
Dividends received 26.5 20.8 232.1 258.6
Interest paid (140.9) (152.1) (122.8) (184.1)
Early close out of interest rate swaps – (24.8) – (24.8)
Tax (paid)/received (10.9) 34.5 – –
Acquisition of Vailog 29 – (1.6) – –
Net cash received from operating activities 101.2 87.7 210.6 207.2
Cash flows from investing activities
Purchase and development of investment properties (429.7) (470.8) – –
Sale of investment properties 614.0 226.3 – –
Acquisition of other interest in property (36.7) – –
Purchase of plant and equipment and intangibles (3.5) (2.1) (0.4) –
Sale of available-for-sale investments – 11.4 – –
Investment in subsidiary undertakings – – (46.6) (51.6)
Divestment in subsidiary undertakings – – 48.2 3.4
Loan advances paid to subsidiary undertakings – – (29.8) (279.5)
Acquisition of Big Box 7 – 2.6 – –
Acquisition of Vailog 29 – (24.8) – –
Sale of SELP portfolio – 119.9 – –
Investment in joint ventures (184.3) (28.0) – –
Divestment in joint ventures 120.9 – – –
Net cash generated from/(used in) investing activities 80.7 (165.5) (28.6) (327.7)
Cash flows from financing activities
Dividends paid to ordinary shareholders (89.0) (91.5) (89.0) (91.5)
Increase in borrowings 42.5 320.5 42.5 320.8
Decrease in borrowings (267.7) (208.3) (267.4) (208.3)
Close out of Vailog debt 29 – (44.8) – –
Net settlement of foreign exchange derivatives (168.4) 101.1 (168.4) 101.1
Proceeds from issue of ordinary shares 318.4 0.4 318.4 0.4
Purchase of ordinary shares (2.3) (6.7) (2.3) (6.7)
Net cash (used in)/generated from financing activities (166.5) 70.7 (166.2) 115.8
Net increase/(decrease) in cash and cash equivalents 15.4 (7.1) 15.8 (4.7)
Cash and cash equivalents at the beginning of the year 16.4 23.8 6.3 11.0
Effect of foreign exchange rate changes 0.2 (0.3) – –
Cash and cash equivalents at the end of the year 19 32.0 16.4 22.1 6.3
117Financial Statements
Overview Strategic Report Governance

Financial Statements
Notes to the Financial StatementsFor the year ended 31 December 2016
1. Significant accounting policiesGeneral informationSEGRO plc (the Company) is a company incorporated in the United Kingdom under the Companies Act. The address of the registered office is given on the inside back cover.
The principal activities of the Company and its subsidiaries (the Group) and the nature of the Group’s operations are set out in the Strategic Report on pages 16 to 17.
These financial statements are presented in pounds sterling because that is the currency of the primary economic environment in which the Group operates (i.e. the functional currency).
Basis of preparationThe financial statements have been prepared in accordance with EU Endorsed International Financial Reporting Standards (IFRS), IFRS Interpretations Committee (IFRS IC), and the Companies Act 2006 applicable to companies reporting under IFRS. The Group’s financial statements also comply with Article 4 of the EU IAS Regulations. In addition, the Group has also disclosed additional measures relating to the Best Practice Recommendations Guidelines issued by the European Public Real Estate Association (EPRA) as appropriate, as discussed further in Note 2.
The financial statements have been prepared on a going concern basis. This is discussed in the Financial Review on page 53.
The Directors have taken advantage of the exemption offered by section 408 of the Companies Act 2006 not to present a separate income statement and statement of comprehensive income for the Company. The financial statements have been prepared under the historical cost convention as modified by the revaluation of properties, available-for-sale investments and certain financial assets and liabilities including derivatives.
In the current year, the Group has applied a number of amendments to IFRSs and a new Interpretation issued by the International Accounting Standards Board (IASB) that are mandatorily effective for an accounting period that begins on or after 1 January 2016. Their adoption has not had any material impact on the disclosures or on the amounts reported in these financial statements.
The following standards and amendments have been adopted by the Group and the Company for the first time for the financial year beginning on 1 January 2016:
– Amendments to IFRS 10, IFRS 12 and IAS 28: Investment Entities – Applying the Consolidation Exception – Amendments to IAS 27: Equity Method in Separate Financial Statements – Amendments to IAS 1: Disclosure Initiative – Annual Improvements to IFRSs 2012–2014 Cycle – Amendments to IAS 16 and IAS 38: Clarification of Acceptable Methods of Depreciation and Amortisation – Amendments to IFRS 11: Accounting for Acquisitions of Interests in Joint Operations – Amendments to IAS 16 and IAS 41: Bearer Plants – Amendments to IAS 19: Defined Benefit Plans: Employee Contributions – Annual Improvements to IFRSs 2010–2012 Cycle
The adoption of these amendments did not have any impact on the financial statements of the Group or the Company for the current period or any prior period and is not likely to affect future periods.
A number of new standards and amendments to standards and interpretations are effective for annual periods beginning after 1 January 2016, and have not been applied in preparing these financial statements:
– Amendments to IAS 7, ‘Statement of cash flows’ on disclosure initiative – Amendments to IAS 12, ‘Income taxes’ on Recognition of deferred tax assets for unrealised losses – Amendments to IFRS 2, ‘Share-based payments’, on clarifying how to account for certain types of share-based payment transactions – IFRS 9 ‘Financial instruments’ – IFRS 15 ‘Revenue from contracts with customers’ – Amendment to IFRS 15, ‘Revenue from contracts with customers’ – IFRS 16 ‘Leases’ – Amendments to IFRS 4, ‘Insurance contracts’ regarding the implementation of IFRS 9, ‘Financial instruments’ – Amendment to IAS 40, ‘Investment property’ relating to transfers of investment property – Annual improvements 2014–2016 – IFRIC 22 ‘Foreign currency transactions and advance consideration’
118SEGRO Annual Report and Accounts 2016
1. Significant accounting policies continuedNone of these is expected to have a significant effect on the financial statements of the Group or Company. Certain Standards which might have an impact are discussed below.
IAS 12, ‘Income taxes’ was amended to clarify the accounting for deferred tax where an asset is measured at fair value and that fair value is below the asset’s tax base. Specifically, the amendments confirm that: (i) a temporary difference exists whenever the carrying amount of an asset is less than its tax base at the end of the reporting period; (ii) an entity can assume that it will recover an amount higher than the carrying amount of an asset to estimate its future taxable profit; (iii) where the tax law restricts the source of taxable profits against which particular types of deferred tax assets can be recovered, the recoverability of the deferred tax assets can only be assessed in combination with other deferred tax assets of the same type; and, (iv) tax deductions resulting from the reversal of deferred tax assets are excluded from the estimated future taxable profit that is used to evaluate the recoverability of those assets. This amendment is effective for annual periods beginning on or after 1 January 2017, however, is subject to endorsement by the EU. At present the Group does not expect the amendment to have a material impact on its financial statements since it only arises where cost exceeds fair value for investment properties and even then assets are typically not recognised due to uncertainty over the reversal of such amounts. The Group is monitoring fair value movements below cost to assess the impact of the amendment in future periods.
IFRS 9, ‘Financial instruments’, addresses the classification, measurement and recognition of financial assets and financial liabilities. The complete version of IFRS 9 was issued in July 2014. It replaces the guidance in IAS 39 that relates to the classification and measurement of financial instruments. IFRS 9 retains but simplifies the mixed measurement model and establishes three primary measurement categories for financial assets: amortised cost, fair value through OCI and fair value through the Income Statement. The basis of classification depends on the entity’s business model and the contractual cash flow characteristics of the financial asset. Investments in equity instruments are required to be measured at fair value through profit or loss with the irrevocable option at inception to present changes in fair value in OCI with no recycling. There is now a new expected credit losses model that replaces the incurred loss impairment model used in IAS 39. For financial liabilities, there were no changes to classification and measurement except for the recognition of changes in a company’s own credit risk in other comprehensive income, for liabilities designated at fair value through profit or loss. IFRS 9 relaxes the requirements for hedge effectiveness by replacing the bright line hedge effectiveness tests. It requires an economic relationship between the hedged item and hedging instrument and for the ‘hedged ratio’ to be the same as the one management actually uses for risk management purposes. Contemporaneous documentation is still required but is different to that currently prepared under IAS 39. The standard is effective for accounting periods beginning on or after 1 January 2018. Early adoption is permitted. At present the Group expects IFRS 9 to have an immaterial impact on the accounting for available-for-sale financial assets and derivatives, and an immaterial impact from the implementation of the expected loss model.
IFRS 15, ‘Revenue from contracts with customers’ deals with revenue recognition and establishes principles for reporting useful information to users of financial statements about the nature, amount, timing and uncertainty of revenue and cash flows arising from an entity’s contracts with customers. Revenue is recognised when a customer obtains control of a good or service and thus has the ability to direct the use and obtain the benefits from the good or service. The standard replaces IAS 18, ‘Revenue’ and IAS 11, ‘Construction contracts’ and related interpretations. The standard is effective for annual periods beginning on or after 1 January 2018 and earlier application is permitted. At present the Group expects IFRS 15 to have an immaterial impact on the provision of services and management income that fall under the scope of IFRS 15.
IFRS 16, ‘Leases’ was issued in January 2016. For lessees, it will result in almost all leases being recognised on the statement of financial position, as the distinction between operating and finance leases will be removed. Under the new standard, an asset (the right to use the leased item) and a financial liability to pay rentals are recognised. The only exceptions are short-term and low-value leases. The accounting for lessors will not significantly change. The standard is effective for annual periods beginning on or after 1 January 2019 and earlier application is permitted, subject to EU endorsement. At present the Group expects IFRS 16 to have an immaterial impact on its current accounting practices.
There are no other IFRSs or IFRS IC interpretations that are not yet effective that would be expected to have a material impact on the Group or the Company.
Basis of consolidationThe consolidated financial statements comprise the financial statements of the Company and the Group, plus the Group’s share of the results and net assets of the joint ventures. The Company holds investments in subsidiaries and joint ventures at cost less accumulated impairment losses. A joint venture is a contract under which the Group and other parties undertake an activity or invest in an entity, under joint control. The Group uses equity accounting for such entities, carrying its investment at cost plus the movement in the Group’s share of net assets after acquisition, less impairment.
Business combinationsThe acquisition of subsidiaries is accounted for using the acquisition method. The cost of the acquisition is measured at the aggregate of the fair values of assets given, liabilities incurred or assumed, and equity instruments issued by the Group in exchange for control of the acquiree. Acquisition related costs are recognised in the Income Statement as incurred. The acquiree’s identifiable assets, liabilities and contingent liabilities that meet the conditions for recognition under IFRS 3 are recognised at their fair value at the acquisition date, except for non-current assets (or disposal groups) that are classified as held for sale in accordance with IFRS 5 Non-Current Assets Held for Sale and Discontinued Operations, which are recognised and measured at fair value less costs to sell.
119Financial Statements
Overview Strategic Report Governance

Financial Statements
Notes to the Financial Statements continued…For the year ended 31 December 2016
1. Significant accounting policies continuedGoodwill arising on acquisition is recognised as an asset measured at cost, being the excess of the cost of the business combination over the Group’s interest in the net fair value of the identifiable assets, liabilities and contingent liabilities recognised. If, after reassessment, the Group’s interest in the net fair value of the acquiree’s identifiable assets, liabilities and contingent liabilities exceeds the cost of the business combination, the excess is recognised immediately in the Income Statement.
The interest of non-controlling interest shareholders in the acquiree is initially measured at their proportion of the net fair value of the assets, liabilities and contingent liabilities recognised.
When the consideration transferred by the Group in a business combination includes a contingent consideration arrangement, the contingent consideration is measured as its acquisition-date fair value. Changes in fair value of the contingent consideration that qualify as measurement period adjustments are adjusted retrospectively, with corresponding adjustments against goodwill. Measurement period adjustments are adjustments that arise from additional information obtained during the ‘measurement period’ (which cannot exceed one year from the acquisition date) about facts and circumstances that existed at the acquisition date.
Contingent consideration that is classified as an asset or a liability is re-measured at subsequent reporting dates in accordance with IAS 39, as appropriate, with the corresponding gain or loss being recognised in the Group Income Statement.
Foreign currency transactionsForeign currency transactions are translated into sterling at the exchange rates ruling on the transaction date. Foreign exchange gains and losses resulting from settling these, or from retranslating monetary assets and liabilities held in foreign currencies, are booked in the Group Income Statement. The exception is for foreign currency loans and derivatives that hedge investments in foreign subsidiaries, where exchange differences are booked in equity until the investment is realised.
Consolidation of foreign entitiesAssets and liabilities of foreign entities are translated into sterling at exchange rates ruling at the Balance Sheet date. Their income, expenses and cash flows are translated at the average rate for the period or at spot rate for significant items. Resultant exchange differences are booked in reserves and recognised in the Income Statement when the operation is sold.
The principal exchange rates used to translate foreign currency denominated amounts in 2016 are:
Balance Sheet: £1 = €1.17 (31 December 2015: £1 = €1.36). Income Statement: £1 = €1.22 (2015: £1 = €1.38)
Investment propertiesThese properties include completed properties that are generating rent or are available for rent, and development properties that are under development or available for development. Investment properties comprise freehold and leasehold properties and are first measured at cost (including transaction costs), then revalued to market value at each reporting date by independent professional valuers. Leasehold properties are shown gross of the leasehold payables (which are accounted for as finance lease obligations). Valuation gains and losses in a period are taken to the Income Statement. As the Group uses the fair value model, as per IAS 40 Investment Properties, no depreciation is provided. An asset will be classified as held for sale within investment properties, in line with IFRS 5 Non-Current Assets Held for Sale and Discontinued Operations, where there is Board approval at the year-end date and the asset is expected to be disposed of within 12 months of the balance sheet date.
Other interests in propertyOther interests in property include the cost and related fees in respect of land options, which are initially capitalised and regularly tested for impairment. The impairment review includes consideration of the resale value of the option and likelihood of achieving planning consent.
Trading propertiesThese are properties being developed for sale or being held for sale after development is complete, and are shown at the lower of cost and net realisable value. Cost includes direct expenditure and capitalised interest.
Trading properties are transferred to investment properties when there is a change in use evidenced by the commencement of an operating lease to another party, together with the intention to hold the property to generate rent, or for capital appreciation, or for both.
Property acquisitions and disposalsProperties are treated as acquired at the point when the Group assumes the significant risks and rewards of ownership and as disposed when these are transferred to the buyer. Generally this would occur on completion of contract. Any gains or loss arising on de-recognition of the property (calculated as the difference between the net disposal proceeds and the carrying amount of the asset) is included in profit or loss in the period in which the property is derecognised.
LeasesLeases where substantially all of the risks and rewards of ownership are transferred to the lessee are classified as finance leases. All others are deemed operating leases. Under operating leases, properties leased to tenants are accounted for as investment properties. In cases where only the buildings part of a property lease qualifies as a finance lease, the land is shown as an investment property.
120SEGRO Annual Report and Accounts 2016
RevenueRevenue includes gross rental income, joint venture management fee income, income from service charges and proceeds from the sale of trading properties. Joint venture management fee income is recognised as income in the period to which it relates.
Rental incomeRental income from properties let as operating leases are recognised on a straight-line basis over the lease term. Lease incentives and initial costs to arrange leases are capitalised, then amortised on a straight-line basis over the lease term (‘rent averaging’). Surrender premiums received in the period are included in rental income.
Service charges and other recoveries from tenantsThese include income in relation to service charges, directly recoverable expenditure and management fees. Revenue from services is recognised by reference to the state of completion of the relevant services provided at the reporting date. Where the Group acts as an agent, service charge income is netted against the relevant property operating expenses.
Plant and equipmentPlant and equipment is stated at historic cost less depreciation. Cost includes purchase price and any directly attributable costs.
DepreciationDepreciation is recognised so as to write off the cost or valuation of assets (other than investment properties) less their residual values, using the straight-line method, on the following bases:
Plant and equipment 20% per annum
Software 33% per annum
Solar panels 5% per annum
The estimated useful lives, residual values and depreciation method are reviewed at the end of each reporting period, with the effect of any changes in estimate accounted for on a prospective basis.
Financial instrumentsBorrowingsBorrowings are recognised initially at fair value less attributable transaction costs. Subsequent to initial recognition, borrowings are stated at amortised cost with any difference between the amount initially recognised and the redemption value being recognised in the Income Statement over the period of the borrowings, using the effective interest rate method.
Gross borrowing costs relating to direct expenditure on properties under development or undergoing major refurbishment are capitalised. The interest capitalised is calculated using the Group’s weighted average cost of borrowing for the relevant currency. Interest is capitalised as from the commencement of the development work until the date of practical completion. The capitalisation of finance costs is suspended if there are prolonged periods when development activity is interrupted.
Derivative financial instrumentsThe Group uses derivatives (principally interest rate swaps, currency swaps and forward foreign exchange contracts) in managing interest rate risk and currency risk, and does not use them for trading. They are recorded, and subsequently revalued, at fair value, with revaluation gains or losses being immediately taken to the Income Statement. The exception is for derivatives qualifying as hedges, when the treatment of the gain/loss depends upon the item being hedged, and may go to other comprehensive income.
Derivatives with a maturity of less than 12 months or that expect to be settled within 12 months of the Balance Sheet date are presented as current assets or liabilities. Other derivatives are presented as non-current assets or liabilities.
Trade and other receivables and payablesTrade and other receivables are booked at fair value and subsequently measured at amortised cost using the effective interest method. An impairment provision is created for receivables where there is objective evidence that the Group will not be able to collect in full. Trade and other payables are initially measured at fair value, net of transaction costs and subsequently measured at amortised costs using the effective interest method.
Available-for-sale (AFS) investmentsAFS investments are initially measured at cost, and then revalued to fair value. Gains and losses arising from valuation are taken to equity, and then recycled through the Income Statement on realisation. If there is objective evidence that the asset is impaired, any cumulative loss recognised in equity is removed from equity and recognised in the Income Statement within other investment income.
121Financial Statements
Overview Strategic Report Governance

Financial Statements
Notes to the Financial Statements continued…For the year ended 31 December 2016
1. Significant accounting policies continuedPensions – Defined benefit schemesThe schemes’ assets are measured at fair value, their obligations are calculated at discounted present value, and any net surplus or deficit is recognised in the Balance Sheet. Operating and financing costs are charged to the Income Statement, with service costs spread systematically over employees’ working lives, and financing costs expensed in the period in which they arise. Actuarial gains and losses are recognised in the Statement of Comprehensive Income. Where the actuarial valuation of the scheme demonstrates that the scheme is in surplus, the recognisable asset is limited to that for which the Group can benefit in the future either through a cash refund or reduction in future payments is available. Professional actuaries are used in relation to defined benefit schemes and the assumptions made are outlined in Note 21.
Share-based paymentsThe cost of granting share options and other share-based remuneration is recognised in the Income Statement at their fair value at grant date. They are expensed straight-line over the vesting period, based on estimates of the shares or options that will eventually vest. Charges are reversed if it appears that non-market-based performance conditions will not be met.
The fair value excludes the effect of non-market-based vesting conditions.
At each Balance Sheet Date, the Group revises its estimate of the number of equity instruments expected to vest as a result of the effect of non-market-based vesting conditions. The impact of the revision of the original estimates, if any, is recognised in profit or loss such that the cumulative expense reflects the revised estimate, with a corresponding adjustment to equity reserves.
Income taxIncome tax on the profit for the year comprises current and deferred tax. Current tax is the tax payable on the taxable income for the year and any adjustment in respect of previous years. Deferred tax is provided in full using the Balance Sheet liability method on temporary differences between the carrying amounts of assets and liabilities for financial reporting purposes and the amounts used for taxation purposes. Deferred tax is determined using tax rates that have been enacted or substantively enacted by the reporting date and are expected to apply when the asset is realised or the liability is settled.
No provision is made for temporary differences (i) arising on the initial recognition of assets or liabilities, other than a business combination, that affect neither accounting nor taxable profit and (ii) relating to investments in subsidiaries to the extent that they will not reverse in the foreseeable future.
Deferred tax assets are recognised to the extent that it is probable that suitable taxable profits will be available against which deductible temporary differences can be utilised.
Critical accounting judgements and key sources of estimation uncertaintyIn the application of the Group’s accounting policies, the Directors are required to make judgements, estimates and assumptions about the carrying amount of assets and liabilities that are not readily apparent from other sources. The estimates and associated assumptions are based on historical experience and other factors that are considered to be relevant. Actual results may differ from these estimates. The estimates and underlying assumptions are reviewed on an ongoing basis. Revisions to accounting estimates are recognised in the period in which the estimate is revised if the revision affects only that period, or in the period of the revisions and future periods if the revision affects both current and future periods.
Significant areas of estimation uncertainty:Property valuationsValuation of property is a central component of the business. In estimating the fair value, the Group engages third party qualified valuers to perform the valuation. Information about the valuation techniques and inputs used in determining the fair value of the property portfolio is disclosed in Note 30 property valuation techniques and related quantitative information.
Significant areas of judgements in applying the Group’s accounting policies:Accounting for significant acquisitions, disposals and investmentsProperty transactions are complex in nature. Management consider each material transaction separately with an assessment carried out to determine the most appropriate accounting treatment and judgements applied, including whether the transaction represents an asset acquisition or business combination.
Revenue recognitionIn making its judgement over revenue recognition for cut-off for property transactions, management considered the detailed criteria for the recognition of revenue set out in IAS 18 Revenue and, in particular, whether the Group had transferred to the buyer the significant risks and rewards of ownership of the assets disposed. Management also consider the appropriate accounting treatment of tenant lease incentives.
Other less significant judgements and sources of uncertainty relate to estimating the fair value of financial instruments, provisioning and the actuarial assumptions used in calculating the Group’s retirement benefit obligations.
122SEGRO Annual Report and Accounts 2016

2. Adjusted profitAdjusted profit is a non-GAAP measure and is the Group’s measure of underlying profit, which is used by the Board and senior management to measure and monitor the Group’s income performance.
It is based on the Best Practices Recommendations Guidelines of European Public Real Estate Association (EPRA), which calculate profit excluding investment and development property revaluations and gains or losses on disposals. Changes in the fair value of financial instruments and associated close-out costs and their related taxation, as well as other permitted one-off items, are also excluded. Refer to the Supplementary Notes for all EPRA adjustments.
The Directors may also exclude from the EPRA profit measure additional items (gains and losses) which are considered by them to be non-recurring, unusual or significant by virtue of size and nature. In the period to 31 December 2015, £4.8 million of pension settlement costs incurred in rationalising pension schemes, primarily the buying out of the Bilton Group Pension Scheme, were excluded from the calculation of Adjusted profit. There is no tax effect of this item in the period to 31 December 2015. No non-EPRA adjustments to underlying profit were made in 2016.
2016
£m2015
£m
Gross rental income 225.5 210.7
Property operating expenses (44.9) (37.7)
Net rental income 180.6 173.0
Joint venture management fee income 18.6 17.0
Administration expenses (31.4) (28.5)
Share of joint ventures’ Adjusted profit after tax1 55.4 44.4
Adjusted operating profit before interest and tax 223.2 205.9
Net finance costs (including adjustments) (68.7) (67.3)
Adjusted profit before tax 154.5 138.6
Adjustments to reconcile to IFRS:
Adjustments to the share of profit from joint ventures after tax1 29.7 112.1
Profit on sale of investment properties 16.4 23.0
Valuation surplus on investment properties 231.3 439.8
Gain/(loss) on sale of trading properties 0.3 (0.1)
Increase in provision for impairment of trading properties (2.0) (1.2)
Other investment income – 6.6
Goodwill and other amounts written off on acquisitions and amortisation of intangibles (0.2) (3.8)
Cost of early close out of bank debt (1.0) –
Net fair value loss on interest rate swaps and other derivatives (2.6) (23.7)
Pension settlement costs2 – (4.8)
Total adjustments 271.9 547.9
Profit before tax 426.4 686.5
Tax
On Adjusted profit (1.8) (1.3)
In respect of adjustments (5.9) (2.4)
(7.7) (3.7)
Profit after tax before non-controlling interests 418.7 682.8
Non-controlling interests:
Less: share of adjusted profit attributable to non-controlling interests (0.1) –
: share of adjustments attributable to non-controlling interests (0.9) (0.3)
Profit after tax and non-controlling interests 417.7 682.5
Of which:
Adjusted profit after tax and non-controlling interests 152.6 137.3
Total adjustments after tax and non-controlling interests 265.1 545.2
Profit attributable to equity shareholders 417.7 682.5
1 A detailed breakdown of the adjustments to the share of profit from joint ventures is included in Note 7.
2 Non-EPRA related adjustment referred to in third paragraph above.
123Financial Statements
Overview Strategic Report Governance

Financial Statements
Notes to the Financial Statements continued…For the year ended 31 December 2016
3. Segmental analysis The Group’s reportable segments are the geographical Business Units, Greater London, Thames Valley and National Logistics, Northern Europe (principally Germany), Southern Europe (principally France) and Central Europe (principally Poland), which are managed and reported to the Board as separate distinct Business Units.
31 December 2016
Gross rental
income £m
Net rental
income £m
Share of joint ventures’
adjusted profit £m
Adjusted PBIT £m
Total directly owned
property assets
£m
Investments injoint ventures2
£m
Capitalexpenditure2
£m
Greater London 76.7 67.5 14.5 88.5 1,777.5 363.4 28.6
Thames Valley and National Logistics 95.6 88.7 (0.1) 88.5 1,991.7 12.6 230.2
Northern Europe 25.0 17.5 16.5 36.5 378.8 396.9 88.4
Southern Europe 22.9 15.5 12.6 28.9 474.6 222.3 179.5
Central Europe 5.3 2.9 13.2 19.1 117.2 319.5 10.3
Other1 – (11.5) (1.3) (38.3) – (248.5) 0.8
Total 225.5 180.6 55.4 223.2 4,739.8 1,066.2 537.8
31 December 2015
Gross rental
income £m
Net rental
income £m
Share of joint ventures’
adjusted profit £m
Adjusted PBIT £m
Total directly owned
property assets
£m
Investments in joint ventures
£m
Capitalexpenditure2
£m
Greater London 67.8 62.3 12.6 82.8 1,680.8 341.2 325.2
Thames Valley and National Logistics 102.0 94.5 – 94.4 2,011.1 5.2 168.3
Northern Europe 15.3 9.8 11.8 22.8 337.6 214.8 131.7
Southern Europe 20.3 14.3 9.4 24.3 320.9 126.6 124.0
Central Europe 5.3 3.1 11.2 16.5 111.2 174.3 15.5
Other1 – (11.0) (0.6) (34.9) – 5.2 1.1
Total 210.7 173.0 44.4 205.9 4,461.6 867.3 765.8
1 Other includes the corporate centre, SELP holding companies and costs relating to the operational business which are not specifically allocated to a geographical business unit. This includes the bond issued and revolving credit facility both held by SELP Finance SARL, a Luxembourg entity, during 2016. This replaced debt held by SELP entities within in the business units.
2 Capital expenditure includes additions and acquisitions of investment and trading properties but does not include tenant incentives, letting fees and rental guarantees. The ‘Other’ category includes non-property related spend, primarily IT.
Revenues from the most significant countries within the Group were UK £185.8 million (2015: £185.2 million), France £30.4 million (2015: £22.6 million), Germany £26.8 million (2015: £17.7 million) and Poland £10.9 million (2015: £9.7 million).
124SEGRO Annual Report and Accounts 2016

4. Revenue
2016
£m2015
£m
Rental income from investment properties 210.6 197.6
Rental income from trading properties 1.8 4.1
Rent averaging 11.8 7.2
Management fees 1.2 1.0
Surrender premiums 0.1 0.8
Gross rental income 225.5 210.7
Joint venture management fee income – property management fees 17.7 13.8
– performance and other fees 0.9 3.2
Service charge income 19.4 17.1
Proceeds from sale of trading properties 20.0 3.7
Total revenue 283.5 248.5
5. Property operating expenses
2016
£m2015
£m
Vacant property costs 5.6 3.4
Letting, marketing, legal and professional fees 7.9 7.2
Bad debt expense 0.2 0.6
Other expenses, net of service charge income 9.8 8.3
Property management expenses 23.5 19.5
Property administration expenses1 25.0 20.9
Costs capitalised2 (3.6) (2.7)
Total property operating expenses 44.9 37.7
1 Property administration expenses predominantly relate to the employee staff costs of personnel directly involved in managing the property portfolio.
2 Costs capitalised relate to internal employee staff costs directly involved in developing the property portfolio.
6. Administration expenses6(i) – Total administration expenses
2016
£m2015
£m
Directors’ remuneration 7.6 5.0
Depreciation 3.1 3.3
Other administration expenses 20.7 20.2
Total administration expenses 31.4 28.5
The full 2016 depreciation charge, including amounts charged under other headings, is £3.1 million (2015: £3.5 million), and relates to assets owned by the Group. Other administration expenses include the cost of services of the Group’s auditor, as described overleaf.
125Financial Statements
Overview Strategic Report Governance

Financial Statements
Notes to the Financial Statements continued…For the year ended 31 December 2016
6. Administration expenses continued6(ii) – Fees in relation to services provided by the Group’s auditor
2016
£m2015
£m
Audit services:
Parent company 0.3 0.4
Subsidiary undertakings 0.3 0.3
Total audit fees 0.6 0.7
Audit related assurance services 0.1 –
Audit and audited related assurance services 0.7 0.7
Other fees:
Taxation – compliance services – –
Other1 – 0.2
Total other fees – 0.2
Total fees in relation to audit and other services 0.7 0.9
1 Other services principally relate to those provided by Deloitte Real Estate.
As discussed further in the Audit Committee Reports, the Group’s Auditor changed from Deloitte LLP to PricewaterhouseCoopers LLP for the current financial year. Accordingly the current year disclosures relate to PricewaterhouseCoopers LLP whereas the comparatives relate to Deloitte LLP.
In addition to the above the Group’s auditor was paid £475,000 being £367,000 in respect of the audit of SEGRO European Logistics Partnership (SELP) for the year ended 31 December 2016 (2015: £152,000), £48,000 in respect of the audit of Airport Property Partnership (APP) joint venture for the year ended 31 December 2016 (2015: £48,000), £30,000 in respect of the audit of the Group’s associated pension scheme (2015: £nil), £30,000 of other fees in respect of SELP (2015: £21,000) and £nil (2015: £53,000) of other fees in respect of APP.
An audit fee of £26,000 was due to the Group’s auditor in respect of the audit of the Heathrow Big Box Industrial and Distribution Fund joint venture for the year ended 31 December 2015. The Heathrow Big Box Industrial and Distribution Fund is now wholly owned and the audit fee for the year ended 31 December 2016 is included in the above table.
6(iii) – Staff costsThe table below presents staff costs which are recognised in both property operating expenses and administration expenses in the Income Statement.
2016
£m2015
£m
Wages and salaries 28.3 24.7
Social security costs 4.6 4.1
Pension costs1 1.6 1.9
Share scheme costs 6.1 2.3
Termination benefits 0.4 0.2
Total 41.0 33.2
Average number of Group employees 285 270
– Direct property 178 168
– Indirect property and administration 107 102
1 Exclude past service cost credit in 2016 of £2.3 million and pension settlement cost in 2015 of £4.8 million.
Disclosures required by the Companies Act 2006 on Directors’ remuneration, including salaries, share options, pension contributions and pension entitlement and those specified by the Listing Rules of the Financial Services Authority are included on pages 85 to 102 in the Remuneration Report and form part of these financial statements.
126SEGRO Annual Report and Accounts 2016
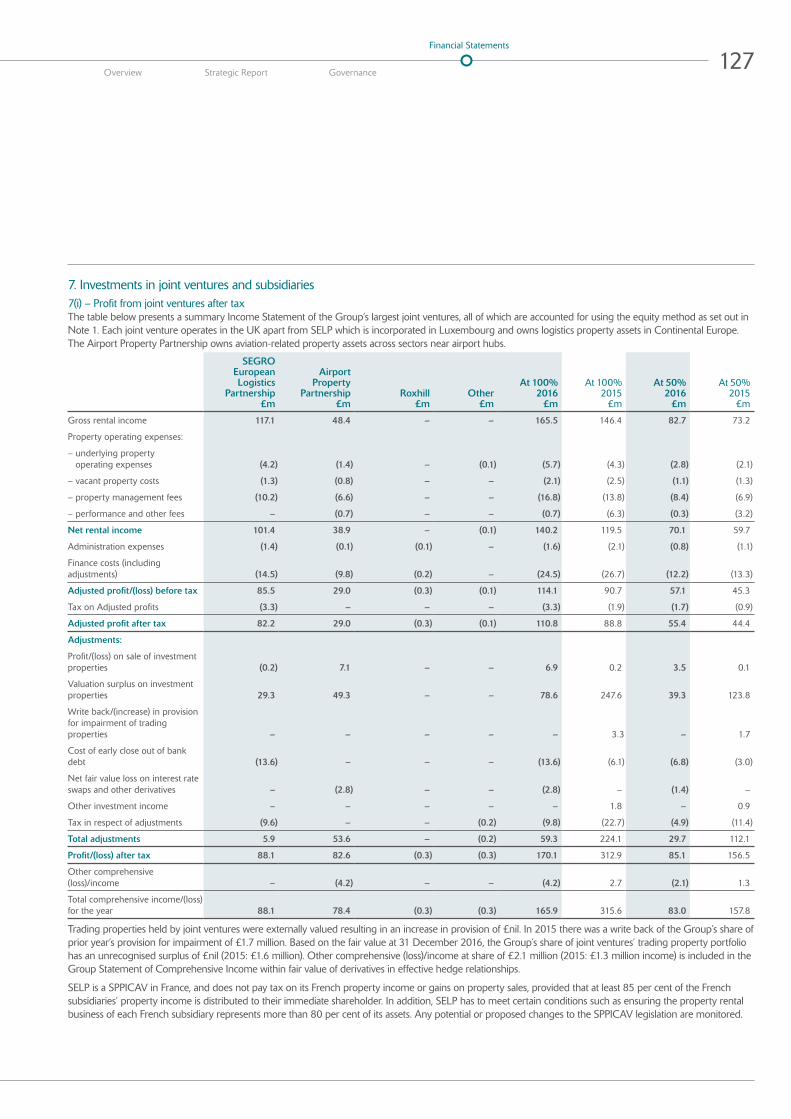
7. Investments in joint ventures and subsidiaries7(i) – Profit from joint ventures after tax The table below presents a summary Income Statement of the Group’s largest joint ventures, all of which are accounted for using the equity method as set out in Note 1. Each joint venture operates in the UK apart from SELP which is incorporated in Luxembourg and owns logistics property assets in Continental Europe. The Airport Property Partnership owns aviation-related property assets across sectors near airport hubs.
SEGRO European Logistics
Partnership £m
Airport Property
Partnership £m
Roxhill £m
Other £m
At 100%2016
£m
At 100%2015
£m
At 50% 2016
£m
At 50%2015
£m
Gross rental income 117.1 48.4 – – 165.5 146.4 82.7 73.2
Property operating expenses:
– underlying property operating expenses (4.2) (1.4) – (0.1) (5.7) (4.3) (2.8) (2.1)
– vacant property costs (1.3) (0.8) – – (2.1) (2.5) (1.1) (1.3)
– property management fees (10.2) (6.6) – – (16.8) (13.8) (8.4) (6.9)
– performance and other fees – (0.7) – – (0.7) (6.3) (0.3) (3.2)
Net rental income 101.4 38.9 – (0.1) 140.2 119.5 70.1 59.7
Administration expenses (1.4) (0.1) (0.1) – (1.6) (2.1) (0.8) (1.1)
Finance costs (including adjustments) (14.5) (9.8) (0.2) – (24.5) (26.7) (12.2) (13.3)
Adjusted profit/(loss) before tax 85.5 29.0 (0.3) (0.1) 114.1 90.7 57.1 45.3
Tax on Adjusted profits (3.3) – – – (3.3) (1.9) (1.7) (0.9)
Adjusted profit after tax 82.2 29.0 (0.3) (0.1) 110.8 88.8 55.4 44.4
Adjustments:
Profit/(loss) on sale of investment properties (0.2) 7.1 – – 6.9 0.2 3.5 0.1
Valuation surplus on investment properties 29.3 49.3 – – 78.6 247.6 39.3 123.8
Write back/(increase) in provision for impairment of trading properties – – – – – 3.3 – 1.7
Cost of early close out of bank debt (13.6) – – – (13.6) (6.1) (6.8) (3.0)
Net fair value loss on interest rate swaps and other derivatives – (2.8) – – (2.8) – (1.4) –
Other investment income – – – – – 1.8 – 0.9
Tax in respect of adjustments (9.6) – – (0.2) (9.8) (22.7) (4.9) (11.4)
Total adjustments 5.9 53.6 – (0.2) 59.3 224.1 29.7 112.1
Profit/(loss) after tax 88.1 82.6 (0.3) (0.3) 170.1 312.9 85.1 156.5
Other comprehensive (loss)/income – (4.2) – – (4.2) 2.7 (2.1) 1.3
Total comprehensive income/(loss)for the year 88.1 78.4 (0.3) (0.3) 165.9 315.6 83.0 157.8
Trading properties held by joint ventures were externally valued resulting in an increase in provision of £nil. In 2015 there was a write back of the Group’s share of prior year’s provision for impairment of £1.7 million. Based on the fair value at 31 December 2016, the Group’s share of joint ventures’ trading property portfolio has an unrecognised surplus of £nil (2015: £1.6 million). Other comprehensive (loss)/income at share of £2.1 million (2015: £1.3 million income) is included in the Group Statement of Comprehensive Income within fair value of derivatives in effective hedge relationships.
SELP is a SPPICAV in France, and does not pay tax on its French property income or gains on property sales, provided that at least 85 per cent of the French subsidiaries’ property income is distributed to their immediate shareholder. In addition, SELP has to meet certain conditions such as ensuring the property rental business of each French subsidiary represents more than 80 per cent of its assets. Any potential or proposed changes to the SPPICAV legislation are monitored.
127Financial Statements
Overview Strategic Report Governance
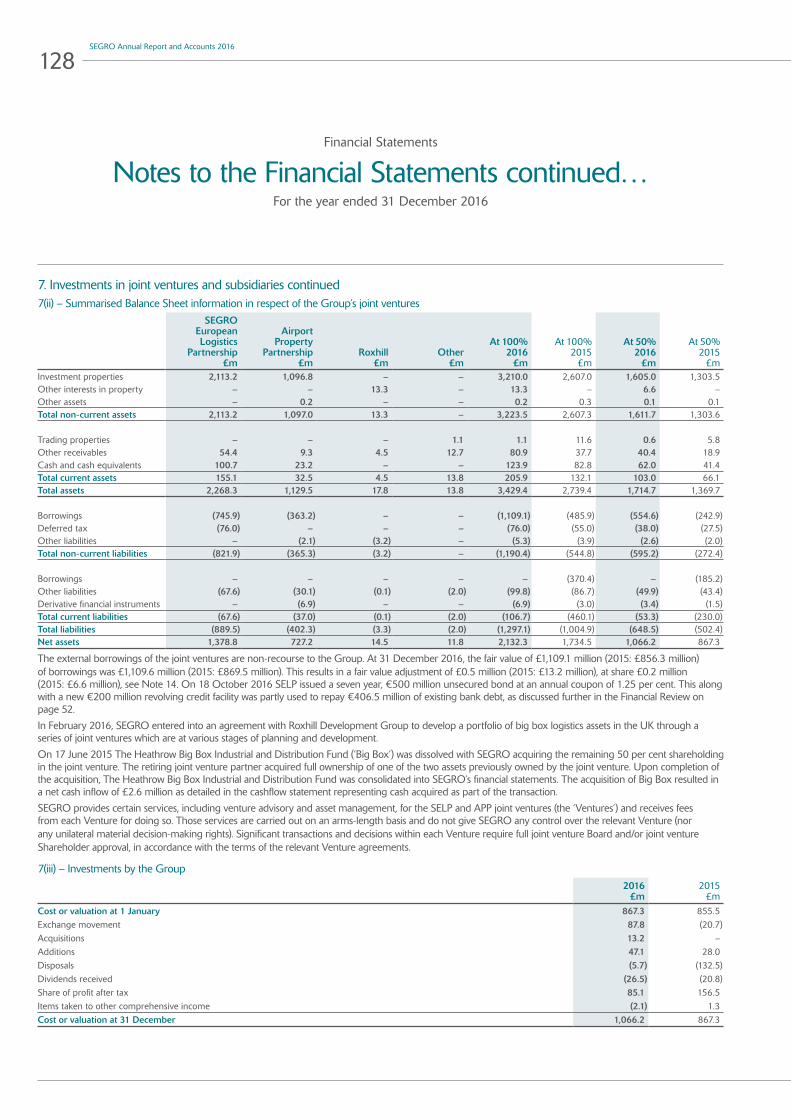
Financial Statements
Notes to the Financial Statements continued…For the year ended 31 December 2016
7. Investments in joint ventures and subsidiaries continued7(ii) – Summarised Balance Sheet information in respect of the Group’s joint ventures
SEGRO European Logistics
Partnership £m
Airport Property
Partnership £m
Roxhill£m
Other £m
At 100%2016
£m
At 100%2015
£m
At 50%2016
£m
At 50%2015
£mInvestment properties 2,113.2 1,096.8 – – 3,210.0 2,607.0 1,605.0 1,303.5Other interests in property – – 13.3 – 13.3 – 6.6 –Other assets – 0.2 – – 0.2 0.3 0.1 0.1Total non-current assets 2,113.2 1,097.0 13.3 – 3,223.5 2,607.3 1,611.7 1,303.6 Trading properties – – – 1.1 1.1 11.6 0.6 5.8Other receivables 54.4 9.3 4.5 12.7 80.9 37.7 40.4 18.9Cash and cash equivalents 100.7 23.2 – – 123.9 82.8 62.0 41.4Total current assets 155.1 32.5 4.5 13.8 205.9 132.1 103.0 66.1Total assets 2,268.3 1,129.5 17.8 13.8 3,429.4 2,739.4 1,714.7 1,369.7 Borrowings (745.9) (363.2) – – (1,109.1) (485.9) (554.6) (242.9)Deferred tax (76.0) – – – (76.0) (55.0) (38.0) (27.5)Other liabilities – (2.1) (3.2) – (5.3) (3.9) (2.6) (2.0)Total non-current liabilities (821.9) (365.3) (3.2) – (1,190.4) (544.8) (595.2) (272.4) Borrowings – – – – – (370.4) – (185.2)Other liabilities (67.6) (30.1) (0.1) (2.0) (99.8) (86.7) (49.9) (43.4)Derivative financial instruments – (6.9) – – (6.9) (3.0) (3.4) (1.5)Total current liabilities (67.6) (37.0) (0.1) (2.0) (106.7) (460.1) (53.3) (230.0)Total liabilities (889.5) (402.3) (3.3) (2.0) (1,297.1) (1,004.9) (648.5) (502.4)Net assets 1,378.8 727.2 14.5 11.8 2,132.3 1,734.5 1,066.2 867.3
The external borrowings of the joint ventures are non-recourse to the Group. At 31 December 2016, the fair value of £1,109.1 million (2015: £856.3 million) of borrowings was £1,109.6 million (2015: £869.5 million). This results in a fair value adjustment of £0.5 million (2015: £13.2 million), at share £0.2 million (2015: £6.6 million), see Note 14. On 18 October 2016 SELP issued a seven year, €500 million unsecured bond at an annual coupon of 1.25 per cent. This along with a new €200 million revolving credit facility was partly used to repay €406.5 million of existing bank debt, as discussed further in the Financial Review on page 52.
In February 2016, SEGRO entered into an agreement with Roxhill Development Group to develop a portfolio of big box logistics assets in the UK through a series of joint ventures which are at various stages of planning and development.
On 17 June 2015 The Heathrow Big Box Industrial and Distribution Fund (‘Big Box’) was dissolved with SEGRO acquiring the remaining 50 per cent shareholding in the joint venture. The retiring joint venture partner acquired full ownership of one of the two assets previously owned by the joint venture. Upon completion of the acquisition, The Heathrow Big Box Industrial and Distribution Fund was consolidated into SEGRO’s financial statements. The acquisition of Big Box resulted in a net cash inflow of £2.6 million as detailed in the cashflow statement representing cash acquired as part of the transaction.
SEGRO provides certain services, including venture advisory and asset management, for the SELP and APP joint ventures (the ‘Ventures’) and receives fees from each Venture for doing so. Those services are carried out on an arms-length basis and do not give SEGRO any control over the relevant Venture (nor any unilateral material decision-making rights). Significant transactions and decisions within each Venture require full joint venture Board and/or joint venture Shareholder approval, in accordance with the terms of the relevant Venture agreements.
7(iii) – Investments by the Group
2016
£m2015
£mCost or valuation at 1 January 867.3 855.5Exchange movement 87.8 (20.7)Acquisitions 13.2 –Additions 47.1 28.0Disposals (5.7) (132.5)Dividends received (26.5) (20.8)Share of profit after tax 85.1 156.5Items taken to other comprehensive income (2.1) 1.3Cost or valuation at 31 December 1,066.2 867.3
128SEGRO Annual Report and Accounts 2016

7. Investments in joint ventures and subsidiaries continuedDividends received were £26.5 million (2015: £20.8 million), of which £16.9 million (2015: £7.4 million) from APP, £9.6 million (2015: £10.0 million) from SELP and £nil (2015: £3.4 million) from Big Box.
7(iv) – Investments by the company
2016
£m2015
£m
Cost or valuation of subsidiaries at 1 January 4,041.8 4,669.1
Exchange movement 108.2 (33.6)
Additions 46.6 51.6
Disposals (48.2) (907.6)
Loan movement 1,071.2 (200.5)
Decrease in provision for investments in and loans to subsidiaries 171.5 462.8
Cost or valuation of subsidiaries at 31 December 5,391.1 4,041.8
Subsidiary entities are detailed in Note 31. The net asset value of subsidiaries is considered to be the approximation of its value in use. This results in the recognition of a reversal or charge for impairment at the end of the reporting period. Since subsidiary companies primarily hold property, assumptions and inputs used in determining their fair value are shown in Note 30. In 2015 disposals include a reduction in investment in subsidiaries of £904.2 million in respect of the capital reduction exercise.
8. Realised and unrealised property gain
2016
£m2015
£m
Profit on sale of investment properties 16.4 23.0
Valuation surplus on investment properties 231.3 439.8
Gain/(loss) on sale of trading properties 0.3 (0.1)
Increase in provision for impairment of trading properties (2.0) (1.2)
Total realised and unrealised property gain 246.0 461.5
9. Other investment income
2016
£m2015
£m
Net profit on available-for-sale investments – 6.2
Transfer of fair value surplus realised on sale of available-for-sale investments – 0.4
Total other investment income – 6.6
10. Goodwill and other amounts written off on acquisitions and amortisations of intangibles
2016
£m2015
£m
Amortisation of intangibles 0.2 0.2
Goodwill and other amounts written off on acquisitions – 3.6
Total goodwill and other amounts written off on acquisitions and amortisation of intangibles 0.2 3.8
Goodwill and other amounts written off on acquisitions relate to the acquisition of Vailog, detailed further in Note 29(iii).
11. Net finance costs
Finance income2016
£m2015
£m
Interest received on bank deposits and related derivatives 32.0 42.3
Fair value gain on interest rate swaps and other derivatives 13.8 0.6
Net interest income on defined benefit asset 0.9 –
Exchange differences – 0.5
Total finance income 46.7 43.4
129Financial Statements
Overview Strategic Report Governance
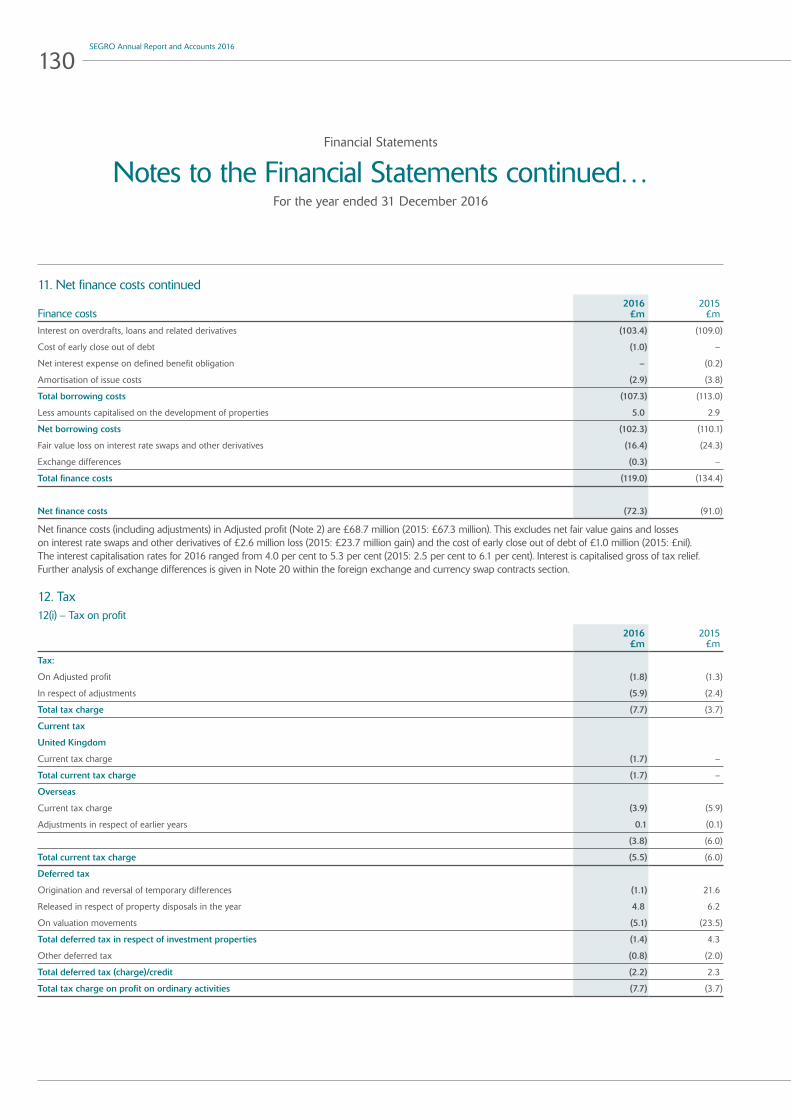
Financial Statements
Notes to the Financial Statements continued…For the year ended 31 December 2016
11. Net finance costs continued
Finance costs2016
£m2015
£m
Interest on overdrafts, loans and related derivatives (103.4) (109.0)
Cost of early close out of debt (1.0) –
Net interest expense on defined benefit obligation – (0.2)
Amortisation of issue costs (2.9) (3.8)
Total borrowing costs (107.3) (113.0)
Less amounts capitalised on the development of properties 5.0 2.9
Net borrowing costs (102.3) (110.1)
Fair value loss on interest rate swaps and other derivatives (16.4) (24.3)
Exchange differences (0.3) –
Total finance costs (119.0) (134.4)
Net finance costs (72.3) (91.0)
Net finance costs (including adjustments) in Adjusted profit (Note 2) are £68.7 million (2015: £67.3 million). This excludes net fair value gains and losses on interest rate swaps and other derivatives of £2.6 million loss (2015: £23.7 million gain) and the cost of early close out of debt of £1.0 million (2015: £nil). The interest capitalisation rates for 2016 ranged from 4.0 per cent to 5.3 per cent (2015: 2.5 per cent to 6.1 per cent). Interest is capitalised gross of tax relief. Further analysis of exchange differences is given in Note 20 within the foreign exchange and currency swap contracts section.
12. Tax12(i) – Tax on profit
2016
£m2015
£m
Tax:
On Adjusted profit (1.8) (1.3)
In respect of adjustments (5.9) (2.4)
Total tax charge (7.7) (3.7)
Current tax
United Kingdom
Current tax charge (1.7) –
Total current tax charge (1.7) –
Overseas
Current tax charge (3.9) (5.9)
Adjustments in respect of earlier years 0.1 (0.1)
(3.8) (6.0)
Total current tax charge (5.5) (6.0)
Deferred tax
Origination and reversal of temporary differences (1.1) 21.6
Released in respect of property disposals in the year 4.8 6.2
On valuation movements (5.1) (23.5)
Total deferred tax in respect of investment properties (1.4) 4.3
Other deferred tax (0.8) (2.0)
Total deferred tax (charge)/credit (2.2) 2.3
Total tax charge on profit on ordinary activities (7.7) (3.7)
130SEGRO Annual Report and Accounts 2016
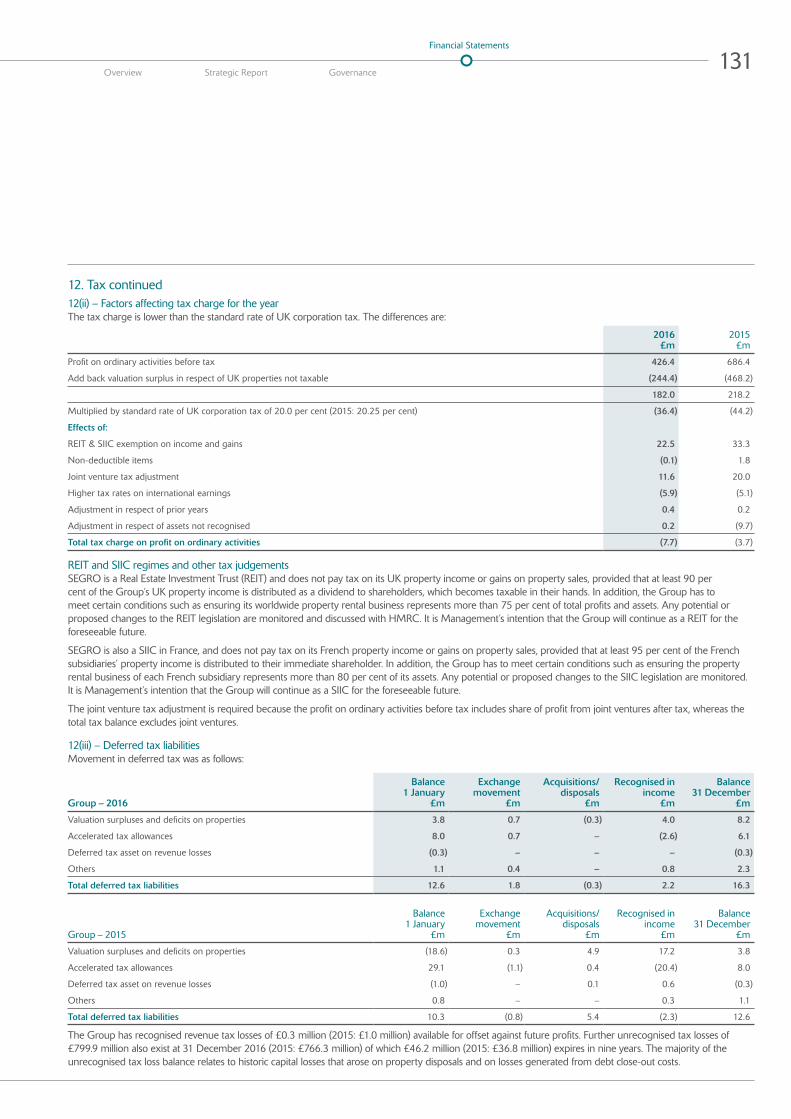
12. Tax continued12(ii) – Factors affecting tax charge for the yearThe tax charge is lower than the standard rate of UK corporation tax. The differences are:
2016
£m2015
£m
Profit on ordinary activities before tax 426.4 686.4
Add back valuation surplus in respect of UK properties not taxable (244.4) (468.2)
182.0 218.2
Multiplied by standard rate of UK corporation tax of 20.0 per cent (2015: 20.25 per cent) (36.4) (44.2)
Effects of:
REIT & SIIC exemption on income and gains 22.5 33.3
Non-deductible items (0.1) 1.8
Joint venture tax adjustment 11.6 20.0
Higher tax rates on international earnings (5.9) (5.1)
Adjustment in respect of prior years 0.4 0.2
Adjustment in respect of assets not recognised 0.2 (9.7)
Total tax charge on profit on ordinary activities (7.7) (3.7)
REIT and SIIC regimes and other tax judgementsSEGRO is a Real Estate Investment Trust (REIT) and does not pay tax on its UK property income or gains on property sales, provided that at least 90 per cent of the Group’s UK property income is distributed as a dividend to shareholders, which becomes taxable in their hands. In addition, the Group has to meet certain conditions such as ensuring its worldwide property rental business represents more than 75 per cent of total profits and assets. Any potential or proposed changes to the REIT legislation are monitored and discussed with HMRC. It is Management’s intention that the Group will continue as a REIT for the foreseeable future.
SEGRO is also a SIIC in France, and does not pay tax on its French property income or gains on property sales, provided that at least 95 per cent of the French subsidiaries’ property income is distributed to their immediate shareholder. In addition, the Group has to meet certain conditions such as ensuring the property rental business of each French subsidiary represents more than 80 per cent of its assets. Any potential or proposed changes to the SIIC legislation are monitored. It is Management’s intention that the Group will continue as a SIIC for the foreseeable future.
The joint venture tax adjustment is required because the profit on ordinary activities before tax includes share of profit from joint ventures after tax, whereas the total tax balance excludes joint ventures.
12(iii) – Deferred tax liabilities Movement in deferred tax was as follows:
Group – 2016
Balance 1 January
£m
Exchange movement
£m
Acquisitions/ disposals
£m
Recognised in income
£m
Balance 31 December
£m
Valuation surpluses and deficits on properties 3.8 0.7 (0.3) 4.0 8.2
Accelerated tax allowances 8.0 0.7 – (2.6) 6.1
Deferred tax asset on revenue losses (0.3) – – – (0.3)
Others 1.1 0.4 – 0.8 2.3
Total deferred tax liabilities 12.6 1.8 (0.3) 2.2 16.3
Group – 2015
Balance 1 January
£m
Exchange movement
£m
Acquisitions/ disposals
£m
Recognised in income
£m
Balance 31 December
£m
Valuation surpluses and deficits on properties (18.6) 0.3 4.9 17.2 3.8
Accelerated tax allowances 29.1 (1.1) 0.4 (20.4) 8.0
Deferred tax asset on revenue losses (1.0) – 0.1 0.6 (0.3)
Others 0.8 – – 0.3 1.1
Total deferred tax liabilities 10.3 (0.8) 5.4 (2.3) 12.6
The Group has recognised revenue tax losses of £0.3 million (2015: £1.0 million) available for offset against future profits. Further unrecognised tax losses of £799.9 million also exist at 31 December 2016 (2015: £766.3 million) of which £46.2 million (2015: £36.8 million) expires in nine years. The majority of the unrecognised tax loss balance relates to historic capital losses that arose on property disposals and on losses generated from debt close-out costs.
131Financial Statements
Overview Strategic Report Governance
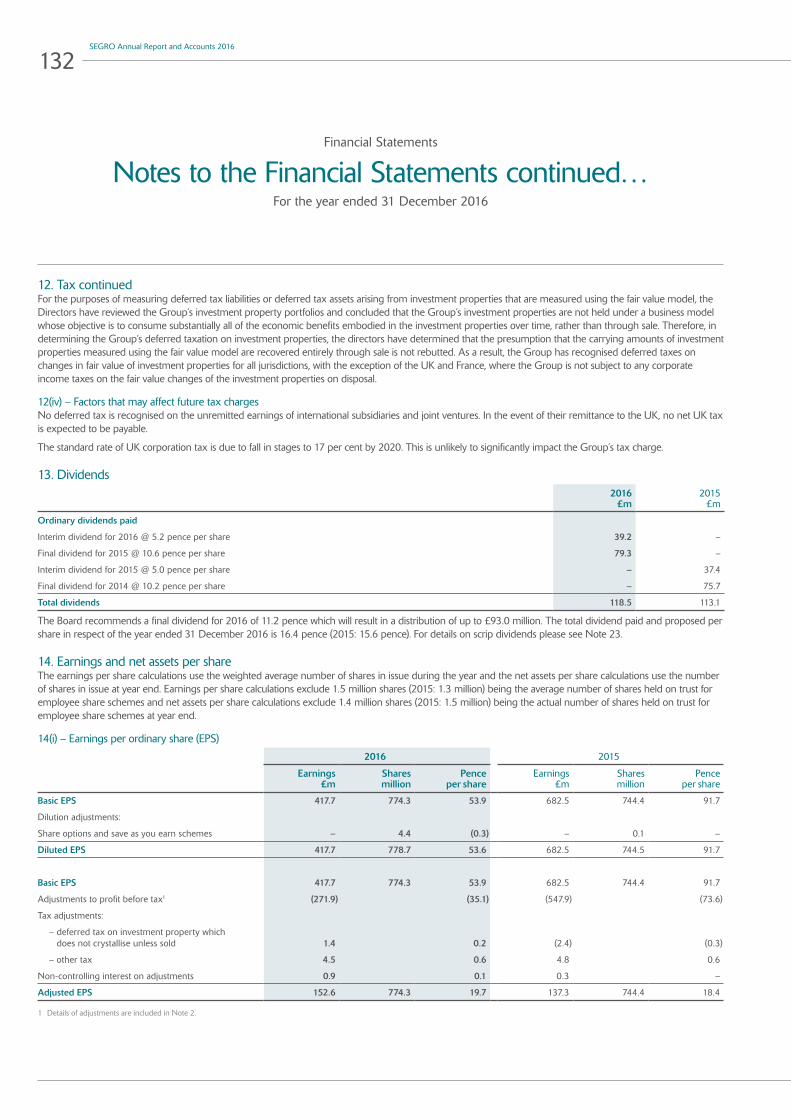
Financial Statements
Notes to the Financial Statements continued…For the year ended 31 December 2016
12. Tax continuedFor the purposes of measuring deferred tax liabilities or deferred tax assets arising from investment properties that are measured using the fair value model, the Directors have reviewed the Group’s investment property portfolios and concluded that the Group’s investment properties are not held under a business model whose objective is to consume substantially all of the economic benefits embodied in the investment properties over time, rather than through sale. Therefore, in determining the Group’s deferred taxation on investment properties, the directors have determined that the presumption that the carrying amounts of investment properties measured using the fair value model are recovered entirely through sale is not rebutted. As a result, the Group has recognised deferred taxes on changes in fair value of investment properties for all jurisdictions, with the exception of the UK and France, where the Group is not subject to any corporate income taxes on the fair value changes of the investment properties on disposal.
12(iv) – Factors that may affect future tax charges No deferred tax is recognised on the unremitted earnings of international subsidiaries and joint ventures. In the event of their remittance to the UK, no net UK tax is expected to be payable.
The standard rate of UK corporation tax is due to fall in stages to 17 per cent by 2020. This is unlikely to significantly impact the Group’s tax charge.
13. Dividends
2016
£m2015
£m
Ordinary dividends paid
Interim dividend for 2016 @ 5.2 pence per share 39.2 –
Final dividend for 2015 @ 10.6 pence per share 79.3 –
Interim dividend for 2015 @ 5.0 pence per share – 37.4
Final dividend for 2014 @ 10.2 pence per share – 75.7
Total dividends 118.5 113.1
The Board recommends a final dividend for 2016 of 11.2 pence which will result in a distribution of up to £93.0 million. The total dividend paid and proposed per share in respect of the year ended 31 December 2016 is 16.4 pence (2015: 15.6 pence). For details on scrip dividends please see Note 23.
14. Earnings and net assets per shareThe earnings per share calculations use the weighted average number of shares in issue during the year and the net assets per share calculations use the number of shares in issue at year end. Earnings per share calculations exclude 1.5 million shares (2015: 1.3 million) being the average number of shares held on trust for employee share schemes and net assets per share calculations exclude 1.4 million shares (2015: 1.5 million) being the actual number of shares held on trust for employee share schemes at year end.
14(i) – Earnings per ordinary share (EPS)
2016 2015
Earnings £m
Shares million
Pence per share
Earnings £m
Shares million
Pence per share
Basic EPS 417.7 774.3 53.9 682.5 744.4 91.7
Dilution adjustments:
Share options and save as you earn schemes – 4.4 (0.3) – 0.1 –
Diluted EPS 417.7 778.7 53.6 682.5 744.5 91.7
Basic EPS 417.7 774.3 53.9 682.5 744.4 91.7
Adjustments to profit before tax1 (271.9) (35.1) (547.9) (73.6)
Tax adjustments:
– deferred tax on investment property which does not crystallise unless sold 1.4 0.2 (2.4) (0.3)
– other tax 4.5 0.6 4.8 0.6
Non-controlling interest on adjustments 0.9 0.1 0.3 –
Adjusted EPS 152.6 774.3 19.7 137.3 744.4 18.4
1 Details of adjustments are included in Note 2.
132SEGRO Annual Report and Accounts 2016
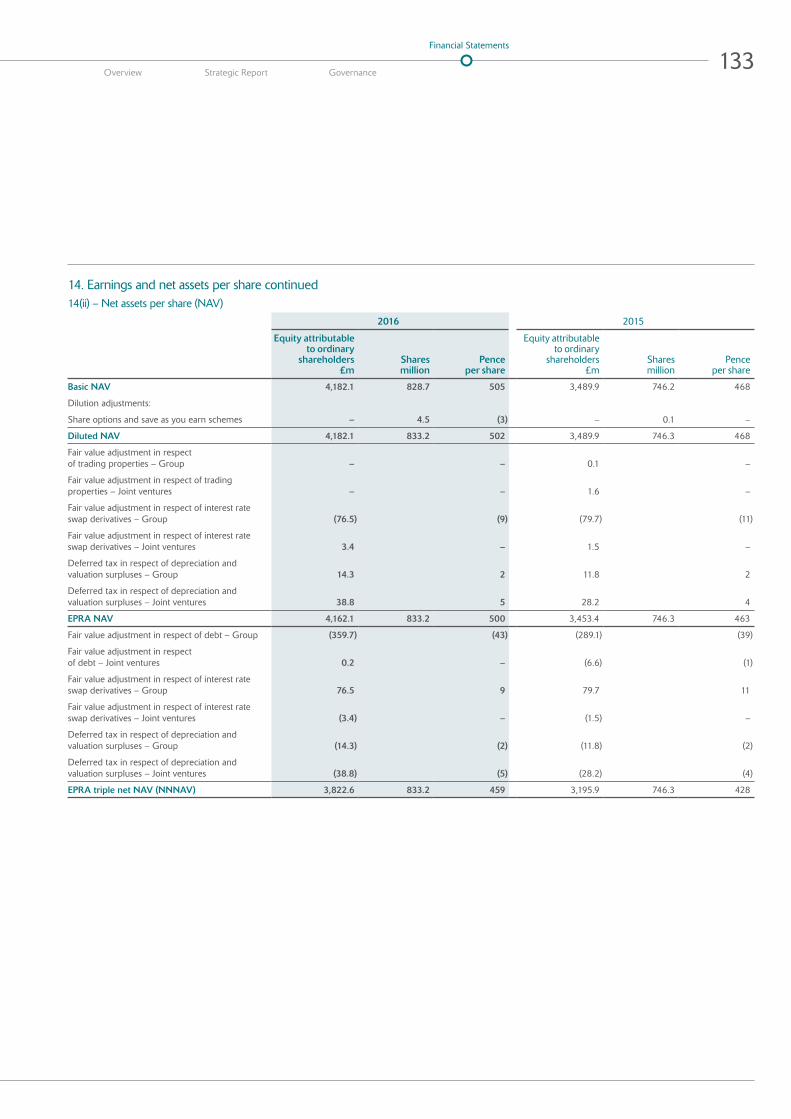
14. Earnings and net assets per share continued14(ii) – Net assets per share (NAV)
2016 2015
Equity attributable to ordinary
shareholders £m
Shares million
Pence per share
Equity attributable to ordinary
shareholders £m
Shares million
Pence per share
Basic NAV 4,182.1 828.7 505 3,489.9 746.2 468
Dilution adjustments:
Share options and save as you earn schemes – 4.5 (3) – 0.1 –
Diluted NAV 4,182.1 833.2 502 3,489.9 746.3 468
Fair value adjustment in respect of trading properties – Group – – 0.1 –
Fair value adjustment in respect of trading properties – Joint ventures – – 1.6 –
Fair value adjustment in respect of interest rate swap derivatives – Group (76.5) (9) (79.7) (11)
Fair value adjustment in respect of interest rate swap derivatives – Joint ventures 3.4 – 1.5 –
Deferred tax in respect of depreciation and valuation surpluses – Group 14.3 2 11.8 2
Deferred tax in respect of depreciation and valuation surpluses – Joint ventures 38.8 5 28.2 4
EPRA NAV 4,162.1 833.2 500 3,453.4 746.3 463
Fair value adjustment in respect of debt – Group (359.7) (43) (289.1) (39)
Fair value adjustment in respect of debt – Joint ventures 0.2 – (6.6) (1)
Fair value adjustment in respect of interest rate swap derivatives – Group 76.5 9 79.7 11
Fair value adjustment in respect of interest rate swap derivatives – Joint ventures (3.4) – (1.5) –
Deferred tax in respect of depreciation and valuation surpluses – Group (14.3) (2) (11.8) (2)
Deferred tax in respect of depreciation and valuation surpluses – Joint ventures (38.8) (5) (28.2) (4)
EPRA triple net NAV (NNNAV) 3,822.6 833.2 459 3,195.9 746.3 428
133Financial Statements
Overview Strategic Report Governance
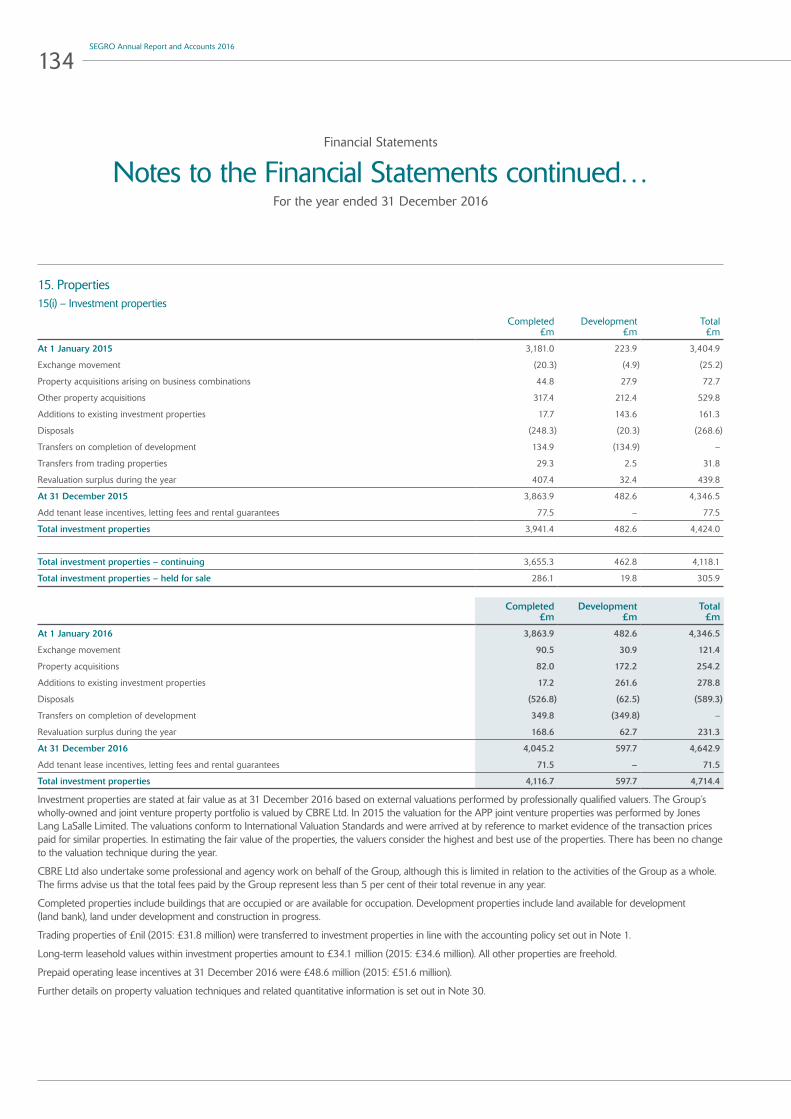
Financial Statements
Notes to the Financial Statements continued…For the year ended 31 December 2016
15. Properties 15(i) – Investment properties
Completed
£mDevelopment
£mTotal £m
At 1 January 2015 3,181.0 223.9 3,404.9
Exchange movement (20.3) (4.9) (25.2)
Property acquisitions arising on business combinations 44.8 27.9 72.7
Other property acquisitions 317.4 212.4 529.8
Additions to existing investment properties 17.7 143.6 161.3
Disposals (248.3) (20.3) (268.6)
Transfers on completion of development 134.9 (134.9) –
Transfers from trading properties 29.3 2.5 31.8
Revaluation surplus during the year 407.4 32.4 439.8
At 31 December 2015 3,863.9 482.6 4,346.5
Add tenant lease incentives, letting fees and rental guarantees 77.5 – 77.5
Total investment properties 3,941.4 482.6 4,424.0
Total investment properties – continuing 3,655.3 462.8 4,118.1
Total investment properties – held for sale 286.1 19.8 305.9
Completed
£mDevelopment
£mTotal
£m
At 1 January 2016 3,863.9 482.6 4,346.5
Exchange movement 90.5 30.9 121.4
Property acquisitions 82.0 172.2 254.2
Additions to existing investment properties 17.2 261.6 278.8
Disposals (526.8) (62.5) (589.3)
Transfers on completion of development 349.8 (349.8) –
Revaluation surplus during the year 168.6 62.7 231.3
At 31 December 2016 4,045.2 597.7 4,642.9
Add tenant lease incentives, letting fees and rental guarantees 71.5 – 71.5
Total investment properties 4,116.7 597.7 4,714.4
Investment properties are stated at fair value as at 31 December 2016 based on external valuations performed by professionally qualified valuers. The Group’s wholly-owned and joint venture property portfolio is valued by CBRE Ltd. In 2015 the valuation for the APP joint venture properties was performed by Jones Lang LaSalle Limited. The valuations conform to International Valuation Standards and were arrived at by reference to market evidence of the transaction prices paid for similar properties. In estimating the fair value of the properties, the valuers consider the highest and best use of the properties. There has been no change to the valuation technique during the year.
CBRE Ltd also undertake some professional and agency work on behalf of the Group, although this is limited in relation to the activities of the Group as a whole. The firms advise us that the total fees paid by the Group represent less than 5 per cent of their total revenue in any year.
Completed properties include buildings that are occupied or are available for occupation. Development properties include land available for development (land bank), land under development and construction in progress.
Trading properties of £nil (2015: £31.8 million) were transferred to investment properties in line with the accounting policy set out in Note 1.
Long-term leasehold values within investment properties amount to £34.1 million (2015: £34.6 million). All other properties are freehold.
Prepaid operating lease incentives at 31 December 2016 were £48.6 million (2015: £51.6 million).
Further details on property valuation techniques and related quantitative information is set out in Note 30.
134SEGRO Annual Report and Accounts 2016

15. Properties continued15(ii) – Trading properties
Completed
£mDevelopment
£mTotal £m
At 1 January 2015 51.1 26.6 77.7
Exchange movement (3.1) (1.4) (4.5)
Additions 0.4 0.5 0.9
Disposals (3.8) – (3.8)
Transfers to investment properties (29.3) (2.5) (31.8)
Increase in provision for impairment during the year (1.1) (0.1) (1.2)
At 31 December 2015 14.2 23.1 37.3
Add tenant lease incentives, letting fees and rental guarantees 0.3 – 0.3
Total trading properties 14.5 23.1 37.6
Completed
£mDevelopment
£mTotal
£m
At 1 January 2016 14.2 23.1 37.3
Exchange movement 2.2 3.1 5.3
Additions 0.2 3.8 4.0
Disposals (0.5) (19.1) (19.6)
Increase in provision for impairment during the year (1.0) (1.0) (2.0)
At 31 December 2016 15.1 9.9 25.0
Add tenant lease incentives, letting fees and rental guarantees 0.4 – 0.4
Total trading properties 15.5 9.9 25.4
Trading properties were externally valued, as detailed in Note 15(i), resulting in an increase in the provision for impairment of £2.0 million (2015: £1.2 million). Based on the fair value at 31 December 2016, the portfolio has an unrecognised surplus of £nil million (2015: £0.1 million). Further information on valuation techniques and related quantitative information is given in Note 30.
15(iii) – Held for saleAt 31 December 2015 the Group had exchanged contracts to sell the Bath Road office investment property portfolio with a total book value of £305.9 million (of which £286.1 million are investment properties and £19.8 million were development properties). This completed on 29 January 2016.
These were considered held for sale at 31 December 2015.
16. Available-for-sale investments
2016
£m2015
£m
Valuation at 1 January 0.9 5.8
Exchange movement 0.1 0.2
Fair value movement – other comprehensive income (0.3) 0.1
Disposals and return of capital – (5.2)
Valuation at 31 December 0.7 0.9
Available-for-sale investments comprise holdings in private equity funds investing in the UK, Continental Europe and USA. Fair value is based on quarterly reports received from the fund managers, or other market evidence where publicly traded.
135Financial Statements
Overview Strategic Report Governance

Financial Statements
Notes to the Financial Statements continued…For the year ended 31 December 2016
17. Trade and other receivablesGroup Company
2016 £m
2015 £m
2016 £m
2015 £m
Current
Trade receivables 22.8 21.3 – –
Other receivables 55.4 61.6 3.7 2.2
Prepayments and accrued income 11.1 6.1 0.8 0.6
Amounts due from related parties 13.5 8.8 – –
Total current trade and other receivables 102.8 97.8 4.5 2.8
Group other receivables also include tax recoverable of £0.2 million (2015: £0.1 million). Group trade receivables are net of provisions for doubtful debts of £4.7 million (2015: £4.8 million).
18. Trade and other payablesGroup Company
2016 £m
2015 £m
2016 £m
2015 £m
Due within one year
Trade payables 4.4 7.9 – –
Other payables 42.1 56.3 0.8 1.9
Non-capital accruals 66.9 63.7 27.7 28.1
Capital creditors and capital accruals 89.8 31.3 – –
Deferred income 43.3 44.4 – –
Loans from subsidiaries1 – – 40.6 –
Total trade and other payables due within one year 246.5 203.6 69.1 30.0
Due after one year
Loans from subsidiaries1 – – 1,470.6 469.7
Amounts due to related parties 4.7 3.9 – –
Total other payables due after one year 4.7 3.9 1,470.6 469.7
1 Loans from subsidiaries are unsecured and incur interest at market rates.
136SEGRO Annual Report and Accounts 2016
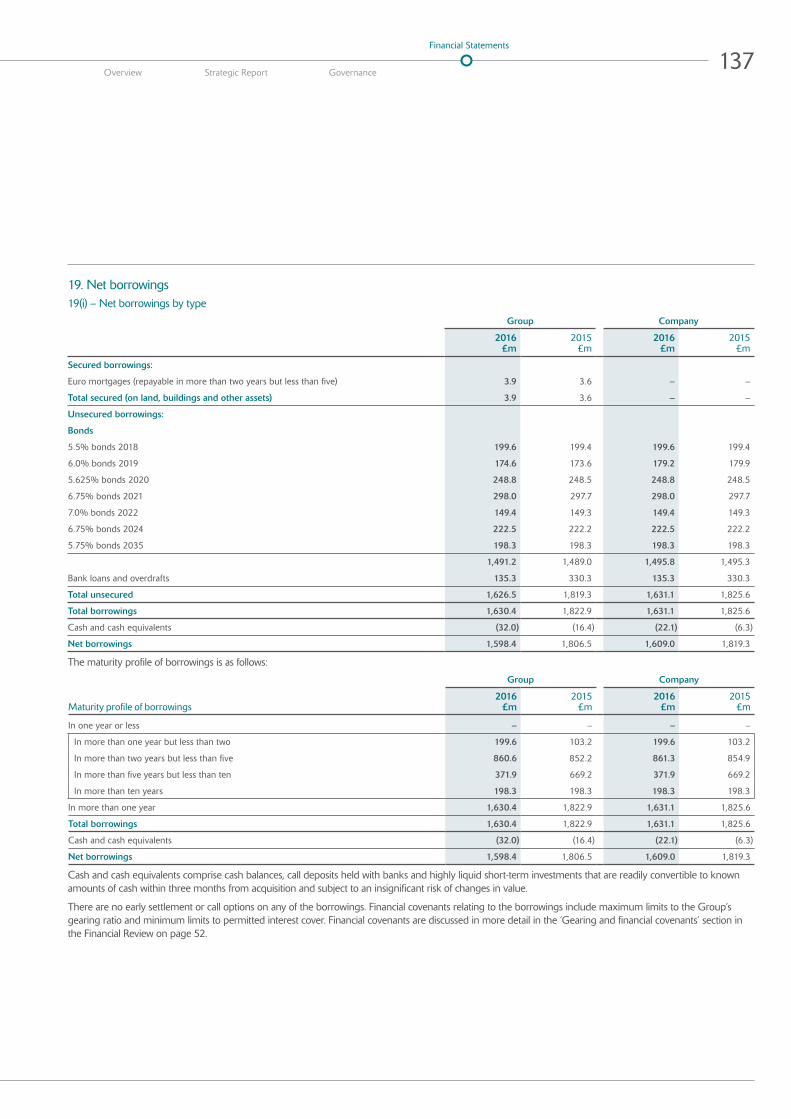
19. Net borrowings19(i) – Net borrowings by type
Group Company
2016 £m
2015 £m
2016 £m
2015 £m
Secured borrowings:
Euro mortgages (repayable in more than two years but less than five) 3.9 3.6 – –
Total secured (on land, buildings and other assets) 3.9 3.6 – –
Unsecured borrowings:
Bonds
5.5% bonds 2018 199.6 199.4 199.6 199.4
6.0% bonds 2019 174.6 173.6 179.2 179.9
5.625% bonds 2020 248.8 248.5 248.8 248.5
6.75% bonds 2021 298.0 297.7 298.0 297.7
7.0% bonds 2022 149.4 149.3 149.4 149.3
6.75% bonds 2024 222.5 222.2 222.5 222.2
5.75% bonds 2035 198.3 198.3 198.3 198.3
1,491.2 1,489.0 1,495.8 1,495.3
Bank loans and overdrafts 135.3 330.3 135.3 330.3
Total unsecured 1,626.5 1,819.3 1,631.1 1,825.6
Total borrowings 1,630.4 1,822.9 1,631.1 1,825.6
Cash and cash equivalents (32.0) (16.4) (22.1) (6.3)
Net borrowings 1,598.4 1,806.5 1,609.0 1,819.3
The maturity profile of borrowings is as follows:
Group Company
Maturity profile of borrowings2016
£m2015
£m2016
£m2015
£m
In one year or less – – – –
In more than one year but less than two 199.6 103.2 199.6 103.2
In more than two years but less than five 860.6 852.2 861.3 854.9
In more than five years but less than ten 371.9 669.2 371.9 669.2
In more than ten years 198.3 198.3 198.3 198.3
In more than one year 1,630.4 1,822.9 1,631.1 1,825.6
Total borrowings 1,630.4 1,822.9 1,631.1 1,825.6
Cash and cash equivalents (32.0) (16.4) (22.1) (6.3)
Net borrowings 1,598.4 1,806.5 1,609.0 1,819.3
Cash and cash equivalents comprise cash balances, call deposits held with banks and highly liquid short-term investments that are readily convertible to known amounts of cash within three months from acquisition and subject to an insignificant risk of changes in value.
There are no early settlement or call options on any of the borrowings. Financial covenants relating to the borrowings include maximum limits to the Group’s gearing ratio and minimum limits to permitted interest cover. Financial covenants are discussed in more detail in the ‘Gearing and financial covenants’ section in the Financial Review on page 52.
137Financial Statements
Overview Strategic Report Governance

Financial Statements
Notes to the Financial Statements continued…For the year ended 31 December 2016
19. Net borrowings continuedBank loans and overdrafts include capitalised finance costs on committed facilities which were undrawn at the prior year end.
Group Company
Maturity profile of undrawn borrowing facilities2016
£m2015
£m2016
£m2015
£m
In one year or less 5.0 5.0 – –
In more than one year but less than two – 102.9 – 102.9
In more than two years but less than five 529.9 110.0 526.0 110.0
Total available undrawn borrowing facilities 534.9 217.9 526.0 212.9
19(ii) – Net borrowings by interest ratesThe weighted average interest rate profile of Group and Company net borrowings after derivative instruments is as follows:
31 December 2016 31 December 2015
Interest rate profile – Group
Fixed rate
%
Fixed period years
Fixed debt £m
Variable debt/cash
£mTotal
£m
Fixed rate
%
Fixed period years
Fixed debt £m
Variable debt/cash
£mTotal £m
BorrowingsWeighted average after derivative instruments
Weighted average after derivative instruments
Sterling 6.31 15.8 382.2 180.2 562.4 6.66 13.0 530.0 170.4 700.4
Euros 3.06 5.0 829.1 254.2 1,083.3 3.83 6.0 713.2 421.7 1,134.9
US dollars – – – (15.3) (15.3) – – – (12.4) (12.4)
Total borrowings 4.10 8.4 1,211.3 419.1 1,630.4 5.03 9.0 1,243.2 579.7 1,822.9
Cash and cash equivalents
Sterling (24.8) (24.8) (10.0) (10.0)
Euros (7.0) (7.0) (6.2) (6.2)
US dollars (0.2) (0.2) (0.2) (0.2)
Total cash and cash equivalents (32.0) (32.0) (16.4) (16.4)
Net borrowings 1,211.3 387.1 1,598.4 1,243.2 563.3 1,806.5
31 December 2016 31 December 2015
Interest rate profile – Company
Fixed rate
%
Fixed period years
Fixed debt £m
Variable debt/cash
£mTotal
£m
Fixed rate
%
Fixed period years
Fixed debt £m
Variable debt/cash
£mTotal £m
BorrowingsWeighted average after derivative instruments
Weighted average after derivative instruments
Sterling 6.23 15.7 386.8 180.2 567.0 6.58 12.9 536.3 170.4 706.7
Euros 3.06 5.0 829.1 250.3 1,079.4 3.83 6.0 713.2 418.1 1,131.3
US dollars – – – (15.3) (15.3) – – – (12.4) (12.4)
Total borrowings 4.07 8.4 1,215.9 415.2 1,631.1 5.01 8.9 1,249.5 576.1 1,825.6
Cash and cash equivalents
Sterling (21.0) (21.0) (6.3) (6.3)
Euros (1.1) (1.1)
Total cash and cash equivalents (22.1) (22.1) (6.3) (6.3)
Net borrowings 1,215.9 393.1 1,609.0 1,249.5 569.8 1,819.3
138SEGRO Annual Report and Accounts 2016

20. Financial instruments and fair valuesDerivative assets
Group Company
2016 £m
2015 £m
2016 £m
2015 £m
Current
Fair value of interest rate swaps – non-hedge 11.1 – 11.1 –
Fair value of forward foreign exchange and currency swap contracts – non-hedge 1.5 0.7 1.5 0.7
Total current derivative financial instruments 12.6 0.7 12.6 0.7
Non-current
Fair value of interest rate swaps – non-hedge 80.1 80.8 80.1 80.8
Total non-current derivative financial instruments 80.1 80.8 80.1 80.8
Derivative liabilities
Group Company
2016 £m
2015 £m
2016 £m
2015 £m
Current
Fair value of forward foreign exchange and currency swap contracts – non-hedge 10.2 7.2 11.1 24.6
Fair value of forward foreign exchange and currency swap contracts – hedge 0.9 17.4 – –
Total current derivative financial instruments 11.1 24.6 11.1 24.6
Non-current
Fair value of interest rate swaps – non-hedge 14.7 1.1 14.7 1.1
Total non-current derivative financial instruments 14.7 1.1 14.7 1.1
Categories of financial instrumentsFinancial assets in the Group comprise interest rate swaps and forward foreign exchange contracts which are categorised as derivatives designated as fair value through the Income Statement (non-hedge). Financial assets also include trade and other receivables (excluding prepaid expenses), available-for-sale investments, loan to joint ventures and cash and cash equivalents, which are all classified as other financial assets.
Financial liabilities in the Group comprise interest rate swaps, forward foreign exchange contracts and cross-currency swap contracts which are categorised as fair value through the Income Statement (non-hedge) and forward foreign exchange contracts and cross-currency swap contracts designated as net investment hedges. Financial liabilities also include secured and unsecured bank loans and unsecured bond issues which are categorised as debt and initially recognised at fair value less costs and subsequently at amortised cost; and trade and other payables (excluding deferred revenue) which are classified as other financial liabilities.
The carrying values of these financial assets and liabilities approximate their fair value, with the exception of unsecured bond issues. At 31 December 2016, the fair value of £1,491.2 million of unsecured bonds issued was £1,850.9 million (2015: £1,489.0 million compared with £1,778.1 million fair value).
The fair values of financial assets and financial liabilities are determined as follows:
– Forward foreign exchange contracts are measured using quoted forward exchange rates and yield curves derived from quoted interest rates with matching maturities of the contracts.
– Interest rate swaps and currency swap contracts are measured at the present value of future cash flows estimated and discounted based on the applicable yield curves derived from quoted interest rates and the appropriate exchange rate at the Balance Sheet date.
– The fair value of non-derivative financial assets and financial liabilities traded on active liquid markets is determined with reference to the quoted market prices. Unlisted investments, such as those classified as available-for-sale investments, are typically valued by the Fund Manager based on the amount at which the asset would be exchanged between knowledgeable, willing parties in an arm’s length transaction. The methodology used to estimate fair value will depend on the nature and facts and circumstances of the investment but will use one of the following bases: transaction value, earnings multiple, net assets, price of recent investment and sale price, where appropriate a marketability discount will be applied.
– Financial guarantees are issued by the Company to support bank borrowings of 100 per cent owned subsidiary companies domiciled overseas.
139Financial Statements
Overview Strategic Report Governance

Financial Statements
Notes to the Financial Statements continued…For the year ended 31 December 2016
20. Financial instruments and fair values continuedFair value measurements recognised in the Balance SheetThe Group and Company financial instruments that are measured subsequent to initial recognition at fair value are available-for-sale investments, forward exchange and currency swap contracts and interest rate swaps as detailed in Note 16 and above. All of these financial instruments would be classified as level 2 fair value measurements, as defined by IFRS 13, being those derived from inputs other than quoted prices (included within level 1) that are observable for the asset or liability, either directly (i.e. as prices) or indirectly (i.e. derived from prices). There were no transfers between categories in the current or prior year.
Capital risk managementThe Group manages its capital to ensure that entities in the Group will be able to continue as a going concern and as such it aims to maintain a prudent mix between debt and equity financing in keeping with our long term mid-cycle LTV target of 40 per cent. The current capital structure of the Group consists of a mix of equity and debt. Equity comprises issued capital, reserves and retained earnings as disclosed in the statement of changes in equity and Notes 22 to 24. Debt primarily comprises long-term debt issues and drawings against medium-term committed revolving credit facilities from banks as disclosed in Note 19.
The Group is not subject to externally imposed capital requirements.
Foreign currency risk managementThe Group does not have any regular transactional foreign currency exposures as it does not have any regular business involving cross border currency flows. However, it does have operations in Continental Europe which transact business denominated mostly in euros. Hence there is currency exposure caused by translating the local trading performance and local net assets into sterling for each financial period and at each Balance Sheet date.
The Group’s approach to managing Balance Sheet translation exposure is described in the Foreign Currency Translation Exposure section in the Financial Review on page 53.
The Group’s Balance Sheet translation exposure (including the impact of derivative financial instruments) is summarised below:
2016 2015
Euros
£mUS Dollars
£mTotal
£mEuros
£mUS Dollars
£mTotal £m
Group
Gross currency assets 1,739.6 39.7 1,779.3 1,350.4 33.2 1,383.6
Gross currency liabilities (1,198.2) (23.3) (1,221.5) (1,213.3) (19.5) (1,232.8)
Net exposure 541.4 16.4 557.8 137.1 13.7 150.8
Company
Gross currency assets 928.2 38.6 966.8 705.2 31.9 737.1
Gross currency liabilities (1,184.1) (61.9) (1,246.0) (1,190.4) (51.4) (1,241.8)
Net exposure (255.9) (23.3) (279.2) (485.2) (19.5) (504.7)
2016 gross currency liabilities include €299.4 million (£255.9 million) and USD28.6 million (£23.3 million) designated as net investment hedges.
2015 gross currency liabilities include €659.9 million (£485.2 million) and USD28.6 million (£19.5 million) designated as net investment hedges.
The remaining gross currency liabilities of the Group shown in the table above that are not designated as net investment hedges are either held directly in a euro or US dollar functional currency entity or passed down to such an entity from a sterling functional currency company through inter-company funding arrangements.
Foreign currency sensitivity analysisThe Group’s main currency exposure is the euro. The blended sensitivity of the net assets of the Group to a 10 per cent increase in the value of sterling against the relevant currencies is £50.7 million (2015: £13.7 million), with a sensitivity of £49.2 million against the euro (2015: £12.5 million) and £1.5 million against the US dollar (2015: £1.2 million). The 10 per cent sensitivity rate is used when reporting foreign currency risk internally to management and represents management’s assessment of the reasonably possible change in foreign exchange rates. The sensitivity analysis adjusts the translation of net assets (after taking account of external loans, currency swap contracts and forward foreign exchange contracts) at the period end for a 10 per cent change in the value of sterling against the relevant currencies.
For the Company, the blended sensitivity is £25.4 million (2015: £45.9 million) with a sensitivity of £23.2 million against the euro (2015: £44.1 million) and £2.1 million against the US dollar (2015: £1.8 million).
140SEGRO Annual Report and Accounts 2016

Forward foreign exchange and currency swap contractsSome of the forward foreign exchange and currency swap contracts held by the Group are designated as net investment hedges of euro and US dollar denominated subsidiaries, where exchange differences are booked in reserves and recognised in the Income Statement when the operation is sold. The remaining foreign exchange and currency swap contracts are effectively economic cash flow hedges, for example using surplus cash in one currency to provide (typically through intercompany debt funding arrangements with overseas subsidiaries) funds to repay debt, or to fund development expenditure or acquisitions in another currency. These instruments have not been designated as hedges. As a consequence exchange movements in respect of these instruments are taken through the Income Statement. Offsetting these movements are £100.6 million exchange gains (2015: £31.6 million loss) arising on intercompany debt funding arrangements discussed above resulting in a loss on exchange differences of £0.3 million (2015: £0.5 million gain) within net finance costs in Note 11.
The Group’s translation exposure risk management policy is that between 50 and 100 per cent of assets denominated in a foreign currency should be hedged by liabilities in the same currency. During the year the foreign currency denominated liabilities of the Group were predominantly the currency leg of foreign exchange and currency swap contracts (both those designated as net investment hedges and those which are effectively cash flow hedges) and the application of this policy is the main economic purpose of these instruments. Further details are provided within the Foreign Currency Translation Exposure section of the Financial Review on page 53.
The following table details the forward foreign exchange and currency swap contracts outstanding as at the year end:
Average exchange rates
Currency contract (local currency)
Contract value
Fair value
2016 20152016
m2015
m2016
£m2015
£m2016
£m2015
£m
Group
Economic cash flow hedges
Sell euros (buy sterling) 1.19 1.39 822.6 450.7 703.1 331.4 (9.3) (7.2)
Buy euros (sell sterling) 1.17 1.35 18.3 0.8 15.7 0.6 0.1 –
Buy US dollars (sell sterling) 1.25 1.50 47.5 46.9 38.6 31.9 0.6 0.7
Net investment hedges
Sell euros (buy sterling) 1.17 1.41 299.4 659.9 255.9 485.2 (0.8) (17.2)
Sell US dollars (buy sterling) 1.24 1.49 28.6 28.6 23.3 19.5 (0.2) (0.2)
Total (9.6) (23.9)
Company
Economic cash flow hedges
Sell euros (buy sterling) 1.18 1.40 1,122.0 1,110.6 959.0 816.6 (10.1) (24.4)
Buy euros (sell sterling) 1.17 1.35 18.3 0.8 15.7 0.6 0.1 –
Buy US dollars (sell sterling) 1.25 1.50 47.5 46.9 38.6 31.9 0.6 0.7
Sell US dollars (buy sterling) 1.24 1.49 28.6 28.6 23.3 19.5 (0.2) (0.2)
Total (9.6) (23.9)
Interest rate risk managementThe Group is exposed to interest rate risk as entities in the Group borrow funds at both fixed and floating interest rates. The risk is managed by maintaining an appropriate mix between fixed and floating rate borrowings. The current Group policy states that 50 to 100 per cent of net borrowings should be at fixed rate provided by long-term debt issues attracting a fixed coupon or from floating rate bank borrowings converted into fixed rate or hedged via interest rate swaps, forwards, caps, collars or floors or options on these products. Hedging activities require the approval of the Finance Committee and are evaluated and reported on regularly to ensure that the policy is being adhered to. The Board reviews the policy on interest rate exposure annually with a view to establishing that it is still relevant in the prevailing and forecast economic environment.
Interest rate sensitivity analysisThe sensitivity analysis below has been determined based on the exposure to interest rates for both derivative and non-derivative instruments at the Balance Sheet date. For floating rate liabilities, the analysis is prepared assuming that the amount of liability outstanding at the Balance Sheet date was outstanding for the whole year. A 1 per cent increase or decrease is used when reporting interest rate risk internally to key management personnel and represents management’s assessment of the reasonably possible change in interest rates, and any lesser impact is proportionately linear.
If interest rates had been 1 per cent higher/lower and all other variables were held constant, the Group’s profit for the year ended 31 December 2016 would decrease/increase by £2.7 million (2015: decrease/increase by £4.9 million). This is attributable to the Group’s exposure to interest rates on its variable rate borrowings and cash deposits. Fixed rate debt issues are held at amortised cost and are not re-valued in the Balance Sheet to reflect interest rate movements.
141Financial Statements
Overview Strategic Report Governance

Financial Statements
Notes to the Financial Statements continued…For the year ended 31 December 2016
20. Financial instruments and fair values continuedInterest rate swap contractsUnder interest rate swap contracts, the Group agrees to exchange the difference between fixed and floating rate interest amounts calculated on agreed notional principal amounts. Such contracts enable the Group to manage the interest rate risk of the Group’s borrowings. The fair value of interest rate swaps at the reporting date is determined by discounting the future cash flows using the yield curves at the reporting date and the credit risk inherent in the contract, and is disclosed below. The average interest rate is based on the outstanding balances at the end of the financial year.
The following tables detail the notional principal amounts and remaining terms of interest rate swap contracts, based on their contractual maturities, outstanding as at the reporting date:
Average contract – fixed interest rate
Notional principal amount Fair value
2016
%2015
%2016
£m2015
£m2016
£m2015
£m
Pay fixed, receive floating contracts:
Group
In one year or less – – – – – –
In more than one year but less than two – – – – – –
In more than two years but less than five 0.24 0.19 606.9 198.5 (10.0) (0.9)
In more than five years 0.34 0.29 222.2 514.7 (4.7) (0.2)
Total 829.1 713.2 (14.7) (1.1)
Company
In one year or less – – – – – –
In more than one year but less than two – – – – – –
In more than two years but less than five 0.24 0.19 606.9 198.5 (10.0) (0.9)
In more than five years 0.34 0.29 222.2 514.7 (4.7) (0.2)
Total 829.1 713.2 (14.7) (1.1)
Receive fixed, pay floating contracts:
Group
In one year or less 5.63 – 250.0 – 11.1 –
In more than one year but less than two 3.42 5.95 350.0 350.0 14.9 17.1
In more than two years but less than five 6.44 6.02 509.0 559.0 65.2 57.1
In more than five years – 6.75 – 50.0 – 6.6
Total 1,109.0 959.0 91.2 80.8
Company
In one year or less 5.63 – 250.0 – 11.1 –
In more than one year but less than two 3.42 5.95 350.0 350.0 14.9 17.1
In more than two years but less than five 6.44 6.02 509.0 559.0 65.2 57.1
In more than five years – 6.75 – 50.0 – 6.6
Total 1,109.0 959.0 91.2 80.8
The above are effective economic hedges although the Group has not elected to adopt hedge accounting for them, hence their change in fair value is taken direct to the Income Statement.
The interest rate swaps settle on either a three-month or six-month basis with the floating rate side based on the EURIBOR or sterling LIBOR rate for the relevant period. The Group will settle or receive the difference between the fixed and floating interest rate on a net basis.
142SEGRO Annual Report and Accounts 2016

20. Financial instruments and fair values continuedCredit risk management Credit risk refers to the risk that a counterparty will default on its contractual obligations resulting in financial loss to the Group. Potential customers are evaluated for creditworthiness and where necessary collateral is secured. There is no concentration of credit risk within the lease portfolio to either business sector or individual company as the Group has a diverse customer base with no one customer accounting for more than 5 per cent of rental income. Trade receivables were less than 1 per cent of total assets at 31 December 2016 and at 31 December 2015. The Directors are of the opinion that the credit risk associated with unpaid rent is low. In excess of 95 per cent of rent due is generally collected within 21 days of the due date.
Ageing of past due trade but not impaired receivables were as follows:
2016
£m2015
£m
0–30 days 1.5 3.5
30–60 days 0.9 0.6
60–90 days 1.1 0.1
90–180 days 0.4 0.6
180 days 0.6 1.3
Past due 4.5 6.1
Not due 18.3 15.2
Total trade receivables 22.8 21.3
No other receivables were considered impaired or overdue.
Investment in financial instruments is restricted to banks and short-term liquidity funds with a good credit rating. Derivative financial instruments are transacted via International Swaps and Derivatives Association (ISDA) agreements with counterparties with a good investment grade credit rating. The Group’s exposure and the credit ratings of its counterparties are continuously monitored and the aggregate value of transactions concluded is spread among approved counterparties.
Liquidity risk management Ultimate responsibility for liquidity risk management rests with the Board, which has built an appropriate liquidity risk management framework for the management of the Group’s short, medium and long-term funding and liquidity management requirements. The Group manages liquidity risk by requiring that adequate cash and committed bank facilities are available to cover and match all debt maturities, development spend, trade related and corporate cash flows over a rolling 18-month period. This is achieved by continuously monitoring forecast and actual cash flows and matching the maturity profiles of financial assets and liabilities. Liquidity risk management is discussed in more detail in the Financial Position and Funding section in the Financial Review on pages 51 to 52.
Liquidity and interest risk tables The following tables detail the Group’s remaining contractual maturity profile for its financial instruments. The tables have been drawn up based on the undiscounted cash flows of financial liabilities based on the earliest date on which the Group can be required to pay. The tables include both interest and principal cash flows.
143Financial Statements
Overview Strategic Report Governance

Financial Statements
Notes to the Financial Statements continued…For the year ended 31 December 2016
20. Financial instruments and fair values continued2016 2015
Weighted average
interest rate %
Under 1 year
£m
1–2 years
£m
2–5 years
£m
Over 5 years
£mTotal
£m
Weighted average
interest rate %
Under 1 year
£m1–2 Years
£m2–5 Years
£m
Over 5 years
£mTotal £m
Group
Non-derivative financial liabilities:
Trade and other payables 176.4 – 4.7 – 181.1 132.8 – 3.9 – 136.7
Variable rate debt instruments 1.0 1.5 1.5 144.6 – 147.6 1.0 4.0 106.6 234.9 – 345.5
Fixed rate debt instruments 6.2 93.1 293.1 938.4 779.2 2,103.8 6.2 93.1 93.1 874.1 1,136.7 2,197.0
Derivative financial instruments:
Net settled interest rate swaps 4.9 4.7 7.4 – 17.0 1.9 1.8 (1.5) (0.9) 1.3
Gross settled foreign exchange – Forward contracts
– Inflowing (694.1) – – – (694.1) (805.9) – – – (805.9)
– Outflowing 703.6 – – – 703.6 832.8 – – – 832.8
Total 285.4 299.3 1,095.1 779.2 2,459.0 258.7 201.5 1,111.4 1,135.8 2,707.4
2016 2015
Weighted average
interest rate %
Under 1 year
£m
1–2 years
£m
2–5 years
£m
Over 5 years
£mTotal
£m
Weighted average
interest rate %
Under 1 year
£m
1–2 years
£m
2–5 years
£m
Over 5 years
£mTotal £m
Company
Non-derivative financial liabilities:
Trade and other payables 42.4 1,470.6 – – 1,513.0 3.7 469.7 – – 473.4
Variable rate debt instruments 1.0 1.4 1.4 140.5 – 143.3 1.0 3.9 106.5 231.0 – 341.4
Fixed rate debt instruments 6.2 93.1 293.1 938.4 779.2 2,103.8 6.2 93.1 93.1 874.1 1,136.7 2,197.0
Derivative financial instruments:
Net settled interest rate swaps 4.9 4.7 7.4 – 17.0 1.9 1.8 (1.5) (0.9) 1.3
Gross settled foreign exchange – Forward contracts
– Inflowing (694.1) – – – (694.1) (805.9) – – – (805.9)
– Outflowing 703.6 – – – 703.6 832.8 – – – 832.8
Total 151.3 1,769.8 1,086.3 779.2 3,786.6 129.5 671.1 1,103.6 1,135.8 3,040.0
144SEGRO Annual Report and Accounts 2016

21. Retirement benefit schemesBackground The Group has two defined benefit pension schemes, the SEGRO Pension Scheme (“the SEGRO scheme”) which, in 2015, merged with two other schemes (the Brixton plc Pension Plan and the J Saville Gordon Group plc and Subsidiary Companies Retirement and Death Benefit Scheme); and the Bilton Group Pension Scheme (“the Bilton scheme”).
Defined benefit pension provision is through trust-based schemes. These arrangements are now closed to new entrants and to future accrual of benefits (the SEGRO scheme being closed to future accrual effective from the end of 2016 giving rise to a past service credit of £2.3 million). In these arrangements, the assets of the schemes are invested separately from those of the Group and the schemes are run by independent Trustee boards. The Trustee board of each pension scheme is required by law to act in the best interests of the fund and its members and also takes into consideration the interests of the employers. There is a requirement for the Trustee board to have member representation, with the other Trustees being company appointed.
During 2015, and after discussion with SEGRO plc, the Trustees of the Bilton scheme committed to a process to buy out the Bilton scheme, which is anticipated to be finalised in 2017. The Trustees decided to insure members’ benefits with a third party specialist insurance company; the terms and conditions of the buy-out were agreed on 30 April 2015 subject to true-up following a data cleanse exercise followed by the issuance of individual policies due to be completed in the early part of 2017. The transaction, which has been predominantly funded from the assets of the scheme, will de-risk this mature scheme and reduce the administrative burden of managing it. In 2015 SEGRO incurred a pension settlement costs charge of £4.8 million in rationalising the pension schemes, as detailed in Note 2, primarily the buying out of the Bilton Group Pension Scheme. The Bilton scheme is net asset neutral with the balance and movements in liabilities matched with insured pension assets provided by a third party specialist and a small amount of cash.
The Trustee Boards are responsible for the investment policy in respect of the assets of the relevant fund, although the Company must be consulted on this and typically has some input into the investment decisions.
Schemes are valued at least triennially, when the funding position is established. The Company and Trustee boards are required to agree on assumptions for the valuation and to agree the contributions that result from this. The contributions may need to incorporate deficit recovery contributions if a deficit position is determined through the valuation. In agreeing contribution rates, reference must be made to the affordability of contributions by the employer.
In general, any surplus after benefits have been paid/secured, can be repaid to the employer.
Following each actuarial valuation the Company agrees with the Trustees a deficit recovery plan (if necessary). The Company paid deficit contributions of £7.7 million to the SEGRO scheme in this respect (2015: £7.2 million plus a one off lump sum of £10.0 million to the SEGRO scheme following the merger of the SEGRO scheme, the Brixton plc Pension Plan and the J Saville Gordon Group plc and Subsidiary Companies Retirement and Death Benefit Scheme). The Company considers that, were a pension asset to be realised in respect of this scheme, this would be fully recoverable in line with the rules of the scheme.
The valuation of the SEGRO scheme has been based on the most recent actuarial valuation at 31 March 2013 and the draft valuation at 31 March 2016 (which is expected to be finalised in the first half of 2017) and updated by the independent actuary in order to assess the liabilities of the scheme at 31 December 2016. Other than market and demographic risks, which are common to all retirement benefit schemes, there are no specific risks in the relevant benefit schemes which the Group considers to be significant or unusual.
Over 70 per cent of the schemes’ assets are held in a matching portfolio of Pooled Liability Driven Investment (LDI) Funds and Corporate Bonds which are a broad hedge for the schemes’ liabilities including some which are index-linked. It is the intention for the SEGRO scheme to move to less risky assets as the scheme matures to match the liabilities of the scheme.
The schemes assets do not include any financial instruments or property owned by the Group.
The major assumptions used were as follows:2016
%2015
%
Discount rate for scheme liabilities 2.7 3.8
Rate of inflation (RPI/CPI) 3.4/2.3 3.2/2.1
Rate of increase to pensions in payment in excess of GMP:
Before April 2003 (SEGRO/Bilton) 4.2/3.2 4.2/3.0
From April 2003 to October 2005 3.2 3.0
After October 2005 2.2 2.1
Rate of general long-term increase in salaries 3.4 3.2
145Financial Statements
Overview Strategic Report Governance
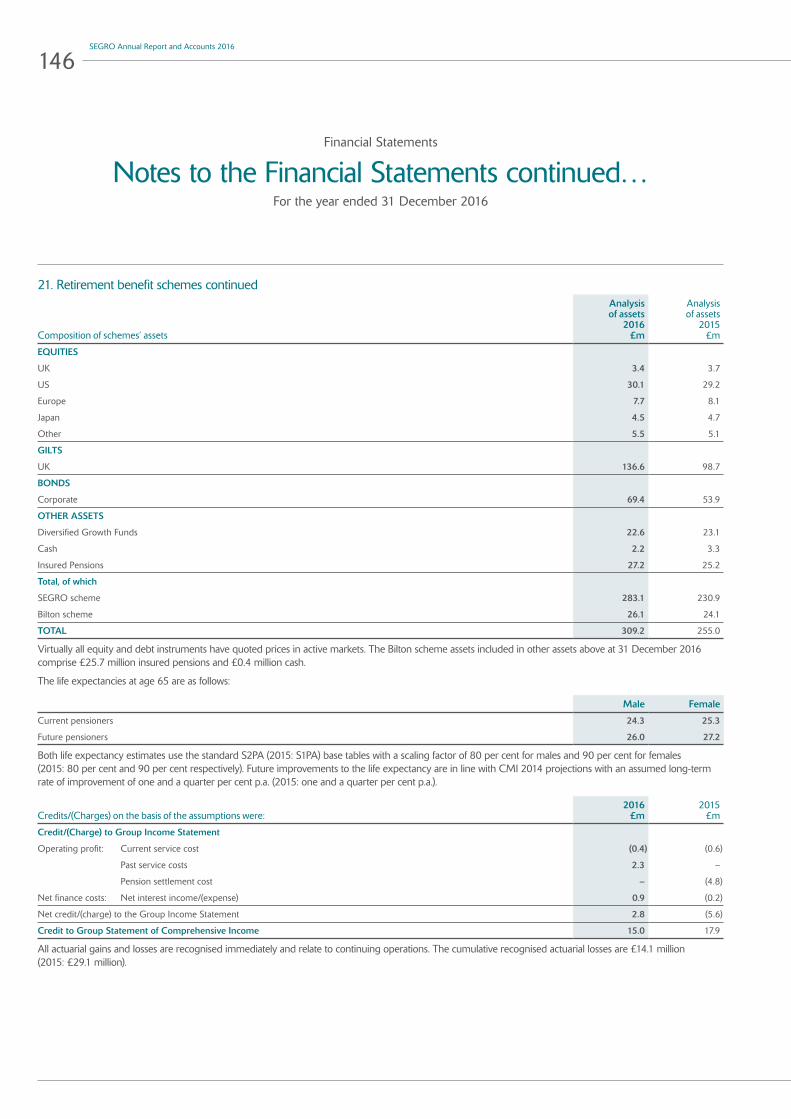
Financial Statements
Notes to the Financial Statements continued…For the year ended 31 December 2016
21. Retirement benefit schemes continued
Composition of schemes’ assets
Analysis of assets
2016 £m
Analysis of assets
2015 £m
EQUITIES
UK 3.4 3.7
US 30.1 29.2
Europe 7.7 8.1
Japan 4.5 4.7
Other 5.5 5.1
GILTS
UK 136.6 98.7
BONDS
Corporate 69.4 53.9
OTHER ASSETS
Diversified Growth Funds 22.6 23.1
Cash 2.2 3.3
Insured Pensions 27.2 25.2
Total, of which
SEGRO scheme 283.1 230.9
Bilton scheme 26.1 24.1
TOTAL 309.2 255.0
Virtually all equity and debt instruments have quoted prices in active markets. The Bilton scheme assets included in other assets above at 31 December 2016 comprise £25.7 million insured pensions and £0.4 million cash.
The life expectancies at age 65 are as follows:
Male Female
Current pensioners 24.3 25.3
Future pensioners 26.0 27.2
Both life expectancy estimates use the standard S2PA (2015: S1PA) base tables with a scaling factor of 80 per cent for males and 90 per cent for females (2015: 80 per cent and 90 per cent respectively). Future improvements to the life expectancy are in line with CMI 2014 projections with an assumed long-term rate of improvement of one and a quarter per cent p.a. (2015: one and a quarter per cent p.a.).
Credits/(Charges) on the basis of the assumptions were:2016
£m2015
£m
Credit/(Charge) to Group Income Statement
Operating profit: Current service cost (0.4) (0.6)
Past service costs 2.3 –
Pension settlement cost – (4.8)
Net finance costs: Net interest income/(expense) 0.9 (0.2)
Net credit/(charge) to the Group Income Statement 2.8 (5.6)
Credit to Group Statement of Comprehensive Income 15.0 17.9
All actuarial gains and losses are recognised immediately and relate to continuing operations. The cumulative recognised actuarial losses are £14.1 million (2015: £29.1 million).
146SEGRO Annual Report and Accounts 2016
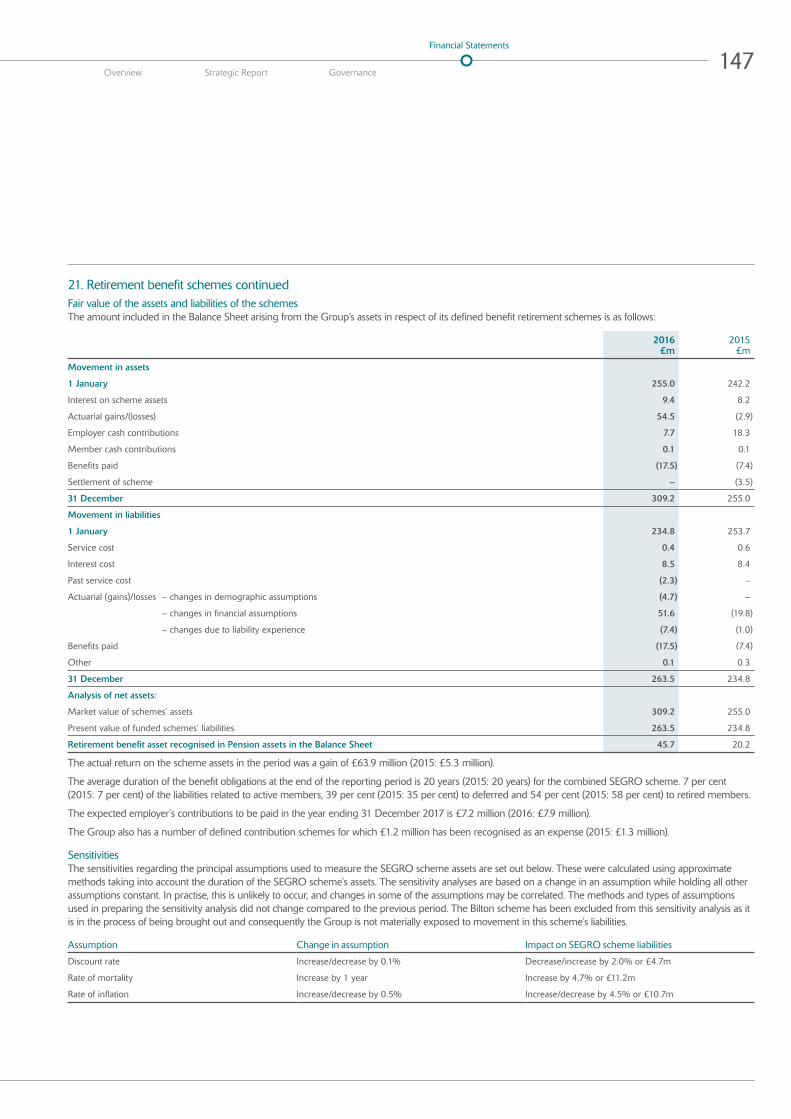
21. Retirement benefit schemes continuedFair value of the assets and liabilities of the schemesThe amount included in the Balance Sheet arising from the Group’s assets in respect of its defined benefit retirement schemes is as follows:
2016
£m2015
£m
Movement in assets
1 January 255.0 242.2
Interest on scheme assets 9.4 8.2
Actuarial gains/(losses) 54.5 (2.9)
Employer cash contributions 7.7 18.3
Member cash contributions 0.1 0.1
Benefits paid (17.5) (7.4)
Settlement of scheme – (3.5)
31 December 309.2 255.0
Movement in liabilities
1 January 234.8 253.7
Service cost 0.4 0.6
Interest cost 8.5 8.4
Past service cost (2.3) –
Actuarial (gains)/losses – changes in demographic assumptions (4.7) –
– changes in financial assumptions 51.6 (19.8)
– changes due to liability experience (7.4) (1.0)
Benefits paid (17.5) (7.4)
Other 0.1 0.3
31 December 263.5 234.8
Analysis of net assets:
Market value of schemes’ assets 309.2 255.0
Present value of funded schemes’ liabilities 263.5 234.8
Retirement benefit asset recognised in Pension assets in the Balance Sheet 45.7 20.2
The actual return on the scheme assets in the period was a gain of £63.9 million (2015: £5.3 million).
The average duration of the benefit obligations at the end of the reporting period is 20 years (2015: 20 years) for the combined SEGRO scheme. 7 per cent (2015: 7 per cent) of the liabilities related to active members, 39 per cent (2015: 35 per cent) to deferred and 54 per cent (2015: 58 per cent) to retired members.
The expected employer’s contributions to be paid in the year ending 31 December 2017 is £7.2 million (2016: £7.9 million).
The Group also has a number of defined contribution schemes for which £1.2 million has been recognised as an expense (2015: £1.3 million).
Sensitivities The sensitivities regarding the principal assumptions used to measure the SEGRO scheme assets are set out below. These were calculated using approximate methods taking into account the duration of the SEGRO scheme’s assets. The sensitivity analyses are based on a change in an assumption while holding all other assumptions constant. In practise, this is unlikely to occur, and changes in some of the assumptions may be correlated. The methods and types of assumptions used in preparing the sensitivity analysis did not change compared to the previous period. The Bilton scheme has been excluded from this sensitivity analysis as it is in the process of being brought out and consequently the Group is not materially exposed to movement in this scheme’s liabilities.
Assumption Change in assumption Impact on SEGRO scheme liabilities
Discount rate Increase/decrease by 0.1% Decrease/increase by 2.0% or £4.7m
Rate of mortality Increase by 1 year Increase by 4.7% or £11.2m
Rate of inflation Increase/decrease by 0.5% Increase/decrease by 4.5% or £10.7m
147Financial Statements
Overview Strategic Report Governance
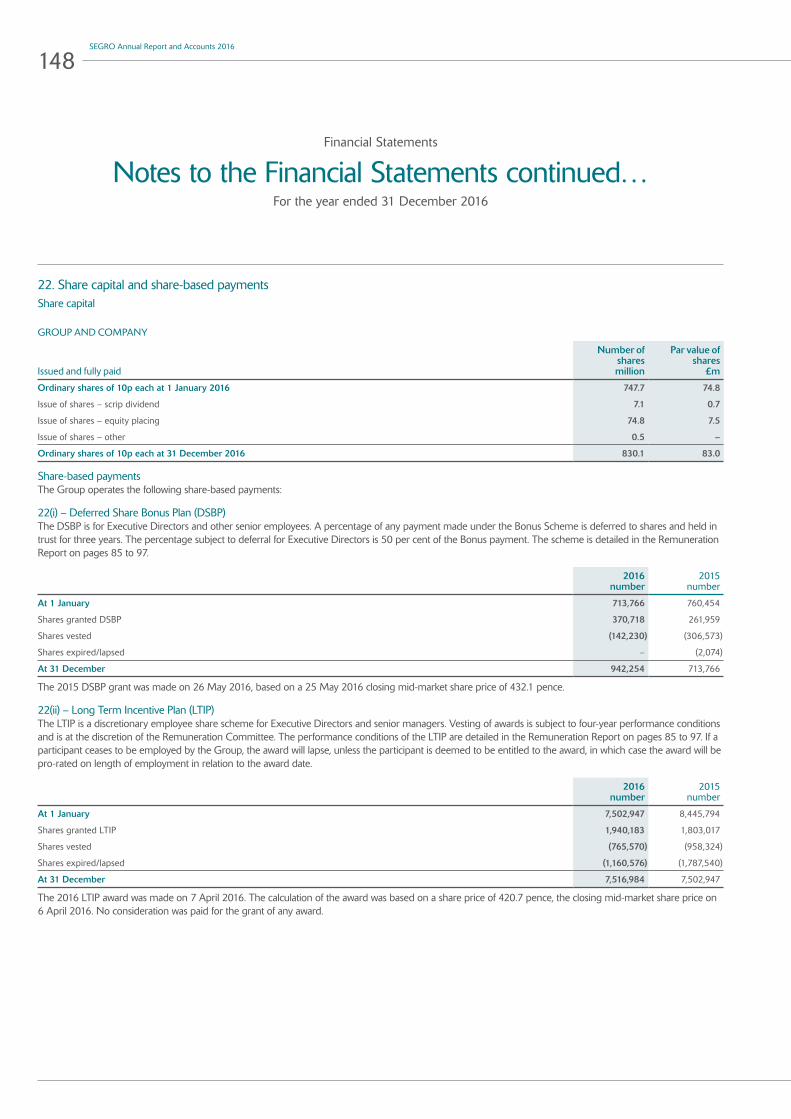
Financial Statements
Notes to the Financial Statements continued…For the year ended 31 December 2016
22. Share capital and share-based paymentsShare capital
GROUP AND COMPANY
Issued and fully paid
Number of shares million
Par value of shares
£m
Ordinary shares of 10p each at 1 January 2016 747.7 74.8
Issue of shares – scrip dividend 7.1 0.7
Issue of shares – equity placing 74.8 7.5
Issue of shares – other 0.5 –
Ordinary shares of 10p each at 31 December 2016 830.1 83.0
Share-based paymentsThe Group operates the following share-based payments:
22(i) – Deferred Share Bonus Plan (DSBP)The DSBP is for Executive Directors and other senior employees. A percentage of any payment made under the Bonus Scheme is deferred to shares and held in trust for three years. The percentage subject to deferral for Executive Directors is 50 per cent of the Bonus payment. The scheme is detailed in the Remuneration Report on pages 85 to 97.
2016
number2015
number
At 1 January 713,766 760,454
Shares granted DSBP 370,718 261,959
Shares vested (142,230) (306,573)
Shares expired/lapsed – (2,074)
At 31 December 942,254 713,766
The 2015 DSBP grant was made on 26 May 2016, based on a 25 May 2016 closing mid-market share price of 432.1 pence.
22(ii) – Long Term Incentive Plan (LTIP) The LTIP is a discretionary employee share scheme for Executive Directors and senior managers. Vesting of awards is subject to four-year performance conditions and is at the discretion of the Remuneration Committee. The performance conditions of the LTIP are detailed in the Remuneration Report on pages 85 to 97. If a participant ceases to be employed by the Group, the award will lapse, unless the participant is deemed to be entitled to the award, in which case the award will be pro-rated on length of employment in relation to the award date.
2016
number2015
number
At 1 January 7,502,947 8,445,794
Shares granted LTIP 1,940,183 1,803,017
Shares vested (765,570) (958,324)
Shares expired/lapsed (1,160,576) (1,787,540)
At 31 December 7,516,984 7,502,947
The 2016 LTIP award was made on 7 April 2016. The calculation of the award was based on a share price of 420.7 pence, the closing mid-market share price on 6 April 2016. No consideration was paid for the grant of any award.
148SEGRO Annual Report and Accounts 2016

22. Share capital and share-based payments continued22(ii) – Long Term Incentive Plan (LTIP) continuedThe Black-Scholes model has been used to fair value the shares granted currently under award, apart from the TSR elements of the award which uses the Monte Carlo model. The assumptions used are as follows:
Date of grant 1 May 2012 6 Aug 2013 9 Apr 2014 22 May 2015 7 April 2016
Market price used for award 221.1p 311.6p 339.5p 422.5p 420.7p
Risk-free interest rate 1.8% 1.1% 1.3% 1.0% 0.5%
Dividend yield 6.6% 4.7% 4.4% 3.6% 3.7%
Volatility 54.0% 26.0% 24.0% 20.0% 19.0%
Term 3 years/4 years 4 years 4 years 4 years 4 years
Fair value per share 183.0p/171.0p 257.6p 285.1p 366.1p 362.6p
22(iii) – Share Incentive Plan (SIP)The SIP is an HMRC approved all-employee share plan. UK employees, who have been employed by the Group since 1 October of the preceding year, may be awarded shares in relation to the Company’s prior year PBT performance. In 2016, as the PBT performance target was achieved in full participating employees were each awarded shares to the value of £3,000. If a participant ceases to be employed by the Group within three years from the date of award the shares will be forfeited, unless the employee is entitled to the shares due to certain leaver circumstances, in which case the shares will be transferred out of the trust to the participant.
2016
number2015
number
At 1 January 482,202 442,868
Shares granted 102,080 97,740
Shares released (78,704) (41,991)
Shares forfeited (21,433) (16,415)
At 31 December 484,145 482,202
As at 31 December 2016, 502,970 shares (2015: 494,528) are held in the SIP trust.
22(iv) – Global Share Incentive Plan (GSIP)The GSIP was launched in 2008 as an all-employee share scheme for non-UK based employees. It is not HMRC approved but the eligibility and performance conditions of the award are designed to replicate the SIP. Employees are granted awards which are released by the Trustees at conclusion of a three-year holding period. If a participant ceases to be employed by the Group during the three-year period then the award will lapse unless the participant is entitled to the award due to the terms of leaving. Shares in respect of the GSIP are held in the SEGRO plc Employees Benefit Trust.
2016
number2015
number
At 1 January 146,623 181,558
Shares granted 74,624 60,092
Shares released (53,473) (81,218)
Shares forfeited (12,850) (13,809)
At 31 December 154,924 146,623
22(v) – SharesaveThe Group operates an HMRC approved all-employee savings related share option plan for UK-based employees. For 2016, a three-year period was offered to employees and if they remain in employment, employees can purchase shares in the Company at a price which is fixed at the start of the saving period. The price is usually set at a 20 per cent discount to the then market price. If a participant ceases to be employed by the Group, in certain circumstances the participant may be able to exercise their options within a fixed period from the date of leaving. During 2016, the movements in Sharesave options were as follows:
2016 2015
Number of options
Weighted average
exercise priceNumber of
options
Weighted average
exercise price
At 1 January 326,155 284.8p 380,462 230.1p
Options granted 80,843 173.9p 124,933 335.6p
Options exercised (64,629) 86.3p (157,179) 191.3p
Options expired/lapsed (22,780) 200.2p (22,061) 296.1p
At 31 December 319,589 189.4p 326,155 284.8p
149Financial Statements
Overview Strategic Report Governance

Financial Statements
Notes to the Financial Statements continued…For the year ended 31 December 2016
22. Share capital and share-based payments continuedThe consideration received by the Company from options exercised during the year was £140,145 (2015: £367,658). The grants have been fair valued using the Black-Scholes model. The assumptions are as follows:
Date of grant
Number of options
outstandingMarket
priceExercise
priceRisk-free
interest rateDividend
yield Volatility Exercisable
Fair value per share
Three years
2 May 2014 134,127 339.8p 271.8p 1.3% 4.4% 24.0% 2017 67p
1 May 2015 110,135 419.5p 335.6p 1.0% 3.6% 20.0% 2018 78p
1 May 2016 75,327 411.9p 329.5p 0.5% 3.8% 19.0% 2019 70p
Total 319,589
A total of 319,589 (2015: 326,155) options exist at 31 December 2016 in relation to the Sharesave with a weighted average remaining contractual life of 1.76 years (2015: 2.12 years).
23. Share premium account
GROUP AND COMPANY2016
£m2015
£m
Balance at 1 January 1,091.4 1,070.0
Premium arising on the issue of shares – scrip dividend 28.8 21.1
Premium arising on the issue of shares – equity placing 310.8 –
Premium arising on the issue of shares – other 0.1 0.3
Balance at 31 December 1,431.1 1,091.4
Share premium is net of transaction costs of £7.0 million in respect of the equity placing.
The capital redemption reserve of £113.9 million arose in 2009 where shares were reclassified, cancelled and consolidated in connection with a rights issue.
The merger reserve of £169.1 million also arose in 2009 in connection with the acquisition of Brixton plc where the Group acquired 100 per cent of the voting equity of Brixton plc in a share for share exchange.
24. Own shares heldGroup Company
2016
£m2015
£m2016
£m2015
£m
Balance at 1 January 6.3 6.1 6.3 6.1
Shares purchased 2.3 6.7 2.3 6.7
Disposed of on exercise of options (3.1) (6.5) (3.1) (6.5)
Balance at 31 December 5.5 6.3 5.5 6.3
These represent the cost of shares in SEGRO plc bought in the open market and held by Estera Trust (Jersey) Limited (formerly Appleby Trust (Jersey) Limited) and Yorkshire Building Society, to satisfy various Group share schemes.
25. CommitmentsContractual obligations to purchase, construct, develop, repair, maintain or enhance assets are as follows:
GROUP2016
£m2015
£m
Properties 91.6 118.4
In addition, commitments in the Group’s joint ventures at 31 December 2016 (at share) amounted to £22.9 million (2015: £24.2 million).
26. Contingent liabilitiesThe Group has given performance guarantees to third parties amounting to £18.6 million (2015: £15.1 million) in respect of development contracts of subsidiary undertakings. It is unlikely that these contingencies will crystallise.
The Company has guaranteed loans and bank overdrafts of subsidiary undertakings and has indicated its intention to provide the necessary support required by its subsidiaries.
The Group has provided certain guarantees, representations and warranties in relation to developments and disposals which are usual for transactions of this nature, including representations and warranties relating to financial, regulatory and tax matters. Adequate amounts have been accrued for 31 December 2016 in relation to the representations and warranties provided.
150SEGRO Annual Report and Accounts 2016
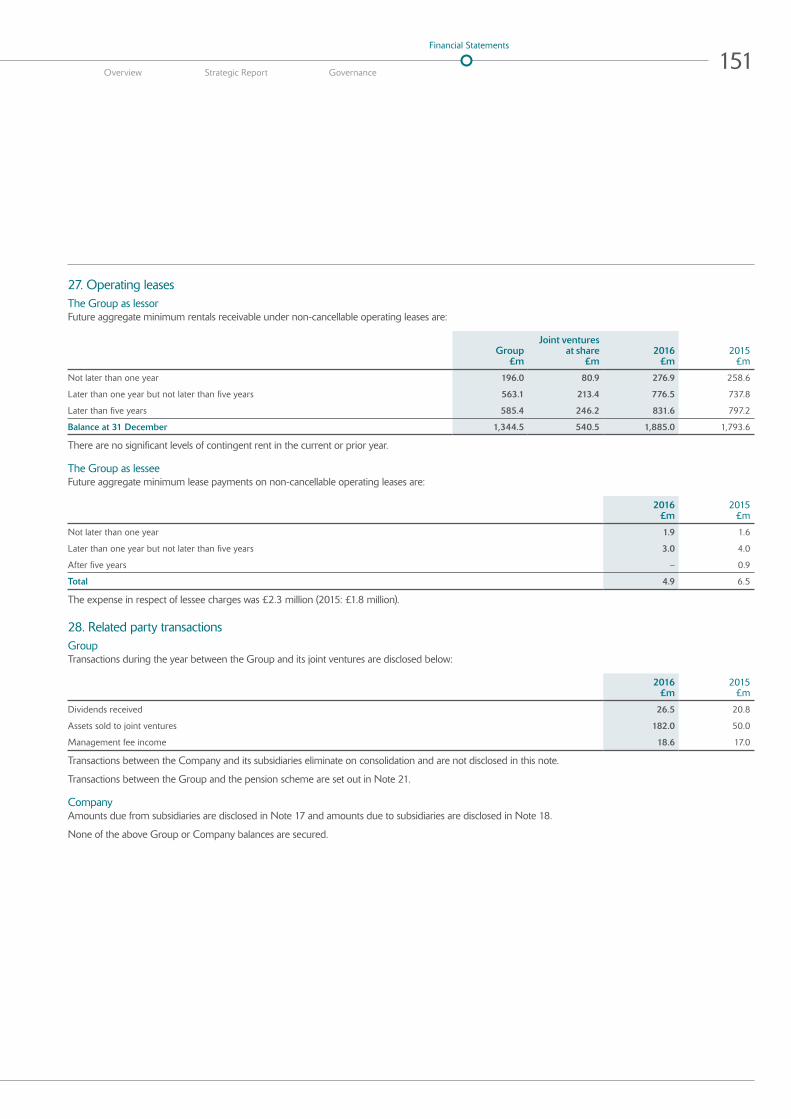
27. Operating leasesThe Group as lessorFuture aggregate minimum rentals receivable under non-cancellable operating leases are:
Group
£m
Joint ventures at share
£m2016
£m2015
£m
Not later than one year 196.0 80.9 276.9 258.6
Later than one year but not later than five years 563.1 213.4 776.5 737.8
Later than five years 585.4 246.2 831.6 797.2
Balance at 31 December 1,344.5 540.5 1,885.0 1,793.6
There are no significant levels of contingent rent in the current or prior year.
The Group as lesseeFuture aggregate minimum lease payments on non-cancellable operating leases are:
2016
£m2015
£m
Not later than one year 1.9 1.6
Later than one year but not later than five years 3.0 4.0
After five years – 0.9
Total 4.9 6.5
The expense in respect of lessee charges was £2.3 million (2015: £1.8 million).
28. Related party transactionsGroupTransactions during the year between the Group and its joint ventures are disclosed below:
2016
£m2015
£m
Dividends received 26.5 20.8
Assets sold to joint ventures 182.0 50.0
Management fee income 18.6 17.0
Transactions between the Company and its subsidiaries eliminate on consolidation and are not disclosed in this note.
Transactions between the Group and the pension scheme are set out in Note 21.
CompanyAmounts due from subsidiaries are disclosed in Note 17 and amounts due to subsidiaries are disclosed in Note 18.
None of the above Group or Company balances are secured.
151Financial Statements
Overview Strategic Report Governance

Financial Statements
Notes to the Financial Statements continued…For the year ended 31 December 2016
28. Related party transactions continuedRemuneration of key management personnelKey management personnel comprise Executive and Non-Executive Directors, as outlined in the Governance Report on pages 66 to 72. Key management personnel compensation is shown in the table below:
2016
£m2015
£m
Salaries and short-term benefits 5.2 4.9
Post-employment benefits – 0.1
Share-based payments 2.4 0.9
Total remuneration 7.6 5.9
More detailed information concerning Directors’ remuneration, shareholdings, pension entitlements, share options and other long-term incentive plans, as required by the Companies Act 2006, is shown in the Remuneration Report on pages 85 to 102.
29. Notes to the cash flow statements29(i) – Reconciliation of cash generated from operations
Group Company
2016
£m2015
£m2016
£m2015
£m
Operating profit/(loss) 498.7 777.5 384.8 (201.1)
Adjustments for:
Depreciation of property, plant and equipment 3.1 3.5 0.2 0.2
Share of profit from joint ventures after tax (85.1) (156.5) – –
Profit on sale of investment properties (16.4) (23.0) – –
Goodwill and other amounts written off on acquisitions and amortisation of intangibles 0.2 3.8 – –
Revaluation surplus on investment properties (231.3) (439.8) – –
Profit on sale of available-for-sale investments – (6.6) – –
Dividends and other income – – (232.1) (258.6)
Pension past service credit and settlement costs (2.3) 4.8 (2.3) –
Pensions and other provisions (1.2) (16.0) (3.8) (16.3)
Decrease in impairment of subsidiaries – – (171.5) (462.8)
Loss on recapitalisation of subsidiary – – – 904.2
165.7 147.7 (24.7) (34.4)
Changes in working capital:
Decrease in trading properties 17.6 3.5 – –
(Increase)/decrease in debtors and tenant incentives (31.2) (21.6) (1.7) 3.2
Increase/(decrease) in creditors 4.6 (5.7) (0.3) 0.6
Net cash inflow/(outflow) generated from operations 156.7 123.9 (26.7) (30.6)
29(ii) – DepositsTerm deposits for a period of three months or less are included within cash and cash equivalents.
29(iii) – Vailog acquisition 2015On 23 June 2015, the Group acquired 90 per cent of the voting equity in Vailog S.r.l. (Vailog), a privately owned Italian development business, for consideration of £28.0 million including £2.8 million contingent consideration which was paid subsequently in 2015 and related to a pre-let development becoming unconditional and to a tenant not exercising a right to purchase the property that they occupy.
The acquisition was accounted for in accordance with IFRS 3 Business Combinations and Goodwill of £2.0 million (primarily as a result of the difference between the value of the acquired investment properties as assessed by our external values and the consideration paid) and transaction costs of £1.6 million arose on acquisitions and were immediately charged to the Income Statement and shown within Goodwill and other amounts written off on acquisitions.
152SEGRO Annual Report and Accounts 2016
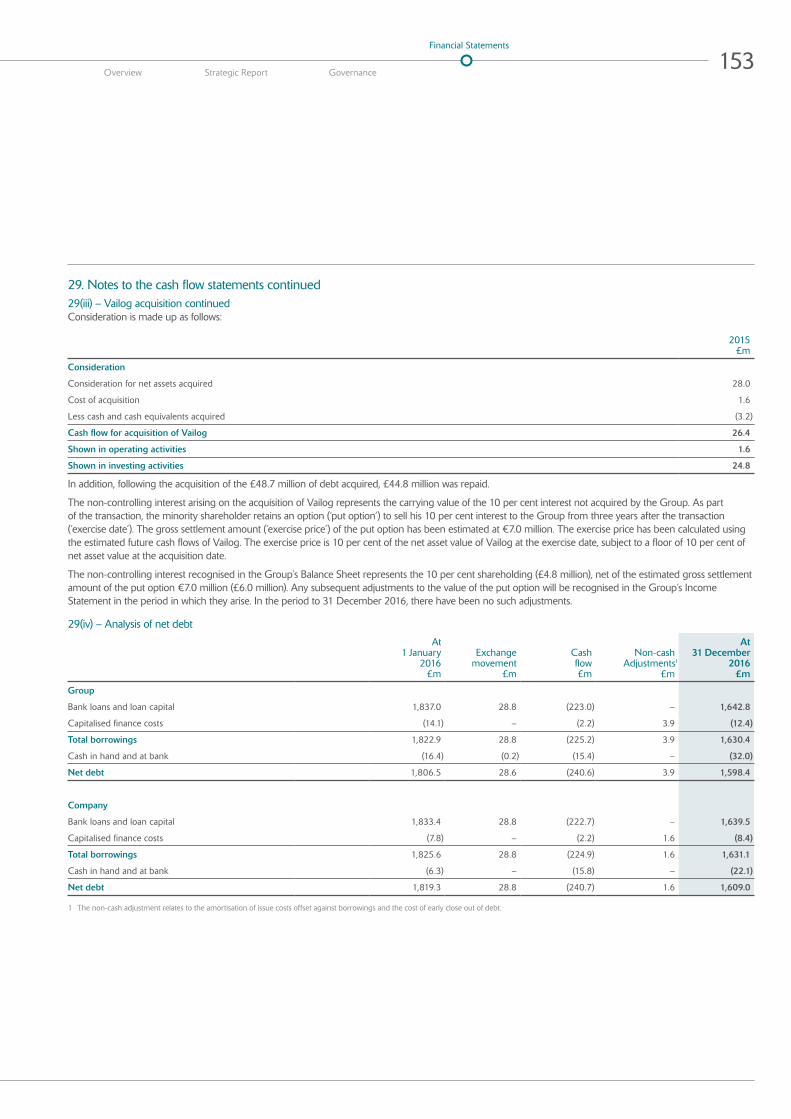
29. Notes to the cash flow statements continued29(iii) – Vailog acquisition continuedConsideration is made up as follows:
2015 £m
Consideration
Consideration for net assets acquired 28.0
Cost of acquisition 1.6
Less cash and cash equivalents acquired (3.2)
Cash flow for acquisition of Vailog 26.4
Shown in operating activities 1.6
Shown in investing activities 24.8
In addition, following the acquisition of the £48.7 million of debt acquired, £44.8 million was repaid.
The non-controlling interest arising on the acquisition of Vailog represents the carrying value of the 10 per cent interest not acquired by the Group. As part of the transaction, the minority shareholder retains an option (‘put option’) to sell his 10 per cent interest to the Group from three years after the transaction (‘exercise date’). The gross settlement amount (‘exercise price’) of the put option has been estimated at €7.0 million. The exercise price has been calculated using the estimated future cash flows of Vailog. The exercise price is 10 per cent of the net asset value of Vailog at the exercise date, subject to a floor of 10 per cent of net asset value at the acquisition date.
The non-controlling interest recognised in the Group’s Balance Sheet represents the 10 per cent shareholding (£4.8 million), net of the estimated gross settlement amount of the put option €7.0 million (£6.0 million). Any subsequent adjustments to the value of the put option will be recognised in the Group’s Income Statement in the period in which they arise. In the period to 31 December 2016, there have been no such adjustments.
29(iv) – Analysis of net debt
At 1 January
2016 £m
Exchange movement
£m
Cash flow £m
Non-cashAdjustments1
£m
At 31 December
2016 £m
Group
Bank loans and loan capital 1,837.0 28.8 (223.0) – 1,642.8
Capitalised finance costs (14.1) – (2.2) 3.9 (12.4)
Total borrowings 1,822.9 28.8 (225.2) 3.9 1,630.4
Cash in hand and at bank (16.4) (0.2) (15.4) – (32.0)
Net debt 1,806.5 28.6 (240.6) 3.9 1,598.4
Company
Bank loans and loan capital 1,833.4 28.8 (222.7) – 1,639.5
Capitalised finance costs (7.8) – (2.2) 1.6 (8.4)
Total borrowings 1,825.6 28.8 (224.9) 1.6 1,631.1
Cash in hand and at bank (6.3) – (15.8) – (22.1)
Net debt 1,819.3 28.8 (240.7) 1.6 1,609.0
1 The non-cash adjustment relates to the amortisation of issue costs offset against borrowings and the cost of early close out of debt.
153Financial Statements
Overview Strategic Report Governance

Financial Statements
Notes to the Financial Statements continued…For the year ended 31 December 2016
30. Property valuation techniques and related quantitative informationAll of the Group’s properties are level 3, as defined by IFRS 13, in the fair value hierarchy as at 31 December 2016 and there were no transfers between levels during the year. Level 3 inputs used in valuing the properties are those which are unobservable, as opposed to level 1 (inputs from quoted prices) and level 2 (observable inputs either directly, i.e. as prices, or indirectly, i.e. derived from prices).
Based on different approaches for different properties, the following valuation techniques can be used for the same class of assets:
The yield methodology valuation technique is used when valuing the Group’s assets which uses market rental values capitalised with a market capitalisation rate. The resulting valuations are cross-checked against the initial yields and the fair market values per square metre derived from actual market transactions for similar assets.
For properties under construction and the majority of land held for development, properties are valued using a residual method valuation. Under this methodology, the valuer assesses the investment value (using the above mentioned methodology for completed buildings). Deductions are then made for the total estimated costs to complete, including notional finance costs and developer’s profit, to take into account the hypothetical purchaser’s management of the remaining development process and their perception of risk with regard to construction and the property market (e.g. as regards potential cost overruns and letting risk). Land values are cross-checked against the rate per hectare derived from actual market transactions. Other land is also valued on this comparative basis, the ranges for which are (per hectare) £1.8 million – £9.1 million (2015: £1.3 million – £5.8 million) for the UK and £0.2 million – £2.5 million (2015: £0.2 million – £2.2 million) for Continental Europe.
An increase/decrease to ERV will increase/decrease valuations, while an increase/decrease to yield decreases/increases valuations.
An increase in ERV of 5 per cent, in isolation would increase the value of the property portfolio (including joint ventures at share) by £228.3 million (2015: £206.6 million); whilst a decrease in ERV of 5 per cent would reduce the value by £221.6 million (£2015: £198.7 million). Similarly, a decrease in yield by 25 bps would increase value by £266.2 million (2015: £237.7 million) whilst an increase in yield of 25 bps would decrease value by £243.7 million (2015: £218.1 million).
There are interrelationships between all these inputs as they are determined by market conditions. The existence of an increase in more than one input would be to magnify the impact on the valuation. The impact on the valuation will be mitigated by the interrelationship of two inputs in opposite directions, e.g. an increase in rent may be offset by an increase in yield. The below table includes wholly-owned and joint-venture assets at share in order to include the entire portfolio, the equivalent analysis for the range of inputs on a wholly-owned basis would not be significantly different.
Valuation Inputs
2016 By asset type
Completed5
£m
Land &development¹
£m
Combined property portfolio
£m
ERV²£ per sq m
ERVrange²£ per sq m
Net true equivalent
yield³%
Net true equivalent yield range
%
Big box warehouses > 10,000 sq m 2,272.6 2,272.6 54.5 19.3–251.1 6.0 4.5–10.2
Urban warehouses and light industrial buildings 2,747.5 2,747.5 103.9 25.6–258.3 5.8 4.7–9.4
Urban warehouses used as data centres 314.2 314.2 169.8 93.1–220.9 5.6 5.0–6.7
Higher value uses4 331.9 331.9 133.0 51.3–288.6 5.9 4.4–9.4
5,666.2 679.2 6,345.4 76.8 19.3–288.6 5.9 4.4–10.2
By ownership
Wholly-owned5 4,131.8 608.0 4,739.8 90.1 19.3–288.6 5.8 4.7–10.2
Joint ventures 1,534.4 71.2 1,605.6 56.4 30.8–258.3 6.1 4.4–8.1
Group Total 5,666.2 679.2 6,345.4 76.8 19.3–288.6 5.9 4.4–10.2
1 Land and development valuations by asset type are not available as land sites are not categorised by asset type. Combined property portfolio column will not cast down but row does cast across.
2 On a fully occupied basis.
3 In relation to the completed properties only.
4 Higher value uses includes offices and retail uses, such as trade counters, car showrooms and self-storage facilities.
5 Included in the completed portfolio, the wholly owned assets are: Big box £1,216.3 million (£1,187.4 million); light industrial £2,381.6 million (2015: £1,971.6 million); data centres £314.2 million (2015: £308.7 million); and higher value uses £219.7 million (2015: £491.7 million including offices).
154SEGRO Annual Report and Accounts 2016
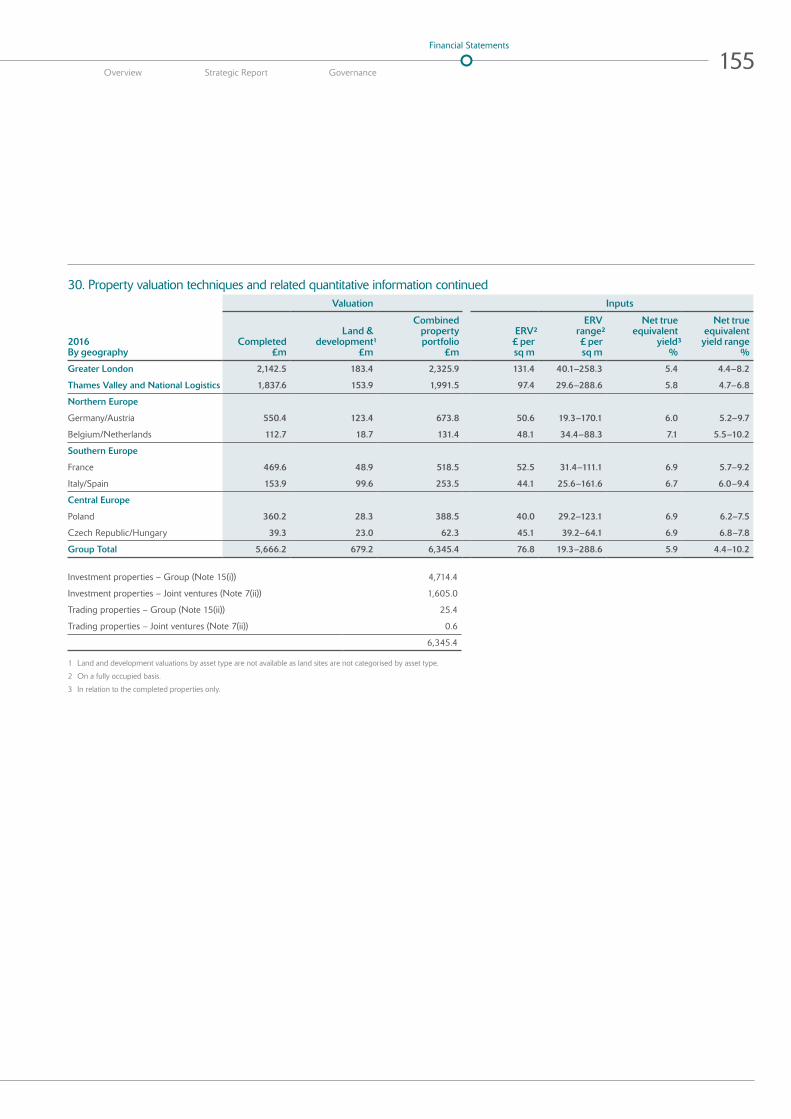
30. Property valuation techniques and related quantitative information continuedValuation Inputs
2016 By geography
Completed £m
Land &development¹
£m
Combined property portfolio
£m
ERV²£ per sq m
ERVrange²£ per sq m
Net true equivalent
yield³%
Net true equivalent yield range
%
Greater London 2,142.5 183.4 2,325.9 131.4 40.1–258.3 5.4 4.4–8.2
Thames Valley and National Logistics 1,837.6 153.9 1,991.5 97.4 29.6–288.6 5.8 4.7–6.8
Northern Europe
Germany/Austria 550.4 123.4 673.8 50.6 19.3–170.1 6.0 5.2–9.7
Belgium/Netherlands 112.7 18.7 131.4 48.1 34.4–88.3 7.1 5.5–10.2
Southern Europe
France 469.6 48.9 518.5 52.5 31.4–111.1 6.9 5.7–9.2
Italy/Spain 153.9 99.6 253.5 44.1 25.6–161.6 6.7 6.0–9.4
Central Europe
Poland 360.2 28.3 388.5 40.0 29.2–123.1 6.9 6.2–7.5
Czech Republic/Hungary 39.3 23.0 62.3 45.1 39.2–64.1 6.9 6.8–7.8
Group Total 5,666.2 679.2 6,345.4 76.8 19.3–288.6 5.9 4.4–10.2
Investment properties – Group (Note 15(i)) 4,714.4
Investment properties – Joint ventures (Note 7(ii)) 1,605.0
Trading properties – Group (Note 15(ii)) 25.4
Trading properties – Joint ventures (Note 7(ii)) 0.6
6,345.4
1 Land and development valuations by asset type are not available as land sites are not categorised by asset type.
2 On a fully occupied basis.
3 In relation to the completed properties only.
155Financial Statements
Overview Strategic Report Governance

Financial Statements
Notes to the Financial Statements continued…For the year ended 31 December 2016
30. Property valuation techniques and related quantitative information continuedValuation Inputs
2015 By asset type
Completed £m
Land &development¹
£m
Combined property portfolio
£m
ERV²£ per sq m
ERVrange²£ per sq m
Net true equivalent
yield³%
Net true equivalent yield range
%
Logistics warehouses > 10,000 sq m 1,948.8 1,948.8 48.3 15.9–199.0 6.0 4.8–12.3
Smaller warehouses and light industrial buildings 2,318.2 2,318.2 95.2 15.9–258.3 6.0 4.4–11.0
Warehouses used as data centres 308.7 308.7 172.6 91.5–219.3 5.7 5.5–6.4
Offices 306.7 306.7 195.0 53.8–290.6 6.7 5.5–10.7
Other business space 298.3 298.3 123.8 17.7–288.6 5.6 4.4–10.3
5,180.7 592.0 5,772.7 73.0 15.9–290.6 6.0 4.4–12.3
By ownership
Wholly-owned 3,959.4 502.4 4,461.8 84.8 15.9–290.6 6.1 4.8–12.3
Joint ventures 1,221.3 89.6 1,310.9 51.5 26.5–258.3 6.5 4.4–9.5
Group Total 5,180.7 592.0 5,772.7 73.0 15.9–290.6 6.0 4.4–12.3
1 Land and development valuations by asset type are not available as land sites are not categorised by asset type. Combined property portfolio column will not cast down but row does cast across.
2 On a fully occupied basis.
3 In relation to the completed properties only.
Valuation Inputs
2015 By geography
Completed £m
Land &development¹
£m
Combined property portfolio
£m
ERV²£ per sq m
ERVrange²£ per sq m
Net true equivalent
yield³%
Net true equivalent yield range
%
Greater London 1,983.1 227.1 2,210.2 120.8 34.6–258.3 5.5 4.4–8.6
Thames Valley and National Logistics 1,881.8 136.2 2,018.0 105.2 29.6–290.6 5.8 4.7–6.7
Northern Europe
Germany 428.2 64.1 492.3 40.1 15.9–123.5 6.3 5.5–12.3
Belgium/Netherlands/Austria 124.0 32.2 156.2 41.1 29.6–75.6 6.8 5.6–10.5
Southern Europe
France 379.3 42.9 422.2 44.9 25.3–95.6 7.1 5.8–9.2
Italy/Spain 60.8 37.7 98.5 29.5 23.1–58.8 6.8 6.4–10.4
Central Europe
Poland 289.5 31.2 320.7 34.9 26.5–105.9 6.9 6.2–8.0
Czech Republic/Hungary 34.0 20.6 54.6 39.1 33.8–70.6 7.1 6.8–7.2
Group Total 5,180.7 592.0 5,772.7 73.0 15.9–290.6 6.0 4.4–12.3
Less trader uplift – Group (Note 15(ii)) (0.1)
Less trader uplift – Joint Ventures (Note 7(i)) (1.6)
Less other adjustments (0.1)
5,770.9
Investment properties – Group (Note 15(i)) 4,424.0
Investment properties – Joint ventures (Note 7(ii)) 1,303.5
Trading properties – Group (Note 15(ii)) 37.6
Trading properties – Joint ventures (Note 7(ii)) 5.8
5,770.9
1 Land and development valuations by asset type are not available as land sites are not categorised by asset type. Combined property portfolio column will not cast down but row does cast across.
2 On a fully occupied basis.
3 In relation to the completed properties only.
156SEGRO Annual Report and Accounts 2016
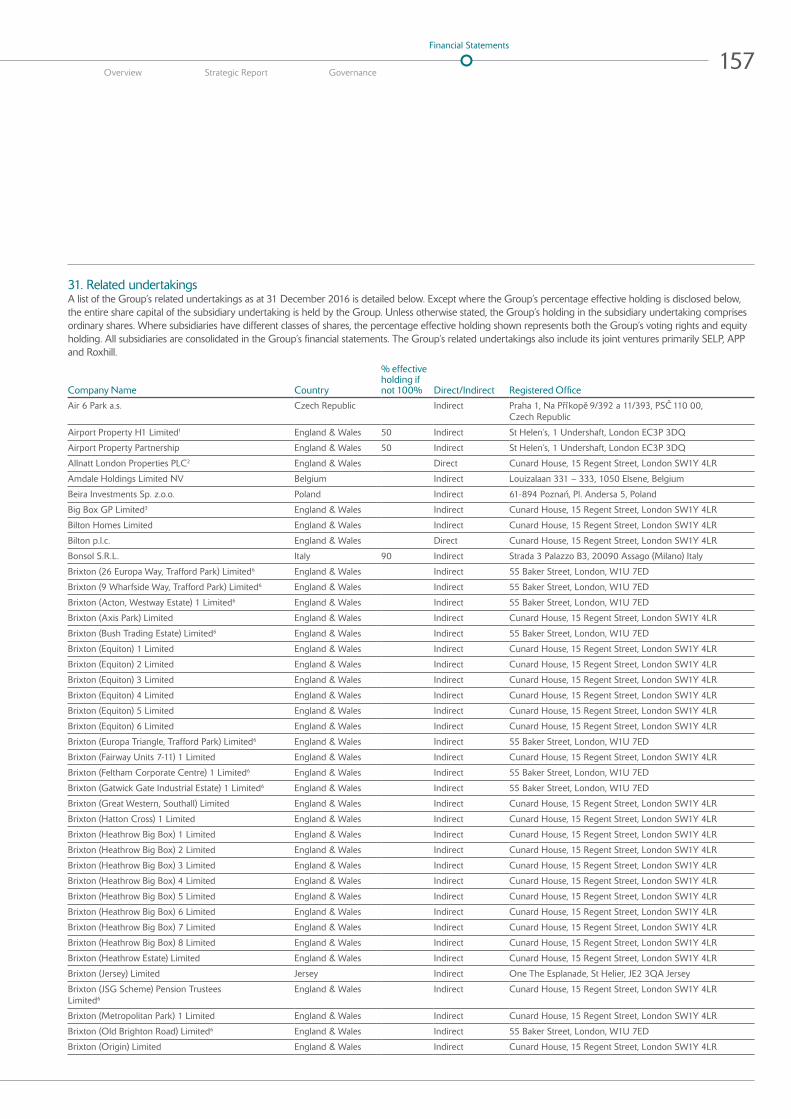
31. Related undertakingsA list of the Group’s related undertakings as at 31 December 2016 is detailed below. Except where the Group’s percentage effective holding is disclosed below, the entire share capital of the subsidiary undertaking is held by the Group. Unless otherwise stated, the Group’s holding in the subsidiary undertaking comprises ordinary shares. Where subsidiaries have different classes of shares, the percentage effective holding shown represents both the Group’s voting rights and equity holding. All subsidiaries are consolidated in the Group’s financial statements. The Group’s related undertakings also include its joint ventures primarily SELP, APP and Roxhill.
Company Name Country
% effective holding if not 100% Direct/Indirect Registered Office
Air 6 Park a.s. Czech Republic Indirect Praha 1, Na Pr ıkope 9/392 a 11/393, PSC 110 00, Czech Republic
Airport Property H1 Limited1 England & Wales 50 Indirect St Helen’s, 1 Undershaft, London EC3P 3DQ
Airport Property Partnership England & Wales 50 Indirect St Helen’s, 1 Undershaft, London EC3P 3DQ
Allnatt London Properties PLC2 England & Wales Direct Cunard House, 15 Regent Street, London SW1Y 4LR
Amdale Holdings Limited NV Belgium Indirect Louizalaan 331 – 333, 1050 Elsene, Belgium
Beira Investments Sp. z.o.o. Poland Indirect 61-894 Poznan, Pl. Andersa 5, Poland
Big Box GP Limited3 England & Wales Indirect Cunard House, 15 Regent Street, London SW1Y 4LR
Bilton Homes Limited England & Wales Indirect Cunard House, 15 Regent Street, London SW1Y 4LR
Bilton p.l.c. England & Wales Direct Cunard House, 15 Regent Street, London SW1Y 4LR
Bonsol S.R.L. Italy 90 Indirect Strada 3 Palazzo B3, 20090 Assago (Milano) Italy
Brixton (26 Europa Way, Trafford Park) Limited6 England & Wales Indirect 55 Baker Street, London, W1U 7ED
Brixton (9 Wharfside Way, Trafford Park) Limited6 England & Wales Indirect 55 Baker Street, London, W1U 7ED
Brixton (Acton, Westway Estate) 1 Limited6 England & Wales Indirect 55 Baker Street, London, W1U 7ED
Brixton (Axis Park) Limited England & Wales Indirect Cunard House, 15 Regent Street, London SW1Y 4LR
Brixton (Bush Trading Estate) Limited6 England & Wales Indirect 55 Baker Street, London, W1U 7ED
Brixton (Equiton) 1 Limited England & Wales Indirect Cunard House, 15 Regent Street, London SW1Y 4LR
Brixton (Equiton) 2 Limited England & Wales Indirect Cunard House, 15 Regent Street, London SW1Y 4LR
Brixton (Equiton) 3 Limited England & Wales Indirect Cunard House, 15 Regent Street, London SW1Y 4LR
Brixton (Equiton) 4 Limited England & Wales Indirect Cunard House, 15 Regent Street, London SW1Y 4LR
Brixton (Equiton) 5 Limited England & Wales Indirect Cunard House, 15 Regent Street, London SW1Y 4LR
Brixton (Equiton) 6 Limited England & Wales Indirect Cunard House, 15 Regent Street, London SW1Y 4LR
Brixton (Europa Triangle, Trafford Park) Limited6 England & Wales Indirect 55 Baker Street, London, W1U 7ED
Brixton (Fairway Units 7-11) 1 Limited England & Wales Indirect Cunard House, 15 Regent Street, London SW1Y 4LR
Brixton (Feltham Corporate Centre) 1 Limited6 England & Wales Indirect 55 Baker Street, London, W1U 7ED
Brixton (Gatwick Gate Industrial Estate) 1 Limited6 England & Wales Indirect 55 Baker Street, London, W1U 7ED
Brixton (Great Western, Southall) Limited England & Wales Indirect Cunard House, 15 Regent Street, London SW1Y 4LR
Brixton (Hatton Cross) 1 Limited England & Wales Indirect Cunard House, 15 Regent Street, London SW1Y 4LR
Brixton (Heathrow Big Box) 1 Limited England & Wales Indirect Cunard House, 15 Regent Street, London SW1Y 4LR
Brixton (Heathrow Big Box) 2 Limited England & Wales Indirect Cunard House, 15 Regent Street, London SW1Y 4LR
Brixton (Heathrow Big Box) 3 Limited England & Wales Indirect Cunard House, 15 Regent Street, London SW1Y 4LR
Brixton (Heathrow Big Box) 4 Limited England & Wales Indirect Cunard House, 15 Regent Street, London SW1Y 4LR
Brixton (Heathrow Big Box) 5 Limited England & Wales Indirect Cunard House, 15 Regent Street, London SW1Y 4LR
Brixton (Heathrow Big Box) 6 Limited England & Wales Indirect Cunard House, 15 Regent Street, London SW1Y 4LR
Brixton (Heathrow Big Box) 7 Limited England & Wales Indirect Cunard House, 15 Regent Street, London SW1Y 4LR
Brixton (Heathrow Big Box) 8 Limited England & Wales Indirect Cunard House, 15 Regent Street, London SW1Y 4LR
Brixton (Heathrow Estate) Limited England & Wales Indirect Cunard House, 15 Regent Street, London SW1Y 4LR
Brixton (Jersey) Limited Jersey Indirect One The Esplanade, St Helier, JE2 3QA Jersey
Brixton (JSG Scheme) Pension Trustees Limited6
England & Wales Indirect Cunard House, 15 Regent Street, London SW1Y 4LR
Brixton (Metropolitan Park) 1 Limited England & Wales Indirect Cunard House, 15 Regent Street, London SW1Y 4LR
Brixton (Old Brighton Road) Limited6 England & Wales Indirect 55 Baker Street, London, W1U 7ED
Brixton (Origin) Limited England & Wales Indirect Cunard House, 15 Regent Street, London SW1Y 4LR
157Financial Statements
Overview Strategic Report Governance
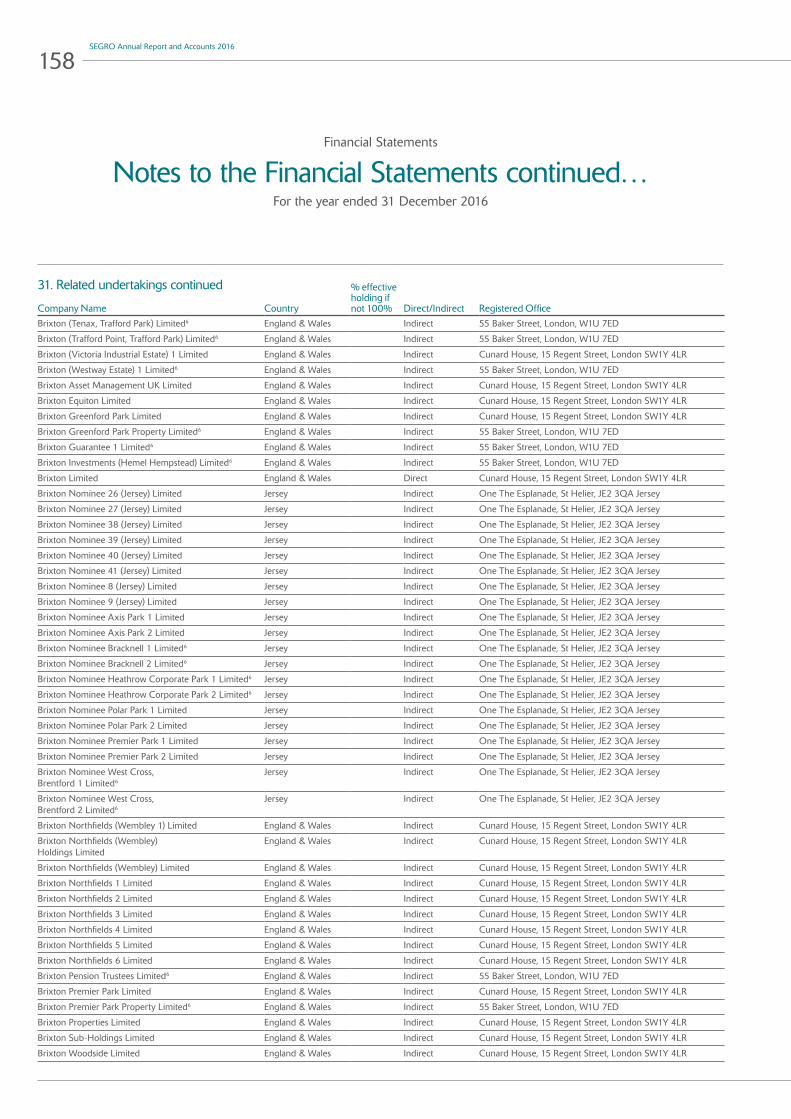
Financial Statements
Notes to the Financial Statements continued…For the year ended 31 December 2016
Company Name Country
% effective holding if not 100% Direct/Indirect Registered Office
Brixton (Tenax, Trafford Park) Limited6 England & Wales Indirect 55 Baker Street, London, W1U 7ED
Brixton (Trafford Point, Trafford Park) Limited6 England & Wales Indirect 55 Baker Street, London, W1U 7ED
Brixton (Victoria Industrial Estate) 1 Limited England & Wales Indirect Cunard House, 15 Regent Street, London SW1Y 4LR
Brixton (Westway Estate) 1 Limited6 England & Wales Indirect 55 Baker Street, London, W1U 7ED
Brixton Asset Management UK Limited England & Wales Indirect Cunard House, 15 Regent Street, London SW1Y 4LR
Brixton Equiton Limited England & Wales Indirect Cunard House, 15 Regent Street, London SW1Y 4LR
Brixton Greenford Park Limited England & Wales Indirect Cunard House, 15 Regent Street, London SW1Y 4LR
Brixton Greenford Park Property Limited6 England & Wales Indirect 55 Baker Street, London, W1U 7ED
Brixton Guarantee 1 Limited6 England & Wales Indirect 55 Baker Street, London, W1U 7ED
Brixton Investments (Hemel Hempstead) Limited6 England & Wales Indirect 55 Baker Street, London, W1U 7ED
Brixton Limited England & Wales Direct Cunard House, 15 Regent Street, London SW1Y 4LR
Brixton Nominee 26 (Jersey) Limited Jersey Indirect One The Esplanade, St Helier, JE2 3QA Jersey
Brixton Nominee 27 (Jersey) Limited Jersey Indirect One The Esplanade, St Helier, JE2 3QA Jersey
Brixton Nominee 38 (Jersey) Limited Jersey Indirect One The Esplanade, St Helier, JE2 3QA Jersey
Brixton Nominee 39 (Jersey) Limited Jersey Indirect One The Esplanade, St Helier, JE2 3QA Jersey
Brixton Nominee 40 (Jersey) Limited Jersey Indirect One The Esplanade, St Helier, JE2 3QA Jersey
Brixton Nominee 41 (Jersey) Limited Jersey Indirect One The Esplanade, St Helier, JE2 3QA Jersey
Brixton Nominee 8 (Jersey) Limited Jersey Indirect One The Esplanade, St Helier, JE2 3QA Jersey
Brixton Nominee 9 (Jersey) Limited Jersey Indirect One The Esplanade, St Helier, JE2 3QA Jersey
Brixton Nominee Axis Park 1 Limited Jersey Indirect One The Esplanade, St Helier, JE2 3QA Jersey
Brixton Nominee Axis Park 2 Limited Jersey Indirect One The Esplanade, St Helier, JE2 3QA Jersey
Brixton Nominee Bracknell 1 Limited6 Jersey Indirect One The Esplanade, St Helier, JE2 3QA Jersey
Brixton Nominee Bracknell 2 Limited6 Jersey Indirect One The Esplanade, St Helier, JE2 3QA Jersey
Brixton Nominee Heathrow Corporate Park 1 Limited6 Jersey Indirect One The Esplanade, St Helier, JE2 3QA Jersey
Brixton Nominee Heathrow Corporate Park 2 Limited6 Jersey Indirect One The Esplanade, St Helier, JE2 3QA Jersey
Brixton Nominee Polar Park 1 Limited Jersey Indirect One The Esplanade, St Helier, JE2 3QA Jersey
Brixton Nominee Polar Park 2 Limited Jersey Indirect One The Esplanade, St Helier, JE2 3QA Jersey
Brixton Nominee Premier Park 1 Limited Jersey Indirect One The Esplanade, St Helier, JE2 3QA Jersey
Brixton Nominee Premier Park 2 Limited Jersey Indirect One The Esplanade, St Helier, JE2 3QA Jersey
Brixton Nominee West Cross, Brentford 1 Limited6
Jersey Indirect One The Esplanade, St Helier, JE2 3QA Jersey
Brixton Nominee West Cross, Brentford 2 Limited6
Jersey Indirect One The Esplanade, St Helier, JE2 3QA Jersey
Brixton Northfields (Wembley 1) Limited England & Wales Indirect Cunard House, 15 Regent Street, London SW1Y 4LR
Brixton Northfields (Wembley) Holdings Limited
England & Wales Indirect Cunard House, 15 Regent Street, London SW1Y 4LR
Brixton Northfields (Wembley) Limited England & Wales Indirect Cunard House, 15 Regent Street, London SW1Y 4LR
Brixton Northfields 1 Limited England & Wales Indirect Cunard House, 15 Regent Street, London SW1Y 4LR
Brixton Northfields 2 Limited England & Wales Indirect Cunard House, 15 Regent Street, London SW1Y 4LR
Brixton Northfields 3 Limited England & Wales Indirect Cunard House, 15 Regent Street, London SW1Y 4LR
Brixton Northfields 4 Limited England & Wales Indirect Cunard House, 15 Regent Street, London SW1Y 4LR
Brixton Northfields 5 Limited England & Wales Indirect Cunard House, 15 Regent Street, London SW1Y 4LR
Brixton Northfields 6 Limited England & Wales Indirect Cunard House, 15 Regent Street, London SW1Y 4LR
Brixton Pension Trustees Limited6 England & Wales Indirect 55 Baker Street, London, W1U 7ED
Brixton Premier Park Limited England & Wales Indirect Cunard House, 15 Regent Street, London SW1Y 4LR
Brixton Premier Park Property Limited6 England & Wales Indirect 55 Baker Street, London, W1U 7ED
Brixton Properties Limited England & Wales Indirect Cunard House, 15 Regent Street, London SW1Y 4LR
Brixton Sub-Holdings Limited England & Wales Indirect Cunard House, 15 Regent Street, London SW1Y 4LR
Brixton Woodside Limited England & Wales Indirect Cunard House, 15 Regent Street, London SW1Y 4LR
31. Related undertakings continued
158SEGRO Annual Report and Accounts 2016
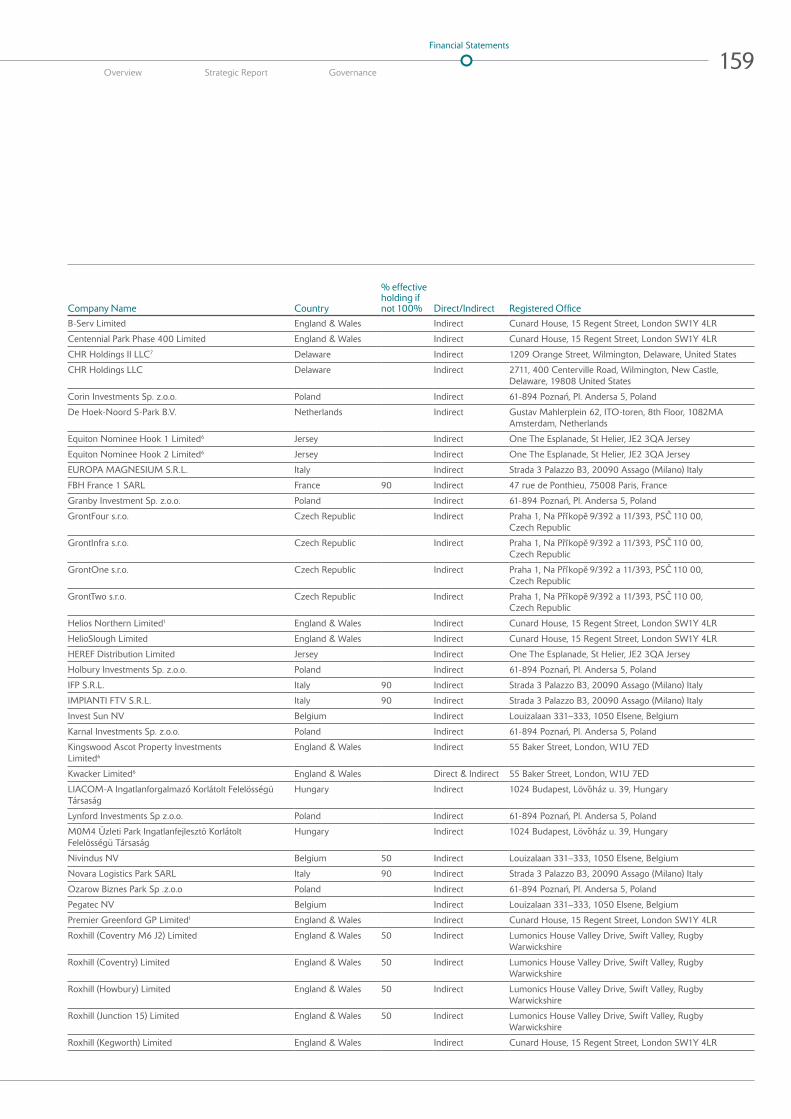
Company Name Country
% effective holding if not 100% Direct/Indirect Registered Office
B-Serv Limited England & Wales Indirect Cunard House, 15 Regent Street, London SW1Y 4LR
Centennial Park Phase 400 Limited England & Wales Indirect Cunard House, 15 Regent Street, London SW1Y 4LR
CHR Holdings II LLC7 Delaware Indirect 1209 Orange Street, Wilmington, Delaware, United States
CHR Holdings LLC Delaware Indirect 2711, 400 Centerville Road, Wilmington, New Castle, Delaware, 19808 United States
Corin Investments Sp. z.o.o. Poland Indirect 61-894 Poznan, Pl. Andersa 5, Poland
De Hoek-Noord S-Park B.V. Netherlands Indirect Gustav Mahlerplein 62, ITO-toren, 8th Floor, 1082MA Amsterdam, Netherlands
Equiton Nominee Hook 1 Limited6 Jersey Indirect One The Esplanade, St Helier, JE2 3QA Jersey
Equiton Nominee Hook 2 Limited6 Jersey Indirect One The Esplanade, St Helier, JE2 3QA Jersey
EUROPA MAGNESIUM S.R.L. Italy Indirect Strada 3 Palazzo B3, 20090 Assago (Milano) Italy
FBH France 1 SARL France 90 Indirect 47 rue de Ponthieu, 75008 Paris, France
Granby Investment Sp. z.o.o. Poland Indirect 61-894 Poznan, Pl. Andersa 5, Poland
GrontFour s.r.o. Czech Republic Indirect Praha 1, Na Pr ıkope 9/392 a 11/393, PSC 110 00, Czech Republic
GrontInfra s.r.o. Czech Republic Indirect Praha 1, Na Pr ıkope 9/392 a 11/393, PSC 110 00, Czech Republic
GrontOne s.r.o. Czech Republic Indirect Praha 1, Na Pr ıkope 9/392 a 11/393, PSC 110 00, Czech Republic
GrontTwo s.r.o. Czech Republic Indirect Praha 1, Na Pr ıkope 9/392 a 11/393, PSC 110 00, Czech Republic
Helios Northern Limited1 England & Wales Indirect Cunard House, 15 Regent Street, London SW1Y 4LR
HelioSlough Limited England & Wales Indirect Cunard House, 15 Regent Street, London SW1Y 4LR
HEREF Distribution Limited Jersey Indirect One The Esplanade, St Helier, JE2 3QA Jersey
Holbury Investments Sp. z.o.o. Poland Indirect 61-894 Poznan, Pl. Andersa 5, Poland
IFP S.R.L. Italy 90 Indirect Strada 3 Palazzo B3, 20090 Assago (Milano) Italy
IMPIANTI FTV S.R.L. Italy 90 Indirect Strada 3 Palazzo B3, 20090 Assago (Milano) Italy
Invest Sun NV Belgium Indirect Louizalaan 331–333, 1050 Elsene, Belgium
Karnal Investments Sp. z.o.o. Poland Indirect 61-894 Poznan, Pl. Andersa 5, Poland
Kingswood Ascot Property Investments Limited6
England & Wales Indirect 55 Baker Street, London, W1U 7ED
Kwacker Limited6 England & Wales Direct & Indirect 55 Baker Street, London, W1U 7ED
LIACOM-A Ingatlanforgalmazó Korlátolt Felelösségü Társaság
Hungary Indirect 1024 Budapest, Lövoház u. 39, Hungary
Lynford Investments Sp z.o.o. Poland Indirect 61-894 Poznan, Pl. Andersa 5, Poland
M0M4 Üzleti Park Ingatlanfejlesztö Korlátolt Felelösségü Társaság
Hungary Indirect 1024 Budapest, Lövoház u. 39, Hungary
Nivindus NV Belgium 50 Indirect Louizalaan 331–333, 1050 Elsene, Belgium
Novara Logistics Park SARL Italy 90 Indirect Strada 3 Palazzo B3, 20090 Assago (Milano) Italy
Ozarow Biznes Park Sp .z.o.o Poland Indirect 61-894 Poznan, Pl. Andersa 5, Poland
Pegatec NV Belgium Indirect Louizalaan 331–333, 1050 Elsene, Belgium
Premier Greenford GP Limited1 England & Wales Indirect Cunard House, 15 Regent Street, London SW1Y 4LR
Roxhill (Coventry M6 J2) Limited England & Wales 50 Indirect Lumonics House Valley Drive, Swift Valley, Rugby Warwickshire
Roxhill (Coventry) Limited England & Wales 50 Indirect Lumonics House Valley Drive, Swift Valley, Rugby Warwickshire
Roxhill (Howbury) Limited England & Wales 50 Indirect Lumonics House Valley Drive, Swift Valley, Rugby Warwickshire
Roxhill (Junction 15) Limited England & Wales 50 Indirect Lumonics House Valley Drive, Swift Valley, Rugby Warwickshire
Roxhill (Kegworth) Limited England & Wales Indirect Cunard House, 15 Regent Street, London SW1Y 4LR
159Financial Statements
Overview Strategic Report Governance

Financial Statements
Notes to the Financial Statements continued…For the year ended 31 December 2016
Company Name Country
% effective holding if not 100% Direct/Indirect Registered Office
Roxhill (Maidstone) Limited England & Wales 50 Indirect Lumonics House Valley Drive, Swift Valley, Rugby Warwickshire
Roxhill (Reading) Limited England & Wales 50 Indirect Lumonics House Valley Drive, Swift Valley, Rugby Warwickshire
Roxhill (Rushden) Limited England & Wales 50 Indirect Lumonics House Valley Drive, Swift Valley, Rugby Warwickshire
Roxhill (Tilbury 2) Limited England & Wales 50 Indirect Lumonics House Valley Drive, Swift Valley, Rugby Warwickshire
Roxhill Burton Latimer Limited England & Wales Indirect Cunard House, 15 Regent Street, London SW1Y 4LR
Roxhill Warth 3 Limited England & Wales 50 Indirect Lumonics House Valley Drive, Swift Valley, Rugby Warwickshire
Roxhill-SEGRO (Rugby Gateway) LLP England & Wales 50 Indirect Lumonics House Valley Drive, Swift Valley, Rugby Warwickshire
SC Union Business SRL Romania 90 Indirect Str. Caimatei n. 10, Corpo B, Sector 2, 030167 Bucharest, Romainia
SEGRO (225 Bath Road) Limited England & Wales Indirect Cunard House, 15 Regent Street, London SW1Y 4LR
SEGRO (Acton Park Estate) Limited England & Wales Indirect Cunard House, 15 Regent Street, London SW1Y 4LR
SEGRO (Barking 1) Limited England & Wales Indirect Cunard House, 15 Regent Street, London SW1Y 4LR
SEGRO (Barking 2) Limited England & Wales Indirect Cunard House, 15 Regent Street, London SW1Y 4LR
SEGRO (Barking 3) Limited England & Wales Indirect Cunard House, 15 Regent Street, London SW1Y 4LR
SEGRO (Barking) Limited England & Wales Indirect Cunard House, 15 Regent Street, London SW1Y 4LR
SEGRO (Blanc Mesnil) SARL France Indirect 20, rue Brunel, 75017 Paris, France
SEGRO (Brackmills) Limited England & Wales Indirect Cunard House, 15 Regent Street, London SW1Y 4LR
SEGRO (Bracknell) LLimited England & Wales Indirect Cunard House, 15 Regent Street, London SW1Y 4LR
SEGRO (Burton upon Trent) Limited England & Wales Indirect Cunard House, 15 Regent Street, London SW1Y 4LR
SEGRO (CRP) Limited6 England & Wales Indirect 55 Baker Street, London, W1U 7ED
SEGRO (Den Bosch) B.V. Netherlands Indirect Gustav Mahlerplein 62, ITO-toren, 8th Floor, 1082MA Amsterdam, Netherlands
SEGRO (Deptford Trading Estate) Limited England & Wales Indirect Cunard House, 15 Regent Street, London SW1Y 4LR
SEGRO (D-Link House) Limited England & Wales Indirect Cunard House, 15 Regent Street, London SW1Y 4LR
SEGRO (East Plus) Limited England & Wales Indirect Cunard House, 15 Regent Street, London SW1Y 4LR
SEGRO (Fairways Industrial Estate) Limited England & Wales Indirect Cunard House, 15 Regent Street, London SW1Y 4LR
SEGRO (Ferry Lane) Limited England & Wales Indirect Cunard House, 15 Regent Street, London SW1Y 4LR
SEGRO (Grange Park) Limited England & Wales Indirect Cunard House, 15 Regent Street, London SW1Y 4LR
SEGRO (Great Cambridge Industrial Estate) Limited England & Wales Indirect Cunard House, 15 Regent Street, London SW1Y 4LR
SEGRO (Hatton Farm Site A) Limited England & Wales Indirect Cunard House, 15 Regent Street, London SW1Y 4LR
SEGRO (Hatton Farm Site B) Limited England & Wales Indirect Cunard House, 15 Regent Street, London SW1Y 4LR
SEGRO (Hatton Farm Site C) Limited England & Wales Indirect Cunard House, 15 Regent Street, London SW1Y 4LR
SEGRO (Hayes Road) Limited England & Wales Indirect Cunard House, 15 Regent Street, London SW1Y 4LR
SEGRO (Hayes) Limited England & Wales Indirect Cunard House, 15 Regent Street, London SW1Y 4LR
SEGRO (Lee Park Distribution) Limited England & Wales Indirect Cunard House, 15 Regent Street, London SW1Y 4LR
SEGRO (Loop) Limited England & Wales Indirect Cunard House, 15 Regent Street, London SW1Y 4LR
SEGRO (Lutterworth) Limited England & Wales Indirect Cunard House, 15 Regent Street, London SW1Y 4LR
SEGRO (Mitchell Way) Limited6 England & Wales Indirect 55 Baker Street, London, W1U 7ED
SEGRO (Motor Park) Limited6 England & Wales Indirect 55 Baker Street, London, W1U 7ED
SEGRO (Nechells 1) Limited6 England & Wales Indirect 55 Baker Street, London, W1U 7ED
SEGRO (Nelson Trade Park) Limited England & Wales Indirect Cunard House, 15 Regent Street, London SW1Y 4LR
SEGRO (New Cross Business Centre) Limited England & Wales Indirect Cunard House, 15 Regent Street, London SW1Y 4LR
SEGRO (Parc des Damiers) SAS France Indirect 20, rue Brunel, 75017 Paris, France
SEGRO (Portsmouth) Limited6 England & Wales Indirect 55 Baker Street, London, W1U 7ED
31. Related undertakings continued
160SEGRO Annual Report and Accounts 2016
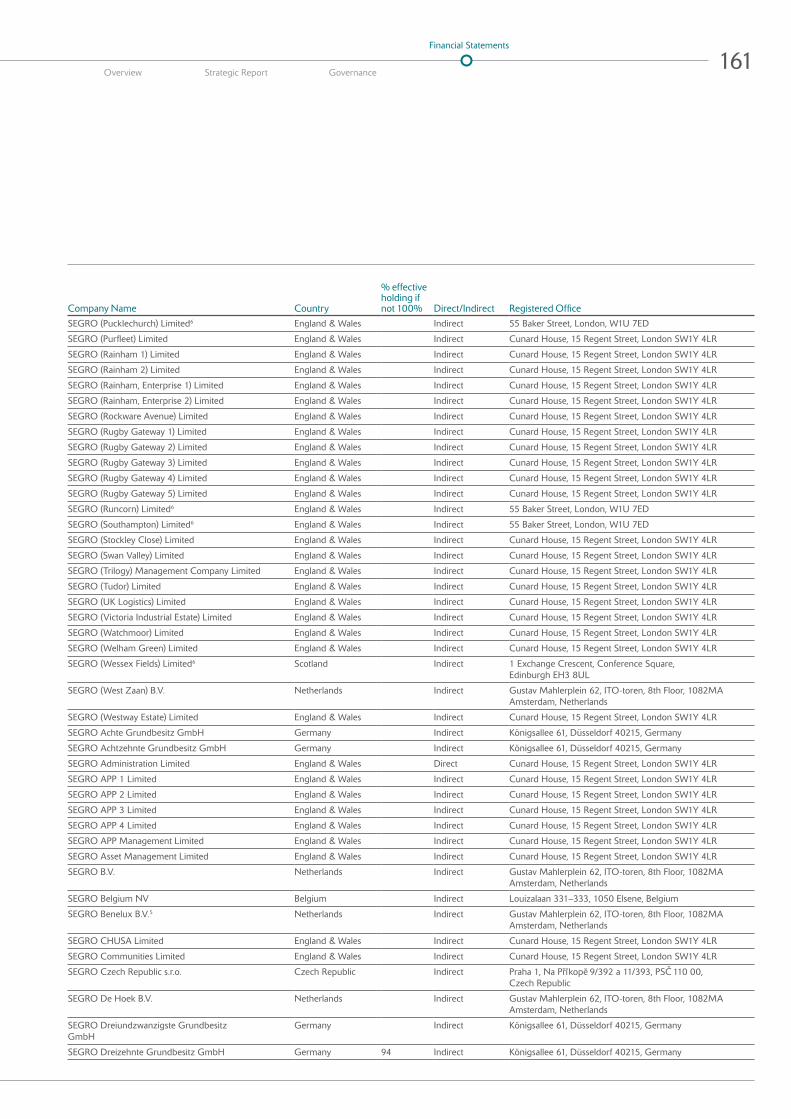
Company Name Country
% effective holding if not 100% Direct/Indirect Registered Office
SEGRO (Pucklechurch) Limited6 England & Wales Indirect 55 Baker Street, London, W1U 7ED
SEGRO (Purfleet) Limited England & Wales Indirect Cunard House, 15 Regent Street, London SW1Y 4LR
SEGRO (Rainham 1) Limited England & Wales Indirect Cunard House, 15 Regent Street, London SW1Y 4LR
SEGRO (Rainham 2) Limited England & Wales Indirect Cunard House, 15 Regent Street, London SW1Y 4LR
SEGRO (Rainham, Enterprise 1) Limited England & Wales Indirect Cunard House, 15 Regent Street, London SW1Y 4LR
SEGRO (Rainham, Enterprise 2) Limited England & Wales Indirect Cunard House, 15 Regent Street, London SW1Y 4LR
SEGRO (Rockware Avenue) Limited England & Wales Indirect Cunard House, 15 Regent Street, London SW1Y 4LR
SEGRO (Rugby Gateway 1) Limited England & Wales Indirect Cunard House, 15 Regent Street, London SW1Y 4LR
SEGRO (Rugby Gateway 2) Limited England & Wales Indirect Cunard House, 15 Regent Street, London SW1Y 4LR
SEGRO (Rugby Gateway 3) Limited England & Wales Indirect Cunard House, 15 Regent Street, London SW1Y 4LR
SEGRO (Rugby Gateway 4) Limited England & Wales Indirect Cunard House, 15 Regent Street, London SW1Y 4LR
SEGRO (Rugby Gateway 5) Limited England & Wales Indirect Cunard House, 15 Regent Street, London SW1Y 4LR
SEGRO (Runcorn) Limited6 England & Wales Indirect 55 Baker Street, London, W1U 7ED
SEGRO (Southampton) Limited6 England & Wales Indirect 55 Baker Street, London, W1U 7ED
SEGRO (Stockley Close) Limited England & Wales Indirect Cunard House, 15 Regent Street, London SW1Y 4LR
SEGRO (Swan Valley) Limited England & Wales Indirect Cunard House, 15 Regent Street, London SW1Y 4LR
SEGRO (Trilogy) Management Company Limited England & Wales Indirect Cunard House, 15 Regent Street, London SW1Y 4LR
SEGRO (Tudor) Limited England & Wales Indirect Cunard House, 15 Regent Street, London SW1Y 4LR
SEGRO (UK Logistics) Limited England & Wales Indirect Cunard House, 15 Regent Street, London SW1Y 4LR
SEGRO (Victoria Industrial Estate) Limited England & Wales Indirect Cunard House, 15 Regent Street, London SW1Y 4LR
SEGRO (Watchmoor) Limited England & Wales Indirect Cunard House, 15 Regent Street, London SW1Y 4LR
SEGRO (Welham Green) Limited England & Wales Indirect Cunard House, 15 Regent Street, London SW1Y 4LR
SEGRO (Wessex Fields) Limited6 Scotland Indirect 1 Exchange Crescent, Conference Square, Edinburgh EH3 8UL
SEGRO (West Zaan) B.V. Netherlands Indirect Gustav Mahlerplein 62, ITO-toren, 8th Floor, 1082MA Amsterdam, Netherlands
SEGRO (Westway Estate) Limited England & Wales Indirect Cunard House, 15 Regent Street, London SW1Y 4LR
SEGRO Achte Grundbesitz GmbH Germany Indirect Königsallee 61, Düsseldorf 40215, Germany
SEGRO Achtzehnte Grundbesitz GmbH Germany Indirect Königsallee 61, Düsseldorf 40215, Germany
SEGRO Administration Limited England & Wales Direct Cunard House, 15 Regent Street, London SW1Y 4LR
SEGRO APP 1 Limited England & Wales Indirect Cunard House, 15 Regent Street, London SW1Y 4LR
SEGRO APP 2 Limited England & Wales Indirect Cunard House, 15 Regent Street, London SW1Y 4LR
SEGRO APP 3 Limited England & Wales Indirect Cunard House, 15 Regent Street, London SW1Y 4LR
SEGRO APP 4 Limited England & Wales Indirect Cunard House, 15 Regent Street, London SW1Y 4LR
SEGRO APP Management Limited England & Wales Indirect Cunard House, 15 Regent Street, London SW1Y 4LR
SEGRO Asset Management Limited England & Wales Indirect Cunard House, 15 Regent Street, London SW1Y 4LR
SEGRO B.V. Netherlands Indirect Gustav Mahlerplein 62, ITO-toren, 8th Floor, 1082MA Amsterdam, Netherlands
SEGRO Belgium NV Belgium Indirect Louizalaan 331–333, 1050 Elsene, Belgium
SEGRO Benelux B.V.5 Netherlands Indirect Gustav Mahlerplein 62, ITO-toren, 8th Floor, 1082MA Amsterdam, Netherlands
SEGRO CHUSA Limited England & Wales Indirect Cunard House, 15 Regent Street, London SW1Y 4LR
SEGRO Communities Limited England & Wales Indirect Cunard House, 15 Regent Street, London SW1Y 4LR
SEGRO Czech Republic s.r.o. Czech Republic Indirect Praha 1, Na Pr ıkope 9/392 a 11/393, PSC 110 00, Czech Republic
SEGRO De Hoek B.V. Netherlands Indirect Gustav Mahlerplein 62, ITO-toren, 8th Floor, 1082MA Amsterdam, Netherlands
SEGRO Dreiundzwanzigste Grundbesitz GmbH
Germany Indirect Königsallee 61, Düsseldorf 40215, Germany
SEGRO Dreizehnte Grundbesitz GmbH Germany 94 Indirect Königsallee 61, Düsseldorf 40215, Germany
161Financial Statements
Overview Strategic Report Governance
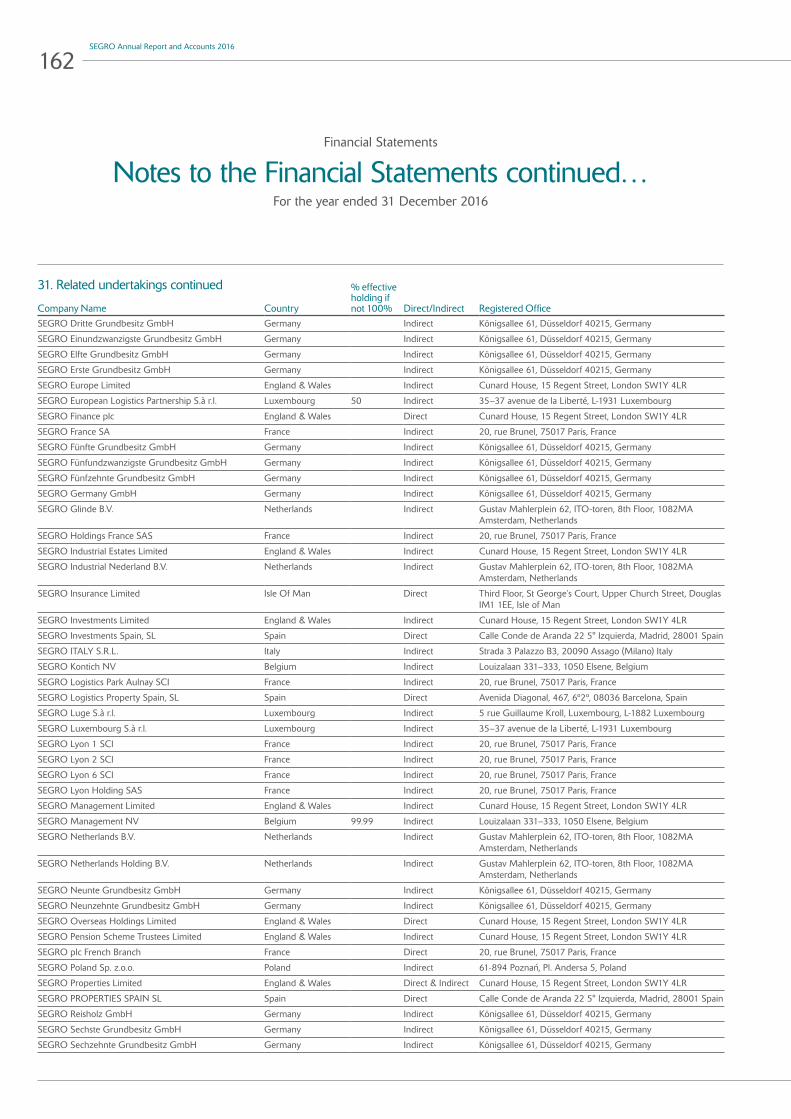
Financial Statements
Notes to the Financial Statements continued…For the year ended 31 December 2016
Company Name Country
% effective holding if not 100% Direct/Indirect Registered Office
SEGRO Dritte Grundbesitz GmbH Germany Indirect Königsallee 61, Düsseldorf 40215, Germany
SEGRO Einundzwanzigste Grundbesitz GmbH Germany Indirect Königsallee 61, Düsseldorf 40215, Germany
SEGRO Elfte Grundbesitz GmbH Germany Indirect Königsallee 61, Düsseldorf 40215, Germany
SEGRO Erste Grundbesitz GmbH Germany Indirect Königsallee 61, Düsseldorf 40215, Germany
SEGRO Europe Limited England & Wales Indirect Cunard House, 15 Regent Street, London SW1Y 4LR
SEGRO European Logistics Partnership S.à r.l. Luxembourg 50 Indirect 35–37 avenue de la Liberté, L-1931 Luxembourg
SEGRO Finance plc England & Wales Direct Cunard House, 15 Regent Street, London SW1Y 4LR
SEGRO France SA France Indirect 20, rue Brunel, 75017 Paris, France
SEGRO Fünfte Grundbesitz GmbH Germany Indirect Königsallee 61, Düsseldorf 40215, Germany
SEGRO Fünfundzwanzigste Grundbesitz GmbH Germany Indirect Königsallee 61, Düsseldorf 40215, Germany
SEGRO Fünfzehnte Grundbesitz GmbH Germany Indirect Königsallee 61, Düsseldorf 40215, Germany
SEGRO Germany GmbH Germany Indirect Königsallee 61, Düsseldorf 40215, Germany
SEGRO Glinde B.V. Netherlands Indirect Gustav Mahlerplein 62, ITO-toren, 8th Floor, 1082MA Amsterdam, Netherlands
SEGRO Holdings France SAS France Indirect 20, rue Brunel, 75017 Paris, France
SEGRO Industrial Estates Limited England & Wales Indirect Cunard House, 15 Regent Street, London SW1Y 4LR
SEGRO Industrial Nederland B.V. Netherlands Indirect Gustav Mahlerplein 62, ITO-toren, 8th Floor, 1082MA Amsterdam, Netherlands
SEGRO Insurance Limited Isle Of Man Direct Third Floor, St George’s Court, Upper Church Street, Douglas IM1 1EE, Isle of Man
SEGRO Investments Limited England & Wales Indirect Cunard House, 15 Regent Street, London SW1Y 4LR
SEGRO Investments Spain, SL Spain Direct Calle Conde de Aranda 22 5° Izquierda, Madrid, 28001 Spain
SEGRO ITALY S.R.L. Italy Indirect Strada 3 Palazzo B3, 20090 Assago (Milano) Italy
SEGRO Kontich NV Belgium Indirect Louizalaan 331–333, 1050 Elsene, Belgium
SEGRO Logistics Park Aulnay SCI France Indirect 20, rue Brunel, 75017 Paris, France
SEGRO Logistics Property Spain, SL Spain Direct Avenida Diagonal, 467, 6º2º, 08036 Barcelona, Spain
SEGRO Luge S.à r.l. Luxembourg Indirect 5 rue Guillaume Kroll, Luxembourg, L-1882 Luxembourg
SEGRO Luxembourg S.à r.l. Luxembourg Indirect 35–37 avenue de la Liberté, L-1931 Luxembourg
SEGRO Lyon 1 SCI France Indirect 20, rue Brunel, 75017 Paris, France
SEGRO Lyon 2 SCI France Indirect 20, rue Brunel, 75017 Paris, France
SEGRO Lyon 6 SCI France Indirect 20, rue Brunel, 75017 Paris, France
SEGRO Lyon Holding SAS France Indirect 20, rue Brunel, 75017 Paris, France
SEGRO Management Limited England & Wales Indirect Cunard House, 15 Regent Street, London SW1Y 4LR
SEGRO Management NV Belgium 99.99 Indirect Louizalaan 331–333, 1050 Elsene, Belgium
SEGRO Netherlands B.V. Netherlands Indirect Gustav Mahlerplein 62, ITO-toren, 8th Floor, 1082MA Amsterdam, Netherlands
SEGRO Netherlands Holding B.V. Netherlands Indirect Gustav Mahlerplein 62, ITO-toren, 8th Floor, 1082MA Amsterdam, Netherlands
SEGRO Neunte Grundbesitz GmbH Germany Indirect Königsallee 61, Düsseldorf 40215, Germany
SEGRO Neunzehnte Grundbesitz GmbH Germany Indirect Königsallee 61, Düsseldorf 40215, Germany
SEGRO Overseas Holdings Limited England & Wales Direct Cunard House, 15 Regent Street, London SW1Y 4LR
SEGRO Pension Scheme Trustees Limited England & Wales Indirect Cunard House, 15 Regent Street, London SW1Y 4LR
SEGRO plc French Branch France Direct 20, rue Brunel, 75017 Paris, France
SEGRO Poland Sp. z.o.o. Poland Indirect 61-894 Poznan, Pl. Andersa 5, Poland
SEGRO Properties Limited England & Wales Direct & Indirect Cunard House, 15 Regent Street, London SW1Y 4LR
SEGRO PROPERTIES SPAIN SL Spain Direct Calle Conde de Aranda 22 5° Izquierda, Madrid, 28001 Spain
SEGRO Reisholz GmbH Germany Indirect Königsallee 61, Düsseldorf 40215, Germany
SEGRO Sechste Grundbesitz GmbH Germany Indirect Königsallee 61, Düsseldorf 40215, Germany
SEGRO Sechzehnte Grundbesitz GmbH Germany Indirect Königsallee 61, Düsseldorf 40215, Germany
31. Related undertakings continued
162SEGRO Annual Report and Accounts 2016

Company Name Country
% effective holding if not 100% Direct/Indirect Registered Office
SEGRO Siebte Grundbesitz GmbH Germany Indirect Königsallee 61, Düsseldorf 40215, Germany
SEGRO Siebzehnte Grundbesitz GmbH Germany Indirect Königsallee 61, Düsseldorf 40215, Germany
SEGRO Spain Management, S.L. Spain Indirect Calle Conde de Aranda 22 5° Izquierda, Madrid, 28001 Spain
SEGRO Trading (France) SNC France Indirect 20, rue Brunel, 75017 Paris, France
SEGRO Vierte Grundbesitz GmbH Germany Indirect Königsallee 61, Düsseldorf 40215, Germany
SEGRO Vierundzwanzigste Grundbesitz GmbH
Germany Indirect Königsallee 61, Düsseldorf 40215, Germany
SEGRO Vierzehnte Grundbesitz GmbH Germany Indirect Königsallee 61, Düsseldorf 40215, Germany
SEGRO Zehnte Grundbesitz GmbH Germany Indirect Königsallee 61, Düsseldorf 40215, Germany
SEGRO Zwanzigste Grundbesitz GmbH Germany Indirect Königsallee 61, Düsseldorf 40215, Germany
SEGRO Zweite Grundbesitz GmbH Germany Indirect Königsallee 61, Düsseldorf 40215, Germany
SEGRO Zweiundzwanzigste Grundbesitz GmbH Germany Indirect Königsallee 61, Düsseldorf 40215, Germany
SEGRO Zwölfte Grundbesitz GmbH Germany Indirect Königsallee 61, Düsseldorf 40215, Germany
SELL INVEST ITALY S.R.L. Italy Indirect Strada 3 Palazzo B3, 20090 Assago (Milano) Italy
SELP (Alpha JV) S.à r.l. Luxembourg 50 Indirect 35–37 avenue de la Liberté, L-1931 Luxembourg
SELP Finance S.à r.l. Luxembourg 50 Indirect 35–37 avenue de la Liberté, L-1931 Luxembourg
SELP Investments S.à r.l. Luxembourg 50 Indirect 35–37 avenue de la Liberté, L-1931 Luxembourg
SELP Management Limited England & Wales Indirect Cunard House, 15 Regent Street, London SW1Y 4LR
SG Austria Brunnerstrasse GmbH Austria Indirect c/o ECOVIS Austrail Wirtschaftsprüfungs, und Steuerberatungsgesellschaft m.b.H., 1060 Wien, Schmalzhofgasse 4, Austria
Slough Trading Estate Limited England & Wales Direct Cunard House, 15 Regent Street, London SW1Y 4LR
TENEDOR S.R.L. Italy Indirect Strada 3 Palazzo B3, 20090 Assago (Milano) Italy
The Heathrow Big Box Industrial and Distribution Fund England & Wales Indirect Cunard House, 15 Regent Street, London SW1Y 4LR
The UK Logistics (Nominee 1) Limited England & Wales Indirect Cunard House, 15 Regent Street, London SW1Y 4LR
The UK Logistics (Nominee 2) Limited England & Wales Indirect Cunard House, 15 Regent Street, London SW1Y 4LR
The UK Logistics General Partner (Jersey) Limited Jersey Indirect Ogier House, The Esplanade, St Helier JE4 9WG, Jersey
The UK Logistics General Partner Limited England & Wales Indirect Cunard House, 15 Regent Street, London SW1Y 4LR
The UK Logistics Limited Partnership England & Wales Indirect Cunard House, 15 Regent Street, London SW1Y 4LR
Trafford Park 1 Limited6 Guernsey Indirect 1st and 2nd Floors, Elizabeth House, Les Ruettes Brayes, St Peter Port, GY1 1EW Guernsey
Trafford Park 2 Limited6 Guernsey Indirect 1st and 2nd Floors, Elizabeth House, Les Ruettes Brayes, St Peter Port, GY1 1EW Guernsey
Trafford Park Estates Limited England & Wales Indirect Cunard House, 15 Regent Street, London SW1Y 4LR
UK Logistics (Jersey) GP Limited1 Jersey Indirect Ogier House, The Esplanade, St Helier JE4 9WG, Jersey
UK Logistics Fund Unit Trust Jersey Indirect Ogier House, The Esplanade, St Helier JE4 9WG, Jersey
UK Logistics Properties No 1 Unit Trust Jersey Indirect Ogier House, The Esplanade, St Helier JE4 9WG, Jersey
UK Logistics Properties No 2 Unit Trust Jersey Indirect Ogier House, The Esplanade, St Helier JE4 9WG, Jersey
UK Logistics Trustee Limited Jersey Indirect Ogier House, The Esplanade, St Helier JE4 9WG, Jersey
Vailog Bonneuil SARL France 90 Indirect 47 rue de Ponthieu, 75008 Paris, France
Vailog Energy 1 S.R.L. Italy 90 Indirect Strada 3 Palazzo B3, 20090 Assago (Milano) Italy
Vailog Energy 2 S.R.L. Italy 90 Indirect Strada 3 Palazzo B3, 20090 Assago (Milano) Italy
Vailog Energy 3 S.R.L. Italy 90 Indirect Strada 3 Palazzo B3, 20090 Assago (Milano) Italy
Vailog Holding France France 90 Indirect 47 rue de Ponthieu, 75008 Paris, France
Vailog S.R.L. Italy 90 Indirect Strada 3 Palazzo B3, 20090 Assago (Milano) Italy
Vailpar B.V. Netherlands 90 Indirect Herengracht 289D, 1016 BL Amsterdam, Netherlands
Voyager Park South Management Company Limited4 England & Wales 88.49 Indirect Cunard House, 15 Regent Street, London SW1Y 4LR
Warth Park (No. 1) Limited England & Wales Indirect Cunard House, 15 Regent Street, London SW1Y 4LR
Wroclaw Industrial Park Sp. z.o.o Poland 50 Indirect 61-894 Poznan, Pl. Andersa 5, Poland
163Financial Statements
Overview Strategic Report Governance
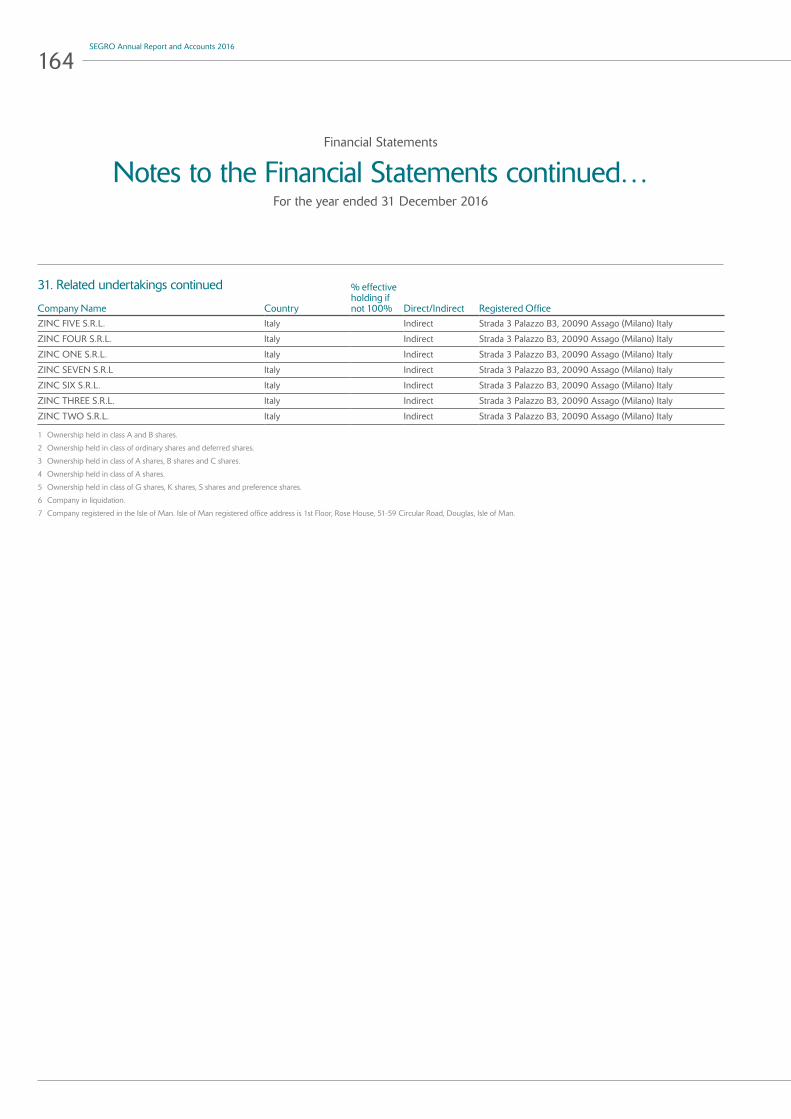
Financial Statements
Notes to the Financial Statements continued…For the year ended 31 December 2016
Company Name Country
% effective holding if not 100% Direct/Indirect Registered Office
ZINC FIVE S.R.L. Italy Indirect Strada 3 Palazzo B3, 20090 Assago (Milano) Italy
ZINC FOUR S.R.L. Italy Indirect Strada 3 Palazzo B3, 20090 Assago (Milano) Italy
ZINC ONE S.R.L. Italy Indirect Strada 3 Palazzo B3, 20090 Assago (Milano) Italy
ZINC SEVEN S.R.L Italy Indirect Strada 3 Palazzo B3, 20090 Assago (Milano) Italy
ZINC SIX S.R.L. Italy Indirect Strada 3 Palazzo B3, 20090 Assago (Milano) Italy
ZINC THREE S.R.L. Italy Indirect Strada 3 Palazzo B3, 20090 Assago (Milano) Italy
ZINC TWO S.R.L. Italy Indirect Strada 3 Palazzo B3, 20090 Assago (Milano) Italy
1 Ownership held in class A and B shares.
2 Ownership held in class of ordinary shares and deferred shares.
3 Ownership held in class of A shares, B shares and C shares.
4 Ownership held in class of A shares.
5 Ownership held in class of G shares, K shares, S shares and preference shares.
6 Company in liquidation.
7 Company registered in the Isle of Man. Isle of Man registered office address is 1st Floor, Rose House, 51-59 Circular Road, Douglas, Isle of Man.
31. Related undertakings continued
164SEGRO Annual Report and Accounts 2016
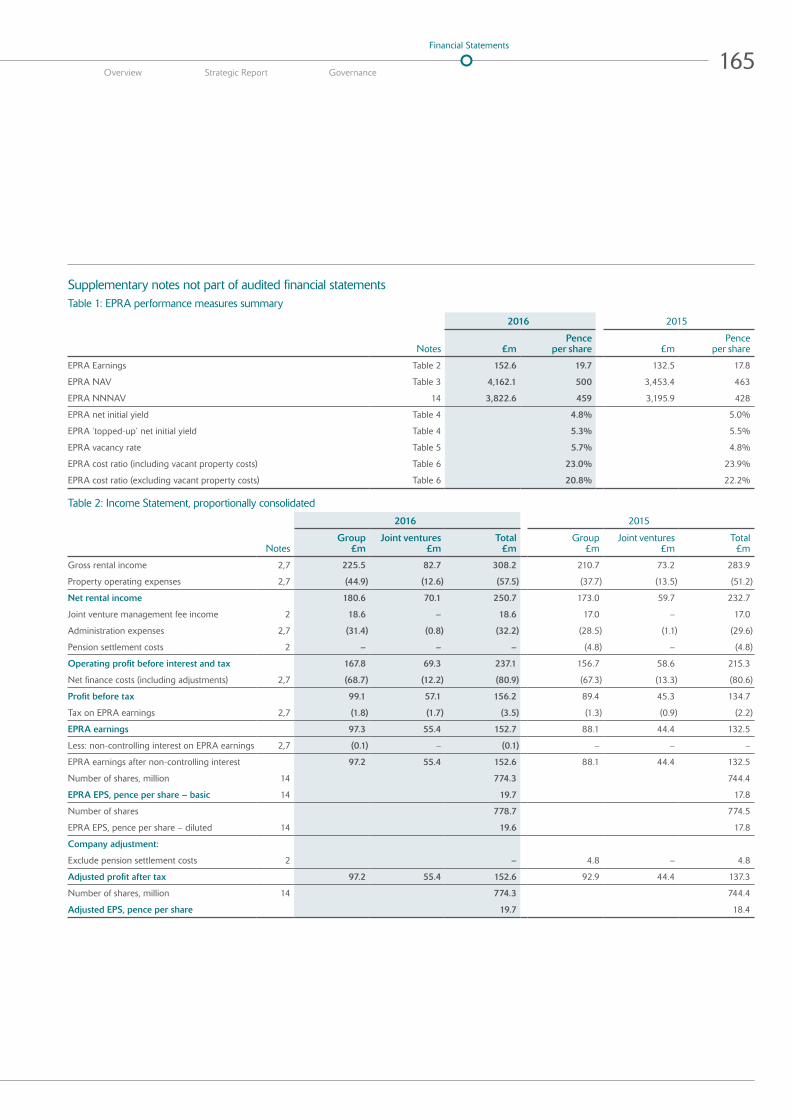
Supplementary notes not part of audited financial statementsTable 1: EPRA performance measures summary
2016 2015
Notes £mPence
per share £mPence
per share
EPRA Earnings Table 2 152.6 19.7 132.5 17.8
EPRA NAV Table 3 4,162.1 500 3,453.4 463
EPRA NNNAV 14 3,822.6 459 3,195.9 428
EPRA net initial yield Table 4 4.8% 5.0%
EPRA ‘topped-up’ net initial yield Table 4 5.3% 5.5%
EPRA vacancy rate Table 5 5.7% 4.8%
EPRA cost ratio (including vacant property costs) Table 6 23.0% 23.9%
EPRA cost ratio (excluding vacant property costs) Table 6 20.8% 22.2%
Table 2: Income Statement, proportionally consolidated
2016 2015
NotesGroup
£mJoint ventures
£mTotal
£mGroup
£mJoint ventures
£mTotal £m
Gross rental income 2,7 225.5 82.7 308.2 210.7 73.2 283.9
Property operating expenses 2,7 (44.9) (12.6) (57.5) (37.7) (13.5) (51.2)
Net rental income 180.6 70.1 250.7 173.0 59.7 232.7
Joint venture management fee income 2 18.6 – 18.6 17.0 – 17.0
Administration expenses 2,7 (31.4) (0.8) (32.2) (28.5) (1.1) (29.6)
Pension settlement costs 2 – – – (4.8) – (4.8)
Operating profit before interest and tax 167.8 69.3 237.1 156.7 58.6 215.3
Net finance costs (including adjustments) 2,7 (68.7) (12.2) (80.9) (67.3) (13.3) (80.6)
Profit before tax 99.1 57.1 156.2 89.4 45.3 134.7
Tax on EPRA earnings 2,7 (1.8) (1.7) (3.5) (1.3) (0.9) (2.2)
EPRA earnings 97.3 55.4 152.7 88.1 44.4 132.5
Less: non-controlling interest on EPRA earnings 2,7 (0.1) – (0.1) – – –
EPRA earnings after non-controlling interest 97.2 55.4 152.6 88.1 44.4 132.5
Number of shares, million 14 774.3 744.4
EPRA EPS, pence per share – basic 14 19.7 17.8
Number of shares 778.7 774.5
EPRA EPS, pence per share – diluted 14 19.6 17.8
Company adjustment:
Exclude pension settlement costs 2 – 4.8 – 4.8
Adjusted profit after tax 97.2 55.4 152.6 92.9 44.4 137.3
Number of shares, million 14 774.3 744.4
Adjusted EPS, pence per share 19.7 18.4
165Financial Statements
Overview Strategic Report Governance

Financial Statements
Notes to the Financial Statements continued…For the year ended 31 December 2016
Supplementary notes not part of audited financial statements continuedTable 3: Balance Sheet, proportionally consolidated
2016 2015
NotesGroup
£mJoint ventures
£mTotal
£mGroup
£mJoint ventures
£mTotal £m
Investment properties 15,7 4,714.4 1,605.0 6,319.4 4,424.0 1,303.5 5,727.5
Trading properties 15,7 25.4 0.6 26.0 37.6 5.8 43.4
Total properties 4,739.8 1,605.6 6,345.4 4,461.6 1,309.3 5,770.9
Investment in joint ventures 7 1,066.2 (1,066.2) – 867.3 (867.3) –
Other net assets/(liabilities) (25.5) (46.8) (72.3) (32.5) (55.3) (87.8)
Net borrowings 19,7 (1,598.4) (492.6) (2,091.0) (1,806.5) (386.7) (2,193.2)
Total shareholders’ equity1 4,182.1 – 4,182.1 3,489.9 – 3,489.9
EPRA adjustments 14 (20.0) (36.5)
EPRA NAV 14 4,162.1 3,453.4
Number of shares, million 14 833.2 746.3
EPRA NAV, pence per share 14 500 463
1 After non-controlling interests.
Note: Loan to value of 33% is calculated as net borrowings of £2,091.0 million divided by total properties £6,345.4 million (2015: 38%; £2,193.2 million net borrowings; £5,770.9 million total properties).
Table 4: EPRA net initial yield and topped-up net initial yield
Combined property portfolio including joint ventures at share – 2016 NotesUK £m
Continental Europe
£mTotal
£m
Total properties per financial statements Table 4 4,317.4 2,028.0 6,345.4
Add valuation surplus not recognised on trading properties¹ – – –
Combined property portfolio per external valuers’ reports 4,317.4 2,028.0 6,345.4
Less development properties (investment, trading and joint ventures) (337.3) (341.9) (679.2)
Net valuation of completed properties 3,980.1 1,686.1 5,666.2
Add notional purchasers’ costs 268.3 84.2 352.5
Gross valuation of completed properties including notional purchasers’ costs A 4,248.4 1,770.3 6,018.7
£m £m £m
Income
Gross passing rent² 182.5 112.9 295.4
Less irrecoverable property costs (2.9) (5.3) (8.2)
Net passing rent B 179.6 107.6 287.2
Adjustment for notional rent in respect of rent frees 22.0 9.7 31.7
Topped up net rent C 201.6 117.3 318.9
Including fixed/minimum uplifts3 8.5 0.7 9.2
Total topped up net rent 210.1 118.0 328.1
Yields – 2016 UK %
Continental Europe
%Total
%
EPRA net initial yield B/A 4.2 6.1 4.8
EPRA topped-up net initial yield C/A 4.7 6.6 5.3
Net true equivalent yield 5.6 6.6 5.9
1 Trading properties are recorded in the financial statements at the lower of cost and net realisable value, therefore valuations above cost have not been recognised.
2 Gross passing rent excludes short-term lettings and licences.
3 Certain leases contain clauses which guarantee future rental increases, whereas most leases contain five yearly, upwards only rent review clauses (UK) or indexation clauses (Continental Europe).
166SEGRO Annual Report and Accounts 2016

Supplementary notes not part of audited financial statements continuedTable 5: EPRA vacancy rate
2016
£m2015
£m
Annualised potential rental value of vacant premises 20.3 15.9
Annualised potential rental value for the completed property portfolio 354.0 328.2
EPRA vacancy rate 5.7% 4.8%
Table 6: EPRA cost ratio/Total cost ratio
EPRA cost ratio Notes2016
£m2015
£m
Costs
Property operating expenses¹ 5 44.9 37.7
Administration expenses 6 31.4 28.5
Pension settlement costs 2 – 4.8
Share of joint venture property operating and administration expenses² 7 13.1 11.4
Less:
Joint venture property management fee income and management fees5 (18.9) (14.8)
Total costs (A) 70.5 67.6
Group vacant property costs 5 (5.6) (3.4)
Share of joint venture vacant property costs 7 (1.1) (1.3)
Total costs excluding vacant property costs (B) 63.8 62.9
Gross rental income
Gross rental income 4 225.5 210.7
Less: management fees5 4 (1.2) (1.0)
Share of joint venture property gross rental income 7 82.7 73.2
Total gross rental income (C) 307.0 282.9
Total EPRA cost ratio (including vacant property costs) (A)/(C) 23.0% 23.9%
Total EPRA cost ratio (excluding vacant property costs) (B)/(C) 20.8% 22.2%
Total costs (A) 70.5 67.6
Pension settlement costs 2 – (4.8)
Total costs after non-EPRA adjustments (D) 70.5 62.8
Group vacant property costs 5 (5.6) (3.4)
Share of joint venture vacant property costs 7 (1.1) (1.3)
Total costs excluding vacant property costs (E) 63.8 58.1
Total gross rental income (C) 307.0 282.9
Total cost ratio3 (including vacant property costs) (D)/(C) 23.0% 22.2%
Total cost ratio3 (excluding vacant property costs) (E)/(C) 20.8% 20.5%
Total costs after non-EPRA adjustments (D) 70.5 62.8
Share based payments 6 (6.1) (2.3)
Total costs after non-EPRA adjustments and share based payments (F) 64.4 60.5
Total gross rental income (C) 307.0 282.9
Total cost ratio after non-EPRA adjustments and share based payments4 21.0% 21.4%
1 Property operating expenses are net of costs capitalised in accordance with IFRS of £3.6 million (FY15: £2.7 million) (see Note 5 for further detail on the nature of costs capitalised).
2 Share of joint venture property operating and administration expenses after deducting costs related to performance and other fees.
3 Adjusted for pension settlement costs in 2015.
4 Adjusted for pension settlement costs and share based payments.
5 Includes joint venture management fees income of £17.7 million (2015: £13.8 million) and, furthermore, management fees of £1.2 million (2015: £1.0 million) which have been represented as an offset against costs rather than a component of income in accordance with EPRA BPR Guidelines as they are reimbursing the Group for costs incurred. As a result the 2015 comparative cost ratio shown above has reduced by 0.3% accordingly.
167Financial Statements
Overview Strategic Report Governance

Financial Statements
Notes to the Financial Statements continued…For the year ended 31 December 2016
Supplementary notes not part of audited financial statements continuedTable 7: EPRA capital expenditure analysis
2016 2015
Wholly owned
£m
Joint ventures
£mTotal
£m
Wholly owned
£m
Joint ventures
£mTotal £m
Acquisitions 254.21 105.1 359.3 602.51 72.8 675.3
Development4 265.42 36.2 301.6 144.12 20.3 164.4
Completed properties4 17.43 4.6 22.0 18.13 6.9 25.0
Other5 19.8 6.8 26.6 13.4 3.9 17.3
Total 556.8 152.7 709.5 778.1 103.9 882.0
1 Being £254.2 million investment property and £nil trading property (2015: £602.5 million and £nil million respectively) see Note 15.
2 Being £261.6 million investment property and £3.8 million trading property (2015: £143.6 million and £0.5 million respectively) see Note 15.
3 Being £17.2 million investment property and £0.2 million trading property (2015: £17.7 million and £0.4 million respectively) see Note 15.
4 Includes wholly-owned capitalised interest of £5.0 million (2015: £2.9 million) as further analysed in Note 11 and share of joint venture capitalised interest of £0.8 million (2015: £0.1 million).
5 Tenant incentives, letting fees and rental guarantees.
Table 8: Like-for-like net rental income
(including JVs at share)2016
£m2015
£mChange
%
UK 149.4 141.0 6.0
Continental Europe 60.4 60.8 (0.7)
Like-for-like net rental income 209.8 201.8 4.0
Other1 (3.6) (2.0)
Like-for-like net rental income (after other) 206.2 199.8 3.2
Development lettings 21.2 4.6
Properties taken back for development 1.1 3.0
Like-for-like net rental income plus developments 228.2 207.4
Properties acquired 14.5 3.5
Properties sold 9.0 33.3
Net rental income before surrenders, dilapidations and exchange 252.0 244.2
Lease surrender premiums and dilapidation income 1.3 1.6
Other items and rent lost from lease surrenders (2.6) (4.3)
Impact of exchange rate difference between periods – (8.8)
Net rental income per Table 2 (including joint ventures at share) 250.7 232.7
1 Other includes the corporate centre and other costs relating to the operational business which are not specifically allocated to a geographical business unit.
168SEGRO Annual Report and Accounts 2016
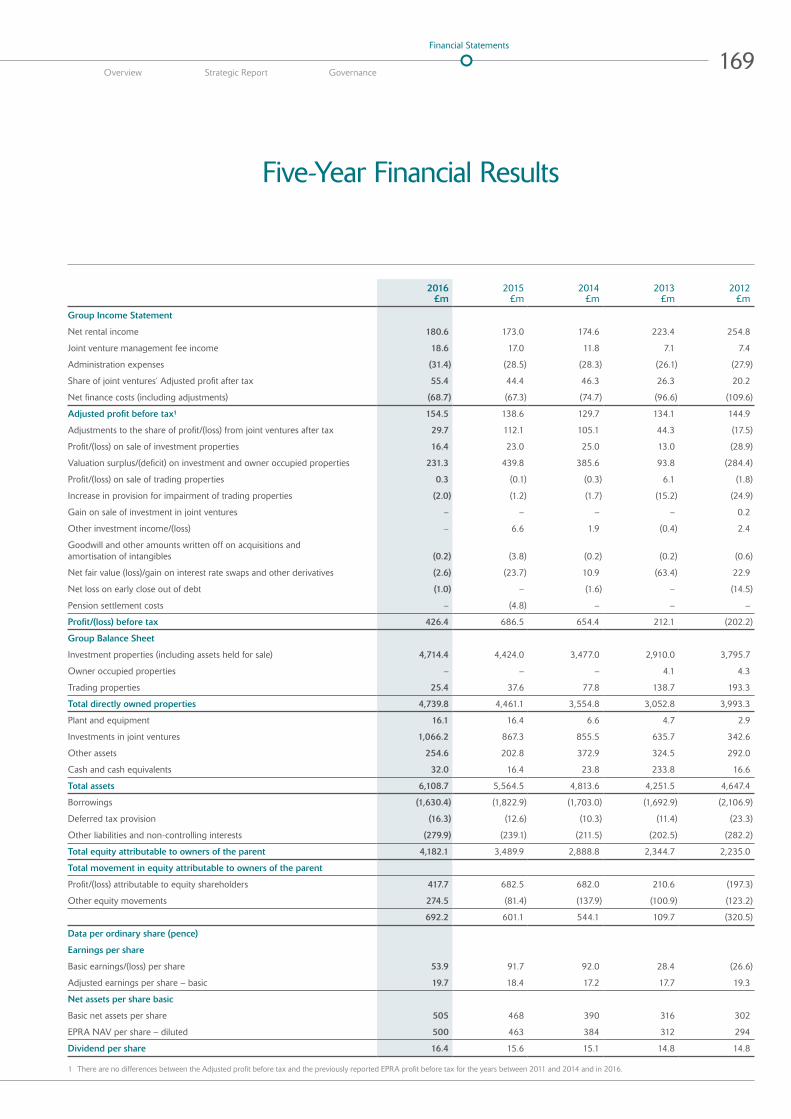
Five-Year Financial Results
2016
£m2015
£m2014
£m2013
£m2012
£m
Group Income Statement
Net rental income 180.6 173.0 174.6 223.4 254.8
Joint venture management fee income 18.6 17.0 11.8 7.1 7.4
Administration expenses (31.4) (28.5) (28.3) (26.1) (27.9)
Share of joint ventures’ Adjusted profit after tax 55.4 44.4 46.3 26.3 20.2
Net finance costs (including adjustments) (68.7) (67.3) (74.7) (96.6) (109.6)
Adjusted profit before tax¹ 154.5 138.6 129.7 134.1 144.9
Adjustments to the share of profit/(loss) from joint ventures after tax 29.7 112.1 105.1 44.3 (17.5)
Profit/(loss) on sale of investment properties 16.4 23.0 25.0 13.0 (28.9)
Valuation surplus/(deficit) on investment and owner occupied properties 231.3 439.8 385.6 93.8 (284.4)
Profit/(loss) on sale of trading properties 0.3 (0.1) (0.3) 6.1 (1.8)
Increase in provision for impairment of trading properties (2.0) (1.2) (1.7) (15.2) (24.9)
Gain on sale of investment in joint ventures – – – – 0.2
Other investment income/(loss) – 6.6 1.9 (0.4) 2.4
Goodwill and other amounts written off on acquisitions and amortisation of intangibles (0.2) (3.8) (0.2) (0.2) (0.6)
Net fair value (loss)/gain on interest rate swaps and other derivatives (2.6) (23.7) 10.9 (63.4) 22.9
Net loss on early close out of debt (1.0) – (1.6) – (14.5)
Pension settlement costs – (4.8) – – –
Profit/(loss) before tax 426.4 686.5 654.4 212.1 (202.2)
Group Balance Sheet
Investment properties (including assets held for sale) 4,714.4 4,424.0 3,477.0 2,910.0 3,795.7
Owner occupied properties – – – 4.1 4.3
Trading properties 25.4 37.6 77.8 138.7 193.3
Total directly owned properties 4,739.8 4,461.1 3,554.8 3,052.8 3,993.3
Plant and equipment 16.1 16.4 6.6 4.7 2.9
Investments in joint ventures 1,066.2 867.3 855.5 635.7 342.6
Other assets 254.6 202.8 372.9 324.5 292.0
Cash and cash equivalents 32.0 16.4 23.8 233.8 16.6
Total assets 6,108.7 5,564.5 4,813.6 4,251.5 4,647.4
Borrowings (1,630.4) (1,822.9) (1,703.0) (1,692.9) (2,106.9)
Deferred tax provision (16.3) (12.6) (10.3) (11.4) (23.3)
Other liabilities and non-controlling interests (279.9) (239.1) (211.5) (202.5) (282.2)
Total equity attributable to owners of the parent 4,182.1 3,489.9 2,888.8 2,344.7 2,235.0
Total movement in equity attributable to owners of the parent
Profit/(loss) attributable to equity shareholders 417.7 682.5 682.0 210.6 (197.3)
Other equity movements 274.5 (81.4) (137.9) (100.9) (123.2)
692.2 601.1 544.1 109.7 (320.5)
Data per ordinary share (pence)
Earnings per share
Basic earnings/(loss) per share 53.9 91.7 92.0 28.4 (26.6)
Adjusted earnings per share – basic 19.7 18.4 17.2 17.7 19.3
Net assets per share basic
Basic net assets per share 505 468 390 316 302
EPRA NAV per share – diluted 500 463 384 312 294
Dividend per share 16.4 15.6 15.1 14.8 14.8
1 There are no differences between the Adjusted profit before tax and the previously reported EPRA profit before tax for the years between 2011 and 2014 and in 2016.
169Financial Statements
Overview Strategic Report Governance

Further Information
Financial Information
Financial calendar and shareholder information
FEBRUARY 2017
Announcement of year end results: 17 February
Payment: 6¾ per cent bonds 2024 interest 23 February
MARCH 2017
Payment: 7 per cent bonds 2022 interest 14 March
Ex-dividend date for final dividend: Property Income Distribution 23 March
Record date: Property Income Distribution 24 March
Payment: 6 per cent bonds 2019 interest 30 March
APRIL 2017
Final date for SCRIP election: Property Income Distribution 10 April
Annual General Meeting: 20 April
MAY 2017
Payment: Property Income Distribution 4 May
Payment: 6¾ per cent 2021 interest 23 May
JUNE 2017
Payment: 5½ per cent bonds 2018 interest 20 June
Payment: 5¾ per cent bonds 2035 interest 20 June
JULY 2017
Announcement of half year results: 25 July
AUGUST 2017
Payment: 6¾ per cent bonds 2024 interest 23 August
SEPTEMBER 2017
Payment: 7 per cent bonds 2022 interest 14 September
Payment: 6 per cent bonds 2019 interest 29 September
OCTOBER 2017
Payment: Property Income Distribution and/or Dividend October
NOVEMBER 2017
Payment: 6¾ per cent bonds 2021 interest 23 November
DECEMBER 2017
Payment: 55/8 per cent bonds 2020 interest 7 December
Analysis of shareholders – 31 December 2016Shareholder analysis
Range Holders%
of holders Shares%
of shares
1–1,000 4,589 62.24 1,090,812 0.13
1,001–10,000 1,925 26.11 6,036,234 0.73
10,001–100,000 490 6.64 17,316,377 2.09
100,001–1,000,000 257 3.49 95,573,040 11.51
1,000,001+ 112 1.52 710,149,206 85.54
Totals 7,373 100.00 830,165,669 100.00
Category analysis
Category Holders%
of holders Shares%
of shares
Individual (certificated) 5,621 76.24 9,441,129 1.14
Individual (uncertificated) 112 1.52 455,673 0.05
Nominee and Institutional Investors 1,640 22.24 820,268,867 98.81
Totals 7,373 100.00 830,165,669 100.00
170SEGRO Annual Report and Accounts 2016

Shareholder Information
Useful historical informationShare history of the Company – On 20 August 2007, the ordinary share capital was consolidated on the basis of 12 new ordinary shares of 271/12 pence for every 13 ordinary shares of 25 pence held on the 17 August 2007. A special dividend of 53 pence per share was paid in connection with the consolidation on 31 August 2007.
– On 4 March 2009, a rights issue was announced on the basis of 12 new ordinary shares for every existing share held on 17 March 2009 at a subscription price of 10 pence per share. Each 271/12 pence ordinary share in issue was sub-divided and re-classified into one ordinary share of one pence each and one deferred share of 261/12 pence each. The deferred shares were created for technical reasons in order to maintain the aggregate nominal value of the Company’s share capital upon sub-division of its ordinary shares. The very limited rights attached to the deferred shares rendered them effectively valueless and they were cancelled on 8 May 2009.
– In relation to the acquisition of Brixton plc, on 24 August 2009, SEGRO plc undertook a share consolidation, open offer and private placing. On 31 July 2009, every 10 ordinary shares of one pence each were consolidated into one ordinary share of 10 pence each and, 0.10484 open offer shares of 10 pence each were offered to every shareholder of SEGRO plc who, on 13 July 2009, held 10 ordinary shares of one pence each. The acquisition of Brixton was conducted by a scheme of arrangement. Brixton shareholders were offered 0.175 consideration shares of 10 pence each in SEGRO plc for each Brixton share held.
– On 2 September 2016, the Company placed 74,770,950 new ordinary shares at a price of 435 pence by way of an equity placing. The shares were issued and admitted to the Official List of the Financial Conduct Authority and to trading on the main market for listed securities of the London Stock Exchange plc on 6 September 2016. Total gross proceeds of approximately £325m were raised from the placing.
Shareholder enquiriesIf you have any questions about your shareholding or if you require further guidance (e.g. to notify a change of address) please contact our Registrar, Equiniti Limited, Aspect House, Spencer Road, Lancing, West Sussex BN99 6DA, telephone +44 (0)371 384 2186. Alternatively, you can check your shareholding and access dividend information by registering at www.shareview.co.uk, or you can securely send queries via the website by visiting https://help.shareview.co.uk.
Electronic communicationsShareholders have the opportunity to elect to receive shareholder communications electronically, e.g. Annual Reports, Notice of the Annual General Meeting and Proxy Forms. You can elect to receive email notifications of shareholder communications by registering at www.shareview.co.uk where you can also set up a bank mandate to receive dividends directly to your bank account and to submit proxy votes for shareholder meetings. Receiving the Company’s communications electronically allows the Company to communicate with its shareholders in a more environmentally friendly, cost effective and timely manner.
AGM The 2017 AGM will be held on 20 April 2017 at RSA House, 8 John Adam Street, London WC2N 6EZ.
ShareGiftShareGift is a charity (registered under the name The Orr Mackintosh Foundation, registered charity number 1052686) which specialises in accepting
donations of small numbers of shares which are uneconomic to sell on their own. Shares which have been donated to ShareGift are aggregated and sold when practicable, with the proceeds passed on to a wide range of UK charities. ShareGift can also help with larger donations of shares. Further details about ShareGift can be obtained from its website at www.sharegift.org or by writing to ShareGift at 17 Carlton House Terrace, London, SW1Y 5AH, telephone: +44 (0)207 930 3737.
Dividends A requirement of the REIT regime is that a REIT must distribute to shareholders by way of dividend at least 90 per cent of its profits from its tax-exempt UK property rental business (calculated under UK tax principles after the deduction of interest and capital allowances and excluding chargeable gains). Such distributions are referred to as Property Income Distributions, or PIDs. Any further distributions may be paid as ordinary dividends or PIDs, which are derived from profits earned by its UK, non-REIT taxable business, as well as its overseas operations.
SCRIP DividendShareholders approved the re-introduction of a scrip dividend option (SCRIP) in respect of cash dividends (including those treated as Property Income Distributions) at the 2015 AGM. Subject to the Board deciding to offer a SCRIP, the SCRIP runs for three years ending on the earlier of 28 April 2018 and the beginning of the third AGM of the Company following 29 April 2015. It allows shareholders who elect to receive the SCRIP, to take their final and interim dividends in shares rather than cash. Details of the SCRIP together with information on how shareholders can elect to receive it, are available on the Company’s website www.SEGRO.com. The Dividend Reinvestment Plan (DRIP) has been suspended.
Withholding tax – PIDsSEGRO is required to withhold tax at source from its PIDs at the basic tax rate (20 per cent). UK shareholders need take no immediate action (unless they qualify for exemption as described below) and will receive with each dividend payment a tax deduction certificate stating the amount of tax deducted.
UK shareholders who fall into one of the classes of shareholder able to claim an exemption from withholding tax may be able to receive a gross PID payment if they have submitted a valid relevant Exemption Declaration form, either as a beneficial owner of the shares, or as an intermediary if the shares are not registered in the name of the beneficial owner, to Equiniti. The Exemption Declaration form is available at www.SEGRO.com under Investors/Shareholder Information/REIT. A valid declaration form, once submitted, will continue to apply to future payments of PIDs until rescinded, and so it is a shareholder’s responsibility to notify SEGRO if their circumstances change and they are no longer able to claim an exemption from withholding tax.
Shareholders resident outside the UK may be able to claim a partial refund of withholding tax (either as an individual or as a company) from HMRC, subject to the terms of a double tax treaty, if any, between the UK and the country in which the shareholder is resident.
Ordinary dividends Ordinary, non-PID dividends will be treated in exactly the same way by shareholders as ordinary dividends paid before the Company became a REIT. From 6 April 2016 the notional 10 per cent tax credit has been abolished and replaced with a tax free dividend allowance, which will apply to the ordinary, non-PID dividends received by UK resident shareholders who are subject to UK income tax. This allowance does not apply to the PID element of dividends. Further information is available from HMRC at www.gov.uk/government/publications/dividend-allowance-factsheet/dividend-allowance-factsheet.
171Financial Statements
Overview Strategic Report Governance

Further Information
Glossary of Terms
APP: Airport Property Partnership, a 50-50 joint venture between SEGRO and Aviva Investors.
Completed portfolio: The completed investment and trading properties (including properties held throughout the period, acquisitions during the period and developments completed during the period), including the Group’s share of joint ventures’ completed investment and trading properties.
Current development pipeline: The Group’s current programme of developments authorised or in the course of construction at the Balance Sheet date.
EPRA: The European Public Real Estate Association, a real estate industry body, which has issued Best Practices Recommendations in order to provide consistency and transparency in real estate reporting across Europe.
Estimated cost to completion: Costs still to be expended on a development or redevelopment to practical completion, including attributable interest.
Estimated rental value (ERV): The estimated annual market rental value of lettable space as determined biannually by the Group’s valuers. This will normally be different from the rent being paid.
Gearing: Net borrowings divided by total shareholders’ equity excluding intangible assets and deferred tax provisions.
Gross rental income: Contracted rental income recognised in the period in the Income Statement, including surrender premiums. Lease incentives, initial costs and any contracted future rental increases are amortised on a straight line basis over the lease term.
Headline rent: Passing rent once rent-free periods have expired.
Hectares (Ha): The area of land measurement used in this analysis. The conversion factor used, where appropriate, is 1 hectare = 2.471 acres.
Investment property: Completed land and buildings held for rental income return and/or capital appreciation.
Joint venture: An entity in which the Group holds an interest and which is jointly controlled by the Group and one or more partners under a contractual arrangement whereby decisions on financial and operating policies essential to the operation, performance and financial position of the venture require each partner’s consent.
Loan to value (LTV): Net borrowings divided by the carrying value of total property assets (investment, owner occupied, trading properties and, at 31 December 2015, includes the Bath Road office portfolio categorised as Assets held for sale in the balance sheet). This is reported on a ‘look-through’ basis (including joint ventures at share).
MSCI-IPD: MSCI Real Estate calculates the IPD indices of real estate performance around the world.
Net initial yield: Annualised current passing rent less non-recoverable property expenses such as empty rates, divided by the property valuation plus notional purchasers’ costs. This is in accordance with EPRA’s Best Practices Recommendations.
Net rental income: Gross rental income less ground rents paid, net service charge expenses and property operating expenses.
Net true equivalent yield: The internal rate of return from an investment property, based on the value of the property assuming the current passing rent reverts to ERV and assuming the property becomes fully occupied over time. It assumes that rent is received quarterly in advance.
Passing rent: The annual rental income currently receivable on a property as at the Balance Sheet date (which may be more or less than the ERV). Excludes rental income where a rent free period is in operation. Excludes service charge income (which is netted off against service charge expenses).
Pre-let: A lease signed with an occupier prior to completion of a development.
REIT: A qualifying entity which has elected to be treated as a Real Estate Investment Trust for tax purposes. In the UK, such entities must be listed on a recognised stock exchange, must be predominantly engaged in property investment activities and must meet certain ongoing qualifications. SEGRO plc and its UK subsidiaries achieved REIT status with effect from 1 January 2007.
Rent roll: See Passing Rent.
SELP: SEGRO European Logistics Partnership, a 50-50 joint venture between SEGRO and Public Sector Pension Investment Board (PSP Investments).
SIIC: Sociétés d’investissements Immobiliers Cotées are the French equivalent of UK Real Estate Investment Trusts (see REIT).
Speculative development: Where a development has commenced prior to a lease agreement being signed in relation to that development.
Square metres (sq m): The area of buildings measurements used in this analysis. The conversion factor used, where appropriate, is one square metre = 10.7639 square feet.
Takeback: Rental income lost due to lease expiry, exercise of break option, surrender or insolvency.
Topped up net initial yield: Net initial yield adjusted to include notional rent in respect of let properties which are subject to a rent free period at the valuation date. This is in accordance with EPRA’s Best Practices Recommendations.
Total property return (TPR): A measure of the ungeared return for the portfolio and is calculated as the change in capital value, less any capital expenditure incurred, plus net income, expressed as a percentage of capital employed over the period concerned, as calculated by MSCI Real Estate and excluding land.
Total shareholder return (TSR): A measure of return based upon share price movement over the period and assuming reinvestment of dividends.
Trading property: Property being developed for sale or one which is being held for sale after development is complete.
Yield on cost: The expected gross yield based on the estimated current market rental value (ERV) of the developments when fully let, divided by the book value of the developments at the earlier of commencement of the development or the balance sheet date plus future development costs and estimated finance costs to completion.
Yield on new money: The yield on cost excluding the book value of land if the land is owned by the Group in the reporting period prior to commencement of the development.
172SEGRO Annual Report and Accounts 2016

Forward-looking statementsThe Annual Report contains certain forward-looking statements with respect to SEGRO’s expectations and plans, strategy, management objectives, future developments and performances, costs, revenues and other trend information. These statements are subject to assumptions, risks and uncertainties. Many of these assumptions, risks and uncertainties relate to factors that are beyond SEGRO’s ability to control or estimate precisely and which could cause actual results or developments to differ materially from those expressed or implied by these forward-looking statements. Certain statements have been made with reference to forecast process changes, economic conditions and the current regulatory environment. Any forward-looking statements made by or on behalf of SEGRO are based upon the knowledge and information available to Directors on the date of this Annual Report. Accordingly, no assurance can be given that any particular expectation will be met and SEGRO’s shareholders are cautioned not to place undue reliance on the forward-looking statements. Additionally, forward-looking statements regarding past trends or activities should not be taken as a representation that such trends or activities will continue in the future. Other than in accordance with its legal or regulatory obligations (including under the UK Listing Rules and the Disclosure Guidance and Transparency Rules of the Financial Conduct Authority), SEGRO does not undertake to update forward-looking statements to reflect any changes in events, conditions or circumstances on which any such statement is based. Past share performance cannot be relied on as a guide to future performance. Nothing in this Annual Report should be construed as a profit forecast.
Go online
To keep up to date with SEGRO, you can source facts and figures about the Group through the various sections on our website and sign up for email alerts for fast communication of breaking news.
Financial reports, shareholder information and property analysis are frequently updated and our current share price is always displayed on the Home Page.
As well as featuring detailed information about available property throughout the portfolio, www.SEGRO.com now also includes a dedicated property search function making it easy for potential customers, or their agents, to find business space that fits their requirement exactly. SEGRO’s performance in areas such as sustainability and customer care are also featured on the site, www.SEGRO.com.
Other publications
Additional disclosures on our property portfolio can be found in the 2016 Property Analysis Report at www.SEGRO.com.
The printer and paper mill are both accredited with ISO14001 Environmental Management System and are both Forest Stewardship Council® certified. CPI Colour is a Carbon Neutral printing company.
Designed and produced by www.ry.com
Registered office SEGRO plc Cunard House 15 Regent Street London SW1Y 4LR
Registered in England and Wales Registered number 167591

SEGRO plcCunard House15 Regent StreetLondon SW1Y 4LR
T +44(0)20 7451 9100F +44(0)20 7451 9150www.SEGRO.com/investors A
nnual Report and Accounts 2016