SEGRO Investment Case
39
SEGRO INVESTMENT CASE 30 July 2021
Transcript of SEGRO Investment Case
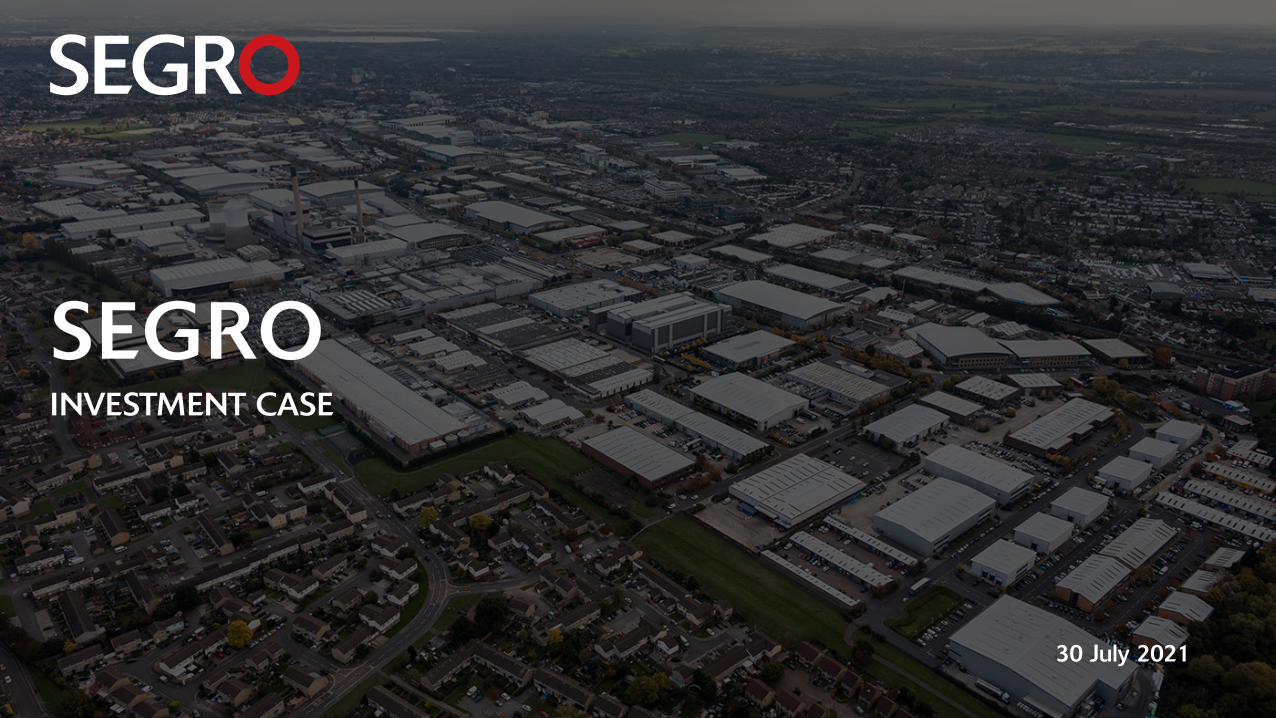
SEGROINVESTMENT CASE
30 July 2021
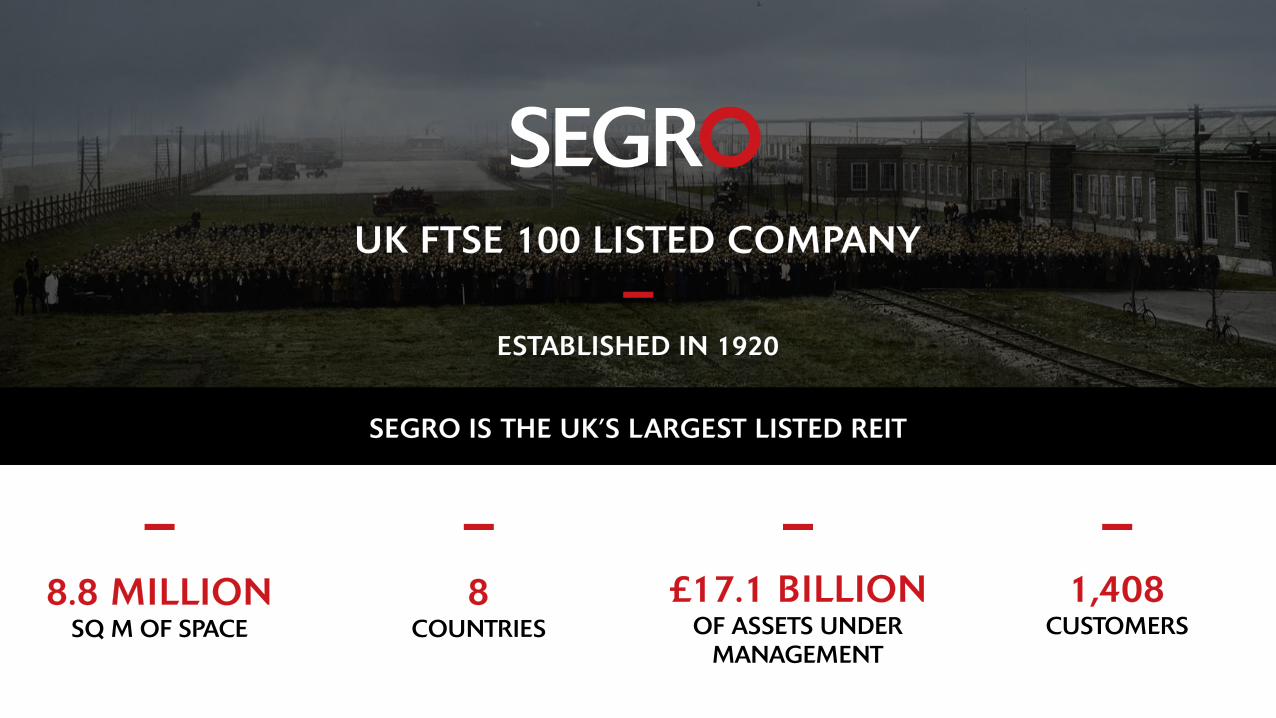
8.8 MILLIONSQ M OF SPACE
8COUNTRIES
£17.1 BILLIONOF ASSETS UNDER
MANAGEMENT
1,408CUSTOMERS
UK FTSE 100 LISTED COMPANY
ESTABLISHED IN 1920
SEGRO IS THE UK’S LARGEST LISTED REIT
3
WE CREATETHE SPACETHAT ENABLESEXTRAORDINARYTHINGS TO HAPPEN
4
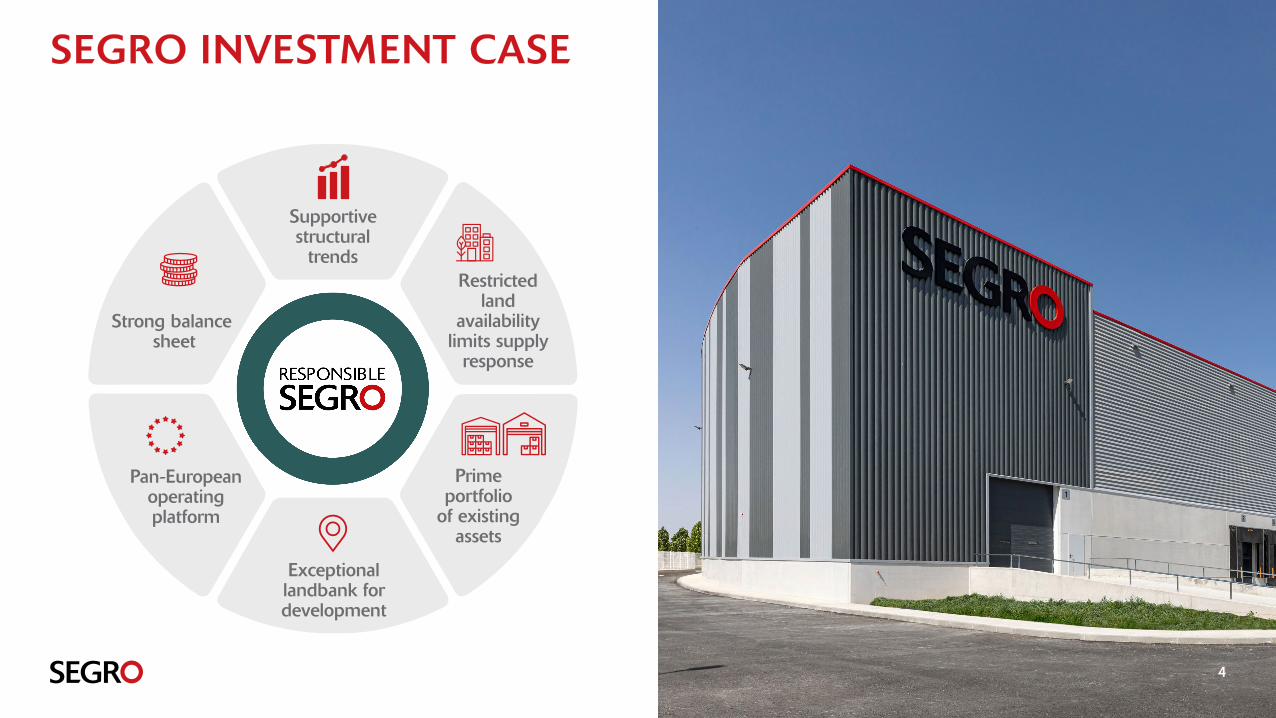
SEGRO INVESTMENT CASE
Supportive structural
trends
Prime portfolio
of existing assets
Pan-European operating platform
Strong balancesheet
Exceptional landbank for development
Restricted land
availability limits supply
response
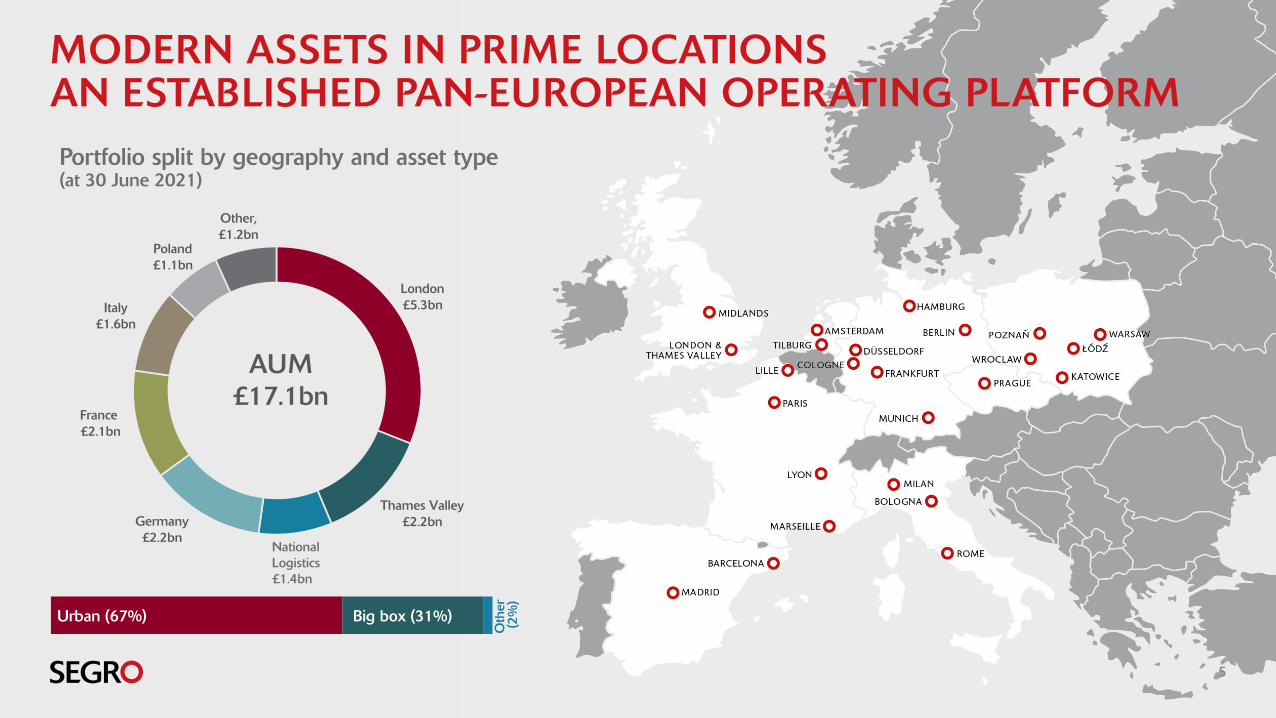
MODERN ASSETS IN PRIME LOCATIONS AN ESTABLISHED PAN-EUROPEAN OPERATING PLATFORM
5
Portfolio split by geography and asset type(at 30 June 2021)
London£5.3bn
Thames Valley£2.2bnGermany
£2.2bn
France£2.1bn
Italy£1.6bn
Poland£1.1bn
Other, £1.2bn
AUM£17.1bn
Urban (67%) Big box (31%)
Oth
er
(2%
)
National Logistics£1.4bn
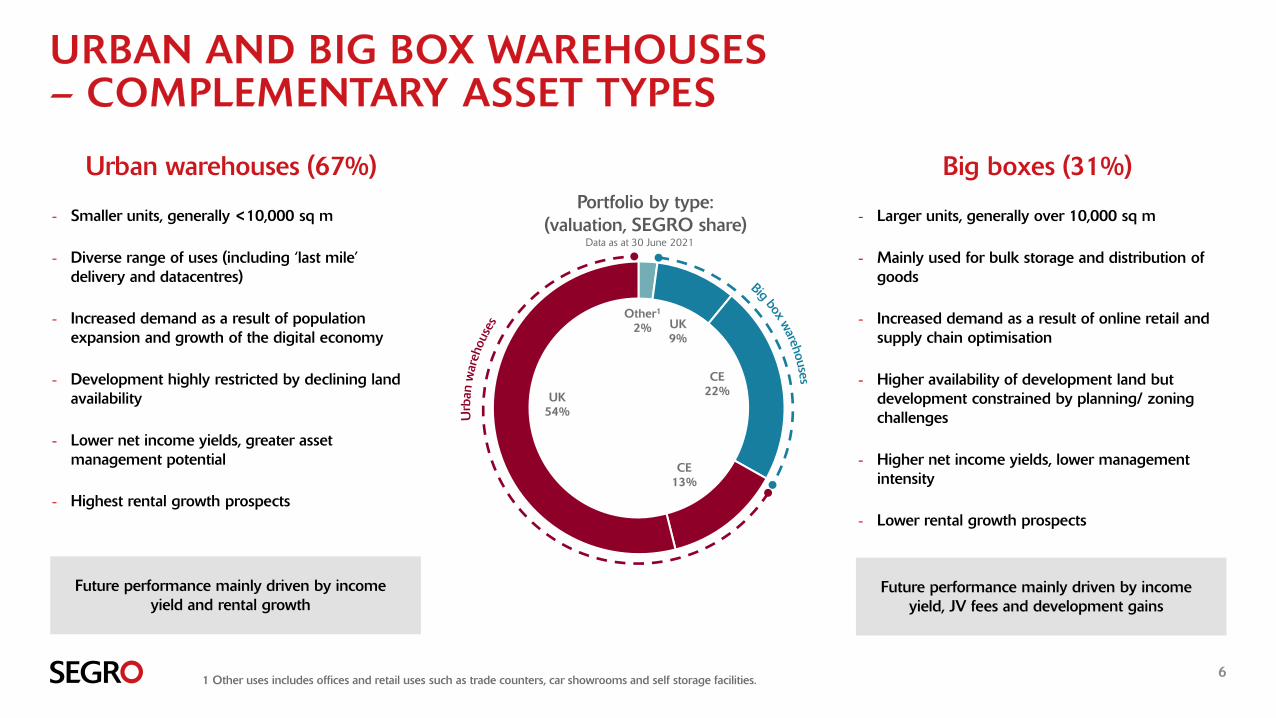
Portfolio by type:(valuation, SEGRO share)
URBAN AND BIG BOX WAREHOUSES – COMPLEMENTARY ASSET TYPES
6
UK 9%
CE22%
CE13%
UK54%
Other1
2%
Data as at 30 June 2021
Urban warehouses (67%)
- Smaller units, generally <10,000 sq m
- Diverse range of uses (including ‘last mile’ delivery and datacentres)
- Increased demand as a result of population expansion and growth of the digital economy
- Development highly restricted by declining land availability
- Lower net income yields, greater asset management potential
- Highest rental growth prospects
Big boxes (31%)
- Larger units, generally over 10,000 sq m
- Mainly used for bulk storage and distribution of goods
- Increased demand as a result of online retail and supply chain optimisation
- Higher availability of development land but development constrained by planning/ zoning challenges
- Higher net income yields, lower management intensity
- Lower rental growth prospects
Future performance mainly driven by income yield, JV fees and development gains
Future performance mainly driven by income yield and rental growth
1 Other uses includes offices and retail uses such as trade counters, car showrooms and self storage facilities.
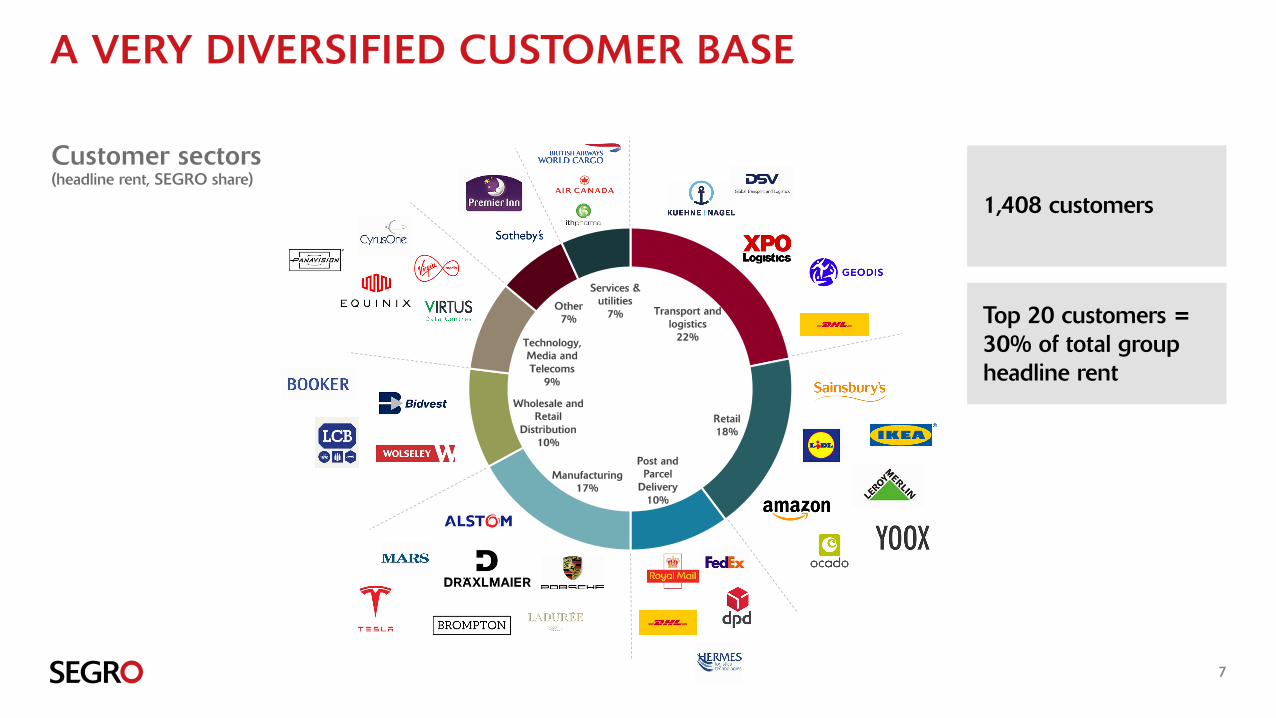
Transport and logistics
22%
Retail18%
Post and Parcel
Delivery10%
Manufacturing17%
Wholesale and Retail
Distribution10%
Technology, Media and Telecoms
9%
Other7%
Services & utilities
7%
A VERY DIVERSIFIED CUSTOMER BASE
7
Customer sectors (headline rent, SEGRO share)
1,408 customers
Top 20 customers = 30% of total group headline rent
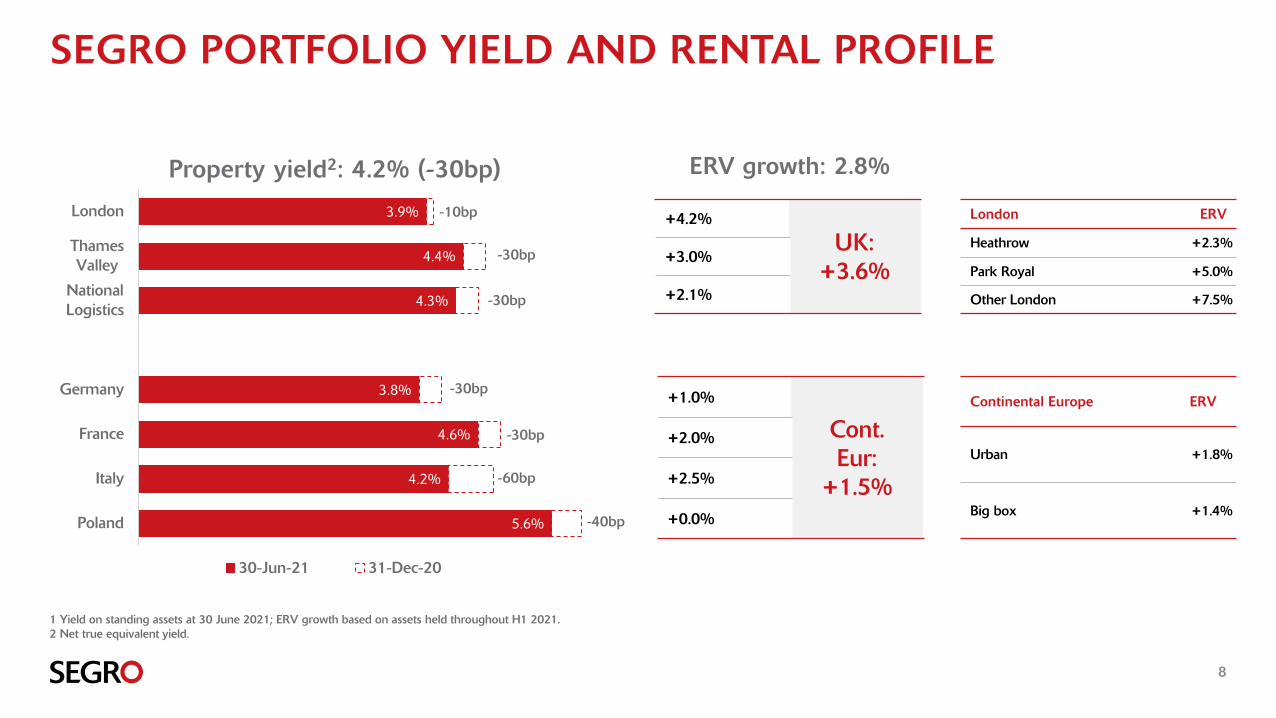
5.6%
4.2%
4.6%
3.8%
4.3%
4.4%
3.9%
Poland
Italy
France
Germany
NationalLogistics
ThamesValley
London
30-Jun-21 31-Dec-20
-10bp
-30bp
SEGRO PORTFOLIO YIELD AND RENTAL PROFILE
8
ERV growth: 2.8%
London ERV
Heathrow +2.3%
Park Royal +5.0%
Other London +7.5%
Property yield2: 4.2% (-30bp)
1 Yield on standing assets at 30 June 2021; ERV growth based on assets held throughout H1 2021.2 Net true equivalent yield.
Continental Europe ERV
Urban +1.8%
Big box +1.4%
+1.0%
Cont. Eur:
+1.5%
+2.0%
+2.5%
+0.0%
+4.2%
UK:+3.6%
+3.0%
+2.1%-30bp
-30bp
-30bp
-60bp
-40bp
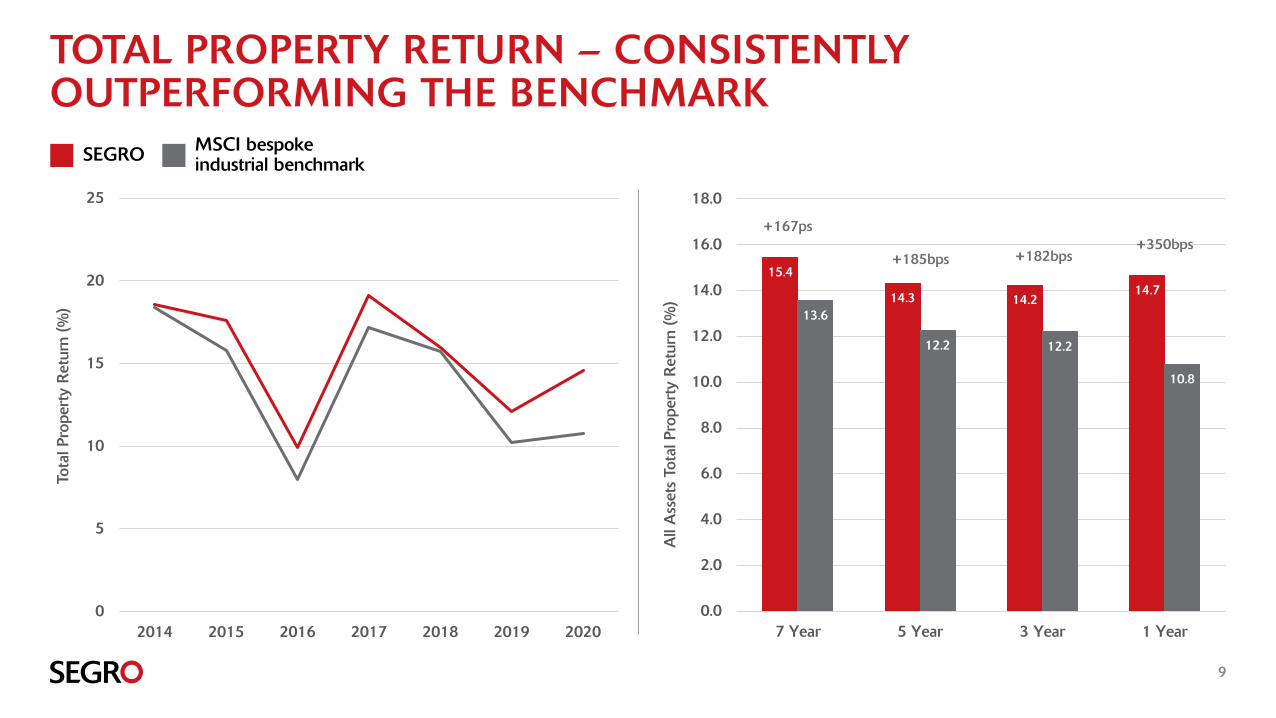
15.4
14.3 14.214.7
13.6
12.2 12.2
10.8
0.0
2.0
4.0
6.0
8.0
10.0
12.0
14.0
16.0
18.0
7 Year 5 Year 3 Year 1 Year
All
Ass
ets
Tota
l Pro
pert
y R
etur
n (%
)
650p
TOTAL PROPERTY RETURN – CONSISTENTLY OUTPERFORMING THE BENCHMARK
0
5
10
15
20
25
2014 2015 2016 2017 2018 2019 2020
Tota
l Pro
pert
y R
etur
n (%
)
SEGRO MSCI bespoke industrial benchmark
+167ps
+185bps +182bps+350bps
9
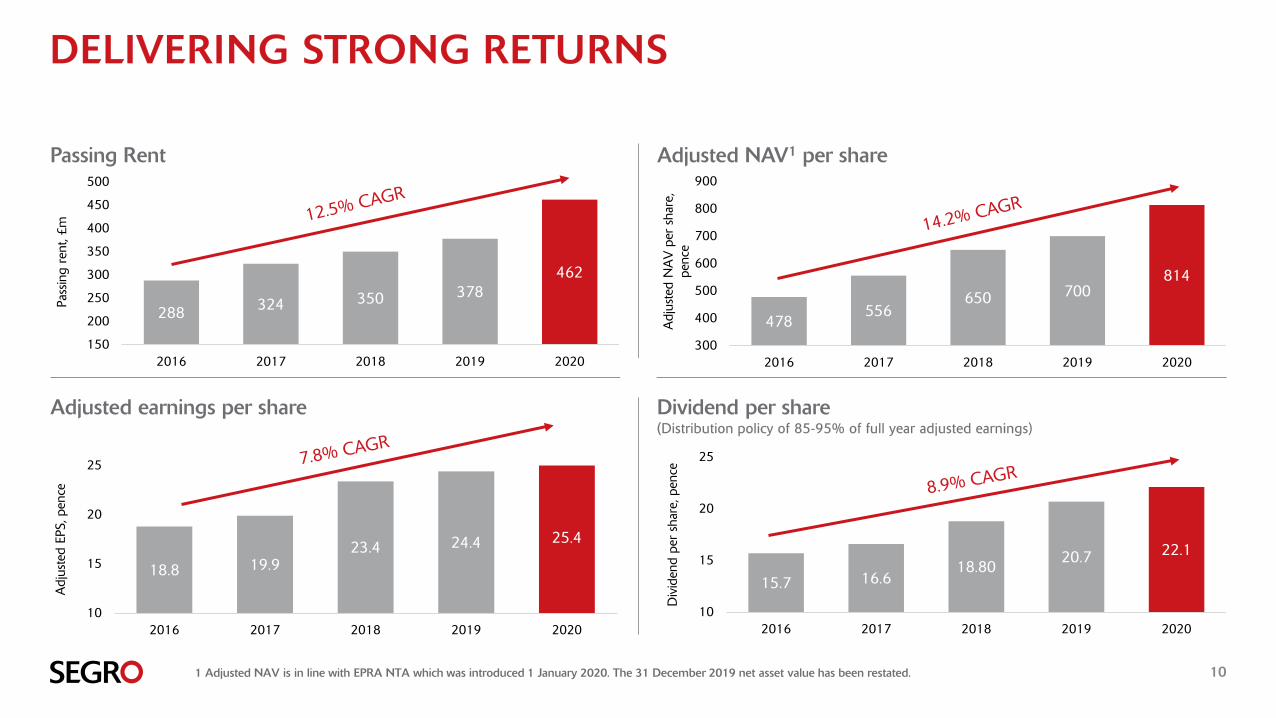
DELIVERING STRONG RETURNS
10
15.7 16.618.80
20.7 22.1
10
15
20
25
2016 2017 2018 2019 2020
Div
iden
d pe
r sh
are,
pen
ce
Adjusted earnings per share
18.8 19.923.4 24.4 25.4
10
15
20
25
2016 2017 2018 2019 2020
Adj
uste
d EP
S, p
ence
478556
650 700814
300
400
500
600
700
800
900
2016 2017 2018 2019 2020
Adj
uste
d N
AV
per
sha
re,
penc
e
Dividend per share(Distribution policy of 85-95% of full year adjusted earnings)
Adjusted NAV1 per share
288 324 350 378462
150
200
250
300
350
400
450
500
2016 2017 2018 2019 2020
Pass
ing
rent
, £m
Passing Rent
1 Adjusted NAV is in line with EPRA NTA which was introduced 1 January 2020. The 31 December 2019 net asset value has been restated.
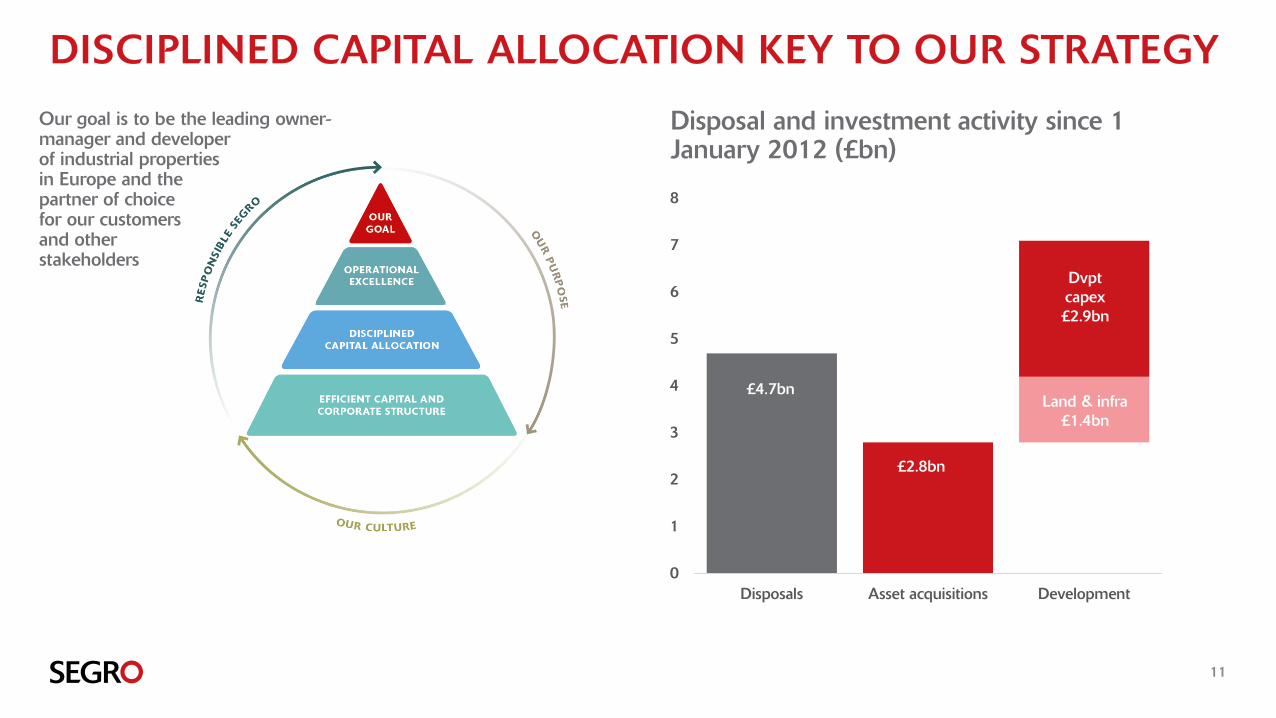
DISCIPLINED CAPITAL ALLOCATION KEY TO OUR STRATEGY
11
0
1
2
3
4
5
6
7
8
Disposals Asset acquisitions Development
Disposal and investment activity since 1 January 2012 (£bn)
£4.7bn
£2.8bn
Land & infra£1.4bn
Dvptcapex£2.9bn
Our goal is to be the leading owner-manager and developerof industrial propertiesin Europe and the partner of choicefor our customersand otherstakeholders
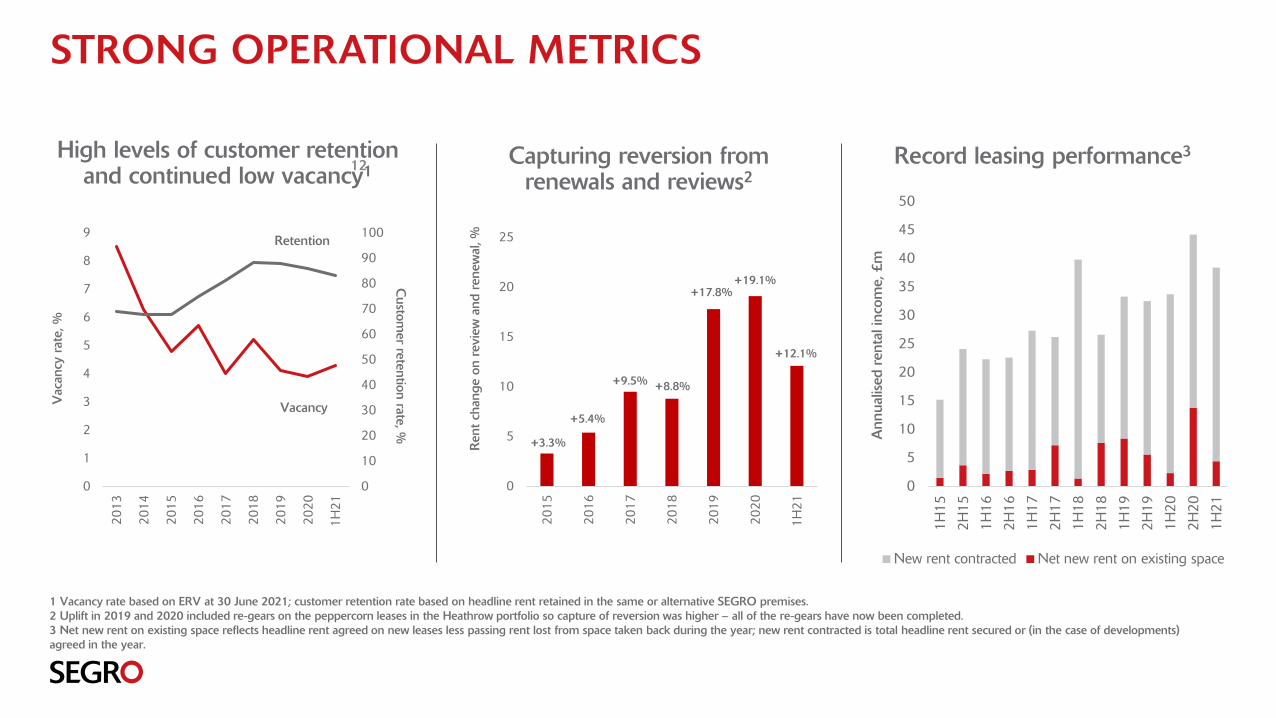
STRONG OPERATIONAL METRICS
12 Record leasing performance3Capturing reversion from renewals and reviews2
High levels of customer retention and continued low vacancy1
0
5
10
15
20
25
30
35
40
45
50
1H15
2H15
1H16
2H16
1H17
2H17
1H18
2H18
1H19
2H19
1H20
2H20
1H21
Ann
ualis
ed r
enta
l inc
ome,
£m
New rent contracted Net new rent on existing space
0
10
20
30
40
50
60
70
80
90
100
0
1
2
3
4
5
6
7
8
9
2013
2014
2015
2016
2017
2018
2019
2020
1H21
Custom
er retention rate, %
Vac
ancy
rat
e, %
Vacancy
Retention
1 Vacancy rate based on ERV at 30 June 2021; customer retention rate based on headline rent retained in the same or alternative SEGRO premises.2 Uplift in 2019 and 2020 included re-gears on the peppercorn leases in the Heathrow portfolio so capture of reversion was higher – all of the re-gears have now been completed.3 Net new rent on existing space reflects headline rent agreed on new leases less passing rent lost from space taken back during the year; new rent contracted is total headline rent secured or (in the case of developments) agreed in the year.
0
5
10
15
20
25
2015
2016
2017
2018
2019
2020
1H21
Ren
t cha
nge
on r
evie
w a
nd r
enew
al, %
+8.8%
+17.8%+19.1%
+12.1%
+9.5%
+5.4%
+3.3%
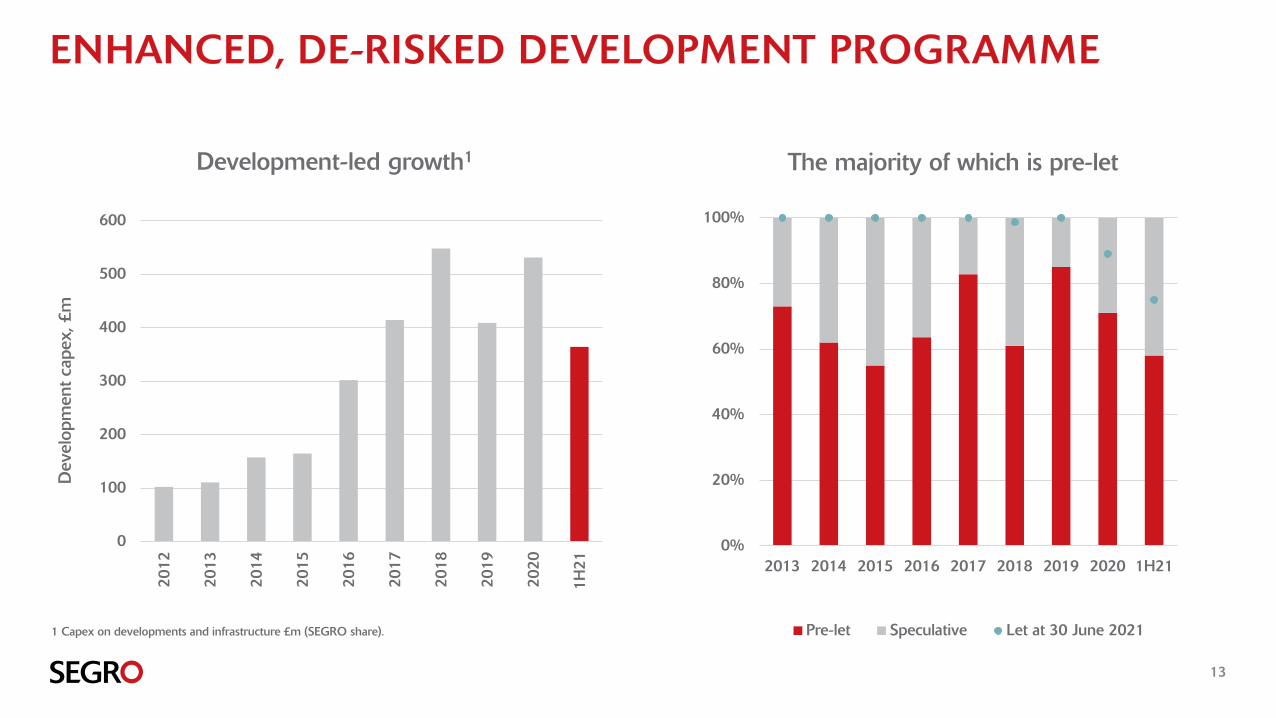
ENHANCED, DE-RISKED DEVELOPMENT PROGRAMME
13
0
100
200
300
400
500
600
2012
2013
2014
2015
2016
2017
2018
2019
2020
1H21
Dev
elop
men
t cap
ex, £
m
Development-led growth1
1 Capex on developments and infrastructure £m (SEGRO share).
0%
20%
40%
60%
80%
100%
2013 2014 2015 2016 2017 2018 2019 2020 1H21
The majority of which is pre-let
Pre-let Speculative Let at 30 June 2021
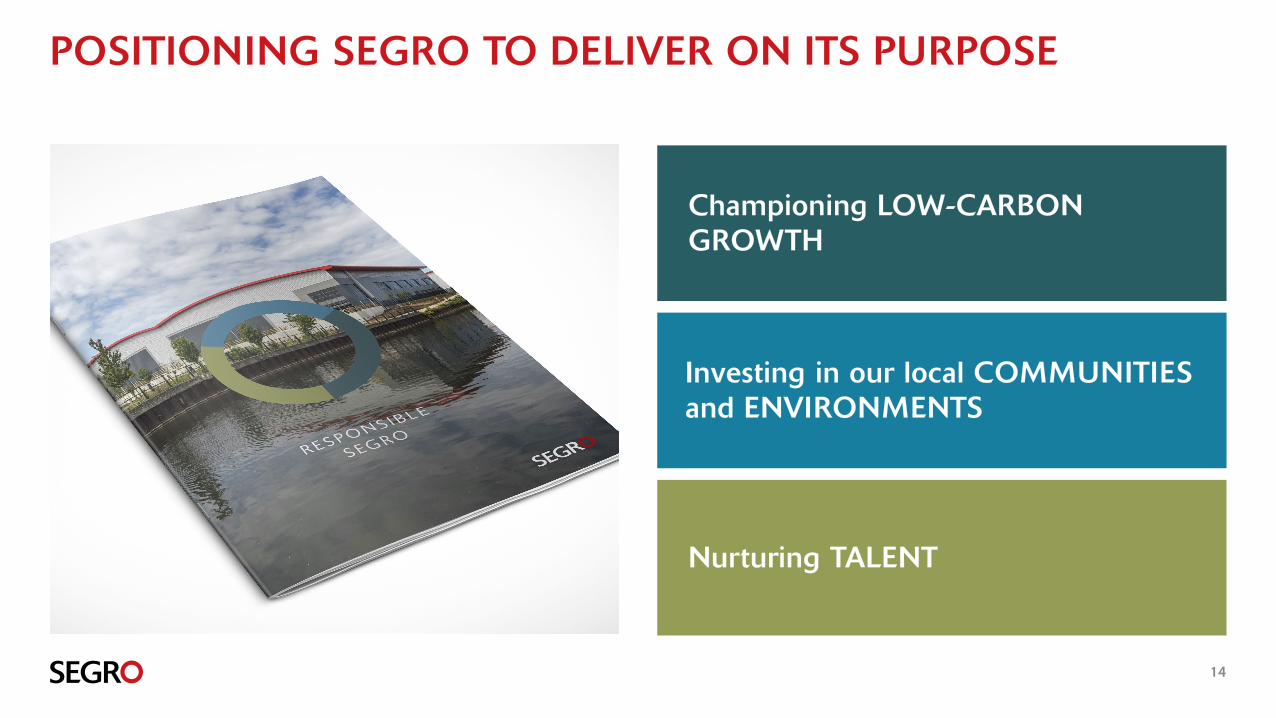
POSITIONING SEGRO TO DELIVER ON ITS PURPOSE
14
Championing LOW-CARBON GROWTH
Investing in our local COMMUNITIES and ENVIRONMENTS
Nurturing TALENT

DRIVING FUTURE GROWTH
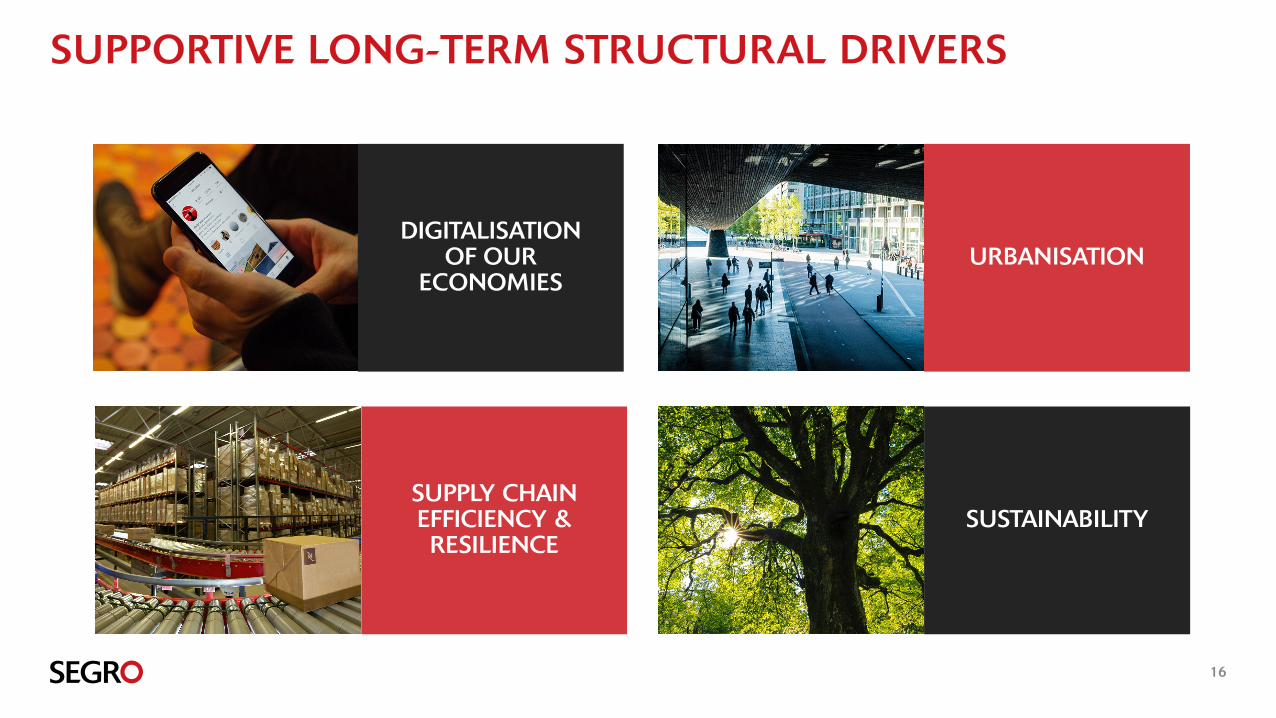
SUPPORTIVE LONG-TERM STRUCTURAL DRIVERS
16
URBANISATION
SUPPLY CHAIN EFFICIENCY & RESILIENCE
SUSTAINABILITY
DIGITALISATION OF OUR
ECONOMIES
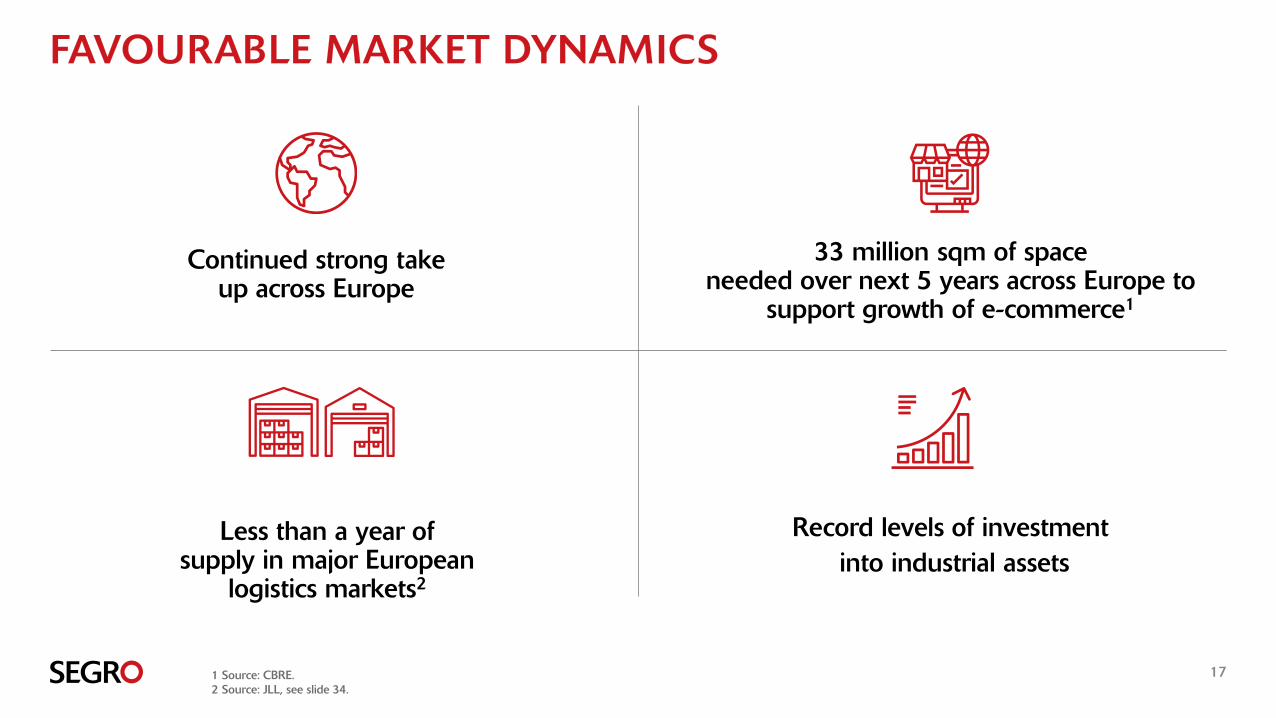
FAVOURABLE MARKET DYNAMICS
17
Record levels of investmentinto industrial assets
Continued strong takeup across Europe
Less than a year of supply in major European
logistics markets2
33 million sqm of spaceneeded over next 5 years across Europe to
support growth of e-commerce1
1 Source: CBRE.2 Source: JLL, see slide 34.
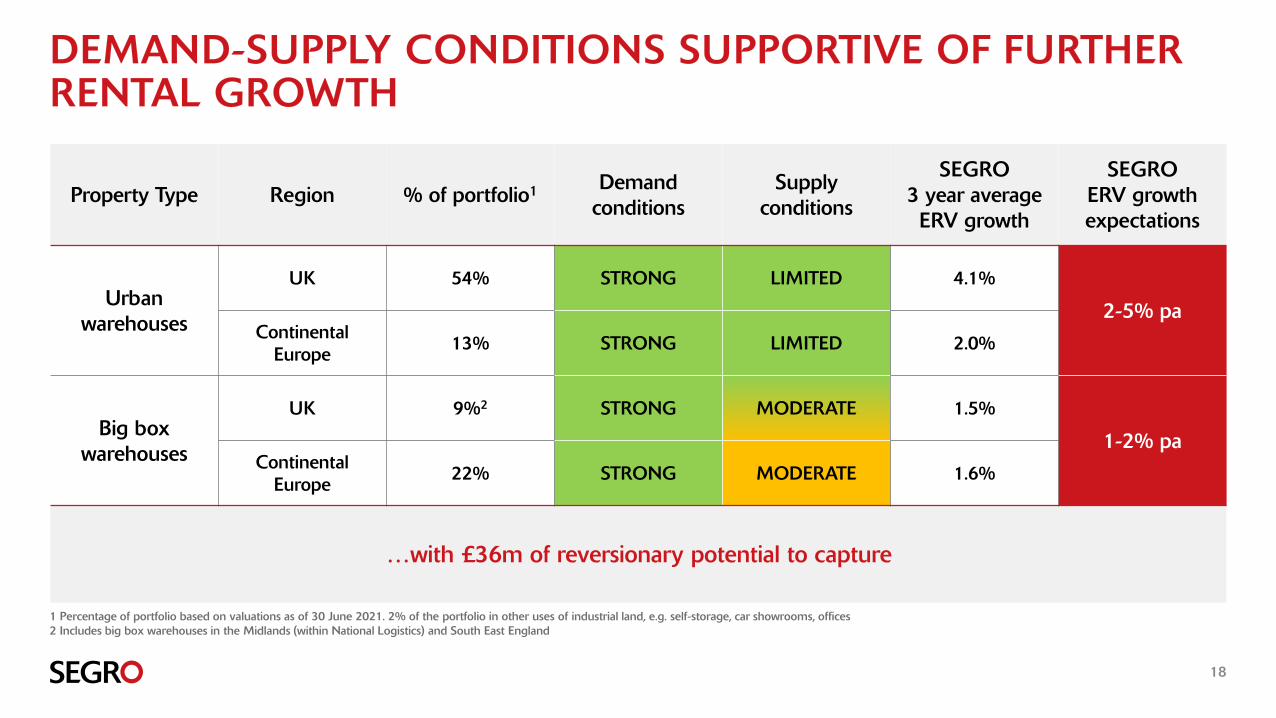
DEMAND-SUPPLY CONDITIONS SUPPORTIVE OF FURTHER RENTAL GROWTH
18
Property Type Region % of portfolio1 Demand conditions
Supply conditions
SEGRO3 year average ERV growth
SEGROERV growth expectations
Urban warehouses
UK 54% STRONG LIMITED 4.1%
2-5% paContinental
Europe 13% STRONG LIMITED 2.0%
Big box warehouses
UK 9%2 STRONG MODERATE 1.5%
1-2% paContinental
Europe 22% STRONG MODERATE 1.6%
…with £36m of reversionary potential to capture
1 Percentage of portfolio based on valuations as of 30 June 2021. 2% of the portfolio in other uses of industrial land, e.g. self-storage, car showrooms, offices2 Includes big box warehouses in the Midlands (within National Logistics) and South East England
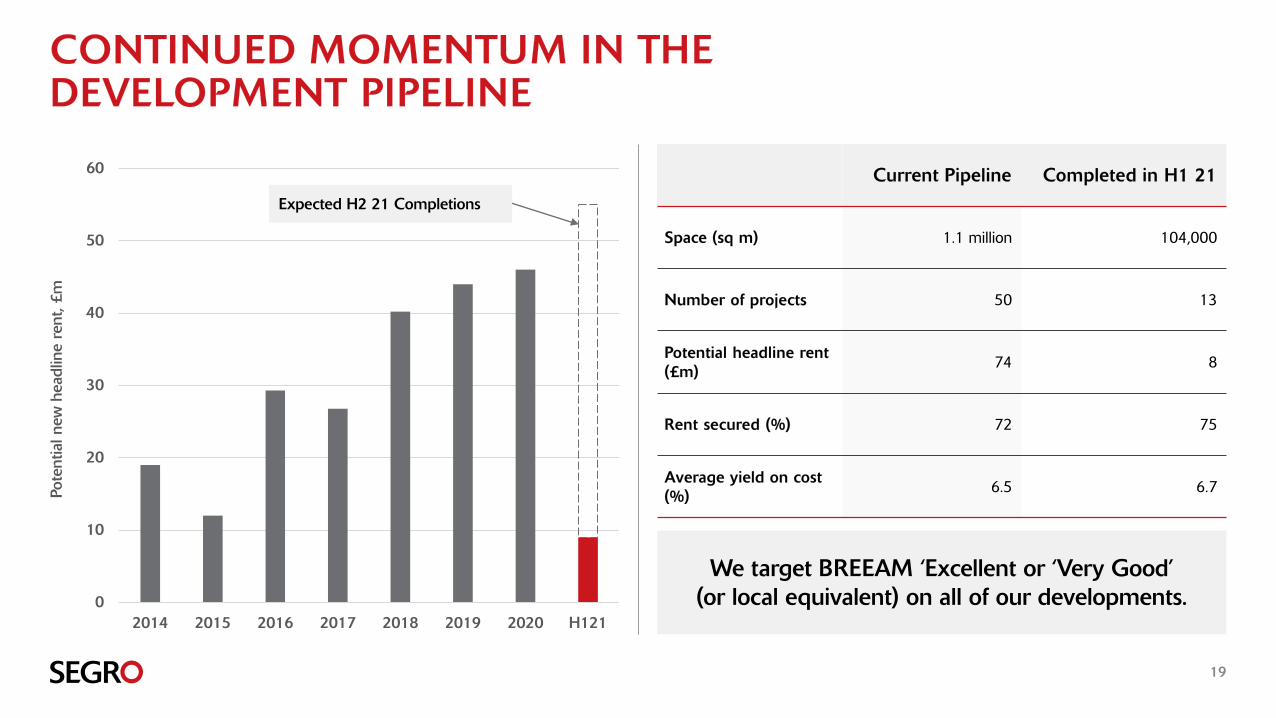
Current Pipeline Completed in H1 21
Space (sq m) 1.1 million 104,000
Number of projects 50 13
Potential headline rent (£m) 74 8
Rent secured (%) 72 75
Average yield on cost (%) 6.5 6.7
CONTINUED MOMENTUM IN THE DEVELOPMENT PIPELINE
19
We target BREEAM ‘Excellent or ‘Very Good’(or local equivalent) on all of our developments.0
10
20
30
40
50
60
2014 2015 2016 2017 2018 2019 2020 H121
Pote
ntia
l new
hea
dlin
e re
nt, £
m
Expected H2 21 Completions
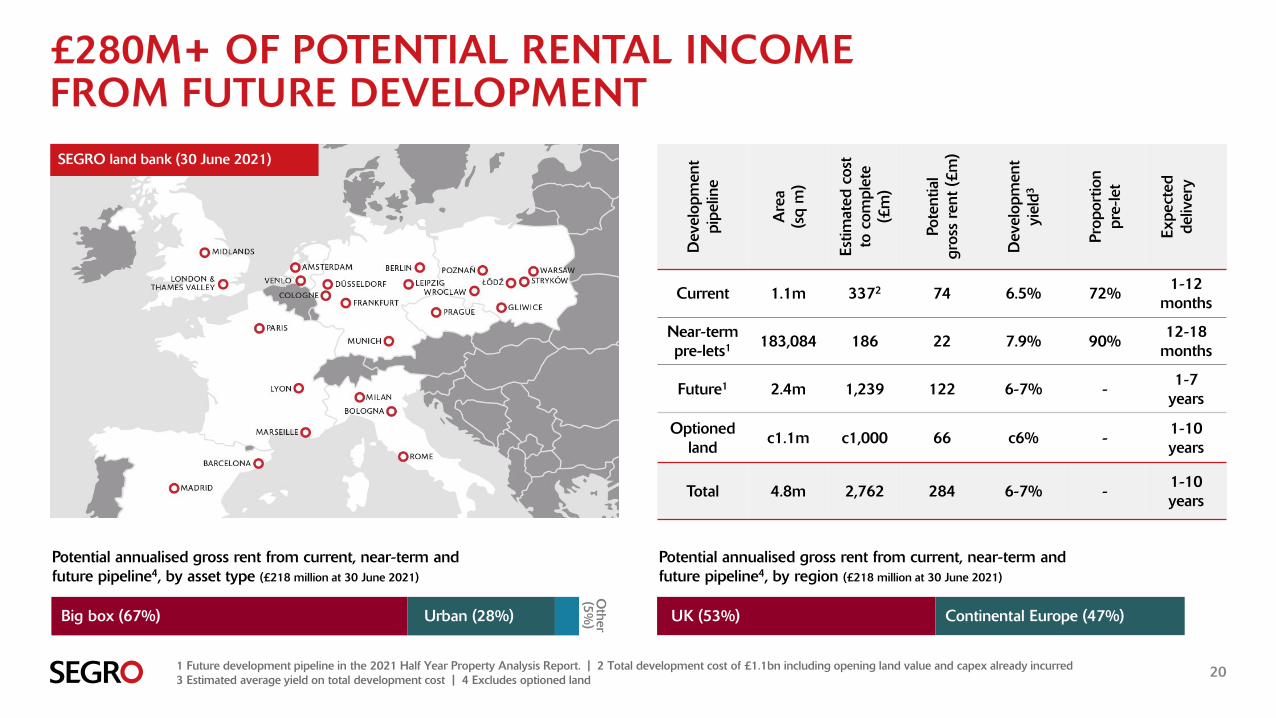
20
£280M+ OF POTENTIAL RENTAL INCOME FROM FUTURE DEVELOPMENT
Dev
elop
men
t pi
pelin
e
Are
a (s
q m
)
Estim
ated
cos
t to
com
plet
e (£
m)
Pote
ntia
l gr
oss
rent
(£m
)
Dev
elop
men
t yi
eld3
Prop
ortio
n
pre-
let
Expe
cted
de
liver
y
Current 1.1m 3372 74 6.5% 72% 1-12 months
Near-termpre-lets1 183,084 186 22 7.9% 90% 12-18
months
Future1 2.4m 1,239 122 6-7% - 1-7 years
Optioned land c1.1m c1,000 66 c6% - 1-10
years
Total 4.8m 2,762 284 6-7% - 1-10 years
Big box (67%) Urban (28%)
Other
(5%) UK (53%) Continental Europe (47%)
1 Future development pipeline in the 2021 Half Year Property Analysis Report. | 2 Total development cost of £1.1bn including opening land value and capex already incurred3 Estimated average yield on total development cost | 4 Excludes optioned land
Potential annualised gross rent from current, near-term and future pipeline4, by region (£218 million at 30 June 2021)
Potential annualised gross rent from current, near-term and future pipeline4, by asset type (£218 million at 30 June 2021)
SEGRO land bank (30 June 2021)
20
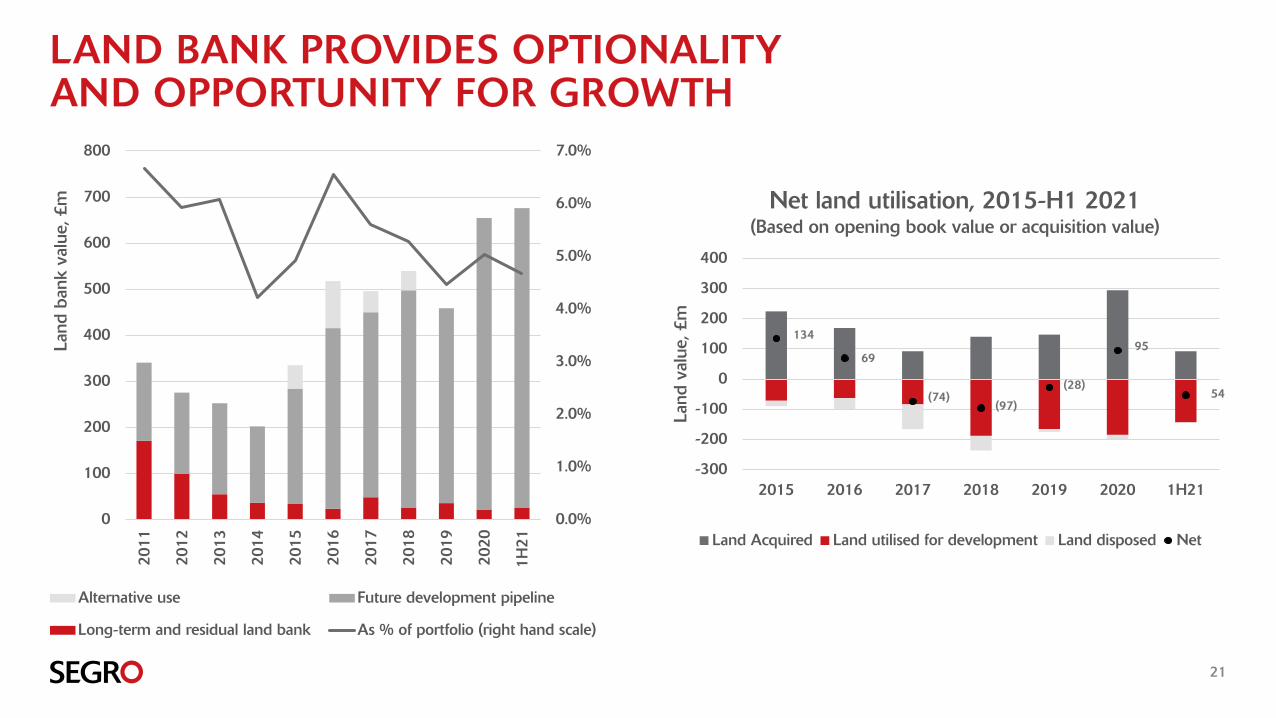
LAND BANK PROVIDES OPTIONALITY AND OPPORTUNITY FOR GROWTH
21
0.0%
1.0%
2.0%
3.0%
4.0%
5.0%
6.0%
7.0%
0
100
200
300
400
500
600
700
80020
11
2012
2013
2014
2015
2016
2017
2018
2019
2020
1H21
Land
ban
k va
lue,
£m
Alternative use Future development pipeline
Long-term and residual land bank As % of portfolio (right hand scale)
-300
-200
-100
0
100
200
300
400
2015 2016 2017 2018 2019 2020 1H21
Land
val
ue, £
m
Net land utilisation, 2015-H1 2021 (Based on opening book value or acquisition value)
Land Acquired Land utilised for development Land disposed Net
134
69
(74)(97)
(28)
95
54
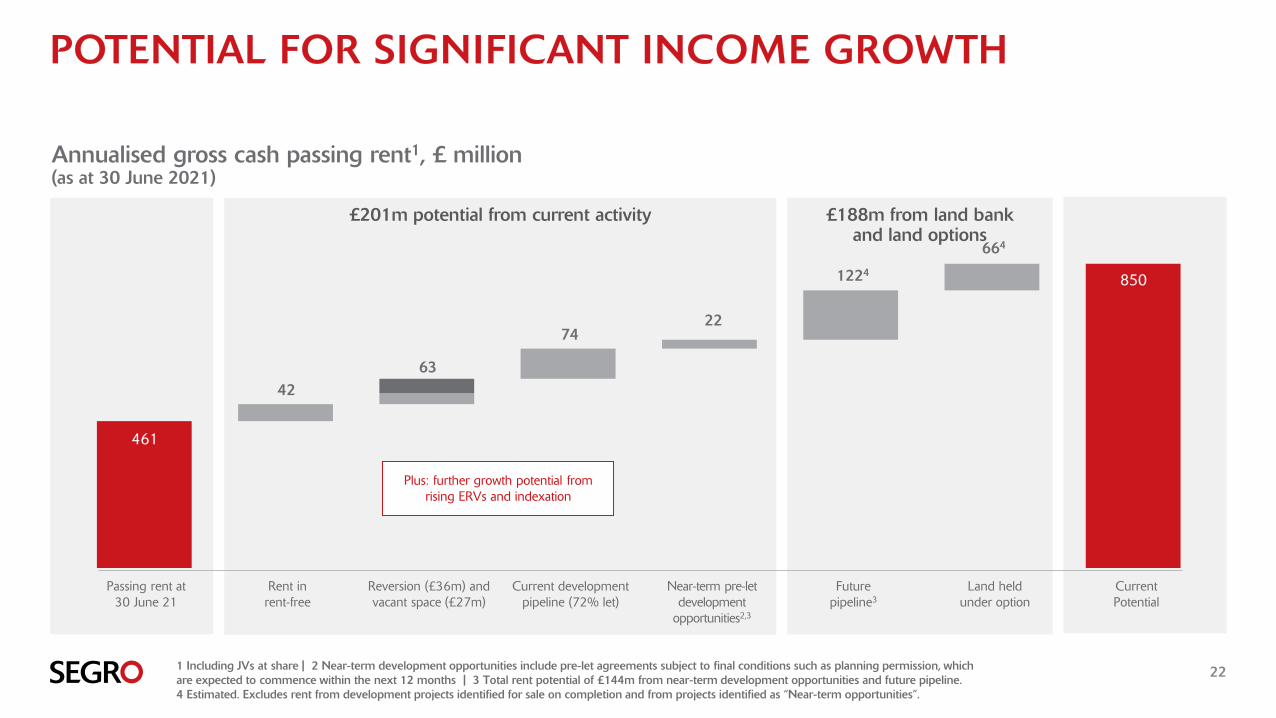
POTENTIAL FOR SIGNIFICANT INCOME GROWTH
22
Passing rent at30 June 21
Rent in rent-free
Reversion (£36m) and vacant space (£27m)
Current developmentpipeline (72% let)
Near-term pre-letdevelopment
opportunities2,3
Futurepipeline3
Land held under option
CurrentPotential
£201m potential from current activity £188m from land bank and land options
63
7422
850
42
1224
664
461
Annualised gross cash passing rent1, £ million(as at 30 June 2021)
Plus: further growth potential from rising ERVs and indexation
1 Including JVs at share | 2 Near-term development opportunities include pre-let agreements subject to final conditions such as planning permission, which are expected to commence within the next 12 months | 3 Total rent potential of £144m from near-term development opportunities and future pipeline. 4 Estimated. Excludes rent from development projects identified for sale on completion and from projects identified as “Near-term opportunities”.

APPENDIX Portfolio and Financial Data
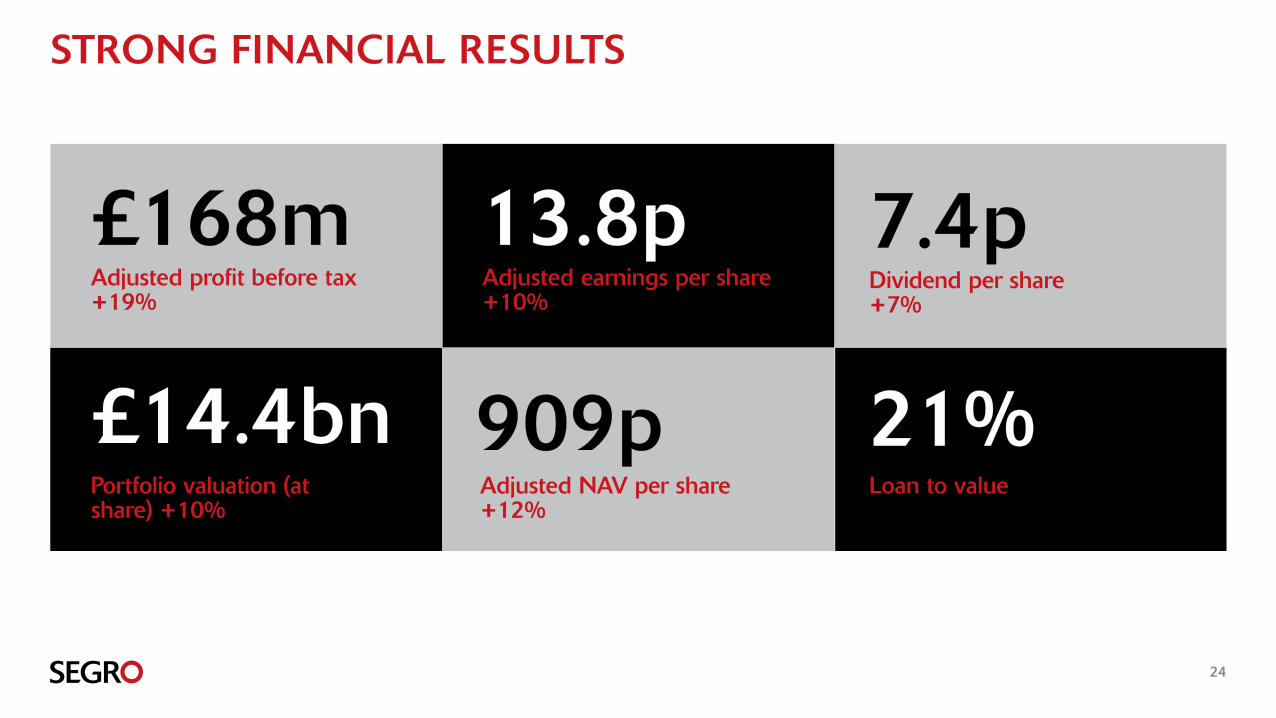
STRONG FINANCIAL RESULTS
24
£14.4bnPortfolio valuation (at share) +10%
13.8pAdjusted earnings per share+10%
21%Loan to value
£168mAdjusted profit before tax+19%
Dividend per share+7%
7.4p
909pAdjusted NAV per share+12%
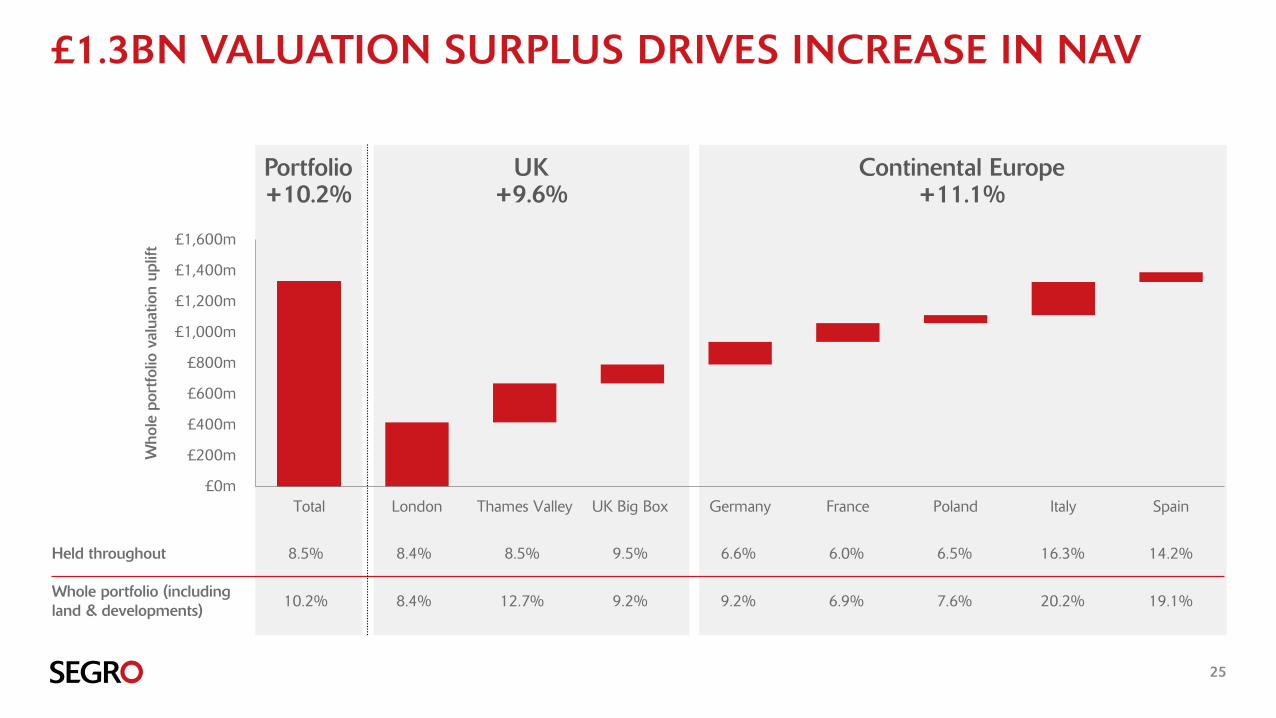
£1.3BN VALUATION SURPLUS DRIVES INCREASE IN NAV
Portfolio +10.2%
25
650p
£0m
£200m
£400m
£600m
£800m
£1,000m
£1,200m
£1,400m
£1,600m
Total London Thames Valley UK Big Box Germany France Poland Italy Spain
Who
le p
ortfo
lio v
alua
tion
uplif
t
Held throughout 8.5% 8.4% 8.5% 9.5% 6.6% 6.0% 6.5% 16.3% 14.2%
Whole portfolio (includingland & developments) 10.2% 8.4% 12.7% 9.2% 9.2% 6.9% 7.6% 20.2% 19.1%
UK+9.6%
Continental Europe+11.1%
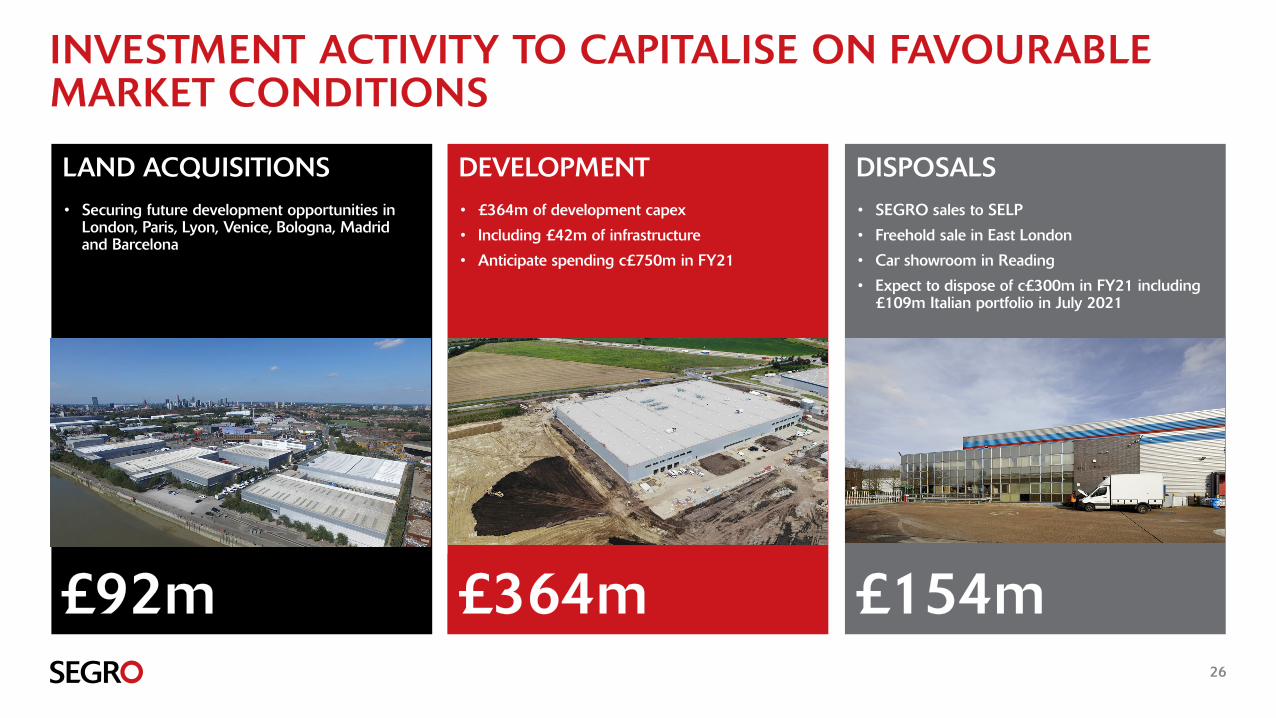
LAND ACQUISITIONS• Securing future development opportunities in
London, Paris, Lyon, Venice, Bologna, Madrid and Barcelona
INVESTMENT ACTIVITY TO CAPITALISE ON FAVOURABLE MARKET CONDITIONS
DEVELOPMENT• £364m of development capex
• Including £42m of infrastructure
• Anticipate spending c£750m in FY21
DISPOSALS• SEGRO sales to SELP
• Freehold sale in East London
• Car showroom in Reading
• Expect to dispose of c£300m in FY21 including £109m Italian portfolio in July 2021
£92m £364m £154m26
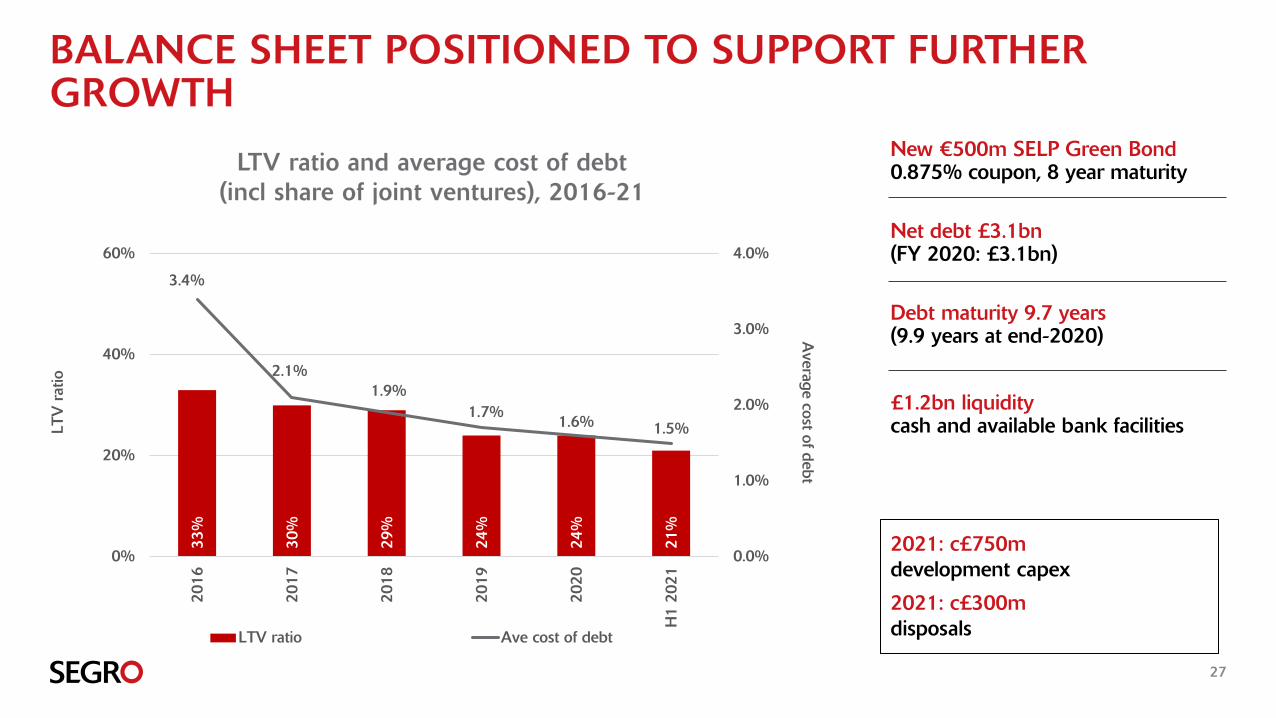
BALANCE SHEET POSITIONED TO SUPPORT FURTHER GROWTH
27
New €500m SELP Green Bond0.875% coupon, 8 year maturity
Net debt £3.1bn(FY 2020: £3.1bn)
Debt maturity 9.7 years(9.9 years at end-2020)
£1.2bn liquiditycash and available bank facilities
33%
30%
29%
24%
24%
21%
3.4%
2.1%1.9%
1.7%1.6% 1.5%
0.0%
1.0%
2.0%
3.0%
4.0%
0%
20%
40%
60%
2016
2017
2018
2019
2020
H1
2021
Average cost of debt
LTV
rat
io
LTV ratio Ave cost of debt
LTV ratio and average cost of debt(incl share of joint ventures), 2016-21
2021: c£750mdevelopment capex
2021: c£300mdisposals
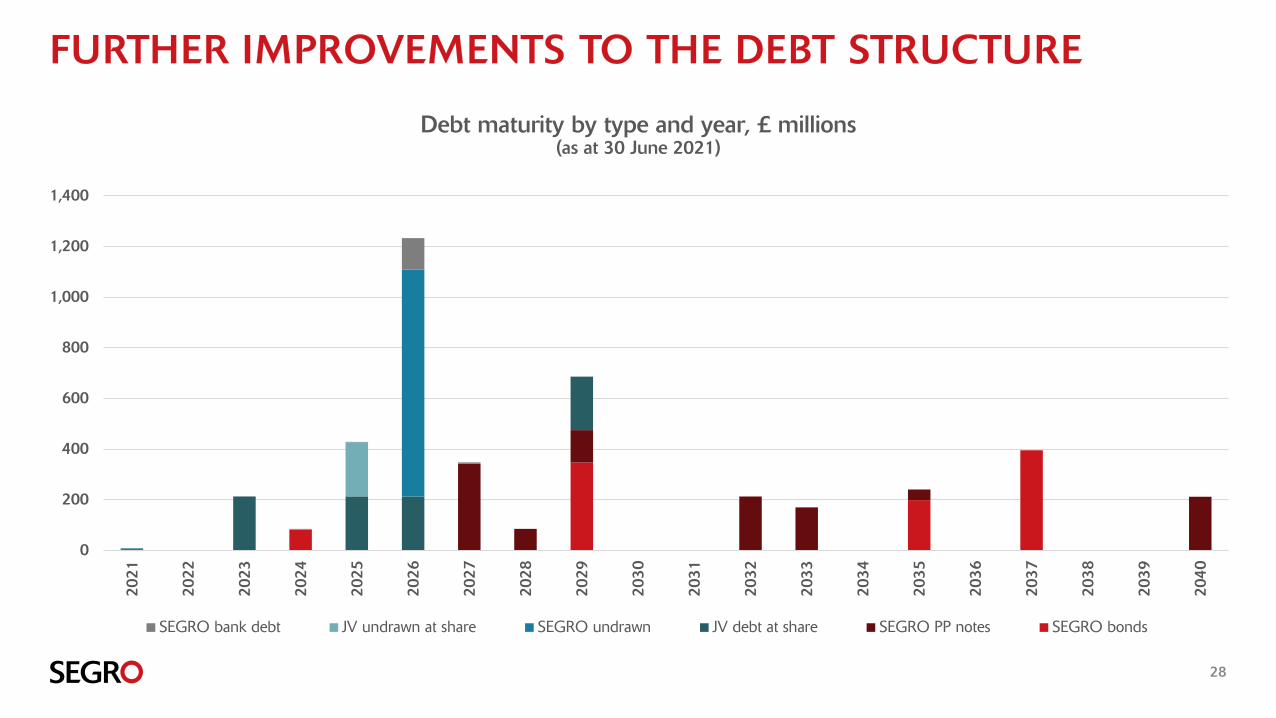
FURTHER IMPROVEMENTS TO THE DEBT STRUCTURE
28
Debt maturity by type and year, £ millions(as at 30 June 2021)
0
200
400
600
800
1,000
1,200
1,400
2021
2022
2023
2024
2025
2026
2027
2028
2029
2030
2031
2032
2033
2034
2035
2036
2037
2038
2039
2040
SEGRO bank debt JV undrawn at share SEGRO undrawn JV debt at share SEGRO PP notes SEGRO bonds
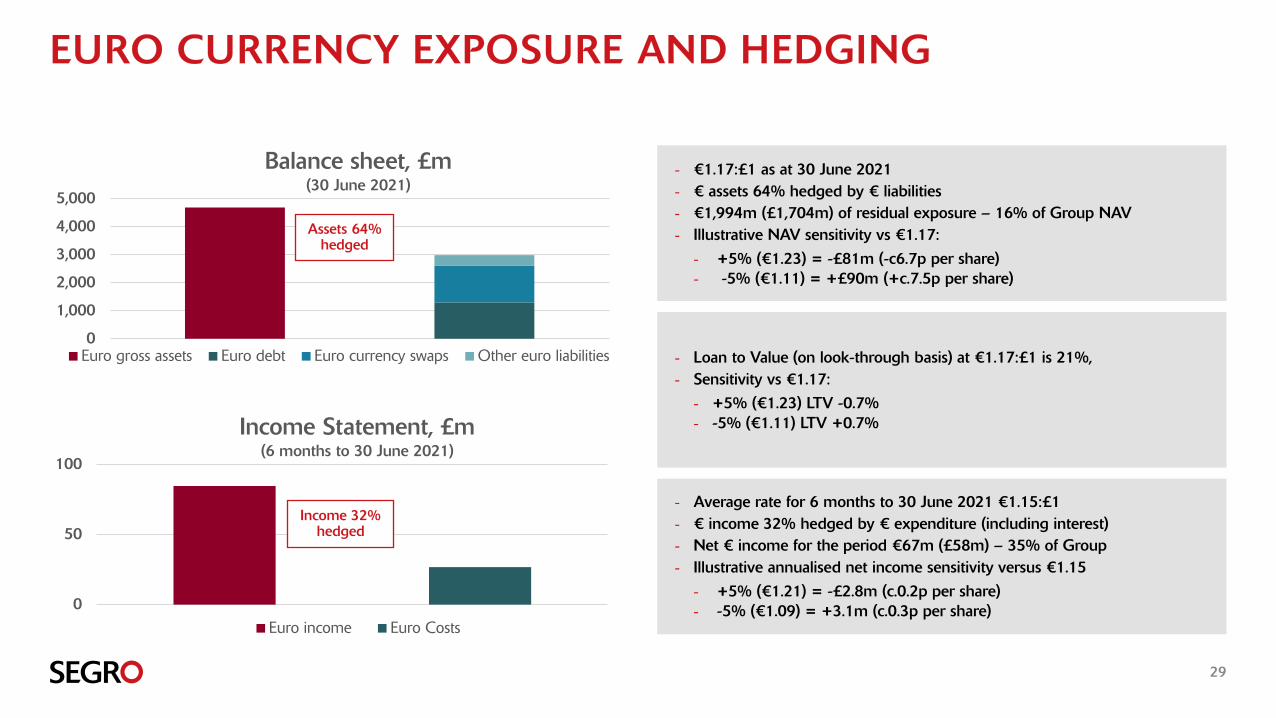
EURO CURRENCY EXPOSURE AND HEDGING
29
0
1,000
2,000
3,000
4,000
5,000
Balance sheet, £m(30 June 2021)
Euro gross assets Euro debt Euro currency swaps Other euro liabilities
0
50
100
Income Statement, £m(6 months to 30 June 2021)
Euro income Euro Costs
Assets 64% hedged
Income 32% hedged
- €1.17:£1 as at 30 June 2021 - € assets 64% hedged by € liabilities - €1,994m (£1,704m) of residual exposure – 16% of Group NAV- Illustrative NAV sensitivity vs €1.17:
- +5% (€1.23) = -£81m (-c6.7p per share)- -5% (€1.11) = +£90m (+c.7.5p per share)
- Loan to Value (on look-through basis) at €1.17:£1 is 21%,- Sensitivity vs €1.17:
- +5% (€1.23) LTV -0.7%- -5% (€1.11) LTV +0.7%
- Average rate for 6 months to 30 June 2021 €1.15:£1- € income 32% hedged by € expenditure (including interest)- Net € income for the period €67m (£58m) – 35% of Group- Illustrative annualised net income sensitivity versus €1.15
- +5% (€1.21) = -£2.8m (c.0.2p per share)- -5% (€1.09) = +3.1m (c.0.3p per share)
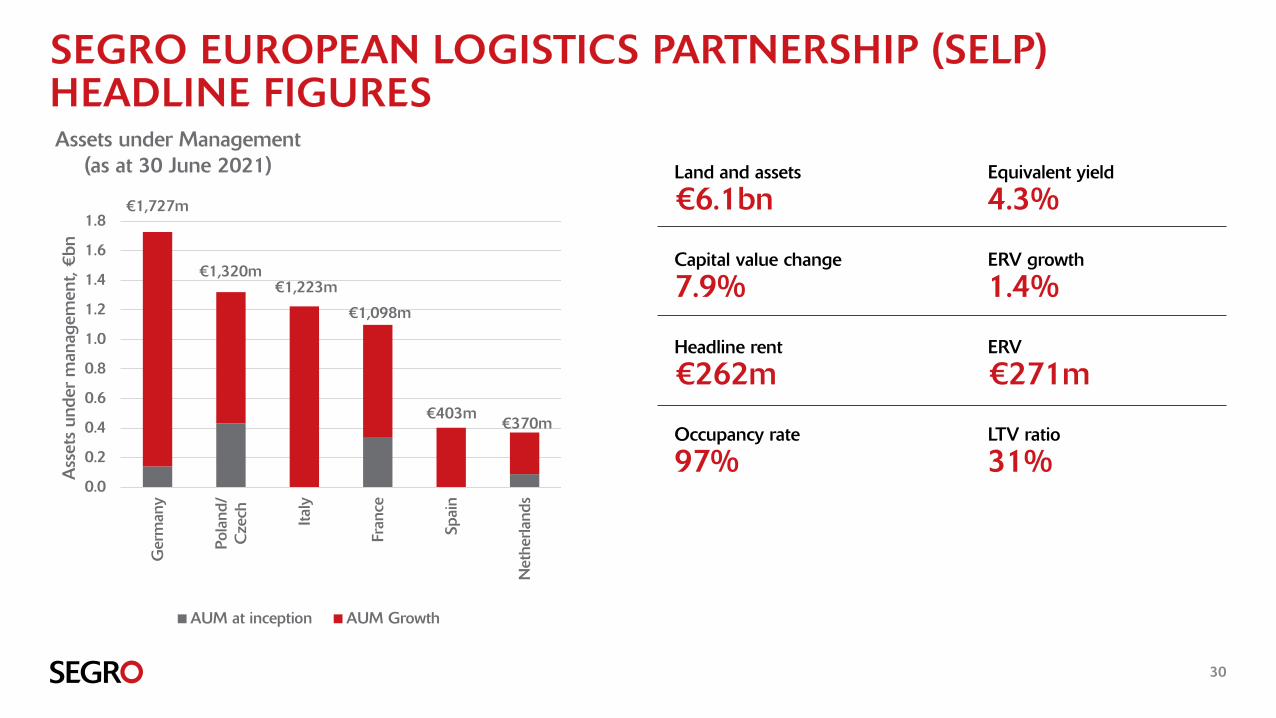
SEGRO EUROPEAN LOGISTICS PARTNERSHIP (SELP) HEADLINE FIGURES
30
Land and assets
€6.1bn
Capital value change
7.9%
Headline rent
€262m
Occupancy rate
97%
Equivalent yield
4.3%
ERV growth
1.4%
ERV
€271m
LTV ratio
31%0.0
0.2
0.4
0.6
0.8
1.0
1.2
1.4
1.6
1.8
Ger
man
y
Pola
nd/
Cze
ch Italy
Fran
ce
Spai
n
Net
herla
nds
Ass
ets
unde
r m
anag
emen
t, €
bn
Assets under Management (as at 30 June 2021)
AUM at inception AUM Growth
€1,727m
€1,223m€1,320m
€370m€403m
€1,098m
Championing Low-carbon growth
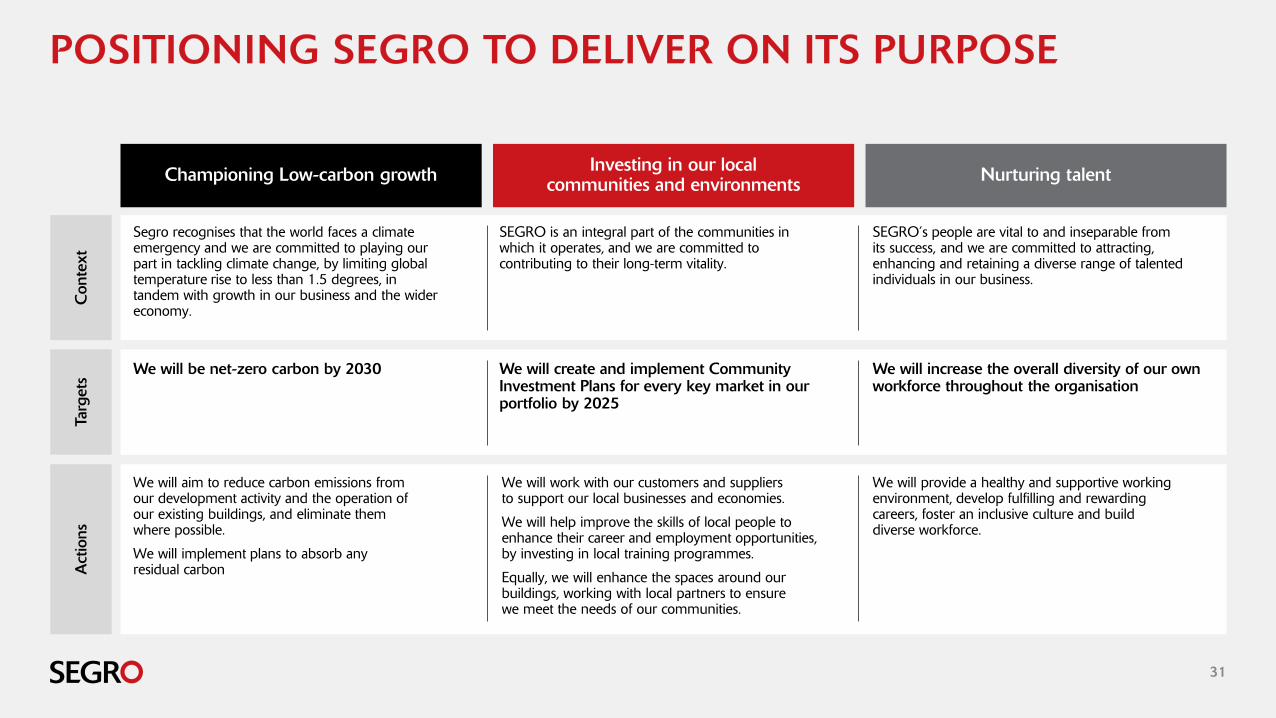
POSITIONING SEGRO TO DELIVER ON ITS PURPOSE
31
Investing in our local communities and environments Nurturing talent
Segro recognises that the world faces a climate emergency and we are committed to playing our part in tackling climate change, by limiting global temperature rise to less than 1.5 degrees, in tandem with growth in our business and the wider economy.
We will be net-zero carbon by 2030
We will aim to reduce carbon emissions from our development activity and the operation of our existing buildings, and eliminate them where possible.
We will implement plans to absorb any residual carbon
SEGRO is an integral part of the communities in which it operates, and we are committed to contributing to their long-term vitality.
We will create and implement Community Investment Plans for every key market in our portfolio by 2025
We will work with our customers and suppliers to support our local businesses and economies.
We will help improve the skills of local people to enhance their career and employment opportunities, by investing in local training programmes.
Equally, we will enhance the spaces around our buildings, working with local partners to ensure we meet the needs of our communities.
SEGRO’s people are vital to and inseparable from its success, and we are committed to attracting, enhancing and retaining a diverse range of talented individuals in our business.
We will increase the overall diversity of our own workforce throughout the organisation
We will provide a healthy and supportive working environment, develop fulfilling and rewarding careers, foster an inclusive culture and build diverse workforce.
Con
text
Targ
ets
Act
ions
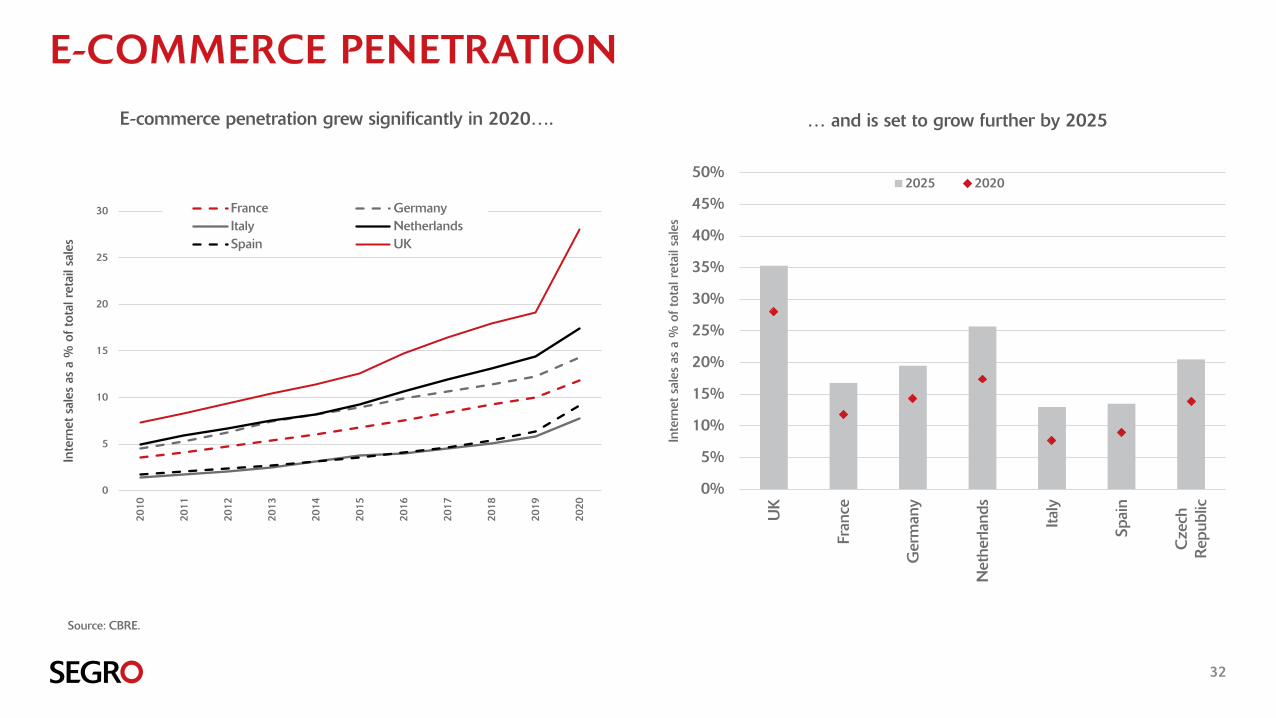
E-COMMERCE PENETRATION
32
0
5
10
15
20
25
30
2010
2011
2012
2013
2014
2015
2016
2017
2018
2019
2020
Inte
rnet
sal
es a
s a
% o
f tot
al r
etai
l sal
es
France GermanyItaly NetherlandsSpain UK
0%
5%
10%
15%
20%
25%
30%
35%
40%
45%
50%
UK
Fran
ce
Ger
man
y
Net
herla
nds
Italy
Spai
n
Cze
chR
epub
lic
Inte
rnet
sal
es a
s a
% o
f tot
al r
etai
l sal
es
2025 2020
… and is set to grow further by 2025
Source: CBRE.
E-commerce penetration grew significantly in 2020….
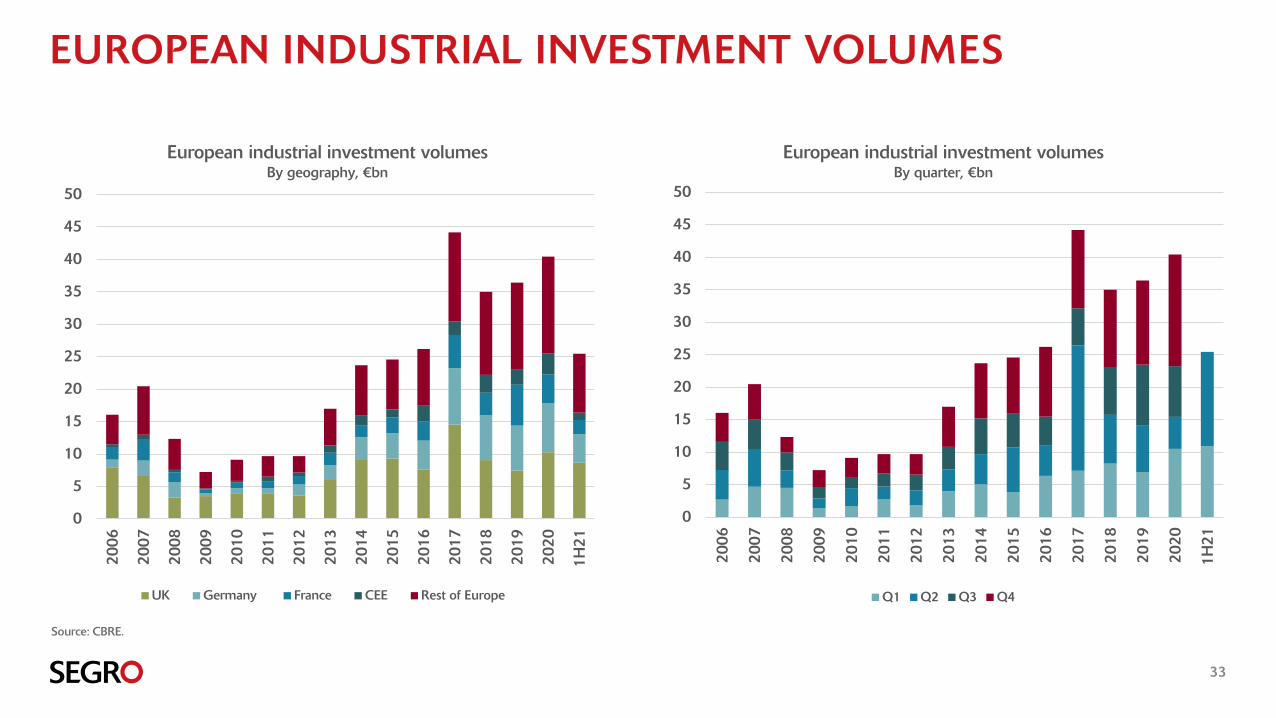
EUROPEAN INDUSTRIAL INVESTMENT VOLUMES
33
0
5
10
15
20
25
30
35
40
45
50
2006
2007
2008
2009
2010
2011
2012
2013
2014
2015
2016
2017
2018
2019
2020
1H21
European industrial investment volumesBy geography, €bn
UK Germany France CEE Rest of Europe
0
5
10
15
20
25
30
35
40
45
50
2006
2007
2008
2009
2010
2011
2012
2013
2014
2015
2016
2017
2018
2019
2020
1H21
European industrial investment volumesBy quarter, €bn
Q1 Q2 Q3 Q4
Source: CBRE.
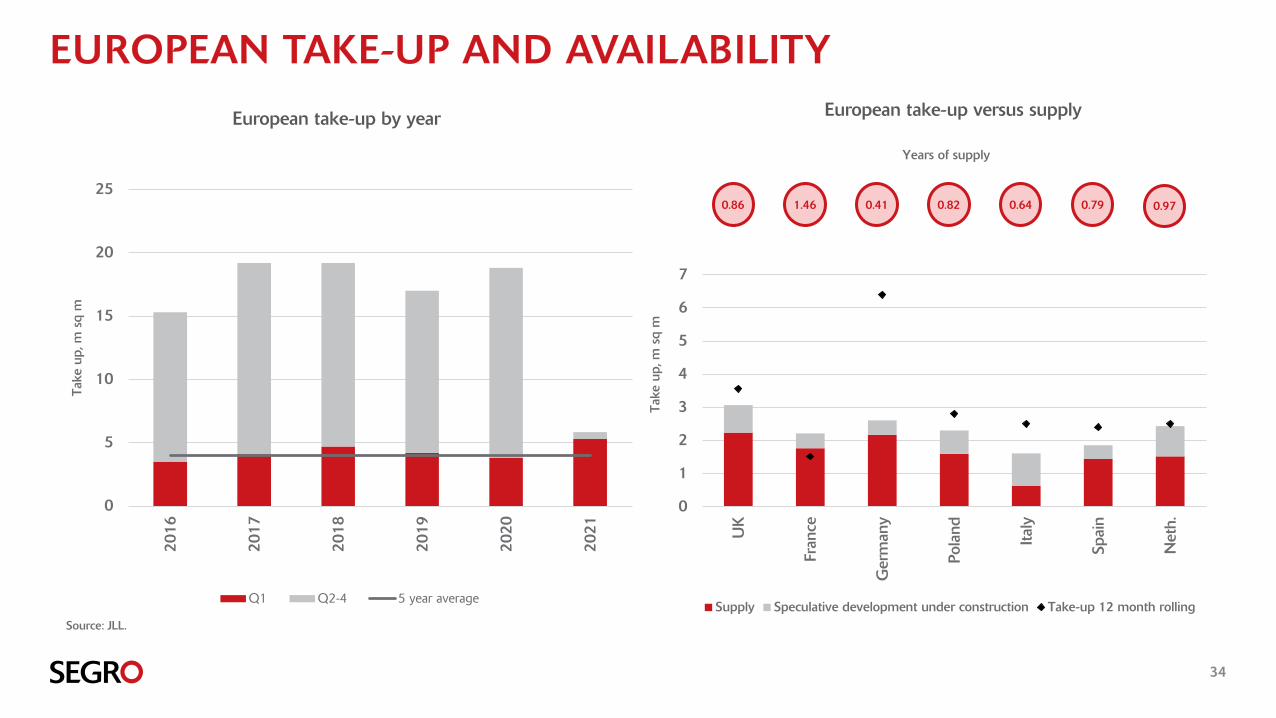
EUROPEAN TAKE-UP AND AVAILABILITY
34
0
5
10
15
20
2520
16
2017
2018
2019
2020
2021
Take
up,
m s
qm
Q1 Q2-4 5 year average
European take-up versus supply
Source: JLL.
European take-up by year
0
1
2
3
4
5
6
7
UK
Fran
ce
Ger
man
y
Pola
nd
Italy
Spai
n
Net
h.
Take
up,
m s
qm
Supply Speculative development under construction Take-up 12 month rolling
0.86 1.46 0.41 0.82 0.64 0.79 0.97
Years of supply
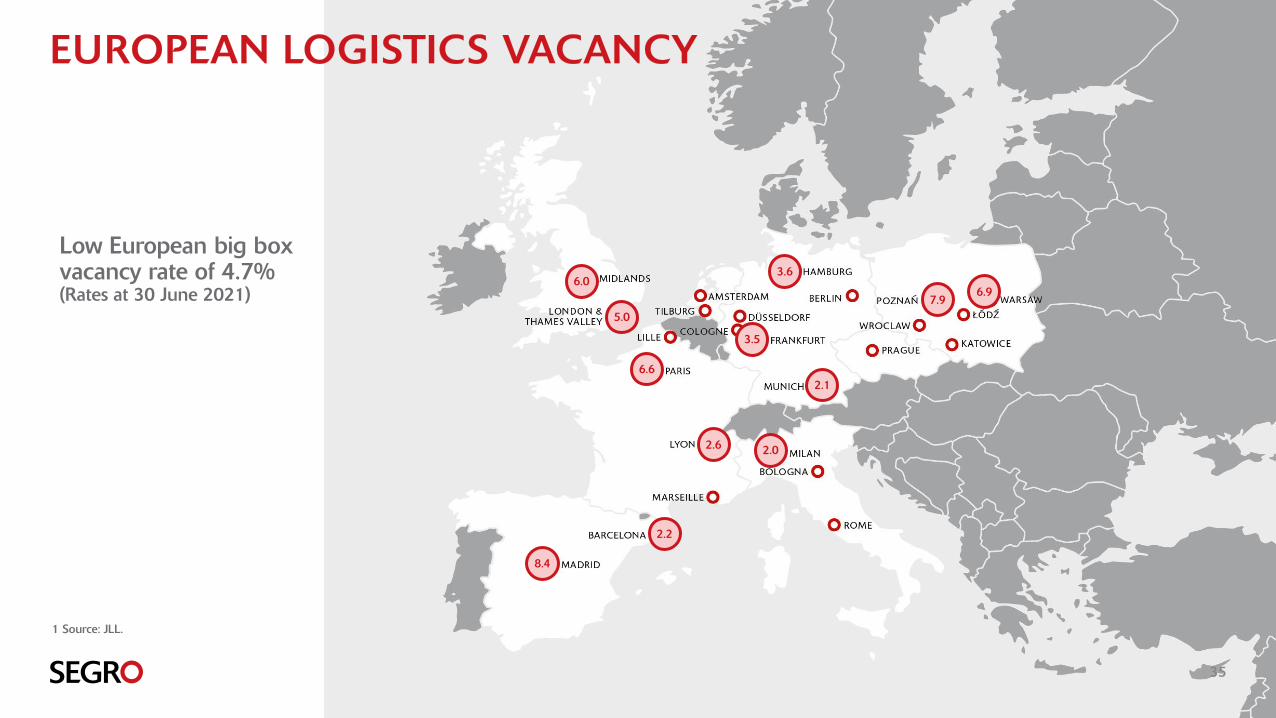
EUROPEAN LOGISTICS VACANCY
35
Low European big box vacancy rate of 4.7%(Rates at 30 June 2021)
6.0
5.0
6.6
2.6 2.0
2.2
8.4
2.1
3.5
3.6
7.96.9
1 Source: JLL.
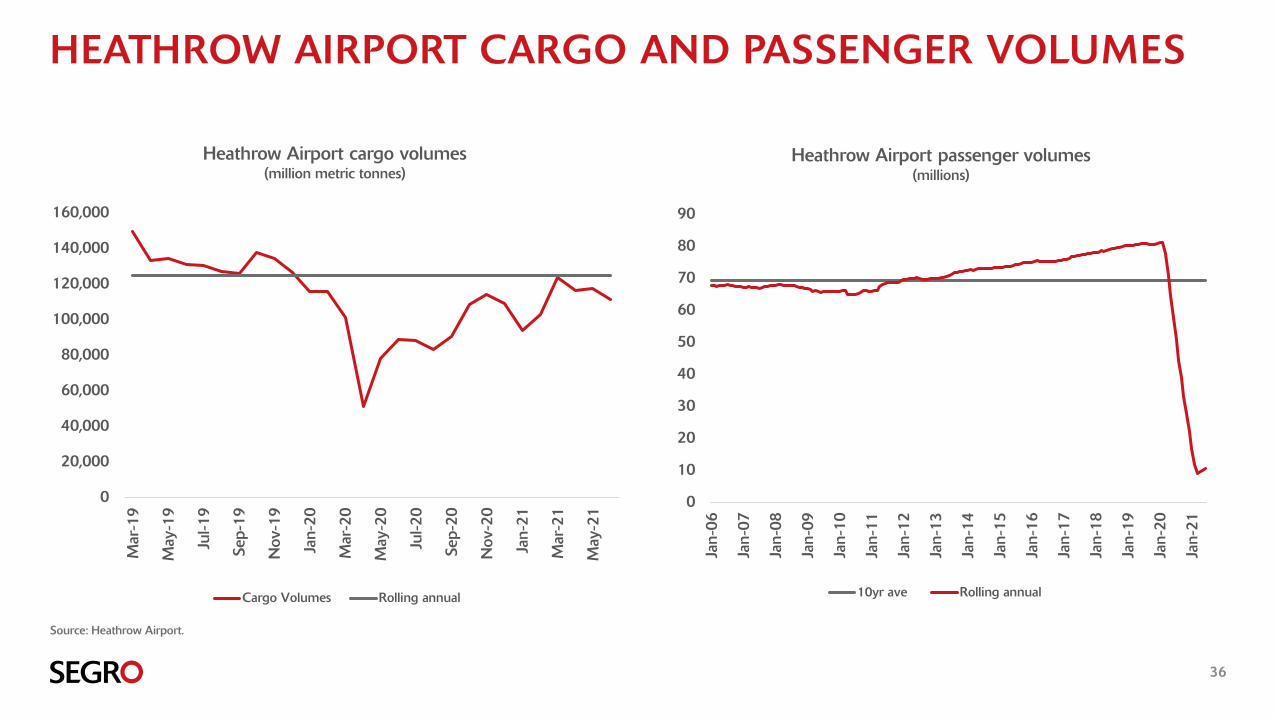
HEATHROW AIRPORT CARGO AND PASSENGER VOLUMES
36
Heathrow Airport cargo volumes(million metric tonnes)
Heathrow Airport passenger volumes(millions)
0
20,000
40,000
60,000
80,000
100,000
120,000
140,000
160,000
Mar
-19
May
-19
Jul-1
9
Sep-
19
Nov
-19
Jan-
20
Mar
-20
May
-20
Jul-2
0
Sep-
20
Nov
-20
Jan-
21
Mar
-21
May
-21
Cargo Volumes Rolling annual
0
10
20
30
40
50
60
70
80
90
Jan-
06
Jan-
07
Jan-
08
Jan-
09
Jan-
10
Jan-
11
Jan-
12
Jan-
13
Jan-
14
Jan-
15
Jan-
16
Jan-
17
Jan-
18
Jan-
19
Jan-
20
Jan-
21
10yr ave Rolling annual
Source: Heathrow Airport.
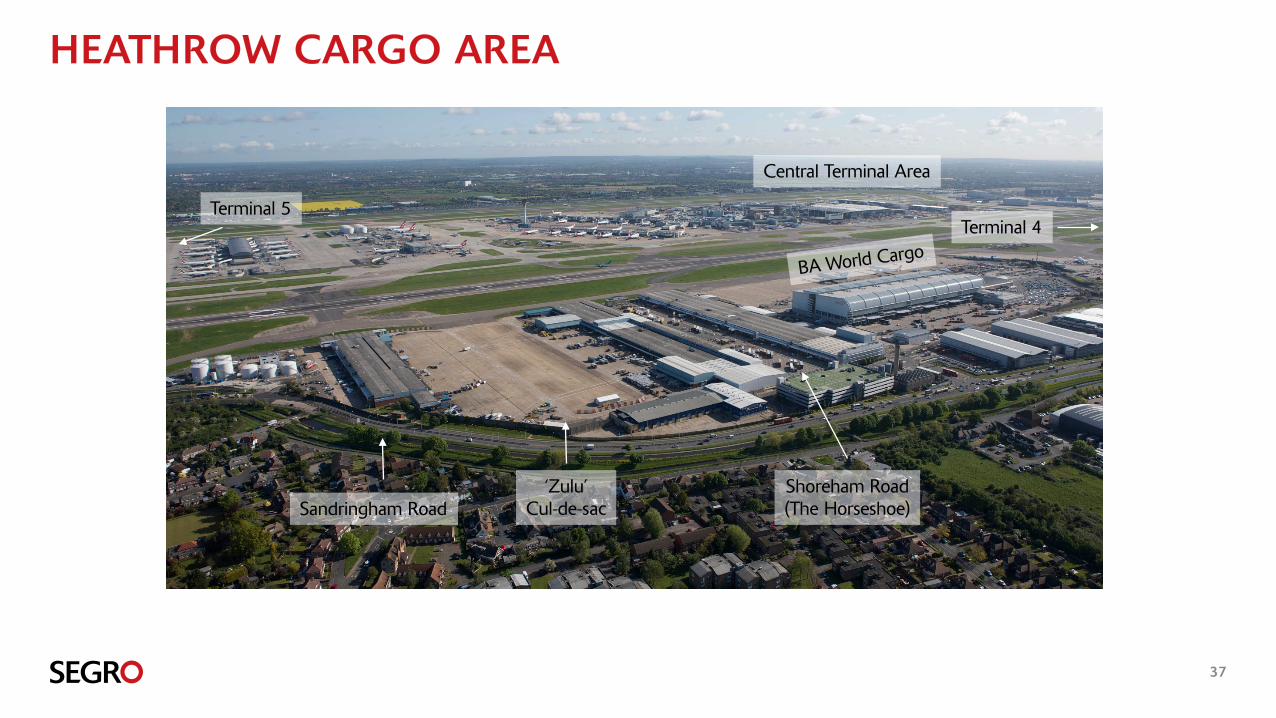
HEATHROW CARGO AREA
37
Terminal 5
Central Terminal Area
Terminal 4
Shoreham Road(The Horseshoe)
‘Zulu’Cul-de-sacSandringham Road
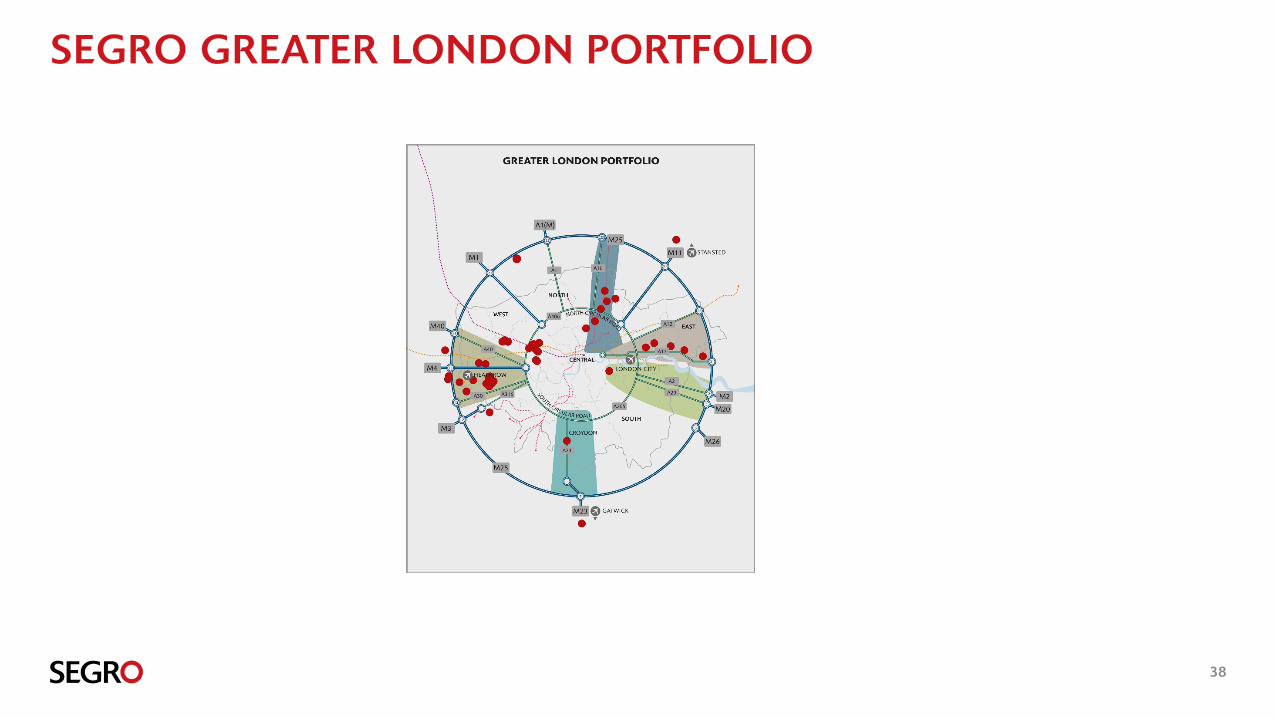
SEGRO GREATER LONDON PORTFOLIO
38
FORWARD-LOOKING STATEMENTS AND DISCLAIMER
39
This Presentation does not constitute an offer to sell or an invitation to buy securities in SEGRO or an invitation or inducement to engage in or enter into any contract or commitment or other investment activity. No part of this Presentation, nor the fact of its distribution, should form the basis of, or be relied on in connection with, any contract or commitment or investment decision whatsoever.
This Presentation may contain certain forward-looking statements with respect to SEGRO’s expectations and plans, strategy, management objectives, future developments and performance, costs, revenues and other trend information. Some of these forward-looking statements may be based on data provided by third parties. All forward-looking statements are subject to assumptions, risks and uncertainties. Many of these assumptions, risks and uncertainties relates to factors that are beyond SEGRO’s ability to control or estimate precisely and which could cause actual results or developments to differ materially from those expressed or implied by these forward-looking statements. Certain statements have been made with reference to forecast process changes, economic conditions and the current regulatory environment. Any forward-looking statements made by or on behalf of SEGRO are based upon the knowledge and information available to Directors as at the date of the statement. Accordingly, no assurance can be given that any particular expectation will be met and you are cautioned not to place undue reliance on the forward-looking statements. Additionally, forward-looking statements regarding past trends or activities should not be taken as a representation that such trends or activities will continue in the future. The information contained in this Presentation, including information provided by third parties, is given as at the date of this Presentation and is subject to change without notice. Other than in accordance with its legal or regulatory obligations (including under the UK Listing Rules and the Disclosure Guidance and Transparency Rules of the Financial Conduct Authority), SEGRO does not undertake to update any forward-looking statements, including to reflect any new information or changes in events, conditions or circumstances on which any such statement is based.
Past share performance cannot be relied on as a guide to future performance. Nothing in this Presentation should be construed as a profit estimate or profit forecast.
Contact details:
Claire MogfordHead of Investor Relations+44 (207) 451 [email protected] July 2021