2017 FULL YEAR RESULTS - SEGRO
56
2017 FULL YEAR RESULTS 16 FEBRUARY 2018
Transcript of 2017 FULL YEAR RESULTS - SEGRO
2017 FULL YEAR RESULTS16 FEBRUARY 2018
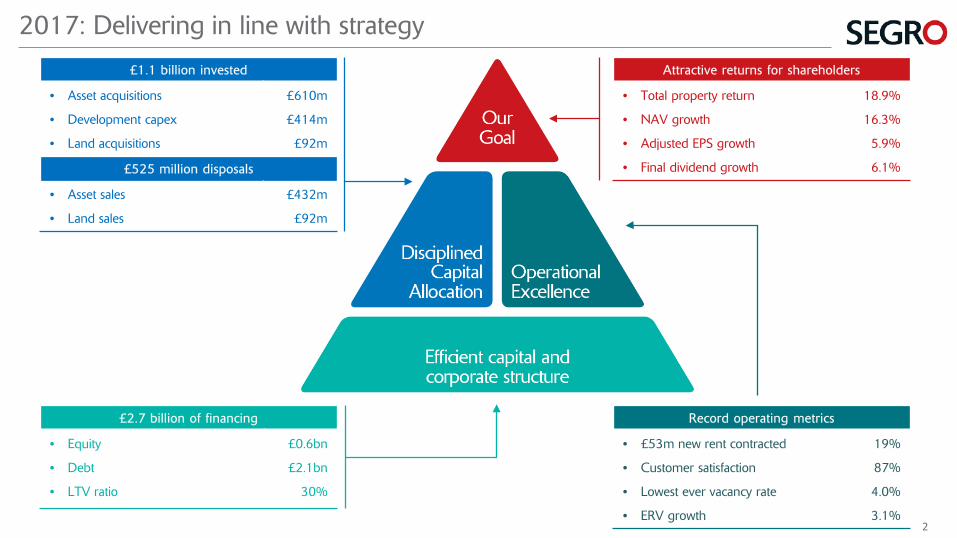
2017: Delivering in line with strategy
Attractive returns for shareholders
• Total property return
• NAV growth
• Adjusted EPS growth
• Final dividend growth
18.9%
16.3%
5.9%
6.1%
Record operating metrics
• £53m new rent contracted
• Customer satisfaction
• Lowest ever vacancy rate
• ERV growth
19%
87%
4.0%
3.1%
£1.1 billion invested
• Asset acquisitions
• Development capex
• Land acquisitions
£610m
£414m
£92m
£525 million disposals
• Asset sales
• Land sales
£432m
£92m
£2.7 billion of financing
• Equity
• Debt
• LTV ratio
£0.6bn
£2.1bn
30%
2
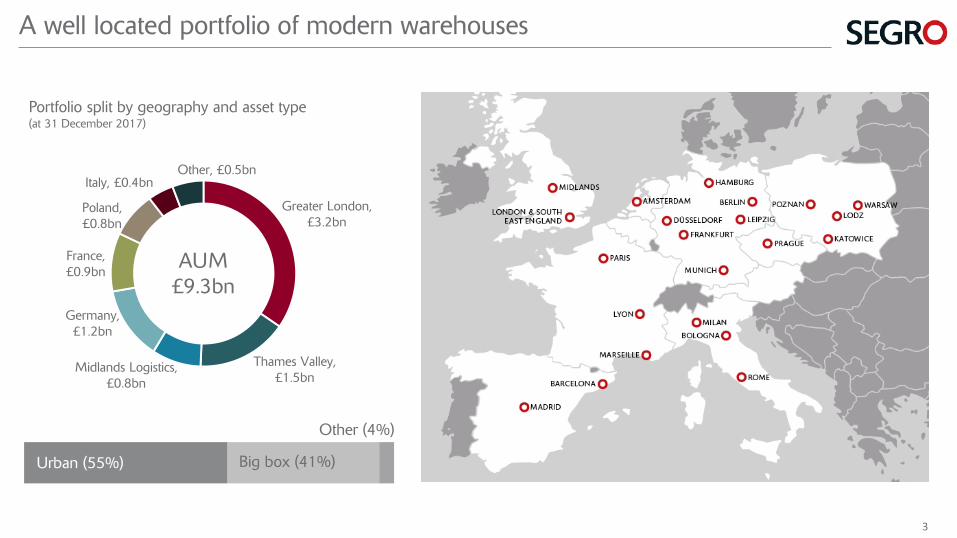
Greater London, £3.2bn
Thames Valley, £1.5bn
Midlands Logistics, £0.8bn
Germany, £1.2bn
France, £0.9bn
Poland, £0.8bn
Italy, £0.4bnOther, £0.5bn
A well located portfolio of modern warehouses
AUM£9.3bn
Urban (55%) Big box (41%)
Other (4%)
Portfolio split by geography and asset type(at 31 December 2017)
3
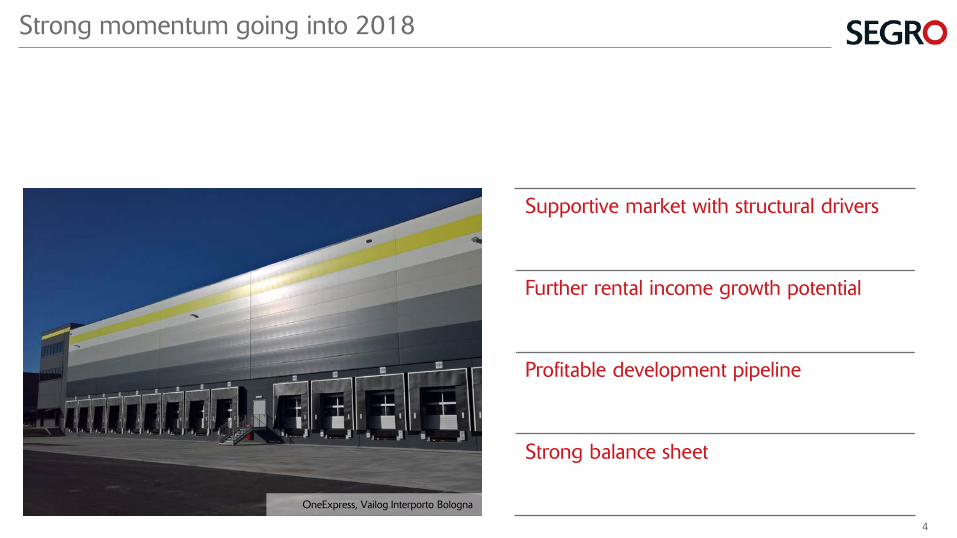
OneExpress, Vailog Interporto Bologna
Strong momentum going into 2018
Supportive market with structural drivers
Further rental income growth potential
Profitable development pipeline
Strong balance sheet
4
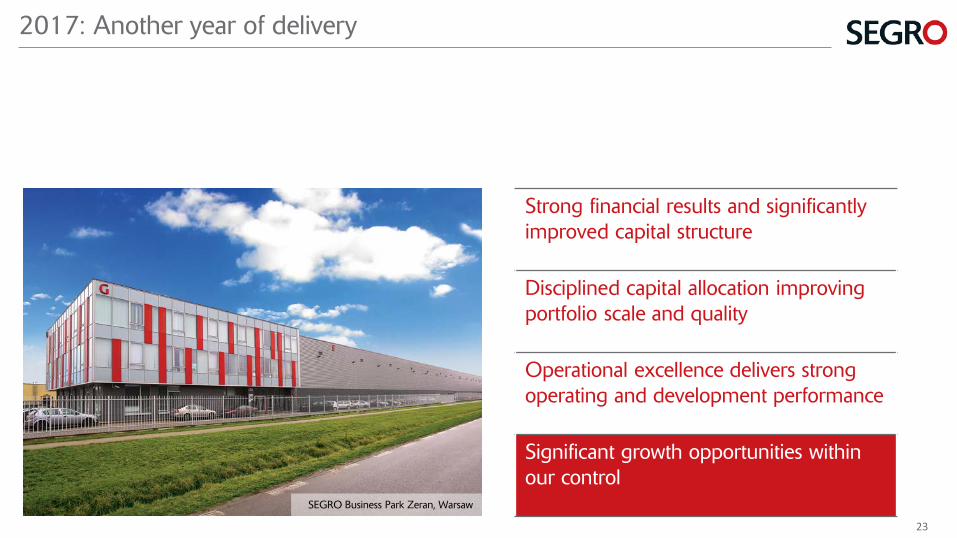
2017: Another year of delivery
Strong financial results and significantly improved capital structure
Disciplined capital allocation improving portfolio scale and quality
Operational excellence delivers strong operating and development performance
Significant growth opportunities within our control
SEGRO Park Düsseldorf-Sud
5
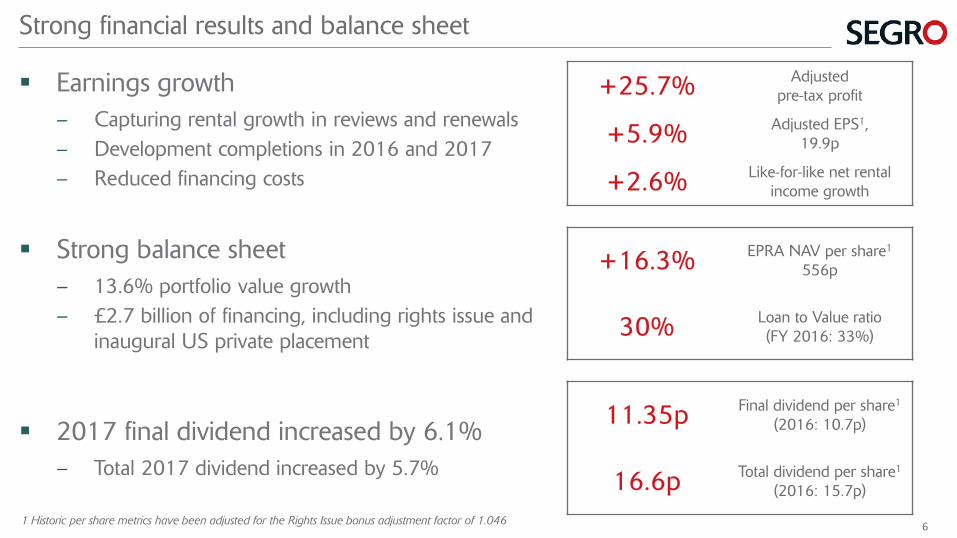
Strong financial results and balance sheet
Earnings growth– Capturing rental growth in reviews and renewals– Development completions in 2016 and 2017– Reduced financing costs
+25.7% Adjustedpre-tax profit
+5.9% Adjusted EPS1, 19.9p
+2.6% Like-for-like net rental income growth
Strong balance sheet– 13.6% portfolio value growth– £2.7 billion of financing, including rights issue and
inaugural US private placement
+16.3% EPRA NAV per share1
556p
30% Loan to Value ratio(FY 2016: 33%)
2017 final dividend increased by 6.1%– Total 2017 dividend increased by 5.7%
11.35p Final dividend per share1
(2016: 10.7p)
16.6p Total dividend per share1
(2016: 15.7p)
1 Historic per share metrics have been adjusted for the Rights Issue bonus adjustment factor of 1.046 6
2016
net
rent
al in
com
e
Disp
osal
s
Acq
uisit
ions
Like
-for-
like
NRI
Com
plet
edde
velo
pmen
ts
Take
-bac
ks fo
rde
velo
pmen
t
Oth
er
Cur
renc
y
2017
net
rent
al in
com
e
Pro
form
a 20
17(s
ee s
lide
35)
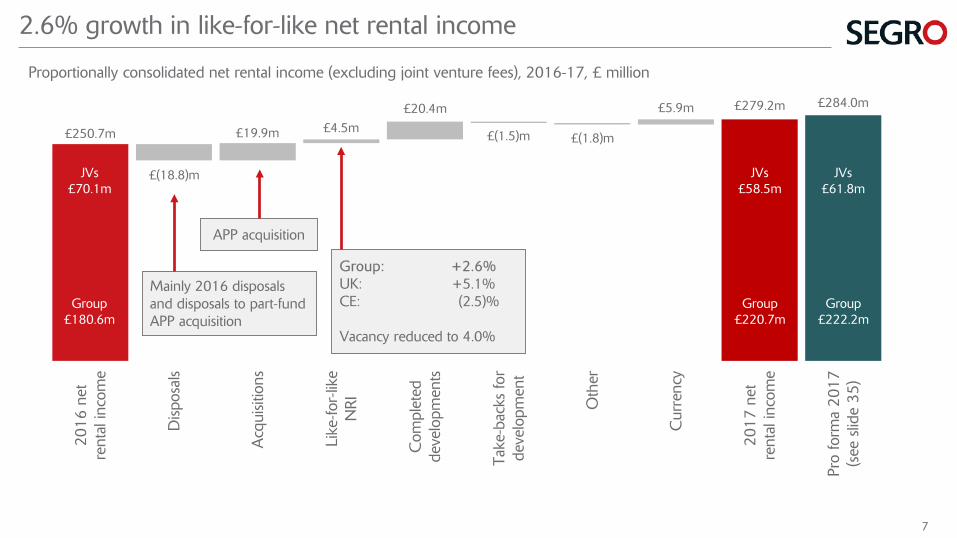
£(18.8)m
£19.9m
£20.4m
£(1.5)m£4.5m
£(1.8)m
£5.9m
£250.7m
£279.2m
2.6% growth in like-for-like net rental income
Proportionally consolidated net rental income (excluding joint venture fees), 2016-17, £ million
Mainly 2016 disposals and disposals to part-fund APP acquisition
Group: +2.6%UK: +5.1%CE: (2.5)%
Vacancy reduced to 4.0%
APP acquisition
Group£220.7m
JVs£70.1m
Group£180.6m
JVs£58.5m
Group£222.2m
JVs£61.8m
£284.0m
7
1 Net property rental income less administrative expenses, net interest expenses and taxation
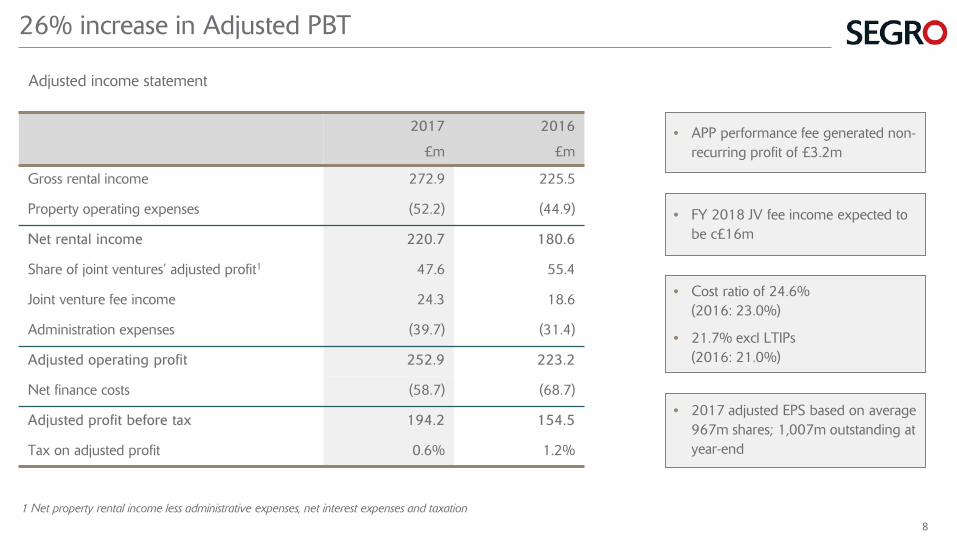
26% increase in Adjusted PBT
Adjusted income statement
2017
£m
2016
£m
Gross rental income 272.9 225.5
Property operating expenses (52.2) (44.9)
Net rental income 220.7 180.6
Share of joint ventures’ adjusted profit1 47.6 55.4
Joint venture fee income 24.3 18.6
Administration expenses (39.7) (31.4)
Adjusted operating profit 252.9 223.2
Net finance costs (58.7) (68.7)
Adjusted profit before tax 194.2 154.5
Tax on adjusted profit 0.6% 1.2%
• APP performance fee generated non-recurring profit of £3.2m
• Cost ratio of 24.6%(2016: 23.0%)
• 21.7% excl LTIPs(2016: 21.0%)
• 2017 adjusted EPS based on average 967m shares; 1,007m outstanding at year-end
• FY 2018 JV fee income expected to be c£16m
8
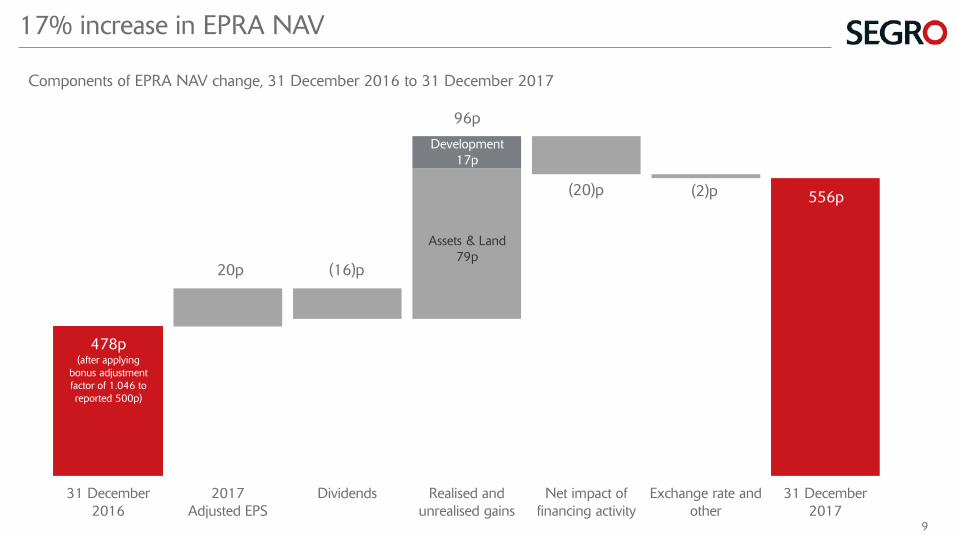
31 December2016
2017Adjusted EPS
Dividends Realised andunrealised gains
Net impact offinancing activity
Exchange rate andother
31 December2017
17% increase in EPRA NAV
Components of EPRA NAV change, 31 December 2016 to 31 December 2017
(16)p20p
96p
(20)p 556p
478p(after applying
bonus adjustment factor of 1.046 to reported 500p)
(2)p
Assets & Land79p
Development17p
9
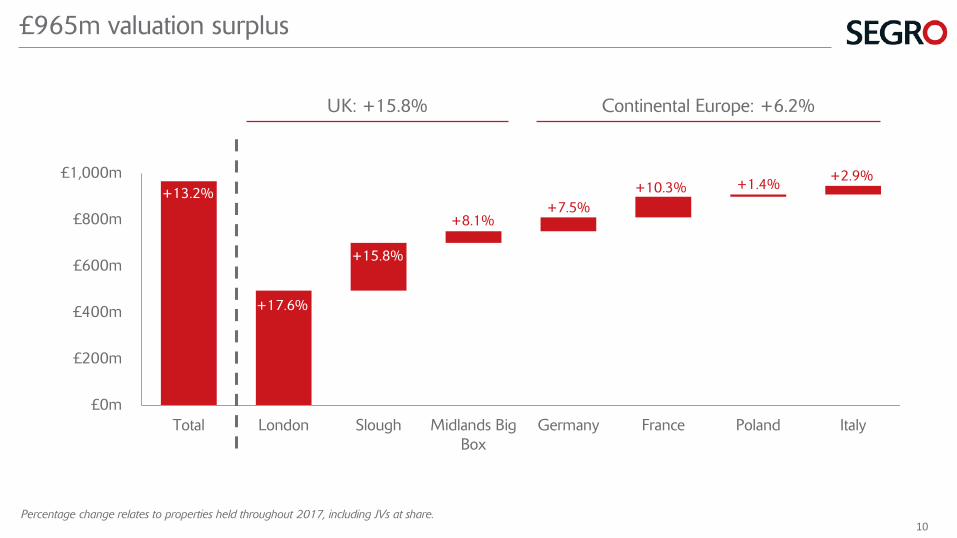
£0m
£200m
£400m
£600m
£800m
£1,000m
Total London Slough Midlands BigBox
Germany France Poland Italy
+17.6%
+8.1%
+1.4% +2.9%+13.2%
+15.8%
+7.5%+10.3%
Percentage change relates to properties held throughout 2017, including JVs at share.
£965m valuation surplus
UK: +15.8% Continental Europe: +6.2%
10
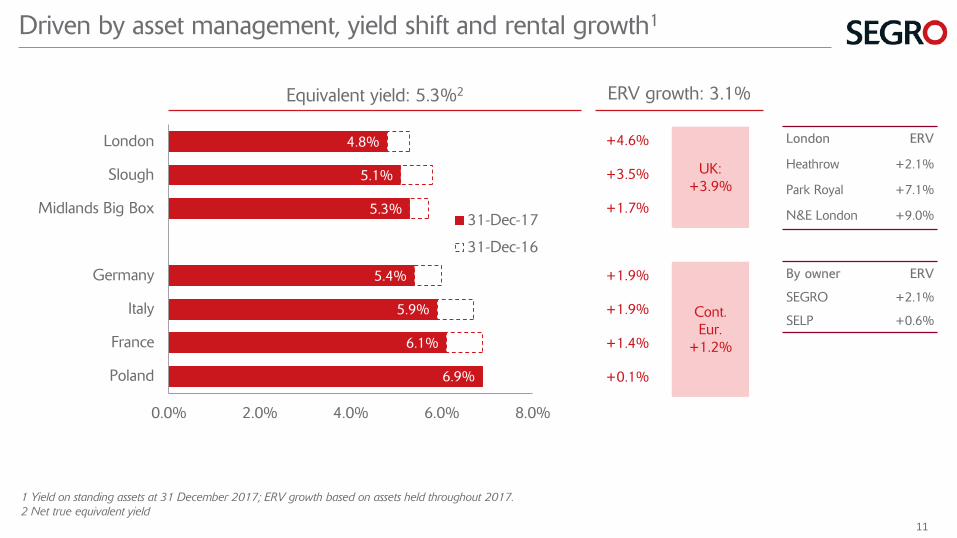
6.9%
6.1%
5.9%
5.4%
5.3%
5.1%
4.8%
0.0% 2.0% 4.0% 6.0% 8.0%
Poland
France
Italy
Germany
Midlands Big Box
Slough
London
31-Dec-17
31-Dec-16
1 Yield on standing assets at 31 December 2017; ERV growth based on assets held throughout 2017.2 Net true equivalent yield
Driven by asset management, yield shift and rental growth1
+4.6%
UK: +3.9%
+3.5%
+1.7%
+1.9%
Cont.Eur.
+1.2%
+1.9%
+1.4%
+0.1%
Equivalent yield: 5.3%2 ERV growth: 3.1%
By owner ERV
SEGRO +2.1%
SELP +0.6%
London ERV
Heathrow +2.1%
Park Royal +7.1%
N&E London +9.0%
11
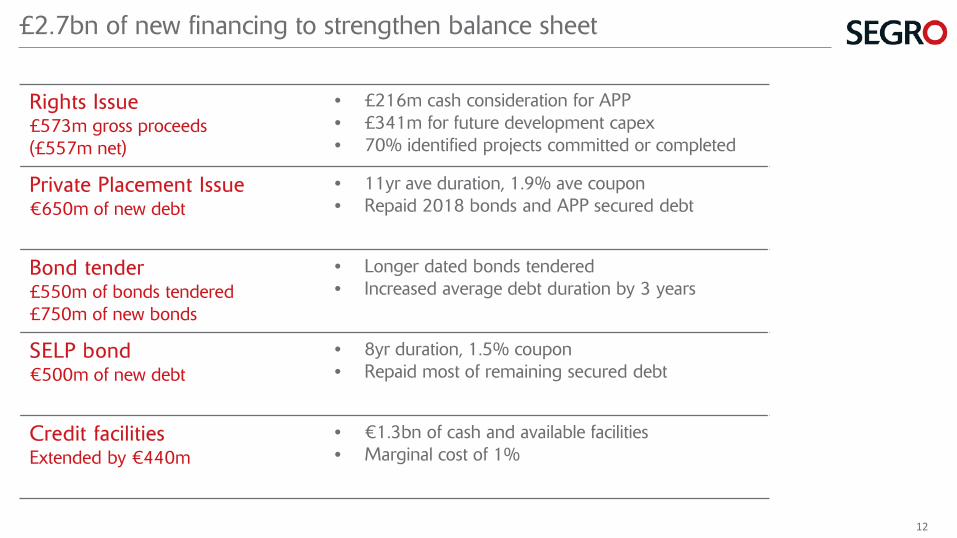
£2.7bn of new financing to strengthen balance sheet
Rights Issue£573m gross proceeds(£557m net)
• £216m cash consideration for APP• £341m for future development capex• 70% identified projects committed or completed
Private Placement Issue€650m of new debt
• 11yr ave duration, 1.9% ave coupon• Repaid 2018 bonds and APP secured debt
Bond tender£550m of bonds tendered£750m of new bonds
• Longer dated bonds tendered• Increased average debt duration by 3 years
SELP bond€500m of new debt
• 8yr duration, 1.5% coupon• Repaid most of remaining secured debt
Credit facilitiesExtended by €440m
• €1.3bn of cash and available facilities• Marginal cost of 1%
12
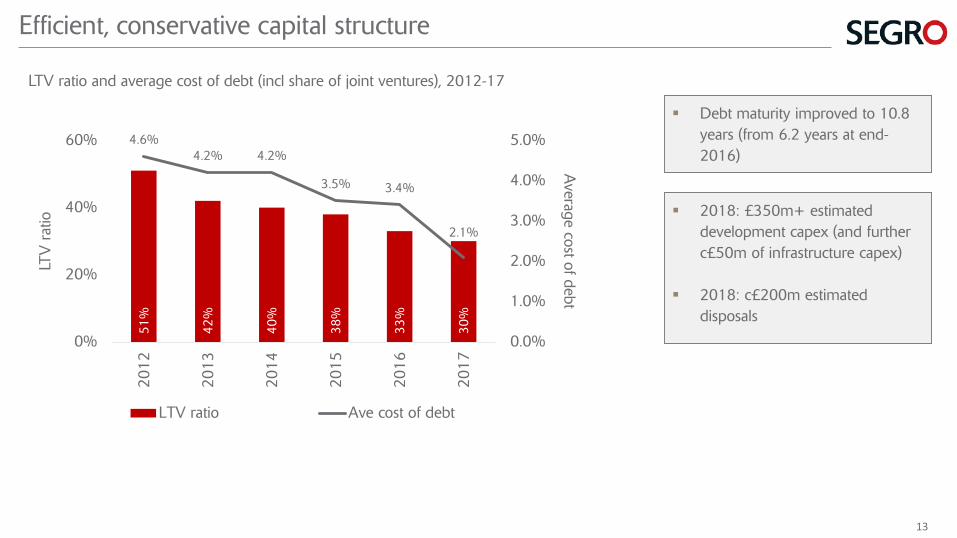
2018: £350m+ estimated development capex (and further c£50m of infrastructure capex)
2018: c£200m estimated disposals
Efficient, conservative capital structure
LTV ratio and average cost of debt (incl share of joint ventures), 2012-17
51%
42%
40%
38%
33%
30%
4.6%4.2% 4.2%
3.5% 3.4%
2.1%
0.0%
1.0%
2.0%
3.0%
4.0%
5.0%
0%
20%
40%
60%20
12
2013
2014
2015
2016
2017
Average cost of debt
LTV
rat
io
LTV ratio Ave cost of debt
Debt maturity improved to 10.8 years (from 6.2 years at end-2016)
13
Strong financial results and balance sheet
Growing earnings
Strong balance sheet
2017 final dividend increased by 6%
BidFood, Slough Trading Estate
14
2017: Another year of delivery
Strong financial results and significantly improved capital structure
Disciplined capital allocation improving portfolio scale and quality
Operational excellence delivers strong operating and development performance
Significant growth opportunities within our control
Camden Town Brewery, Navigation Park
15
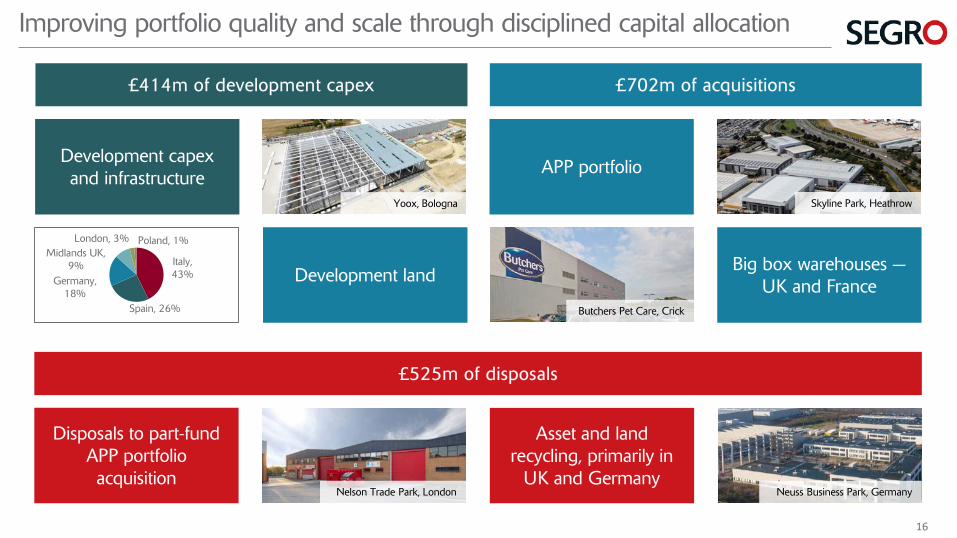
Improving portfolio quality and scale through disciplined capital allocation
£525m of disposals
£702m of acquisitions
Disposals to part-fund APP portfolio acquisition
Nelson Trade Park, London
Asset and land recycling, primarily in
UK and GermanyNeuss Business Park, Germany
APP portfolio
Skyline Park, Heathrow
Big box warehouses —UK and France
Butchers Pet Care, Crick
Development landItaly, 43%
Spain, 26%
Germany, 18%
Midlands UK, 9%
London, 3% Poland, 1%
£414m of development capex
Development capex and infrastructure
Yoox, Bologna
16
0.0
0.2
0.4
0.6
0.8
1.0
1.2
1.4
1.6
Germany France Poland/Czech Italy OtherEuropean
Ass
ets
unde
r m
anag
emen
t
SELP SEGRO wholly-owned
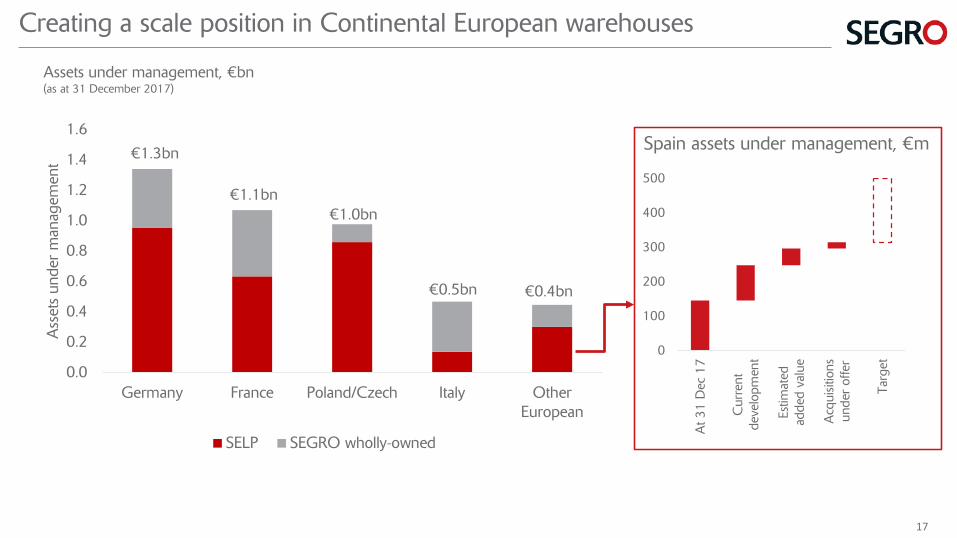
€1.3bn
€1.1bn€1.0bn
€0.4bn€0.5bn
Creating a scale position in Continental European warehouses
0
100
200
300
400
500
At 3
1 D
ec 1
7
Cur
rent
deve
lopm
ent
Estim
ated
adde
d va
lue
Acq
uisit
ions
unde
r of
fer
Targ
et
Spain assets under management, €m
Assets under management, €bn(as at 31 December 2017)
17
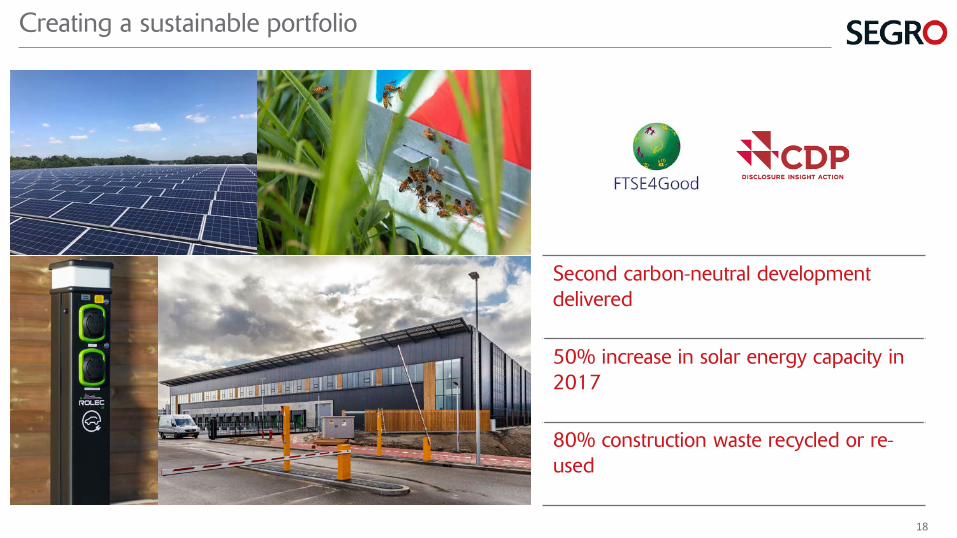
Creating a sustainable portfolio
Second carbon-neutral development delivered
50% increase in solar energy capacity in 2017
80% construction waste recycled or re-used
18
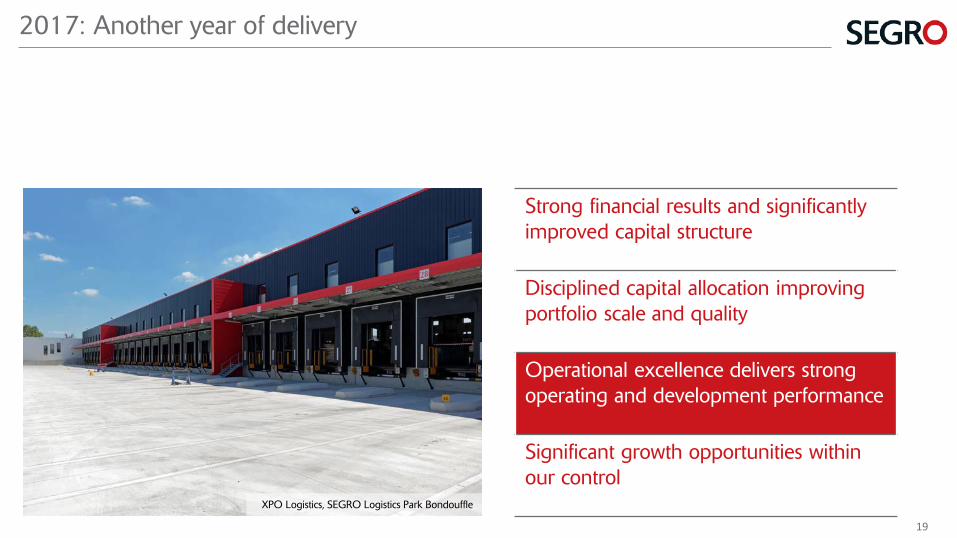
2017: Another year of delivery
Strong financial results and significantly improved capital structure
Disciplined capital allocation improving portfolio scale and quality
Operational excellence delivers strong operating and development performance
Significant growth opportunities within our control
XPO Logistics, SEGRO Logistics Park Bondouffle
19
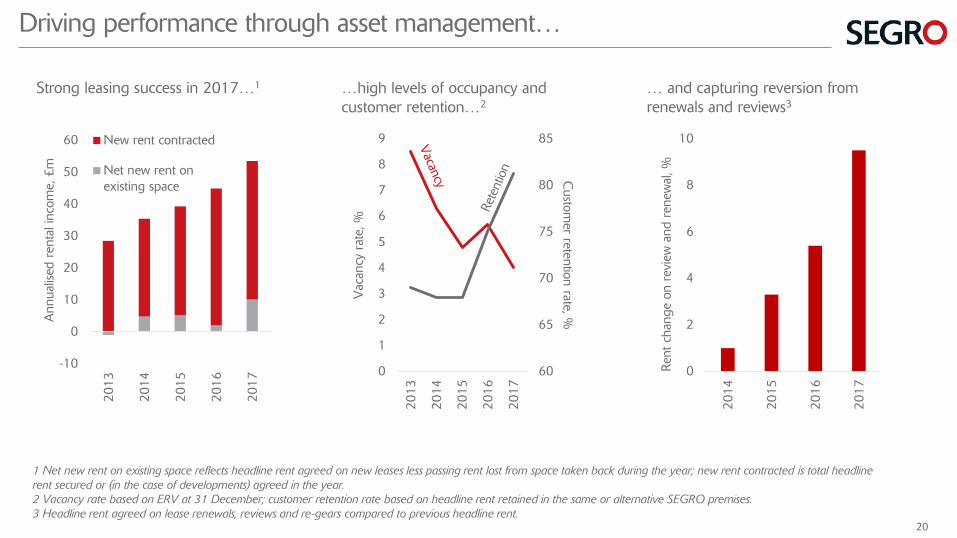
Driving performance through asset management…
-10
0
10
20
30
40
50
60
2013
2014
2015
2016
2017
Ann
ualis
ed r
enta
l inc
ome,
£m
New rent contracted
Net new rent onexisting space
60
65
70
75
80
85
0
1
2
3
4
5
6
7
8
9
2013
2014
2015
2016
2017
Custom
er retention rate, %
Vac
ancy
rat
e, %
0
2
4
6
8
10
2014
2015
2016
2017
Rent
cha
nge
on r
evie
w a
nd r
enew
al, %
Strong leasing success in 2017…1 …high levels of occupancy and customer retention…2
… and capturing reversion from renewals and reviews3
1 Net new rent on existing space reflects headline rent agreed on new leases less passing rent lost from space taken back during the year; new rent contracted is total headline rent secured or (in the case of developments) agreed in the year.2 Vacancy rate based on ERV at 31 December; customer retention rate based on headline rent retained in the same or alternative SEGRO premises.3 Headline rent agreed on lease renewals, reviews and re-gears compared to previous headline rent.
20
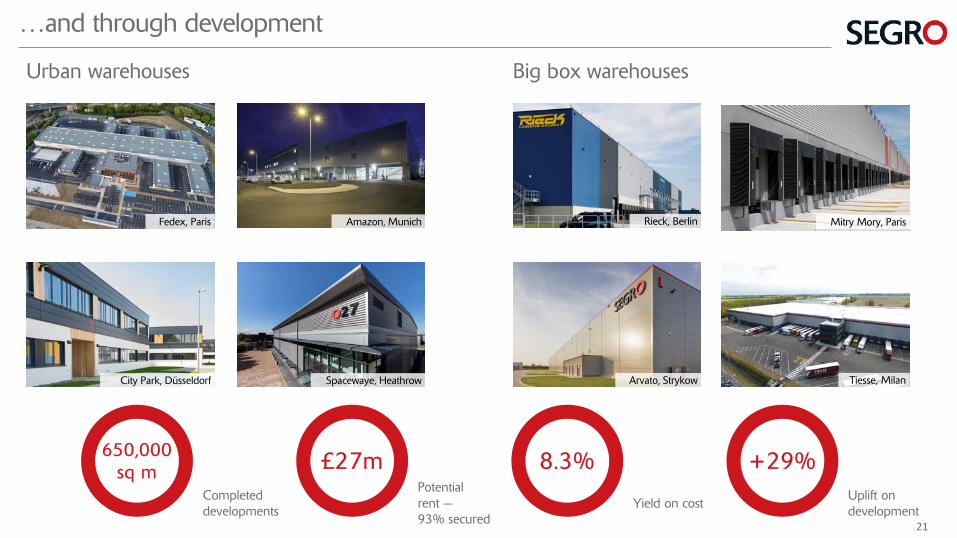
Big box warehousesUrban warehouses
…and through development
Mitry Mory, ParisFedex, Paris Amazon, Munich
City Park, Düsseldorf
Rieck, Berlin
Arvato, Strykow Tiesse, MilanSpacewaye, Heathrow
650,000sq m
Completed developments
£27mPotential rent —93% secured
8.3%
Yield on cost
+29%Uplift on development
21
0
50
100
150
200
250
300
350
400
2012
2013
2014
2015
2016
2017
Dev
elop
men
t cap
ex, £
m
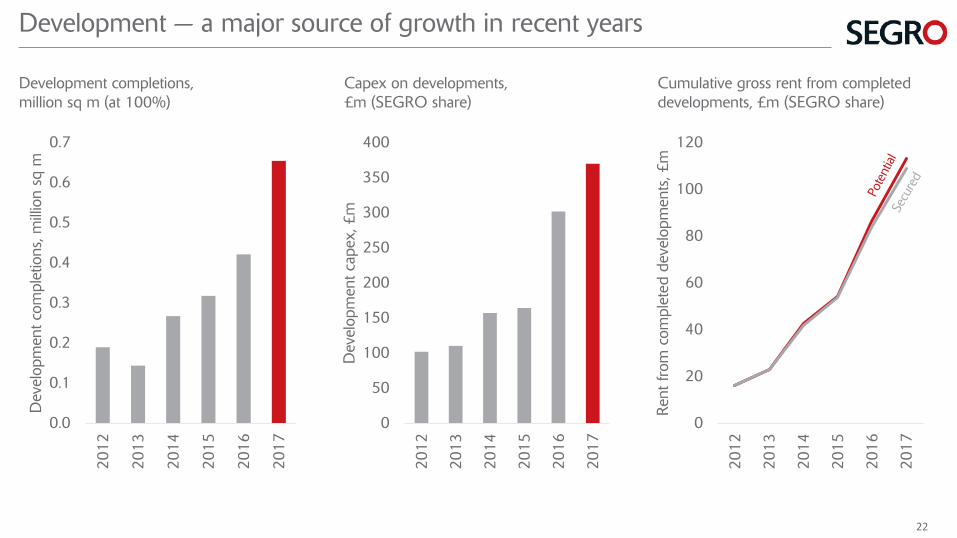
Development — a major source of growth in recent years
Development completions, million sq m (at 100%)
0.0
0.1
0.2
0.3
0.4
0.5
0.6
0.7
2012
2013
2014
2015
2016
2017
Dev
elop
men
t com
plet
ions
, mill
ion
sq m
0
20
40
60
80
100
120
2012
2013
2014
2015
2016
2017
Rent
from
com
plet
ed d
evel
opm
ents
, £m
Capex on developments, £m (SEGRO share)
Cumulative gross rent from completed developments, £m (SEGRO share)
22
2017: Another year of delivery
Strong financial results and significantly improved capital structure
Disciplined capital allocation improving portfolio scale and quality
Operational excellence delivers strong operating and development performance
Significant growth opportunities within our control
SEGRO Business Park Zeran, Warsaw
23
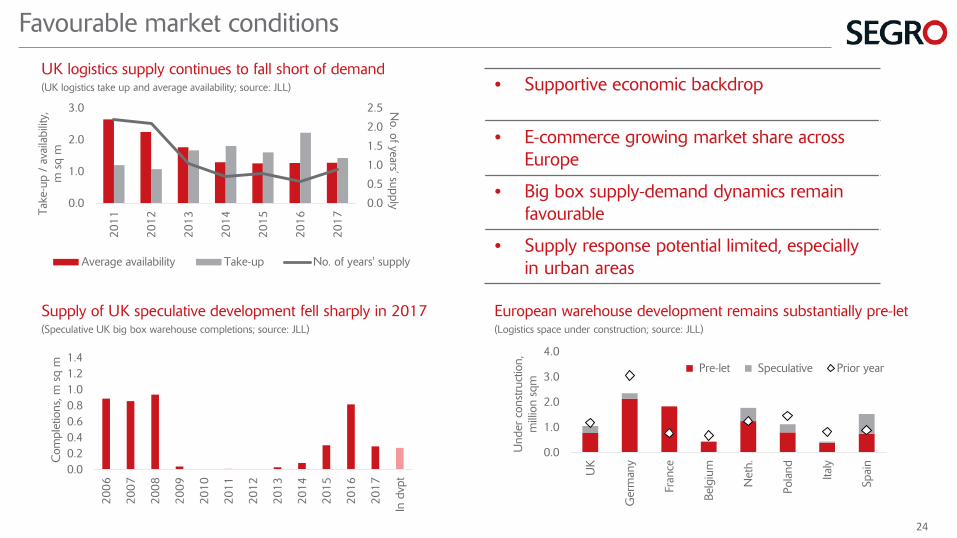
UK logistics supply continues to fall short of demand(UK logistics take up and average availability; source: JLL)
Favourable market conditions
Supply of UK speculative development fell sharply in 2017(Speculative UK big box warehouse completions; source: JLL)
0.00.20.40.60.81.01.21.4
2006
2007
2008
2009
2010
2011
2012
2013
2014
2015
2016
2017
In d
vpt
Com
plet
ions
, m s
q m
0.0
0.5
1.0
1.5
2.0
2.5
0.0
1.0
2.0
3.020
11
2012
2013
2014
2015
2016
2017
No. of years’ supply
Take
-up
/ av
aila
bilit
y,m
sq
m
Average availability Take-up No. of years' supply
European warehouse development remains substantially pre-let(Logistics space under construction; source: JLL)
• Supportive economic backdrop
• E-commerce growing market share across Europe
• Big box supply-demand dynamics remain favourable
• Supply response potential limited, especially in urban areas
0.0
1.0
2.0
3.0
4.0
UK
Ger
man
y
Fran
ce
Belg
ium
Net
h.
Pola
nd Italy
Spai
n
Und
er c
onst
ruct
ion,
m
illio
n sq
m
Pre-let Speculative Prior year
24
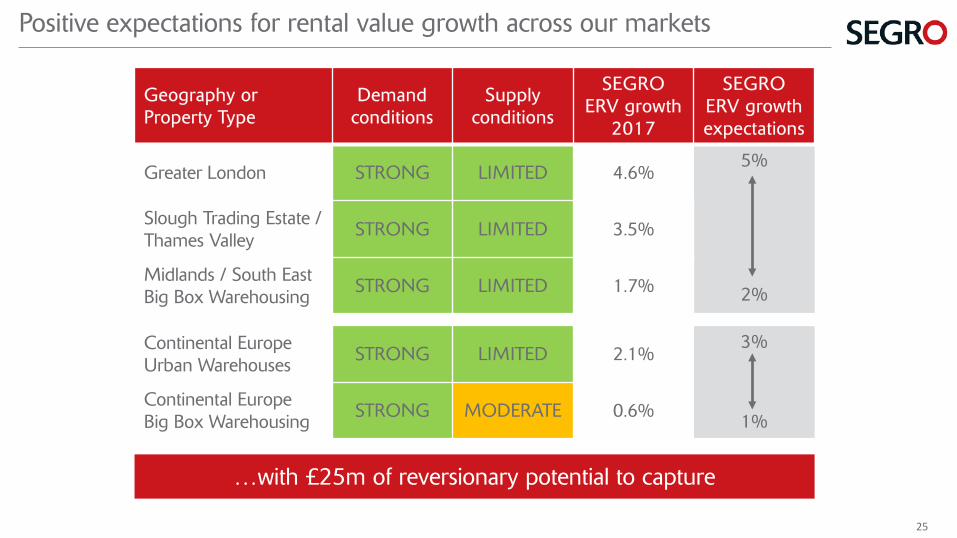
Geography or Property Type
Demand conditions
Supply conditions
SEGROERV growth
2017
SEGROERV growth expectations
Greater London STRONG LIMITED 4.6%5%
2%
Slough Trading Estate / Thames Valley STRONG LIMITED 3.5%
Midlands / South East Big Box Warehousing STRONG LIMITED 1.7%
Continental Europe Urban Warehouses STRONG LIMITED 2.1%
3%
1%Continental Europe Big Box Warehousing STRONG MODERATE 0.6%
Positive expectations for rental value growth across our markets
…with £25m of reversionary potential to capture
25
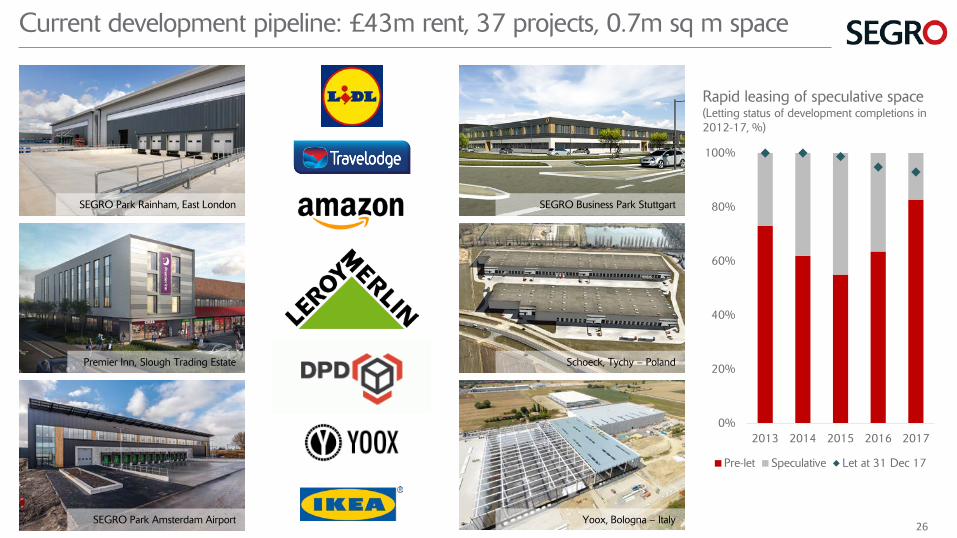
Current development pipeline: £43m rent, 37 projects, 0.7m sq m space
Premier Inn, Slough Trading Estate
SEGRO Park Rainham, East London
SEGRO Park Amsterdam Airport
SEGRO Business Park Stuttgart
Schoeck, Tychy – Poland
Yoox, Bologna – Italy
0%
20%
40%
60%
80%
100%
2013 2014 2015 2016 2017
Pre-let Speculative Let at 31 Dec 17
Rapid leasing of speculative space(Letting status of development completions in 2012-17, %)
26
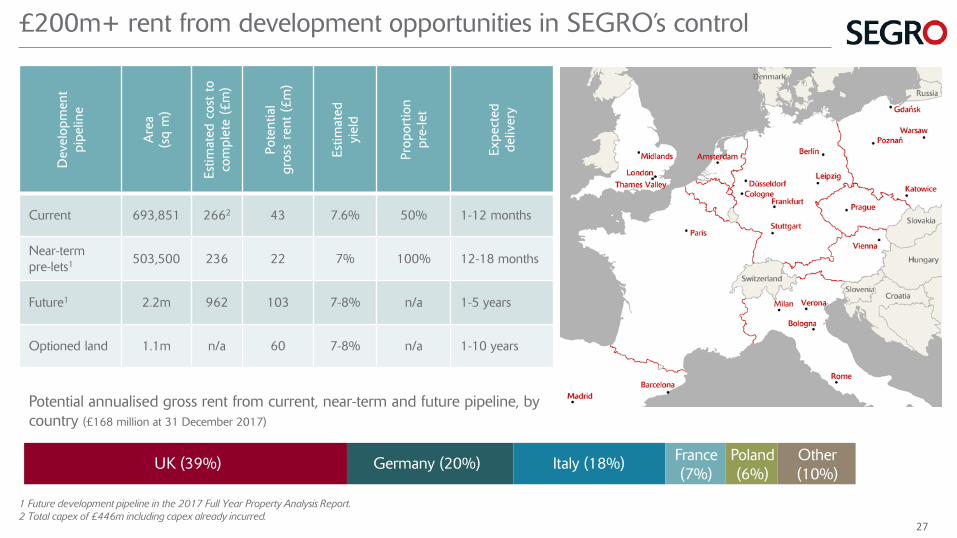
£200m+ rent from development opportunities in SEGRO’s control
1 Future development pipeline in the 2017 Full Year Property Analysis Report.2 Total capex of £446m including capex already incurred.
Dev
elop
men
t pi
pelin
e
Are
a (s
q m
)
Estim
ated
cos
t to
co
mpl
ete
(£m
)
Pote
ntia
l gr
oss
rent
(£m
)
Estim
ated
yi
eld
Prop
ortio
n
pre-
let
Expe
cted
de
liver
y
Current 693,851 2662 43 7.6% 50% 1-12 months
Near-termpre-lets1 503,500 236 22 7% 100% 12-18 months
Future1 2.2m 962 103 7-8% n/a 1-5 years
Optioned land 1.1m n/a 60 7-8% n/a 1-10 years
UK (39%) Germany (20%) Italy (18%) France(7%)
Poland(6%)
Potential annualised gross rent from current, near-term and future pipeline, by country (£168 million at 31 December 2017)
Other(10%)
27
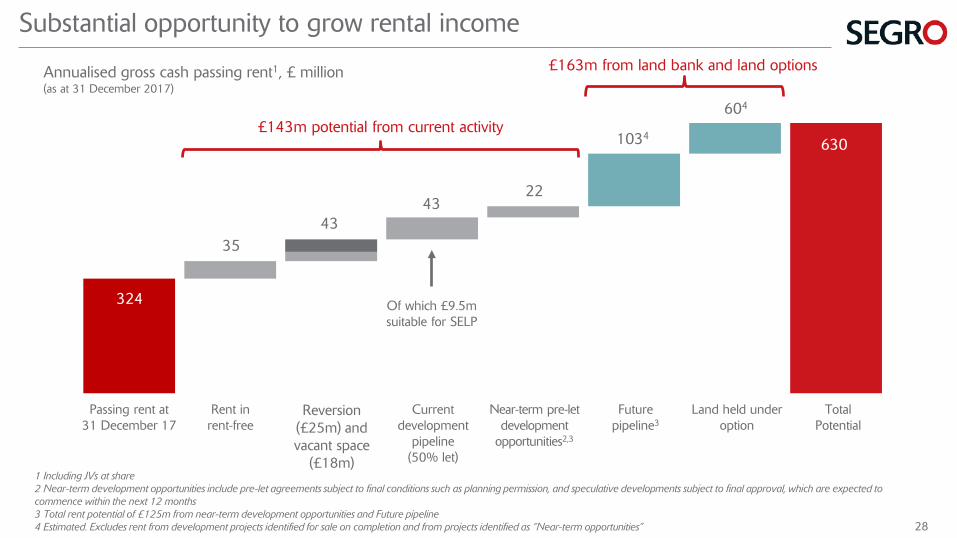
324
35
4322
384
388.8
Annualised gross cash passing rent1, £ million(as at 31 December 2017)
1 Including JVs at share2 Near-term development opportunities include pre-let agreements subject to final conditions such as planning permission, and speculative developments subject to final approval, which are expected to commence within the next 12 months3 Total rent potential of £125m from near-term development opportunities and Future pipeline 4 Estimated. Excludes rent from development projects identified for sale on completion and from projects identified as “Near-term opportunities”
43
Passing rent at31 December 17
Rent in rent-free
Reversion (£25m) and vacant space
(£18m)
Current development
pipeline(50% let)
Near-term pre-letdevelopment
opportunities2,3
Futurepipeline3
Land held under option
TotalPotential
Substantial opportunity to grow rental income
1034
604
£143m potential from current activity
£163m from land bank and land options
630
Of which £9.5m suitable for SELP
28
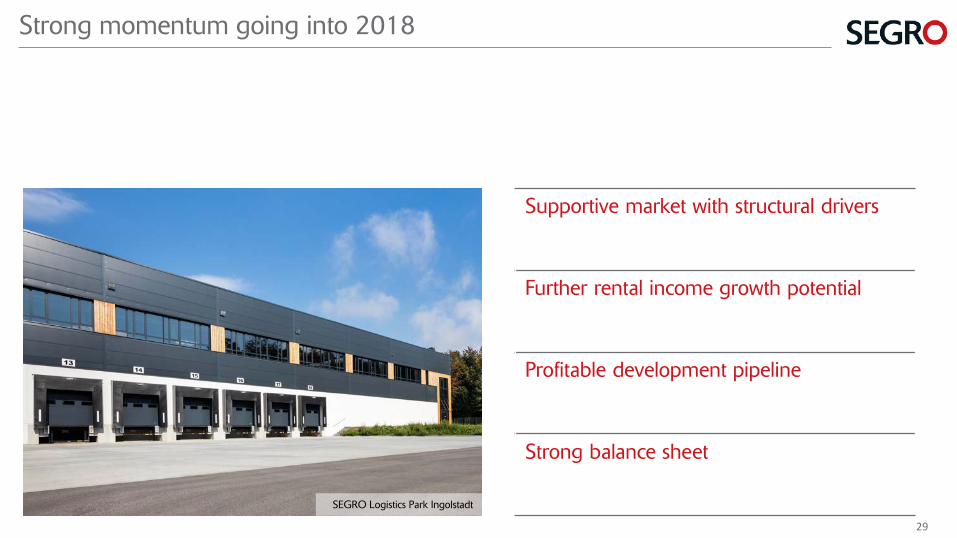
Strong momentum going into 2018
Supportive market with structural drivers
Further rental income growth potential
Profitable development pipeline
Strong balance sheet
SEGRO Logistics Park Ingolstadt
29
2017 FULL YEAR RESULTS
Q&A
APPENDIX IPORTFOLIO AND FINANCIAL DATA
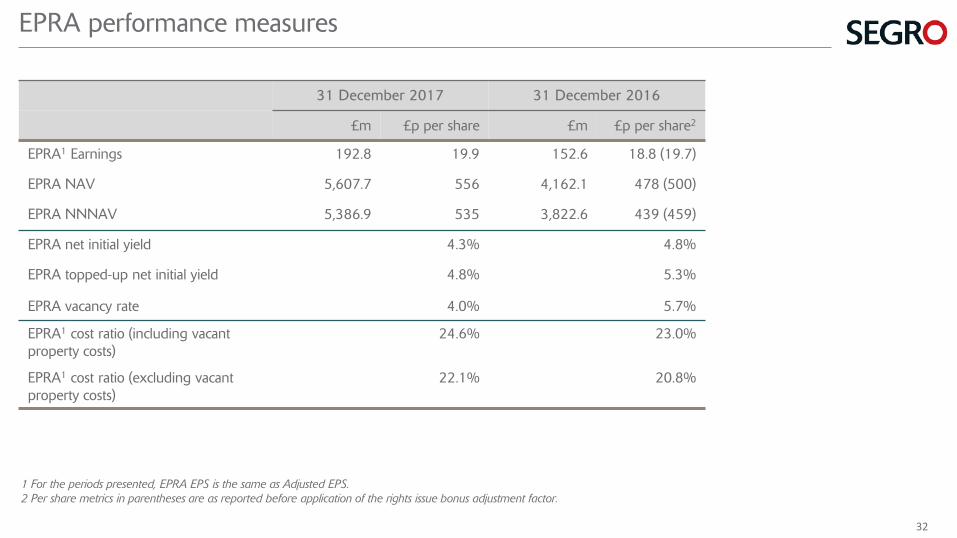
31 December 2017 31 December 2016
£m £p per share £m £p per share2
EPRA1 Earnings 192.8 19.9 152.6 18.8 (19.7)
EPRA NAV 5,607.7 556 4,162.1 478 (500)
EPRA NNNAV 5,386.9 535 3,822.6 439 (459)
EPRA net initial yield 4.3% 4.8%
EPRA topped-up net initial yield 4.8% 5.3%
EPRA vacancy rate 4.0% 5.7%
EPRA1 cost ratio (including vacant property costs)
24.6% 23.0%
EPRA1 cost ratio (excluding vacant property costs)
22.1% 20.8%
1 For the periods presented, EPRA EPS is the same as Adjusted EPS.2 Per share metrics in parentheses are as reported before application of the rights issue bonus adjustment factor.
EPRA performance measures
32
2017 2016
Group£m
JVs£m
Total£m
Group£m
JVs£m
Total£m
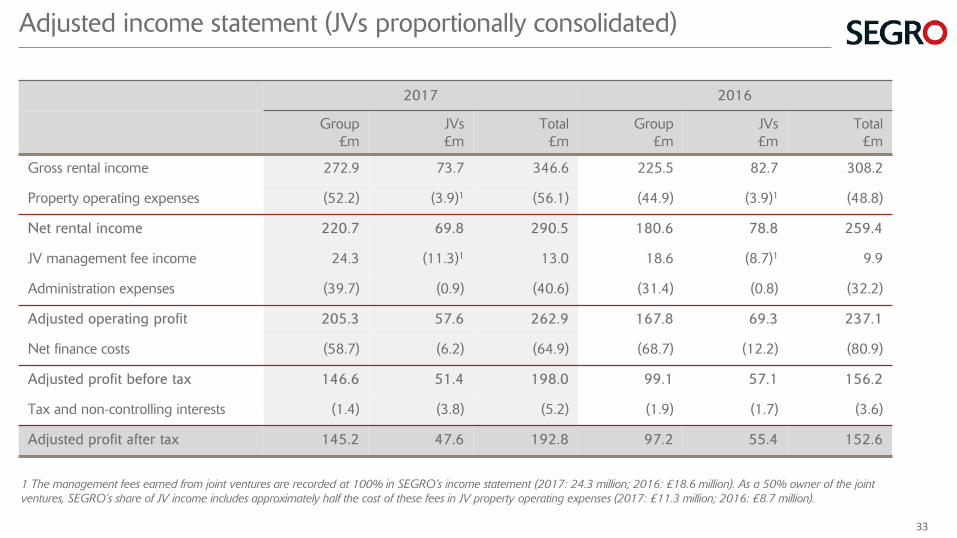
Gross rental income 272.9 73.7 346.6 225.5 82.7 308.2
Property operating expenses (52.2) (3.9)1 (56.1) (44.9) (3.9)1 (48.8)
Net rental income 220.7 69.8 290.5 180.6 78.8 259.4
JV management fee income 24.3 (11.3)1 13.0 18.6 (8.7)1 9.9
Administration expenses (39.7) (0.9) (40.6) (31.4) (0.8) (32.2)
Adjusted operating profit 205.3 57.6 262.9 167.8 69.3 237.1
Net finance costs (58.7) (6.2) (64.9) (68.7) (12.2) (80.9)
Adjusted profit before tax 146.6 51.4 198.0 99.1 57.1 156.2
Tax and non-controlling interests (1.4) (3.8) (5.2) (1.9) (1.7) (3.6)
Adjusted profit after tax 145.2 47.6 192.8 97.2 55.4 152.6
Adjusted income statement (JVs proportionally consolidated)
1 The management fees earned from joint ventures are recorded at 100% in SEGRO’s income statement (2017: 24.3 million; 2016: £18.6 million). As a 50% owner of the joint ventures, SEGRO’s share of JV income includes approximately half the cost of these fees in JV property operating expenses (2017: £11.3 million; 2016: £8.7 million).
33
31 December 2017 31 December 2016
Group£m
JVs£m
Total£m
Group£m
JVs£m
Total£m
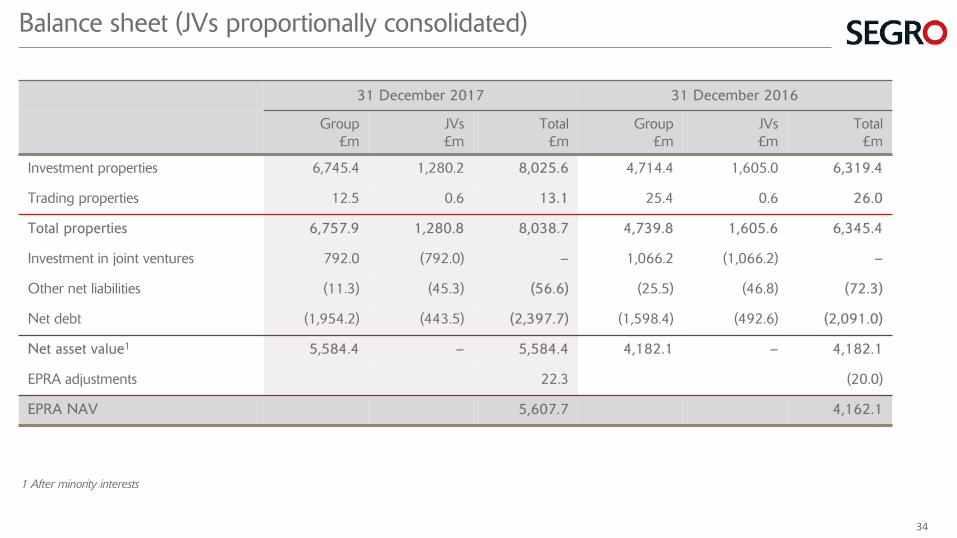
Investment properties 6,745.4 1,280.2 8,025.6 4,714.4 1,605.0 6,319.4
Trading properties 12.5 0.6 13.1 25.4 0.6 26.0
Total properties 6,757.9 1,280.8 8,038.7 4,739.8 1,605.6 6,345.4
Investment in joint ventures 792.0 (792.0) – 1,066.2 (1,066.2) –
Other net liabilities (11.3) (45.3) (56.6) (25.5) (46.8) (72.3)
Net debt (1,954.2) (443.5) (2,397.7) (1,598.4) (492.6) (2,091.0)
Net asset value1 5,584.4 – 5,584.4 4,182.1 – 4,182.1
EPRA adjustments 22.3 (20.0)
EPRA NAV 5,607.7 4,162.1
1 After minority interests
Balance sheet (JVs proportionally consolidated)
34
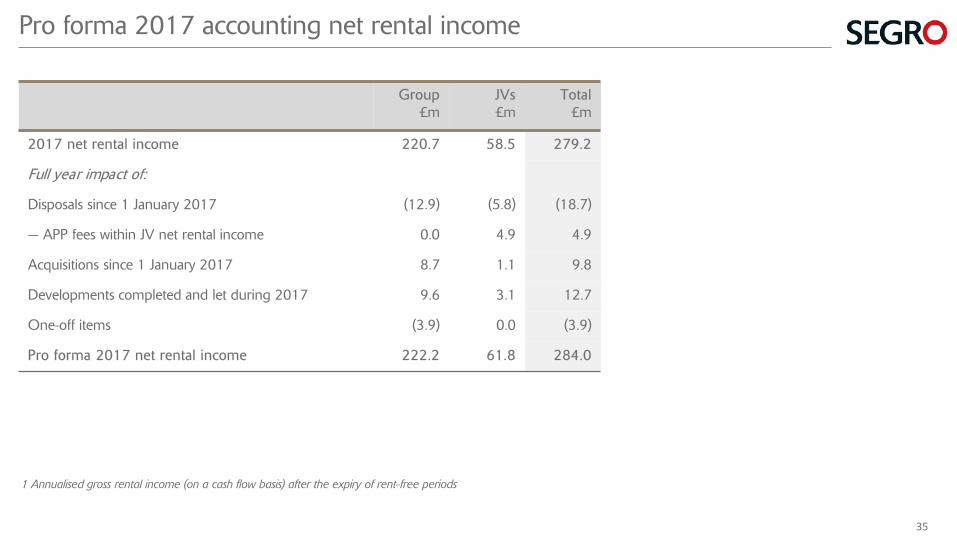
1 Annualised gross rental income (on a cash flow basis) after the expiry of rent-free periods
Group£m
JVs£m
Total£m
2017 net rental income 220.7 58.5 279.2
Full year impact of:
Disposals since 1 January 2017 (12.9) (5.8) (18.7)
— APP fees within JV net rental income 0.0 4.9 4.9
Acquisitions since 1 January 2017 8.7 1.1 9.8
Developments completed and let during 2017 9.6 3.1 12.7
One-off items (3.9) 0.0 (3.9)
Pro forma 2017 net rental income 222.2 61.8 284.0
Pro forma 2017 accounting net rental income
35
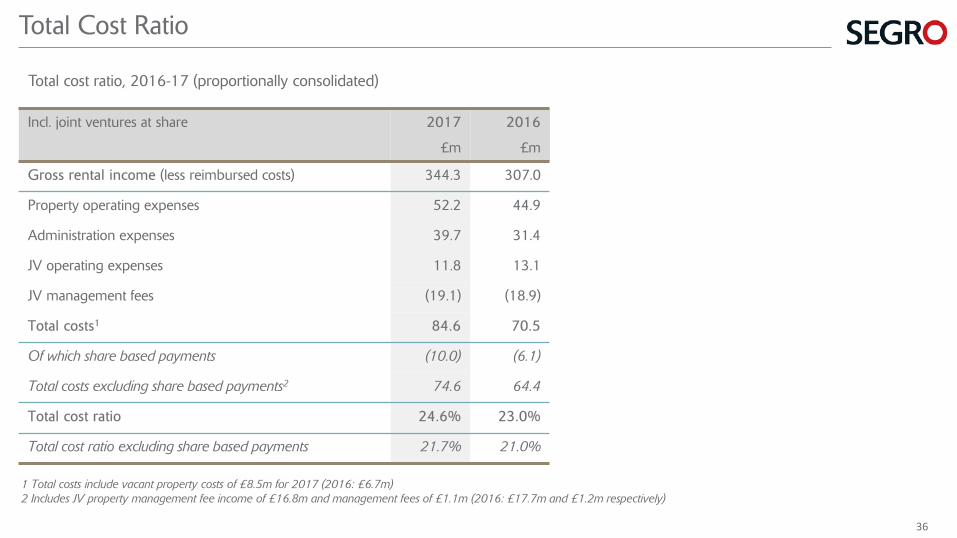
1 Total costs include vacant property costs of £8.5m for 2017 (2016: £6.7m)2 Includes JV property management fee income of £16.8m and management fees of £1.1m (2016: £17.7m and £1.2m respectively)
Incl. joint ventures at share 2017
£m
2016
£m
Gross rental income (less reimbursed costs) 344.3 307.0
Property operating expenses 52.2 44.9
Administration expenses 39.7 31.4
JV operating expenses 11.8 13.1
JV management fees (19.1) (18.9)
Total costs1 84.6 70.5
Of which share based payments (10.0) (6.1)
Total costs excluding share based payments2 74.6 64.4
Total cost ratio 24.6% 23.0%
Total cost ratio excluding share based payments 21.7% 21.0%
Total Cost Ratio
Total cost ratio, 2016-17 (proportionally consolidated)
36
2017 2016
Group£m
JVs£m
Total£m
Group£m
JVs£m
Total£m
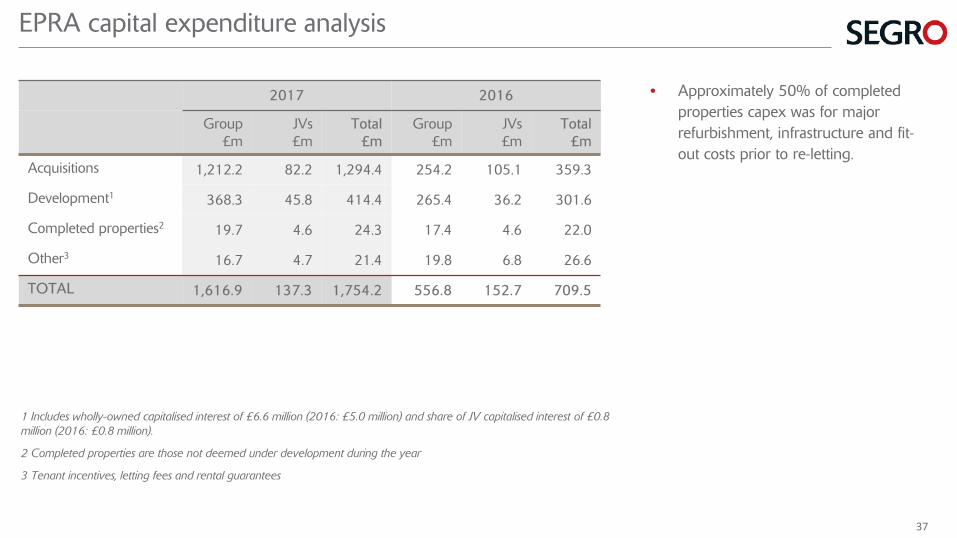
Acquisitions 1,212.2 82.2 1,294.4 254.2 105.1 359.3
Development1 368.3 45.8 414.4 265.4 36.2 301.6
Completed properties2 19.7 4.6 24.3 17.4 4.6 22.0
Other3 16.7 4.7 21.4 19.8 6.8 26.6
TOTAL 1,616.9 137.3 1,754.2 556.8 152.7 709.5
1 Includes wholly-owned capitalised interest of £6.6 million (2016: £5.0 million) and share of JV capitalised interest of £0.8 million (2016: £0.8 million).
2 Completed properties are those not deemed under development during the year
3 Tenant incentives, letting fees and rental guarantees
• Approximately 50% of completed properties capex was for major refurbishment, infrastructure and fit-out costs prior to re-letting.
EPRA capital expenditure analysis
37
31 December 2017
£m
Weighted average cost of gross debt,
%1
31 December 2016
£m
Weighted average cost of gross debt,
%1
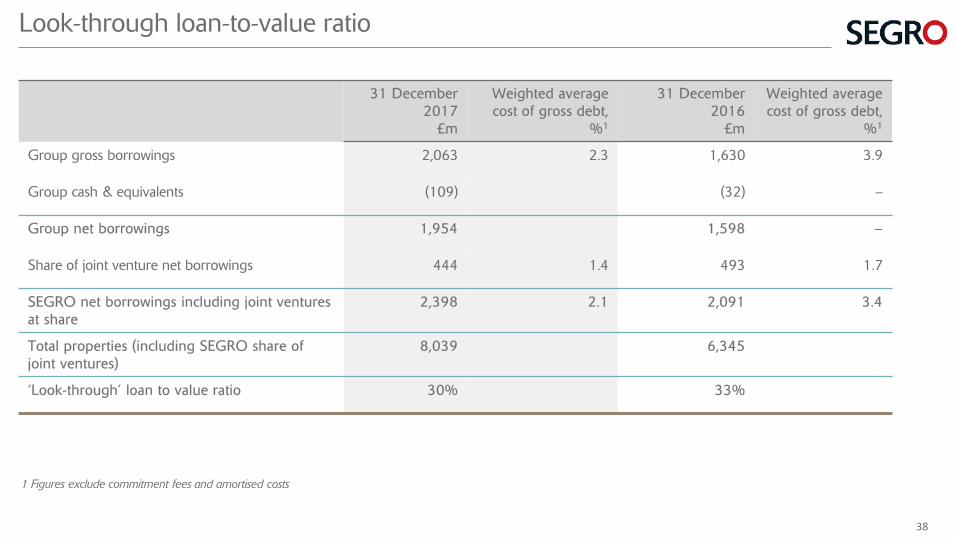
Group gross borrowings 2,063 2.3 1,630 3.9
Group cash & equivalents (109) (32) –
Group net borrowings 1,954 1,598 –
Share of joint venture net borrowings 444 1.4 493 1.7
SEGRO net borrowings including joint ventures at share
2,398 2.1 2,091 3.4
Total properties (including SEGRO share of joint ventures)
8,039 6,345
‘Look-through’ loan to value ratio 30% 33%
1 Figures exclude commitment fees and amortised costs
Look-through loan-to-value ratio
38
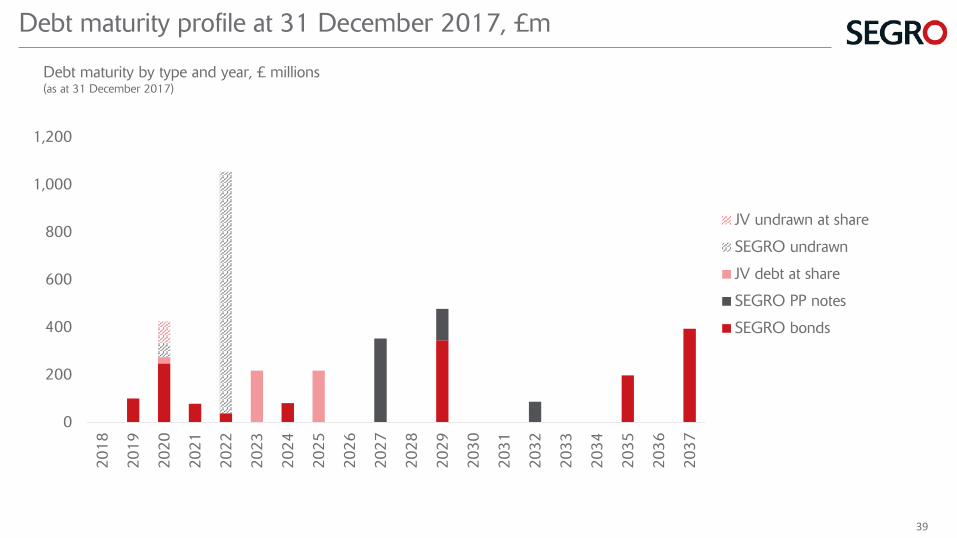
Debt maturity profile at 31 December 2017, £m
0
200
400
600
800
1,000
1,200
2018
2019
2020
2021
2022
2023
2024
2025
2026
2027
2028
2029
2030
2031
2032
2033
2034
2035
2036
2037
JV undrawn at share
SEGRO undrawn
JV debt at share
SEGRO PP notes
SEGRO bonds
Debt maturity by type and year, £ millions(as at 31 December 2017)
39
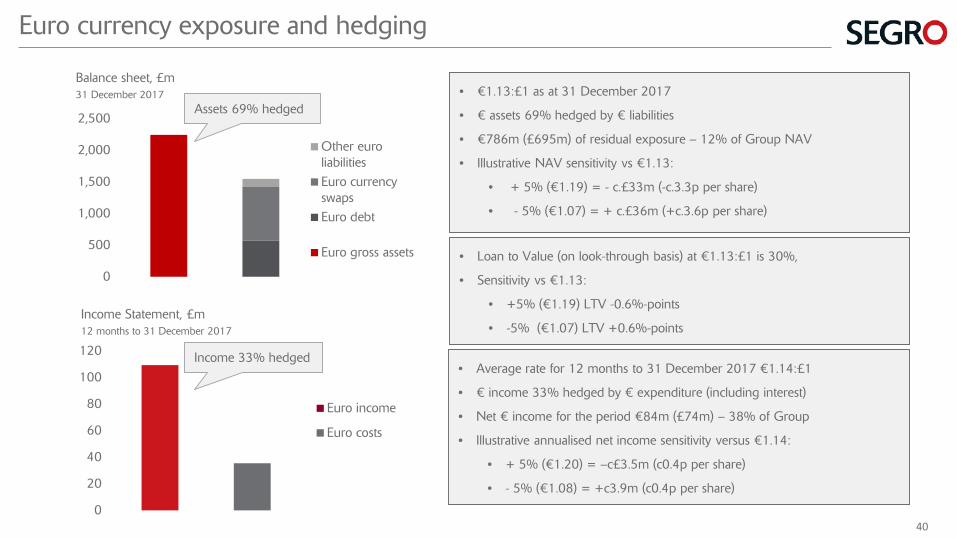
• €1.13:£1 as at 31 December 2017
• € assets 69% hedged by € liabilities
• €786m (£695m) of residual exposure – 12% of Group NAV
• Illustrative NAV sensitivity vs €1.13:
• + 5% (€1.19) = - c.£33m (-c.3.3p per share)
• - 5% (€1.07) = + c.£36m (+c.3.6p per share)
• Loan to Value (on look-through basis) at €1.13:£1 is 30%,
• Sensitivity vs €1.13:
• +5% (€1.19) LTV -0.6%-points
• -5% (€1.07) LTV +0.6%-points
• Average rate for 12 months to 31 December 2017 €1.14:£1
• € income 33% hedged by € expenditure (including interest)
• Net € income for the period €84m (£74m) – 38% of Group
• Illustrative annualised net income sensitivity versus €1.14:
• + 5% (€1.20) = –c£3.5m (c0.4p per share)
• - 5% (€1.08) = +c3.9m (c0.4p per share)
0
500
1,000
1,500
2,000
2,500
Other euroliabilitiesEuro currencyswapsEuro debt
Euro gross assets
0
20
40
60
80
100
120
Euro income
Euro costs
Balance sheet, £m31 December 2017
Income Statement, £m12 months to 31 December 2017
Assets 69% hedged
Income 33% hedged
Euro currency exposure and hedging
40
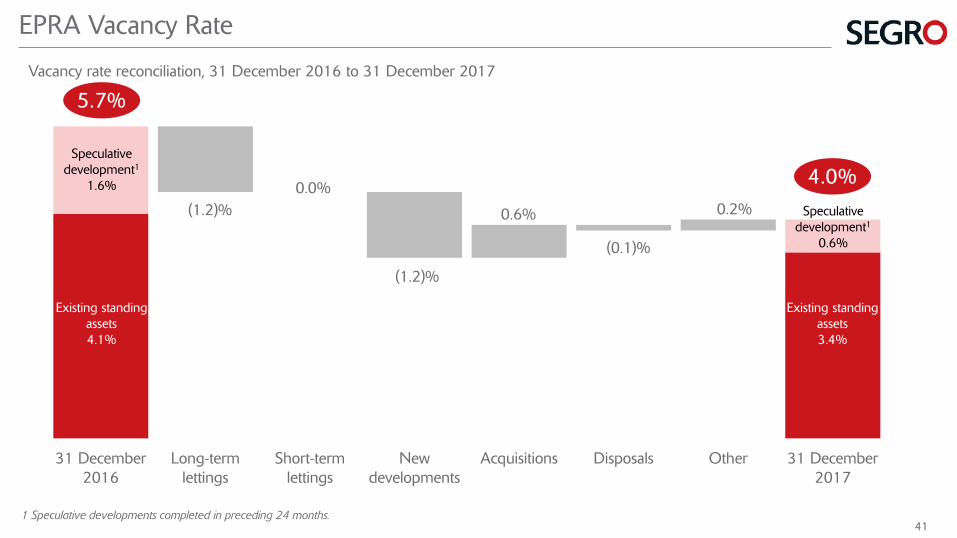
31 December2016
Long-termlettings
Short-termlettings
Newdevelopments
Acquisitions Disposals Other 31 December2017
Speculative development1
0.6%
Speculative development1
1.6%
0.6%
(1.2)%
5.7%
0.2%0.0%
1 Speculative developments completed in preceding 24 months.
Existing standing assets4.1%
Existing standing assets3.4%
(1.2)%
4.0%
EPRA Vacancy Rate
(0.1)%
Vacancy rate reconciliation, 31 December 2016 to 31 December 2017
41
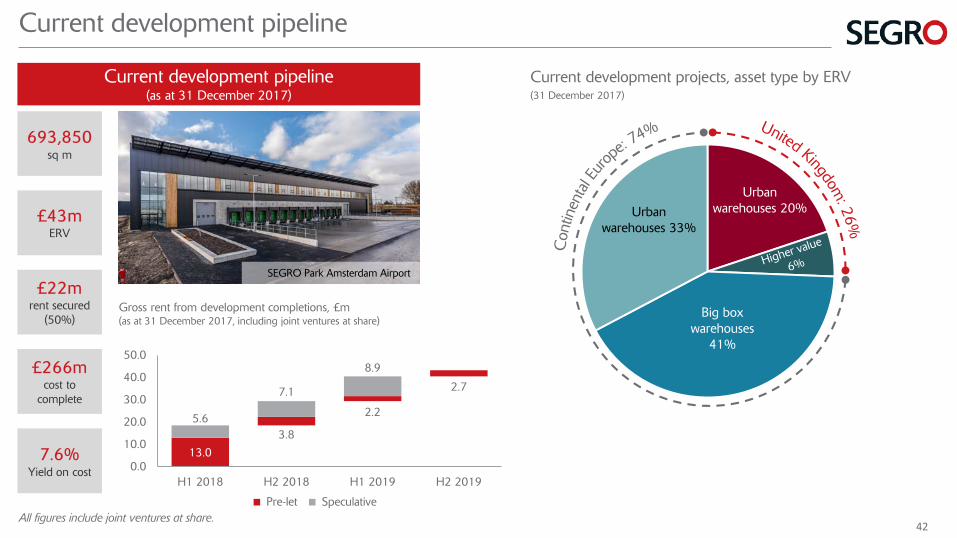
Current development pipeline
Current development pipeline(as at 31 December 2017)
693,850sq m
£43m ERV
£22mrent secured
(50%)
£266m cost to
complete
7.6%Yield on cost
Current development projects, asset type by ERV(31 December 2017)
Urbanwarehouses 20%
Big box warehouses
41%
Urbanwarehouses 33%
Gross rent from development completions, £m(as at 31 December 2017, including joint ventures at share)
13.03.8
2.2
2.7
5.6
7.1
8.9
0.0
10.0
20.0
30.0
40.0
50.0
H1 2018 H2 2018 H1 2019 H2 2019
Pre-let SpeculativeAll figures include joint ventures at share.
SEGRO Park Amsterdam Airport
42
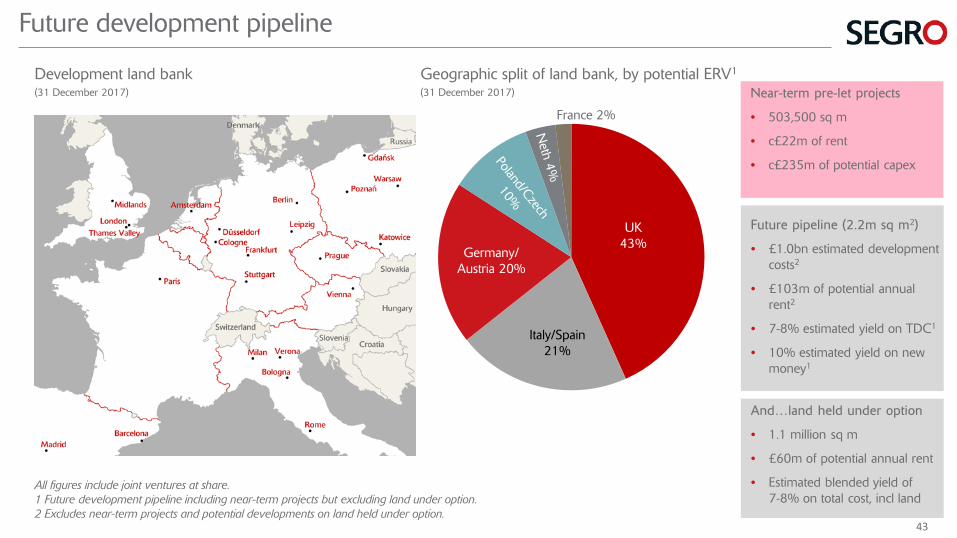
All figures include joint ventures at share.1 Future development pipeline including near-term projects but excluding land under option.2 Excludes near-term projects and potential developments on land held under option.
Germany/Austria 20%
UK43%
Italy/Spain21%
France 2%
Geographic split of land bank, by potential ERV1
(31 December 2017)
Development land bank(31 December 2017)
Future pipeline (2.2m sq m2)
• £1.0bn estimated development costs2
• £103m of potential annual rent2
• 7-8% estimated yield on TDC1
• 10% estimated yield on new money1
Future development pipeline
And…land held under option
• 1.1 million sq m
• £60m of potential annual rent
• Estimated blended yield of 7-8% on total cost, incl land
Near-term pre-let projects
• 503,500 sq m
• c£22m of rent
• c£235m of potential capex
43
0.0%
1.0%
2.0%
3.0%
4.0%
5.0%
6.0%
7.0%
0
100
200
300
400
500
600
2011
2012
2013
2014
2015
2016
2017
Land
ban
k va
lue,
£m
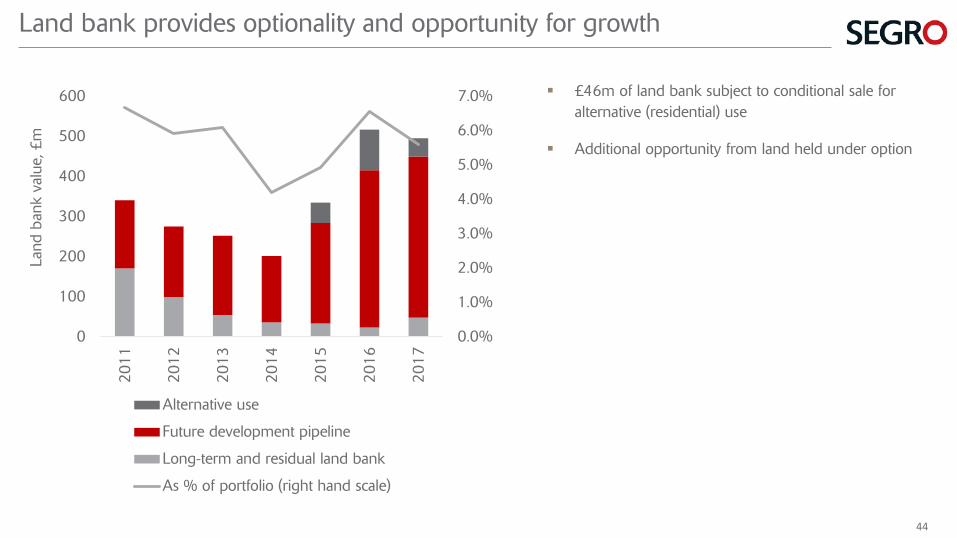
Alternative use
Future development pipeline
Long-term and residual land bank
As % of portfolio (right hand scale)
£46m of land bank subject to conditional sale for alternative (residential) use
Additional opportunity from land held under option
Land bank provides optionality and opportunity for growth
44
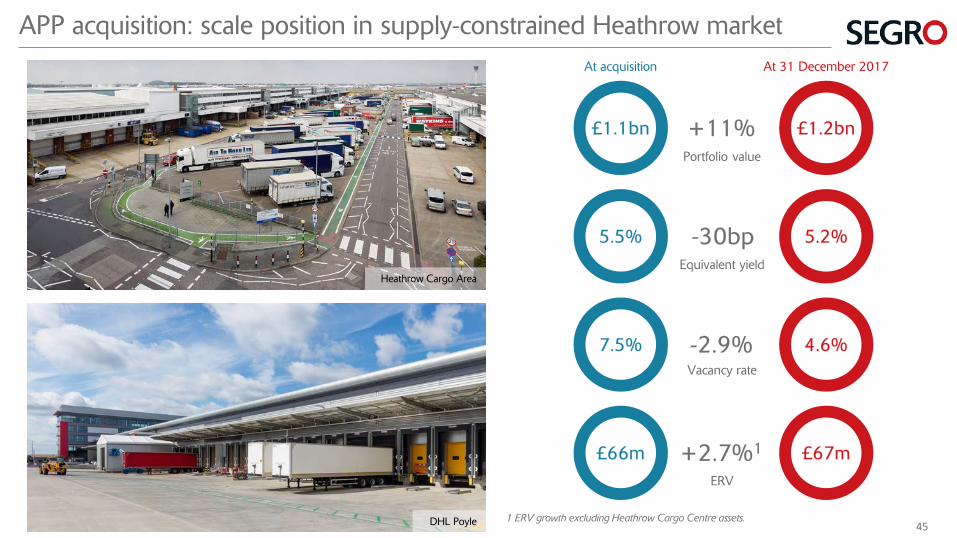
Heathrow Cargo Area
APP acquisition: scale position in supply-constrained Heathrow market
1 ERV growth excluding Heathrow Cargo Centre assets.
£1.1bnPortfolio value
£1.2bn+11%
5.5%Equivalent yield
5.2%-30bp
7.5%Vacancy rate
4.6%-2.9%
£66mERV
£67m+2.7%1
At acquisition At 31 December 2017
DHL Poyle 45
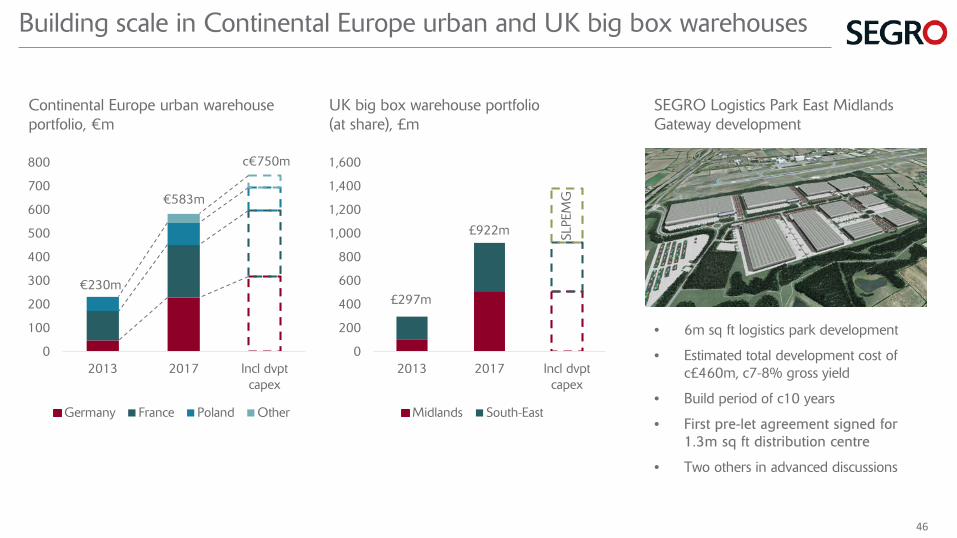
Building scale in Continental Europe urban and UK big box warehouses
• 6m sq ft logistics park development
• Estimated total development cost of c£460m, c7-8% gross yield
• Build period of c10 years
• First pre-let agreement signed for 1.3m sq ft distribution centre
• Two others in advanced discussions
0
100
200
300
400
500
600
700
800
2013 2017 Incl dvptcapex
Germany France Poland Other
€230m
€583m
c€750m
Continental Europe urban warehouse portfolio, €m
0
200
400
600
800
1,000
1,200
1,400
1,600
2013 2017 Incl dvptcapex
Midlands South-East
£297m
£922m SLPE
MG
UK big box warehouse portfolio(at share), £m
SEGRO Logistics Park East Midlands Gateway development
46
APPENDIX IIMARKET DATA
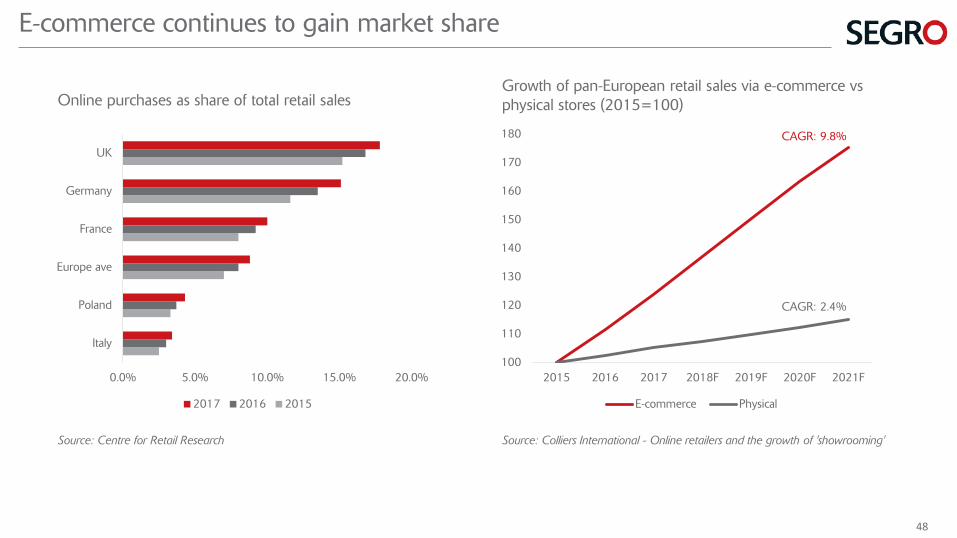
E-commerce continues to gain market share
0.0% 5.0% 10.0% 15.0% 20.0%
Italy
Poland
Europe ave
France
Germany
UK
2017 2016 2015
Online purchases as share of total retail sales
Source: Centre for Retail Research
100
110
120
130
140
150
160
170
180
2015 2016 2017 2018F 2019F 2020F 2021F
E-commerce Physical
CAGR: 2.4%
CAGR: 9.8%
Growth of pan-European retail sales via e-commerce vs physical stores (2015=100)
Source: Colliers International - Online retailers and the growth of 'showrooming'
48
05
1015202530354045
2006
2007
2008
2009
2010
2011
2012
2013
2014
2015
2016
2017
UK Germany France CEE Rest of Europe
05
1015202530354045
2006
2007
2008
2009
2010
2011
2012
2013
2014
2015
2016
2017
Q1 Q2 Q3 Q4
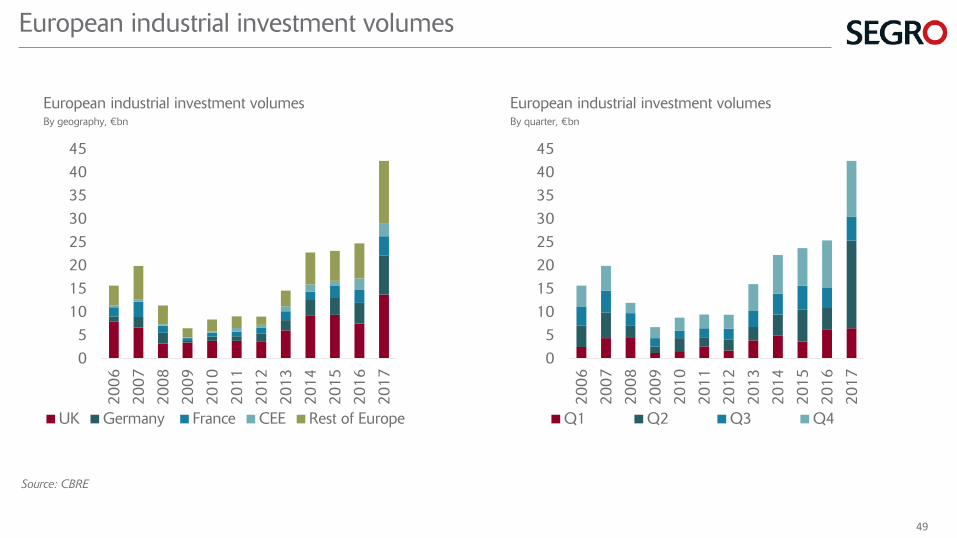
European industrial investment volumesBy geography, €bn
European industrial investment volumesBy quarter, €bn
Source: CBRE
European industrial investment volumes
49
0.0
2.0
4.0
6.0
8.0
10.0
12.0
2004 2005 2006 2007 2008 2009 2010 2011 2012 2013 2014 2015 2016 2017
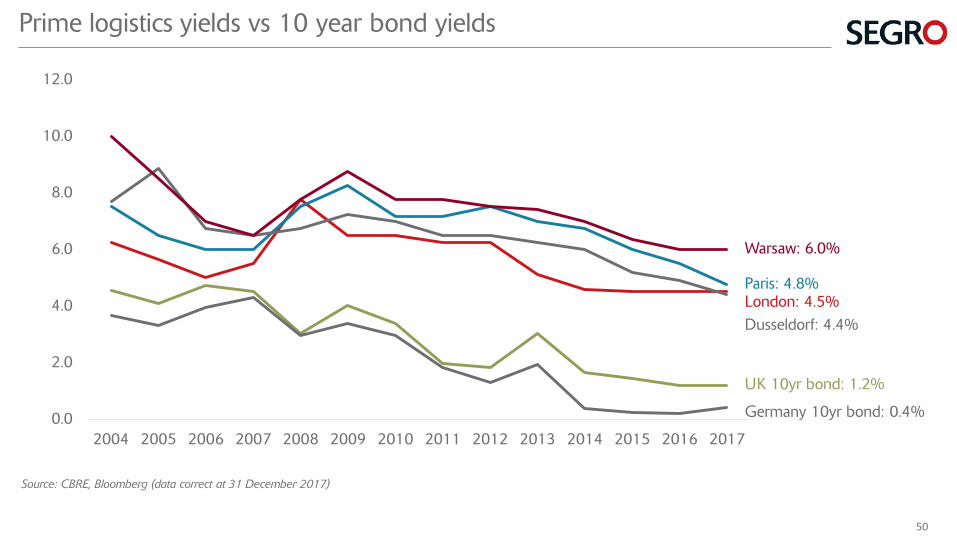
Warsaw: 6.0%
Paris: 4.8%
Dusseldorf: 4.4%London: 4.5%
UK 10yr bond: 1.2%
Germany 10yr bond: 0.4%
Source: CBRE, Bloomberg (data correct at 31 December 2017)
Prime logistics yields vs 10 year bond yields
50
0.0
0.5
1.0
1.5
2.0
2.5
0.0
1.0
2.0
3.0
2011
2012
2013
2014
2015
2016
2017
No. of years’ supply
Take
-up
/ av
aila
bilit
y, m
sq
m
Average availability
Take-up
Available space as multiple of annual take-up
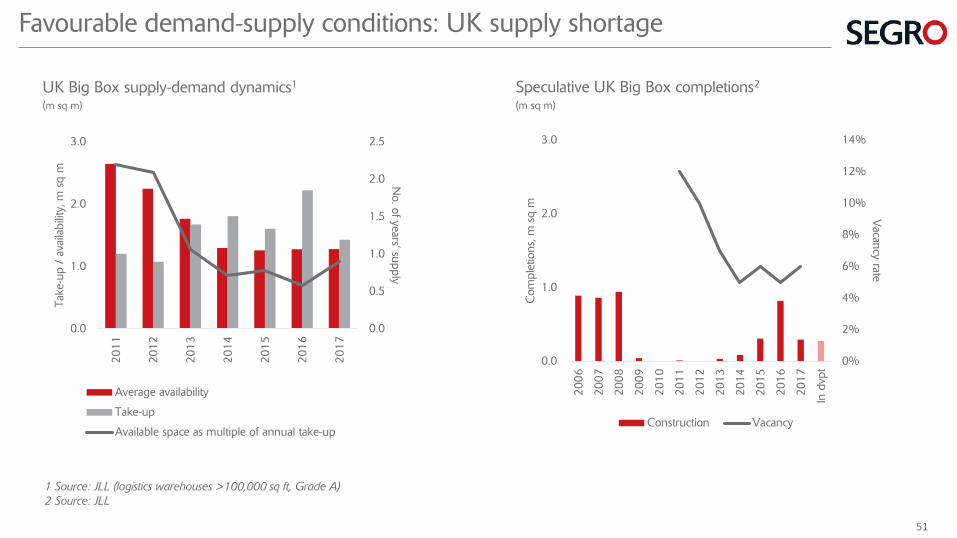
UK Big Box supply-demand dynamics1
(m sq m)
1 Source: JLL (logistics warehouses >100,000 sq ft, Grade A)2 Source: JLL
Speculative UK Big Box completions2
(m sq m)
0%
2%
4%
6%
8%
10%
12%
14%
0.0
1.0
2.0
3.0
2006
2007
2008
2009
2010
2011
2012
2013
2014
2015
2016
2017
In d
vpt
Vacancy rate
Com
plet
ions
, m s
q m
Construction Vacancy
Favourable demand-supply conditions: UK supply shortage
51
0.0
0.5
1.0
1.5
2.0
2.5
3.0
3.5
UK
Ger
man
y
Fran
ce
Belg
ium
Net
h.
Pola
nd Italy
Spai
n
Pre-let Speculative 4Q 2016
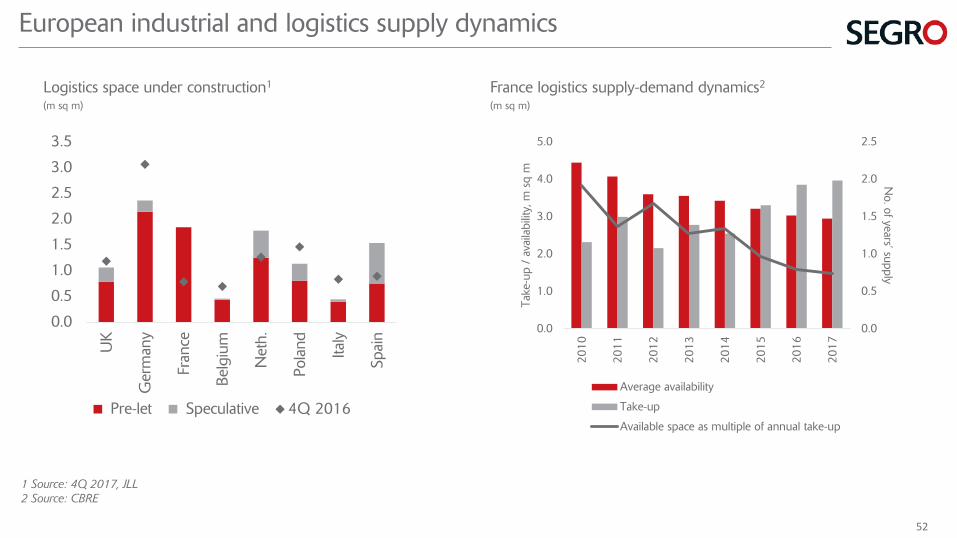
Logistics space under construction1
(m sq m)
1 Source: 4Q 2017, JLL2 Source: CBRE
European industrial and logistics supply dynamics
0.0
0.5
1.0
1.5
2.0
2.5
0.0
1.0
2.0
3.0
4.0
5.0
2010
2011
2012
2013
2014
2015
2016
2017
No. of years’ supply
Take
-up
/ av
aila
bilit
y, m
sq
m
Average availability
Take-up
Available space as multiple of annual take-up
France logistics supply-demand dynamics2
(m sq m)
52
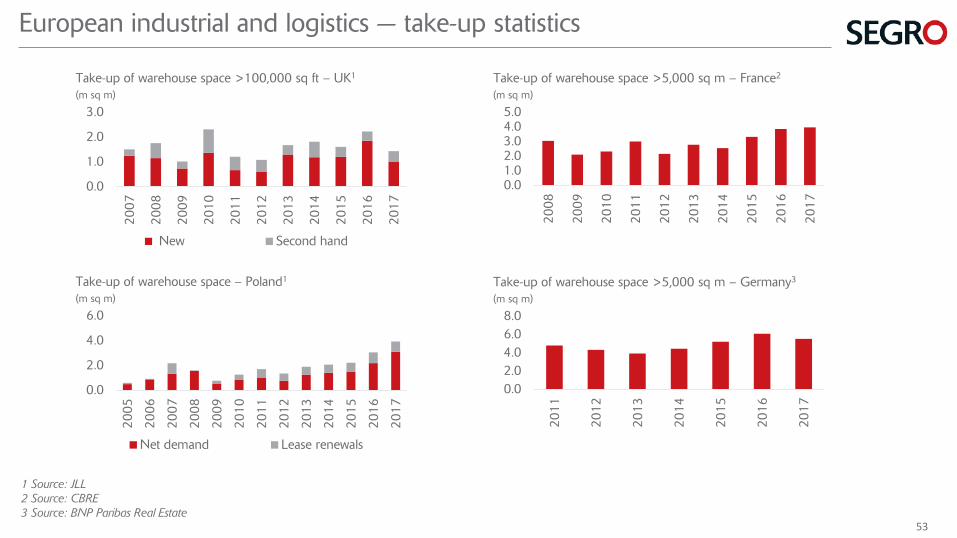
0.0
1.0
2.0
3.020
07
2008
2009
2010
2011
2012
2013
2014
2015
2016
2017
New Second hand
Take-up of warehouse space >100,000 sq ft – UK1
(m sq m)
1 Source: JLL2 Source: CBRE3 Source: BNP Paribas Real Estate
0.01.02.03.04.05.0
2008
2009
2010
2011
2012
2013
2014
2015
2016
2017
0.0
2.0
4.0
6.0
2005
2006
2007
2008
2009
2010
2011
2012
2013
2014
2015
2016
2017
Net demand Lease renewals
Take-up of warehouse space >5,000 sq m – France2
(m sq m)
Take-up of warehouse space – Poland1
(m sq m)
European industrial and logistics — take-up statistics
0.02.04.06.08.0
2011
2012
2013
2014
2015
2016
2017
Take-up of warehouse space >5,000 sq m – Germany3
(m sq m)
53
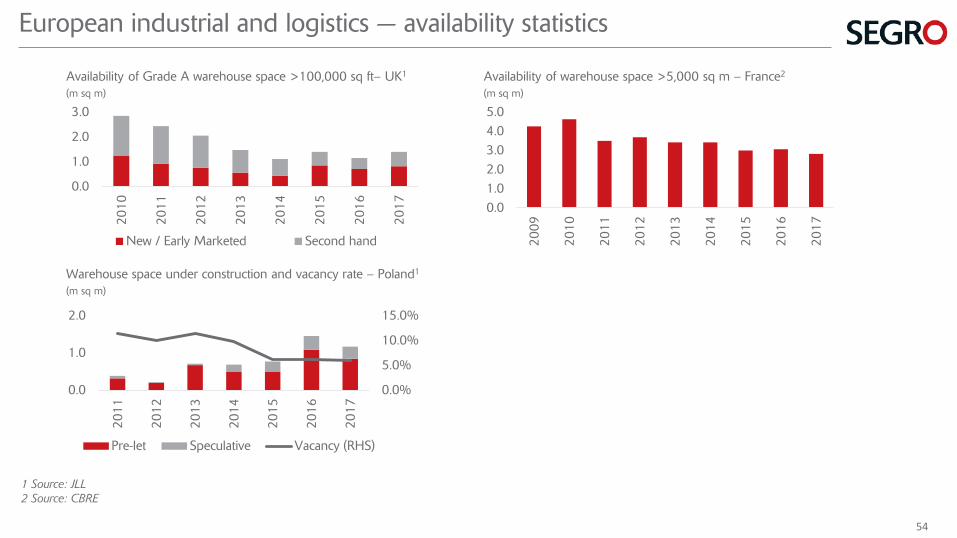
0.0
1.0
2.0
3.020
10
2011
2012
2013
2014
2015
2016
2017
New / Early Marketed Second hand
Availability of Grade A warehouse space >100,000 sq ft– UK1
(m sq m)
1 Source: JLL2 Source: CBRE
0.01.02.03.04.05.0
2009
2010
2011
2012
2013
2014
2015
2016
2017
0.0%
5.0%
10.0%
15.0%
0.0
1.0
2.0
2011
2012
2013
2014
2015
2016
2017
Pre-let Speculative Vacancy (RHS)
Availability of warehouse space >5,000 sq m – France2
(m sq m)
Warehouse space under construction and vacancy rate – Poland1
(m sq m)
European industrial and logistics — availability statistics
54
1.01.11.21.31.41.51.61.71.8
Dec
-05
Dec
-06
Dec
-07
Dec
-08
Dec
-09
Dec
-10
Dec
-11
Dec
-12
Dec
-13
Dec
-14
Dec
-15
Dec
-16
Dec
-17
10yr ave Rolling annual
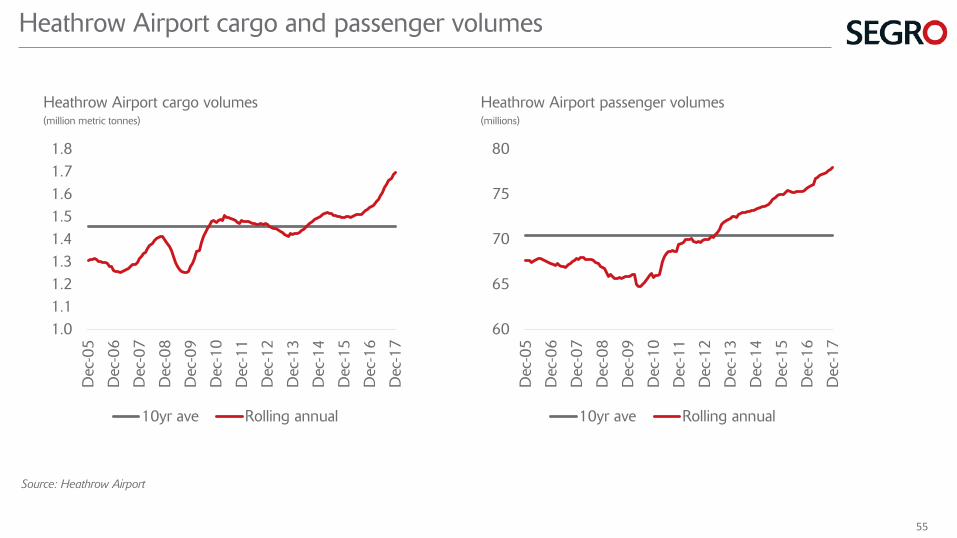
Heathrow Airport cargo volumes(million metric tonnes)
Source: Heathrow Airport
60
65
70
75
80
Dec
-05
Dec
-06
Dec
-07
Dec
-08
Dec
-09
Dec
-10
Dec
-11
Dec
-12
Dec
-13
Dec
-14
Dec
-15
Dec
-16
Dec
-17
10yr ave Rolling annual
Heathrow Airport passenger volumes(millions)
Heathrow Airport cargo and passenger volumes
55
This document has been prepared by SEGRO plc (‘SEGRO’) solely for use at the presentation of SEGRO’s results announcement in respect of the year ended 31
December 2017. For the purposes of this disclaimer, “Presentation” shall mean this document, the oral presentation of the slides by SEGRO and related question-and-
answer session and any materials distributed at, or in connection with, that presentation.
This Presentation does not constitute or form part of and should not be construed as, an offer to sell or issue, or the solicitation of an offer to buy or acquire, SEGRO’s
securities in any jurisdiction or an inducement to enter into investment activity. No part of this Presentation, nor the fact of its distribution, should form the basis of, or be
relied on in connection with, any contract or commitment or investment decision whatsoever.
This Presentation may contain certain forward-looking statements with respect to SEGRO’s expectations and plans, strategy, management’s objectives, future
performance, costs, revenues and other trend information. These statements and forecasts involve risk and uncertainty because they relate to events and depend upon
circumstances that may occur in the future. There are a number of factors which could cause actual results or developments to differ materially from those expressed or
implied by these forward looking statements and forecasts. The statements have been made with reference to forecast price changes, economic conditions and the
current regulatory environment. Any forward-looking statement is based on information available to SEGRO as at the date of the statement. SEGRO does not undertake
any obligation to revise or update any forward-looking statement to reflect any change in SEGRO’s expectations or events, conditions or circumstances on which any
such statement is based.
Nothing in this Presentation should be construed as a profit forecast. Past share performance cannot be relied on as a guide to future performance.
Forward-looking statements and Disclaimer
56