A Predictive Map of Puma (Puma concolor) Predation Risk in...
1
A Predictive Map of Puma (Puma concolor) Predation Risk in Southcentral New Mexico Scarlet Sellers EES201 – Introduction to Geographic Information Systems – Spring 2013, Furman University, Greenville, SC Abstract IV. Results and Discussion Alexander, S. M., Logan, T. B., & Paquet, P. C. (2006). Spatio-temporal co-occurrence of cougars (Felis concolor), wolves (Canis lupus) and their prey during winter: a comparison of two analytical methods. Journal of Biogeography, 33(11), 2001-2012. Anderson, C. R., F. G. Lindzey (2003). "Estimating cougar predation rates from GPS location clusters." Journal of Wildlife Management 67(2): 307-316. Atwood, T. C., Gese, E. M., Kunkel, K. E. (2007). "Comparative patterns of predation by cougars and recolonizing wolves in Montana's Madison Range." Journal of Wildlife Management 71(4): 1098-1106. Atwood, T. C., Gese, E. M., Kunkel, K. E. (2009). "Spatial Partitioning of Predation Risk in a Multiple Predator-Multiple Prey System." Journal of Wildlife Management 73(6): 876-884. Holmes, B. R., Laundré, J. W. (2006). “Use of open, edge and forest areas by pumas Puma concolor in winter: are pumas foraging optimally?” Wildlife Biology 12(2), 201-209. Hornocker, M. G. (1970). An analysis of mountain lion predation upon mule deer and elk in the Idaho primitive area.” Wildlife Monographs (21), 5-39. Laundré, J. W., Hernández, L. (2003). "Winter hunting habitat of pumas Puma concolor in northwestern Utah and southern Idaho, USA." Wildlife Biology 9(2): 123-129. Murrow, J. L., Thatcher, C. A, van Manen, F. T., Clark, J. D. (2012). “A data-based conservation planning tool for Florida panthers.” Environmental Modeling and Assessment 18(2): 159-170. All maps created with ESRI ArcDesktop 10 (2012). I would like to thank Dr. Travis Perry and Mike Winiski for major assistance in this project, as well as the members of Team Puma (Megan Pitman, Jesse Wood, Alex Viere, Sarah Kooy, Richard Pickens, Brianna Upton, Sadie Perrin, Sarah Rusnak, Mary Hornack, Tricia Rossettie) for data collection. I. Introduction III. Methodology VI. Acknowledgements VII. References V. Conclusion Figure 3. A predictive map of puma predation in Ladder Ranch, NM. Red indicates a high probability of puma predation, blue indicates a low probability. The mountain lion (Puma concolor), also called puma and cougar, is a nocturnal ambush predator whose hunting success depends on habitat type. The majority of their diet consists of mule deer (Odocoileus hemionus), and these predators rely on high vegetation cover for camouflage when stalking prey (Hornocker, 1970). Previous studies have documented the influence of environmental variables on puma predation, as the number of kills often depends on habitat type, where puma hunt more successfully in edge habitat rather than open habitat (Laundré and Hernandez, 2003). Generally, more open habitat decreases the probability of puma predation, as puma tend to rely on environmental camouflage for hunting, and structurally complex habitats often increase predation risk for prey species (Atwood, Gese, and Hernández, 2007). Other environmental variables, such as distance to roads and water, elevation, and slope have also been shown to affect predation (Atwood, Gese, and Hernandez, 2009). The use of GPS technology to develop models for estimating probability is increasing in the wildlife biology and management field, and has been suggested to accurately predict important ecological systems such as predation rates (Anderson and Lindzey, 2003). In addition, geographic information systems (GIS) have also been utilized in predator conservation by developing habitat models and analyzing environmental variables such as habitat type and land cover (Murrow et al., 2012). In this study, environmental variables where puma predation was likely were determined using data obtained from GPS-collared puma. The purpose of this study is to determine the influence of environmental variables on puma and create a predictive map of predation risk of puma in southcentral New Mexico. Image 2. A sedated individual fitted with a GPS collar. Image 1. A radio-collared puma whose predation data was used in the study. Objective: What is the probability of an area having a high risk of puma predation? Study Site: Ladder Ranch, Caballo, New Mexico (approx. size: 156,439 acres) Environmental Variables: •Topographic Ruggedness Index (TRI) at a scale of 120 -expresses the amount of elevation difference between adjacent cells of a digital elevation model (DEM) and corresponds to average elevation change between any point on a grid and its surrounding area. Calculates the difference in elevation values from a center cell and the eight cells immediately surrounding it, squares each value, averages the squares, and takes the square root of the average. •Distance to Drainage – low areas or indentations in the landscape measured in meters, defined in this study as an area where 100 cells would drain water into 1 cell •Slope - the steepness of a surface measured in degrees Methods: The computer program R was used to locate clusters of GPS points defined as kill sites. The study area was divided into 10 meter by 10 meter cells. Layers documenting TRI_120, distance to drainage, and slope were created for the study site. These layers were combined and the documented kill points were plotted to create a single map. A layer with 1,000 random points was compared with the layer documenting the 266 known puma kill sites. An extraction of these layers using Hawth’s Tools and merging of the two data sets provided the data for statistical analysis. A digital elevation model (DEM) raster map was created to indicate the probability of a 10m x 10m area being a site of puma predation. Each cell was assigned a value indicating a high or low probability of that area being a puma predation site. Kill Sites: Kill sites are defined as areas where a puma predation event occurred. Sites were determined by GPS location data from collared puma, where a cluster of two or more points within 50 m of each other within a 48 hour period indicated a kill site. The areas were then checked on site to determine evidence of predation based on remains of hair, bone, etc. We can conclude that topographic ruggedness at a scale of 120 and distance to drainage are significant variables in predicting puma predation. We would be more likely to predict an area to have a greater probability of predation if the area is close to a drainage with a high level of topographic ruggedness. These results agree with what is known about puma hunting behavior, as puma rely on environmental cover to increase hunting success as ambush predators. Flat, open areas are associated with low predation risk by puma, and areas closer to drainage with high topographic ruggedness would likely be associated with greater cover and an uneven land surface. Slope was somewhat significant (p=0.056), and may have an affect on probability of predation, as areas with a greater slope also tend to be more complex and less flat. Future research would extend analysis to a greater number of environmental variables, including vegetation type, elevation, or distance to water. A greater number of documented kill sites used in analysis would yield more accurate results, and the study could also extend to cover multiple study sites or a greater total area. The effects of environmental variables on prey species such as mule deer or elk would also increase our understanding of predator-prey relationships. Figure 2. A topography map of New Mexico. The study site at Ladder Ranch is indicated in purple. A multiple logistic regression was derived using empirical data. This analysis was combined with a step-wise Akaike information criterion (AIC) model selection procedure indicated that TRI_120 and distance to drainage at a scale of 120 (p=0.00944, 3.31e-14, respectively) were significantly effective predictor variables for distinguishing between puma kill points and random points. Slope was indicated to be moderately significant (p=0.05644). The resulting AIC model for predicting the log odds of a point being a random point was exp(-(-0.12573*logTRI_120 + 0.40173*logdst + 0.14495*logslope + 0.276. This was converted to probability by 1/(1+ exp(-(-0.12573*logTRI_120 + 0.40173*logdst + 0.14495*logslope + 0.276))). This was then subtracted from 1 to put the model in terms of probability of kill presence. Statistical Analysis: A binary logistic regression produced the linear combination of habitat variables that best distinguishes between puma kill points and random points. The value of each raster cell layer is multiplied by the model coefficient and added/subtracted from the other raster layers at that same location. The value in the new raster cell is equal to the odds that a predation event is in that cell. Figure 4. An inset map of the selected area of Figure 3 detailing topographic ruggedness at a scale of 120. Cells with a high value are red, those with a low value are blue. Red areas correspond to a more variable landscape. Figure 5. An inset map of slope measured in degrees. The high values in red indicate a greater slope, which occur in steep areas. Areas with a low value tend to occur at mesas, where the landscape is more flat. Figure 6. An inset map of distance to drainage measured in meters. Those cells with a low value indicate low points, or indentations, in the landscape. Figure 1. A detailed view of a digital elevation model (DEM). In this example measuring slope, each individual cell represents 10m x 10m. Cells with a high slope value are red, and those with a low value are blue. Results are presented in Figure 3, where areas with a high probability of puma predation are indicated in red, and areas with a low probability are indicated in blue. Cells with a high probability of predation tend to be in areas with greater values of topographic ruggedness and distance to drainage. Cells with a low probability tend to be in more open, flat areas. Figures 4- 6 show values of individual variables for topographic ruggedness, slope, and distance to drainage before the combined analysis for comparison. Figure 7 provides a detailed inset of the final output, and shows the predation probability values based on the environmental variables and kill points. Due to the significance of topographic ruggedness and distance to drainage, areas with a low probability value in figure 3 often correspond to large, flat areas such as mesas, which are likely poor areas for puma predation as they provide little cover. Areas with a high probability value represent land with a high topographic ruggedness and a close distance to drainage, which corresponds to greater habitat complexity that would likely provide more cover, and therefore increase the probability of a predation event. For example, areas along Cave Creek Mesa (fig. 4-6), a high, flat area, have low values of slope and topographic ruggedness, and are farther from drainages. As a result, much of this area has a low probability of predation (Fig. 7). Likewise, similar flat areas with little cover tend to have lower probability values, and those with high values tend to be more structurally complex with uneven land surfaces. Figure 7. A closer view of the final output map, detailing the selected portion of Figure 3. Topographic ruggedness, slope, and distance to drainage are combined to create a predictive model of predation. Probability values are measured out of 1. Sample Size: 10 GPS-radio-collared puma, 266 kill sites Study Period: February, 2008 - June, 2012 The importance of animal movement, predation, and predator-prey relationships has been widely researched in literature, and the use of GPS technology has increased accuracy and understanding of these concepts (Alexander, Logan, and Paquet, 2006). Environmental variables, such as vegetation, slope, and elevation, have previously been found to influence the hunting success of large carnivores, and ambush predators such as puma are likely to be more successful with greater habitat complexity for camouflage (Holmes and Laundré, 2006). Using ArcGIS to create a digital elevation model, I created a predictive map of puma predation by comparing known puma kill sites to random points to determine the probability of each 10 meter x 10 meter area being a predation site in southcentral New Mexico. I found that topographic ruggedness at a scale of 120 and distance to drainage were significant in determining puma predation (p=0.009, 3.31e-14). These results have greater implications for wildlife management and conservation in predicting the success of puma based on environmental variables.
-
Upload
truongthuy -
Category
Documents
-
view
226 -
download
5
Transcript of A Predictive Map of Puma (Puma concolor) Predation Risk in...
A Predictive Map of Puma (Puma concolor) Predation Risk in Southcentral New Mexico Scarlet Sellers
EES201 – Introduction to Geographic Information Systems – Spring 2013, Furman University, Greenville, SC
Abstract IV. Results and Discussion
Alexander, S. M., Logan, T. B., & Paquet, P. C. (2006). Spatio-temporal co-occurrence of cougars (Felis concolor), wolves (Canis lupus) and their prey during winter: a comparison of two analytical methods. Journal of
Biogeography, 33(11), 2001-2012.
Anderson, C. R., F. G. Lindzey (2003). "Estimating cougar predation rates from GPS location clusters." Journal of Wildlife Management 67(2): 307-316.
Atwood, T. C., Gese, E. M., Kunkel, K. E. (2007). "Comparative patterns of predation by cougars and recolonizing wolves in Montana's Madison Range." Journal of Wildlife Management 71(4): 1098-1106.
Atwood, T. C., Gese, E. M., Kunkel, K. E. (2009). "Spatial Partitioning of Predation Risk in a Multiple Predator-Multiple Prey System." Journal of Wildlife Management 73(6): 876-884.
Holmes, B. R., Laundré, J. W. (2006). “Use of open, edge and forest areas by pumas Puma concolor in winter: are pumas foraging optimally?” Wildlife Biology 12(2), 201-209.
Hornocker, M. G. (1970). An analysis of mountain lion predation upon mule deer and elk in the Idaho primitive area.” Wildlife Monographs (21), 5-39.
Laundré, J. W., Hernández, L. (2003). "Winter hunting habitat of pumas Puma concolor in northwestern Utah and southern Idaho, USA." Wildlife Biology 9(2): 123-129.
Murrow, J. L., Thatcher, C. A, van Manen, F. T., Clark, J. D. (2012). “A data-based conservation planning tool for Florida panthers.” Environmental Modeling and Assessment 18(2): 159-170.
All maps created with ESRI ArcDesktop 10 (2012).
I would like to thank Dr. Travis Perry and Mike Winiski for major
assistance in this project, as well as the members of Team Puma
(Megan Pitman, Jesse Wood, Alex Viere, Sarah Kooy, Richard
Pickens, Brianna Upton, Sadie Perrin, Sarah Rusnak, Mary
Hornack, Tricia Rossettie) for data collection.
I. Introduction
III. Methodology
VI. Acknowledgements
VII. References
V. Conclusion
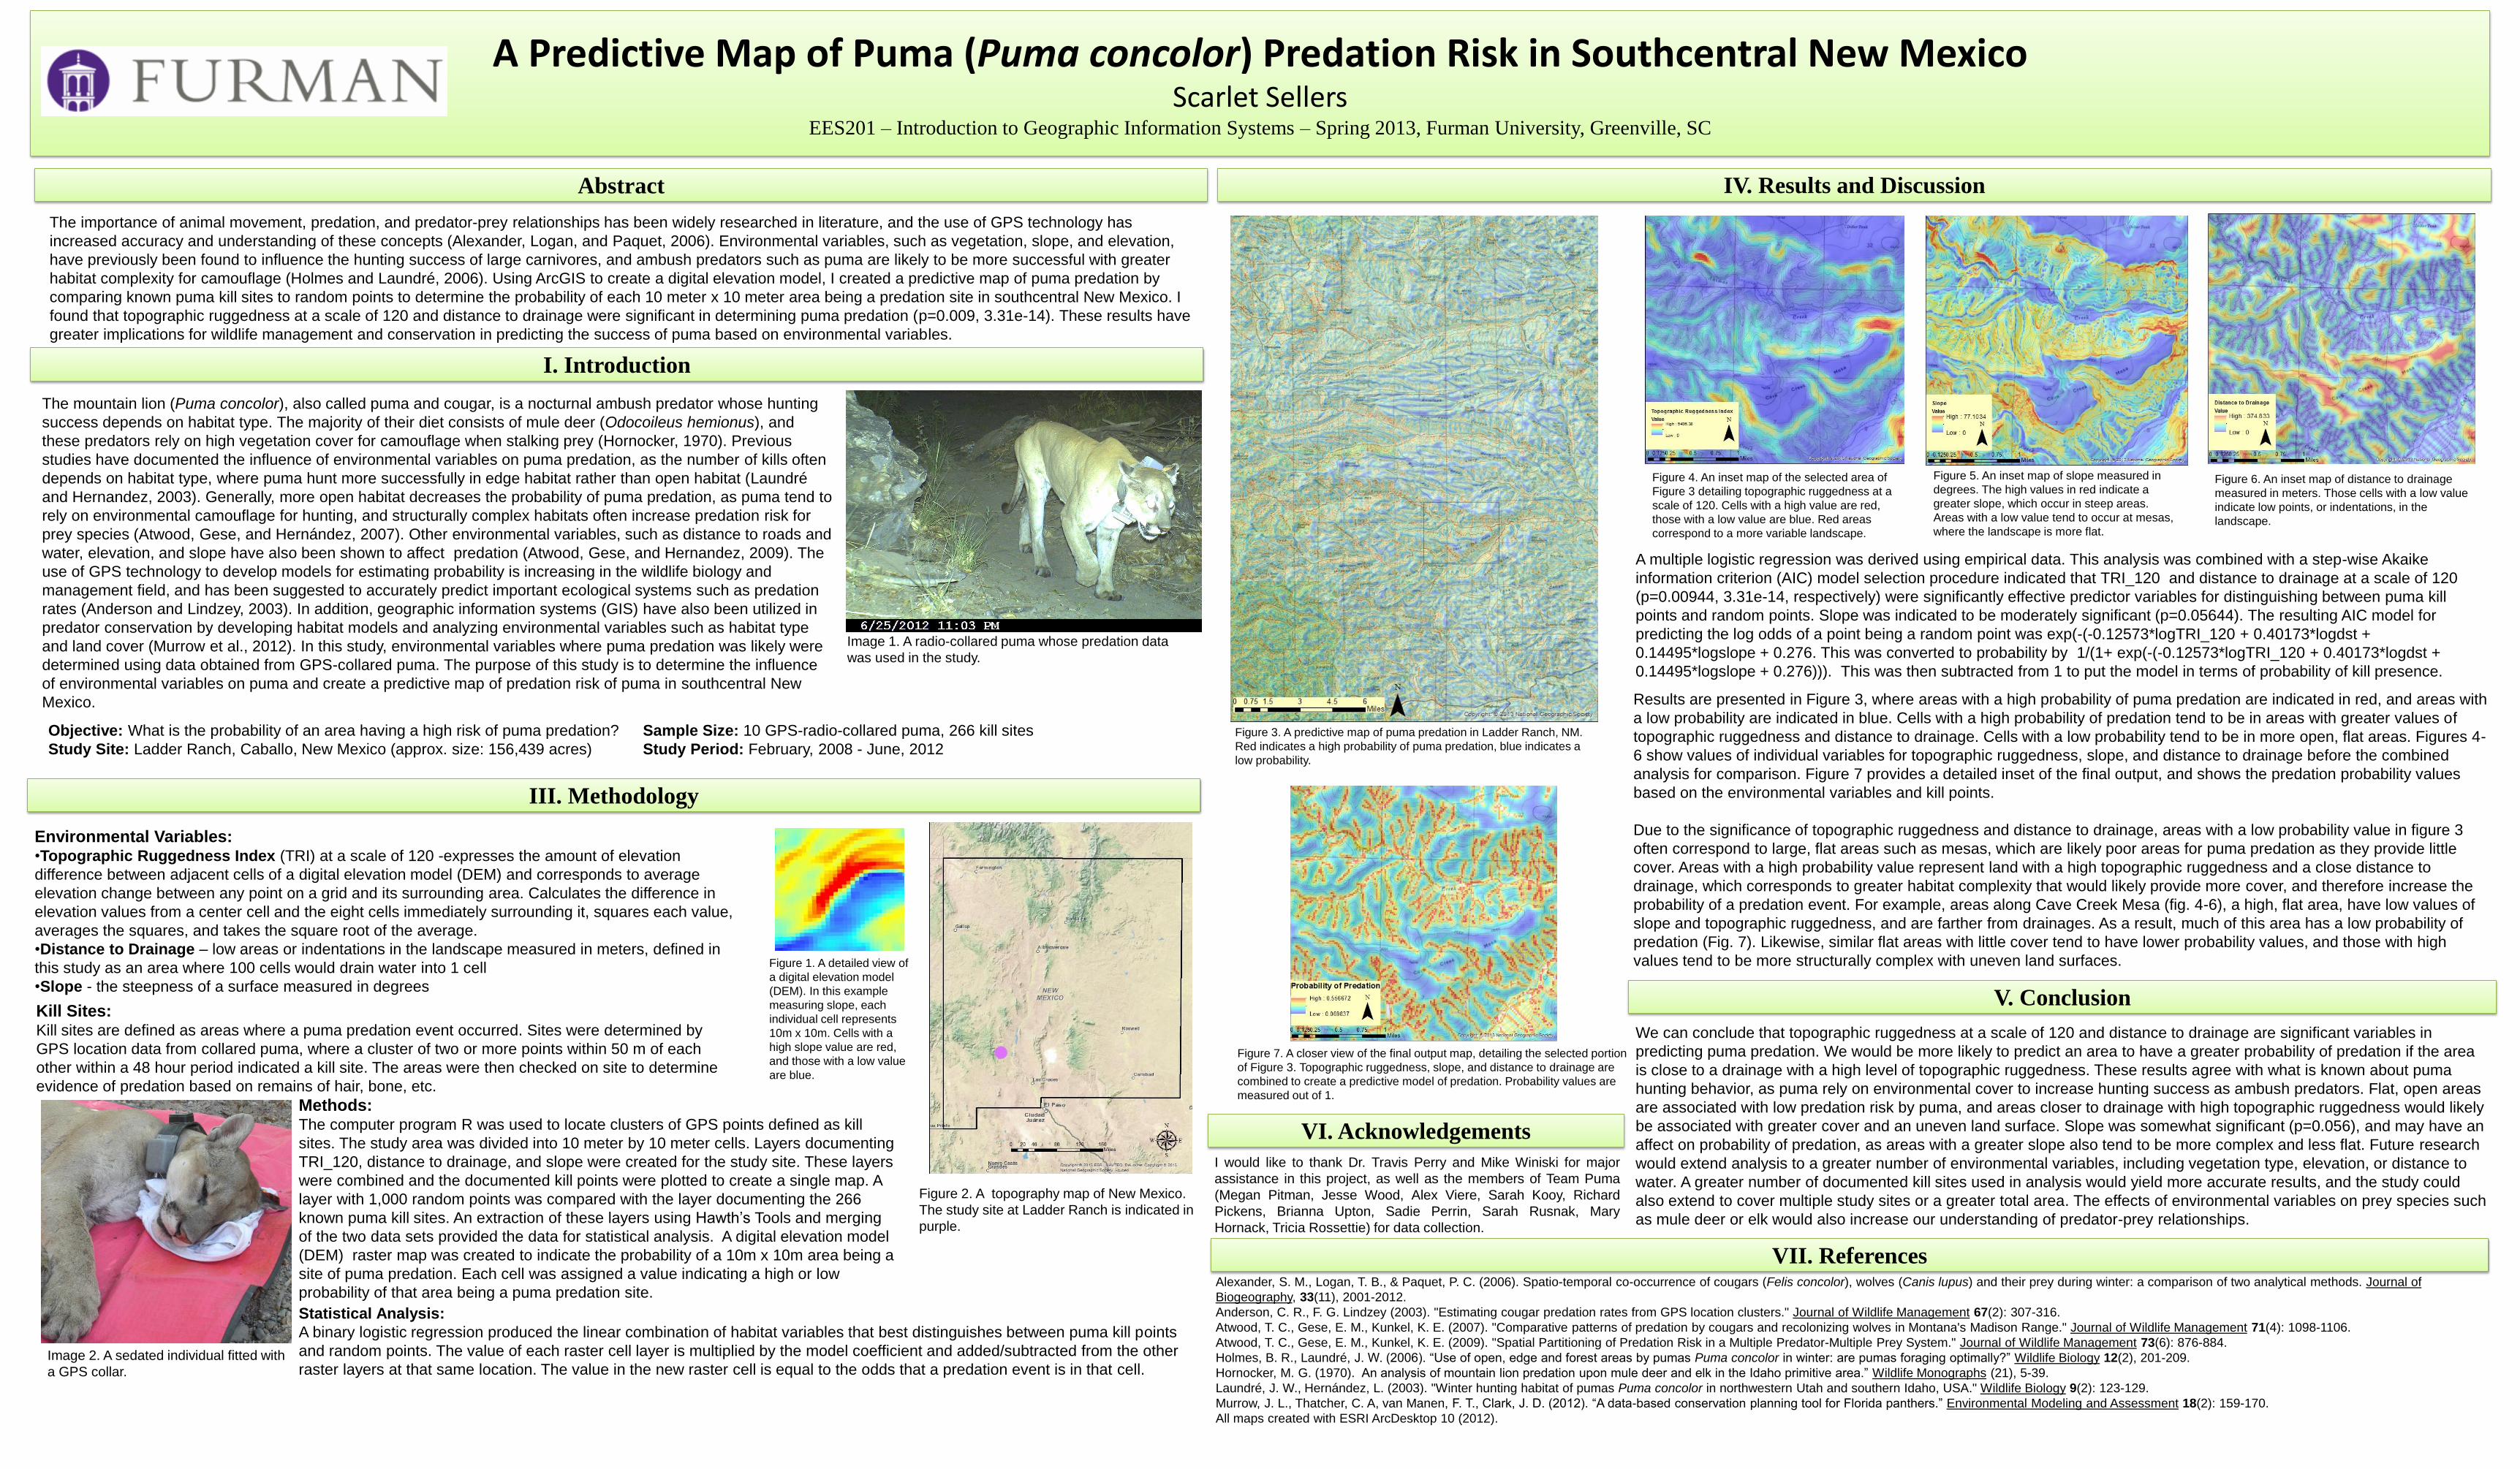
Figure 3. A predictive map of puma predation in Ladder Ranch, NM.
Red indicates a high probability of puma predation, blue indicates a
low probability.
The mountain lion (Puma concolor), also called puma and cougar, is a nocturnal ambush predator whose hunting
success depends on habitat type. The majority of their diet consists of mule deer (Odocoileus hemionus), and
these predators rely on high vegetation cover for camouflage when stalking prey (Hornocker, 1970). Previous
studies have documented the influence of environmental variables on puma predation, as the number of kills often
depends on habitat type, where puma hunt more successfully in edge habitat rather than open habitat (Laundré
and Hernandez, 2003). Generally, more open habitat decreases the probability of puma predation, as puma tend to
rely on environmental camouflage for hunting, and structurally complex habitats often increase predation risk for
prey species (Atwood, Gese, and Hernández, 2007). Other environmental variables, such as distance to roads and
water, elevation, and slope have also been shown to affect predation (Atwood, Gese, and Hernandez, 2009). The
use of GPS technology to develop models for estimating probability is increasing in the wildlife biology and
management field, and has been suggested to accurately predict important ecological systems such as predation
rates (Anderson and Lindzey, 2003). In addition, geographic information systems (GIS) have also been utilized in
predator conservation by developing habitat models and analyzing environmental variables such as habitat type
and land cover (Murrow et al., 2012). In this study, environmental variables where puma predation was likely were
determined using data obtained from GPS-collared puma. The purpose of this study is to determine the influence
of environmental variables on puma and create a predictive map of predation risk of puma in southcentral New
Mexico.
Image 2. A sedated individual fitted with
a GPS collar.
Image 1. A radio-collared puma whose predation data
was used in the study.
Objective: What is the probability of an area having a high risk of puma predation?
Study Site: Ladder Ranch, Caballo, New Mexico (approx. size: 156,439 acres)
Environmental Variables: •Topographic Ruggedness Index (TRI) at a scale of 120 -expresses the amount of elevation
difference between adjacent cells of a digital elevation model (DEM) and corresponds to average
elevation change between any point on a grid and its surrounding area. Calculates the difference in
elevation values from a center cell and the eight cells immediately surrounding it, squares each value,
averages the squares, and takes the square root of the average.
•Distance to Drainage – low areas or indentations in the landscape measured in meters, defined in
this study as an area where 100 cells would drain water into 1 cell
•Slope - the steepness of a surface measured in degrees
Methods: The computer program R was used to locate clusters of GPS points defined as kill
sites. The study area was divided into 10 meter by 10 meter cells. Layers documenting
TRI_120, distance to drainage, and slope were created for the study site. These layers
were combined and the documented kill points were plotted to create a single map. A
layer with 1,000 random points was compared with the layer documenting the 266
known puma kill sites. An extraction of these layers using Hawth’s Tools and merging
of the two data sets provided the data for statistical analysis. A digital elevation model
(DEM) raster map was created to indicate the probability of a 10m x 10m area being a
site of puma predation. Each cell was assigned a value indicating a high or low
probability of that area being a puma predation site.
Kill Sites: Kill sites are defined as areas where a puma predation event occurred. Sites were determined by
GPS location data from collared puma, where a cluster of two or more points within 50 m of each
other within a 48 hour period indicated a kill site. The areas were then checked on site to determine
evidence of predation based on remains of hair, bone, etc.
We can conclude that topographic ruggedness at a scale of 120 and distance to drainage are significant variables in
predicting puma predation. We would be more likely to predict an area to have a greater probability of predation if the area
is close to a drainage with a high level of topographic ruggedness. These results agree with what is known about puma
hunting behavior, as puma rely on environmental cover to increase hunting success as ambush predators. Flat, open areas
are associated with low predation risk by puma, and areas closer to drainage with high topographic ruggedness would likely
be associated with greater cover and an uneven land surface. Slope was somewhat significant (p=0.056), and may have an
affect on probability of predation, as areas with a greater slope also tend to be more complex and less flat. Future research
would extend analysis to a greater number of environmental variables, including vegetation type, elevation, or distance to
water. A greater number of documented kill sites used in analysis would yield more accurate results, and the study could
also extend to cover multiple study sites or a greater total area. The effects of environmental variables on prey species such
as mule deer or elk would also increase our understanding of predator-prey relationships.
Figure 2. A topography map of New Mexico.
The study site at Ladder Ranch is indicated in
purple.
A multiple logistic regression was derived using empirical data. This analysis was combined with a step-wise Akaike
information criterion (AIC) model selection procedure indicated that TRI_120 and distance to drainage at a scale of 120
(p=0.00944, 3.31e-14, respectively) were significantly effective predictor variables for distinguishing between puma kill
points and random points. Slope was indicated to be moderately significant (p=0.05644). The resulting AIC model for
predicting the log odds of a point being a random point was exp(-(-0.12573*logTRI_120 + 0.40173*logdst +
0.14495*logslope + 0.276. This was converted to probability by 1/(1+ exp(-(-0.12573*logTRI_120 + 0.40173*logdst +
0.14495*logslope + 0.276))). This was then subtracted from 1 to put the model in terms of probability of kill presence.
Statistical Analysis:
A binary logistic regression produced the linear combination of habitat variables that best distinguishes between puma kill points
and random points. The value of each raster cell layer is multiplied by the model coefficient and added/subtracted from the other
raster layers at that same location. The value in the new raster cell is equal to the odds that a predation event is in that cell.
Figure 4. An inset map of the selected area of
Figure 3 detailing topographic ruggedness at a
scale of 120. Cells with a high value are red,
those with a low value are blue. Red areas
correspond to a more variable landscape.
Figure 5. An inset map of slope measured in
degrees. The high values in red indicate a
greater slope, which occur in steep areas.
Areas with a low value tend to occur at mesas,
where the landscape is more flat.
Figure 6. An inset map of distance to drainage
measured in meters. Those cells with a low value
indicate low points, or indentations, in the
landscape.
Figure 1. A detailed view of
a digital elevation model
(DEM). In this example
measuring slope, each
individual cell represents
10m x 10m. Cells with a
high slope value are red,
and those with a low value
are blue.
Results are presented in Figure 3, where areas with a high probability of puma predation are indicated in red, and areas with
a low probability are indicated in blue. Cells with a high probability of predation tend to be in areas with greater values of
topographic ruggedness and distance to drainage. Cells with a low probability tend to be in more open, flat areas. Figures 4-
6 show values of individual variables for topographic ruggedness, slope, and distance to drainage before the combined
analysis for comparison. Figure 7 provides a detailed inset of the final output, and shows the predation probability values
based on the environmental variables and kill points.
Due to the significance of topographic ruggedness and distance to drainage, areas with a low probability value in figure 3
often correspond to large, flat areas such as mesas, which are likely poor areas for puma predation as they provide little
cover. Areas with a high probability value represent land with a high topographic ruggedness and a close distance to
drainage, which corresponds to greater habitat complexity that would likely provide more cover, and therefore increase the
probability of a predation event. For example, areas along Cave Creek Mesa (fig. 4-6), a high, flat area, have low values of
slope and topographic ruggedness, and are farther from drainages. As a result, much of this area has a low probability of
predation (Fig. 7). Likewise, similar flat areas with little cover tend to have lower probability values, and those with high
values tend to be more structurally complex with uneven land surfaces.
Figure 7. A closer view of the final output map, detailing the selected portion
of Figure 3. Topographic ruggedness, slope, and distance to drainage are
combined to create a predictive model of predation. Probability values are
measured out of 1.
Sample Size: 10 GPS-radio-collared puma, 266 kill sites
Study Period: February, 2008 - June, 2012
The importance of animal movement, predation, and predator-prey relationships has been widely researched in literature, and the use of GPS technology has
increased accuracy and understanding of these concepts (Alexander, Logan, and Paquet, 2006). Environmental variables, such as vegetation, slope, and elevation,
have previously been found to influence the hunting success of large carnivores, and ambush predators such as puma are likely to be more successful with greater
habitat complexity for camouflage (Holmes and Laundré, 2006). Using ArcGIS to create a digital elevation model, I created a predictive map of puma predation by
comparing known puma kill sites to random points to determine the probability of each 10 meter x 10 meter area being a predation site in southcentral New Mexico. I
found that topographic ruggedness at a scale of 120 and distance to drainage were significant in determining puma predation (p=0.009, 3.31e-14). These results have
greater implications for wildlife management and conservation in predicting the success of puma based on environmental variables.