estimating rates and dates: the molecular clock - UCLA · the utility of a molecular clock ... Puma...
72
estimating rates and dates: the molecular clock Wednesday, July 27, 2011
Transcript of estimating rates and dates: the molecular clock - UCLA · the utility of a molecular clock ... Puma...
estimating rates and dates:the molecular clock
Wednesday, July 27, 2011

is there a molecular clock?
Wednesday, July 27, 2011
molecular clocks
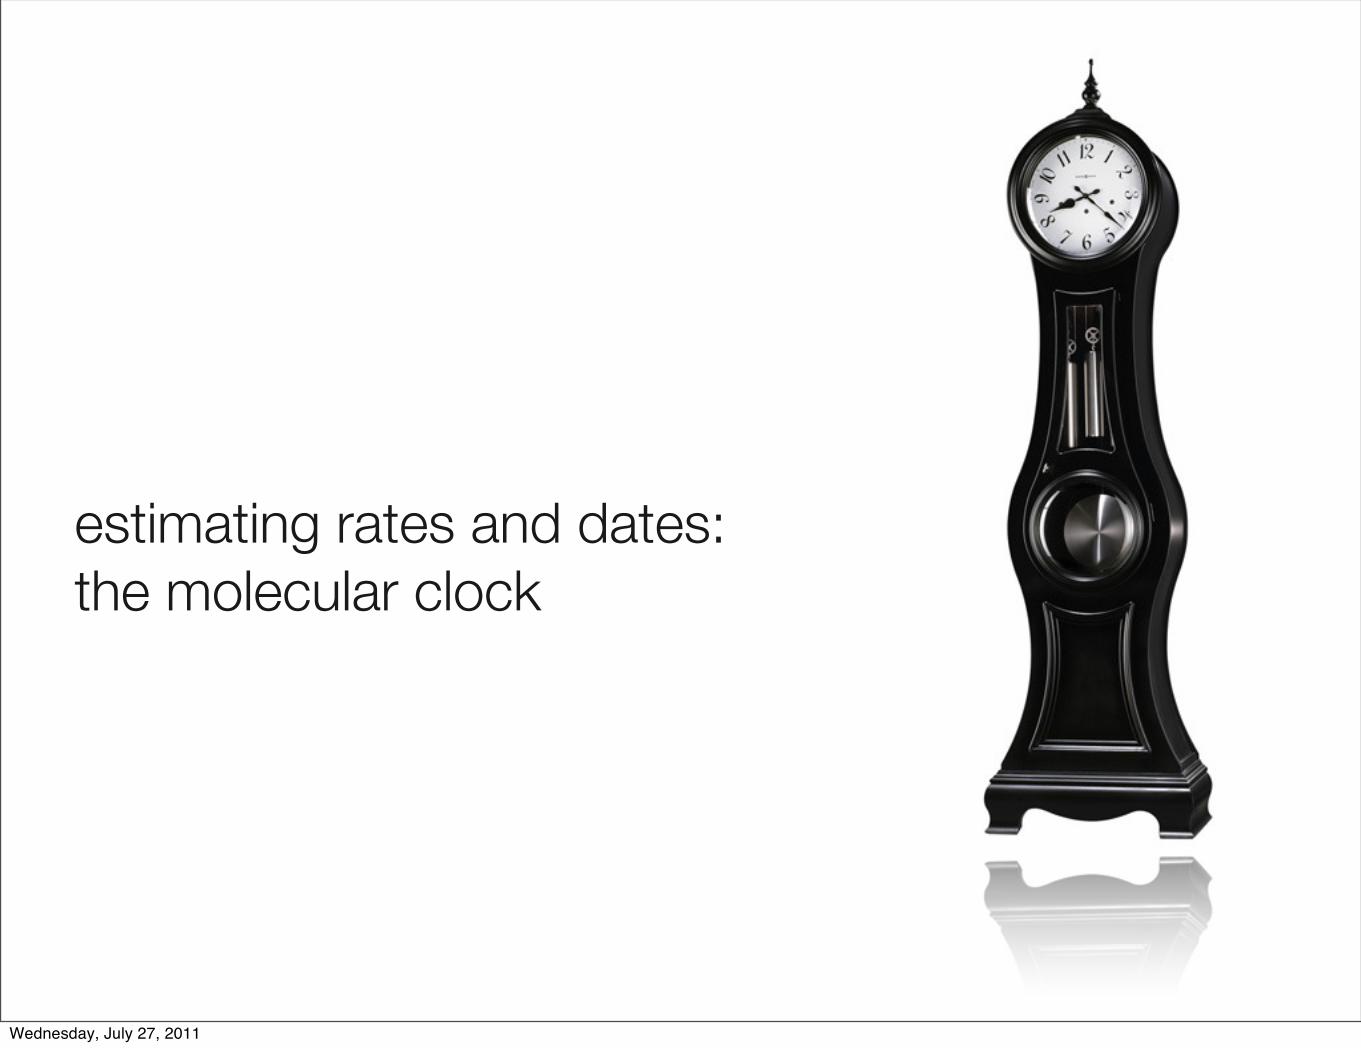
• most molecular phylogenies
are unrooted (or rooting is determined by prior information)
have branch lengths indicating genetic change
3introduction clocks calibrations clock tests relaxed clocks conclusionWednesday, July 27, 2011
molecular phylogenies
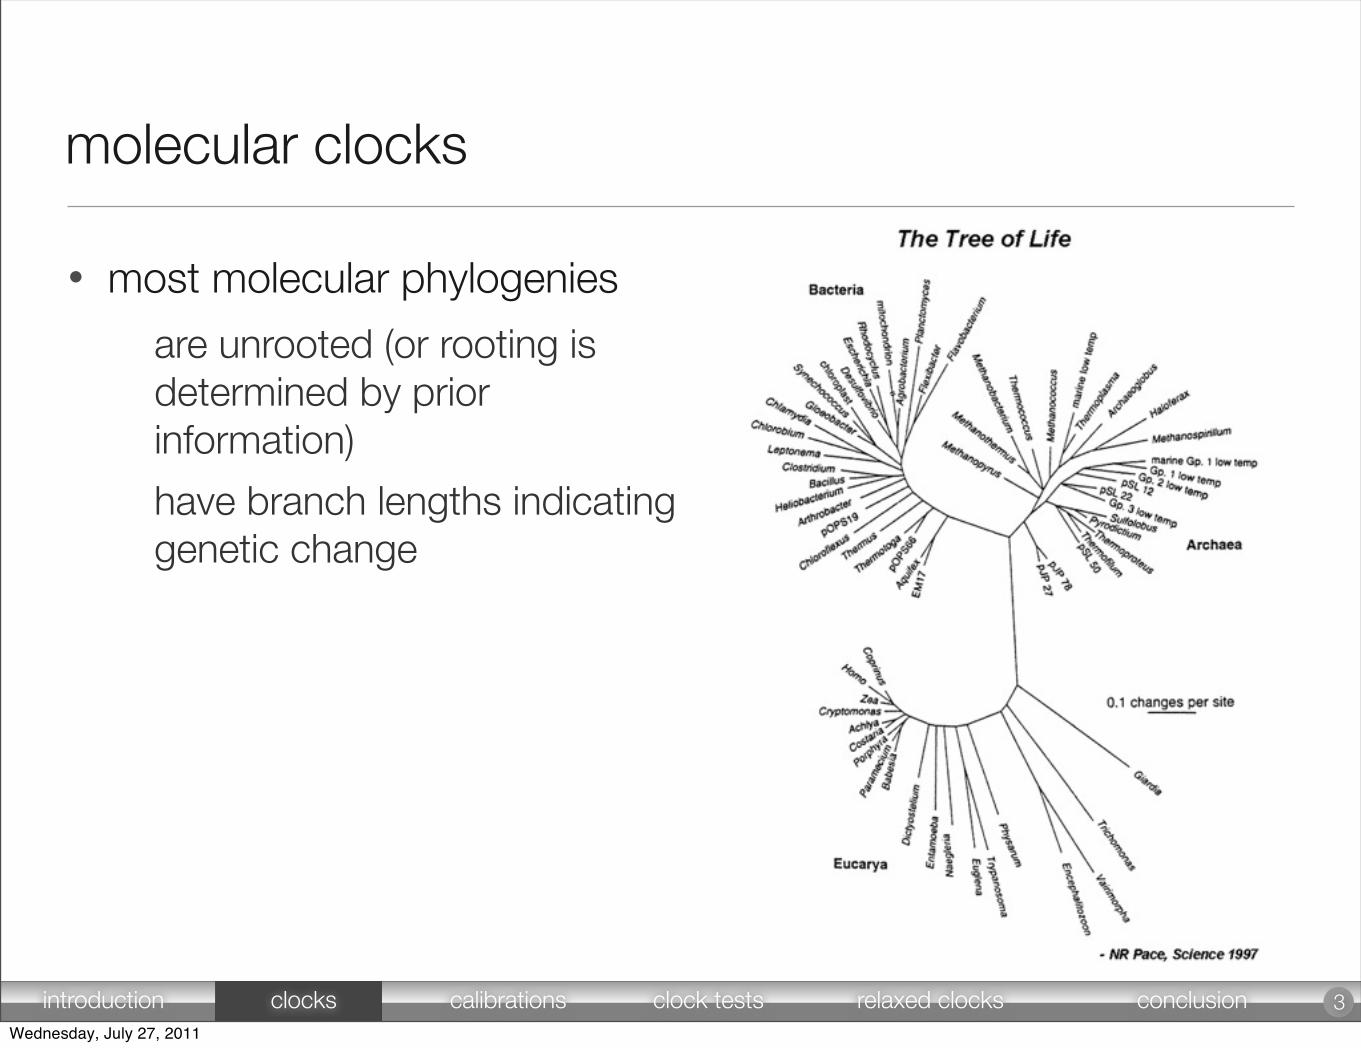
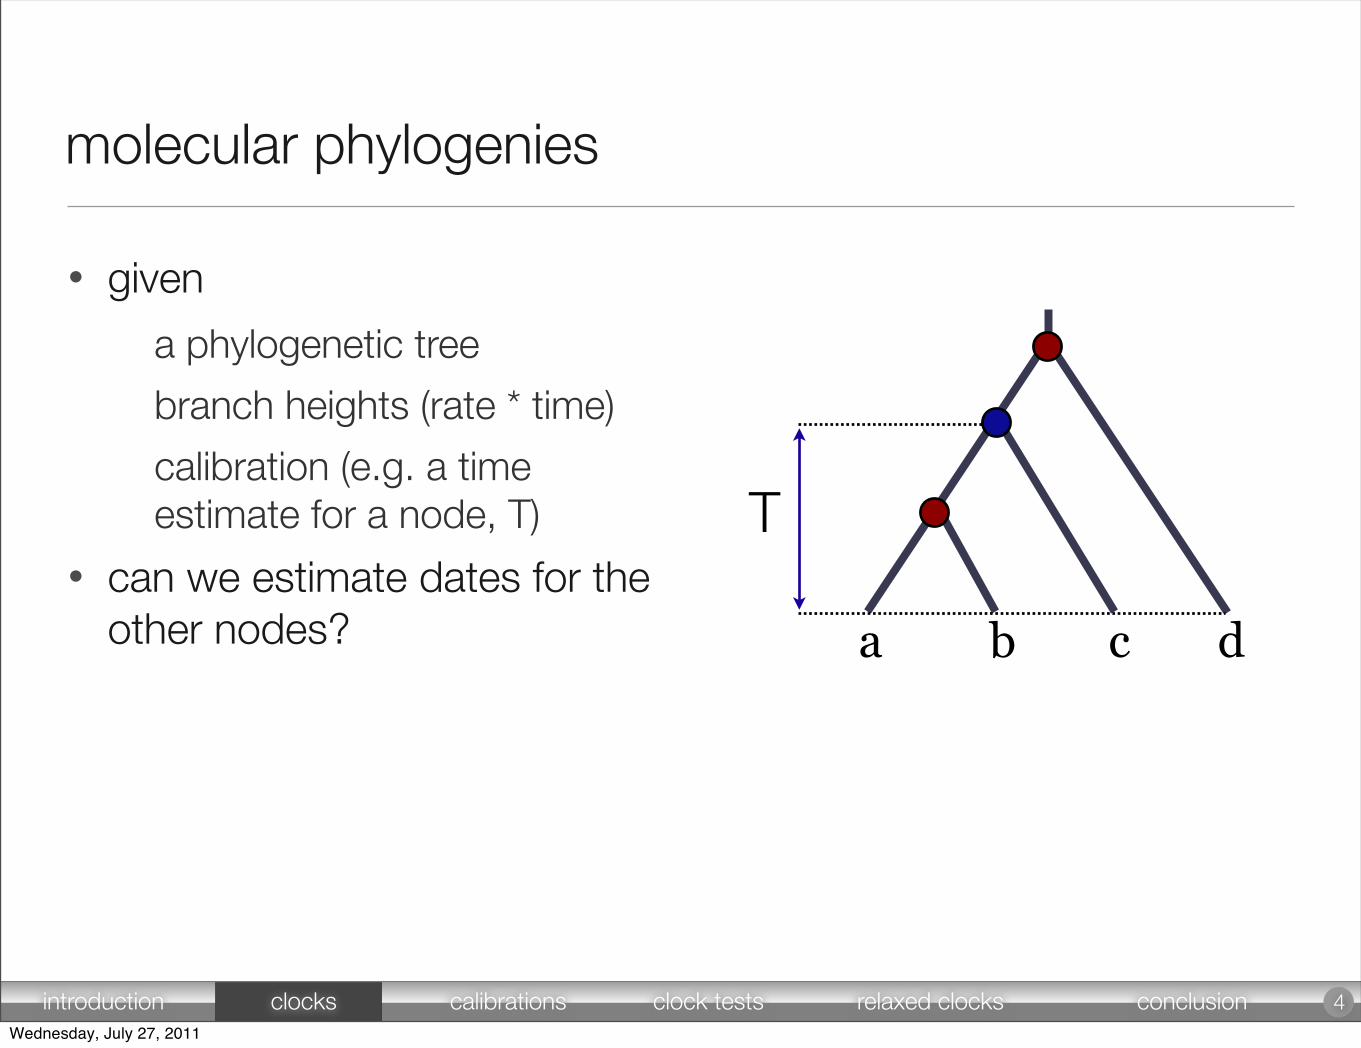
• given
a phylogenetic tree
branch heights (rate * time)
calibration (e.g. a time estimate for a node, T)
• can we estimate dates for the other nodes?
4
T
a b c d
introduction clocks calibrations clock tests relaxed clocks conclusionWednesday, July 27, 2011
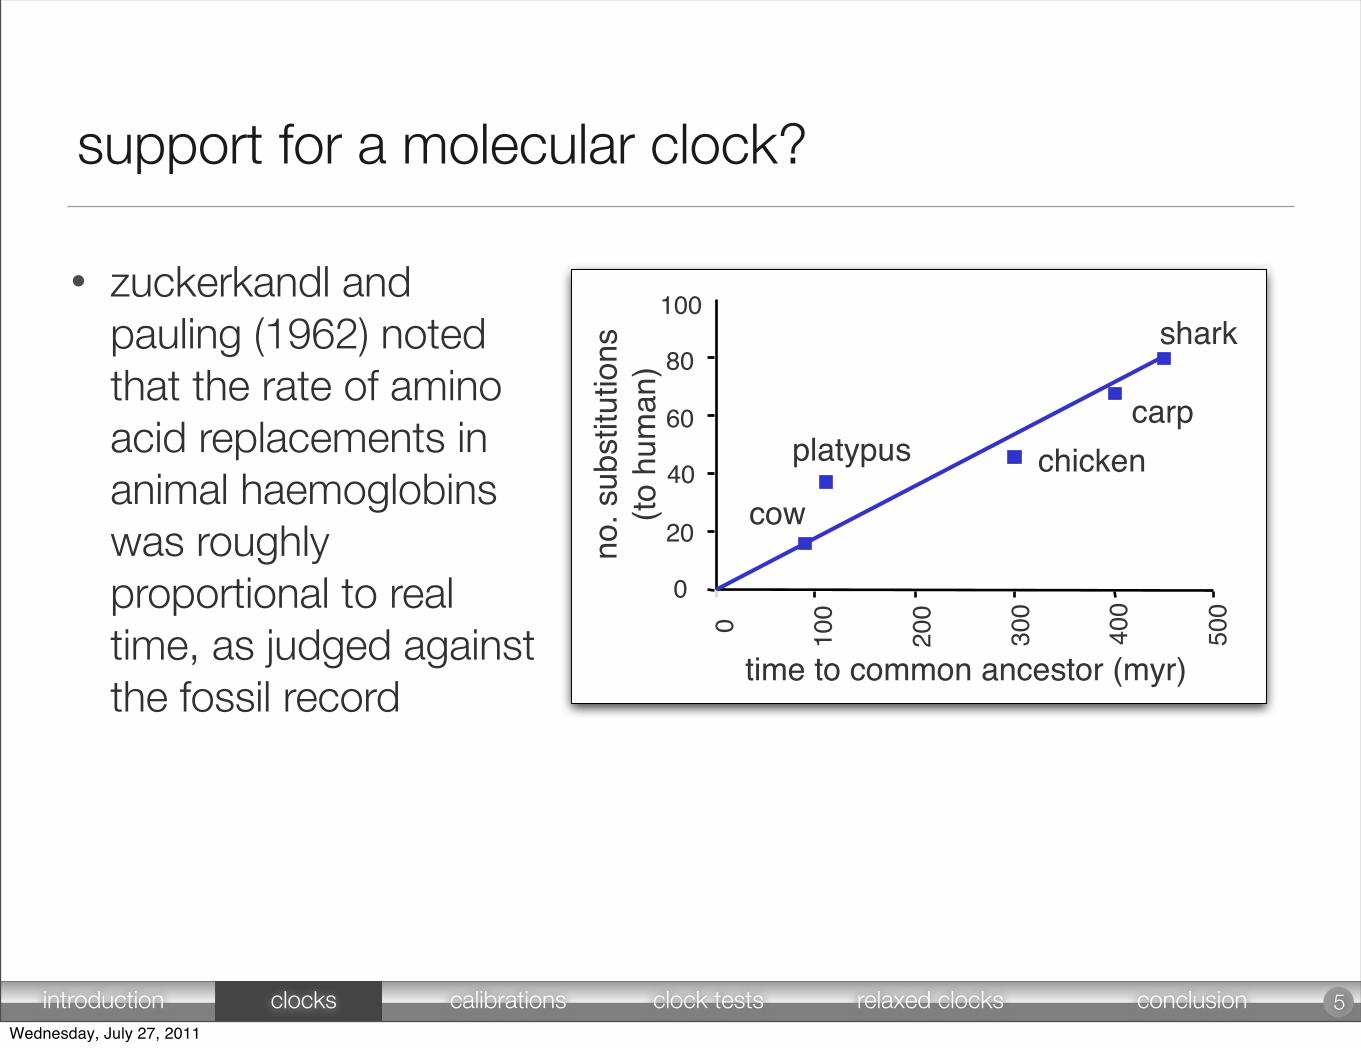
• zuckerkandl and pauling (1962) noted that the rate of amino acid replacements in animal haemoglobins was roughly proportional to real time, as judged against the fossil record
support for a molecular clock?
evol
ving
pop
ulat
ions
0
20
40
60
0 100
200
300
400
500
time to common ancestor (myr)
no. s
ubst
itutio
ns
(to h
uman
)
cow
platypus chickencarp
80
100shark
5introduction clocks calibrations clock tests relaxed clocks conclusionWednesday, July 27, 2011
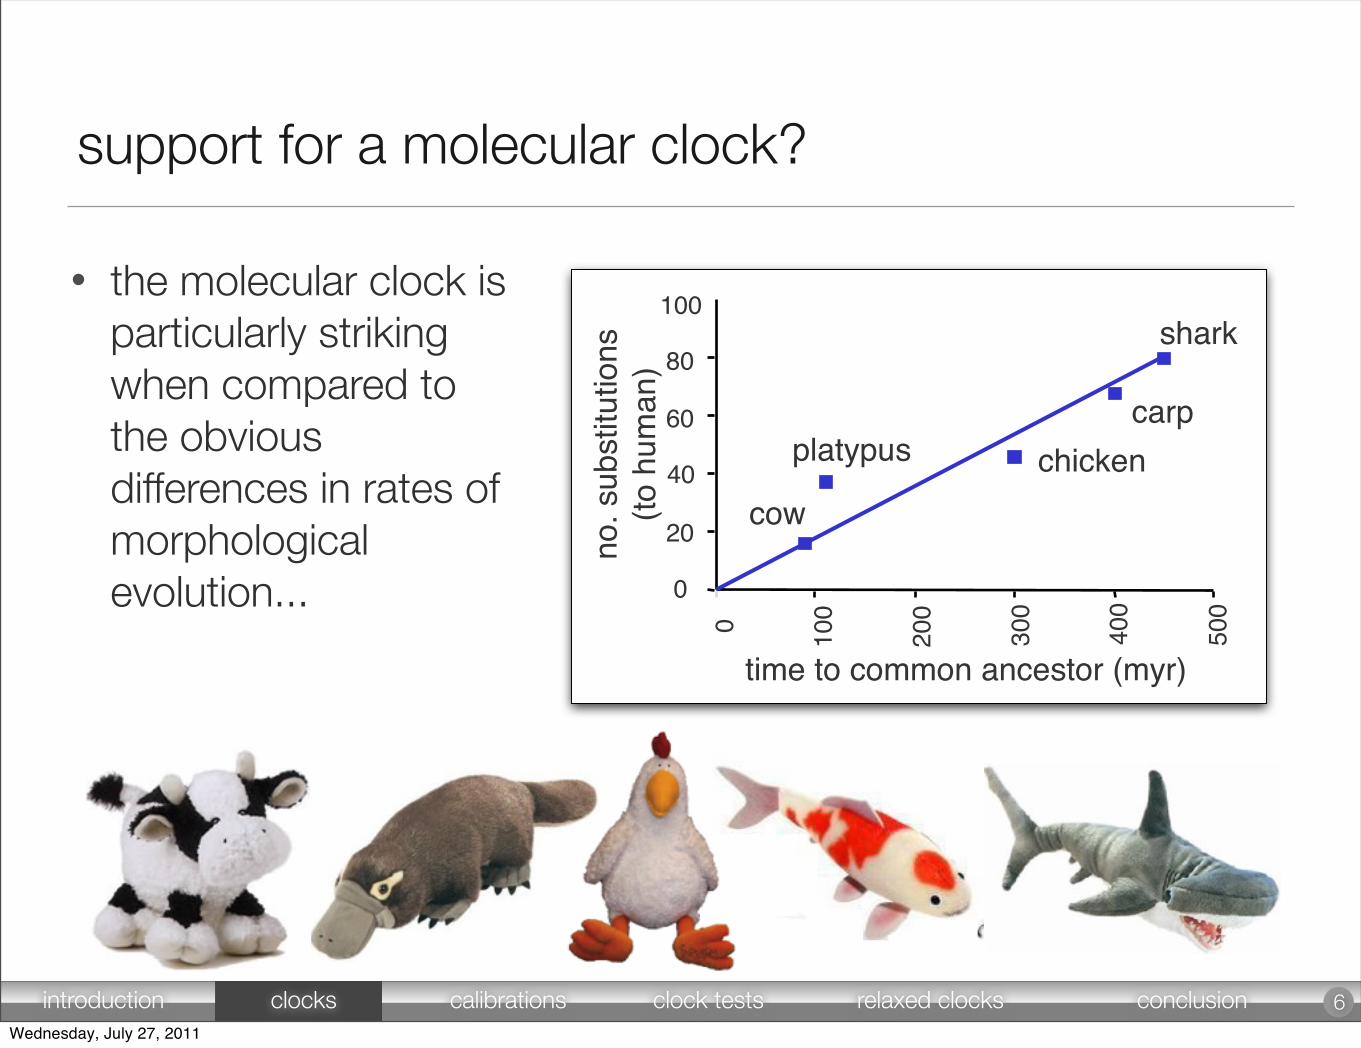
support for a molecular clock?
• the molecular clock is particularly striking when compared to the obvious differences in rates of morphological evolution...
evol
ving
pop
ulat
ions
0
20
40
60
0 100
200
300
400
500
time to common ancestor (myr)
no. s
ubst
itutio
ns
(to h
uman
)
cow
platypus chickencarp
80
100shark
6introduction clocks calibrations clock tests relaxed clocks conclusionWednesday, July 27, 2011
support for a molecular clock?
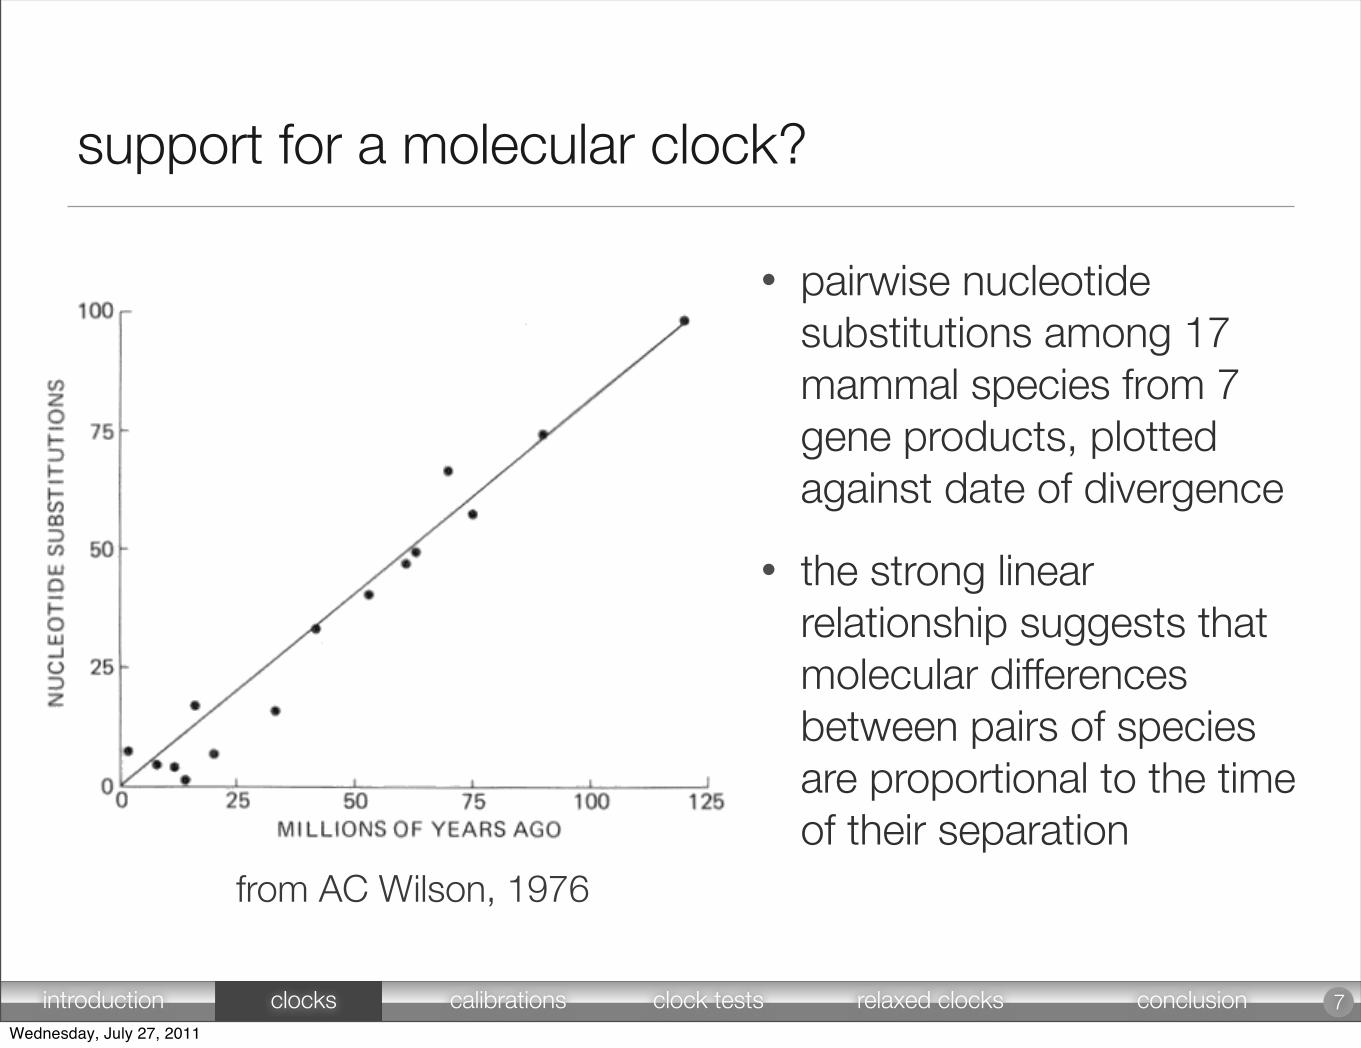
• pairwise nucleotide substitutions among 17 mammal species from 7 gene products, plotted against date of divergence
• the strong linear relationship suggests that molecular differences between pairs of species are proportional to the time of their separation
evol
ving
pop
ulat
ions
from AC Wilson, 1976
7introduction clocks calibrations clock tests relaxed clocks conclusionWednesday, July 27, 2011

support for a molecular clock?
• 8 HIV-1 patients:
8introduction clocks calibrations clock tests relaxed clocks conclusionWednesday, July 27, 2011
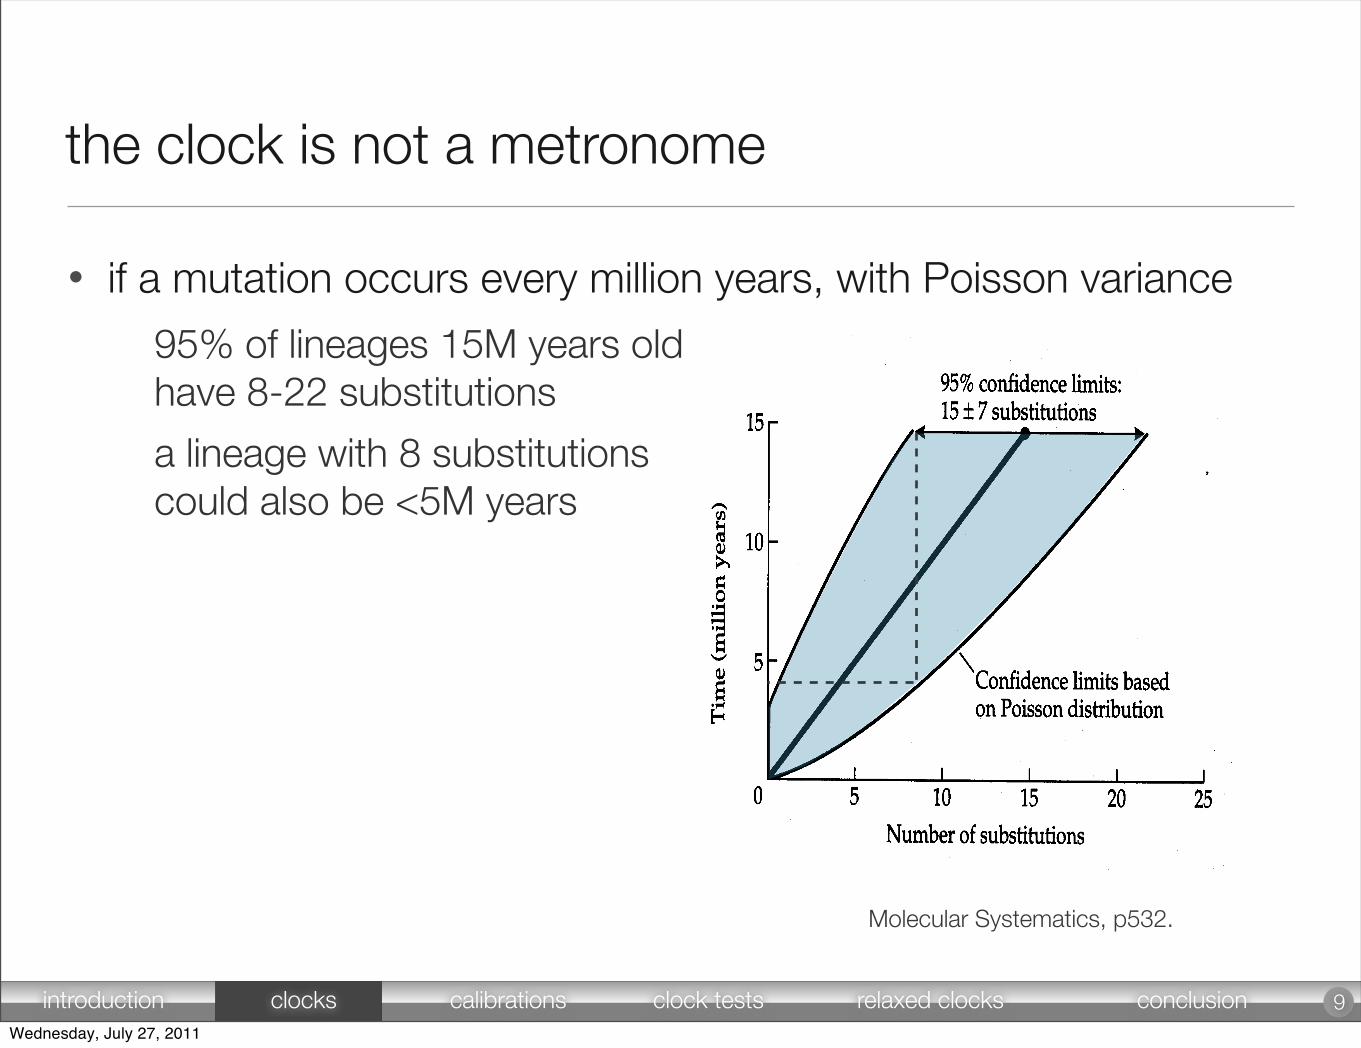
the clock is not a metronome
• if a mutation occurs every million years, with Poisson variance
95% of lineages 15M years old have 8-22 substitutions
a lineage with 8 substitutions could also be <5M years
9
Molecular Systematics, p532.
introduction clocks calibrations clock tests relaxed clocks conclusionWednesday, July 27, 2011
variation in tick rate
Wednesday, July 27, 2011
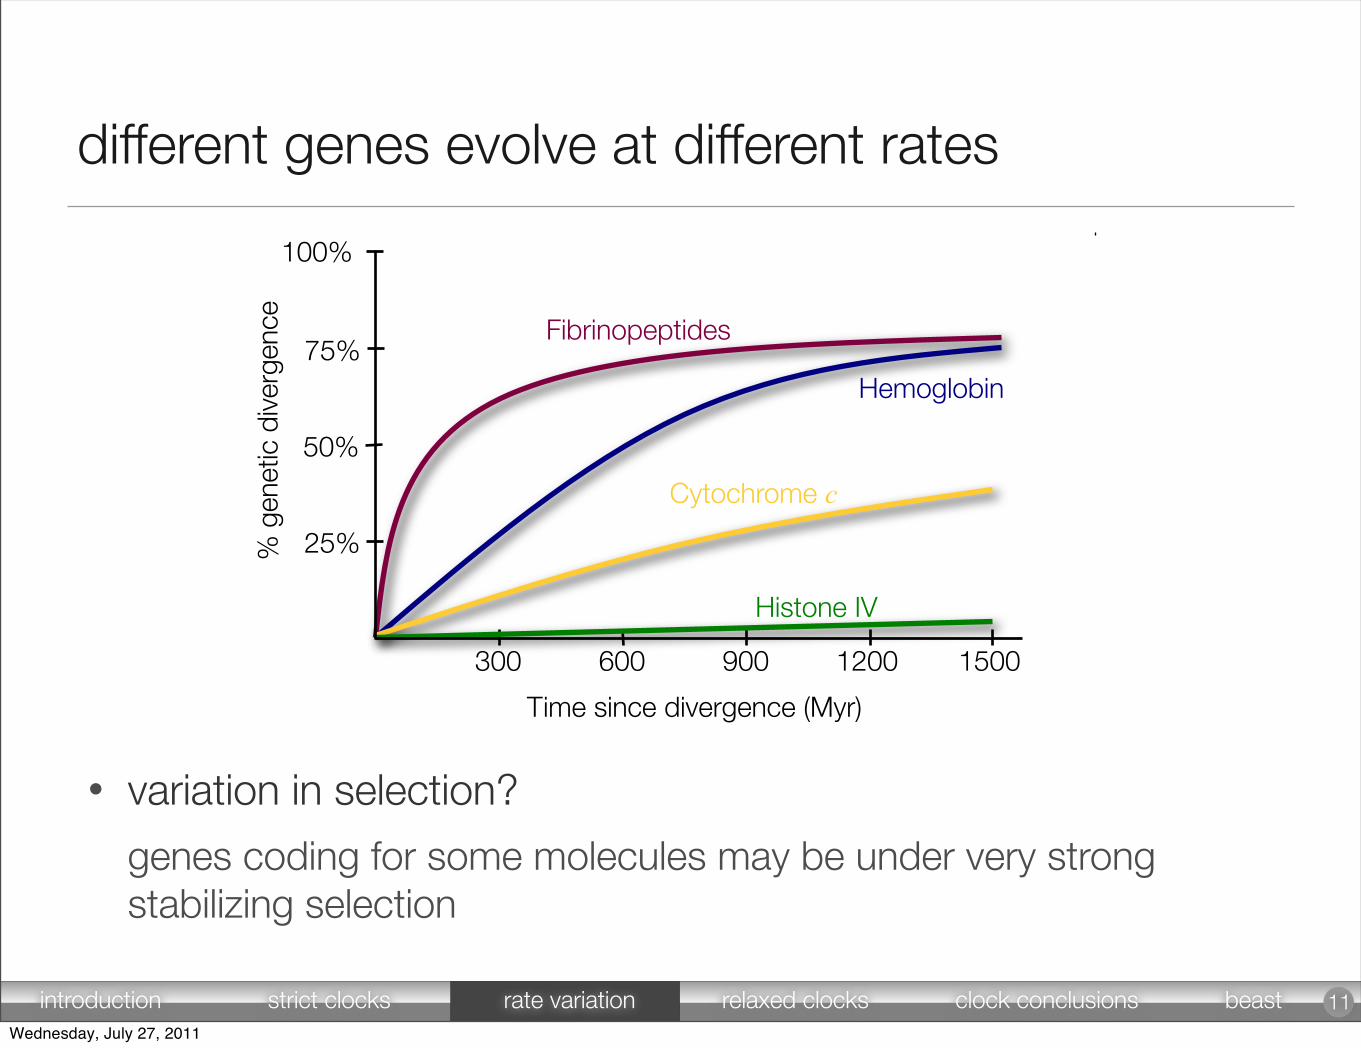
different genes evolve at different rates
% g
enet
ic d
iver
genc
e
Time since divergence (Myr)
100%
50%
75%
25%
1500300 600 900 1200
Fibrinopeptides
Hemoglobin
Cytochrome c
Histone IV
11
• variation in selection?
genes coding for some molecules may be under very strong stabilizing selection
introduction strict clocks rate variation relaxed clocks clock conclusions beastWednesday, July 27, 2011
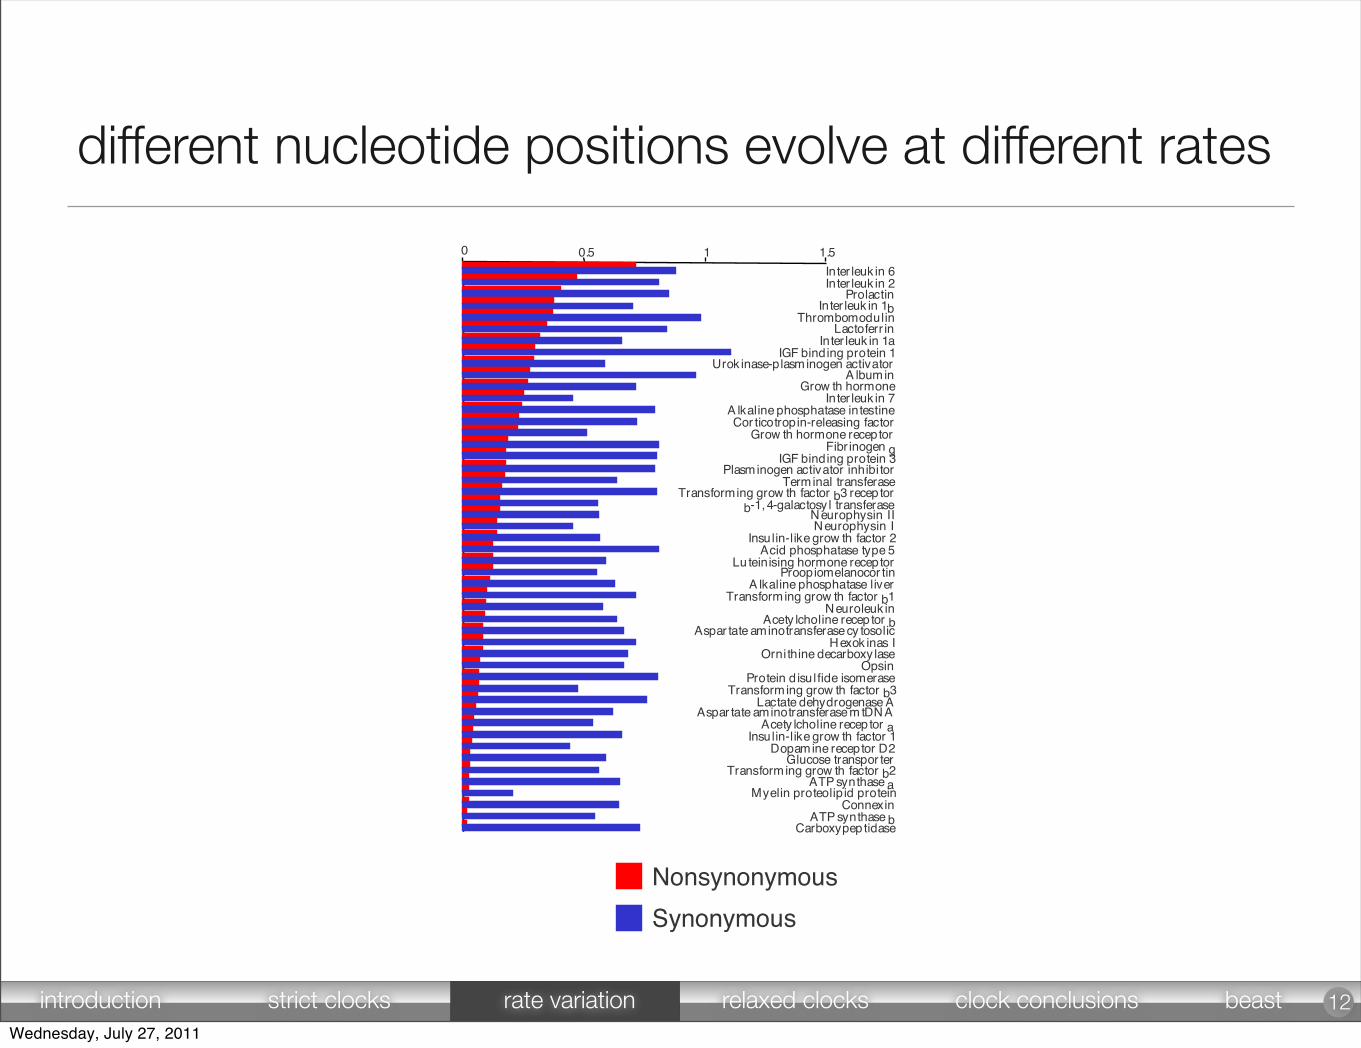
different nucleotide positions evolve at different rates
evol
ving
pop
ulat
ions
Inter leuk in 2Prolactin
Inter leuk in 6
Inter leuk in 1bThrombomodulin
Lactoferr inInter leuk in 1a
IGF binding protein 1Urok inase-plasminogen activator
A lbuminGrow th hormone
Inter leuk in 7A lkaline phosphatase intestineCor ticotropin-releasing factor
Grow th hormone receptorFibr inogen g
IGF binding protein 3Plasminogen activator inhibi tor
Terminal transferaseTransforming grow th factor b3 recep tor
b-1, 4-galactosy l transferaseNeurophysin IINeurophysin I
Insulin-like grow th factor 2Acid phosphatase type 5
Lu teinising hormone receptorProopiomelanocor tin
A lkaline phosphatase liverTransforming grow th factor b1
Neuroleuk inAcety lcholine recep tor b
Aspar tate aminotransferase cy tosolicHexok inas I
Orni thine decarboxy laseOpsin
Protein d isul fide isomeraseTransforming grow th factor b3
Lactate dehydrogenase AAspar tate aminotransferase m tDNA
Acety lcholine recep tor aInsulin-like grow th factor 1
Dopamine receptor D2Glucose transpor ter
Transforming grow th factor b2ATP synthase a
Myelin proteolip id proteinConnexin
ATP synthase bCarboxypep tidase
0 0.5 1 1.5
Nonsynonymous
Synonymous
12introduction strict clocks rate variation relaxed clocks clock conclusions beastWednesday, July 27, 2011

different organisms evolve at different rates
10 10 10 10 10 10 10 10 10-9 -8 -7 -6 -5 -4 -3 -2 -1
nucleotide substitutions per site per yearpl
ant c
hlor
opla
st d
nam
amm
alia
n nu
clea
r dn
ae
coli
and
salm
onel
la e
nter
ica
dros
ophi
la n
ucle
ar d
na
hum
an t
cell
lym
phot
ropi
c vi
rus
hbv
rna
viru
ses
picornaviridae calciviridaeflaviridaetogaviridaecoronaviridaerhabdoviridaeparamyxoviridaeorthomyxoviridaereoviridaebirnaviridaeretroviridae
evol
ving
pop
ulat
ions
13introduction strict clocks rate variation relaxed clocks clock conclusions beastWednesday, July 27, 2011

what causes variation in mutation rate?
14
• differences in generation time
• differences in population size
• differences in selective pressure
• differences in metabolic rate
• differences in efficiency of DNA repair
= mutation rate
= probability of fixation
introduction strict clocks rate variation relaxed clocks clock conclusions beastWednesday, July 27, 2011
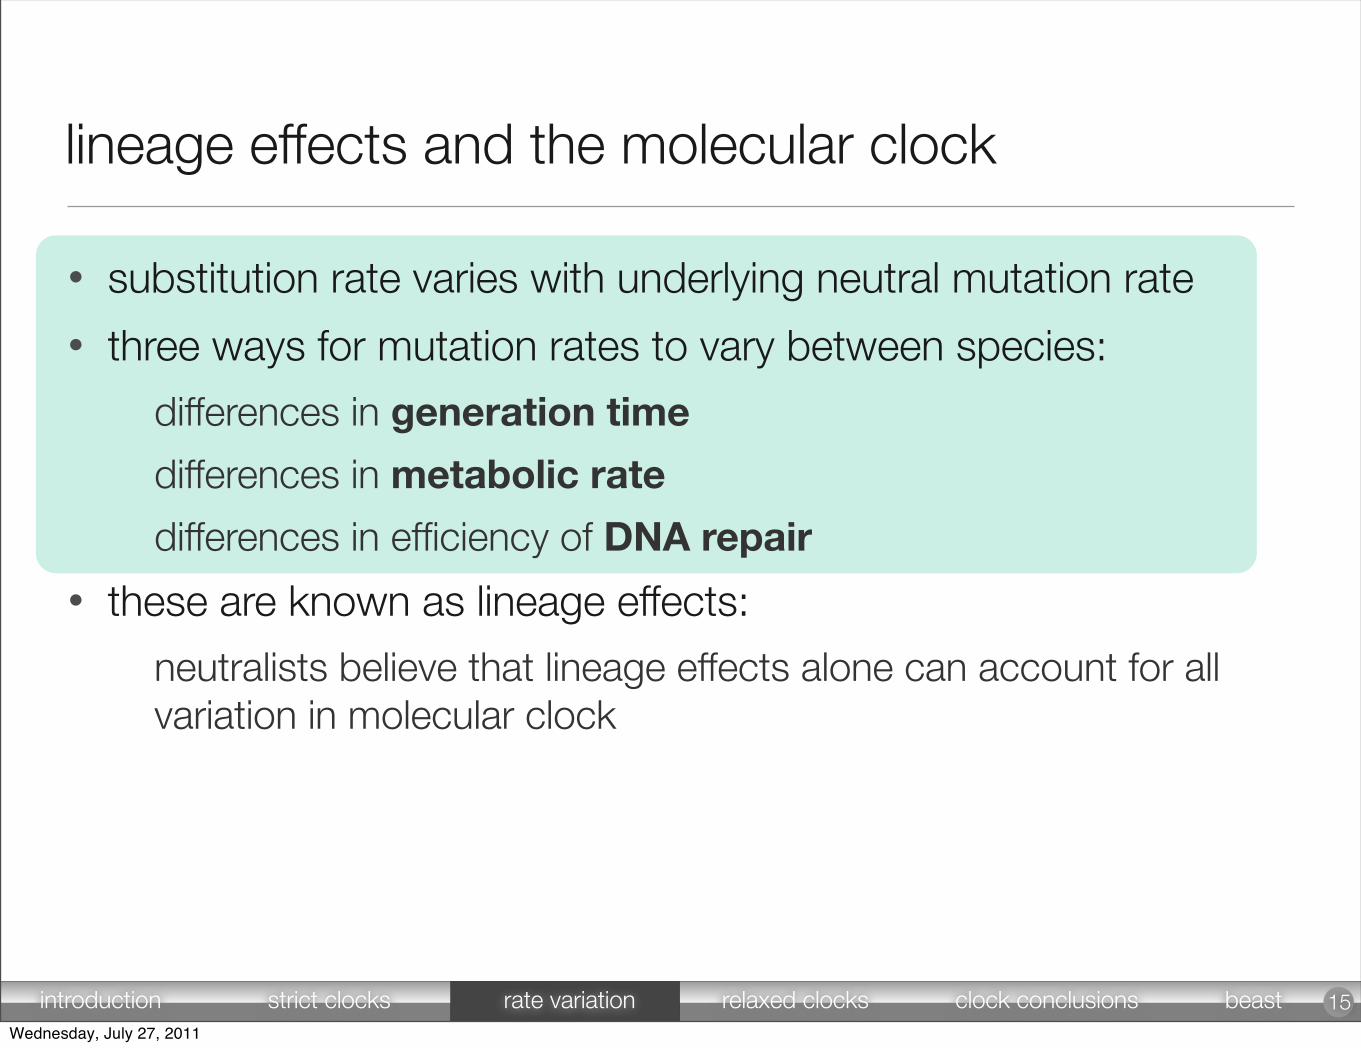
lineage effects and the molecular clock
• substitution rate varies with underlying neutral mutation rate
• three ways for mutation rates to vary between species:
differences in generation time
differences in metabolic rate
differences in efficiency of DNA repair
• these are known as lineage effects:
neutralists believe that lineage effects alone can account for all variation in molecular clock
15introduction strict clocks rate variation relaxed clocks clock conclusions beastWednesday, July 27, 2011
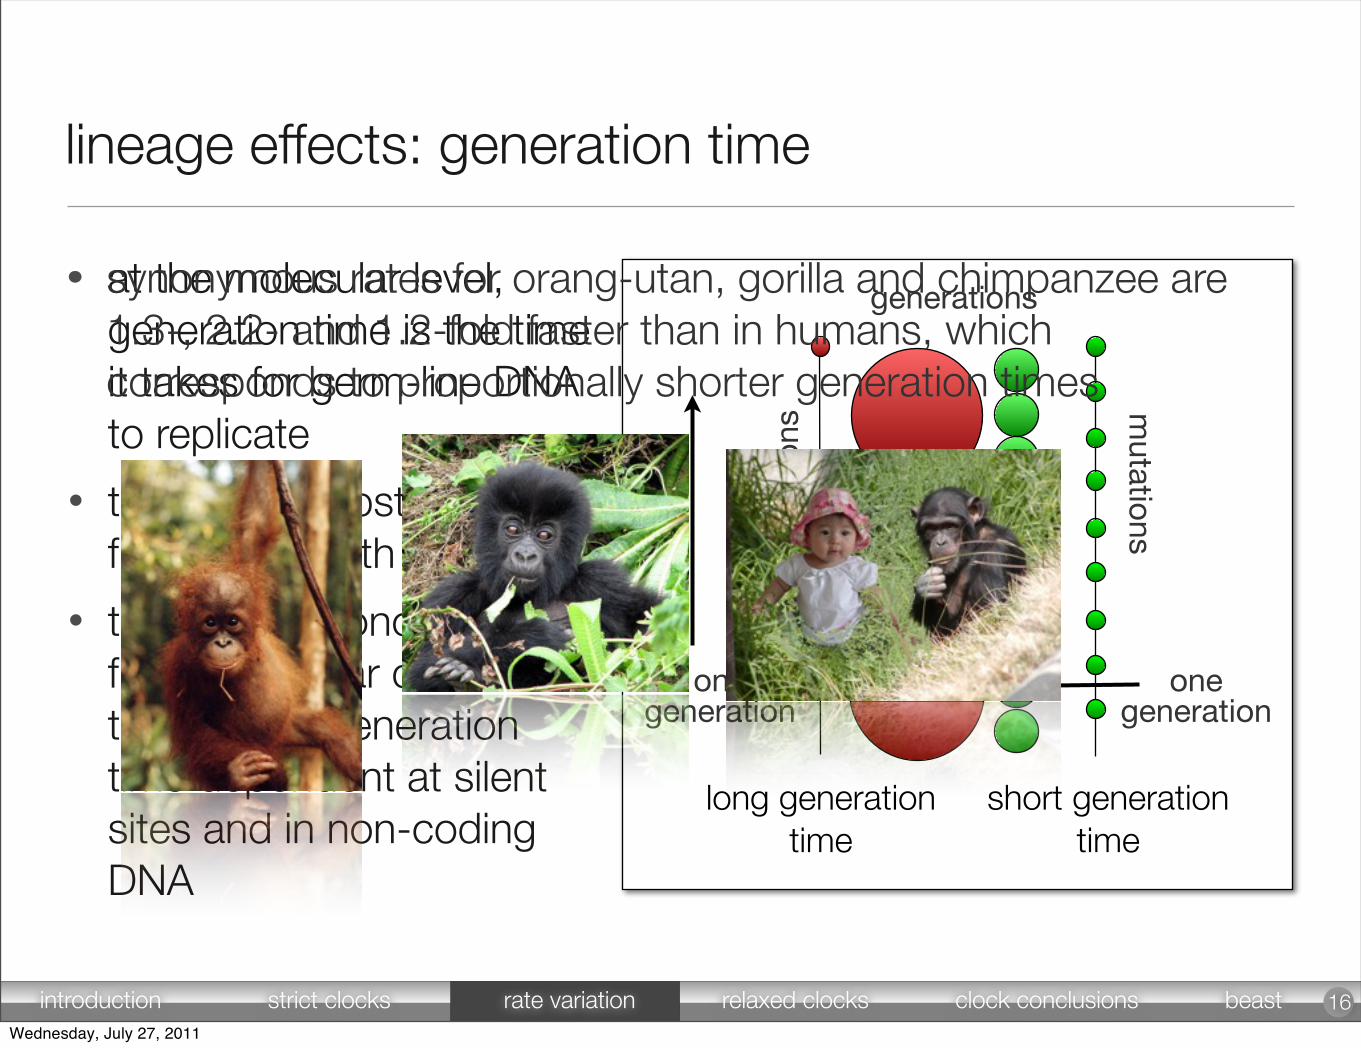
lineage effects: generation time
16
• at the molecular level, generation time is the time it takes for germ-line DNA to replicate
• the rate of substitution is a function of both µ and g
• the general conclusion from molecular data is that the clock is generation time dependent at silent sites and in non-coding DNA
mut
atio
ns
mutations
generations
long generation time
short generation time
time
one generation
one generation
• synonymous rates for orang-utan, gorilla and chimpanzee are 1.3-, 2.2- and 1.2-fold faster than in humans, which corresponds to proportionally shorter generation times
introduction strict clocks rate variation relaxed clocks clock conclusions beastWednesday, July 27, 2011
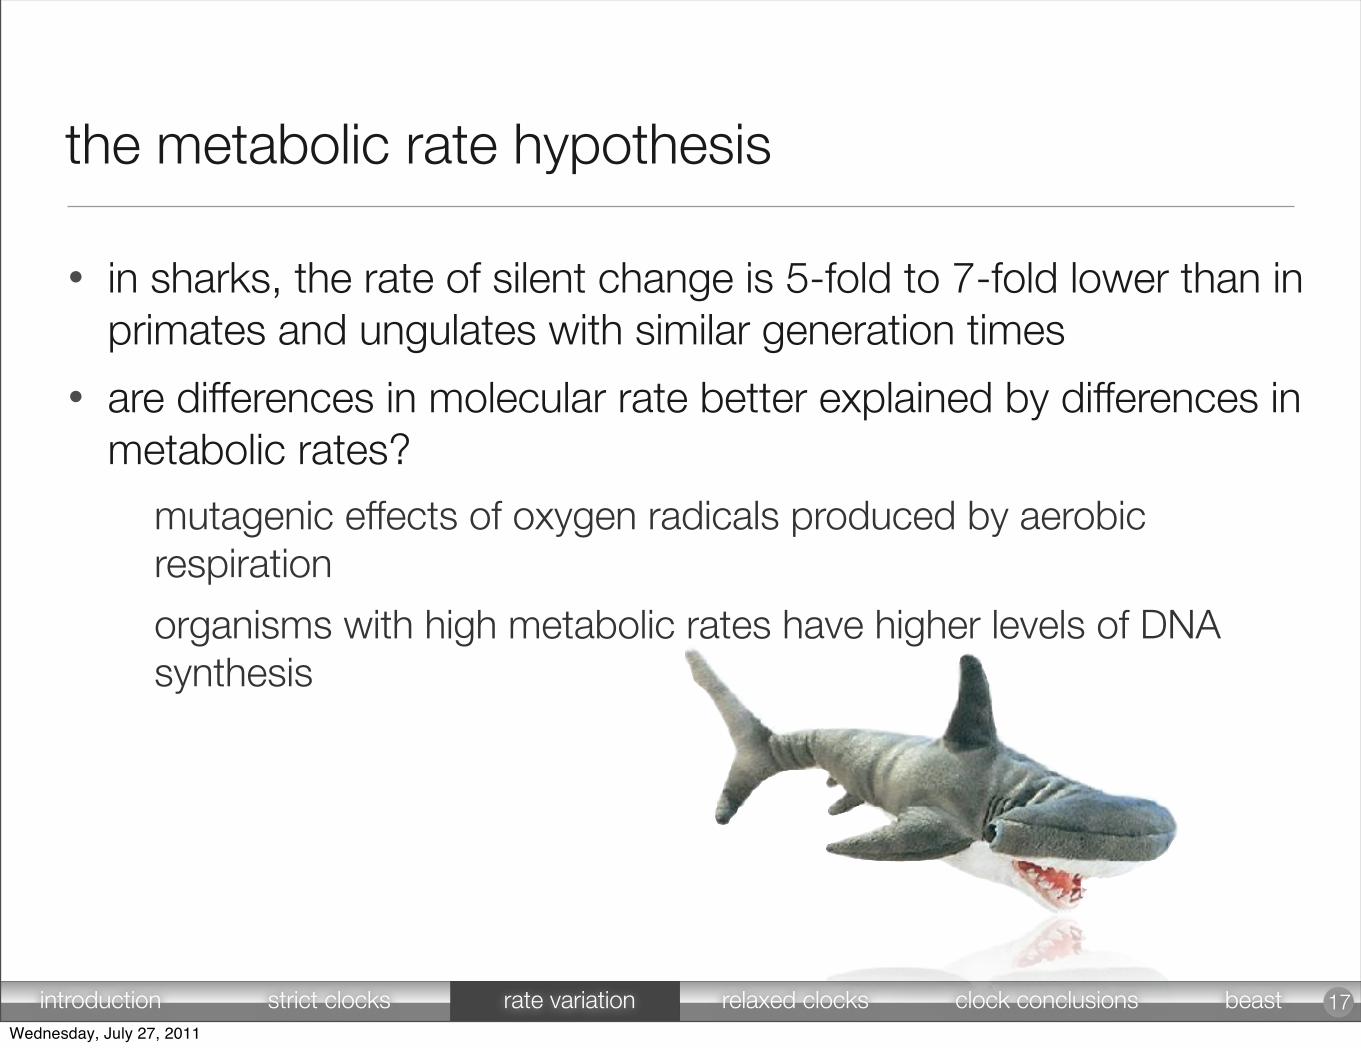
the metabolic rate hypothesis
17
• in sharks, the rate of silent change is 5-fold to 7-fold lower than in primates and ungulates with similar generation times
• are differences in molecular rate better explained by differences in metabolic rates?
mutagenic effects of oxygen radicals produced by aerobic respiration
organisms with high metabolic rates have higher levels of DNA synthesis
introduction strict clocks rate variation relaxed clocks clock conclusions beastWednesday, July 27, 2011
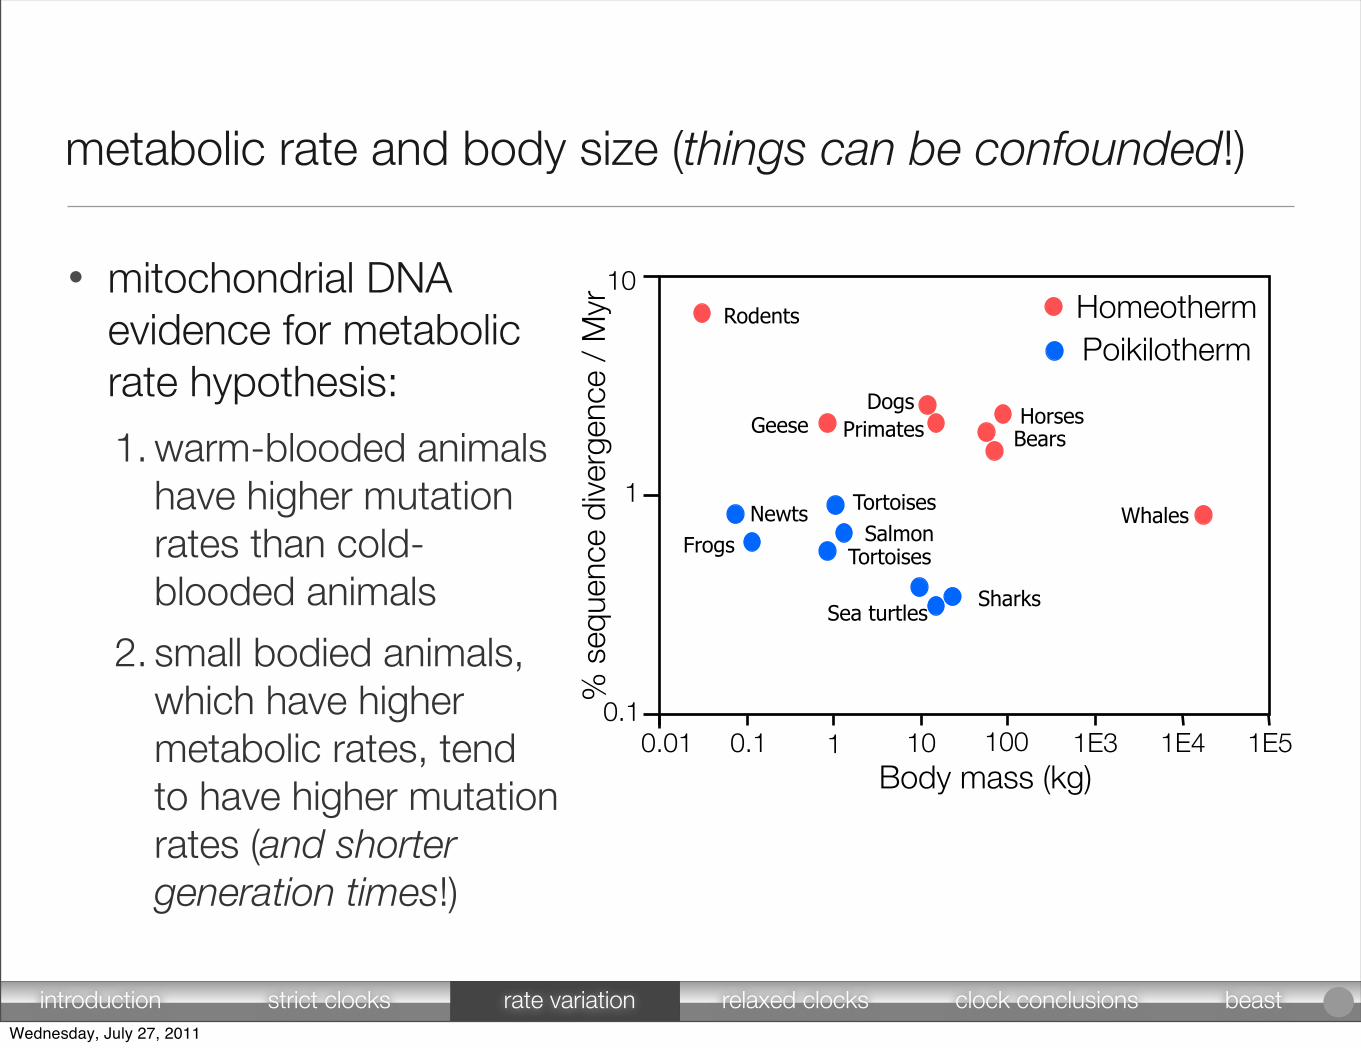
metabolic rate and body size (things can be confounded!)
0.01 0.1 1 10 100 1E3 1E4 1E50.1
1
10
% s
eque
nce
dive
rgen
ce /
Myr
Body mass (kg)
Rodents
GeeseDogs
Primates HorsesBears
WhalesNewtsFrogs
Tortoises
TortoisesSalmon
Sea turtlesSharks
HomeothermPoikilotherm
• mitochondrial DNA evidence for metabolic rate hypothesis:
1. warm-blooded animals have higher mutation rates than cold-blooded animals
2. small bodied animals, which have higher metabolic rates, tend to have higher mutation rates (and shorter generation times!)
introduction strict clocks rate variation relaxed clocks clock conclusions beastWednesday, July 27, 2011

• DNA repair may influence mutation rate
highly transcribed genes are more efficiently repaired
silent rates in mammalian genes tends to be gene- rather than species-specific
however, closely related species such as primates, which share very similar repair mechanisms, can exhibit greatly differing substitution rates
DNA repair and mutation
DNA
Directdamage
Replicationerrors
Repair Incorrectlyrepaired
Correctlyrepaired
Mutation
19introduction strict clocks rate variation relaxed clocks clock conclusions beastWednesday, July 27, 2011
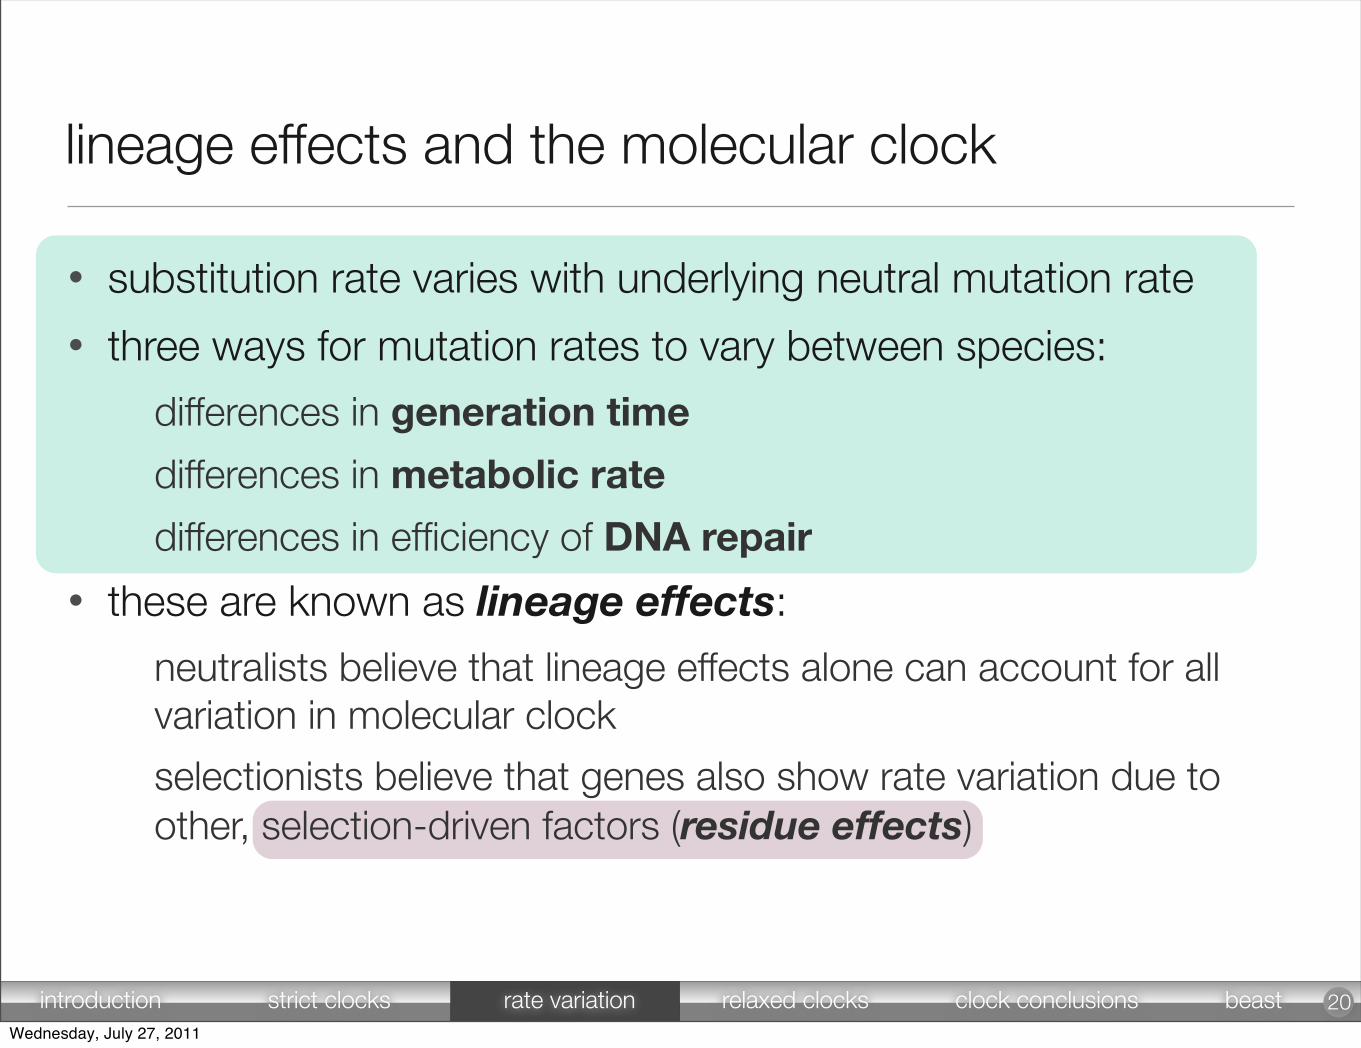
lineage effects and the molecular clock
• substitution rate varies with underlying neutral mutation rate
• three ways for mutation rates to vary between species:
differences in generation time
differences in metabolic rate
differences in efficiency of DNA repair
• these are known as lineage effects:
neutralists believe that lineage effects alone can account for all variation in molecular clock
selectionists believe that genes also show rate variation due to other, selection-driven factors (residue effects)
20introduction strict clocks rate variation relaxed clocks clock conclusions beastWednesday, July 27, 2011
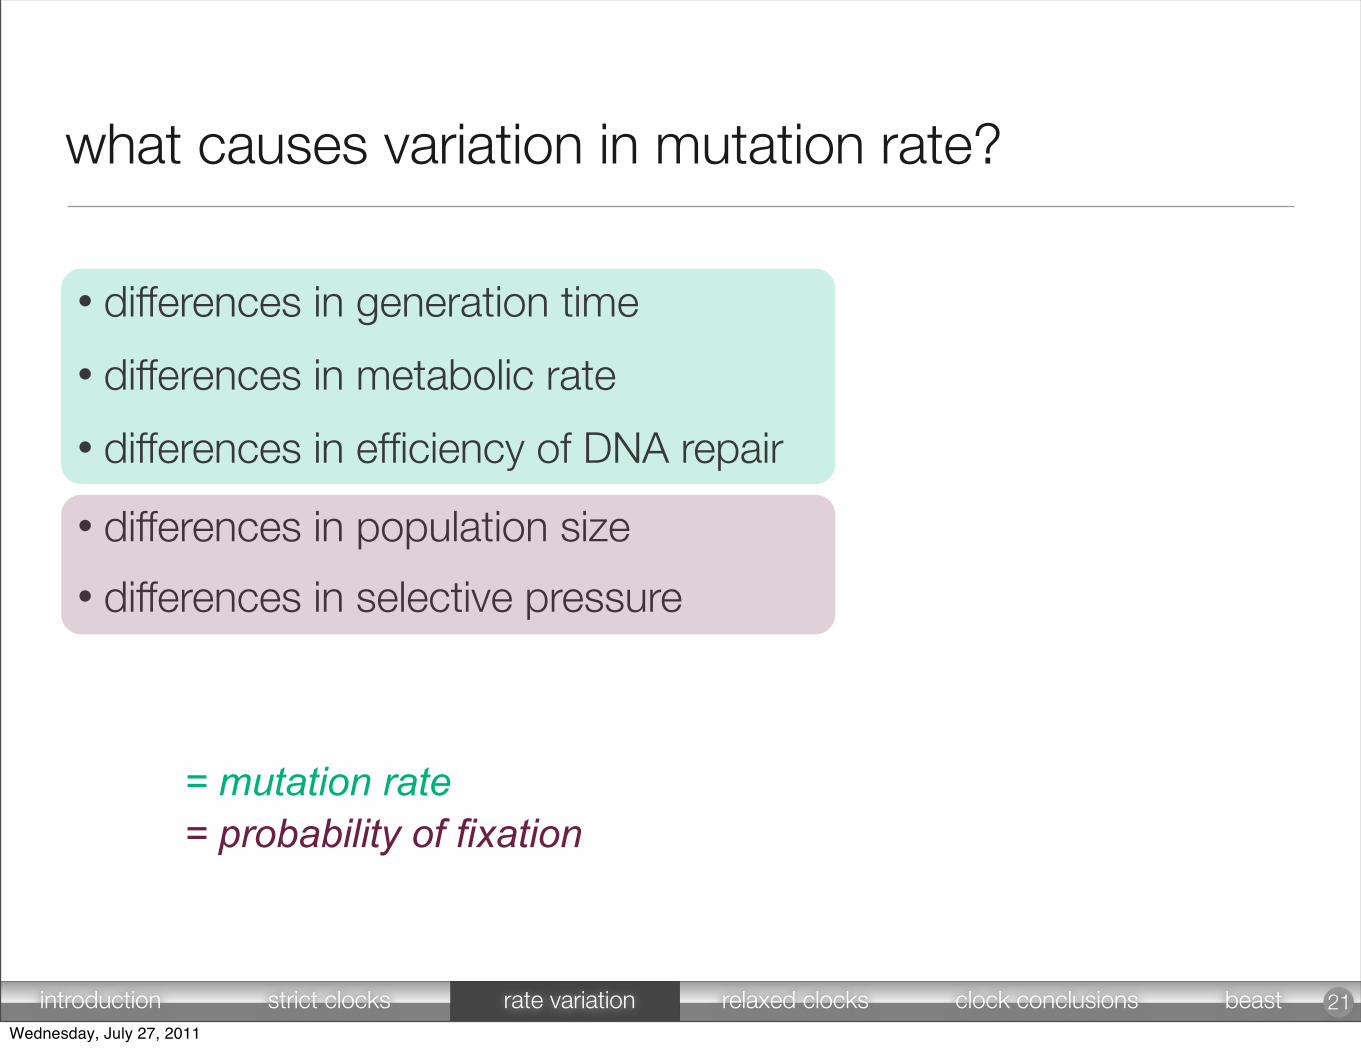
what causes variation in mutation rate?
21
• differences in generation time
• differences in population size
• differences in selective pressure
• differences in metabolic rate
• differences in efficiency of DNA repair
= mutation rate
= probability of fixation
introduction strict clocks rate variation relaxed clocks clock conclusions beastWednesday, July 27, 2011

calibrating the molecular clock
Wednesday, July 27, 2011
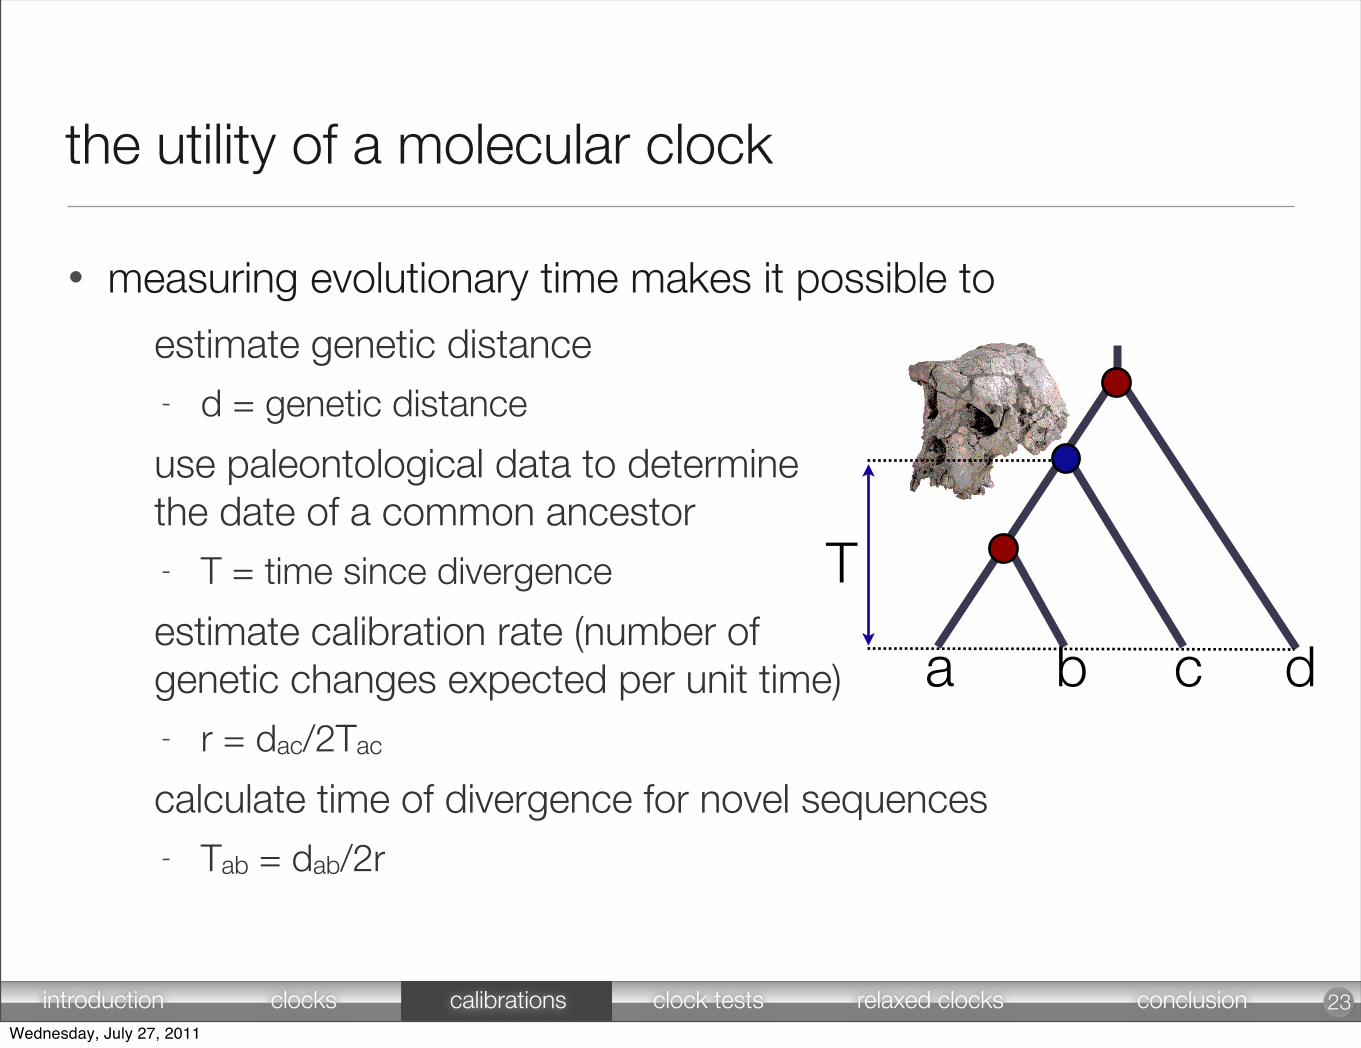
the utility of a molecular clock
• measuring evolutionary time makes it possible to
estimate genetic distance- d = genetic distance
use paleontological data to determine the date of a common ancestor- T = time since divergence
estimate calibration rate (number of genetic changes expected per unit time)- r = dac/2Tac
calculate time of divergence for novel sequences- Tab = dab/2r
23
T
a b c d
introduction clocks calibrations clock tests relaxed clocks conclusionWednesday, July 27, 2011
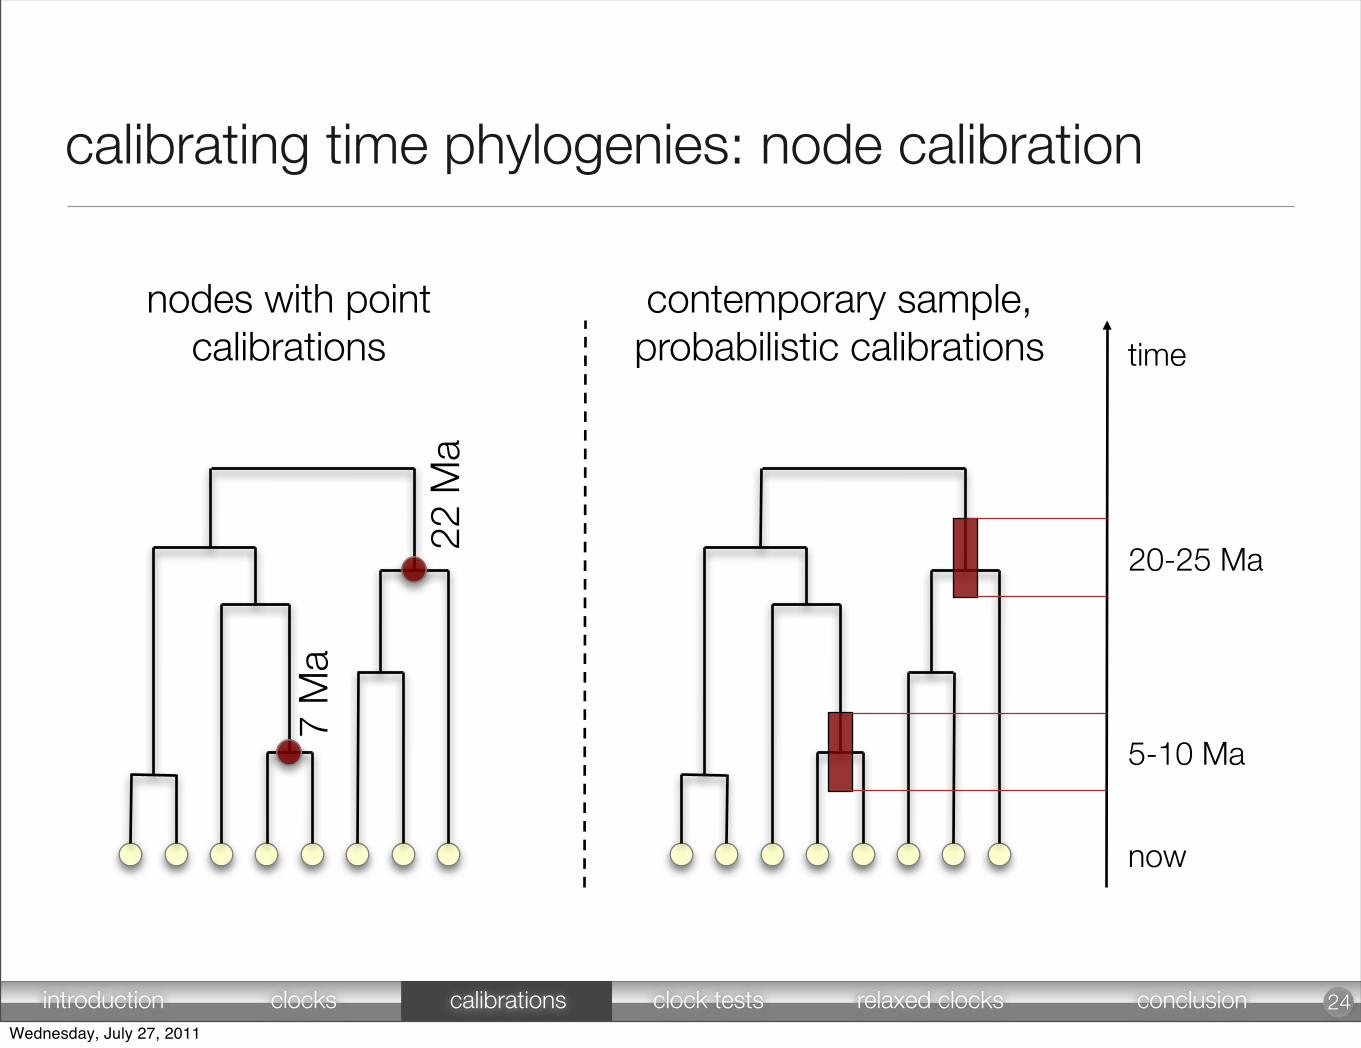
calibrating time phylogenies: node calibration
24
time
now
20-25 Ma
5-10 Ma
nodes with point calibrations
contemporary sample, probabilistic calibrations
7 M
a
22 M
a
introduction clocks calibrations clock tests relaxed clocks conclusionWednesday, July 27, 2011
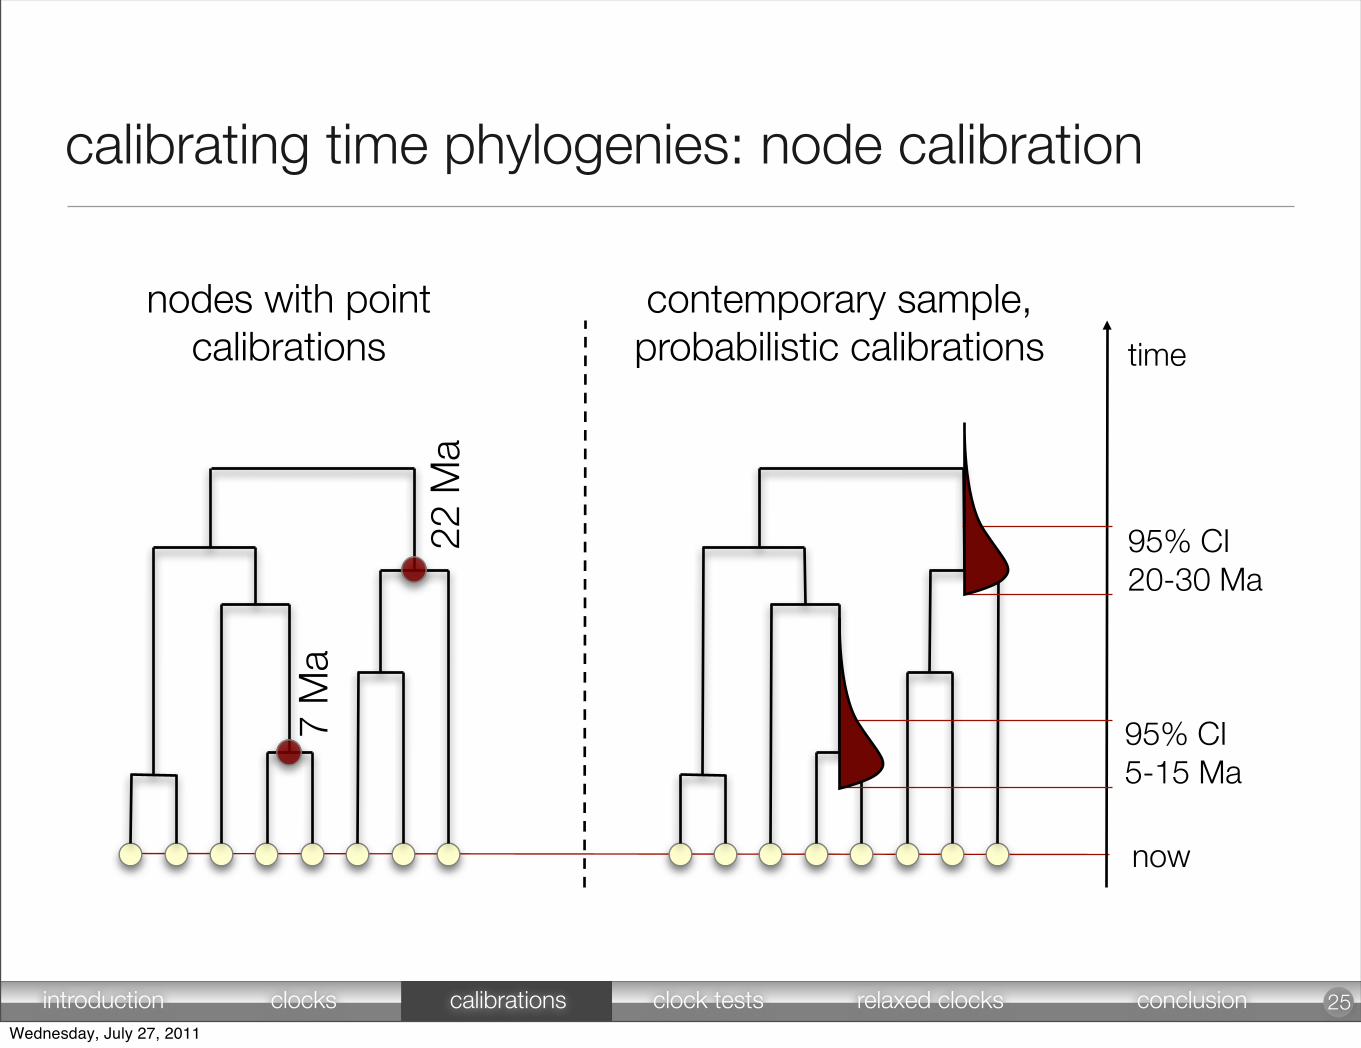
calibrating time phylogenies: node calibration
25
time
now
95% CI20-30 Ma
95% CI5-15 Ma
nodes with point calibrations
contemporary sample, probabilistic calibrations
7 M
a
22 M
a
introduction clocks calibrations clock tests relaxed clocks conclusionWednesday, July 27, 2011

Calibrating a node
hum
an
chim
p
gorill
a
uniform[5.0, 1.5]
foss
il A =
1.5
My
foss
il B =
5.0
My
Wednesday, July 27, 2011
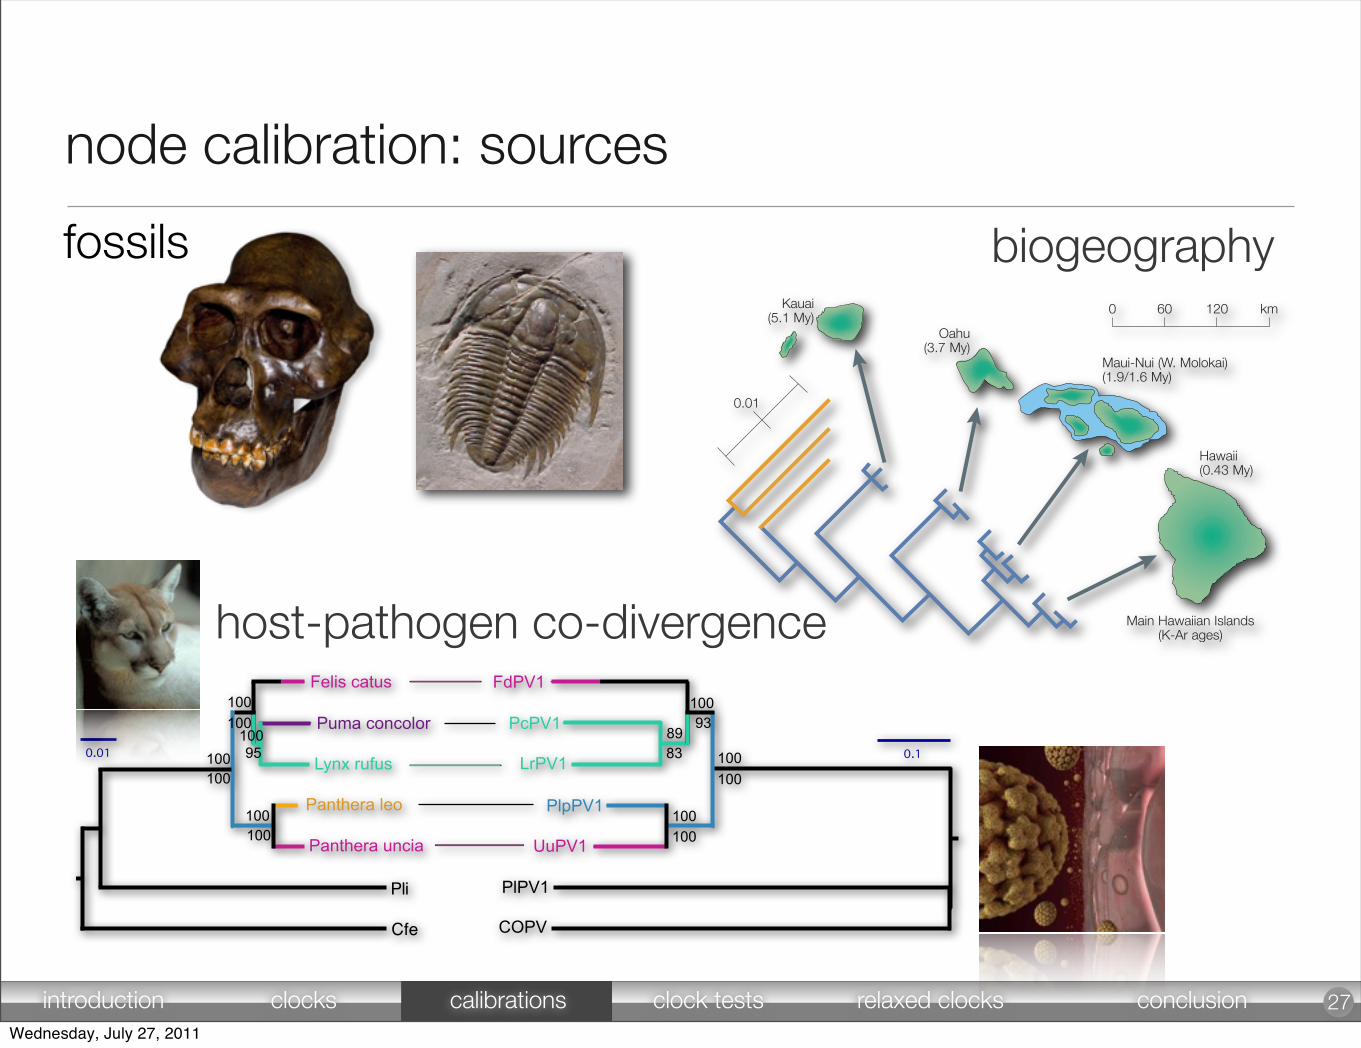
node calibration: sources
27
fossils
introduction clocks calibrations clock tests relaxed clocks conclusion
100
93
83
89
100
100
100
100
100
100
100
100
100
95
100
100
Felis catus
Puma concolor
Lynx rufus
Panthera leo
Panthera uncia
FdPV1
PcPV1
LrPV1
PlpPV1
UuPV1
COPV
PlPV1
biogeography
host-pathogen co-divergence
Wednesday, July 27, 2011
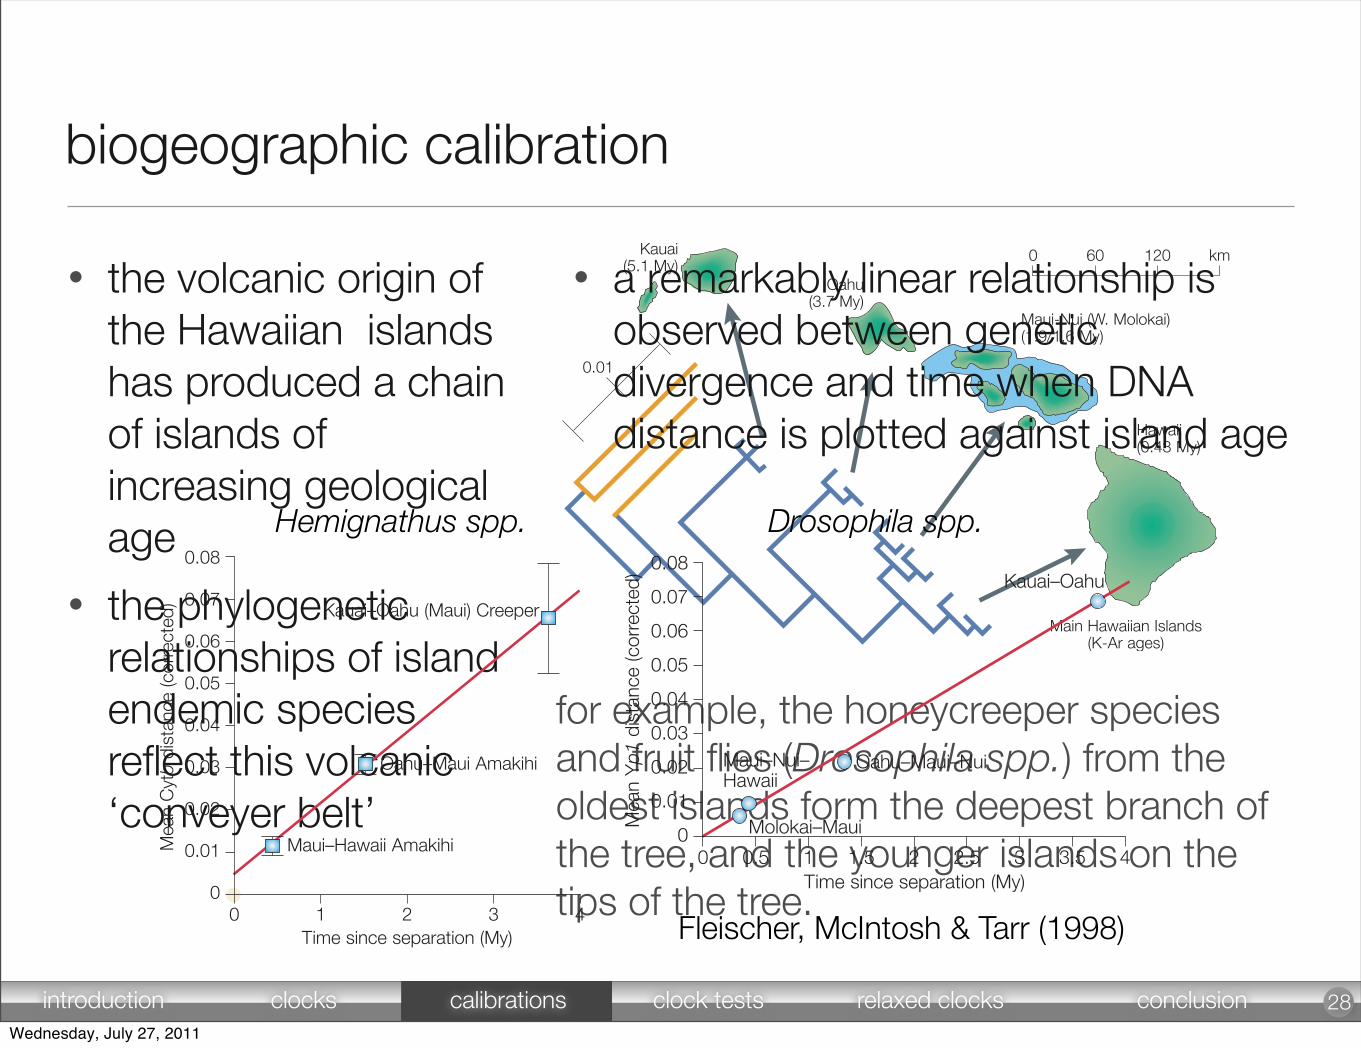
biogeographic calibration
• the volcanic origin of the Hawaiian islands has produced a chain of islands of increasing geological age
• the phylogenetic relationships of island endemic species reflect this volcanic ‘conveyer belt’
28
for example, the honeycreeper species and fruit flies (Drosophila spp.) from the oldest islands form the deepest branch of the tree, and the younger islands on the tips of the tree.
Hemignathus spp. Drosophila spp.
Fleischer, McIntosh & Tarr (1998)
• a remarkably linear relationship is observed between genetic divergence and time when DNA distance is plotted against island age
introduction clocks calibrations clock tests relaxed clocks conclusionWednesday, July 27, 2011
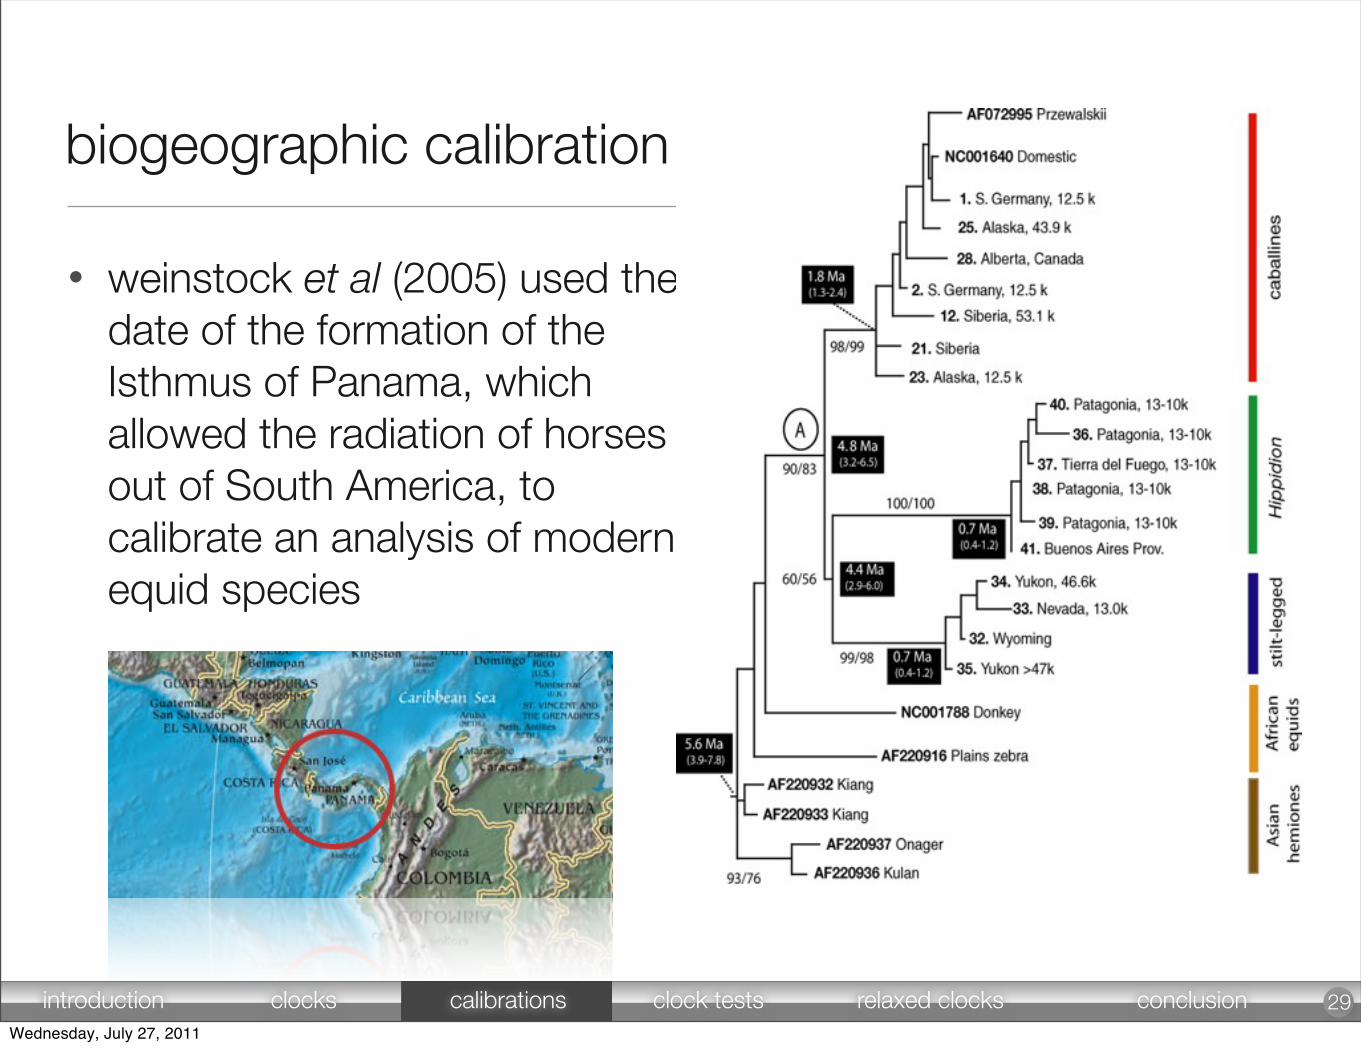
• weinstock et al (2005) used the date of the formation of the Isthmus of Panama, which allowed the radiation of horses out of South America, to calibrate an analysis of modern equid species
29
biogeographic calibration
introduction clocks calibrations clock tests relaxed clocks conclusionWednesday, July 27, 2011
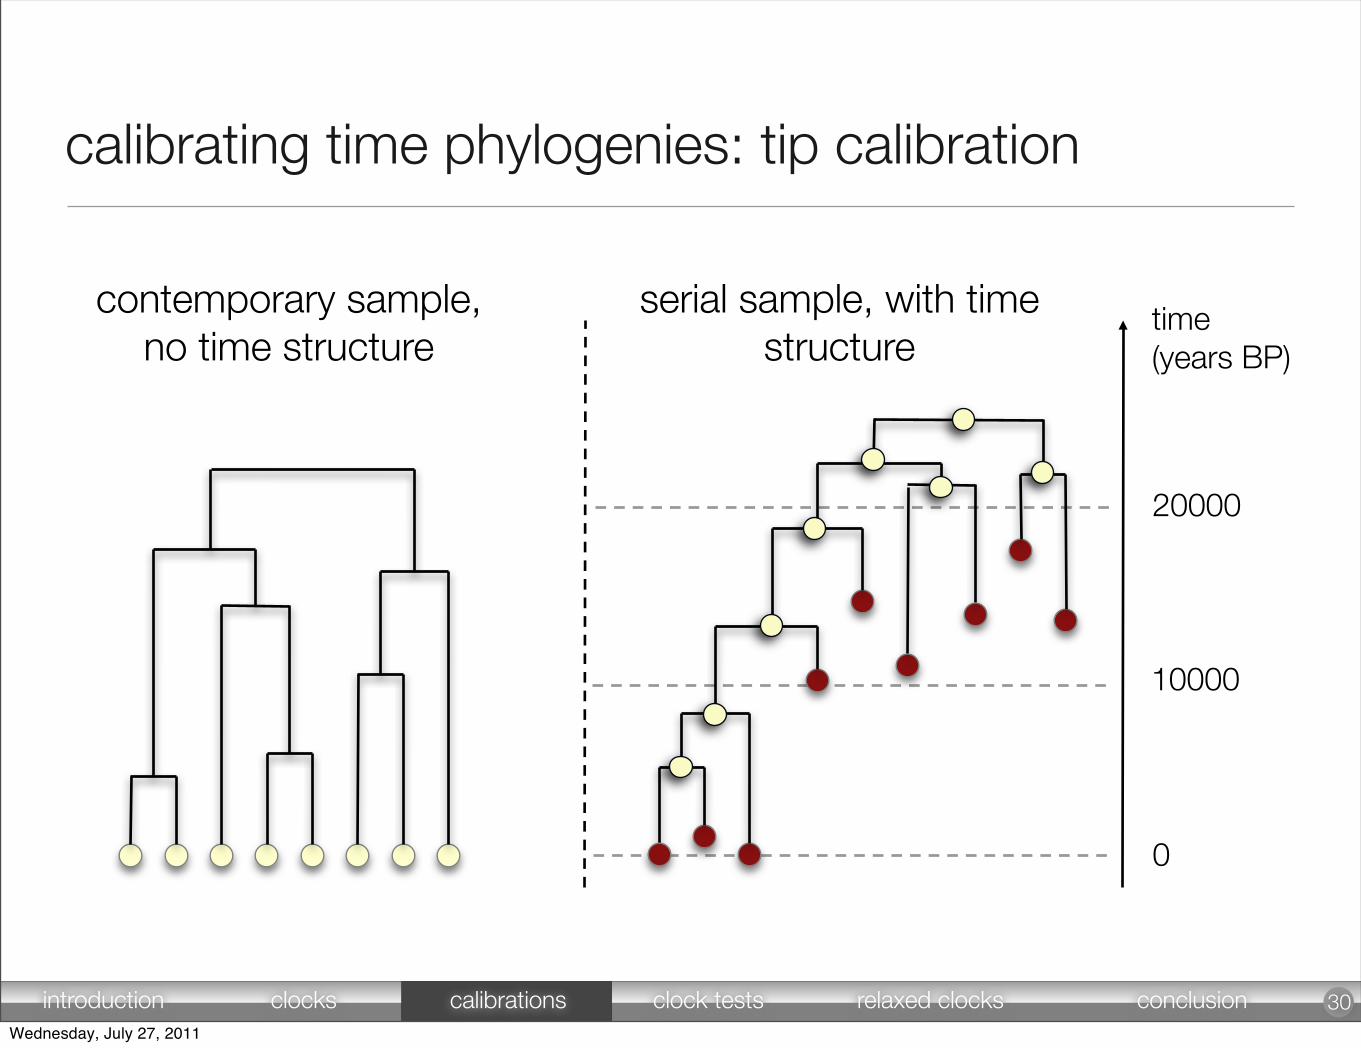
calibrating time phylogenies: tip calibration
30
time (years BP)
0
20000
10000
contemporary sample, no time structure
serial sample, with time structure
introduction clocks calibrations clock tests relaxed clocks conclusionWednesday, July 27, 2011

calibrating the clock with tips
• 2 major sources:
31
1. ancient DNA
large data sets of radiocarbon-dated specimens
2. RNA viruses
evolve quickly: 10-3 - 10-5 substitutions per site per year.
Measurably evolvin
g
population
introduction clocks calibrations clock tests relaxed clocks conclusionWednesday, July 27, 2011
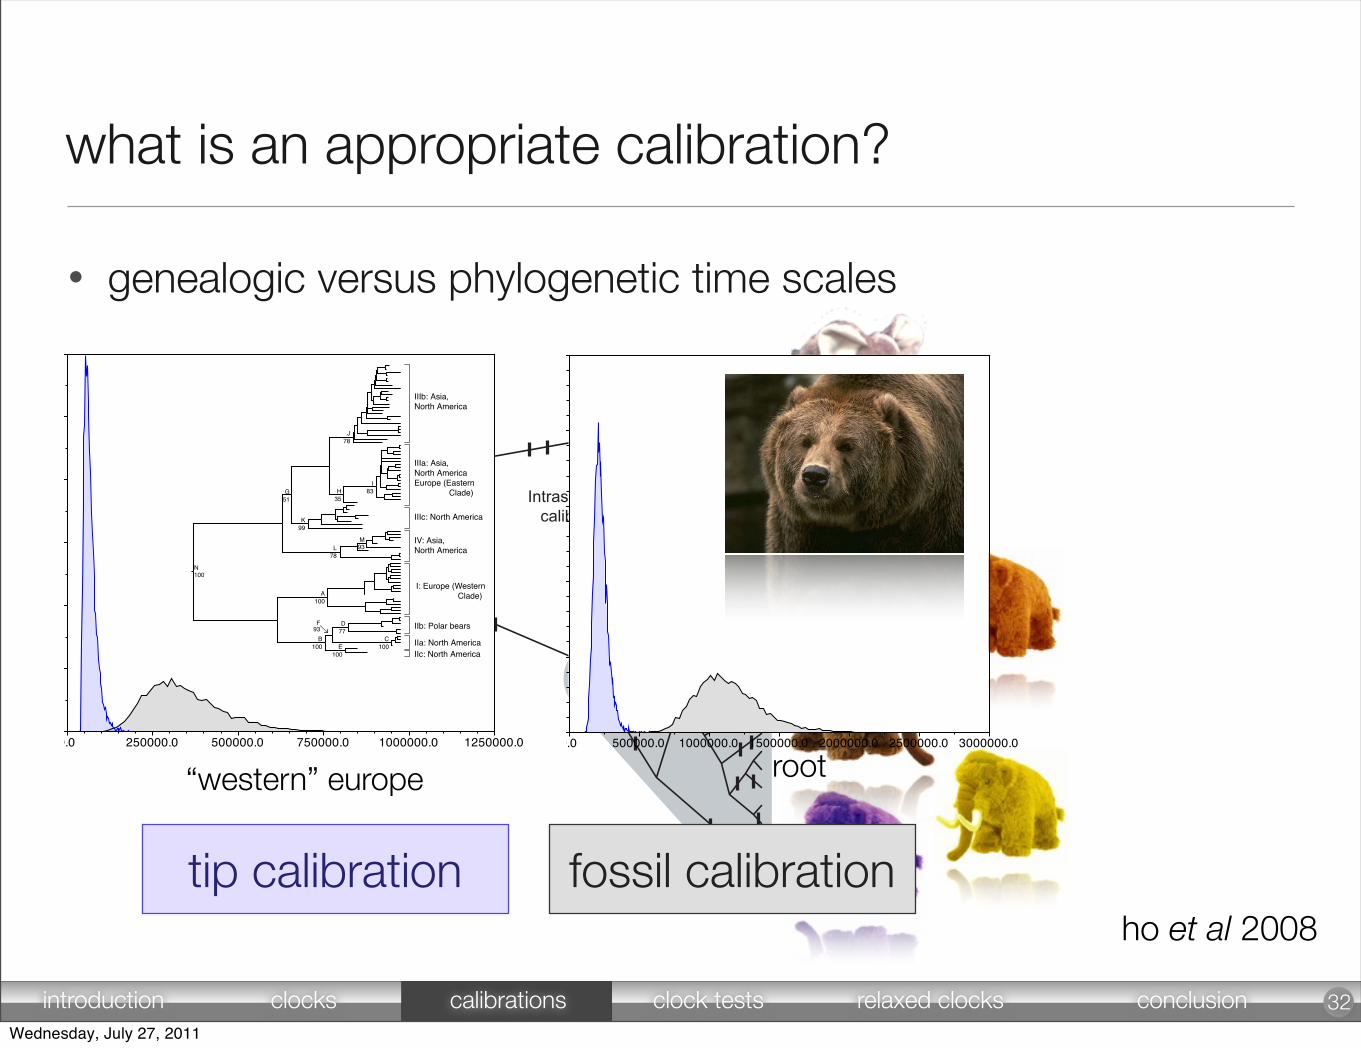
• genealogic versus phylogenetic time scales
what is an appropriate calibration?
32
STUDYSPECIES
OUTGROUPSPECIES
Intraspecificcalibration
Extraspecificcalibration
treeModel.rootHeight
0.0 500000.0 1000000.0 1500000.0 2000000.0 2500000.0 3000000.00.0
0.0000025
0.000005
0.0000075
0.00001
0.0000125
root“western” europetmrca(clade1)
0.0 250000.0 500000.0 750000.0 1000000.0 1250000.00.0
0.000005
0.00001
0.000015
0.00002
0.000025
0.00003
fossil calibrationtip calibrationho et al 2008
introduction clocks calibrations clock tests relaxed clocks conclusionWednesday, July 27, 2011
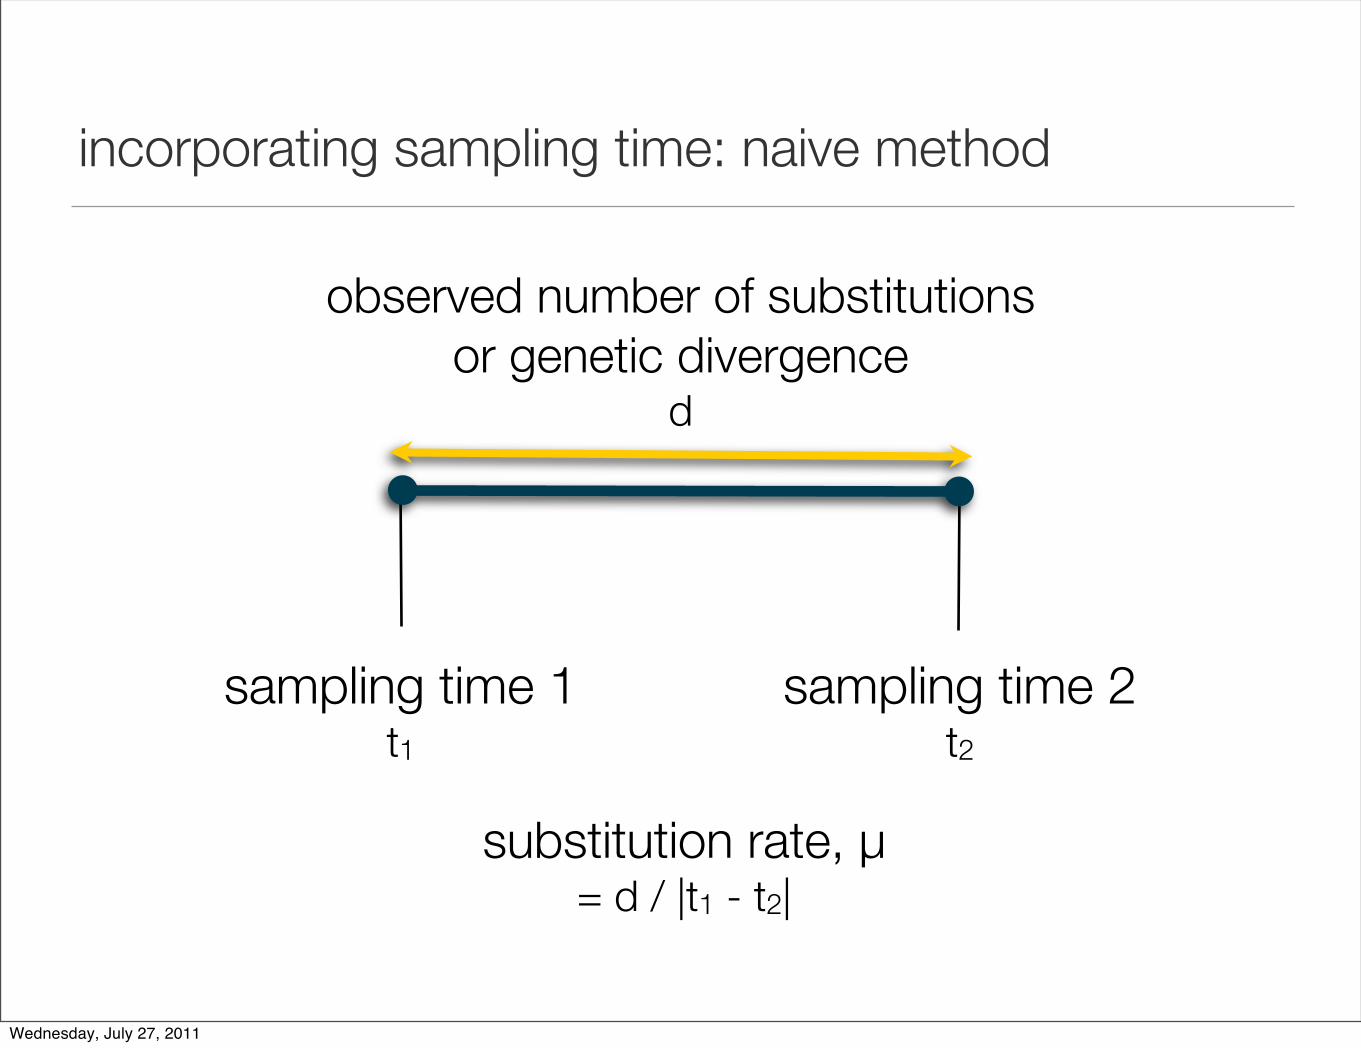
incorporating sampling time: naive method
sampling time 1t1
sampling time 2t2
observed number of substitutions or genetic divergence
d
substitution rate, µ = d / |t1 - t2|
Wednesday, July 27, 2011
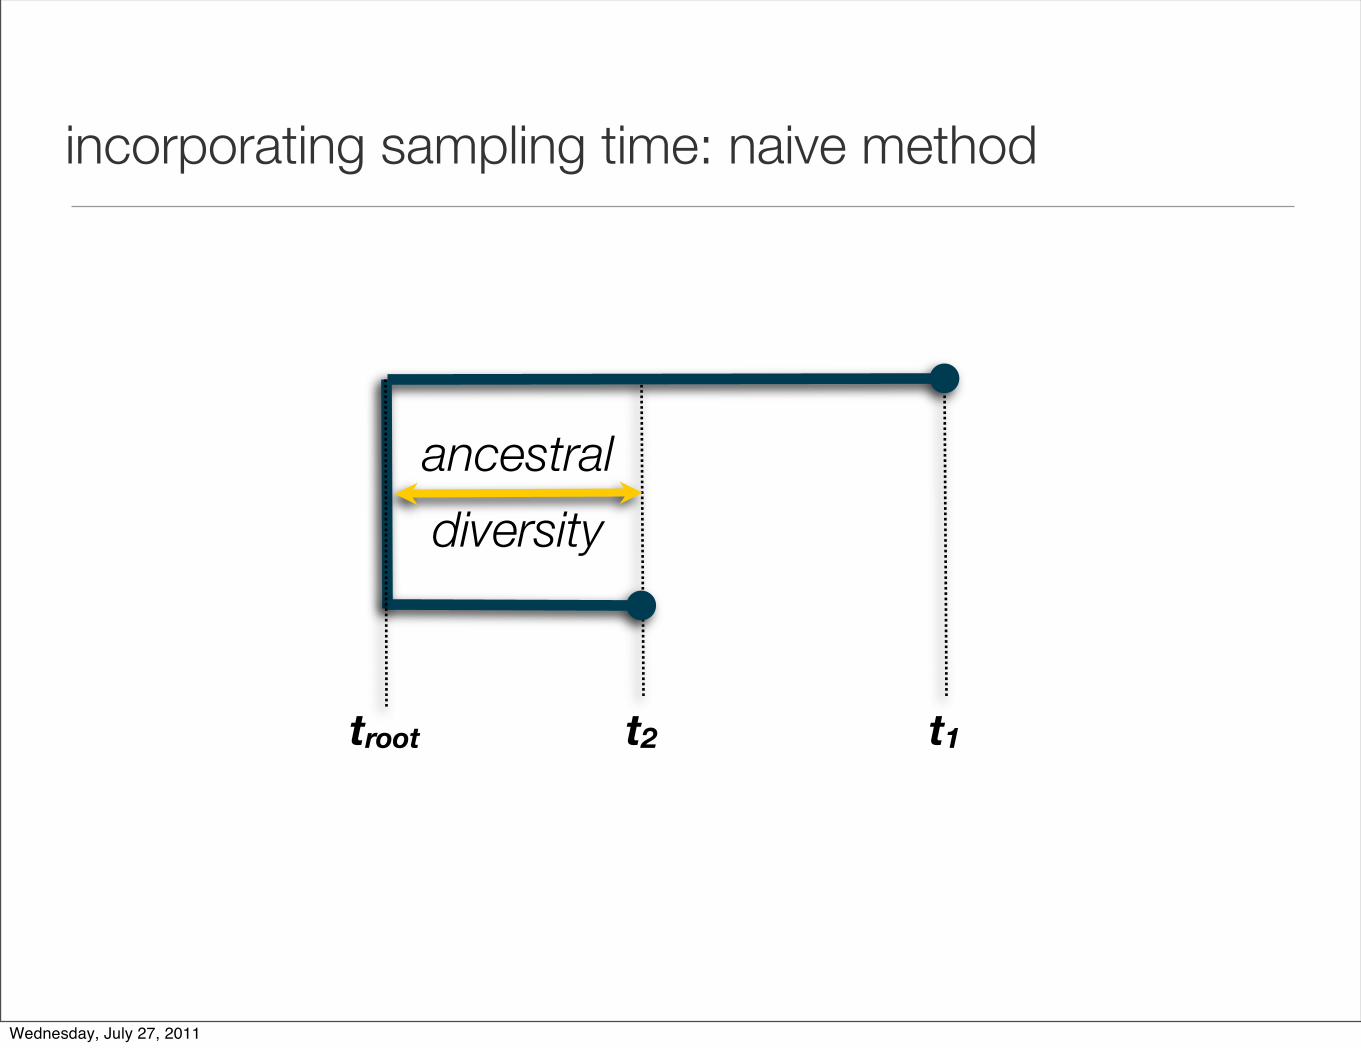
incorporating sampling time: naive method
ancestral
diversity
troot t2 t1
Wednesday, July 27, 2011
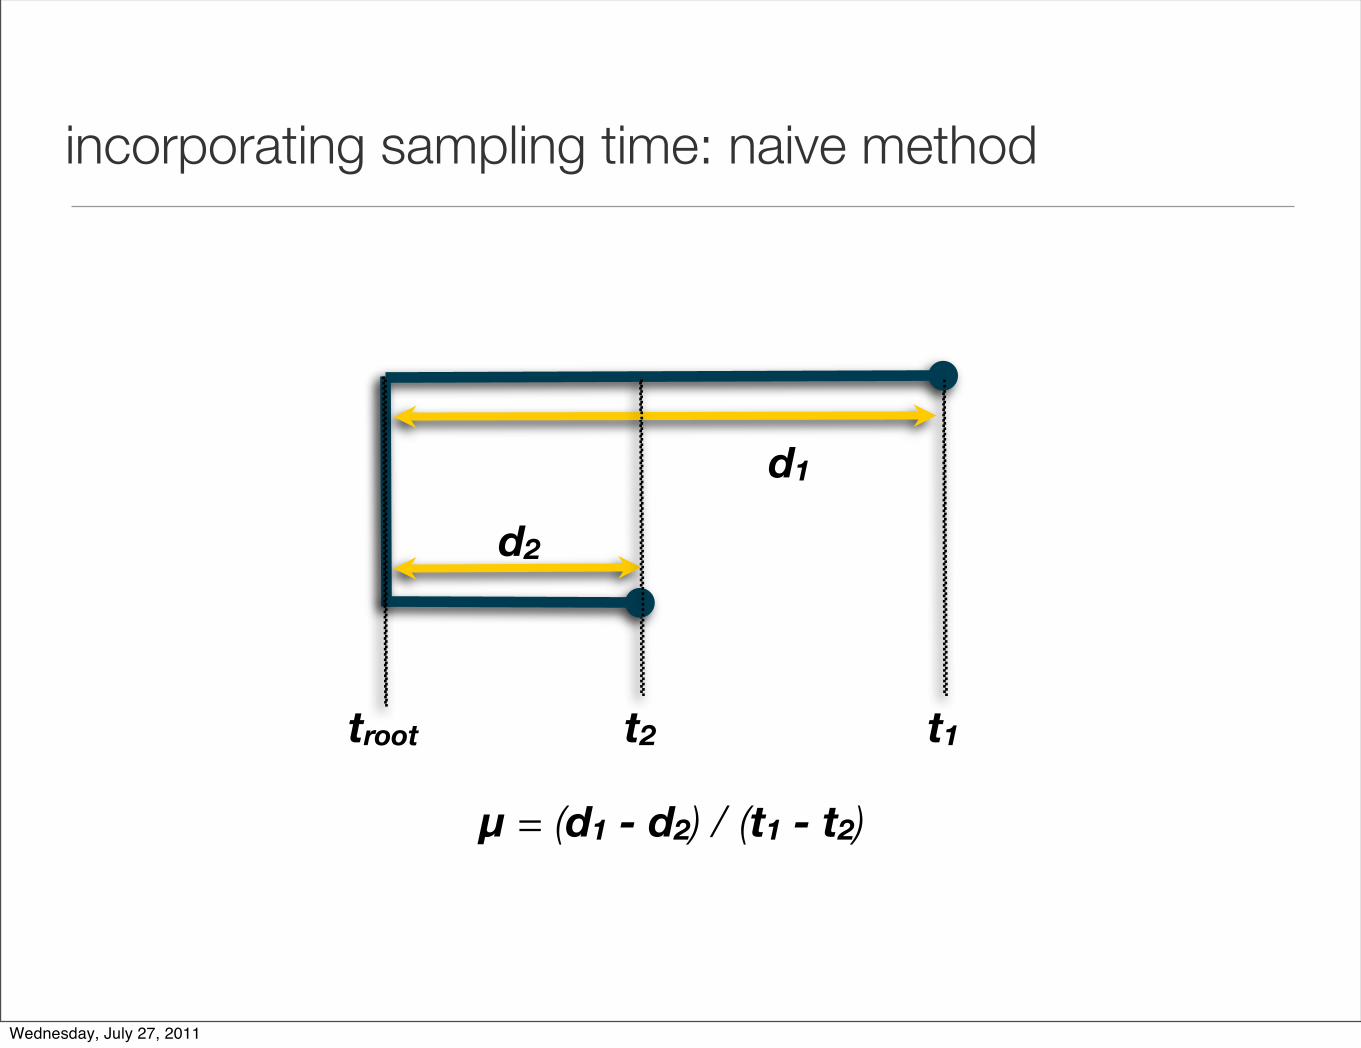
µ = (d1 - d2) / (t1 - t2)
d1
d2
troot t2 t1
incorporating sampling time: naive method
Wednesday, July 27, 2011

linear regression
• can be rearranged:
di = µ (ti - troot)
E[di] = µ . ti - µ . troot
gradient is: µy-intercept is: - µ . troot
x-intercept is: troott2 t1
d1
d3
troot t3
d2
µ = di / (ti - troot)
Wednesday, July 27, 2011
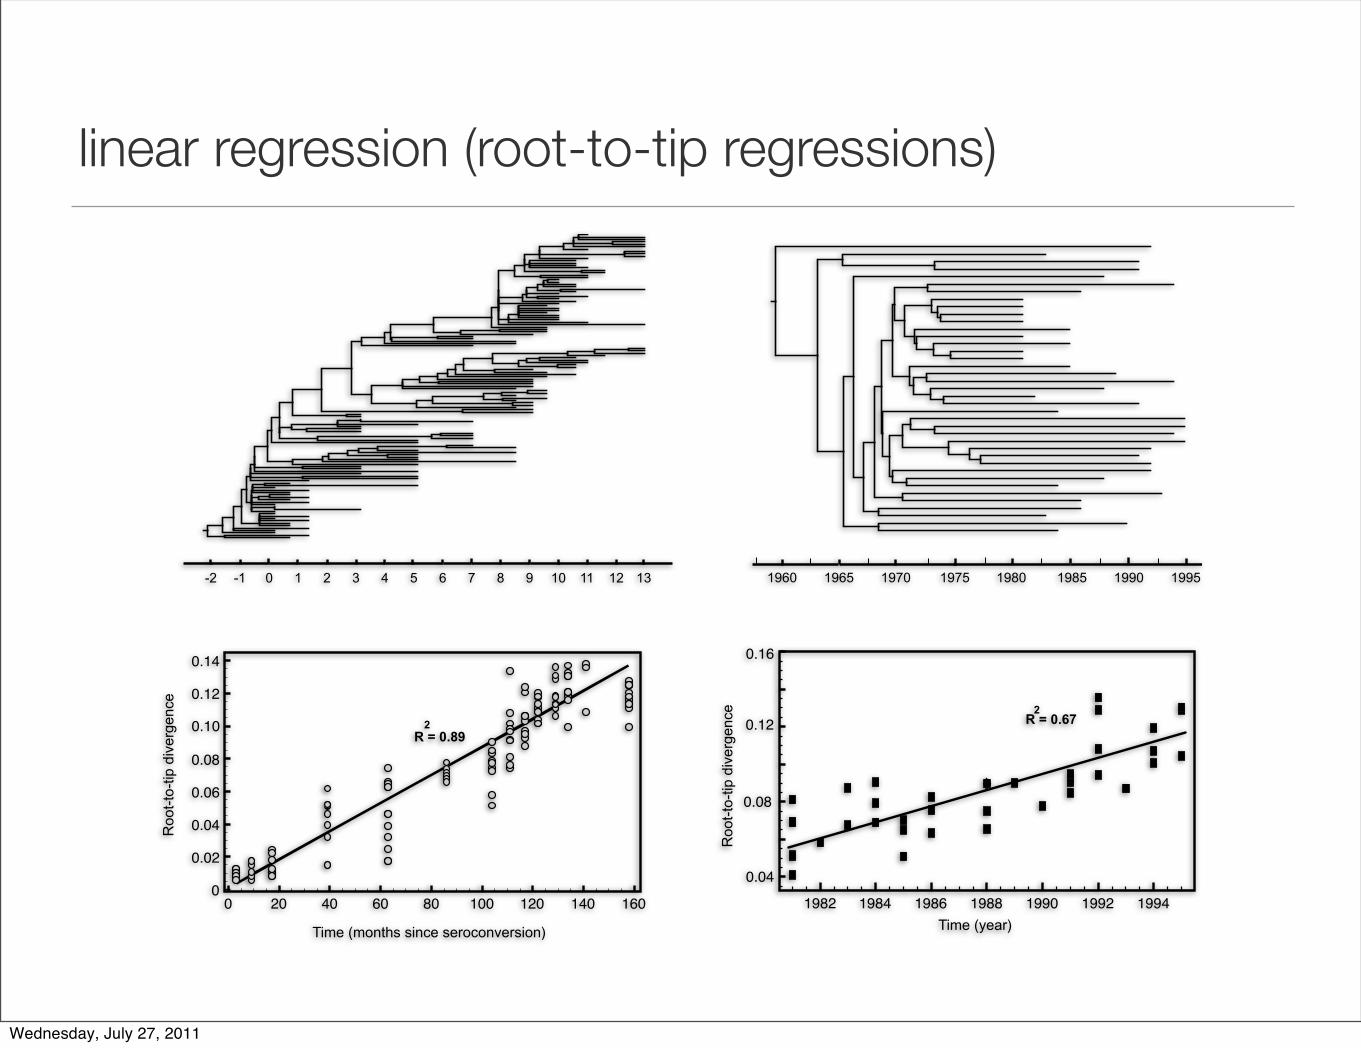
linear regression (root-to-tip regressions)
Time (months since seroconversion) Time (year)
Roo
t-to
-tip
div
erge
nce
R = 0.672
R = 0.89 2
0 1 2 3 4 5 6 7 8 -1 -2 9 10 12 13 11 1985 1990 1995 1980 1975 1970 1965 1960
Roo
t-to
-tip
div
erge
nce
Wednesday, July 27, 2011
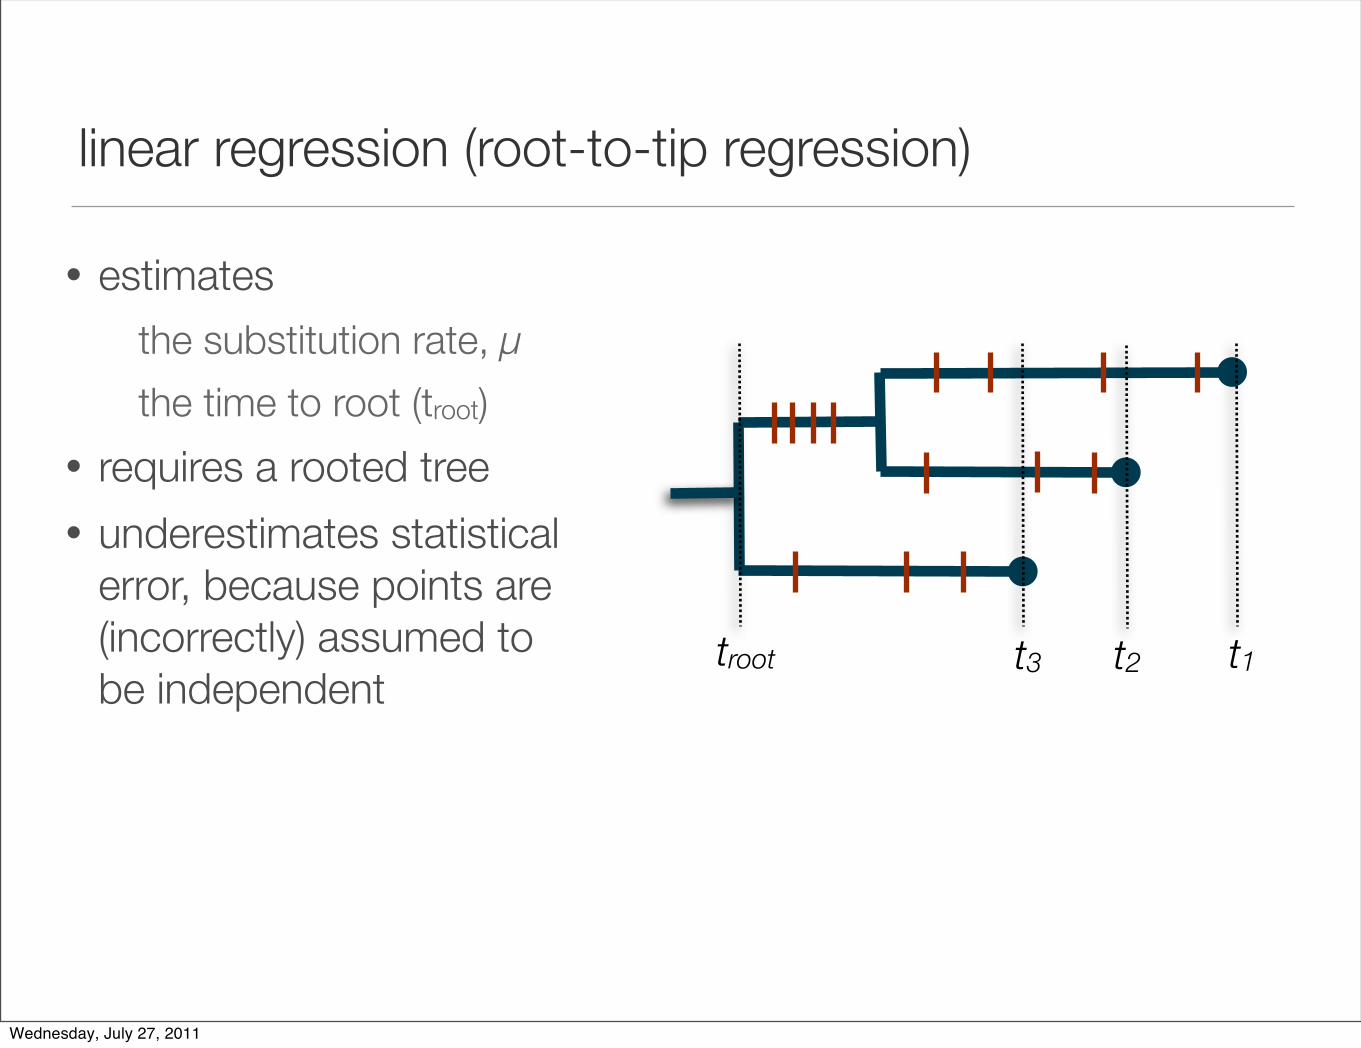
linear regression (root-to-tip regression)
• estimates
the substitution rate, µ
the time to root (troot)
• requires a rooted tree
• underestimates statistical error, because points are (incorrectly) assumed to be independent
t2 t1troot t3
Wednesday, July 27, 2011
testing the molecular clock
Wednesday, July 27, 2011
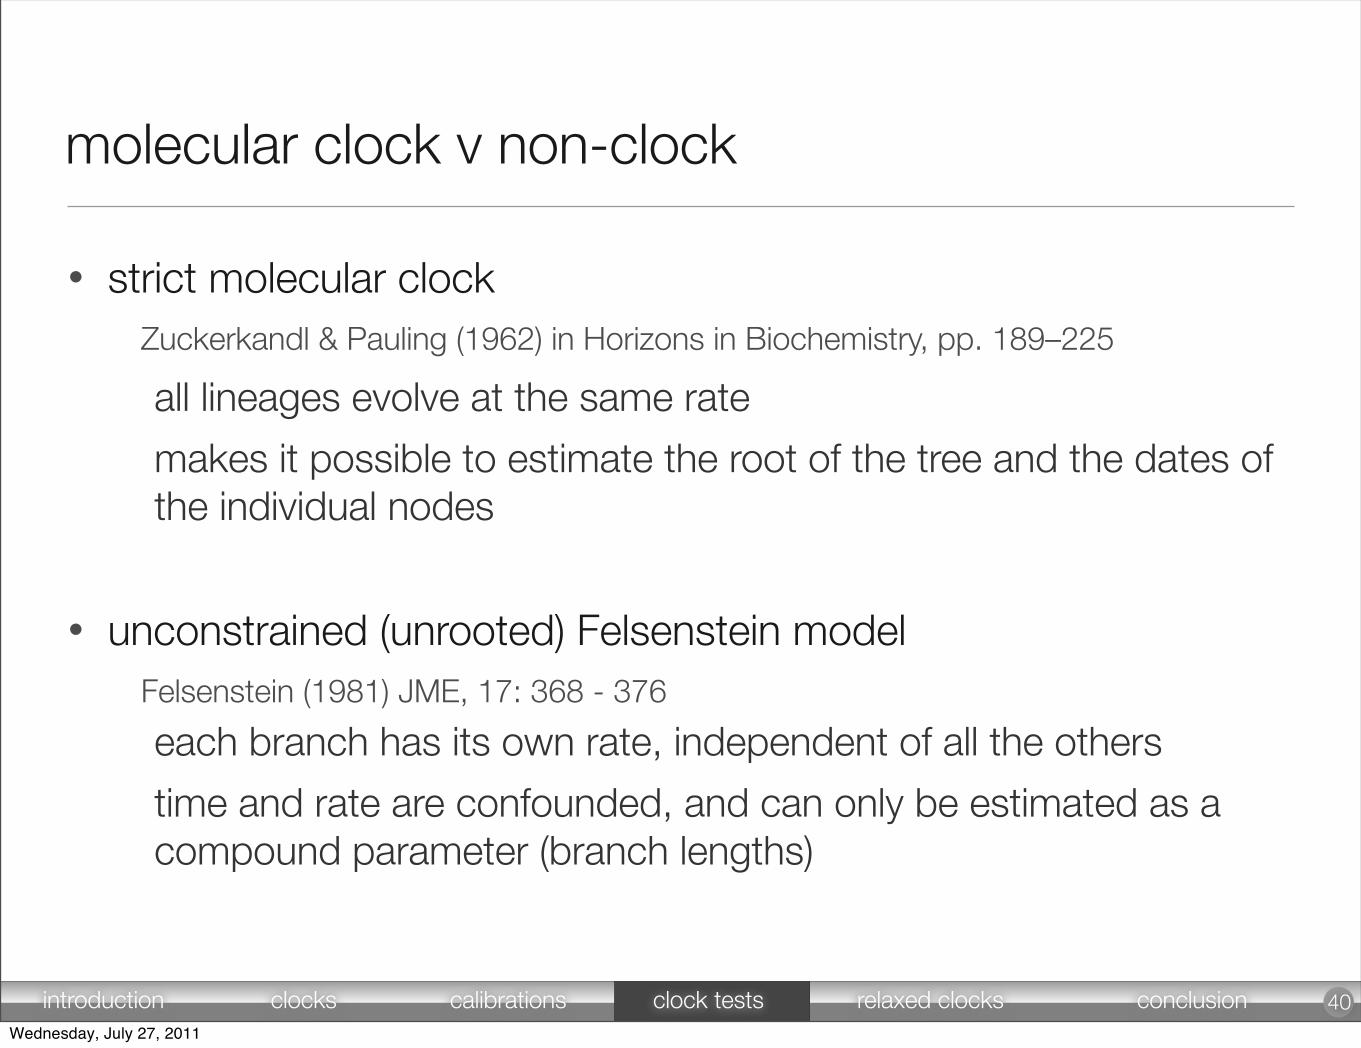
molecular clock v non-clock
• strict molecular clockZuckerkandl & Pauling (1962) in Horizons in Biochemistry, pp. 189–225
all lineages evolve at the same rate
makes it possible to estimate the root of the tree and the dates of the individual nodes
• unconstrained (unrooted) Felsenstein modelFelsenstein (1981) JME, 17: 368 - 376
each branch has its own rate, independent of all the others
time and rate are confounded, and can only be estimated as a compound parameter (branch lengths)
40introduction clocks calibrations clock tests relaxed clocks conclusionWednesday, July 27, 2011

Two types of tests
• relative rate test
• likelihood ratio/Bayes factor test
41Wednesday, July 27, 2011
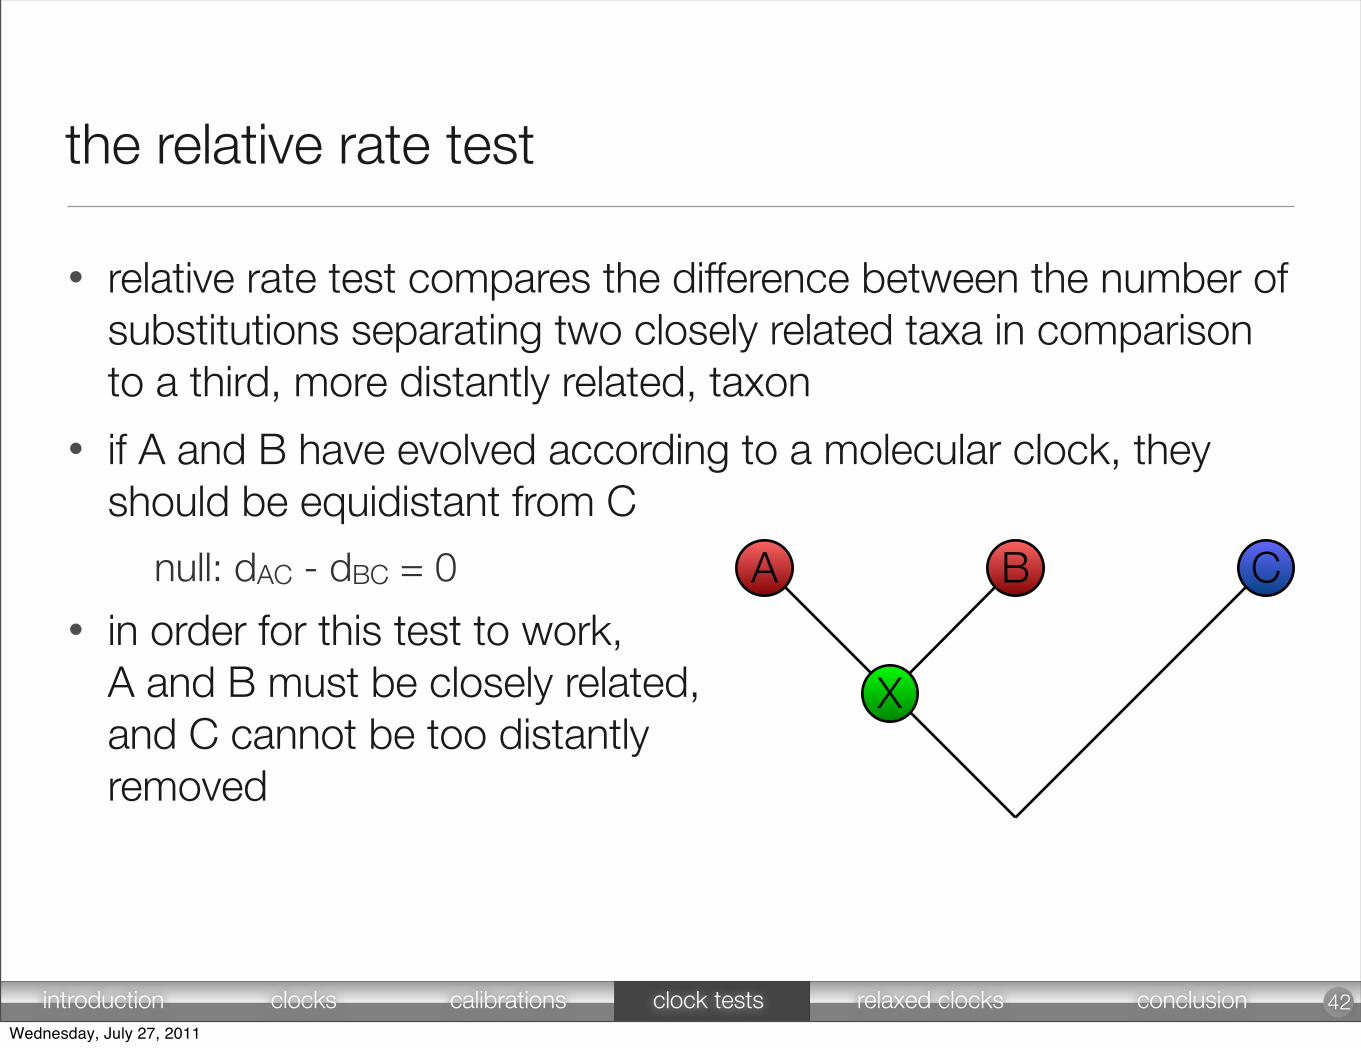
the relative rate test
• relative rate test compares the difference between the number of substitutions separating two closely related taxa in comparison to a third, more distantly related, taxon
• if A and B have evolved according to a molecular clock, they should be equidistant from C
null: dAC - dBC = 0
• in order for this test to work, A and B must be closely related, and C cannot be too distantly removed
42
A B C
X
introduction clocks calibrations clock tests relaxed clocks conclusionWednesday, July 27, 2011
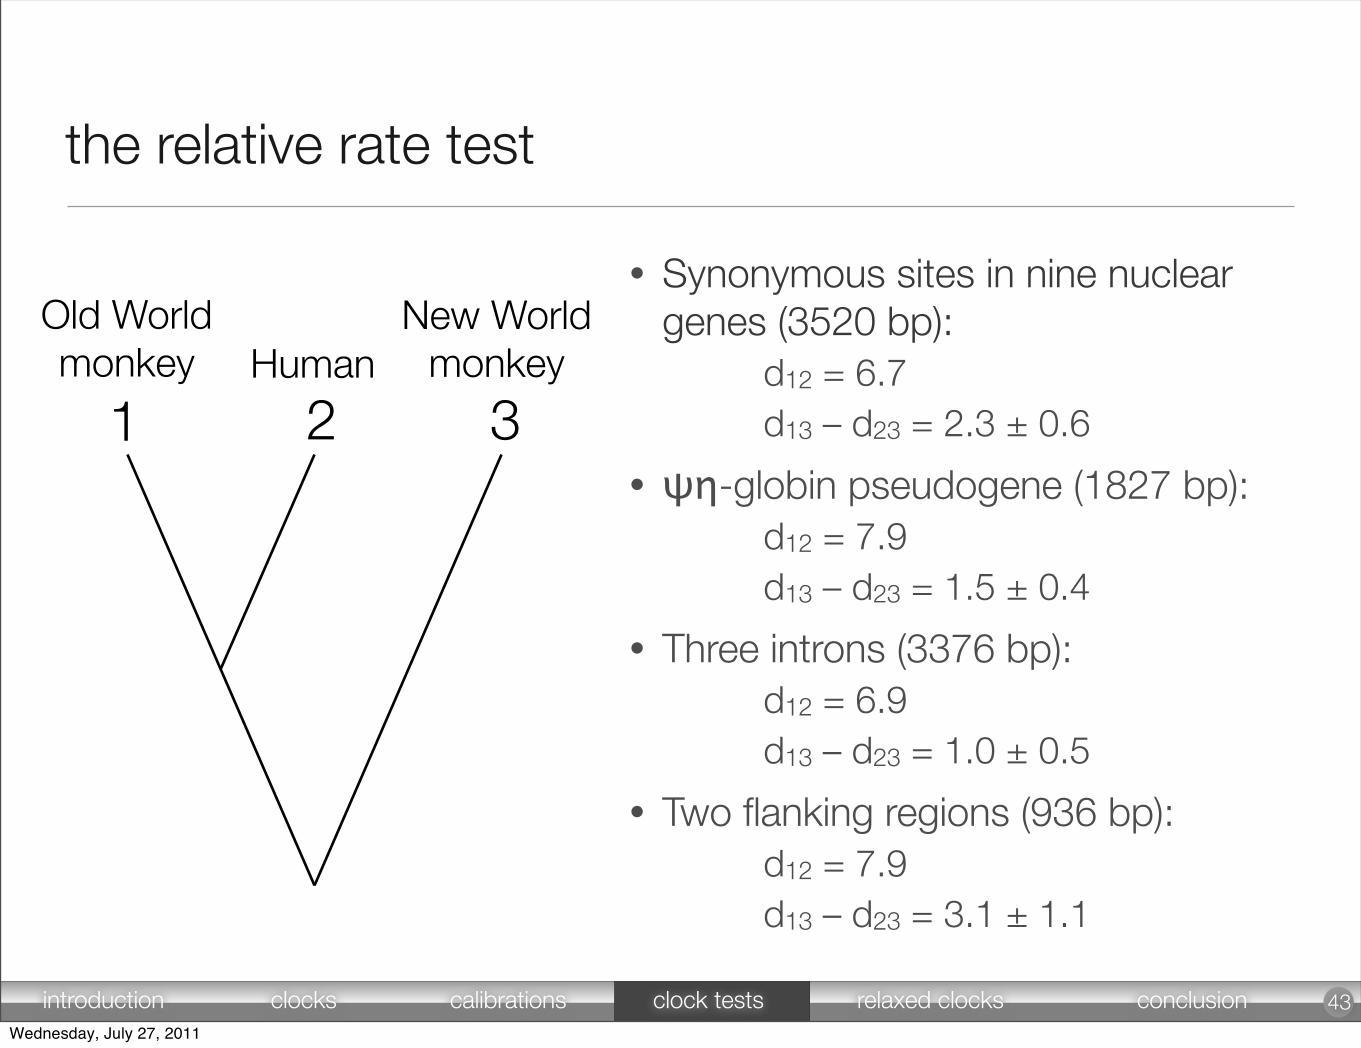
the relative rate test
• Synonymous sites in nine nuclear genes (3520 bp):
d12 = 6.7d13 – d23 = 2.3 ± 0.6
• ψη-globin pseudogene (1827 bp):d12 = 7.9d13 – d23 = 1.5 ± 0.4
• Three introns (3376 bp):d12 = 6.9d13 – d23 = 1.0 ± 0.5
• Two flanking regions (936 bp):d12 = 7.9d13 – d23 = 3.1 ± 1.1
43
1 2 3
Old Worldmonkey Human
New Worldmonkey
introduction clocks calibrations clock tests relaxed clocks conclusionWednesday, July 27, 2011
Two types of tests
• relative rate test
• likelihood ratio/Bayes factor test
44Wednesday, July 27, 2011
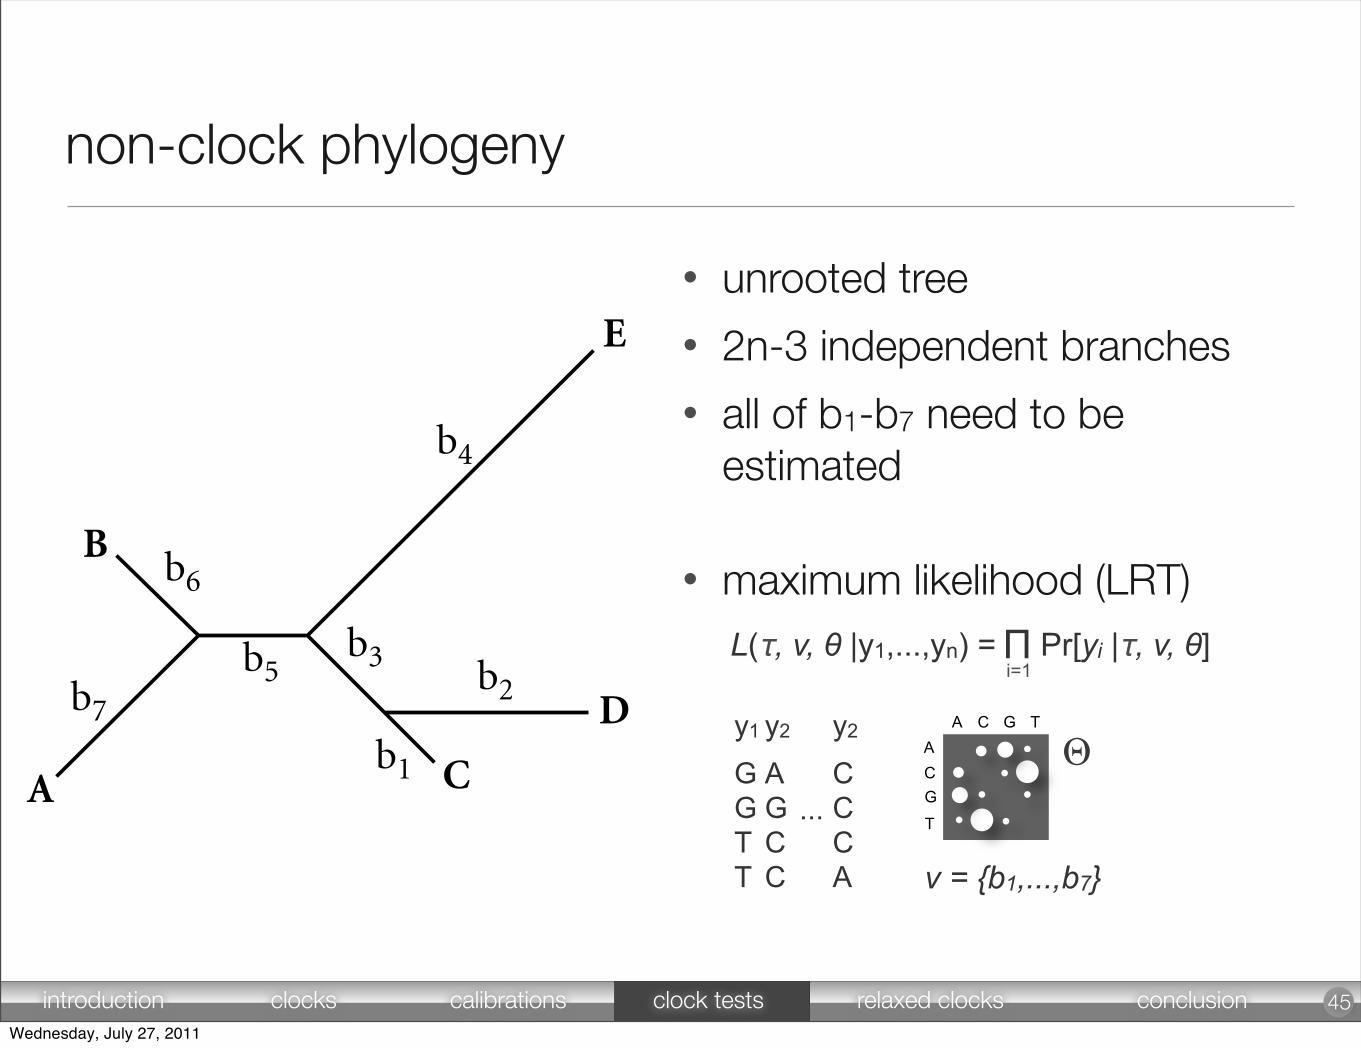
non-clock phylogeny
• unrooted tree
• 2n-3 independent branches
• all of b1-b7 need to be estimated
• maximum likelihood (LRT)
45
P1: IKB
CB502-10 CB502-Salemi & Vandamme CB502-Sample-v3.cls March 18, 2003 13:50 Char Count= 0
268 David Posada
A C
D
E
B
E
C
D
A
B
b6
b4b4
b3b1
b2
b6
b7b5
b8b3 b2
b5b7
b1
unrooted tree2n ! 3 independent branches
rooted treen ! 1 independent branches
All b1, b2, b3, b4, b5, b6, and b7need to be estimated
Only b1, b3, b4, and b6,for example, need to be estimated,because under the molecular clock:
b2 = b1b5 = b1 + b3 ! b6b7 = b6b8 = b4 ! b5 ! b6
ANonclocklike phylogenetic tree
n taxa = 5
BClocklike phylogenetic tree
n taxa = 5
Figure 10.5 Number of free parameters in clock and nonclock trees. Under the free rates model(= nonclock), all the branches need to be estimated (2n ! 3). Under the molecular clock,only n ! 1 branches have to be estimated. The difference in the number of parametersamong a nonclock and a clock model is n ! 2.
Maximum-likelihood methods can estimate the branch lengths of a tree by enforc-ing or not enforcing a molecular clock. In the absence of a molecular clock (thefree-rates model), 2n ! 3 branch lengths must be inferred for a strictly bifurcatingunrooted phylogenetic tree with n taxa (Figure 10.5B). If the molecular clock isenforced, the tree is rooted, and just n ! 1 branch lengths need to be estimated (seeFigure 10.4 and Chapter 1). This should appear obvious considering that under amolecular clock, for any two taxa sharing a common ancestor, only the length of thebranch from the ancestor to one of the taxa needs to be estimated, the other one be-ing the same. Statistically speaking, the molecular clock is the null hypothesis (i.e.,the rate of evolution is equal for all branches of the tree) and represents a specialcase of the more general alternative hypothesis that assumes a specific rate for eachbranch (i.e., free-rates model). Thus, given a tree relating n taxa, the LRT can beused to evaluate whether the taxa have been evolving at the same rate (Felsenstein,1988). In practice, a model of nucleotide (or amino-acid) substitution is chosenand the branch lengths of the tree with and without enforcing the molecular clockare estimated. To assess the significance of this test, the LRT can be compared witha !2 distribution with (2n ! 3) ! (n ! 1) = n ! 2 degrees of freedom, becausethe only difference in parameter estimates is in the number of branch lengths thatneeds to be estimated.
L(τ, v, θ |y1,...,yn) = Pr[yi |τ, v, θ]Πi=1
ΘA C G T
ACG
T
y1
GGTT
y2
AGCC
y2
CCCA
...
v = {b1,...,b7}
introduction clocks calibrations clock tests relaxed clocks conclusionWednesday, July 27, 2011
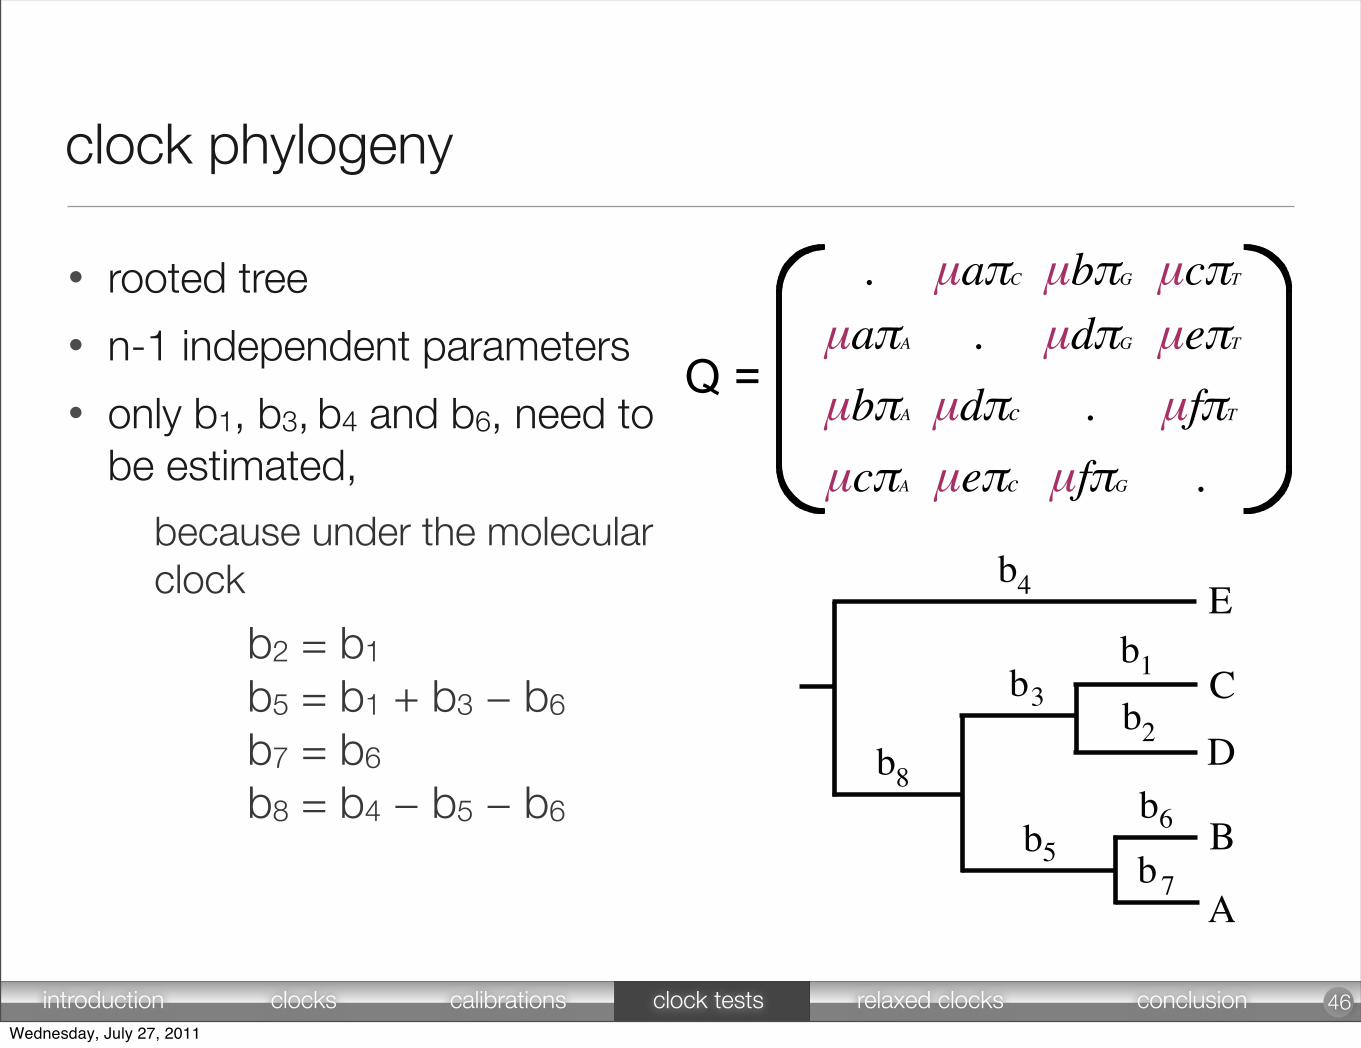
clock phylogeny
• rooted tree
• n-1 independent parameters
• only b1, b3, b4 and b6, need to be estimated,
because under the molecular clock
b2 = b1 b5 = b1 + b3 − b6 b7 = b6 b8 = b4 − b5 − b6
46
b
b
b
bb
b
bb
1
23
4
56
7
8
A
B
C
E
D
μaπC
.μdπcμeπc
. μbπG μcπT
.μaπA
.
μdπG μeπT
μfπTμbπA
μcπA μfπG
Q =
introduction clocks calibrations clock tests relaxed clocks conclusionWednesday, July 27, 2011
t
t
1
2
t3
t4
A
B
C
E
D
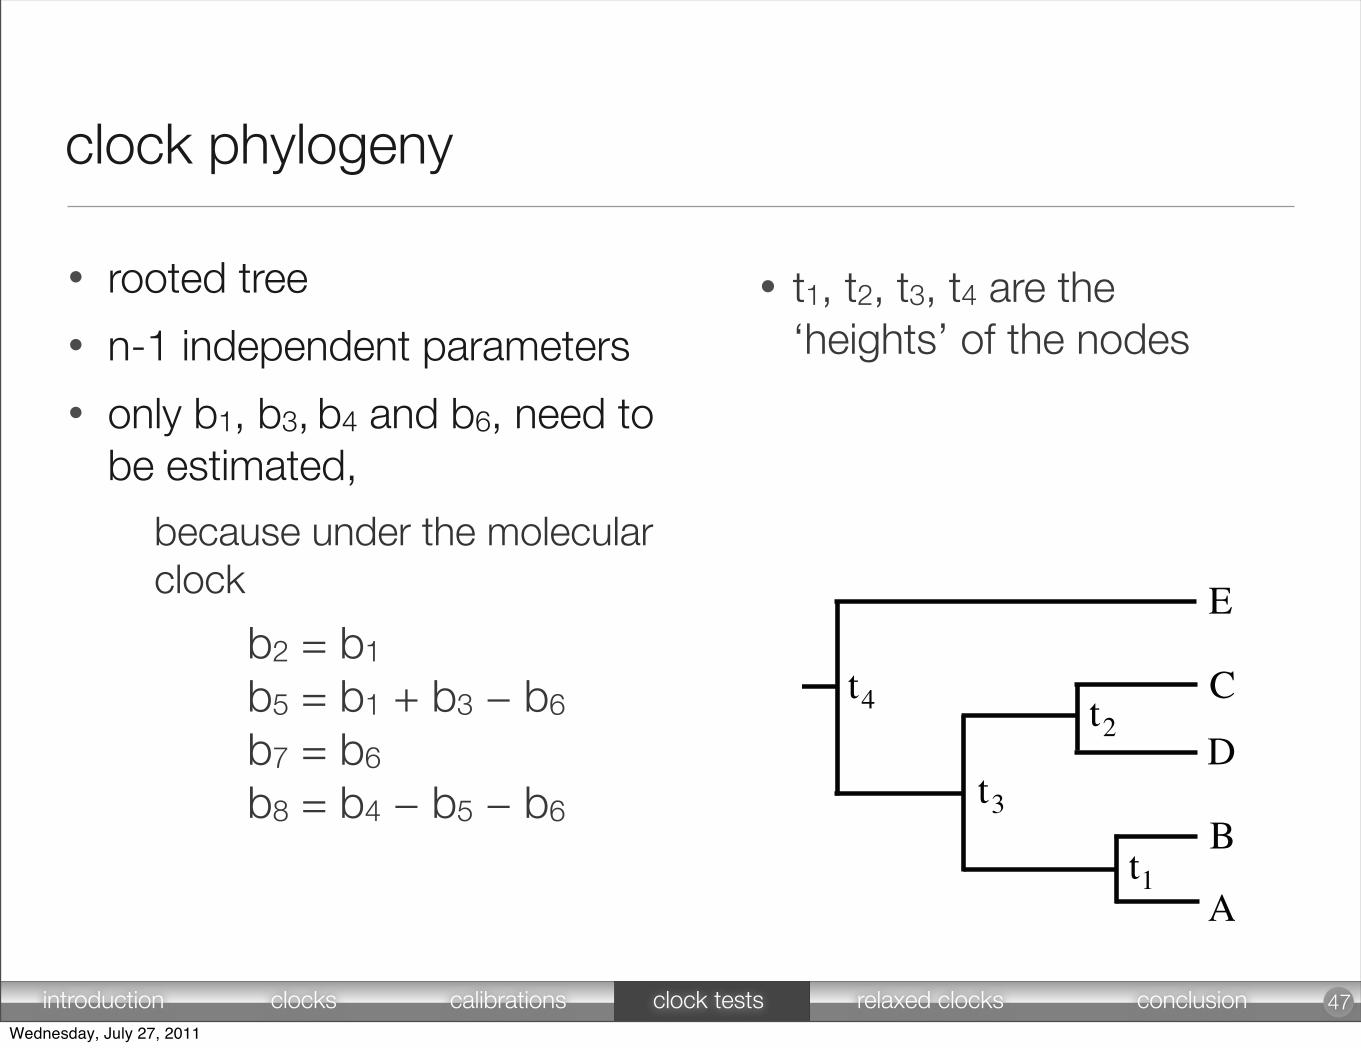
clock phylogeny
• rooted tree
• n-1 independent parameters
• only b1, b3, b4 and b6, need to be estimated,
because under the molecular clock
b2 = b1 b5 = b1 + b3 − b6 b7 = b6 b8 = b4 − b5 − b6
47
• t1, t2, t3, t4 are the ‘heights’ of the nodes
introduction clocks calibrations clock tests relaxed clocks conclusionWednesday, July 27, 2011
t
t
1
2
t3
t4
A
B
C
E
D
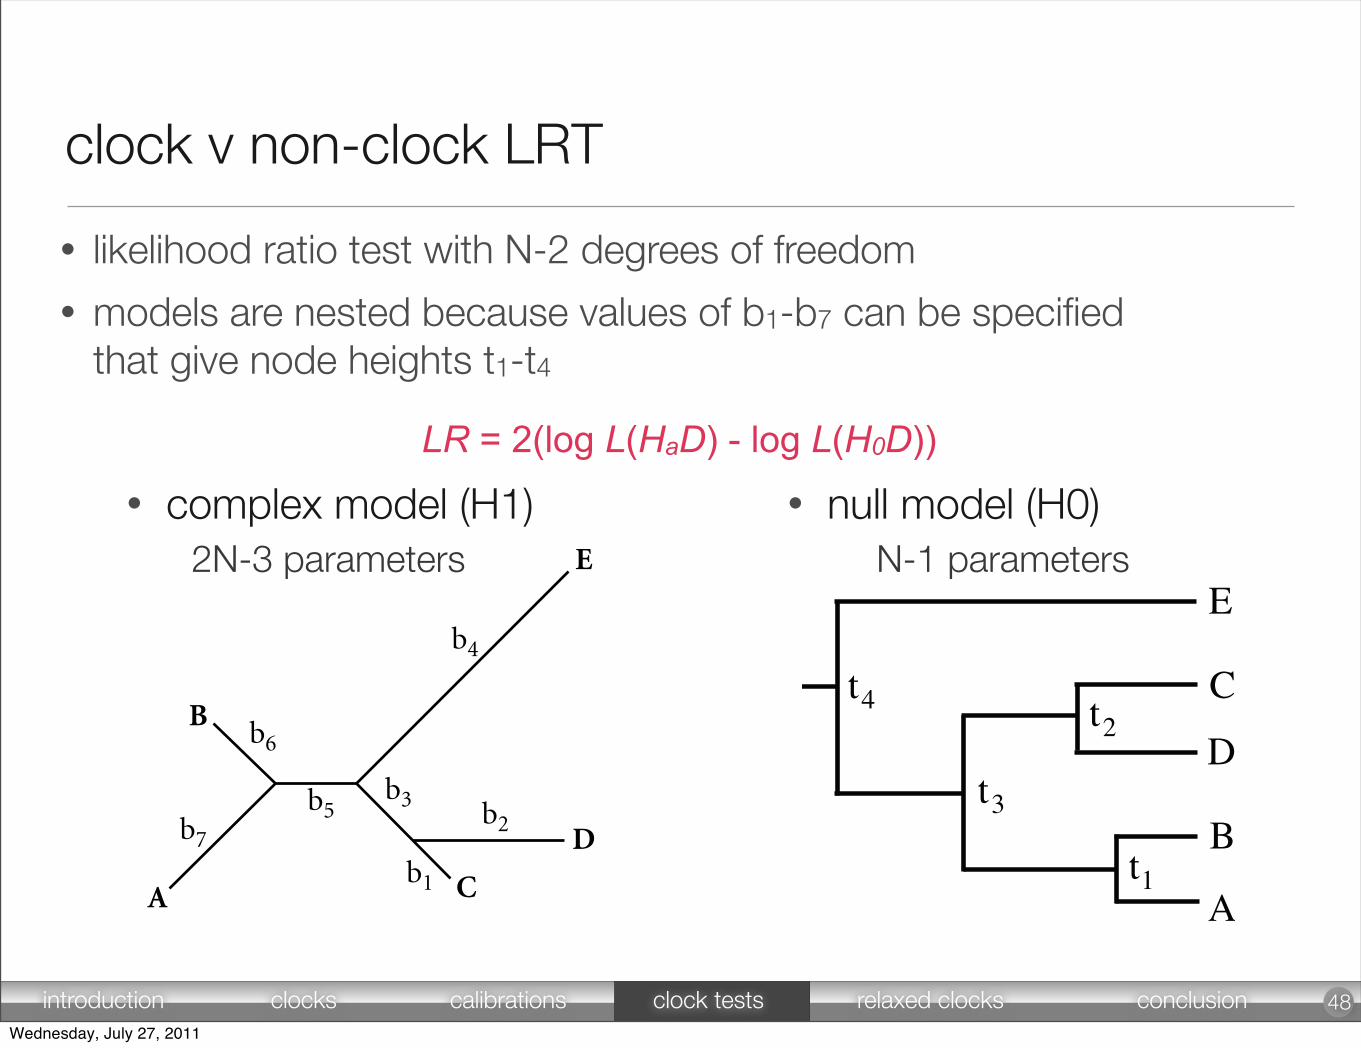
clock v non-clock LRT
• complex model (H1)
48
P1: IKB
CB502-10 CB502-Salemi & Vandamme CB502-Sample-v3.cls March 18, 2003 13:50 Char Count= 0
268 David Posada
A C
D
E
B
E
C
D
A
B
b6
b4b4
b3b1
b2
b6
b7b5
b8b3 b2
b5b7
b1
unrooted tree2n ! 3 independent branches
rooted treen ! 1 independent branches
All b1, b2, b3, b4, b5, b6, and b7need to be estimated
Only b1, b3, b4, and b6,for example, need to be estimated,because under the molecular clock:
b2 = b1b5 = b1 + b3 ! b6b7 = b6b8 = b4 ! b5 ! b6
ANonclocklike phylogenetic tree
n taxa = 5
BClocklike phylogenetic tree
n taxa = 5
Figure 10.5 Number of free parameters in clock and nonclock trees. Under the free rates model(= nonclock), all the branches need to be estimated (2n ! 3). Under the molecular clock,only n ! 1 branches have to be estimated. The difference in the number of parametersamong a nonclock and a clock model is n ! 2.
Maximum-likelihood methods can estimate the branch lengths of a tree by enforc-ing or not enforcing a molecular clock. In the absence of a molecular clock (thefree-rates model), 2n ! 3 branch lengths must be inferred for a strictly bifurcatingunrooted phylogenetic tree with n taxa (Figure 10.5B). If the molecular clock isenforced, the tree is rooted, and just n ! 1 branch lengths need to be estimated (seeFigure 10.4 and Chapter 1). This should appear obvious considering that under amolecular clock, for any two taxa sharing a common ancestor, only the length of thebranch from the ancestor to one of the taxa needs to be estimated, the other one be-ing the same. Statistically speaking, the molecular clock is the null hypothesis (i.e.,the rate of evolution is equal for all branches of the tree) and represents a specialcase of the more general alternative hypothesis that assumes a specific rate for eachbranch (i.e., free-rates model). Thus, given a tree relating n taxa, the LRT can beused to evaluate whether the taxa have been evolving at the same rate (Felsenstein,1988). In practice, a model of nucleotide (or amino-acid) substitution is chosenand the branch lengths of the tree with and without enforcing the molecular clockare estimated. To assess the significance of this test, the LRT can be compared witha !2 distribution with (2n ! 3) ! (n ! 1) = n ! 2 degrees of freedom, becausethe only difference in parameter estimates is in the number of branch lengths thatneeds to be estimated.
• null model (H0)
• likelihood ratio test with N-2 degrees of freedom
• models are nested because values of b1-b7 can be specifiedthat give node heights t1-t4
N-1 parameters2N-3 parameters
LR = 2(log L(HaD) - log L(H0D))
introduction clocks calibrations clock tests relaxed clocks conclusionWednesday, July 27, 2011
Human
Chimp
Gorilla
Orang-utan
Gibbon
Human
Chimp
Gorilla
Orang-utan
Gibbon
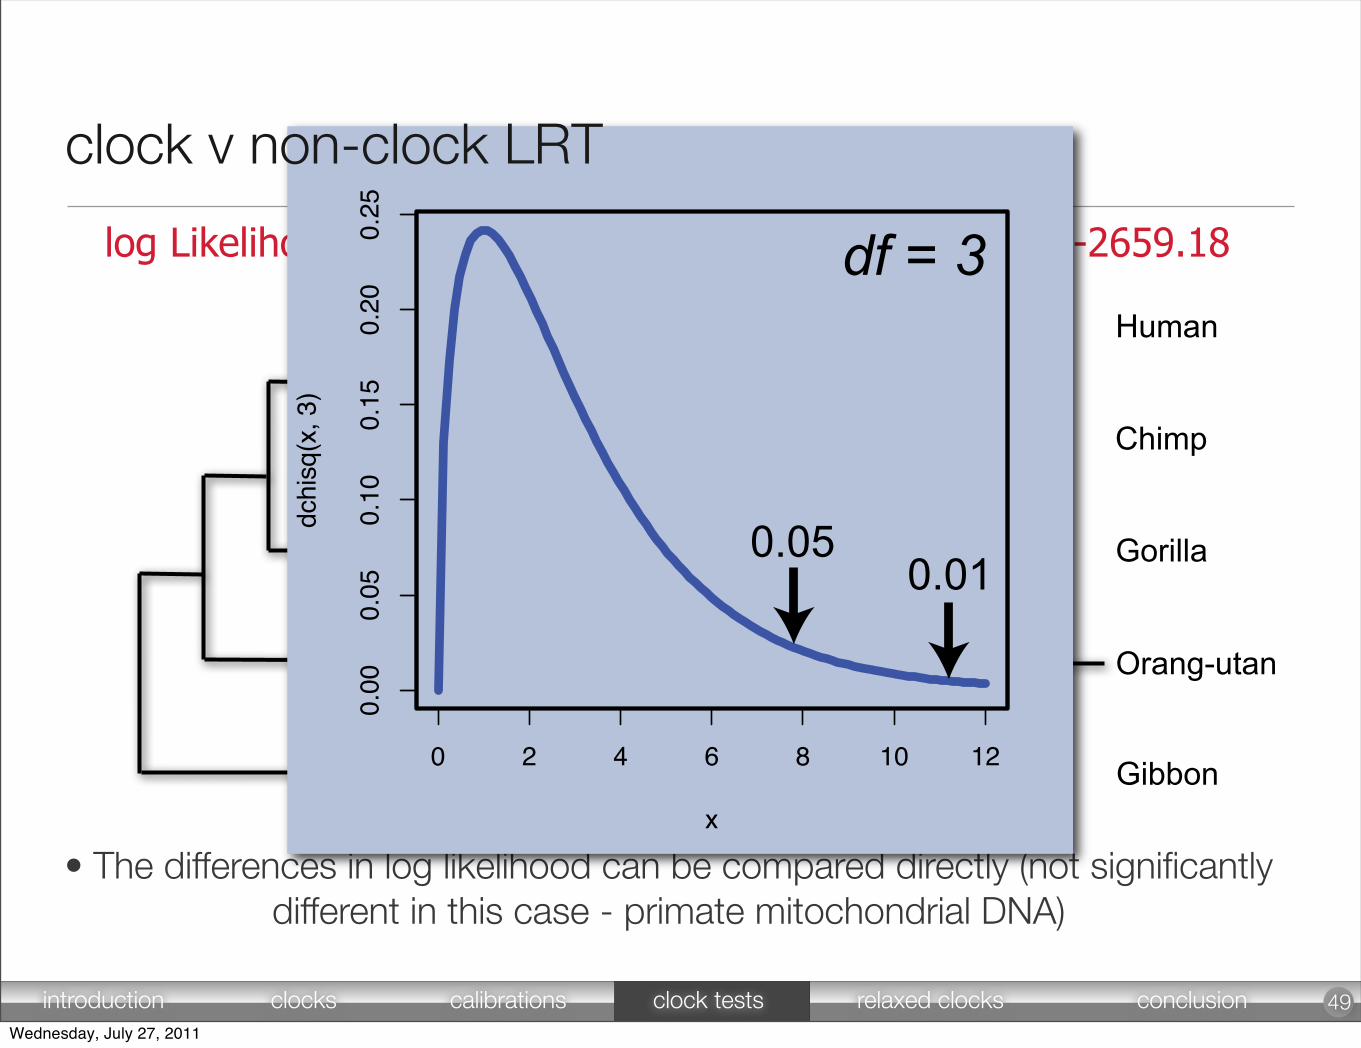
log Likelihood = -2660.61 log Likelihood = -2659.18
• The differences in log likelihood can be compared directly (not significantlydifferent in this case - primate mitochondrial DNA)
0 2 4 6 8 10 12
0.00
0.05
0.10
0.15
0.20
0.25
x
dchi
sq(x
, 3)
df = 3
0.050.01
49
clock v non-clock LRT
introduction clocks calibrations clock tests relaxed clocks conclusionWednesday, July 27, 2011
50introduction clocks calibrations clock tests relaxed clocks conclusion
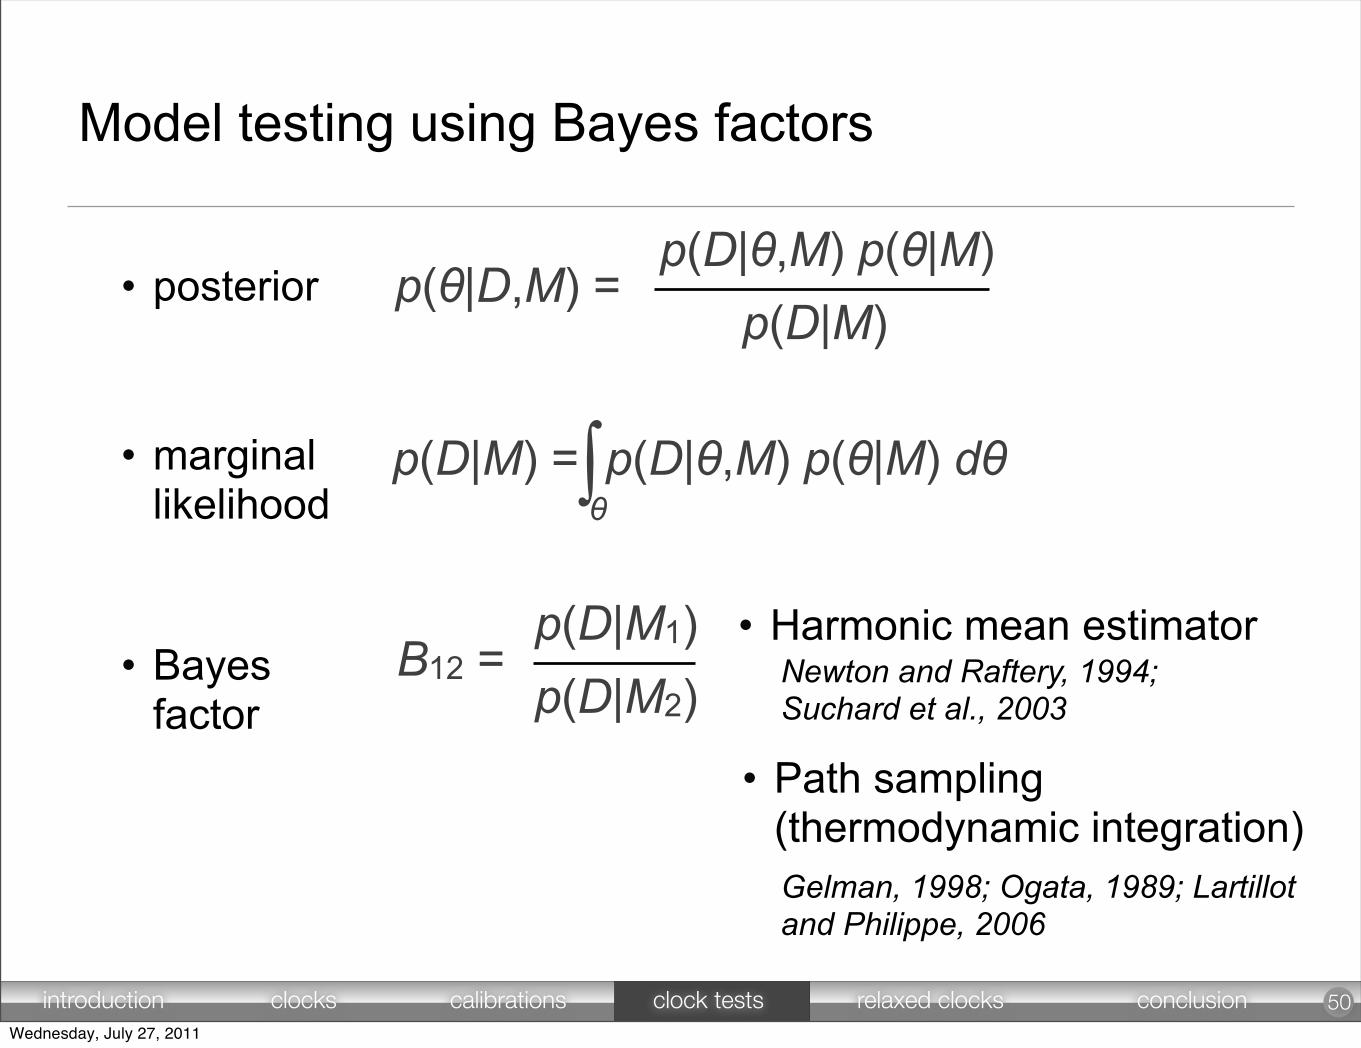
Model testing using Bayes factors
p(θ|D,M) = p(D|θ,M) p(θ|M)
p(D|M)
p(D|M) = p(D|θ,M) p(θ|M) dθ
B12 = p(D|M1) p(D|M2)
∫θ
• Harmonic mean estimator
• Path sampling (thermodynamic integration)
Newton and Raftery, 1994; Suchard et al., 2003
Gelman, 1998; Ogata, 1989; Lartillot and Philippe, 2006
• posterior
• marginal likelihood
• Bayes factor
Wednesday, July 27, 2011

relaxing the clock
Wednesday, July 27, 2011
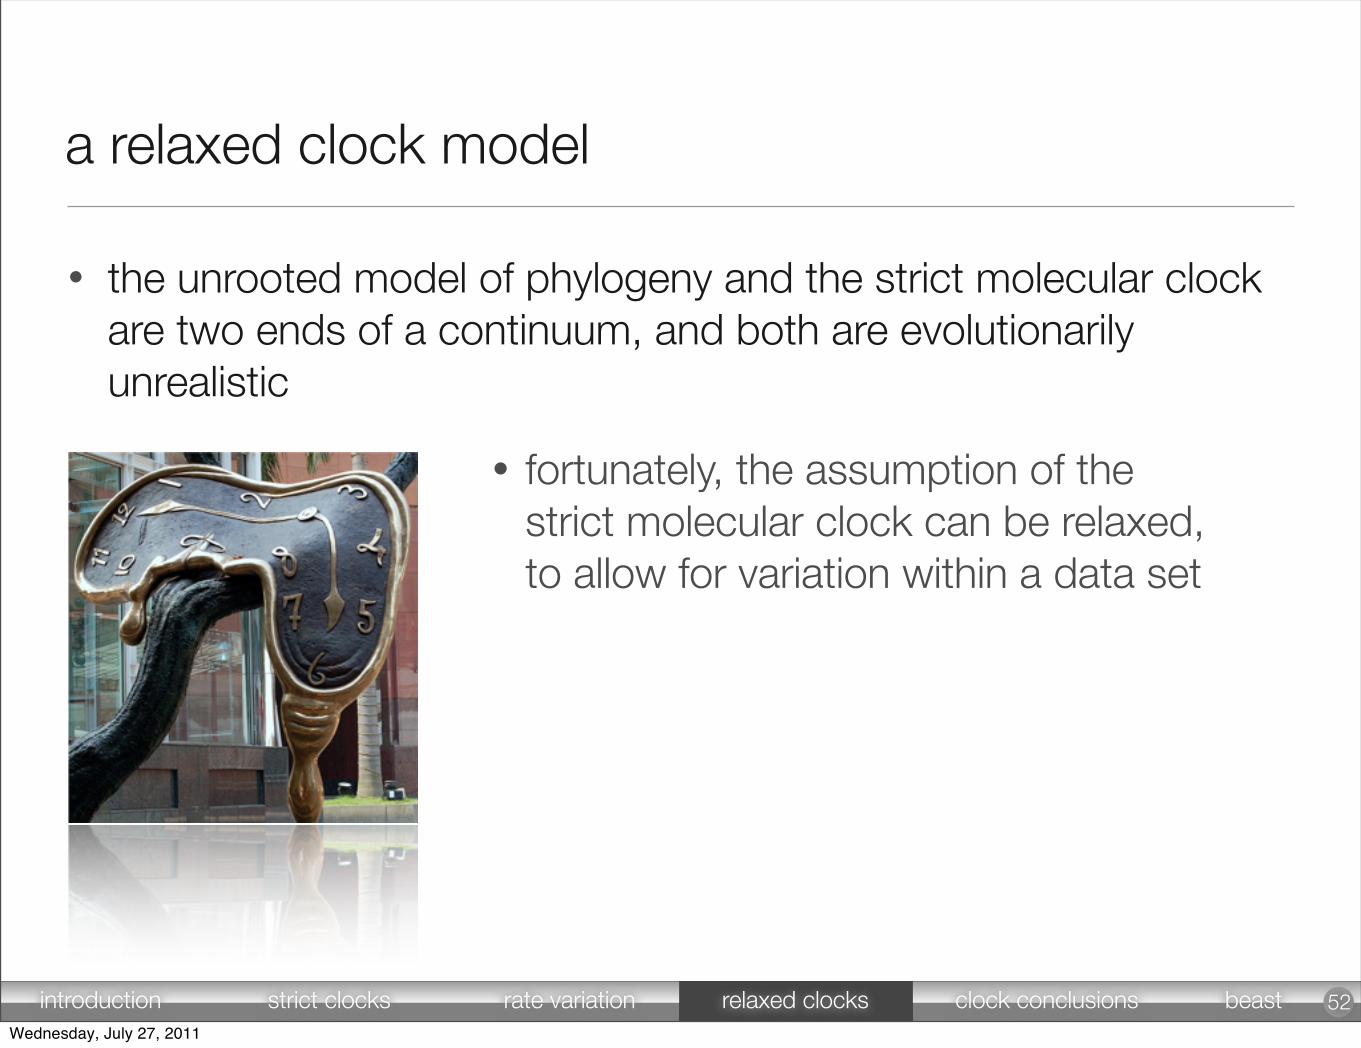
a relaxed clock model
• the unrooted model of phylogeny and the strict molecular clock are two ends of a continuum, and both are evolutionarily unrealistic
52
• fortunately, the assumption of the strict molecular clock can be relaxed, to allow for variation within a data set
introduction strict clocks rate variation relaxed clocks clock conclusions beastWednesday, July 27, 2011
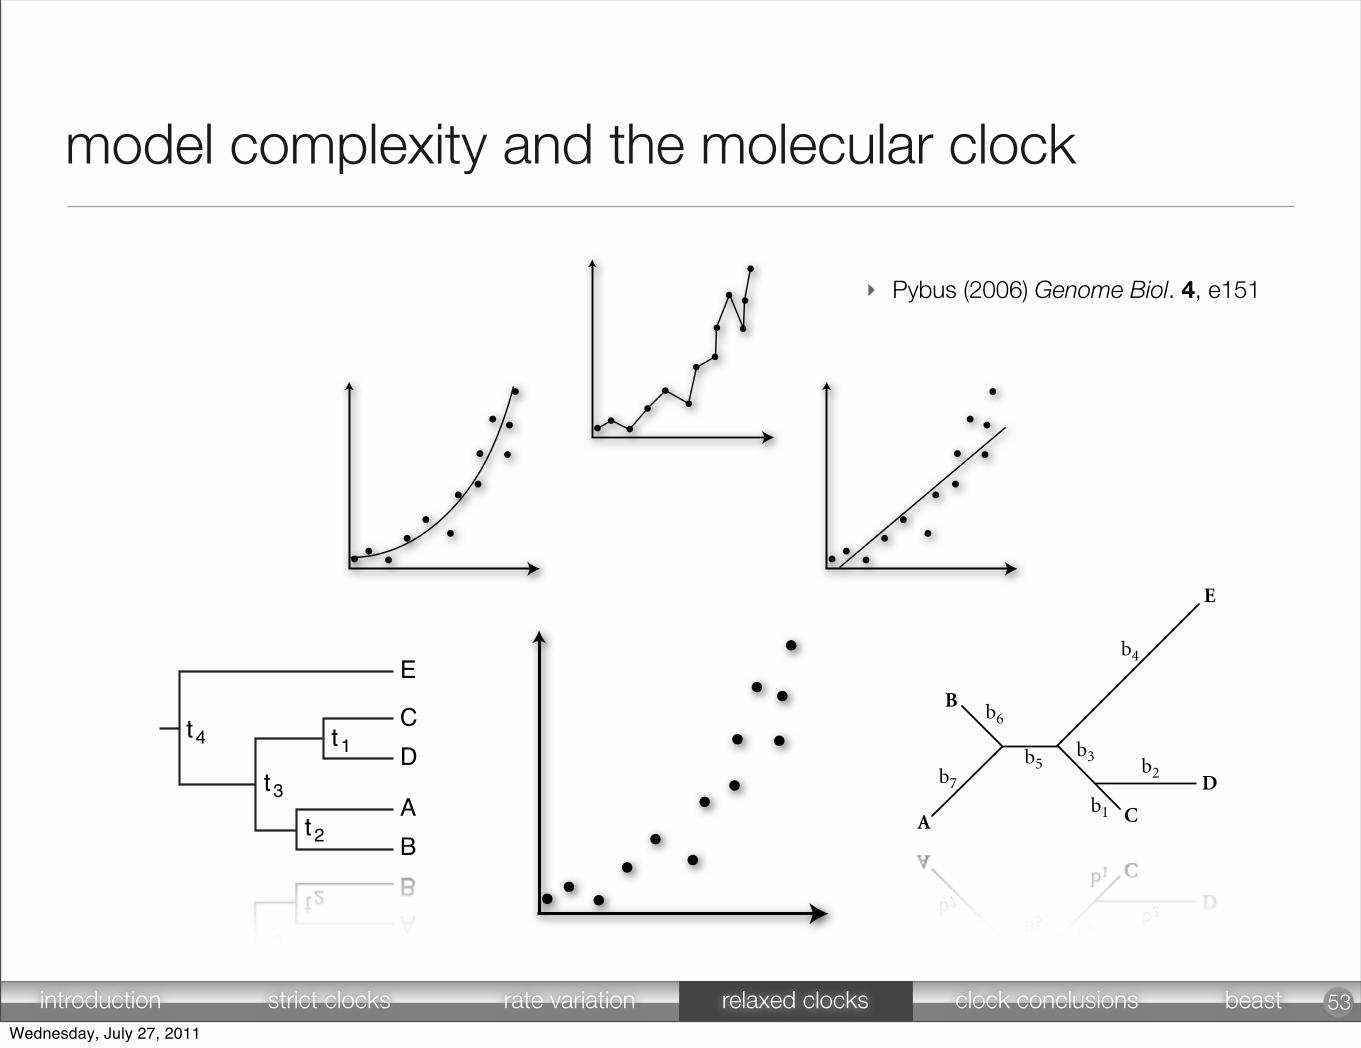
model complexity and the molecular clock
53
P1: IKB
CB502-10 CB502-Salemi & Vandamme CB502-Sample-v3.cls March 18, 2003 13:50 Char Count= 0
268 David Posada
A C
D
E
B
E
C
D
A
B
b6
b4b4
b3b1
b2
b6
b7b5
b8b3 b2
b5b7
b1
unrooted tree2n ! 3 independent branches
rooted treen ! 1 independent branches
All b1, b2, b3, b4, b5, b6, and b7need to be estimated
Only b1, b3, b4, and b6,for example, need to be estimated,because under the molecular clock:
b2 = b1b5 = b1 + b3 ! b6b7 = b6b8 = b4 ! b5 ! b6
ANonclocklike phylogenetic tree
n taxa = 5
BClocklike phylogenetic tree
n taxa = 5
Figure 10.5 Number of free parameters in clock and nonclock trees. Under the free rates model(= nonclock), all the branches need to be estimated (2n ! 3). Under the molecular clock,only n ! 1 branches have to be estimated. The difference in the number of parametersamong a nonclock and a clock model is n ! 2.
Maximum-likelihood methods can estimate the branch lengths of a tree by enforc-ing or not enforcing a molecular clock. In the absence of a molecular clock (thefree-rates model), 2n ! 3 branch lengths must be inferred for a strictly bifurcatingunrooted phylogenetic tree with n taxa (Figure 10.5B). If the molecular clock isenforced, the tree is rooted, and just n ! 1 branch lengths need to be estimated (seeFigure 10.4 and Chapter 1). This should appear obvious considering that under amolecular clock, for any two taxa sharing a common ancestor, only the length of thebranch from the ancestor to one of the taxa needs to be estimated, the other one be-ing the same. Statistically speaking, the molecular clock is the null hypothesis (i.e.,the rate of evolution is equal for all branches of the tree) and represents a specialcase of the more general alternative hypothesis that assumes a specific rate for eachbranch (i.e., free-rates model). Thus, given a tree relating n taxa, the LRT can beused to evaluate whether the taxa have been evolving at the same rate (Felsenstein,1988). In practice, a model of nucleotide (or amino-acid) substitution is chosenand the branch lengths of the tree with and without enforcing the molecular clockare estimated. To assess the significance of this test, the LRT can be compared witha !2 distribution with (2n ! 3) ! (n ! 1) = n ! 2 degrees of freedom, becausethe only difference in parameter estimates is in the number of branch lengths thatneeds to be estimated.
‣ Pybus (2006) Genome Biol. 4, e151
introduction strict clocks rate variation relaxed clocks clock conclusions beastWednesday, July 27, 2011
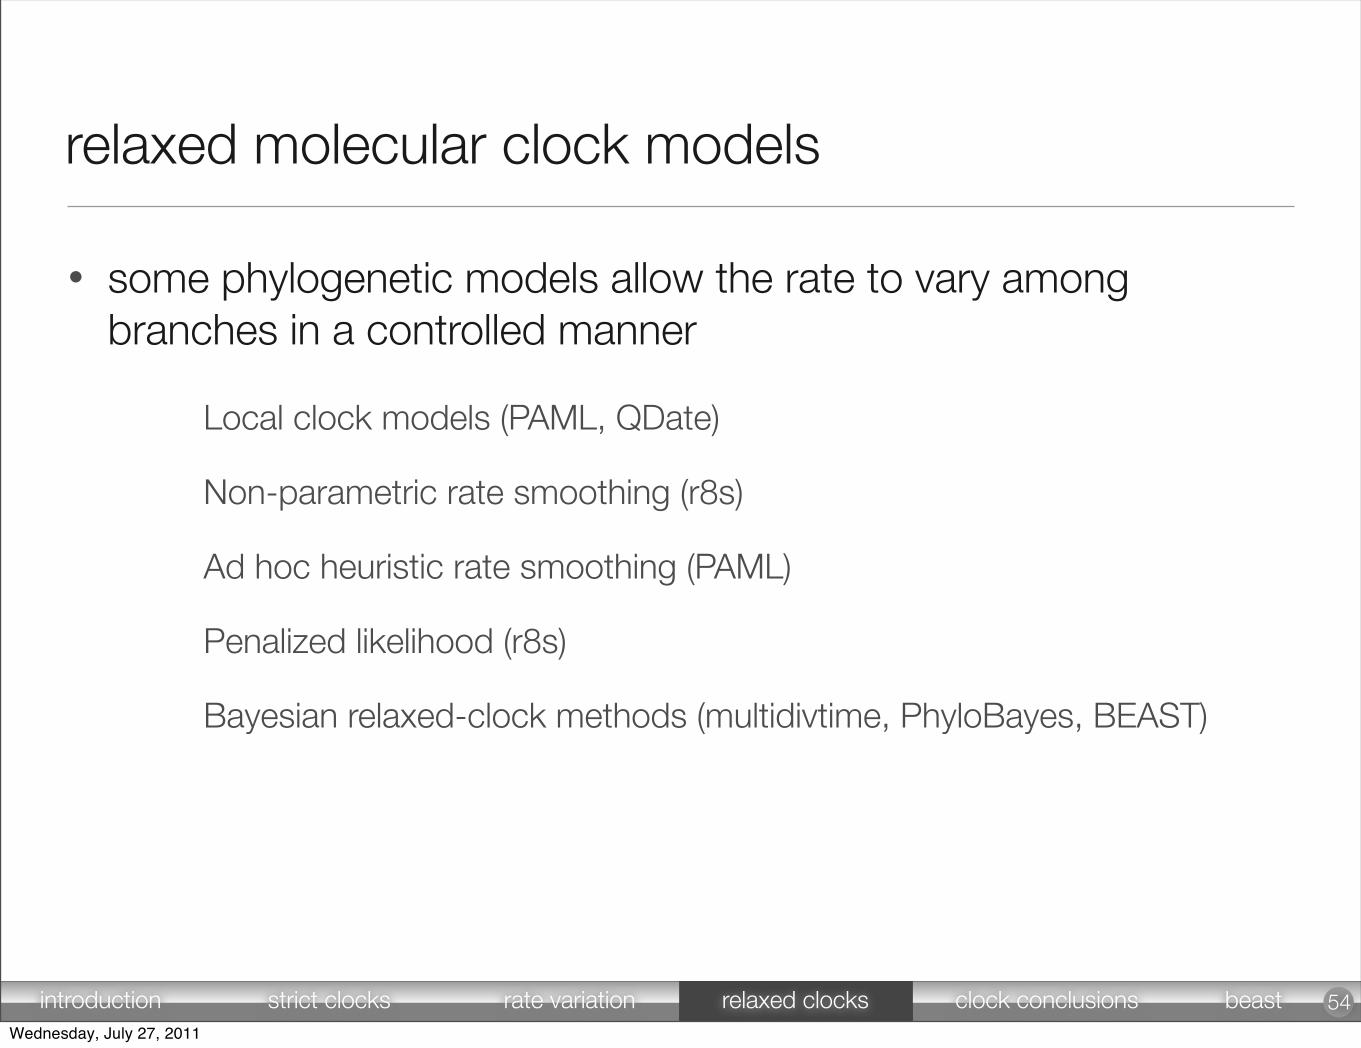
relaxed molecular clock models
• some phylogenetic models allow the rate to vary among branches in a controlled manner
54
Local clock models (PAML, QDate)
Non-parametric rate smoothing (r8s)
Ad hoc heuristic rate smoothing (PAML)
Penalized likelihood (r8s)
Bayesian relaxed-clock methods (multidivtime, PhyloBayes, BEAST)
introduction strict clocks rate variation relaxed clocks clock conclusions beastWednesday, July 27, 2011
t
t
1
2
t3
t4
A
B
C
E
D
P1: IKB
CB502-10 CB502-Salemi & Vandamme CB502-Sample-v3.cls March 18, 2003 13:50 Char Count= 0
268 David Posada
A C
D
E
B
E
C
D
A
B
b6
b4b4
b3b1
b2
b6
b7b5
b8b3 b2
b5b7
b1
unrooted tree2n ! 3 independent branches
rooted treen ! 1 independent branches
All b1, b2, b3, b4, b5, b6, and b7need to be estimated
Only b1, b3, b4, and b6,for example, need to be estimated,because under the molecular clock:
b2 = b1b5 = b1 + b3 ! b6b7 = b6b8 = b4 ! b5 ! b6
ANonclocklike phylogenetic tree
n taxa = 5
BClocklike phylogenetic tree
n taxa = 5
Figure 10.5 Number of free parameters in clock and nonclock trees. Under the free rates model(= nonclock), all the branches need to be estimated (2n ! 3). Under the molecular clock,only n ! 1 branches have to be estimated. The difference in the number of parametersamong a nonclock and a clock model is n ! 2.
Maximum-likelihood methods can estimate the branch lengths of a tree by enforc-ing or not enforcing a molecular clock. In the absence of a molecular clock (thefree-rates model), 2n ! 3 branch lengths must be inferred for a strictly bifurcatingunrooted phylogenetic tree with n taxa (Figure 10.5B). If the molecular clock isenforced, the tree is rooted, and just n ! 1 branch lengths need to be estimated (seeFigure 10.4 and Chapter 1). This should appear obvious considering that under amolecular clock, for any two taxa sharing a common ancestor, only the length of thebranch from the ancestor to one of the taxa needs to be estimated, the other one be-ing the same. Statistically speaking, the molecular clock is the null hypothesis (i.e.,the rate of evolution is equal for all branches of the tree) and represents a specialcase of the more general alternative hypothesis that assumes a specific rate for eachbranch (i.e., free-rates model). Thus, given a tree relating n taxa, the LRT can beused to evaluate whether the taxa have been evolving at the same rate (Felsenstein,1988). In practice, a model of nucleotide (or amino-acid) substitution is chosenand the branch lengths of the tree with and without enforcing the molecular clockare estimated. To assess the significance of this test, the LRT can be compared witha !2 distribution with (2n ! 3) ! (n ! 1) = n ! 2 degrees of freedom, becausethe only difference in parameter estimates is in the number of branch lengths thatneeds to be estimated.
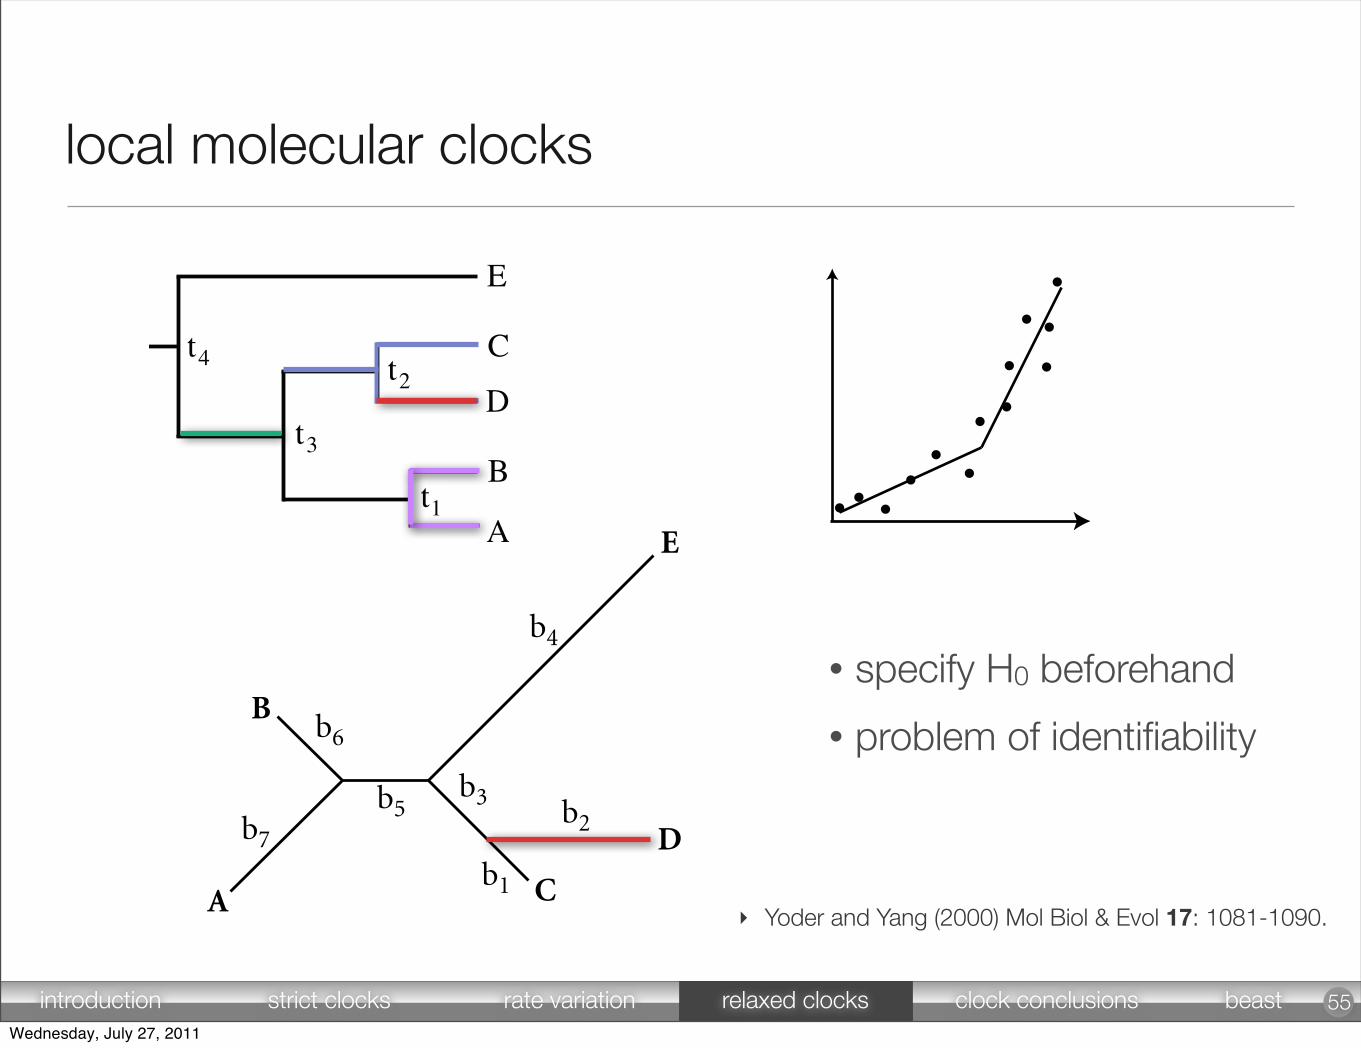
• specify H0 beforehand
• problem of identifiability
‣ Yoder and Yang (2000) Mol Biol & Evol 17: 1081-1090.
55
local molecular clocks
introduction strict clocks rate variation relaxed clocks clock conclusions beastWednesday, July 27, 2011
• Most relaxed clock models assume inheritance of rates of evolution, resulting in correlation between ancestral lineages and their descendants
- e.g., Thorne & Kashino (1998) Mol Biol Evol, 15: 1647-165
- Descendant branches draw a rate from a distribution with a mean given by the ancestral branch. Distributions can be exponential, gamma, lognormal etc.
- Assume a single fixed tree topology
- Use Bayesian MCMC to sample rates and times given the tree
56
relaxed molecular clocks
introduction strict clocks rate variation relaxed clocks clock conclusions beastWednesday, July 27, 2011
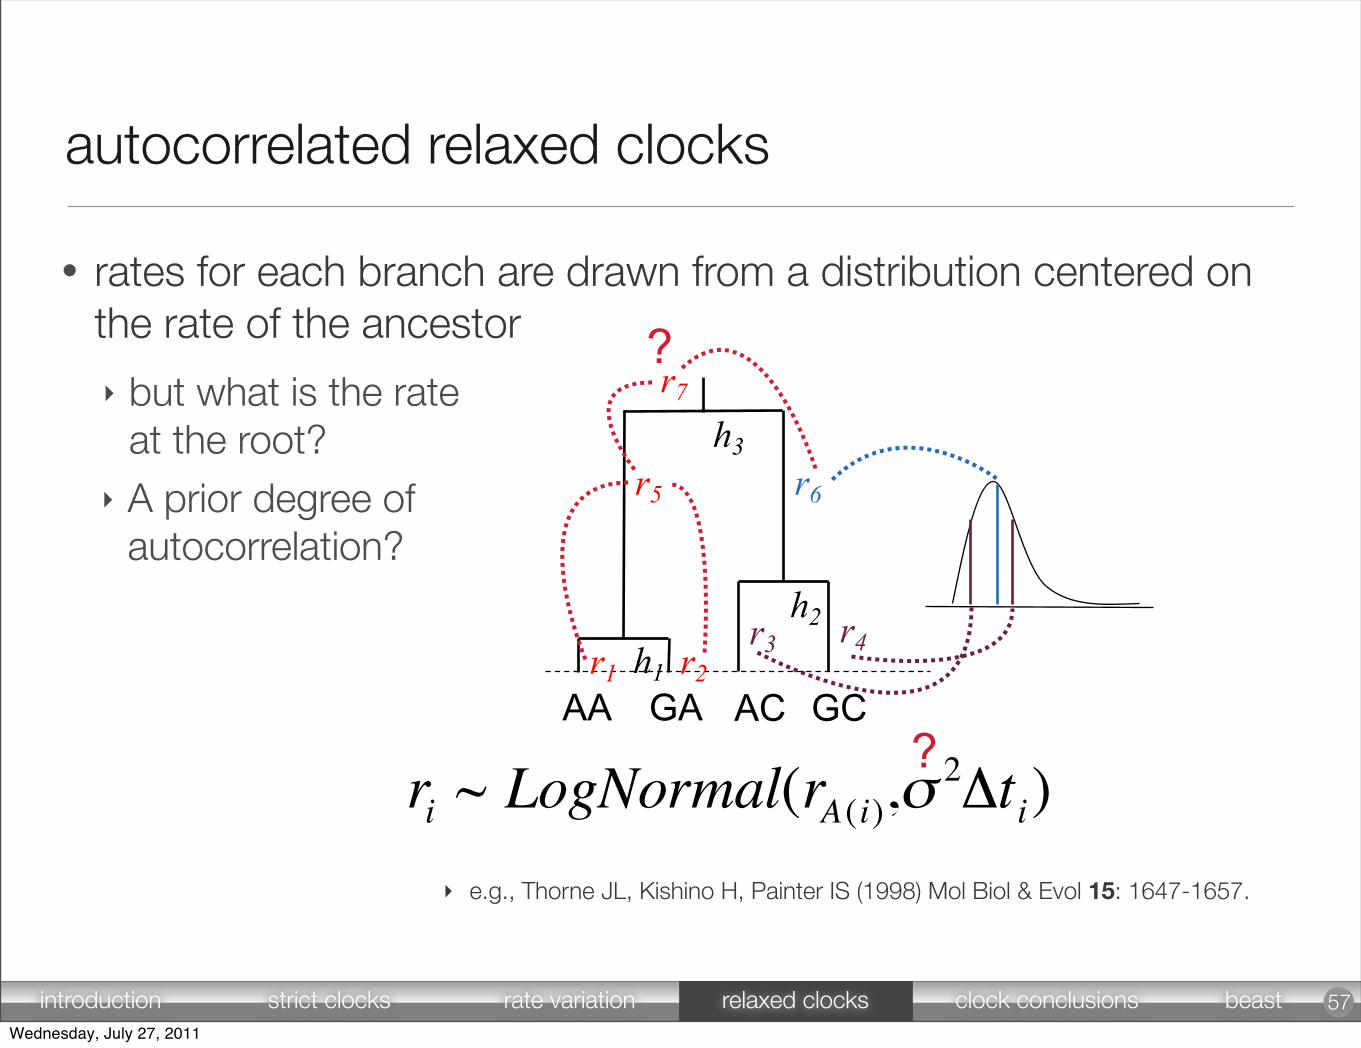
• rates for each branch are drawn from a distribution centered on the rate of the ancestor
€
ri ~ LogNormal(rA (i),σ2Δti)
AA
h3
h1
h2
GA AC GC
r6r5
r4r3r2r1
r7
‣ e.g., Thorne JL, Kishino H, Painter IS (1998) Mol Biol & Evol 15: 1647-1657.
?
?
‣ A prior degree ofautocorrelation?
‣ but what is the rate at the root?
57
autocorrelated relaxed clocks
introduction strict clocks rate variation relaxed clocks clock conclusions beastWednesday, July 27, 2011
AA
h3
h1
h2
GA AC GC
r6r5
r4r3r2r1€
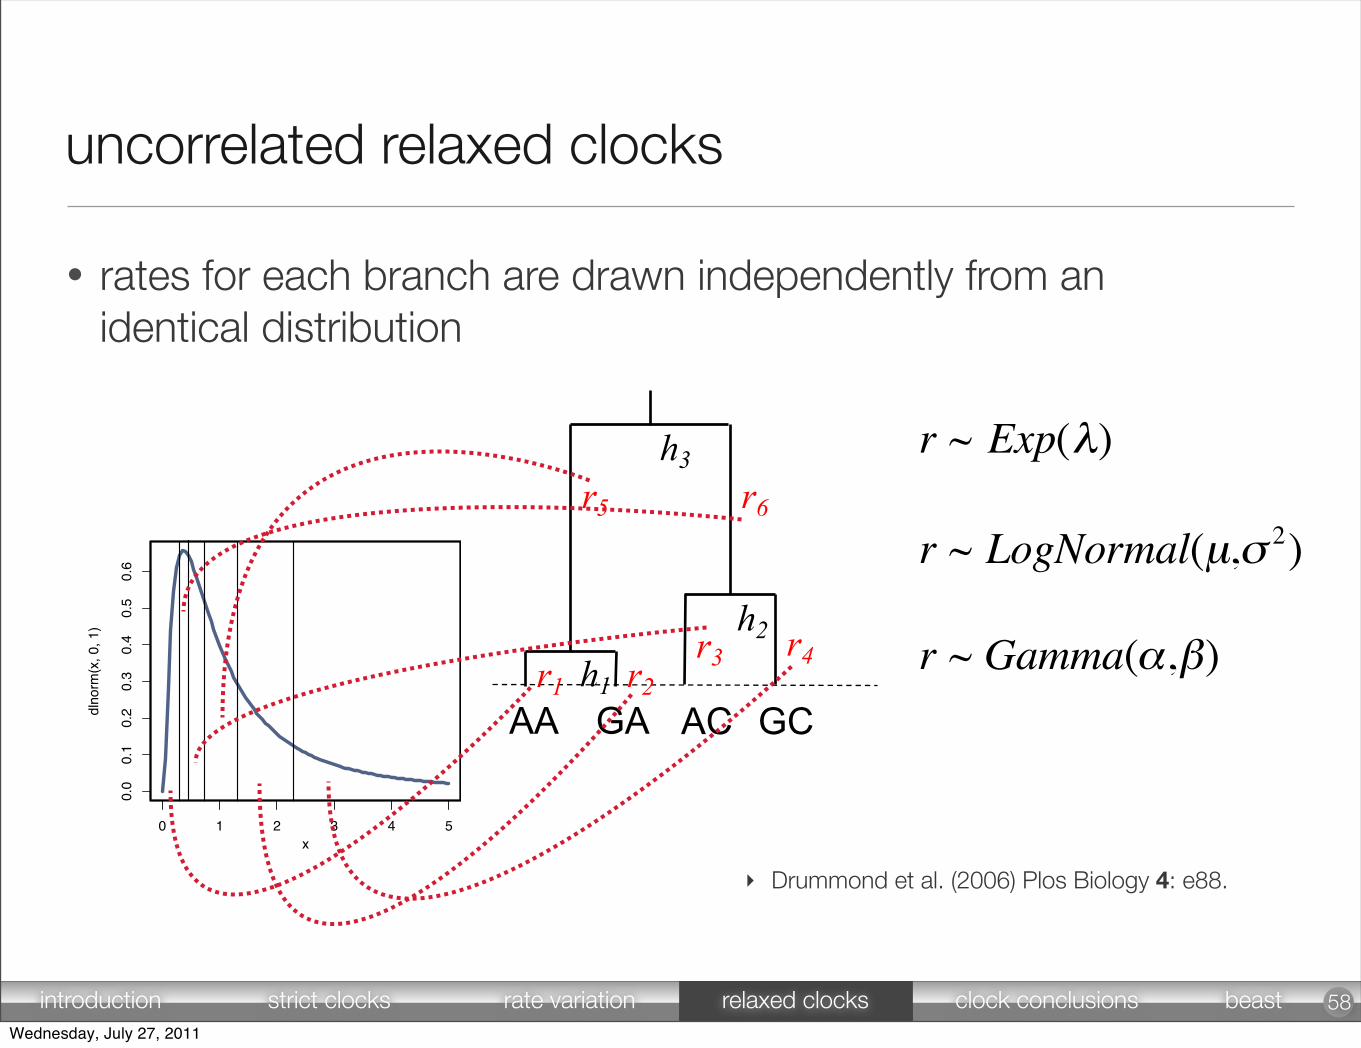
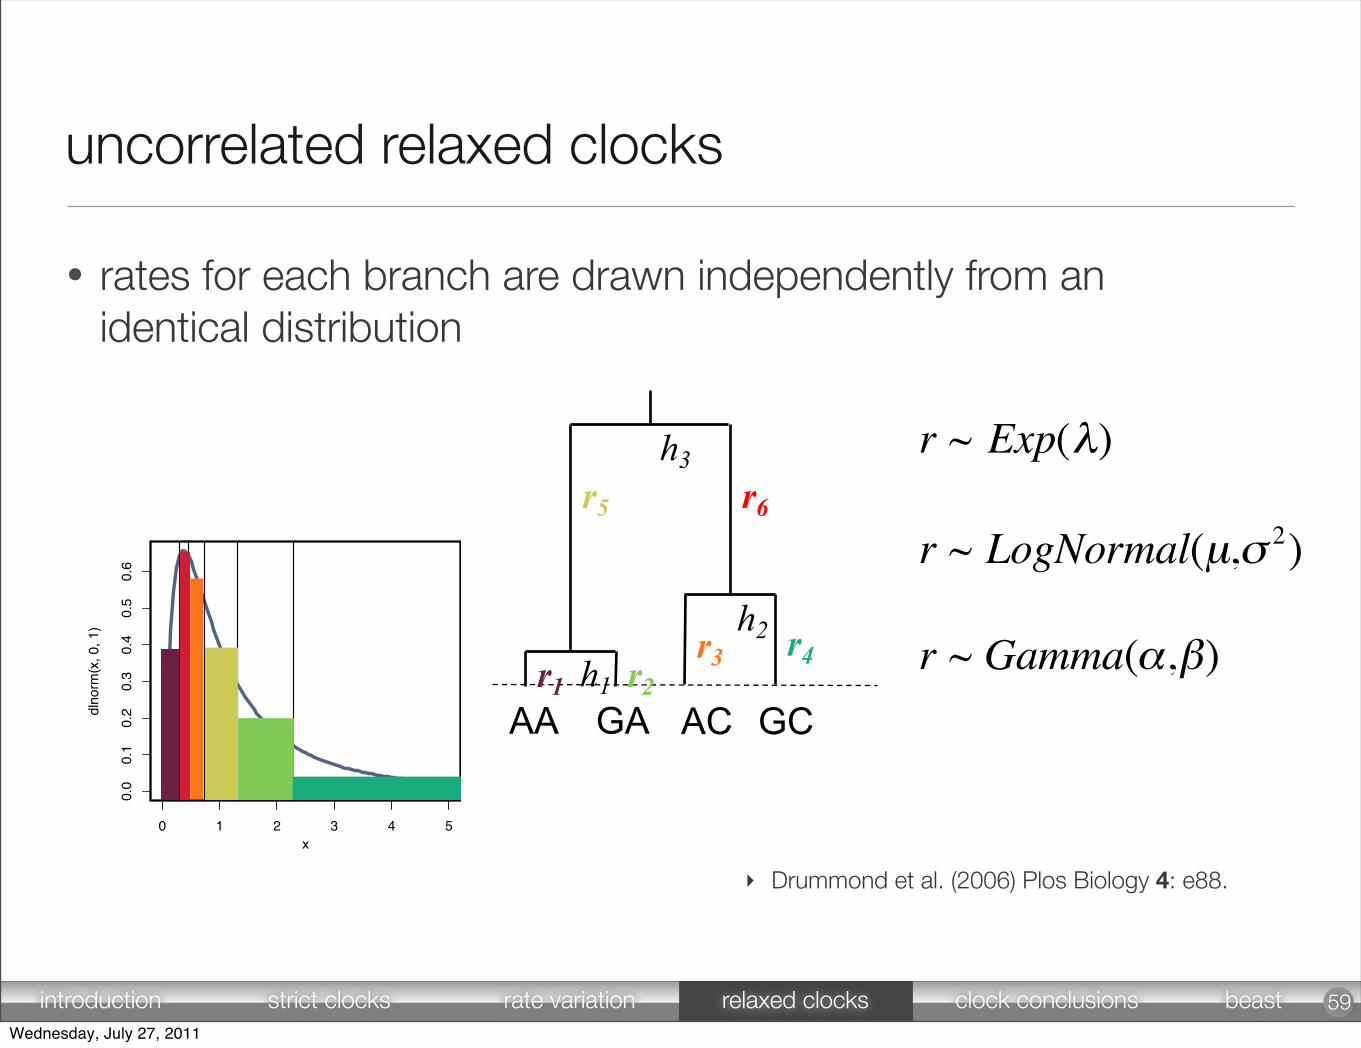
r ~ Exp(λ) [7]
€
r ~ LogNormal(µ,σ 2) [8]
€
r ~ Gamma(α,β) [9]
0 1 2 3 4 5
0.0
0.1
0.2
0.3
0.4
0.5
0.6
x
dlno
rm(x
, 0, 1
)
‣ Drummond et al. (2006) Plos Biology 4: e88.
58
• rates for each branch are drawn independently from an identical distribution
uncorrelated relaxed clocks
introduction strict clocks rate variation relaxed clocks clock conclusions beastWednesday, July 27, 2011
AA
h3
h1
h2
GA AC GC
r6r5
r4r3r2r1€
r ~ Exp(λ) [7]
€
r ~ LogNormal(µ,σ 2) [8]
€
r ~ Gamma(α,β) [9]
0 1 2 3 4 5
0.0
0.1
0.2
0.3
0.4
0.5
0.6
x
dlno
rm(x
, 0, 1
)
‣ Drummond et al. (2006) Plos Biology 4: e88.
59
• rates for each branch are drawn independently from an identical distribution
uncorrelated relaxed clocks
introduction strict clocks rate variation relaxed clocks clock conclusions beastWednesday, July 27, 2011
60
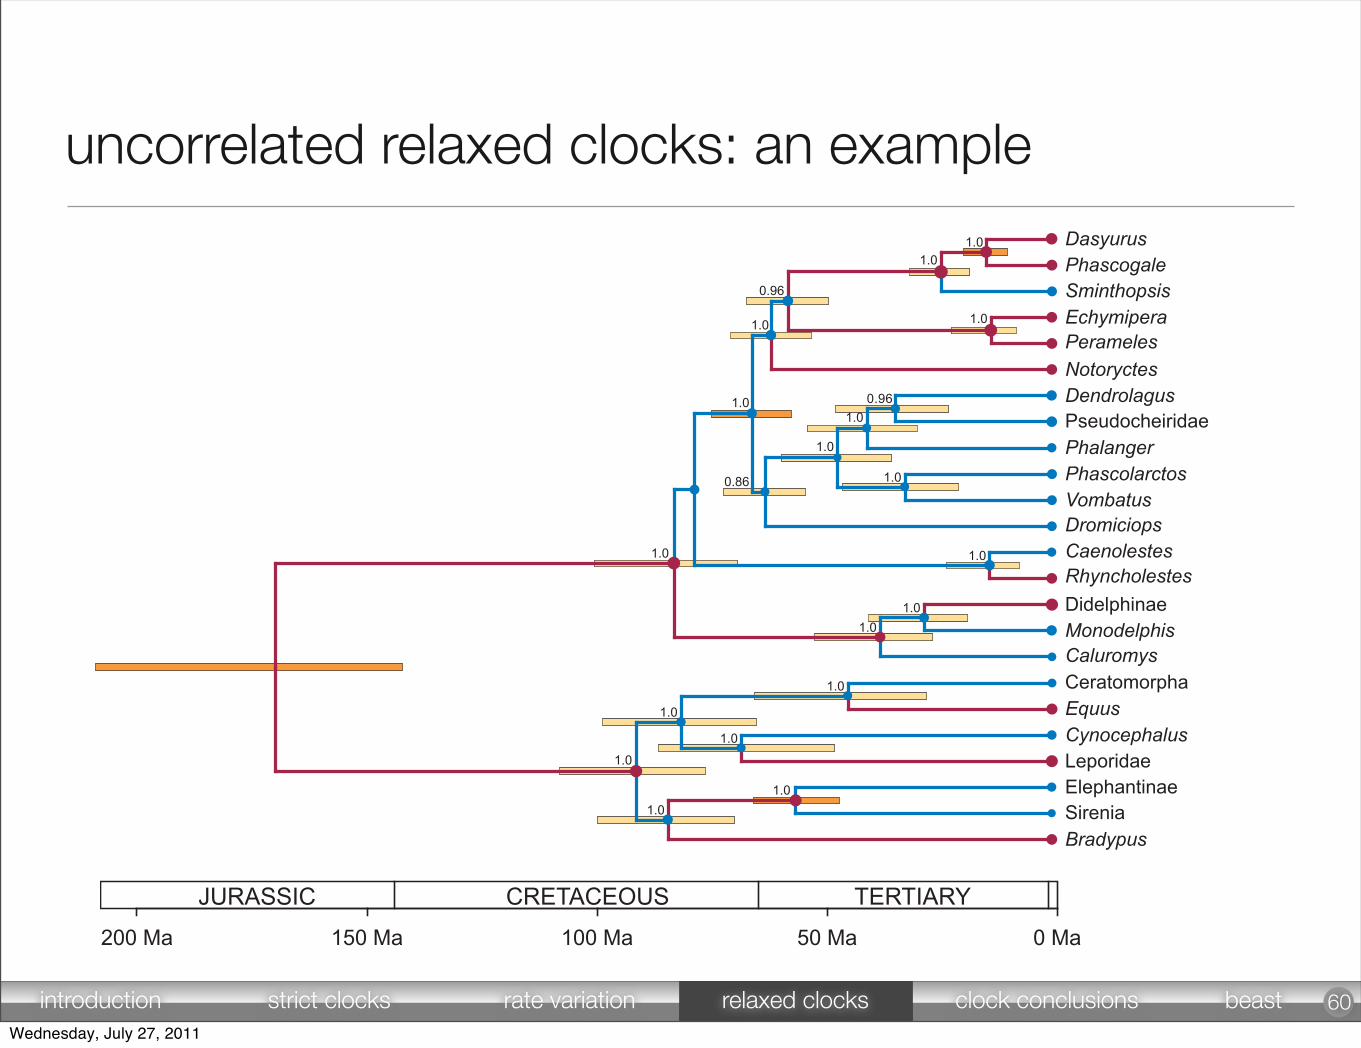
uncorrelated relaxed clocks: an example
introduction strict clocks rate variation relaxed clocks clock conclusions beastWednesday, July 27, 2011

Slow
Ape
s
Fast Rodent
1
=i
00
00
0
1
0
Random local clocks
➡ Rate changes do not necessarily occur regularly or on every branch➡ Small number of significant changes➡ Can we handle the uncertainty in the number and locations of (a
small number of) local clocks?
•three local clocks•two rate changes
➡ How to explore 22n-2 clock models?
Wednesday, July 27, 2011
0 2 4 6 8 10 12
0.0
0.1
0.2
0.3
0.4
0.5
0.6
# of Rate Changes
Prob
abilit
y
PosteriorPrior
Random local clocks
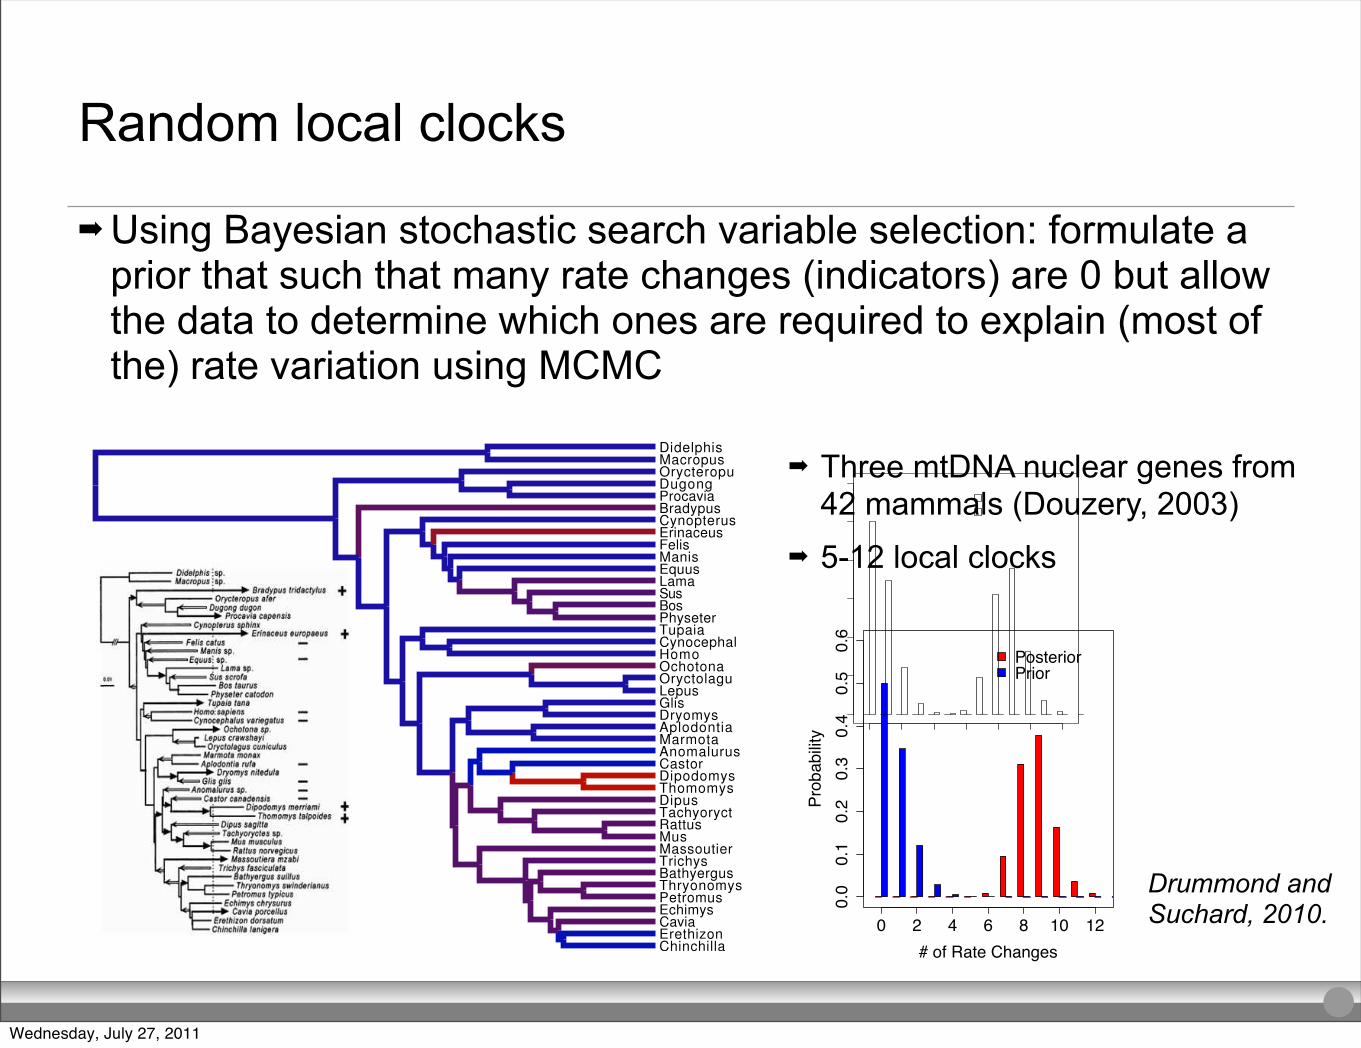
➡ Using Bayesian stochastic search variable selection: formulate a prior that such that many rate changes (indicators) are 0 but allow the data to determine which ones are required to explain (most of the) rate variation using MCMC
Local Clock Comparison withDouzery (2003)
3 Nuclear Genes from 42 Mammals (GTR + !)
0 2 4 6 8 10 12
0.0
0.1
0.2
0.3
0.4
0.5
0.6
# of Rate Changes
Prob
abilit
y
PosteriorPrior
Consistentresults (5-12local clocks).
RLC model provides an automated approach to discover localclocks and their uncertainty.
PhyloGroup, September 2007 – p.9
➡ Three mtDNA nuclear genes from 42 mammals (Douzery, 2003)
➡ 5-12 local clocks
Drummond and Suchard, 2010.
Wednesday, July 27, 2011
relaxed clocks: summary
• can be used to estimate phylogenies and divergence times in the face of uncertainty in evolutionary rates and divergence times
• provides a means for measuring the clocklike-ness of data and comparing this measurement between different genes and different taxonomic groups
• allows investigation of autocorrelation between rates
rates of evolution are drawn randomly from some parametric distribution
parameters of substitution (rate and variance) can be estimated
63introduction strict clocks rate variation relaxed clocks clock conclusions beastWednesday, July 27, 2011
summary
• a molecular clock is a reasonable assumption... sometimes
• molecular clocks make it possible to correlate genetic divergence with time
estimate divergence dates, timing of demogrpahic and phylogenetic events, etc
• clocks need to be calibrated
• various statistical tests have been developed to test the clock-likeness of any particular data set
64introduction clocks calibrations clock tests relaxed clocks conclusionWednesday, July 27, 2011
vicariance versus dispersal: ratite birds
Wednesday, July 27, 2011
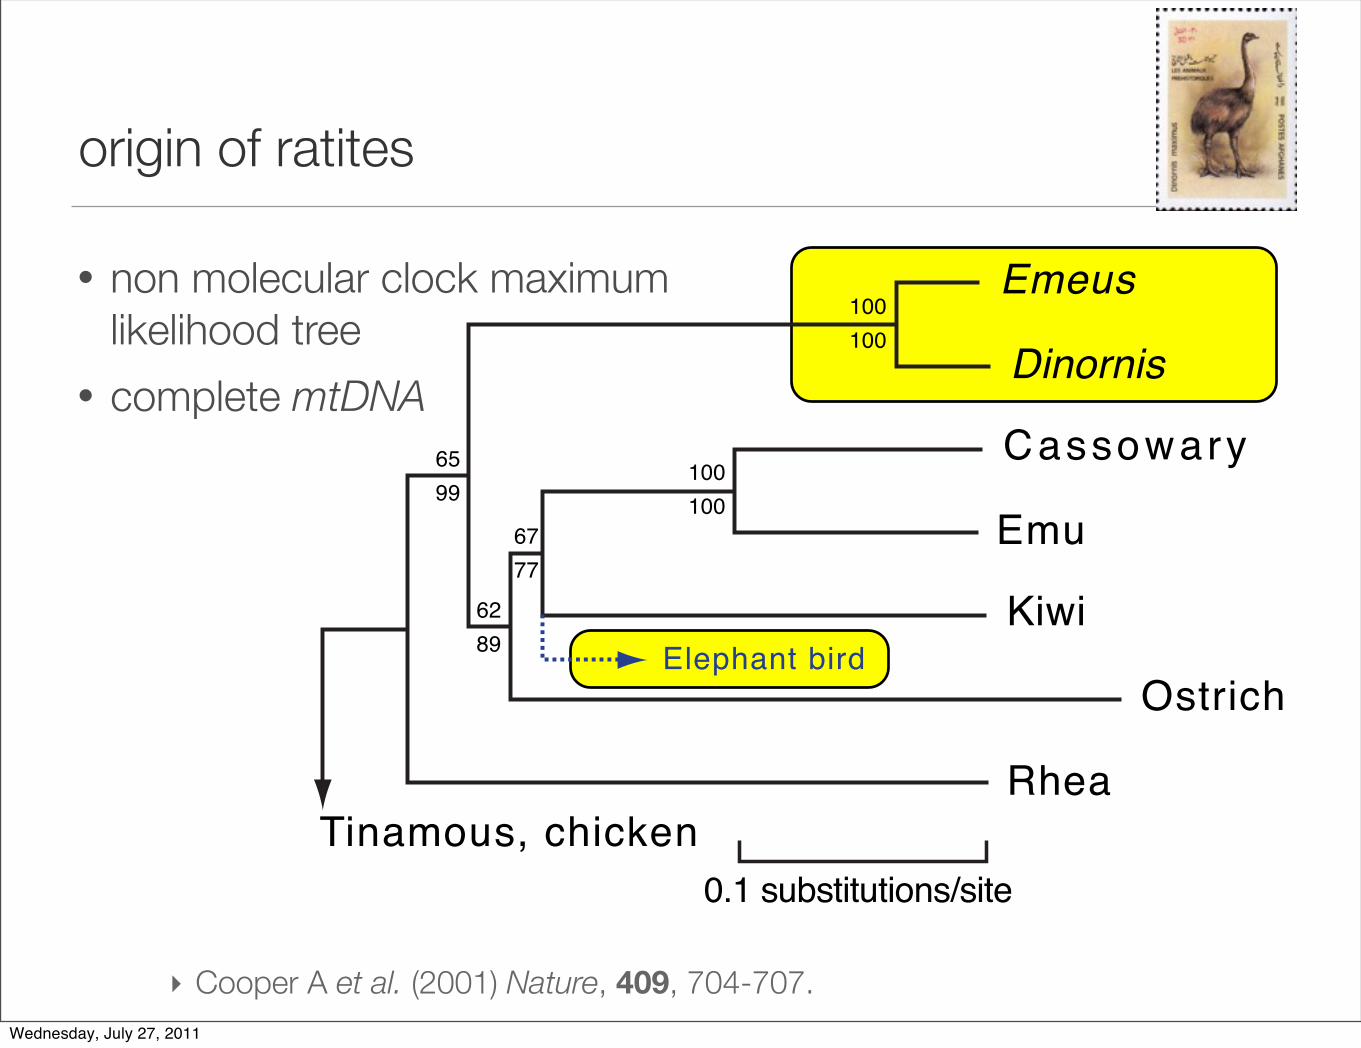
origin of ratites
• non molecular clock maximum likelihood tree
• complete mtDNA
‣ Cooper A et al. (2001) Nature, 409, 704-707.Wednesday, July 27, 2011

vicariance and dispersal
• is ostrich evolving faster?
• did it reach Africa via dispersalrather than vicariance?
• is the tree wrong?
80 My reconstruction
Wednesday, July 27, 2011
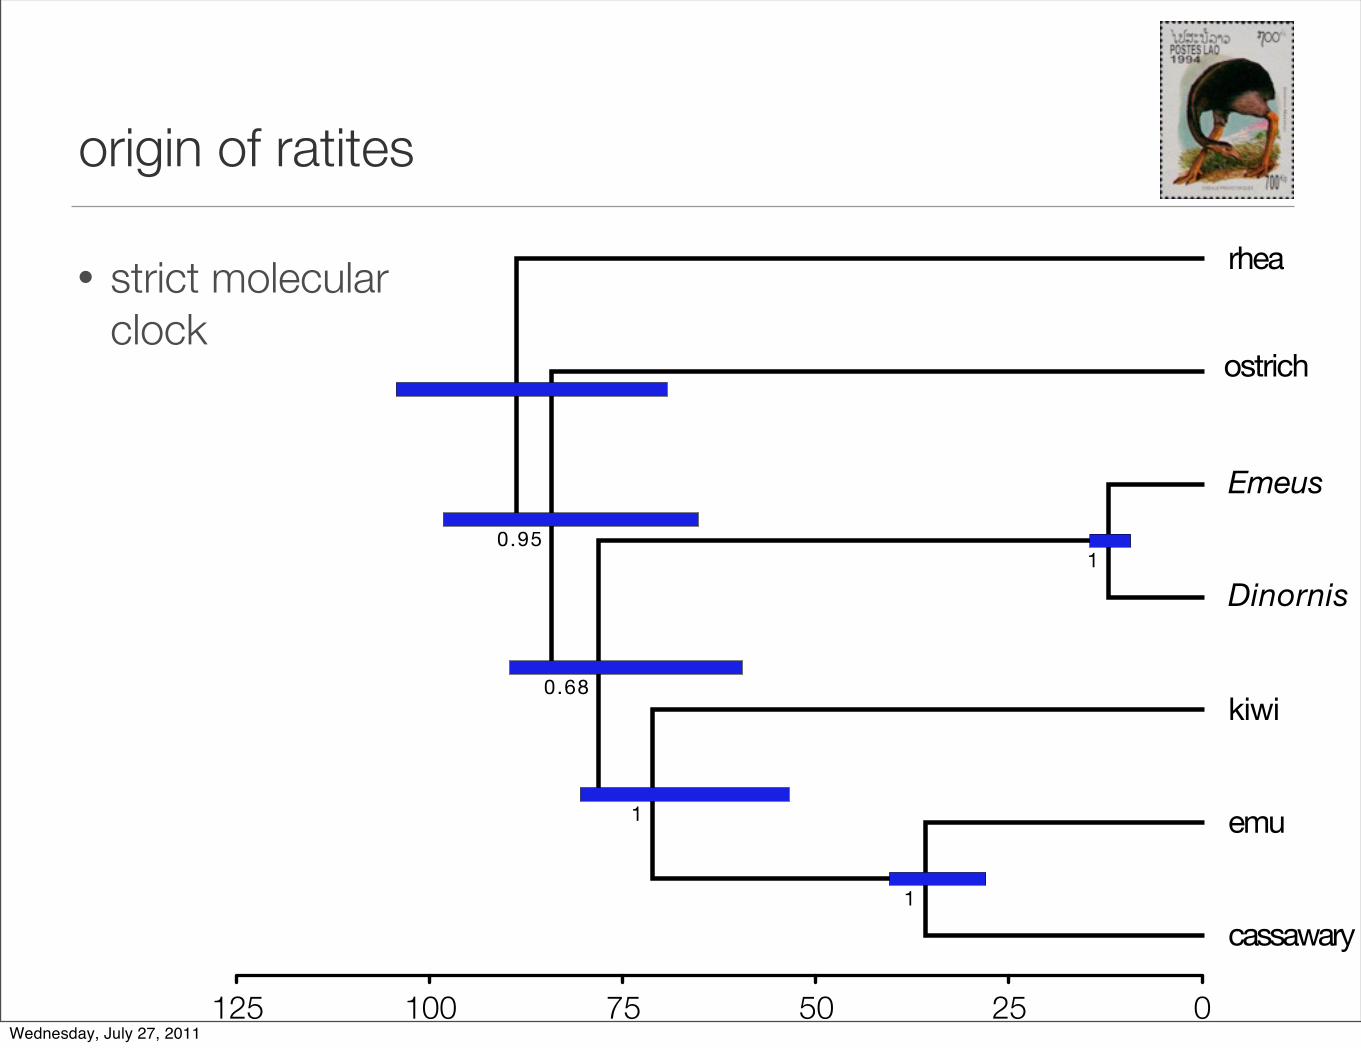
origin of ratites
• strict molecularclock
Wednesday, July 27, 2011
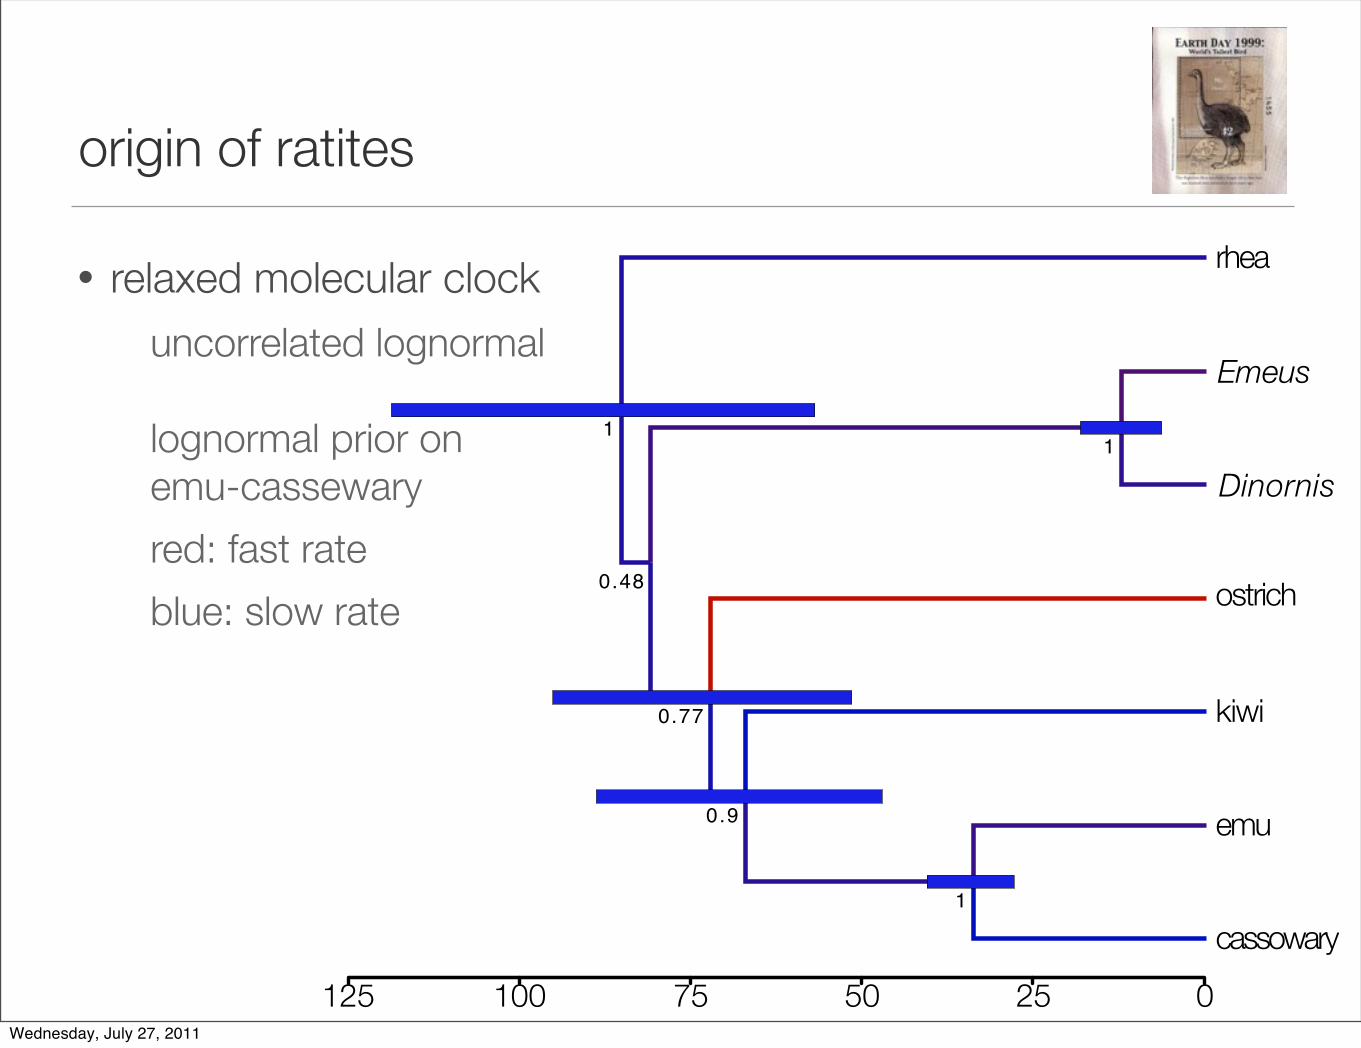
origin of ratites
• relaxed molecular clock
uncorrelated lognormal
lognormal prior on emu-cassewary
red: fast rate
blue: slow rate
Wednesday, July 27, 2011
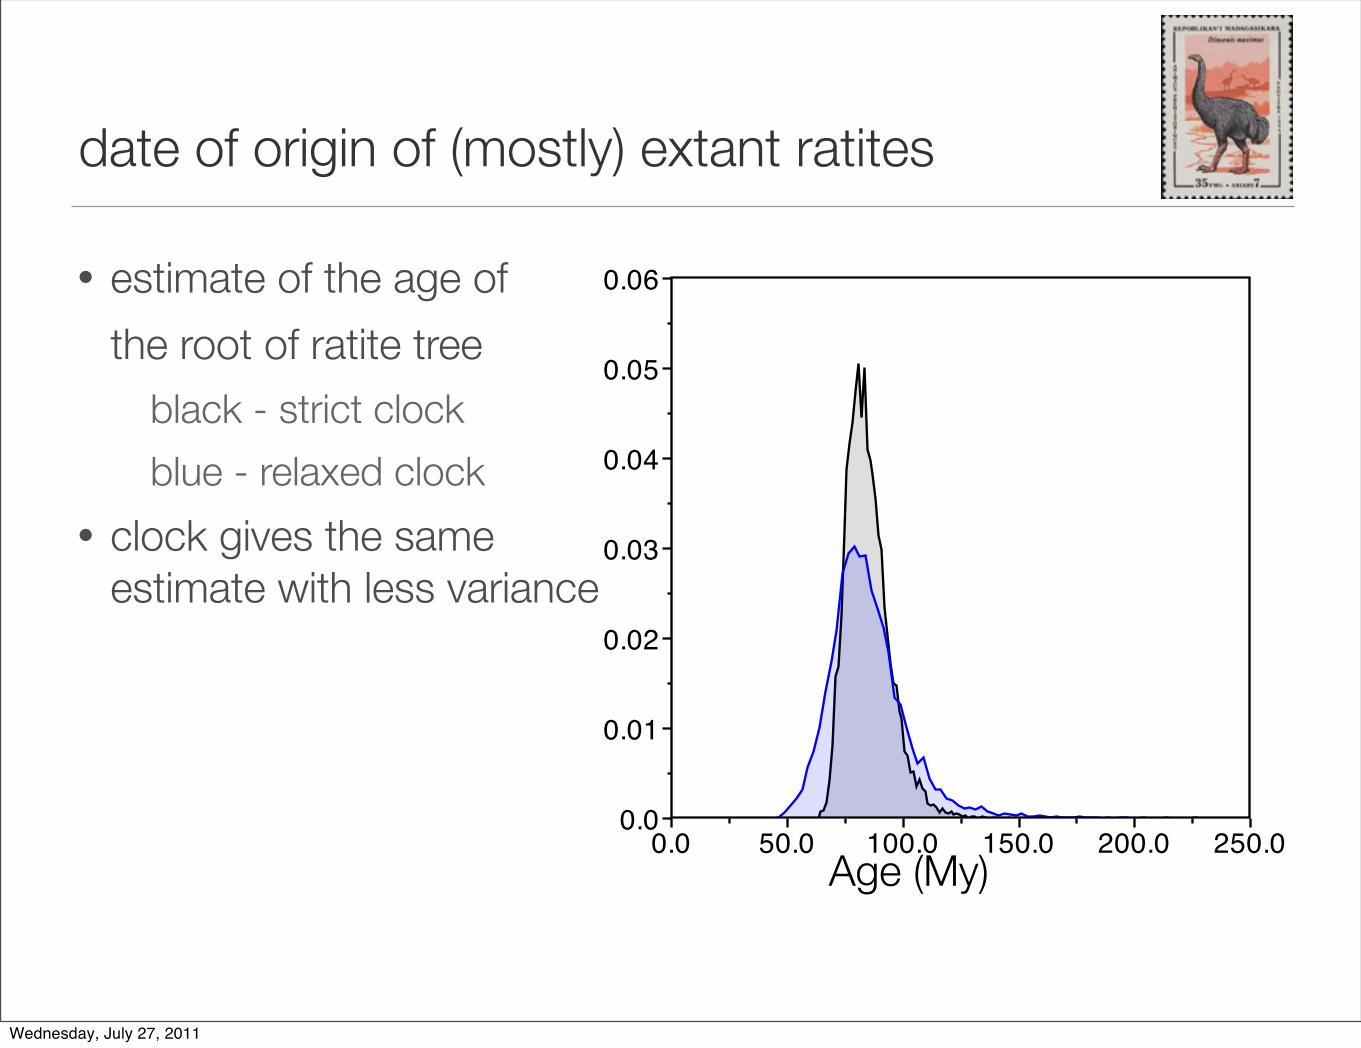
date of origin of (mostly) extant ratites
• estimate of the age of
the root of ratite tree
black - strict clock
blue - relaxed clock
• clock gives the sameestimate with less variance
treeModel.rootHeight
0.0 50.0 100.0 150.0 200.0 250.00.0
0.01
0.02
0.03
0.04
0.05
0.06
Age (My)
Wednesday, July 27, 2011
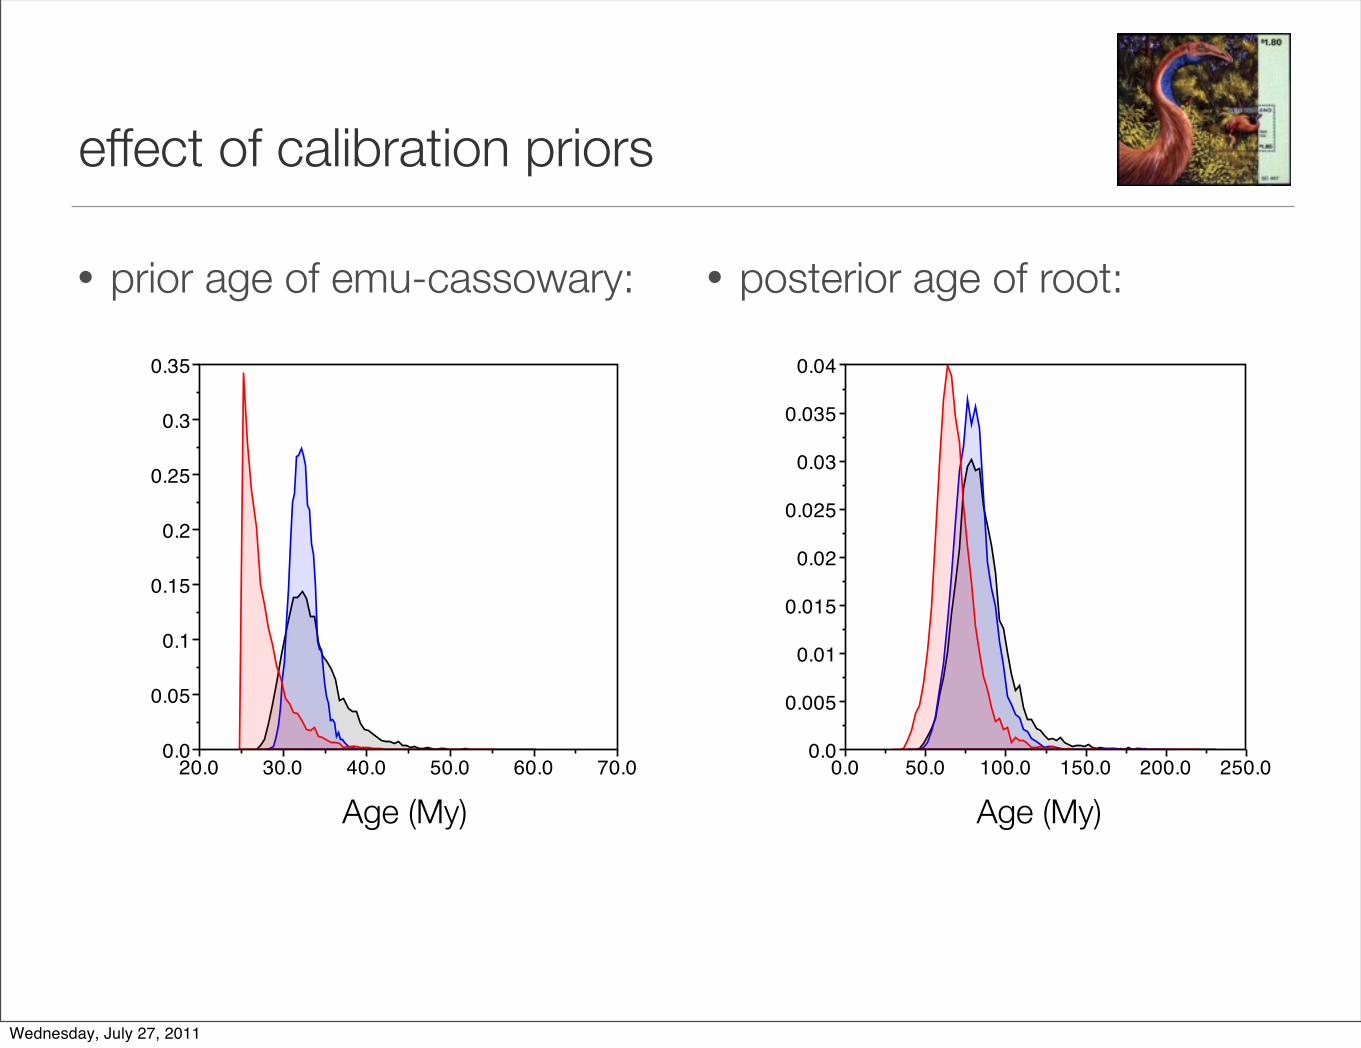
effect of calibration priors
• prior age of emu-cassowary: • posterior age of root:
tmrca(Oz)
20.0 30.0 40.0 50.0 60.0 70.00.0
0.05
0.1
0.15
0.2
0.25
0.3
0.35
treeModel.rootHeight
0.0 50.0 100.0 150.0 200.0 250.00.0
0.005
0.01
0.015
0.02
0.025
0.03
0.035
0.04
Age (My)Age (My)
Wednesday, July 27, 2011

break
Wednesday, July 27, 2011