GNA Axles Limited - Angel...
12
Please refer to important disclosures at the end of this report 1 GNA Axles Ltd (GNAAL) is a Punjab based manufacturer of rear axle shafts, other shafts and spindles used in on-highway vehicular (including LCVs, MCVs, HCVs, bus etc) and off-highway vehicular (agricultural tractors and machinery, forestry, construction equipment, mining etc) segments. In FY2016, the company’s revenue mix was constituted by domestic and export segments in the proportion of ~45% and ~55% respectively. GNAAL’s customers include OEMs such as Mahindra & Mahindra, John Deere, Tractors and Farm Equipment (TAFE) and tier 1 suppliers to OEMs such as Automotive Axles, Meritor HVS AB and Dana. The company has two manufacturing facilities, both of which are located in Punjab. It exports products to various countries across America, Europe and Asia Pacific. Strong recovery in tractor segment to drive growth: 70% of the company’s domestic revenue comes from the tractor segment where it holds an ~50% market share. In the last two years, we have seen de-growth in the tractor industry due to poor monsoons which has resultantly impacted GNAAL’s domestic revenue growth. However, during 5MFY2017, we saw a strong (~19% yoy) recovery at major tractor players, thanks to the optimal monsoon this year. Going forward we expect the company’s domestic revenue to improve on the back of strong recovery in the tractor segment. Strong global footprint: GNAAL’s export revenue is constituted by America (~49%), Europe (~33%), the Asia Pacific (~18%), and the balance is accounted by Australia. Exports constitute ~55% of the company’s total revenue. The company’s major clients include Meritor HVS AB, John Deere, Transaxle Manufacturing of America, Dana Ltd and Kubota Corporation. The company reported a strong ~33% export revenue CAGR over FY2013-16; we expect continuation of healthy growth over the next 2-3 years on the back of low cost manufacturing advantages in India, the company’s diversified product portfolio, strong growth in the US market and with the company tapping newer international geographies. Consistent operating margin improvement: GNAAL has consistently been reporting margin improvement over the last five years on back of its effective cost management strategy and higher composition of exports in the revenue mix which entail better margins vis-a-vis the domestic market. The company has reported operating margin improvement from 13.0% in FY2012 to 16.2% in FY2016. Going forward, we expect GNAAL to continue to deliver a healthy performance on the operating front. Outlook & Valuation: In terms of valuations, the pre-issue P/E works out to 12.1x its FY2016 earnings (at the upper end of the issue price band) which is lower compared to its peers (Talbros Engineering is trading at 19.5x its FY2016 earnings). Also, GNAAL has a better margin and ROE profile than its comparable peers. Considering high export revenue composition, expected recovery in domestic sales and the company’s market leadership position in the tractor segment; plus, given the relatively attractive valuation proposition, we recommend a SUBSCRIBE on the issue. SUBSCRIBE Issue Open: September 14, 2016 Issue Close: September 16, 2016 Note:*at Lower price band and **Upper price band QIBs 50% Non-Institutional 15% Retail 35% Post Issue Shareholding Pattern(%) Promoters Group 70.7 MF/Banks/Indian FIs/FIIs/Public & Others 29.3 Book Building Face Value: `10 Present Eq. Paid up Capital: `15.2cr Fresh Issue: 0.63cr Shares Offer for sale:-NA Post Eq. Paid up Capital: `21.5cr Market Lot: 70 Shares Issue (amount): `129*-130cr** Price Band: `205-207 Post-issue implied mkt. cap `440cr*- 444cr** Amarjeet S Maurya +91 22 4000 3600 Ext: 6831 [email protected] GNA Axles Limited IPO Note – Attractive on Valuations: Subscribe IPO Note | Auto ancillary September 9, 2016
Transcript of GNA Axles Limited - Angel...

Please refer to important disclosures at the end of this report 1
GNA Axles Ltd (GNAAL) is a Punjab based manufacturer of rear axle shafts, othershafts and spindles used in on-highway vehicular (including LCVs, MCVs, HCVs,bus etc) and off-highway vehicular (agricultural tractors and machinery, forestry,construction equipment, mining etc) segments. In FY2016, the company’s revenuemix was constituted by domestic and export segments in the proportion of ~45%and ~55% respectively. GNAAL’s customers include OEMs such as Mahindra &Mahindra, John Deere, Tractors and Farm Equipment (TAFE) and tier 1 suppliersto OEMs such as Automotive Axles, Meritor HVS AB and Dana. The company hastwo manufacturing facilities, both of which are located in Punjab. It exportsproducts to various countries across America, Europe and Asia Pacific.
Strong recovery in tractor segment to drive growth: 70% of the company’sdomestic revenue comes from the tractor segment where it holds an ~50%market share. In the last two years, we have seen de-growth in the tractor industrydue to poor monsoons which has resultantly impacted GNAAL’s domestic revenuegrowth. However, during 5MFY2017, we saw a strong (~19% yoy) recovery atmajor tractor players, thanks to the optimal monsoon this year. Going forward weexpect the company’s domestic revenue to improve on the back of strong recoveryin the tractor segment.
Strong global footprint: GNAAL’s export revenue is constituted by America(~49%), Europe (~33%), the Asia Pacific (~18%), and the balance is accountedby Australia. Exports constitute ~55% of the company’s total revenue. Thecompany’s major clients include Meritor HVS AB, John Deere, TransaxleManufacturing of America, Dana Ltd and Kubota Corporation. The companyreported a strong ~33% export revenue CAGR over FY2013-16; we expectcontinuation of healthy growth over the next 2-3 years on the back of low costmanufacturing advantages in India, the company’s diversified product portfolio,strong growth in the US market and with the company tapping newerinternational geographies.
Consistent operating margin improvement: GNAAL has consistently beenreporting margin improvement over the last five years on back of its effective costmanagement strategy and higher composition of exports in the revenue mix whichentail better margins vis-a-vis the domestic market. The company has reportedoperating margin improvement from 13.0% in FY2012 to 16.2% in FY2016.Going forward, we expect GNAAL to continue to deliver a healthy performanceon the operating front.
Outlook & Valuation: In terms of valuations, the pre-issue P/E works out to 12.1xits FY2016 earnings (at the upper end of the issue price band) which is lowercompared to its peers (Talbros Engineering is trading at 19.5x its FY2016earnings). Also, GNAAL has a better margin and ROE profile than its comparablepeers. Considering high export revenue composition, expected recovery indomestic sales and the company’s market leadership position in the tractorsegment; plus, given the relatively attractive valuation proposition, werecommend a SUBSCRIBE on the issue.
SUBSCRIBE Issue Open: September 14, 2016 Issue Close: September 16, 2016
Note:*at Lower price band and **Upper price band
QIBs 50%
Non-Institutional 15%
Retail 35%
Post Issue Shareholding Pattern(%)
Promoters Group 70.7
MF/Banks/Indian FIs/FIIs/Public & Others 29.3
Book Building
Face Value: `10
Present Eq. Paid up Capital: `15.2cr
Fresh Issue: 0.63cr Shares
Offer for sale:-NA
Post Eq. Paid up Capital: `21.5cr
Market Lot: 70 Shares
Issue (amount): `129*-130cr**
Price Band: `205-207
Post-issue implied mkt. cap `440cr*- 444cr**
Amarjeet S Maurya
+91 22 4000 3600 Ext: 6831
GNA Axles Limited IPO Note – Attractive on Valuations: Subscribe
IPO Note | Auto ancillary
September 9, 2016

GNA Axles | IPO Note
September 9, 2016 2
Exhibit 1: Key Financial
Y/E March (` cr) FY2012 FY2013 FY2014 FY2015 FY2016
Net Sales 399 349 404 430 509
% chg - (12.5) 15.8 6.5 18.2
Net Profit 17 5 13 22 26
% chg - (71.6) 175.6 62.8 20.2
OPM (%) 13.0 12.6 12.6 14.0 16.2
EPS (`) 11.2 3.2 8.7 14.2 17.1
P/E (x) 18.5 65.2 23.7 14.5 12.1
P/BV (x) 4.3 4.0 3.4 2.8 2.3
RoE (%) 23.0 6.1 14.5 19.1 18.8
RoCE (%) 26.9 16.9 16.4 15.4 22.4
EV/Sales (x) 1.0 1.2 1.1 1.0 0.8
EV/EBITDA (x) 7.5 9.4 8.4 7.3 5.1
Source: Company, Angel Research; Note: Valuation ratios based on pre-issue outstanding shares and at upper end of the price band
Company background
GNAAL is a Punjab based manufacturer of rear axle shafts, other shafts and spindles used in on-highway and off-highway vehicular segments. The company manufactures a range of rear axle shafts, other shafts, and spindles for the on-highway segment vehicles, including light commercial vehicles, medium commercial vehicles, and heavy commercial vehicles, as well as other transport vehicles, such as buses. It also offers a range of rear axle shafts and other shafts for the off-highway segment, which include agricultural tractors and machinery, forestry and construction equipment, electric carts, and other specialty vehicles used in mining and defense sectors.
In FY2016, the company’s revenue mix was constituted by domestic and export segments in the proportion of ~45% and ~55% respectively. Its customers include OEM's such as Mahindra & Mahindra, John Deere, Tractors and Farm Equipment (TAFE) and tier 1 suppliers to OEMs such as Automotive Axles, Meritor HVS AB and Dana.
The company exports its products to various countries including the United States, Sweden, Turkey, Brazil, Italy, Germany, Spain, Mexico, Japan, the United Kingdom, France, China, and Australia. It has two manufacturing facilities: Unit I located in village Mehtiana, district Hoshiarpur, Punjab and Unit II located at village Gulabgarh Jattan, district Kapurthala, Punjab. Both of its manufacturing facilities are ISO/TS 16949:2009 certified for manufacture of rear axle shafts, other shafts and spindles for automotive applications.

GNA Axles | IPO Note
September 9, 2016 3
Exhibit 2: Product portfolio
Source: Company, Angel Research
Issue details
The company is raising `129-130cr through fresh issue (0.63cr share) of equity shares in the price band of `205-207. The fresh issue will constitute ~29% of the post-issue paid-up equity share capital of the company assuming the issue is subscribed at the upper end of the price band.
Exhibit 3: Shareholding pattern Particulars Pre-Issue Post-Issue
No. of shares (%) No. of shares (%)
Promoter group 15,165,400 100.0% 15,165,400 70.7%
Others - - 6300000 29.3%
Total 15,165,400 100.0% 21,465,400 100.0%
Source: Company, Angel Research
Objects of the offer
~`80cr will be used for purchase of plant & machinery.
~`35cr will be used for funding working capital requirements.
The balance will be used for general corporate purposes.

GNA Axles | IPO Note
September 9, 2016 4
Investment rationale
Company to benefit from expected CV segment growth
Going forward, we expect strong growth in commercial vehicle sales on back of improvement in industrial activity and the government's focus on speeding up execution of infrastructure projects in the country. Further, implementation of the GST is expected to expedite the evolution of the hub-and-spoke model for transportation, which will create increased demand for LCVs and HCVs, thus benefitting the company.
Exhibit 4: Flat growth in domestic revenue over FY2013-16
Source: Company, Angel Research
Recovery in tractor segment to drive growth
70% of the company’s domestic revenue comes from the tractor segment where it holds an ~50% market share. In the last two years, we have seen de-growth in the tractor industry due to poor monsoons which has resultantly impacted GNAAL’s domestic revenue growth. However, during 5MFY2017, we saw a strong (~19% yoy) recovery at major tractor players, thanks to the optimal monsoon this year. Going forward we expect the company’s domestic revenue to improve on the back of strong recovery in the tractor segment.
232 261 225 228
(9.2)
12.6
(13.8)
1.2
(20)
(15)
(10)
(5)
0
5
10
15
200
210
220
230
240
250
260
270
FY2013 FY2014 FY2015 FY2016
(%)
(` c
r)
Domestic yoy growth (%)

GNA Axles | IPO Note
September 9, 2016 5
Exhibit 5: Domestic tractor sales trend
Source: Company, Angel Research Note: * Sales volume of M&M & Escorts which cover more than
50% market share.
Strong global footprint
GNAAL’s export revenue is constituted by America (~49%), Europe (~33%), the Asia Pacific (~18%), and the balance is accounted by Australia. Exports constitute ~55% of the company’s total revenue. The company’s major clients include Meritor HVS AB, John Deere, Transaxle Manufacturing of America, Dana Ltd and Kubota Corporation. The company reported a strong ~33% export revenue CAGR over FY2013-16; we expect continuation of healthy growth over the next 2-3 years on the back of low cost manufacturing advantages in India, the company’s diversified product portfolio, strong growth in the US market and with the company tapping newer international geographies.
Exhibit 6: Export % to total revenue
Source: Company, Angel Research
Exhibit 7: Historical export growth
Source: Company, Angel Research
Consistent operating margin improvement
GNAAL has been consistently reporting margin improvement over the last five years on back of its effective cost management strategy. It has been following measures such as adopting value engineering at die making to reduce the cost of input material, optimising tool consumption by using designated tools for designated processes, and shifting from furnace oil/diesel to electricity to minimise the burning losses in forging. Further, certain of its forging facilities have been robotised to increase capacity utilisation. Moreover, the company derives ~55%
11.4
(1.7)
19.9
(13.0)(10.5)
19.0
(15)
(10)
(5)
0
5
10
15
20
25 FY2012 FY2013 FY2014 FY2015 FY2016 5MFY2017*
(%)
349 404
431
50933.6 35.5
47.8
54.1
0
10
20
30
40
50
60
0
100
200
300
400
500
600
FY2013 FY2014 FY2015 FY2016
(%)
(`cr
)
Total revenue % to total revenue
117143
206
275
0
50
100
150
200
250
300
FY2013 FY2014 FY2015 FY2016
(`cr
)

GNA Axles | IPO Note
September 9, 2016 6
revenue from exports which entail higher margins compared to the domestic market. The company has reported operating margin improvement from 13.0% in FY2012 to 16.2% in FY2016. Going forward, we expect GNAAL to continue to deliver a healthy operating performance.
Exhibit 8: Historical operating margin trend
Source: Company, Angel Research
13.012.6 12.6
14.0
16.2
11
12
13
14
15
16
17
FY2012 FY2013 FY2014 FY2015 FY2016
(%)

GNA Axles | IPO Note
September 9, 2016 7
Outlook and Valuation
In terms of valuations, the pre-issue P/E works out to 12.1x its FY2016 earnings (at the upper end of the issue price band) which is lower compared to its peers (Talbros Engineering is trading at 19.5x its FY2016 earnings). Also, GNAAL has a better margin and ROE profile than its comparable peers. Considering high export revenue composition, expected recovery in domestic sales and the company’s market leadership position in the tractor segment; plus, given the relatively attractive valuation proposition, we recommend a SUBSCRIBE on the issue.
Exhibit 9: Comparative Valuation
P/E P/BV ROE EV/Sales EV/EBITDA
Pre issue valuation^
(x) (x) (%) (x) (x)
GNAAL FY2016 12.1 2.3 18.8 0.8 5.1
Talbros Engineering FY2016 19.5 1.8 9.4 0.6 8.9
Source: RHP, Bloomberg; Note: ^based on price at upper band & pre-market cap
Risks
Intense competition and lack of pricing power: Fewer entry barriers and high competition have resulted in a low pricing power in the industry.
Currency fluctuation: 55% of the company’s revenues come from exports; cross-currency headwinds could impact the company’s earnings going forward.
Client concentration risk: The top five and the top ten clients of the company account for ~50% and ~80% of the revenues, respectively, thus exposing the company to the risk of client concentration.

GNA Axles | IPO Note
September 9, 2016 8
Profit & Loss Statement
Y/E March (` cr) FY2012 FY2013 FY2014 FY2015 FY2016
Total operating income 399 349 404 430 509
% chg (12.5) 15.8 6.5 18.2
Total Expenditure 347 305 353 370 426
Raw Material Consumed 269 234 274 279 318
Personnel Expenses 14 16 19 21 24
Others Expenses 64 55 60 70 85
EBITDA 52 44 51 60 82
% chg (15.3) 15.8 19.0 36.3
(% of Net Sales) 13.0 12.6 12.6 14.0 16.2
Depreciation& Amortisation 12 14 17 23 27
EBIT 39 30 33 37 55
% chg (23.2) 10.6 12.0 47.4
(% of Net Sales) 9.9 8.7 8.3 8.7 10.9
Interest & other Charges 12 13 15 17 16
Other Income 0 0 0 1 0
(% of PBT) 0.1 0.7 1.3 2.7 1.1
Recurring PBT 28 18 18 21 39
% chg (36.7) 4.7 12.3 89.5
Extraordinary Expense/(Inc.) - - - - -
PBT (reported) 28 18 18 21 39
Tax 11 13 5 (1) 13
(% of PBT) 39.2 72.7 28.2 (4.1) 34.0
Reported PAT 17 5 13 22 26
% chg - (71.6) 175.6 62.8 20.2
(% of Net Sales) 4.2 1.4 3.3 5.0 5.1
Basic EPS (`) 11.2 3.2 8.7 14.2 17.1
Fully Diluted EPS (`) 11.2 3.2 8.7 14.2 17.1
% chg - (71.6) 175.6 62.8 20.2

GNA Axles | IPO Note
September 9, 2016 9
Balance Sheet
Y/E March (` cr) FY2012 FY2013 FY2014 FY2015 FY2016
SOURCES OF FUNDS
Equity Share Capital 15 15 15 15 15
Reserves& Surplus 59 63 76 98 123
Shareholders Funds 74 79 92 113 138
Total Loans 73 100 113 130 108
Other long term liabilities - - 16 - -
Deferred Tax Liability 3 11 13 6 4
Total Liabilities 150 190 233 249 250
APPLICATION OF FUNDS
Gross Block 161 194 248 285 301
Less: Acc. Depreciation 66 58 79 126 153
Net Block 95 137 169 160 147
Investments - - - - 0
Current Assets 172 181 213 267 299
Inventories 53 53 61 92 91
Sundry Debtors 85 87 111 122 162
Cash 1 1 1 0 1
Loans & Advances 13 15 15 23 18
Other Assets 21 25 25 30 27
Current liabilities 118 128 149 178 196
Net Current Assets 54 54 64 89 103
Mis. Exp. not written off - - - - -
Total Assets 150 190 233 249 250
GNA Axles | IPO Note
September 9, 2016 10
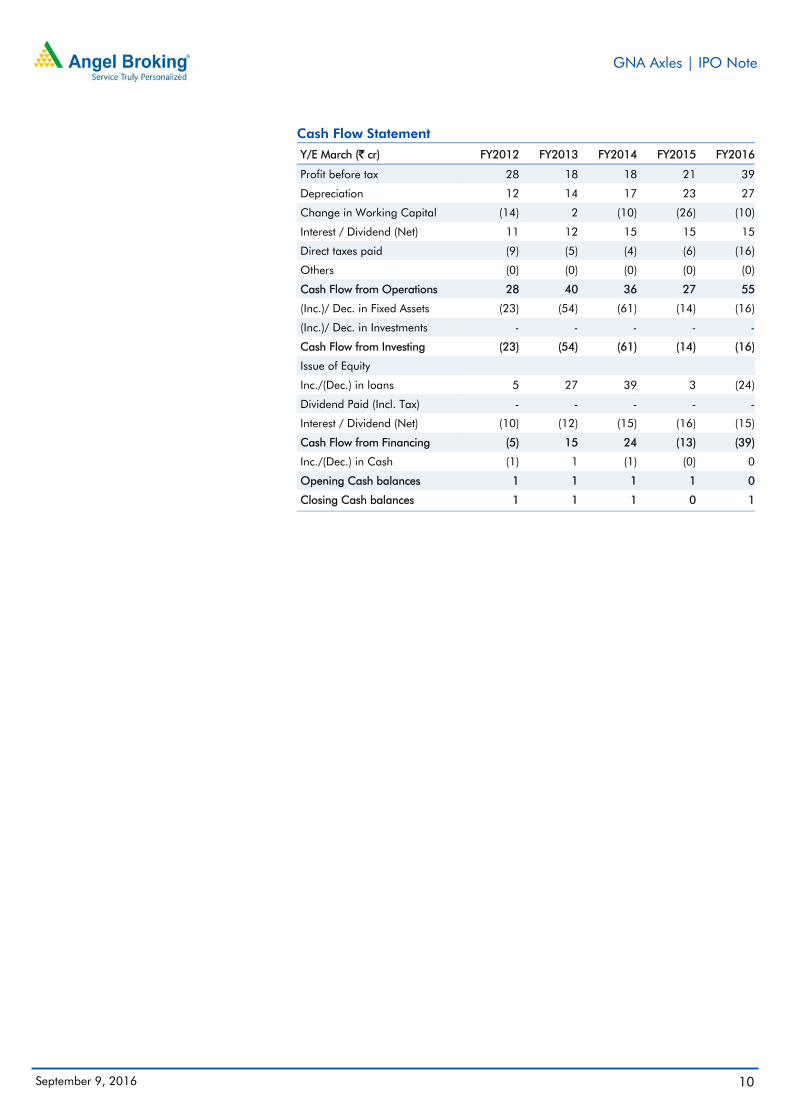
Cash Flow Statement
Y/E March (` cr) FY2012 FY2013 FY2014 FY2015 FY2016
Profit before tax 28 18 18 21 39
Depreciation 12 14 17 23 27
Change in Working Capital (14) 2 (10) (26) (10)
Interest / Dividend (Net) 11 12 15 15 15
Direct taxes paid (9) (5) (4) (6) (16)
Others (0) (0) (0) (0) (0)
Cash Flow from Operations 28 40 36 27 55
(Inc.)/ Dec. in Fixed Assets (23) (54) (61) (14) (16)
(Inc.)/ Dec. in Investments - - - - -
Cash Flow from Investing (23) (54) (61) (14) (16)
Issue of Equity
Inc./(Dec.) in loans 5 27 39 3 (24)
Dividend Paid (Incl. Tax) - - - - -
Interest / Dividend (Net) (10) (12) (15) (16) (15)
Cash Flow from Financing (5) 15 24 (13) (39)
Inc./(Dec.) in Cash (1) 1 (1) (0) 0
Opening Cash balances 1 1 1 1 0
Closing Cash balances 1 1 1 0 1

GNA Axles | IPO Note
September 9, 2016 11
Key Ratio
Y/E March FY2012 FY2013 FY2014 FY2015 FY2016
Valuation Ratio (x)
P/E (on FDEPS) 18.5 65.2 23.7 14.5 12.1
P/CEPS 10.7 17.0 10.2 7.0 5.9
P/BV 4.3 4.0 3.4 2.8 2.3
Dividend yield (%) 0.0 0.0 0.0 0.0 0.0
EV/Sales 1.0 1.2 1.1 1.0 0.8
EV/EBITDA 7.5 9.4 8.4 7.3 5.1
EV / Total Assets 1.4 1.3 1.1 1.0 0.9
Per Share Data (`)
EPS (Basic) 11.2 3.2 8.7 14.2 17.1
EPS (fully diluted) 11.2 3.2 8.7 14.2 17.1
Cash EPS 19.3 12.2 20.2 29.4 35.0
Book Value 48.6 51.8 60.4 74.4 91.2
Returns (%)
ROCE 26.9 16.9 16.4 15.4 22.4
Angel ROIC (Pre-tax) 27.0 17.0 16.4 15.5 22.5
ROE 23.0 6.1 14.5 19.1 18.8
Turnover ratios (x)
Asset Turnover (Gross Block) 2.5 1.8 1.6 1.5 1.7
Inventory / Sales (days) 49 55 55 78 66
Receivables (days) 78 91 101 103 116
Payables (days) 86 113 111 125 117
WCC (ex-cash) (days) 40 33 45 56 65

GNA Axles | IPO Note
September 9, 2016 12
Research Team Tel: 022 - 39357800 E-mail: [email protected] Website: www.angelbroking.com
DISCLAIMER
Angel Broking Private Limited (hereinafter referred to as “Angel”) is a registered Member of National Stock Exchange of India Limited, Bombay Stock Exchange Limited and Metropolitan Stock Exchange Limited. It is also registered as a Depository Participant with CDSL and Portfolio Manager with SEBI. It also has registration with AMFI as a Mutual Fund Distributor. Angel Broking Private Limited is a registered entity with SEBI for Research Analyst in terms of SEBI (Research Analyst) Regulations, 2014 vide registration number INH000000164. Angel or its associates has not been debarred/ suspended by SEBI or any other regulatory authority for accessing /dealing in securities Market. Angel or its associates/analyst has not received any compensation / managed or co-managed public offering of securities of the company covered by Analyst during the past twelve months.
This document is solely for the personal information of the recipient, and must not be singularly used as the basis of any investment decision. Nothing in this document should be construed as investment or financial advice. Each recipient of this document should make such investigations as they deem necessary to arrive at an independent evaluation of an investment in the securities of the companies referred to in this document (including the merits and risks involved), and should consult their own advisors to determine the merits and risks of such an investment.
Reports based on technical and derivative analysis center on studying charts of a stock's price movement, outstanding positions and trading volume, as opposed to focusing on a company's fundamentals and, as such, may not match with a report on a company's fundamentals. Investors are advised to refer the Fundamental and Technical Research Reports available on our website to evaluate the contrary view, if any.
The information in this document has been printed on the basis of publicly available information, internal data and other reliable sources believed to be true, but we do not represent that it is accurate or complete and it should not be relied on as such, as this document is for general guidance only. Angel Broking Pvt. Limited or any of its affiliates/ group companies shall not be in any way responsible for any loss or damage that may arise to any person from any inadvertent error in the information contained in this report. Angel Broking Pvt. Limited has not independently verified all the information contained within this document. Accordingly, we cannot testify, nor make any representation or warranty, express or implied, to the accuracy, contents or data contained within this document. While Angel Broking Pvt. Limited endeavors to update on a reasonable basis the information discussed in this material, there may be regulatory, compliance, or other reasons that prevent us from doing so.
This document is being supplied to you solely for your information, and its contents, information or data may not be reproduced, redistributed or passed on, directly or indirectly.
Neither Angel Broking Pvt. Limited, nor its directors, employees or affiliates shall be liable for any loss or damage that may arise from or in connection with the use of this information.