


Languages
Pages
Legal


FinnairQ2 2015 Result
14 August 2015CEO Pekka Vauramo, Interim CFO Mika Stirkkinen
1 Finnair Q2 2015 Result, 14 August 2015

Market environment shows signs of improvement• There were signs of a recovery in the demand for consumer and business travel in all traffic
areas.
• Appreciation of several income currencies supported unit revenue improvement in long-haul traffic.
• The supply of packaged travel by tour operators active in Finland for the summer season 2015 has now been well-balanced with the demand.
• The appreciation of the dollar diluted the benefit gained from the substantial decrease in the price of jet fuel and increased other dollar-denominated costs.
• In cargo traffic, continued overcapacity between Asia and Europe put further downward pressure on yields.
• Finnair’s market share increased in European traffic and fell slightly in Asian traffic due to decreased capacity in Asian traffic.*
Finnair Q2 2015 Result, 14 August 20152
*Finnair’s estimate based on MIDT data collected on the sales volumes of travel agencies and Finnair’s estimates of airlines’ sales through their own sales channels, such as websites.
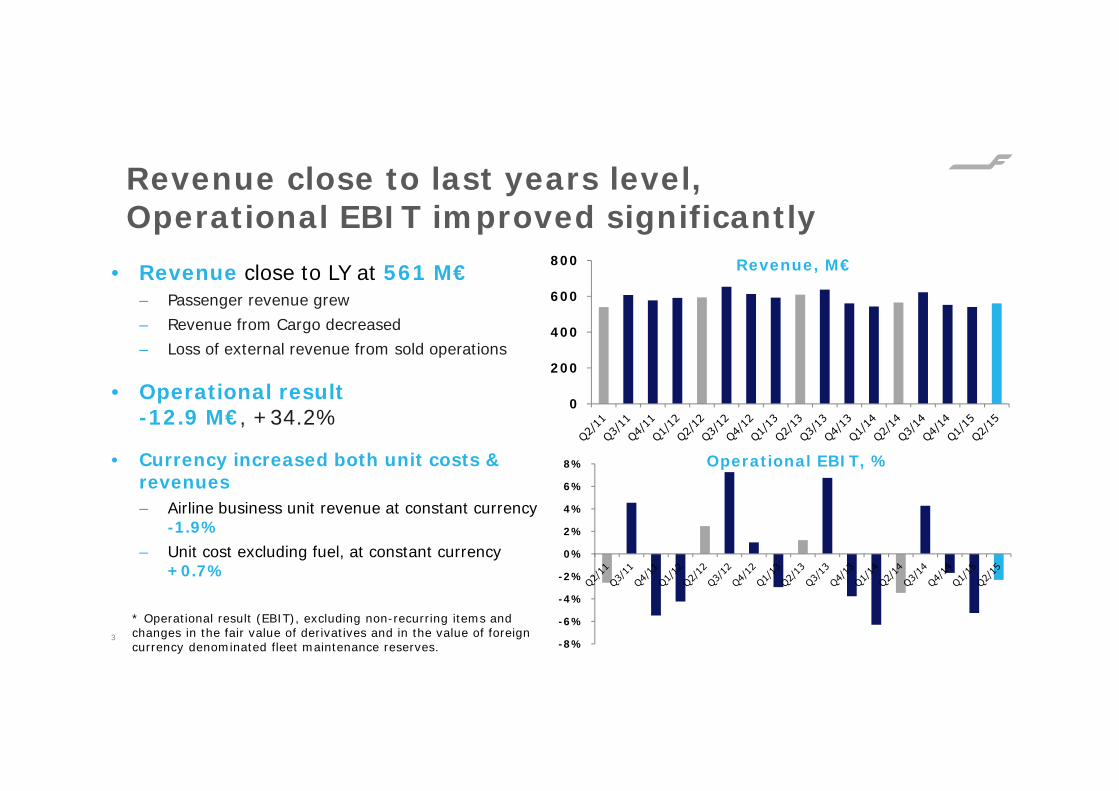
Revenue close to last years level, Operational EBIT improved significantly
• Revenue close to LY at 561 M€– Passenger revenue grew– Revenue from Cargo decreased– Loss of external revenue from sold operations
• Operational result-12.9 M€, +34.2%
• Currency increased both unit costs & revenues– Airline business unit revenue at constant currency
-1.9% – Unit cost excluding fuel, at constant currency
+0.7%
3
* Operational result (EBIT), excluding non-recurring items and changes in the fair value of derivatives and in the value of foreign currency denominated fleet maintenance reserves.
0
200
400
600
800 Revenue, M€
-8%
-6%
-4%
-2%
0%
2%
4%
6%
8% Operational EBIT, %
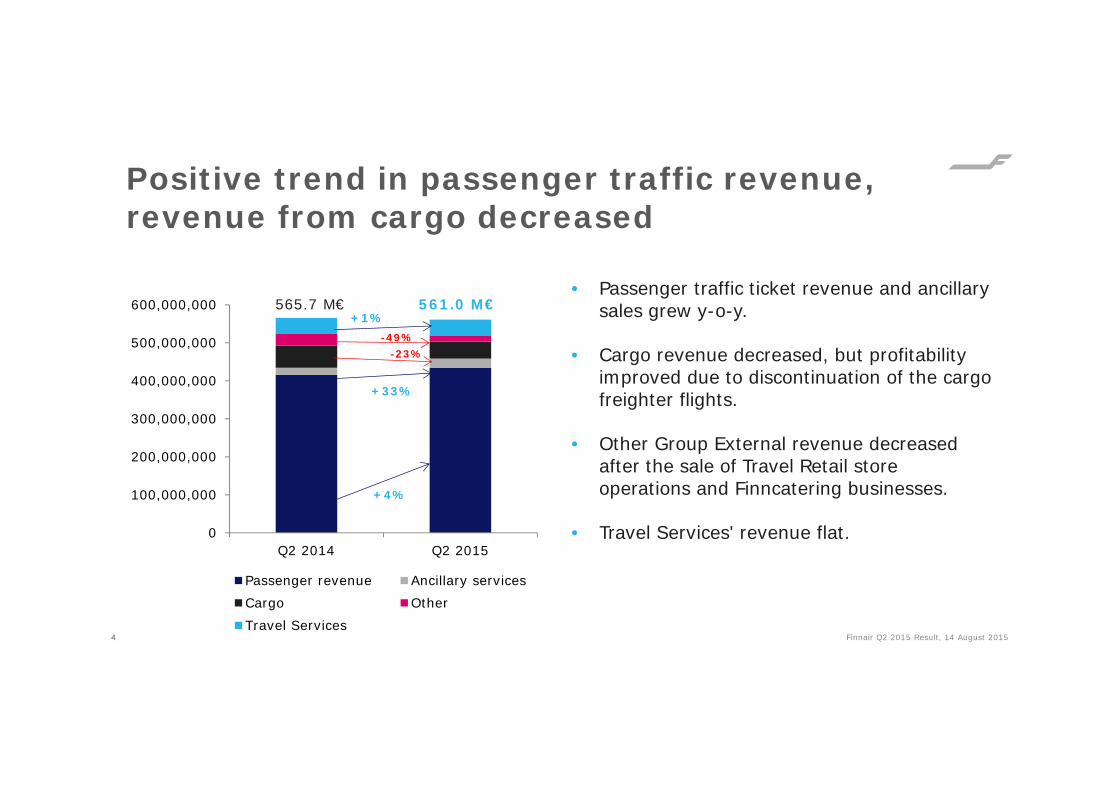
Positive trend in passenger traffic revenue, revenue from cargo decreased
Finnair Q2 2015 Result, 14 August 2015
• Passenger traffic ticket revenue and ancillary sales grew y-o-y.
• Cargo revenue decreased, but profitability improved due to discontinuation of the cargo freighter flights.
• Other Group External revenue decreased after the sale of Travel Retail store operations and Finncatering businesses.
• Travel Services' revenue flat.
4
0
100,000,000
200,000,000
300,000,000
400,000,000
500,000,000
600,000,000
Q2 2014 Q2 2015
Passenger revenue Ancillary servicesCargo OtherTravel Services
565.7 M€ 561.0 M€
+4%
-23%-49%
+1%
+33%
4

Q2: Passenger unit revenues developed favourably in all traffic areas, overcapacity drags cargo marketdown
5
North America**
ASK 5.0 %
RPK 0.4 %
PLF -4.0 %-p
Revenue* 9.4 %
Europe
ASK 4.7 %
RPK 2.3 %
PLF -1.9 %-p
Revenue* 5.7 %
Total Traffic
ASK 0.4 %
RPK -0.1 %
PLF -0.4 %-p
Revenue* 4.6 %
Asia**
ASK -4.2 %
RPK -2.9 %
PLF 1.1 %-p
Revenue* 1.7 %
Domestic
ASK 7.6 %
RPK 9.7 %
PLF 1.3 %-p
Revenue* 11.2 %
Cargo***
ATK -10.7 %
RTK -19.2 %
OLF -5.9 %-p
Revenue -22.4 %
47%
40%
8%4%
Europe Asia
Domestic North America
Passenger Revenue Split
Finnair Q2 2015 Result, 14 August 2015
*Passenger revenue incl. leisure.**Atlantic / Siberian (Japan) Joint Business revenue contribution included.
***Discontinuation of freighter flights decreased revenue, but improved profitability

Nordic Regional Airlines ownership negotiations• On 31 March 2015, Norra was transferred to Finnair’s ownership on an interim
basis.
• Following the acquisition, Finnair has continued negotiations regarding the future ownership of Norra.
• Finnair expanded its contract flying agreement with Norra from 1 May 2015 onwards to cover all routes operated by Norra at its own commercial risk from Helsinki.
• The possible change in ownership will not have a significant financial impact on Finnair in 2015.
Finnair Q2 2015 Result, 14 August 20156
Outlook for 2015
• Finnair estimates that in 2015, its operational result is around break-even or slightly positive.
• Finnair reiterates its previous estimate that its capacity measured in Available Seat Kilometres will grow by approximately 3 per cent and that its revenue will remain approximately at the 2014 level. As a change to its previous estimate, the company now estimates, that its 2015 unit costs excluding fuel at constant currency will remain at the 2014 level.
• Finnair also reiterates as a separate guidance that, when calculated using the exchange rates effective at the end of the review period, the non-recurring items associated with the long haul fleet renewal in 2015 will have a substantial positive impact on Finnair’s operating result due to the strengthened US dollar.
Finnair Q2 2015 Result, 14 August 20157

Finnair Q2 2015 Result, 14 August 20158
Financials

Changes in the calculation method and reporting of unit revenues and - costs
Finnair Q2 2015 Result, 14 August 2015
9
6.05
Q1 RASKNew 2015
Fx effect
2. New constant currency calculation principle
5.93
RASK at constant currency
4.82
Q1 CASK ex. Fuel
New 2015
Fx effect
2. New constant currency calculation principle
4.66
CASK ex. Fuel at constant currency
5.81
Q1 RASK2014
Q1 CASK ex. Fuel
2014
1. Technical adjustments
FlyBe
Other adjustments
In flight 5.96
4.37
1. Technical adjustments
4.61
ChangesYoY
Q1 CASK ex. Fuel
New 2014
Q1 RASKNew 2014
FlyBe
In flightChanges
YoY
Other adjustments

Airline business: Q2 RASK & CASK development
1.9 %
-1.9 %3.0 %
4.8 %0.7 %
-1.0 %-1.8 %-5.1 %
14.2 %10.1 %
-4.3 %14.0 %
6.2 %
-10% -5% 0% 5% 10% 15% 20%
RASK, unit revenueRASK at constant currency
CASK, unit costCASK, excluding fuel
CASK, excluding fuel, at constant currencyFuel
Staff costsDepreciation & lease expenses
Traffic chargesGround handling
CateringMaintenance
Other expenses*
Change, %
10 Finnair Q2 2015 Result, 14 August 2015
• Unit cost excluding fuel, at constant currency +0.7%• Unit revenue at constant currency -1.9%
IncludingFx and hedging
* Including Group management- , IT-, sales and marketing expences and other rents (Norra)
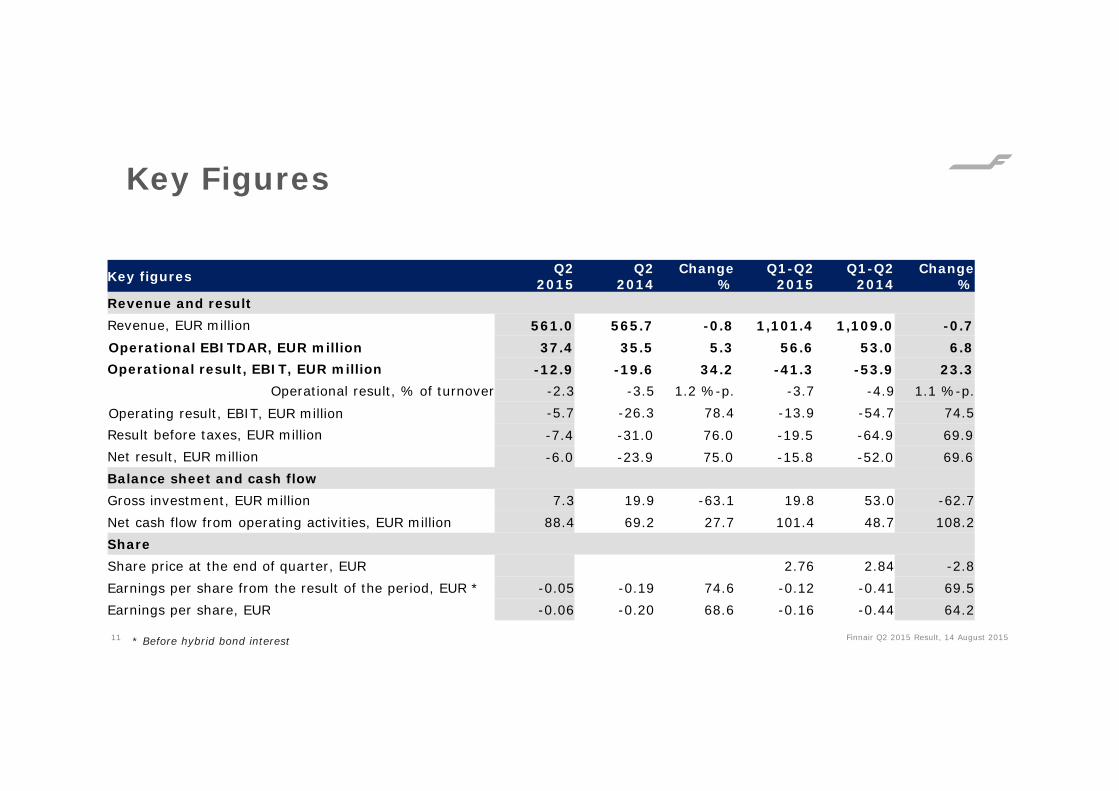
Key figures Q22015
Q22014
Change %
Q1-Q2 2015
Q1-Q2 2014
Change%
Revenue and resultRevenue, EUR million 561.0 565.7 -0.8 1,101.4 1,109.0 -0.7Operational EBITDAR, EUR million 37.4 35.5 5.3 56.6 53.0 6.8Operational result, EBIT, EUR million -12.9 -19.6 34.2 -41.3 -53.9 23.3
Operational result, % of turnover -2.3 -3.5 1.2 %-p. -3.7 -4.9 1.1 %-p.Operating result, EBIT, EUR million -5.7 -26.3 78.4 -13.9 -54.7 74.5Result before taxes, EUR million -7.4 -31.0 76.0 -19.5 -64.9 69.9Net result, EUR million -6.0 -23.9 75.0 -15.8 -52.0 69.6Balance sheet and cash flowGross investment, EUR million 7.3 19.9 -63.1 19.8 53.0 -62.7Net cash flow from operating activities, EUR million 88.4 69.2 27.7 101.4 48.7 108.2ShareShare price at the end of quarter, EUR 2.76 2.84 -2.8Earnings per share from the result of the period, EUR * -0.05 -0.19 74.6 -0.12 -0.41 69.5Earnings per share, EUR -0.06 -0.20 68.6 -0.16 -0.44 64.2
Finnair Q2 2015 Result, 14 August 201511
Key Figures
* Before hybrid bond interest

Operational result, EBIT Q2 2014 vs. Q2 2015, M€
Finnair Q2 2015 Result, 14 August 201512
-19.6-12.9
10.5
-15.4
-1.6
-13.4
2.2
-7.410.4
24.2
-0.7-1.1-1.0
-30.0
-20.0
-10.0
0.0
10.0
20.0
30.0
40.0

Segment results: Airline Business
Finnair Q1 2015 Result, 7 May 201513
83 %
9 %5 % 3 %
Airline Business revenue535 M€
Matkustajaliikenne Rahti
Lisämyynti Muut
• Segment profitability significantly improved y-o-y, result still at loss• Passenger revenue and ancillary sales grew significantly• Cargo share of segment revenue decreased mainly due to discontinuation of
dedicated cargo freighter flights, Cargo profitability improved
Key figures Q2 2015
Q2 2014
Change %
Q1-Q2 2015
Q1-Q2 2014
Change %
2014
Revenue and result
Revenue, EUR million 534.8 541.3 -1.2 1,045.6 1,049.4 -0.4 2,167.7
Operational result, EUR million -14.7 -20.8 29.3 -38.8 -55.3 29.8 -43.5
Operating result, EBIT, EUR million -7.2 -27.0 73.4 -11.0 -55.2 80.0 -78.4
Operating result, % of revenue -1.3 % -5.0 % -1.1 % -5.3 % -3.6 %
Personnel
Average number of employees 3949 4367 -9.6 3,963 4,450 -11.0 4,232

Segment result: Travel Services
Finnair Q1 2015 Result, 7 May 201514
• The revenue declined slightly y-o-y mainly due to adjustment of Suntours package tour supply.
• The profitability of Suntours improved after restructuring of operations. • The revenue of the business travel agency SMT was flat y-o-y and its operational
result showed a slight profit.
Key figures Q2 2015
Q2 2014
Change %
Q1-Q2 2015
Q1-Q2 2014
Change %
2014
Revenue and result
Revenue, EUR million 41.4 42.6 -2.7 102.7 116.8 -12.1 216.7
Operational result, EUR million 1.7 1.1 56.9 -2.5 1.4 <-200 % 7.0
Operating result, EBIT, EUR million 1.5 0.8 99.0 -2.9 0.5 <-200 % 5.9
Operating result, % of revenue 3.6 % 1.9 % -2.8 % 0.4 % 2.7 %
Personnel
Average number of employees 585 676 -13.5 587 690 -15.0 645

Operating costs 578 M€, -1.9% Fuel largest cost item
Finnair Q2 2015 Result, 14 August 201515
Change, %
-6.7 %
-8.6 %
24.7 %
4.9 %
3.3 %
-28.2 %
4.1 %
12.7 %
-3.7 %
1.3 %
-6.3 %
-1.9 %
-40% -20% 0% 20% 40%
Other costs
Sales and marketing
Leasing
Tour operations
Maintenance
Depreciation
Other rents
Traffic charges
Ground handling and catering
Staff
Fuel
Total
27%
15%
11%10%
10%
7%
5%
4%3%
4% 3%
Fuel Staff costsTraffic charges Ground handling and cateringOther costs Other rental paymentsMaintenance DepreciationTour operations LeasingSales and marketing
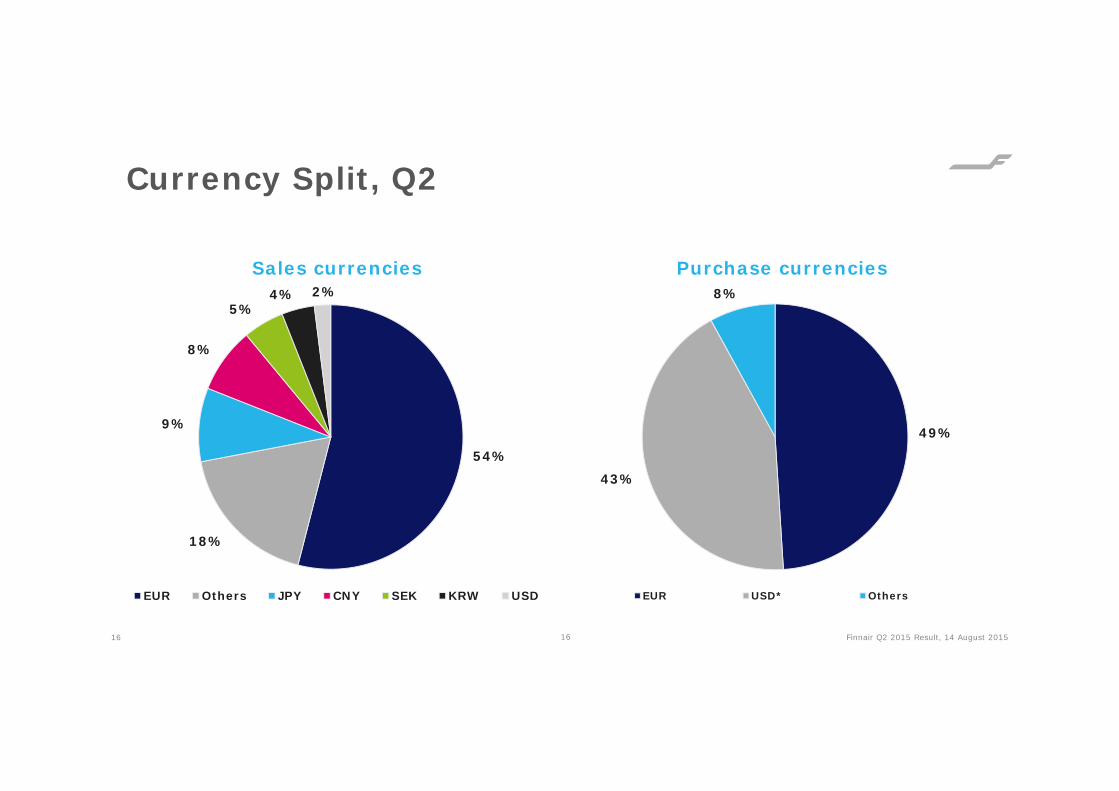
49%
43%
8%
EUR USD* Others
54%
18%
9%
8%
5%4% 2%
EUR Others JPY CNY SEK KRW USD
Currency Split, Q2
Sales currencies
16 Finnair Q2 2015 Result, 14 August 201516
Purchase currencies
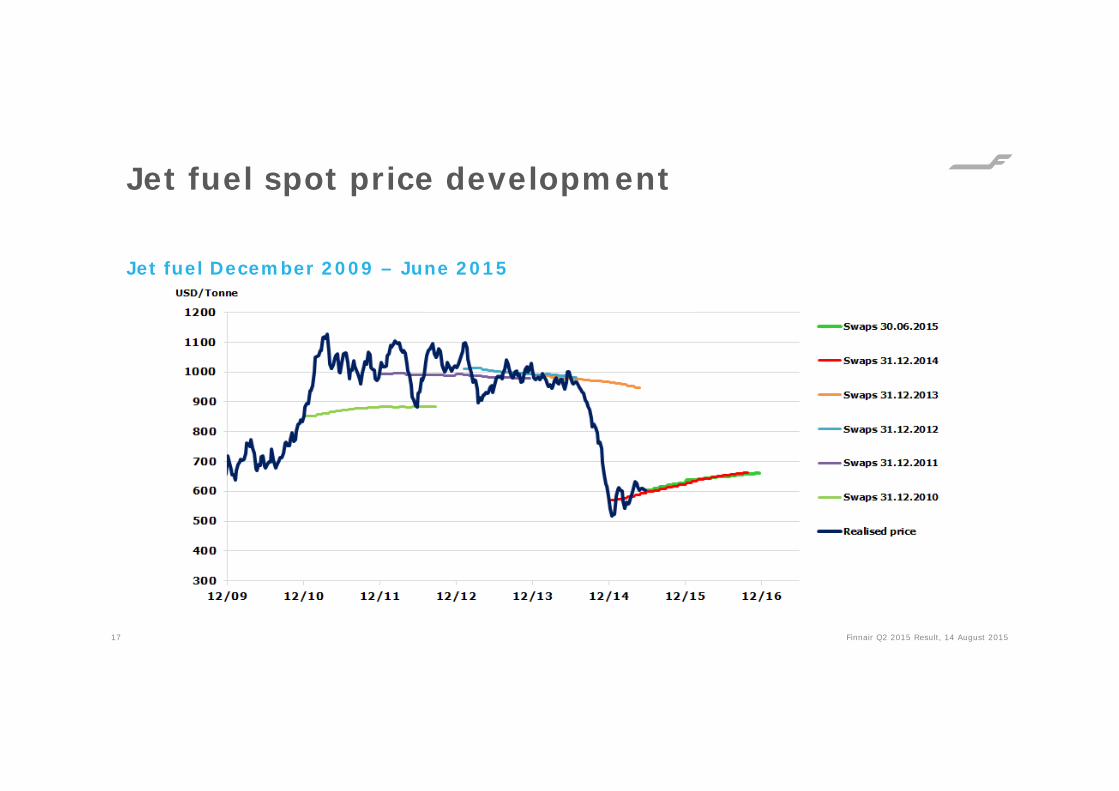
Jet fuel spot price development
Finnair Q2 2015 Result, 14 August 201517
Jet fuel December 2009 – June 2015
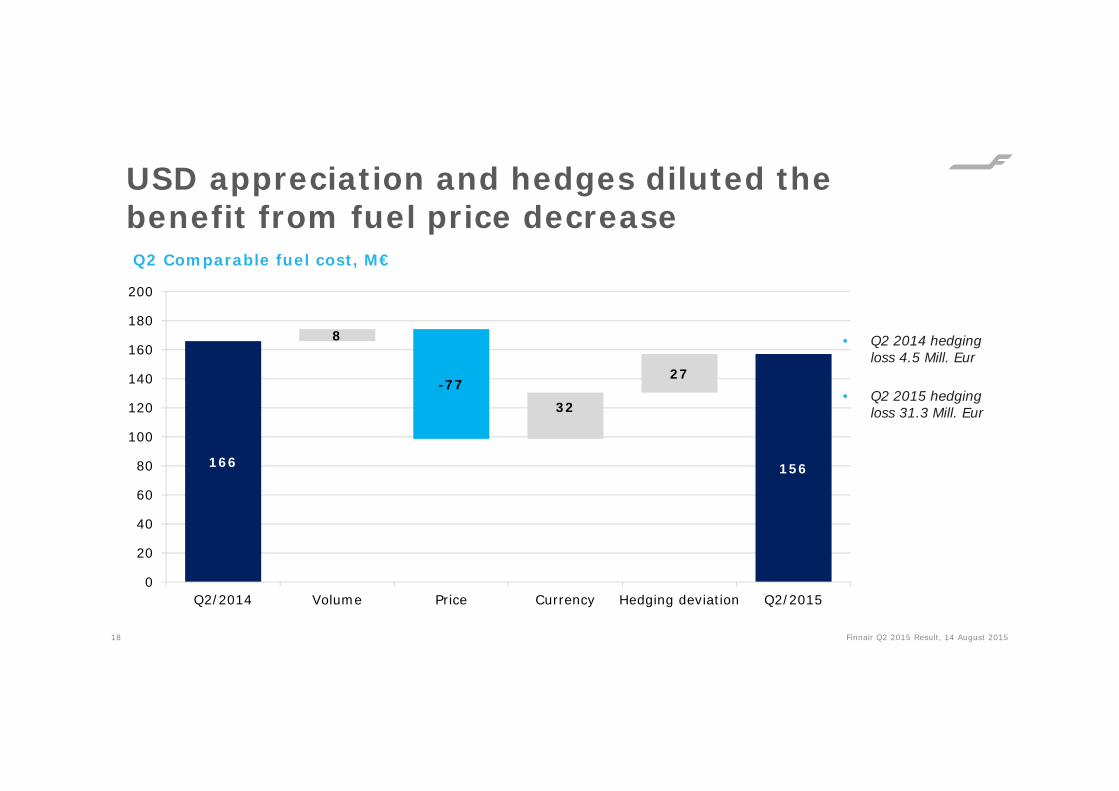
USD appreciation and hedges diluted the benefit from fuel price decrease
• Q2 2014 hedging loss 4.5 Mill. Eur
• Q2 2015 hedging loss 31.3 Mill. Eur
Finnair Q2 2015 Result, 14 August 201518
166 156
8
27-77
32
0
20
40
60
80
100
120
140
160
180
200
Q2/2014 Volume Price Currency Hedging deviation Q2/2015
Q2 Comparable fuel cost, M€

-40
-20
0
20
40
60
80
100
120
2011 2012 2013 2014 H1 2015
Strong balance sheet
Equity ratio Gearing Adjusted gearing
%
Finnair Q2 2015 Result, 14 August 201519
-150
0
150
300
450
600
2011 2012 2013 2014 2Q 2015
Good Cash position
Net cash flow from operating activitiesGross capital expenditureCash and cash equivalents
M€
Net debt 167 M€ negative, Cash 532 M€

Rolling Hedging policy
Finnair Q2 2015 Result, 14 August 201520
Hedging positions as of 30 June 2015Hedging ratio for 2015: 66 %
• Finnair hedges jet fuel consumption 24 months ahead within the limits defined in the hedging policy.
• Finnair’s fuel purchases are 66% hedged for H2 2015 and 52% for H1 2016.
• The company protects itself against the risks of currency, interest rate and jet fuel positions by using different derivative instruments, such as forward contracts, swaps and options.

Thank you
21 Finnair Q2 2015 Result, 14 August 2015
Top Related