Results for Q2 2015 - Alm. · PDF fileResults for Q2 2015 Webcast presentation 20 August 2015...
24
Alm Brand Results for Q2 2015 Webcast presentation 20 August 2015
Transcript of Results for Q2 2015 - Alm. · PDF fileResults for Q2 2015 Webcast presentation 20 August 2015...
Alm Brand
Results for Q2 2015 Webcast presentation 20 August 2015
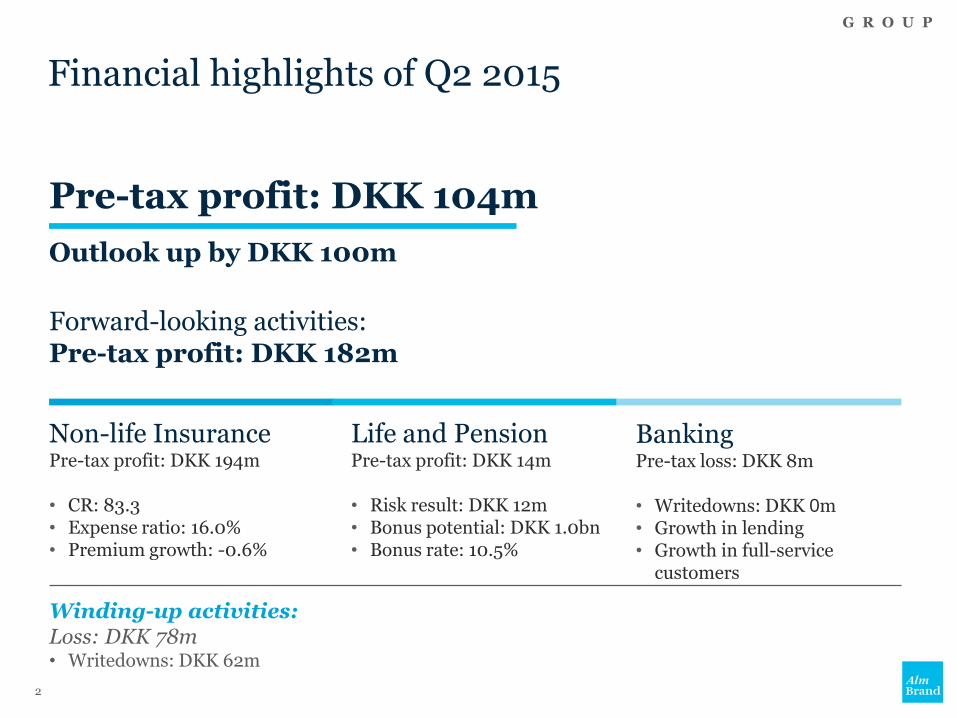
Financial highlights of Q2 2015
Pre-tax profit: DKK 104m
Outlook up by DKK 100m
Forward-looking activities: Pre-tax profit: DKK 182m
Winding-up activities: Loss: DKK 78m • Writedowns: DKK 62m
G R O U P
Non-life Insurance Pre-tax profit: DKK 194m
• CR: 83.3 • Expense ratio: 16.0% • Premium growth: -0.6%
Life and Pension Pre-tax profit: DKK 14m
• Risk result: DKK 12m • Bonus potential: DKK 1.0bn • Bonus rate: 10.5%
Banking Pre-tax loss: DKK 8m
• Writedowns: DKK 0m • Growth in lending • Growth in full-service
customers
2
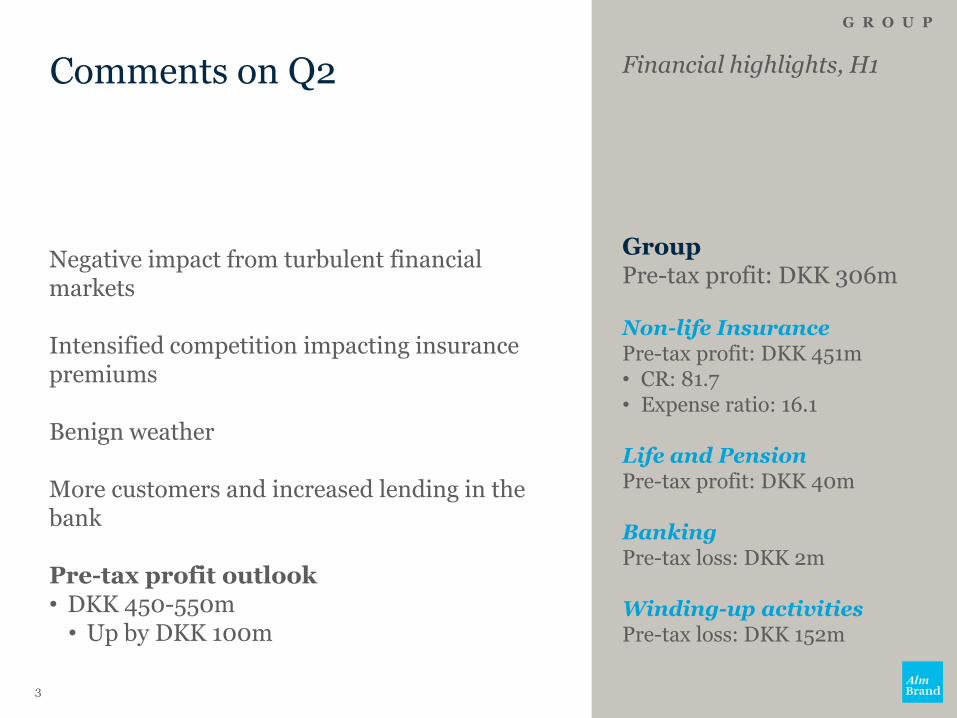
Comments on Q2
Negative impact from turbulent financial markets Intensified competition impacting insurance premiums Benign weather More customers and increased lending in the bank Pre-tax profit outlook • DKK 450-550m • Up by DKK 100m
G R O U P
Financial highlights, H1
Group Pre-tax profit: DKK 306m Non-life Insurance Pre-tax profit: DKK 451m • CR: 81.7 • Expense ratio: 16.1
Life and Pension Pre-tax profit: DKK 40m Banking Pre-tax loss: DKK 2m Winding-up activities Pre-tax loss: DKK 152m
3
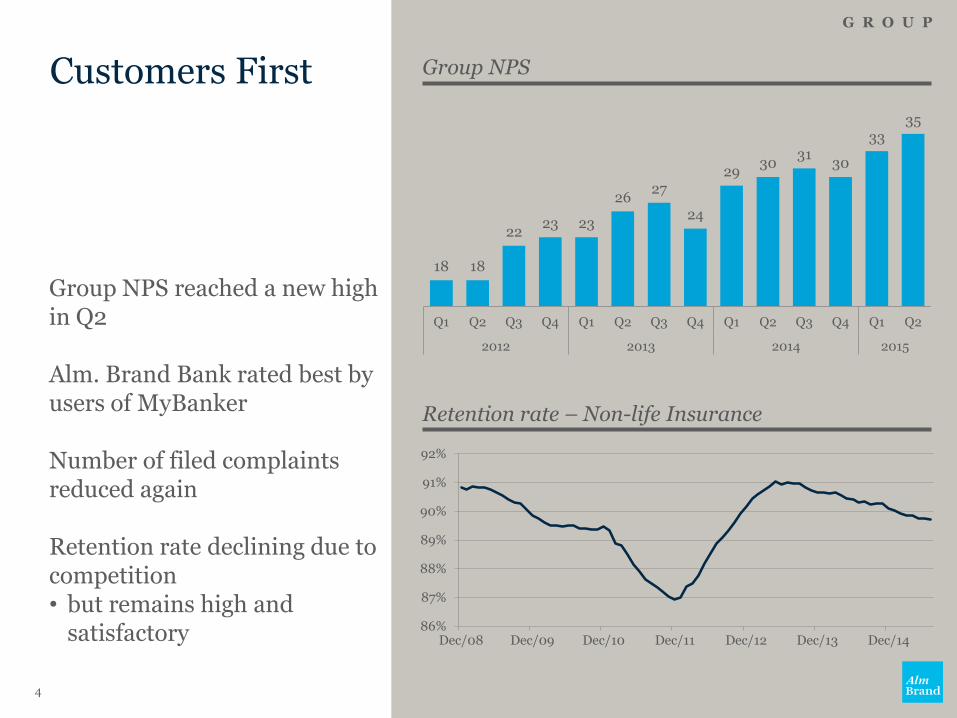
Customers First
Group NPS reached a new high in Q2 Alm. Brand Bank rated best by users of MyBanker Number of filed complaints reduced again Retention rate declining due to competition • but remains high and
satisfactory
G R O U P
Group NPS
18 18
22 23 23
26 27
24
29 30
31 30
33 35
Q1 Q2 Q3 Q4 Q1 Q2 Q3 Q4 Q1 Q2 Q3 Q4 Q1 Q2
2012 2013 2014 2015
4
Retention rate – Non-life Insurance
86%
87%
88%
89%
90%
91%
92%
Dec/08 Dec/09 Dec/10 Dec/11 Dec/12 Dec/13 Dec/14
fjern evt. pladsholderen
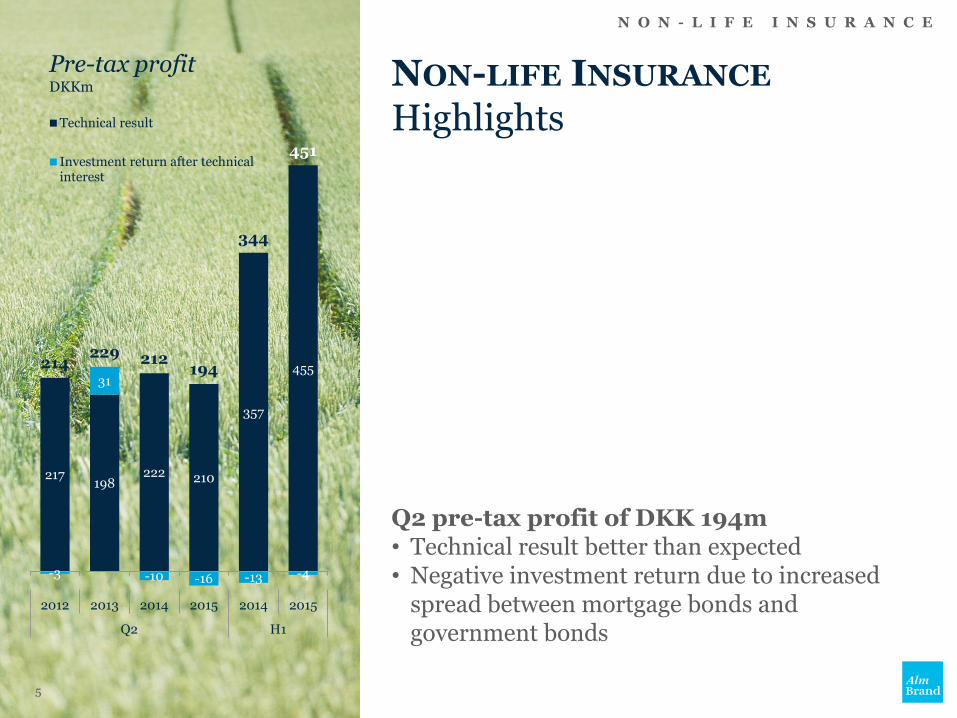
NON-LIFE INSURANCE Highlights
Q2 pre-tax profit of DKK 194m • Technical result better than expected • Negative investment return due to increased
spread between mortgage bonds and government bonds
N O N - L I F E I N S U R A N C E
Pre-tax profit DKKm
5
217 198
222 210
357
455
-3
31
-10 -16 -13 -4
214 229 212
194
344
451
2012 2013 2014 2015 2014 2015
Q2 H1
Technical result
Investment return after technical interest
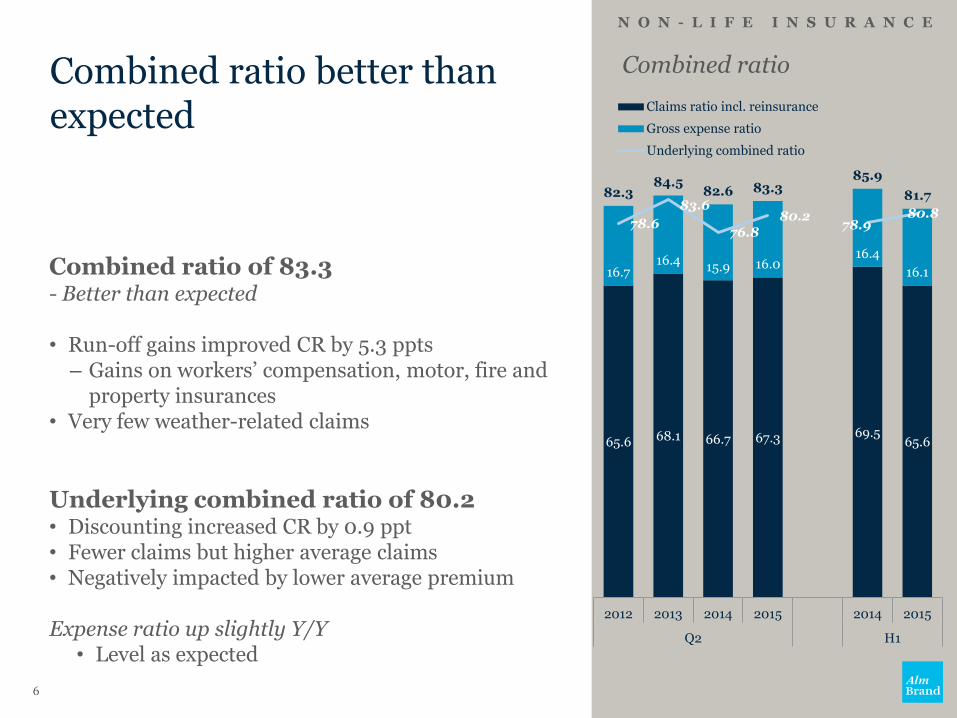
Combined ratio better than expected
Combined ratio of 83.3 - Better than expected • Run-off gains improved CR by 5.3 ppts
– Gains on workers’ compensation, motor, fire and property insurances
• Very few weather-related claims
Underlying combined ratio of 80.2 • Discounting increased CR by 0.9 ppt • Fewer claims but higher average claims • Negatively impacted by lower average premium
Expense ratio up slightly Y/Y
• Level as expected
N O N - L I F E I N S U R A N C E
Combined ratio
6
65.6 68.1 66.7 67.3 69.5 65.6
16.7 16.4
15.9 16.0 16.4
16.1
82.3 84.5
82.6 83.3 85.9
81.7
78.6
83.6
76.8
80.2 78.9
80.8
2012 2013 2014 2015 2014 2015
Q2 H1
Claims ratio incl. reinsurance
Gross expense ratio
Underlying combined ratio
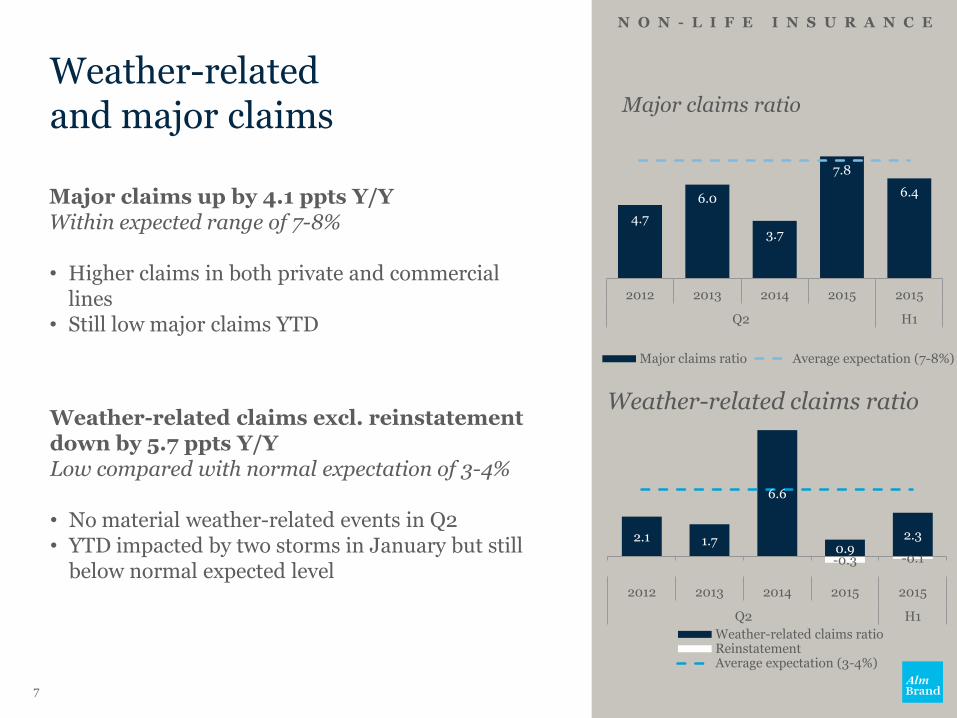
Weather-related and major claims
N O N - L I F E I N S U R A N C E
Major claims ratio
Major claims up by 4.1 ppts Y/Y Within expected range of 7-8%
• Higher claims in both private and commercial
lines • Still low major claims YTD
Weather-related claims excl. reinstatement down by 5.7 ppts Y/Y Low compared with normal expectation of 3-4% • No material weather-related events in Q2 • YTD impacted by two storms in January but still
below normal expected level
Weather-related claims ratio
7
4.7
6.0
3.7
7.8
6.4
2012 2013 2014 2015 2015
Q2 H1
Major claims ratio Average expectation (7-8%)
2.1 1.7
6.6
0.9 2.3
-0.3 -0.1
2012 2013 2014 2015 2015
Q2 H1
Weather-related claims ratio Reinstatement Average expectation (3-4%)
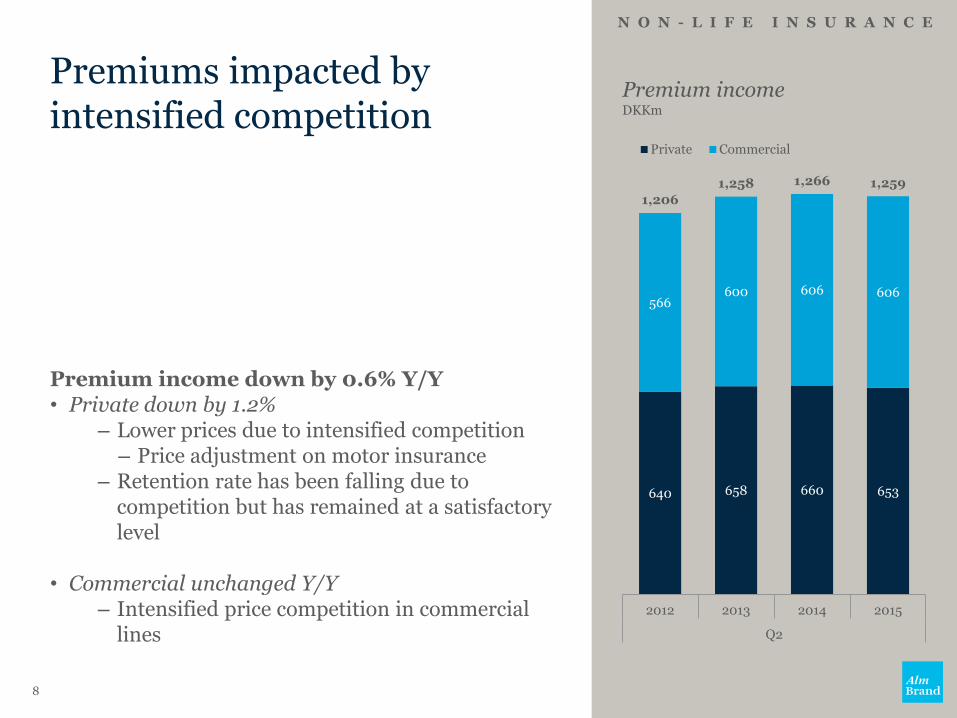
Premiums impacted by intensified competition
Premium income down by 0.6% Y/Y • Private down by 1.2%
– Lower prices due to intensified competition – Price adjustment on motor insurance
– Retention rate has been falling due to competition but has remained at a satisfactory level
• Commercial unchanged Y/Y – Intensified price competition in commercial
lines
N O N - L I F E I N S U R A N C E
Premium income DKKm
8
640 658 660 653
566 600 606 606
1,206
1,258 1,266 1,259
2012 2013 2014 2015
Q2
Private Commercial
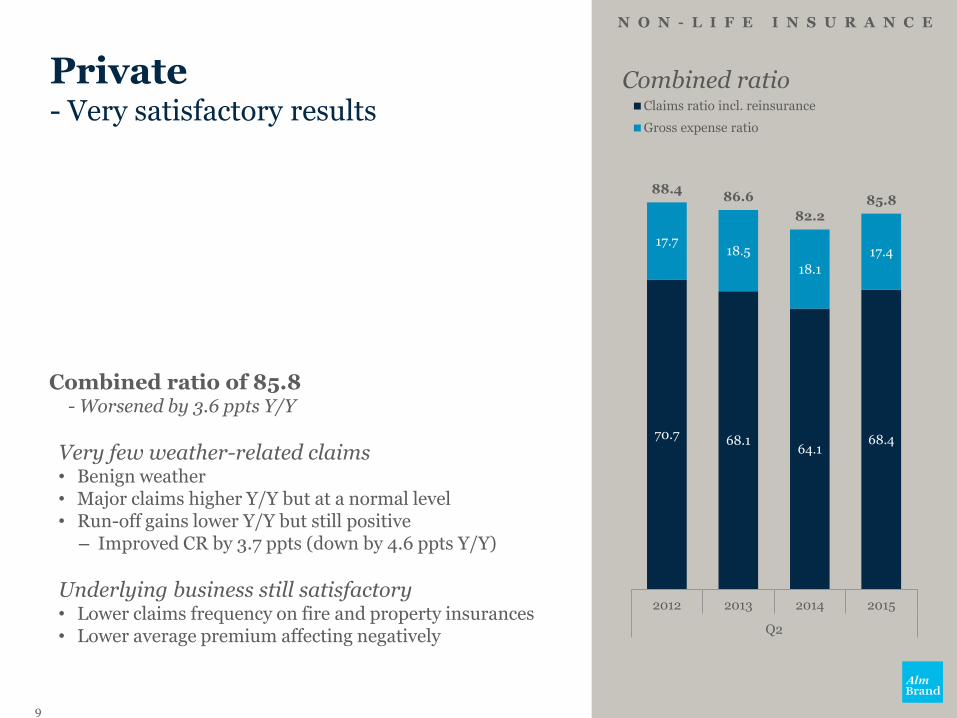
Private - Very satisfactory results
Combined ratio of 85.8 - Worsened by 3.6 ppts Y/Y
Very few weather-related claims • Benign weather • Major claims higher Y/Y but at a normal level • Run-off gains lower Y/Y but still positive
– Improved CR by 3.7 ppts (down by 4.6 ppts Y/Y)
Underlying business still satisfactory • Lower claims frequency on fire and property insurances • Lower average premium affecting negatively
N O N - L I F E I N S U R A N C E
Combined ratio
9
70.7 68.1 64.1
68.4
17.7 18.5
18.1
17.4
88.4 86.6
82.2 85.8
2012 2013 2014 2015
Q2
Claims ratio incl. reinsurance
Gross expense ratio
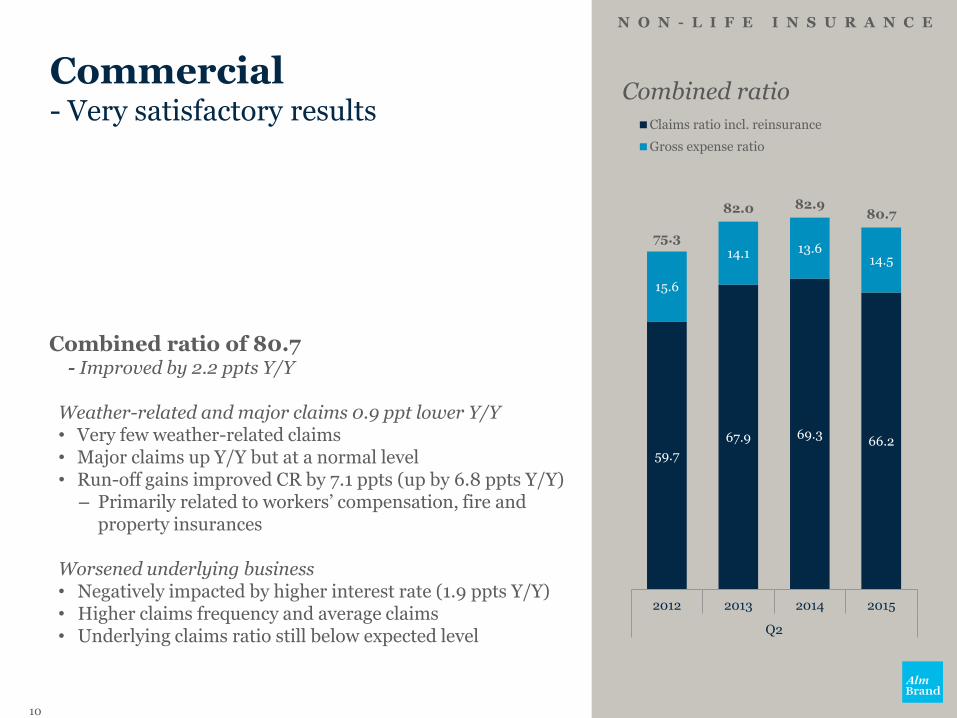
Commercial - Very satisfactory results
Combined ratio of 80.7 - Improved by 2.2 ppts Y/Y
Weather-related and major claims 0.9 ppt lower Y/Y • Very few weather-related claims • Major claims up Y/Y but at a normal level • Run-off gains improved CR by 7.1 ppts (up by 6.8 ppts Y/Y)
– Primarily related to workers’ compensation, fire and property insurances
Worsened underlying business • Negatively impacted by higher interest rate (1.9 ppts Y/Y) • Higher claims frequency and average claims • Underlying claims ratio still below expected level
N O N - L I F E I N S U R A N C E
Combined ratio
10
59.7
67.9 69.3 66.2
15.6
14.1 13.6 14.5
75.3
82.0 82.9 80.7
2012 2013 2014 2015
Q2
Claims ratio incl. reinsurance
Gross expense ratio
fjern evt. pladsholderen
LIFE AND PENSION Highlights
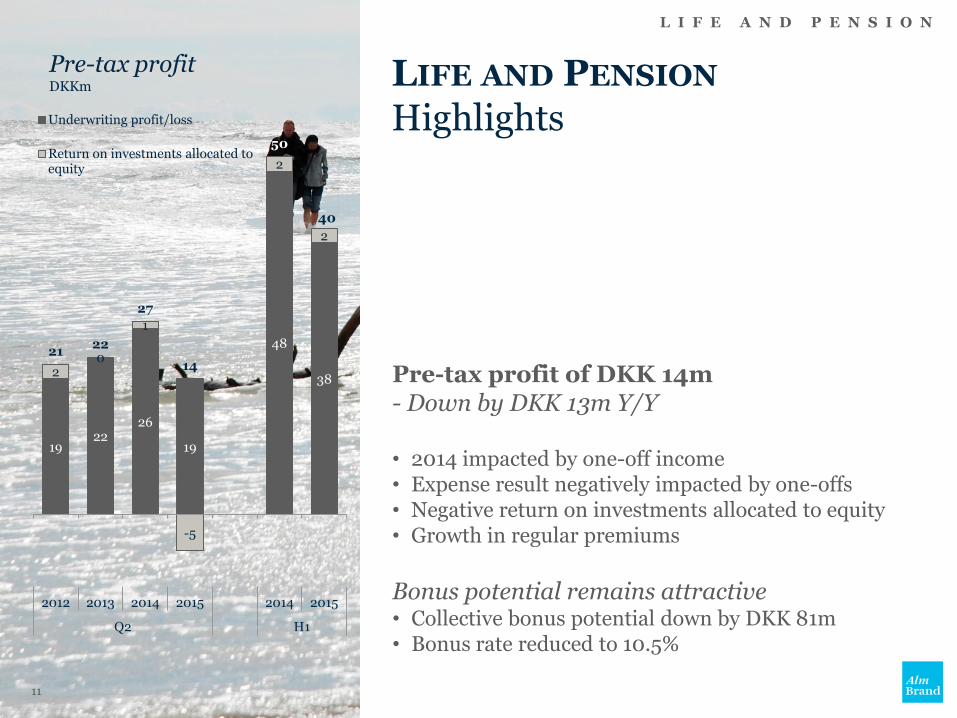
Pre-tax profit of DKK 14m - Down by DKK 13m Y/Y • 2014 impacted by one-off income • Expense result negatively impacted by one-offs • Negative return on investments allocated to equity • Growth in regular premiums
Bonus potential remains attractive • Collective bonus potential down by DKK 81m • Bonus rate reduced to 10.5%
L I F E A N D P E N S I O N
Pre-tax profit DKKm
11
19 22
26
19
48
38 2
0
1
-5
2
2
21 22
27
14
50
40
2012 2013 2014 2015 2014 2015
Q2 H1
Underwriting profit/loss
Return on investments allocated to equity
Pension contributions
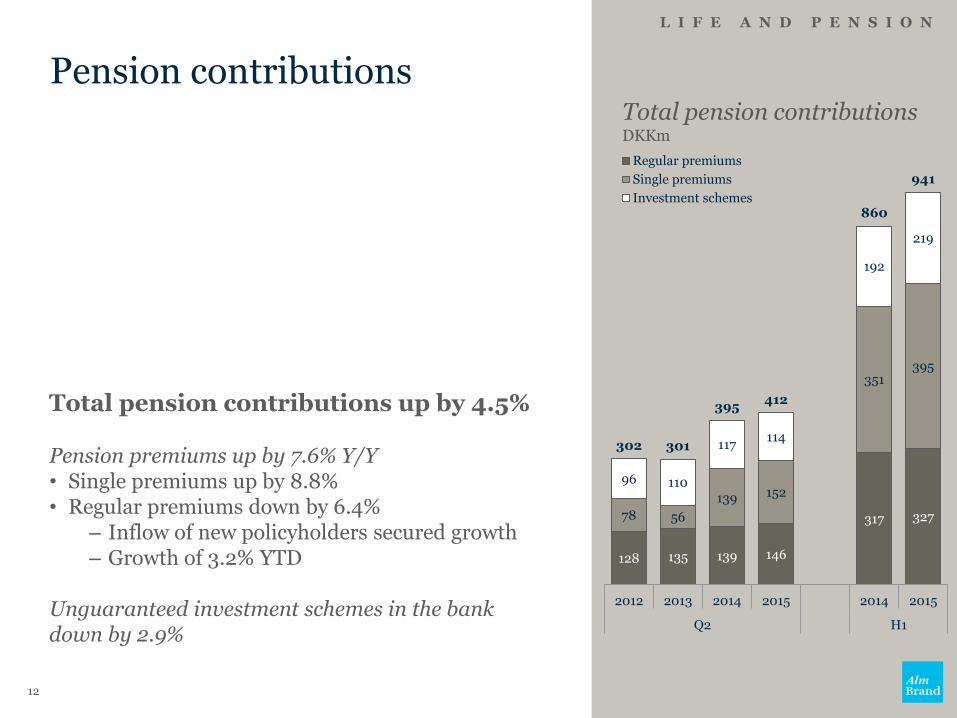
Total pension contributions up by 4.5%
Pension premiums up by 7.6% Y/Y • Single premiums up by 8.8% • Regular premiums down by 6.4%
– Inflow of new policyholders secured growth – Growth of 3.2% YTD
Unguaranteed investment schemes in the bank down by 2.9%
L I F E A N D P E N S I O N
Total pension contributions DKKm
12
128 135 139 146
317 327 78 56
139 152
351 395
96 110
117 114
192
219
302 301
395 412
860
941
2012 2013 2014 2015 2014 2015
Q2 H1
Regular premiums
Single premiums
Investment schemes
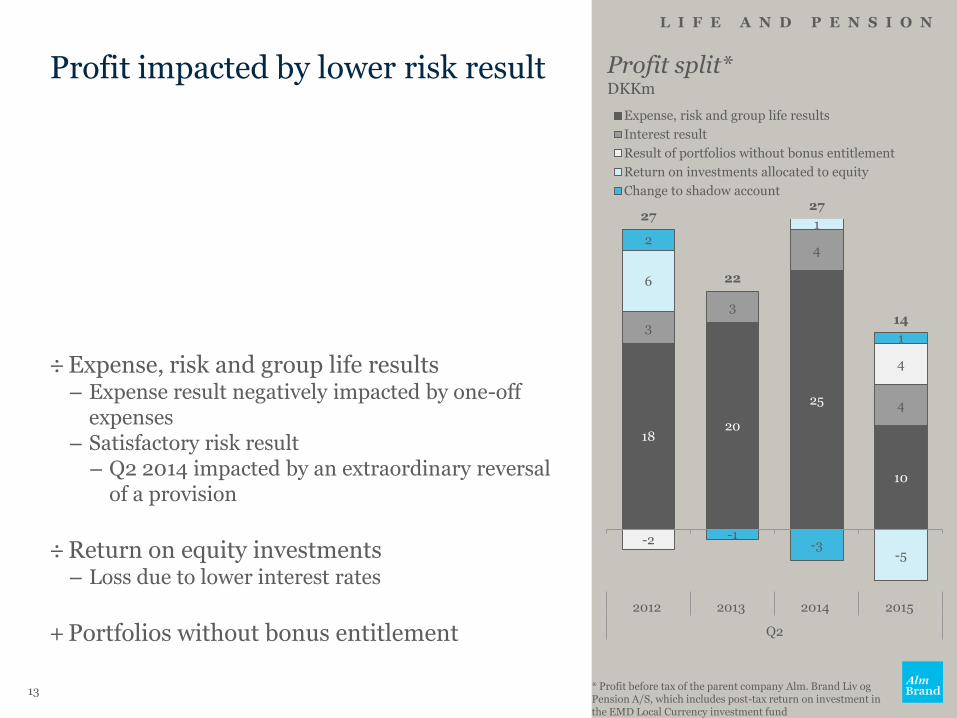
Profit impacted by lower risk result
÷ Expense, risk and group life results – Expense result negatively impacted by one-off
expenses – Satisfactory risk result – Q2 2014 impacted by an extraordinary reversal
of a provision
÷ Return on equity investments
– Loss due to lower interest rates
+ Portfolios without bonus entitlement
L I F E A N D P E N S I O N
Profit split* DKKm
13 * Profit before tax of the parent company Alm. Brand Liv og Pension A/S, which includes post-tax return on investment in the EMD Local Currency investment fund
18 20
25
10
3
3
4
4
-2
4
6
1
-5
2
-1 -3
1
27
22
27
14
2012 2013 2014 2015
Q2
Expense, risk and group life results
Interest result
Result of portfolios without bonus entitlement
Return on investments allocated to equity
Change to shadow account
Investment return
L I F E A N D P E N S I O N
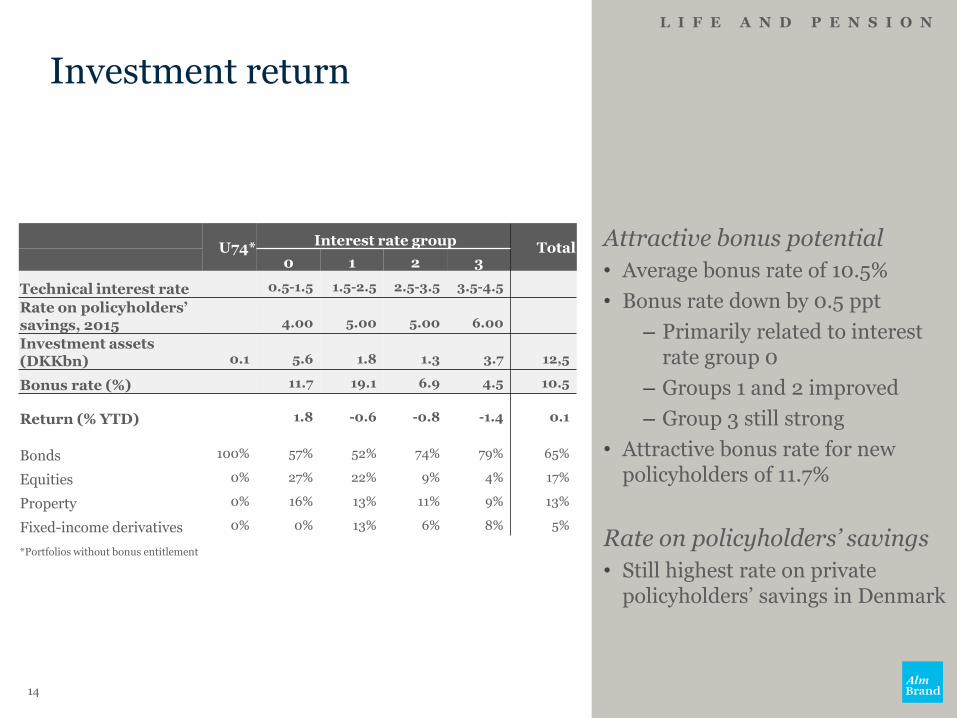
Attractive bonus potential
• Average bonus rate of 10.5%
• Bonus rate down by 0.5 ppt
– Primarily related to interest rate group 0
– Groups 1 and 2 improved
– Group 3 still strong
• Attractive bonus rate for new policyholders of 11.7%
Rate on policyholders’ savings
• Still highest rate on private policyholders’ savings in Denmark
14
U74*
Interest rate group Total
0 1 2 3
Technical interest rate 0.5-1.5 1.5-2.5 2.5-3.5 3.5-4.5
Rate on policyholders’ savings, 2015 4.00 5.00 5.00 6.00
Investment assets (DKKbn) 0.1 5.6 1.8 1.3 3.7 12,5
Bonus rate (%) 11.7 19.1 6.9 4.5 10.5
Return (% YTD) 1.8 -0.6 -0.8 -1.4 0.1
Bonds 100% 57% 52% 74% 79% 65%
Equities 0% 27% 22% 9% 4% 17%
Property 0% 16% 13% 11% 9% 13%
Fixed-income derivatives 0% 0% 13% 6% 8% 5%
*Portfolios without bonus entitlement
fjern evt. pladsholderen
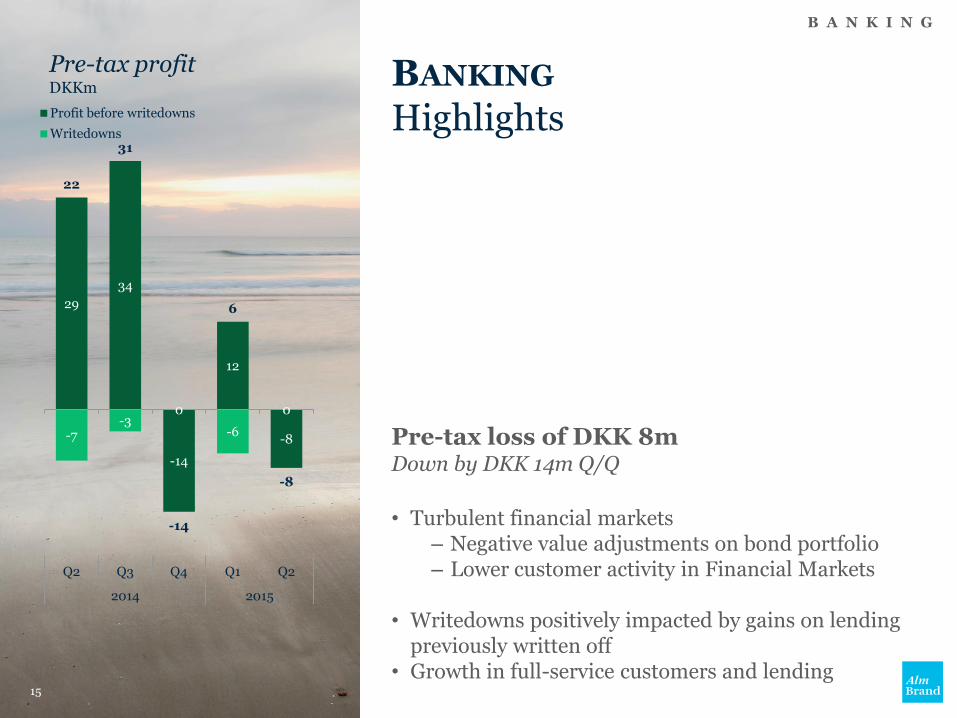
BANKING Highlights
Pre-tax loss of DKK 8m Down by DKK 14m Q/Q
• Turbulent financial markets
– Negative value adjustments on bond portfolio – Lower customer activity in Financial Markets
• Writedowns positively impacted by gains on lending
previously written off • Growth in full-service customers and lending
B A N K I N G
Pre-tax profit DKKm
15
29
34
-14
12
-8 -7 -3
0
-6
0
22
31
-14
6
-8
Q2 Q3 Q4 Q1 Q2
2014 2015
Profit before writedowns
Writedowns
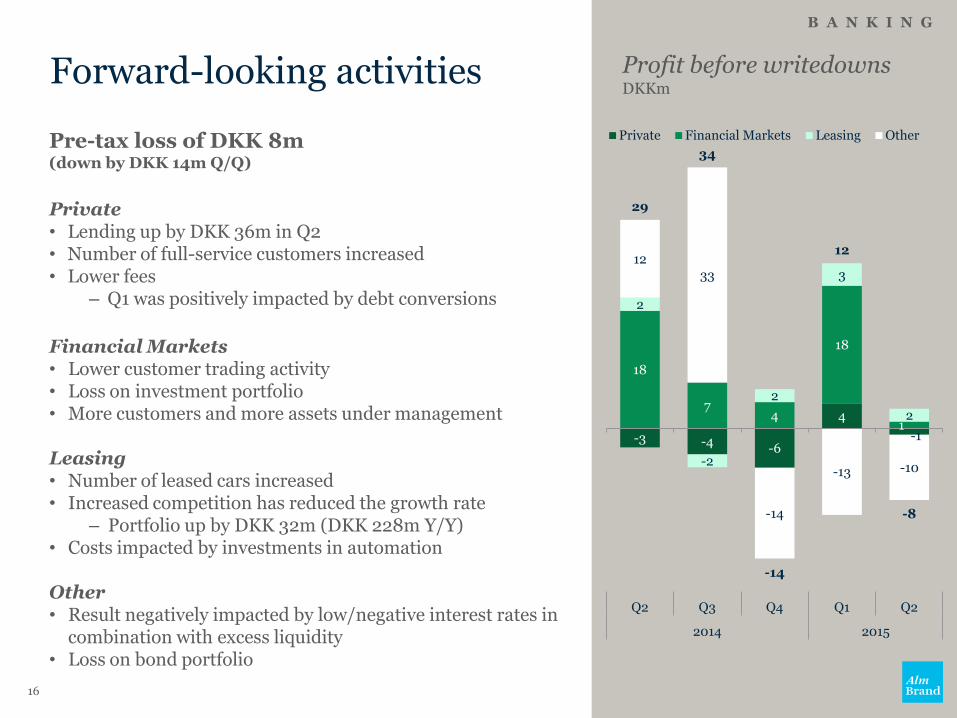
Forward-looking activities
Pre-tax loss of DKK 8m (down by DKK 14m Q/Q)
Private • Lending up by DKK 36m in Q2 • Number of full-service customers increased • Lower fees
– Q1 was positively impacted by debt conversions
Financial Markets • Lower customer trading activity • Loss on investment portfolio • More customers and more assets under management
Leasing • Number of leased cars increased • Increased competition has reduced the growth rate
– Portfolio up by DKK 32m (DKK 228m Y/Y) • Costs impacted by investments in automation
Other • Result negatively impacted by low/negative interest rates in
combination with excess liquidity • Loss on bond portfolio
B A N K I N G
Profit before writedowns DKKm
16
-3 -4 -6
4
-1
18
7 4
18
1
2
-2
2
3
2
12
33
-14
-13 -10
29
34
-14
12
-8
Q2 Q3 Q4 Q1 Q2
2014 2015
Private Financial Markets Leasing Other
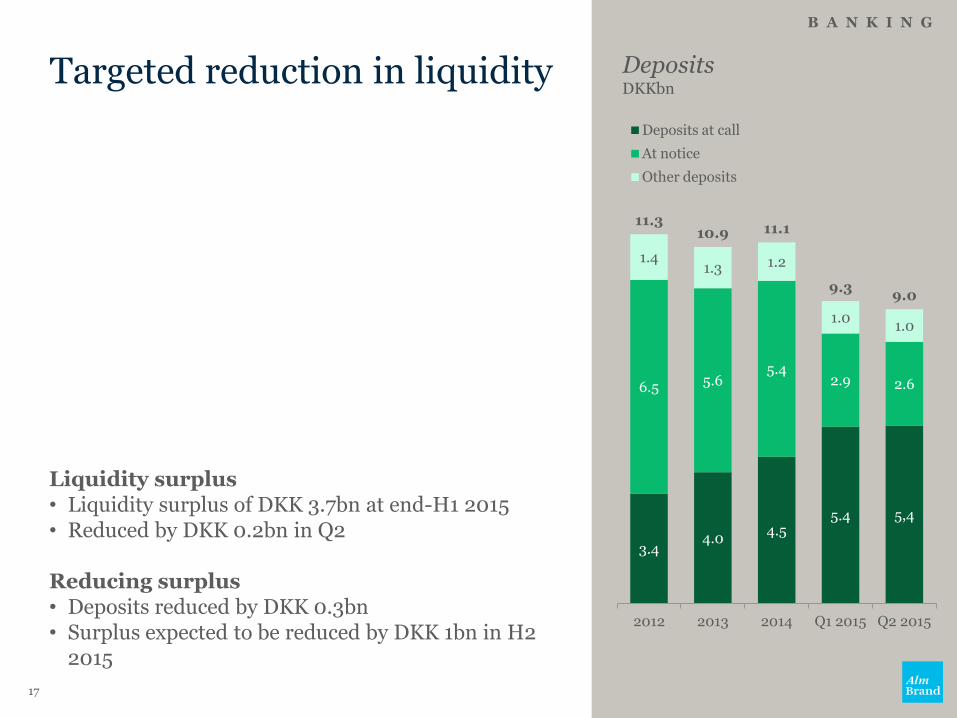
Targeted reduction in liquidity
Liquidity surplus • Liquidity surplus of DKK 3.7bn at end-H1 2015 • Reduced by DKK 0.2bn in Q2 Reducing surplus • Deposits reduced by DKK 0.3bn • Surplus expected to be reduced by DKK 1bn in H2
2015
B A N K I N G
Deposits DKKbn
17
3.4 4.0
4.5 5.4 5,4
6.5 5.6 5.4
2.9 2.6
1.4 1.3 1.2
1.0 1.0
11.3 10.9 11.1
9.3 9.0
2012 2013 2014 Q1 2015 Q2 2015
Deposits at call
At notice
Other deposits
fjern evt. pladsholderen
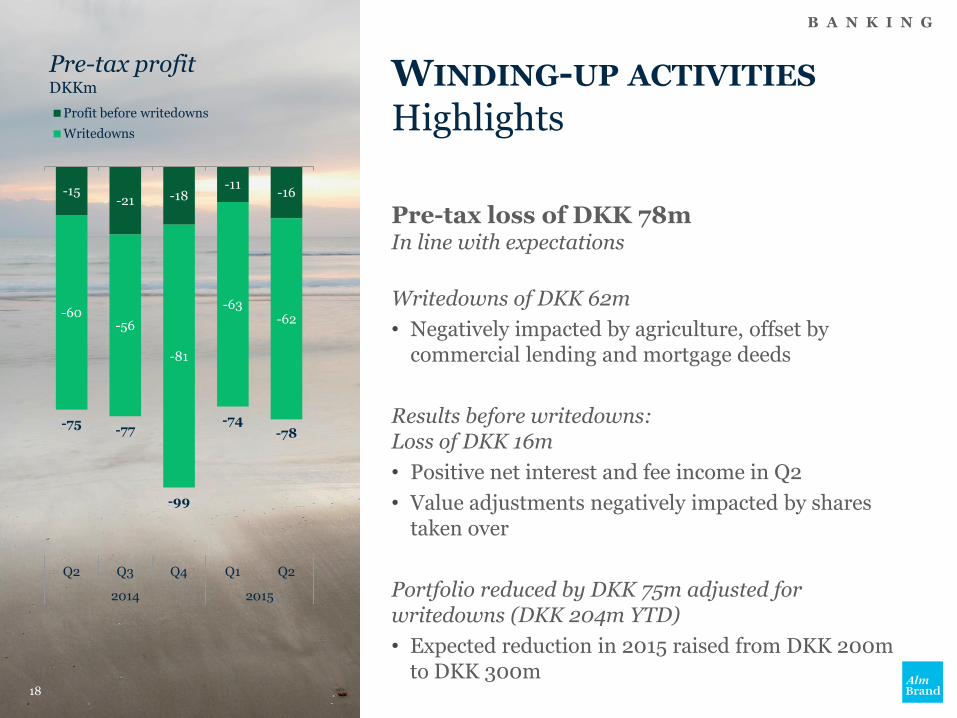
WINDING-UP ACTIVITIES Highlights
Pre-tax loss of DKK 78m In line with expectations
Writedowns of DKK 62m
• Negatively impacted by agriculture, offset by commercial lending and mortgage deeds
Results before writedowns: Loss of DKK 16m
• Positive net interest and fee income in Q2
• Value adjustments negatively impacted by shares taken over
Portfolio reduced by DKK 75m adjusted for writedowns (DKK 204m YTD)
• Expected reduction in 2015 raised from DKK 200m to DKK 300m
B A N K I N G
Pre-tax profit DKKm
18
-15 -21 -18
-11 -16
-60 -56
-81
-63 -62
-75 -77
-99
-74 -78
Q2 Q3 Q4 Q1 Q2
2014 2015
Profit before writedowns
Writedowns
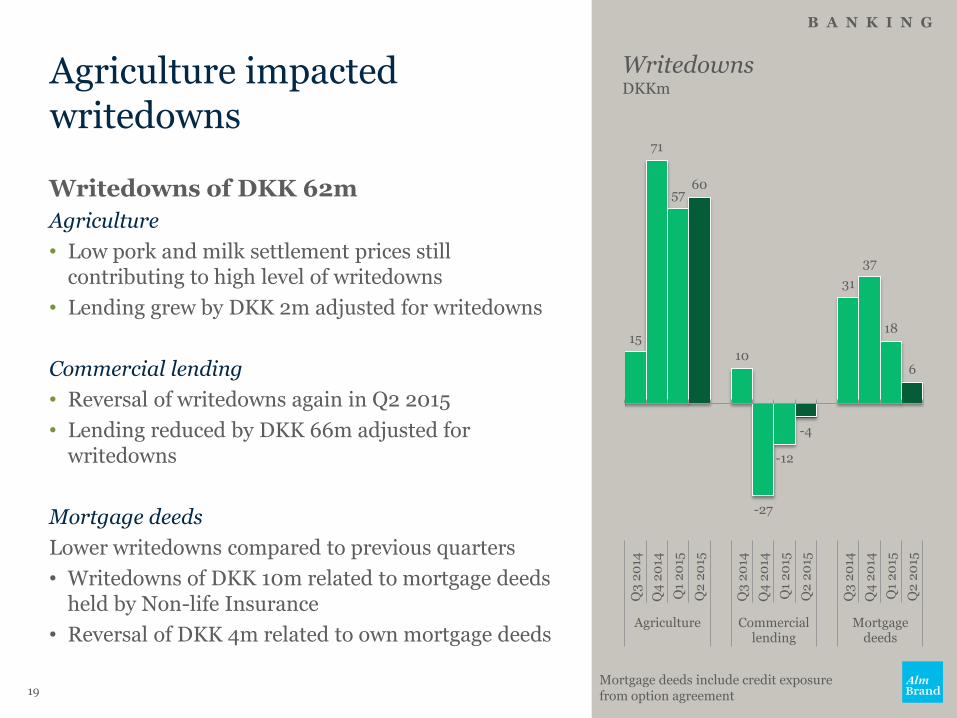
Agriculture impacted writedowns
Writedowns of DKK 62m
Agriculture
• Low pork and milk settlement prices still contributing to high level of writedowns
• Lending grew by DKK 2m adjusted for writedowns
Commercial lending
• Reversal of writedowns again in Q2 2015
• Lending reduced by DKK 66m adjusted for writedowns
Mortgage deeds
Lower writedowns compared to previous quarters
• Writedowns of DKK 10m related to mortgage deeds held by Non-life Insurance
• Reversal of DKK 4m related to own mortgage deeds
B A N K I N G
Writedowns DKKm
19 Mortgage deeds include credit exposure from option agreement
15
71
57 60
10
-27
-12
-4
31
37
18
6
Q3
20
14
Q4
20
14
Q1
20
15
Q2
20
15
Q3
20
14
Q4
20
14
Q1
20
15
Q2
20
15
Q3
20
14
Q4
20
14
Q1
20
15
Q2
20
15
Agriculture Commercial lending
Mortgage deeds
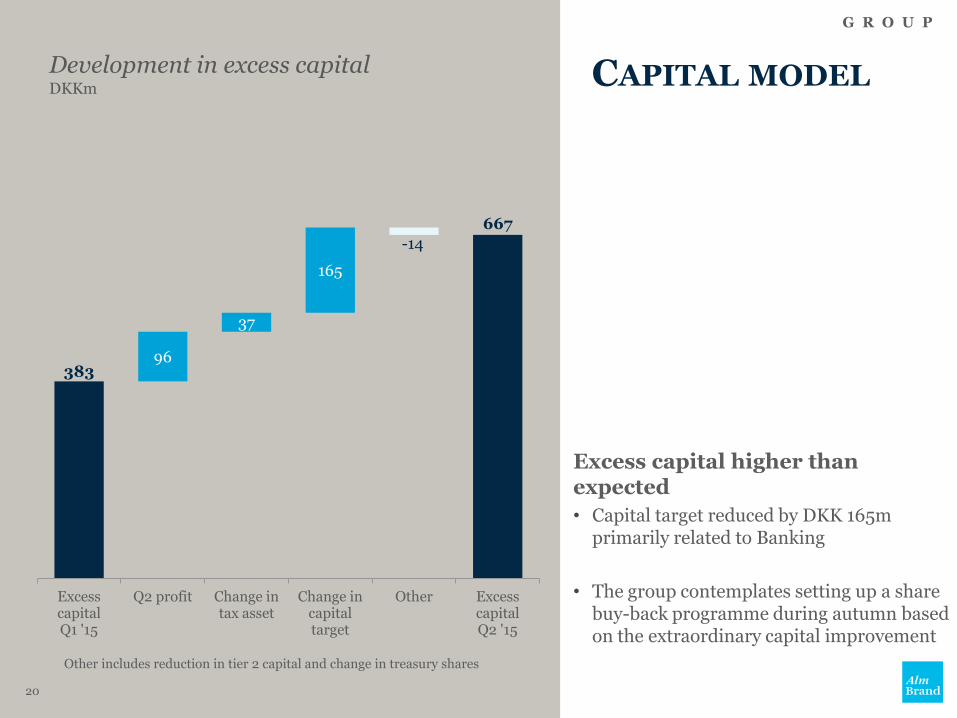
CAPITAL MODEL
Excess capital higher than expected
• Capital target reduced by DKK 165m primarily related to Banking
• The group contemplates setting up a share buy-back programme during autumn based on the extraordinary capital improvement
G R O U P
20
Development in excess capital DKKm
Other includes reduction in tier 2 capital and change in treasury shares
383
667
96
37
165
-14
Excess capital Q1 '15
Q2 profit Change in tax asset
Change in capital target
Other Excess capital Q2 '15
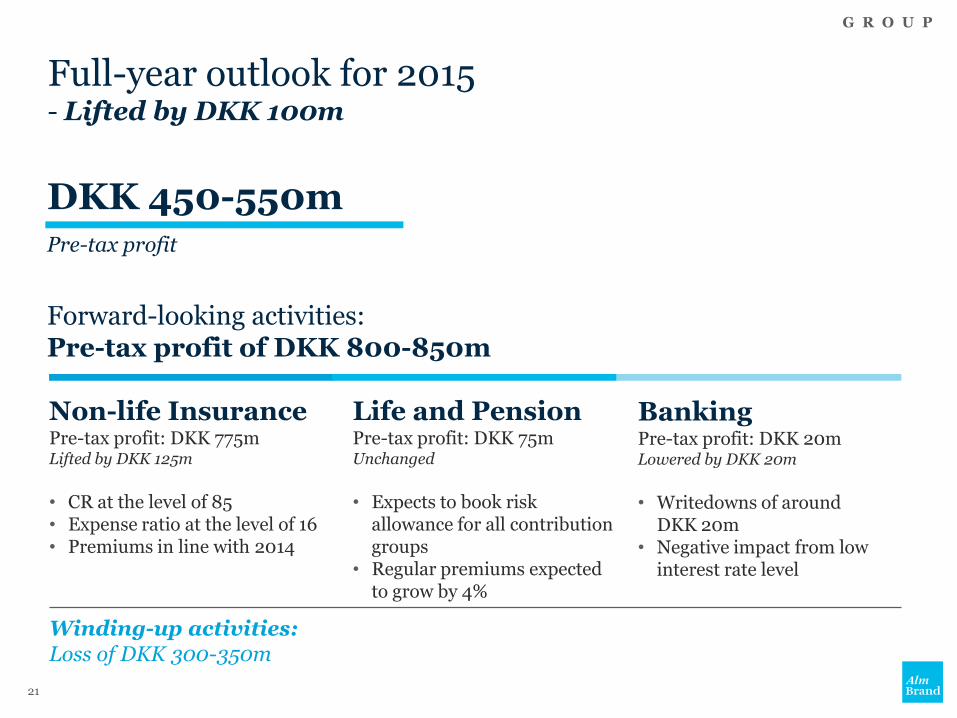
Full-year outlook for 2015 - Lifted by DKK 100m
DKK 450-550m Pre-tax profit
Forward-looking activities: Pre-tax profit of DKK 800-850m
Winding-up activities: Loss of DKK 300-350m
G R O U P
Non-life Insurance Pre-tax profit: DKK 775m Lifted by DKK 125m
• CR at the level of 85 • Expense ratio at the level of 16 • Premiums in line with 2014
Life and Pension Pre-tax profit: DKK 75m Unchanged
• Expects to book risk
allowance for all contribution groups
• Regular premiums expected to grow by 4%
Banking Pre-tax profit: DKK 20m Lowered by DKK 20m
• Writedowns of around
DKK 20m • Negative impact from low
interest rate level
21
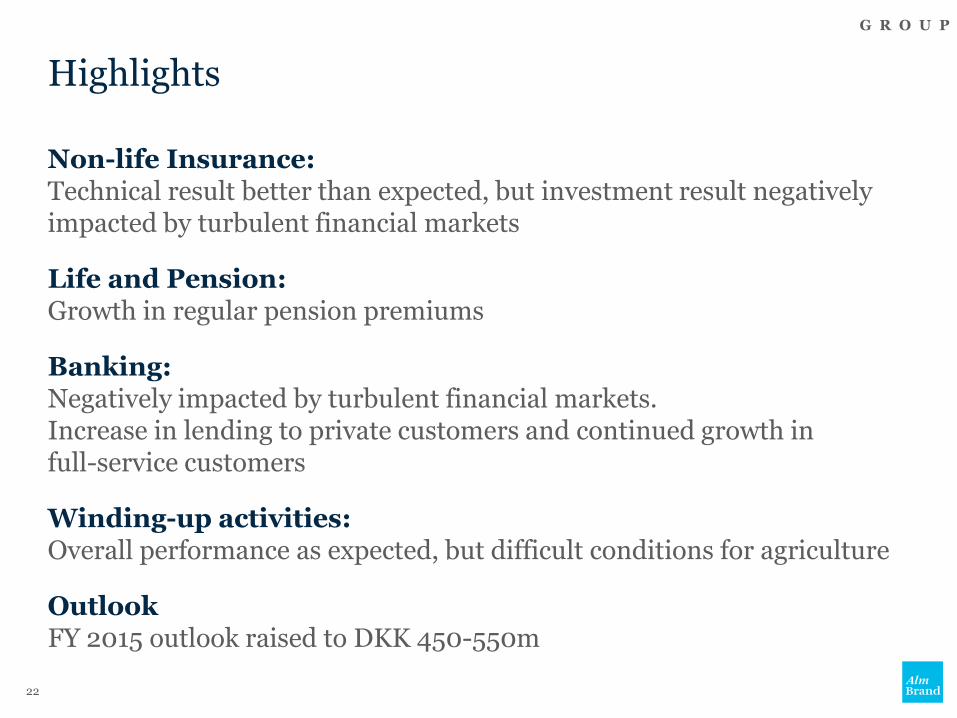
Non-life Insurance: Technical result better than expected, but investment result negatively impacted by turbulent financial markets
Life and Pension: Growth in regular pension premiums
Banking: Negatively impacted by turbulent financial markets. Increase in lending to private customers and continued growth in full-service customers
Winding-up activities: Overall performance as expected, but difficult conditions for agriculture
Outlook FY 2015 outlook raised to DKK 450-550m
G R O U P
22
Highlights
“The statements made in this presentation are based on current expectations, estimates and projections made by management. All statements about future financial performance are subject to risks and uncertainties that could cause actual results to differ materially from those set forth in or implied by the statements. All statements about future financial performance made in this presentation are solely based on information known at the time of the preparation of the last published financial report, and the company assumes no obligation to update these statements, whether as a result of new information, future events, or otherwise.”
23

Alm Brand
Results for Q2 2015 Webcast presentation 20 August 2015