Q2 2015 presentation
28
SECOND QUARTER 2015 July 21 st , 2015 Tele2 AB
-
Upload
tele2 -
Category
Investor Relations
-
view
3.240 -
download
1
Transcript of Q2 2015 presentation
SECONDQUARTER 2015July 21st, 2015
Tele2 AB
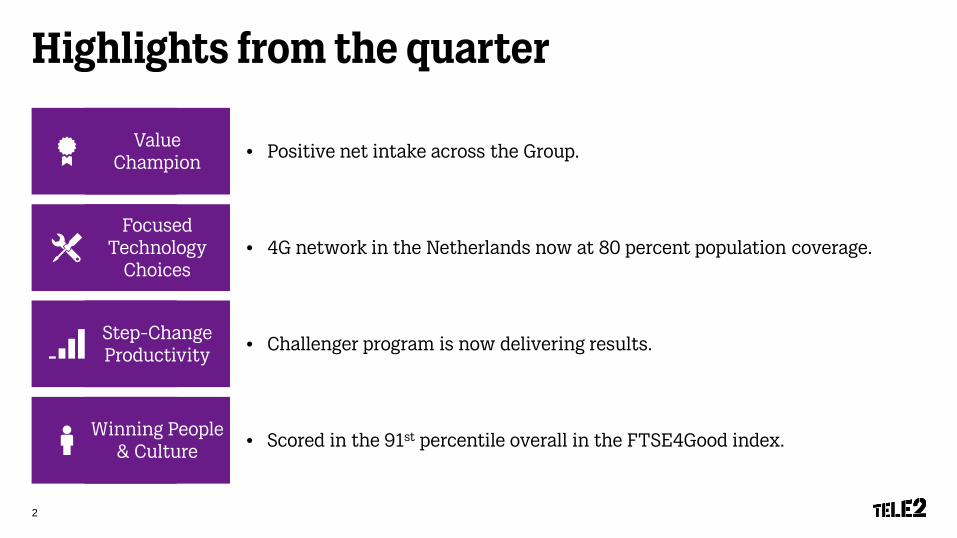
Highlights from the quarter
Winning People & Culture
Value Champion
Step-Change Productivity
Focused Technology
Choices
• Scored in the 91st percentile overall in the FTSE4Good index.
• 4G network in the Netherlands now at 80 percent population coverage.
• Positive net intake across the Group.
• Challenger program is now delivering results.
2
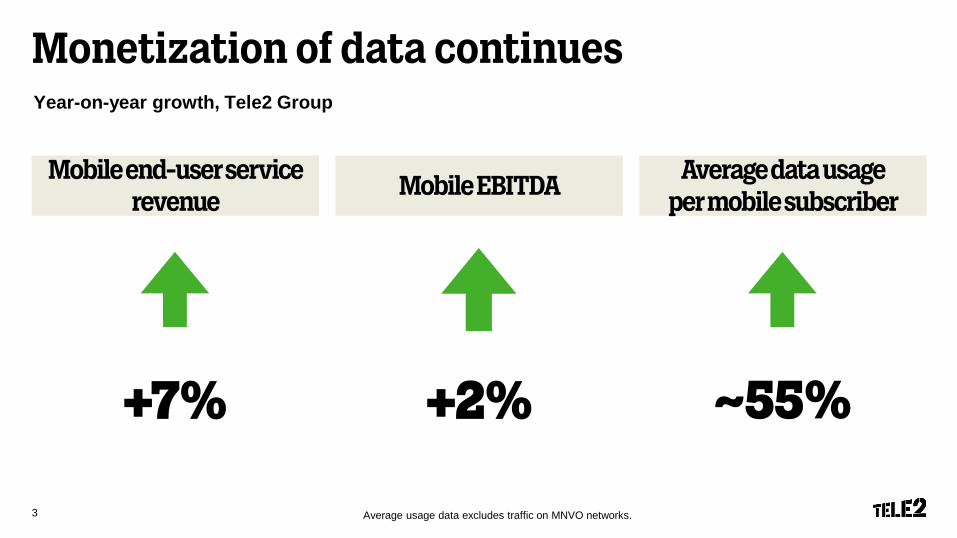
Monetization of data continues
Average usage data excludes traffic on MNVO networks.
Year-on-year growth, Tele2 Group
Mobile end-user service revenue
Mobile EBITDA Average data usage per mobile subscriber
+7% +2% ~55%
3
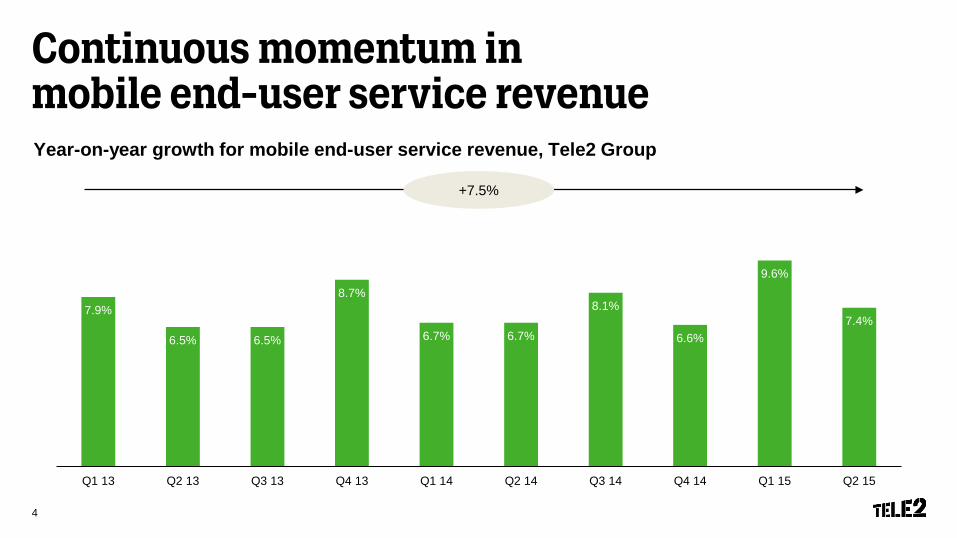
Continuous momentum in mobile end-user service revenue Year-on-year growth for mobile end-user service revenue, Tele2 Group
+7.5%
7.9%
6.5% 6.5%
8.7%
6.7% 6.7%
8.1%
6.6%
9.6%
7.4%
Q1 13 Q2 13 Q3 13 Q4 13 Q1 14 Q2 14 Q3 14 Q4 14 Q1 15 Q2 15
4
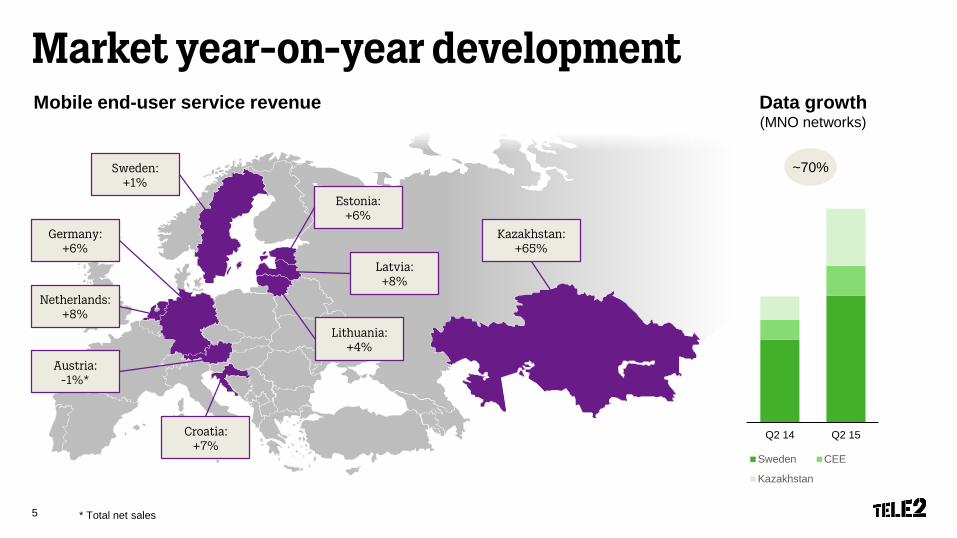
Kazakhstan: +65%
Latvia: +8%
Lithuania: +4%
Sweden: +1%
Netherlands: +8%
Austria: -1%*
Croatia: +7%
Germany: +6%
Estonia: +6%
Market year-on-year development
* Total net sales
Mobile end-user service revenue Data growth (MNO networks)
~70%
Q2 14 Q2 15
Sweden CEE
Kazakhstan
5
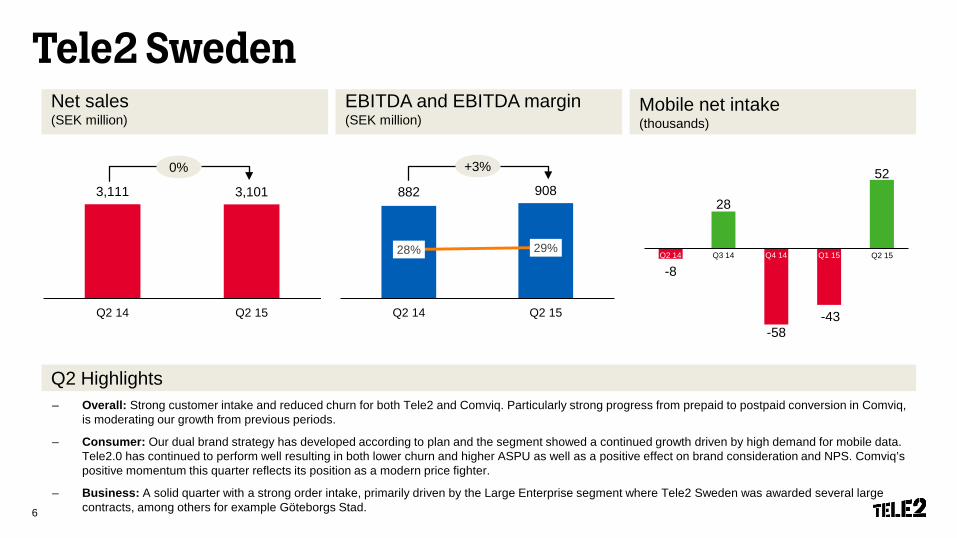
Tele2 SwedenNet sales(SEK million)
EBITDA and EBITDA margin(SEK million)
Mobile net intake(thousands)
– Overall: Strong customer intake and reduced churn for both Tele2 and Comviq. Particularly strong progress from prepaid to postpaid conversion in Comviq,is moderating our growth from previous periods.
– Consumer: Our dual brand strategy has developed according to plan and the segment showed a continued growth driven by high demand for mobile data. Tele2.0 has continued to perform well resulting in both lower churn and higher ASPU as well as a positive effect on brand consideration and NPS. Comviq’spositive momentum this quarter reflects its position as a modern price fighter.
– Business: A solid quarter with a strong order intake, primarily driven by the Large Enterprise segment where Tele2 Sweden was awarded several large contracts, among others for example Göteborgs Stad.
Q2 Highlights
3,111 3,101
Q2 14 Q2 15
0%
882 908
28% 29%
0%
10%
20%
30%
40%
50%
60%
Q2 14 Q2 150
100
200
300
400
500
600
700
800
900
1000
+3%
-8
28
-58-43
52
Q4 14 Q1 15Q2 14 Q3 14 Q2 15
6
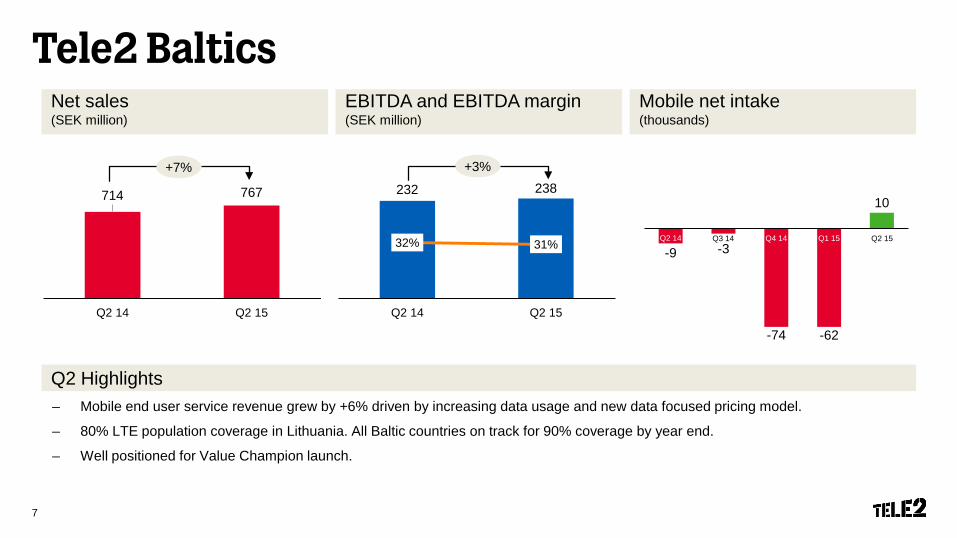
Tele2 BalticsNet sales(SEK million)
EBITDA and EBITDA margin(SEK million)
Mobile net intake(thousands)
– Mobile end user service revenue grew by +6% driven by increasing data usage and new data focused pricing model.
– 80% LTE population coverage in Lithuania. All Baltic countries on track for 90% coverage by year end.
– Well positioned for Value Champion launch.
Q2 Highlights
714 767
Q2 14 Q2 15
232 238
32% 31%
0%
10%
20%
30%
40%
50%
60%
Q2 14 Q2 150
50
100
150
200
250
+7% +3%
-9 -3
-74 -62
10
Q4 14 Q1 15Q2 14 Q3 14 Q2 15
7
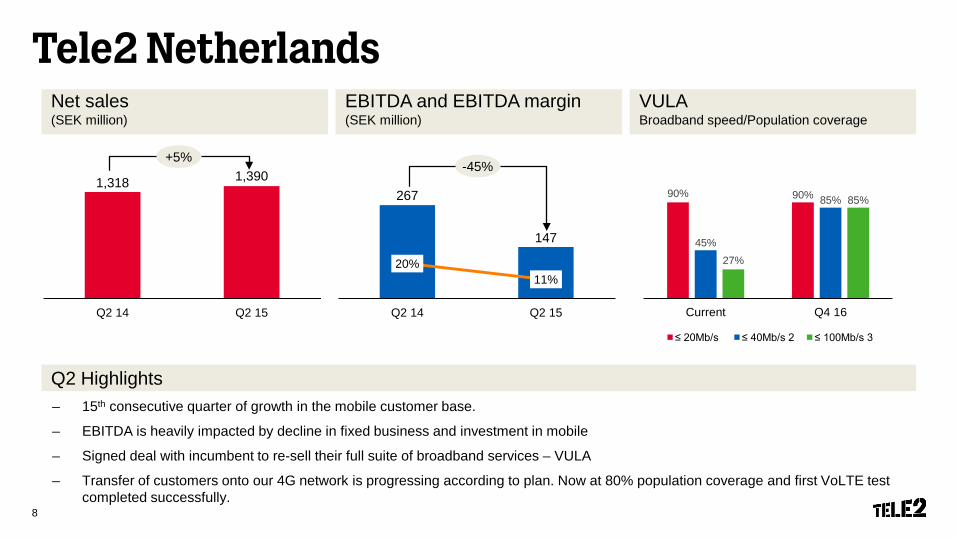
Tele2 NetherlandsNet sales(SEK million)
EBITDA and EBITDA margin(SEK million)
Q2 Highlights– 15th consecutive quarter of growth in the mobile customer base.
– EBITDA is heavily impacted by decline in fixed business and investment in mobile
– Signed deal with incumbent to re-sell their full suite of broadband services – VULA
– Transfer of customers onto our 4G network is progressing according to plan. Now at 80% population coverage and first VoLTE test completed successfully.
VULABroadband speed/Population coverage
1,318 1,390
Q2 14 Q2 15
267
147
20%11%
0%
10%
20%
30%
40%
50%
60%
Q2 14 Q2 150
50
100
150
200
250
300
+5%-45%
90% 90%
45%
85%
27%
85%
Current Q4 16
≤ 20Mb/s ≤ 40Mb/s 2 ≤ 100Mb/s 3
8
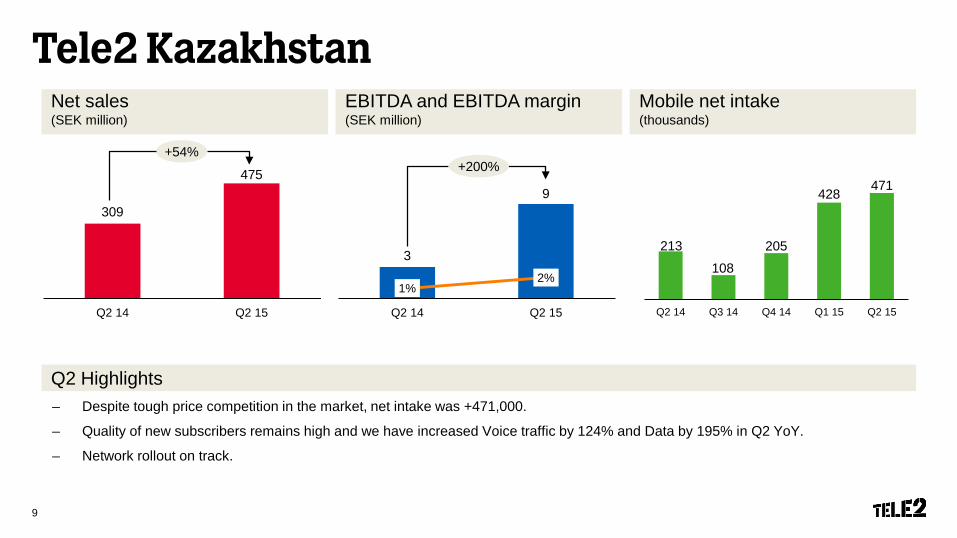
Tele2 Kazakhstan
– Despite tough price competition in the market, net intake was +471,000.
– Quality of new subscribers remains high and we have increased Voice traffic by 124% and Data by 195% in Q2 YoY.
– Network rollout on track.
Net sales(SEK million)
EBITDA and EBITDA margin(SEK million)
Q2 Highlights
Mobile net intake(thousands)
309
475
Q2 14 Q2 15
3
9
1%2%
0%
1%
2%
3%
4%
5%
6%
7%
8%
9%
10%
Q2 14 Q2 150
1
2
3
4
5
6
7
8
9
10
+54%+200%
213
108
205
428 471
Q2 14 Q3 14 Q4 14 Q1 15 Q2 15
9
Financial Overview
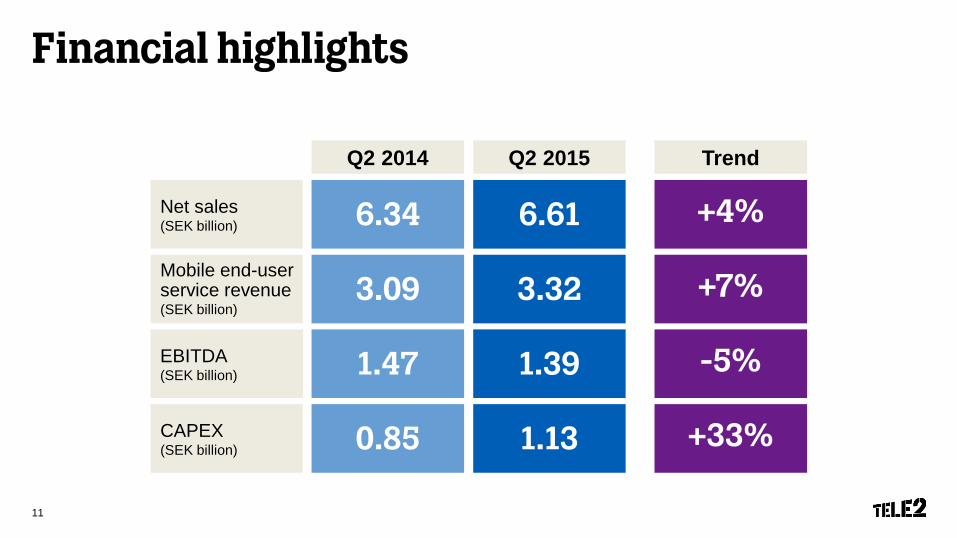
Financial highlights
Mobile end-user service revenue(SEK billion)
3.32
EBITDA(SEK billion) 1.39
CAPEX(SEK billion) 1.13
Net sales(SEK billion) 6.61
Q2 2015 Trend
+7%
-5%
+33%
+4%
3.09
1.47
0.85
6.34
Q2 2014
11
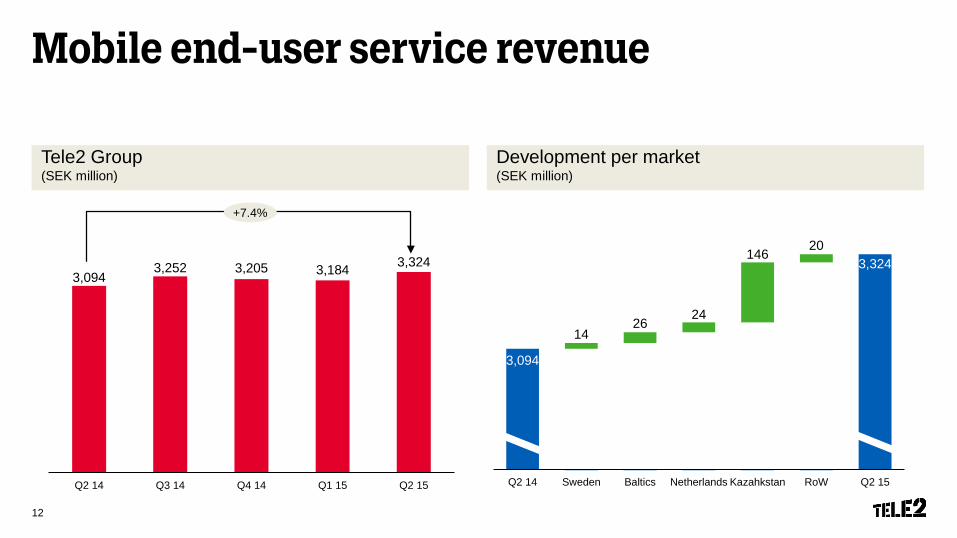
Mobile end-user service revenue
Tele2 Group(SEK million)
Development per market(SEK million)
3,205
3,0943,252 3,205 3,184 3,324
Q2 14 Q3 14 Q4 14 Q1 15 Q2 15
+7.4%
3,094
3,324
1426
24
14620
Q2 14 Sweden Baltics Netherlands Kazahkstan RoW Q2 15
12
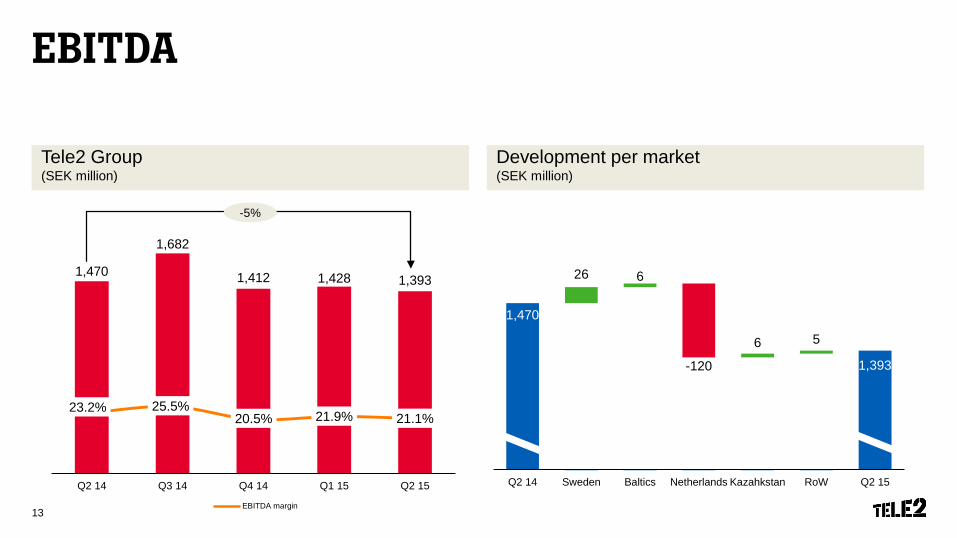
EBITDA
Tele2 Group(SEK million)
1,412
Development per market(SEK million)
1,470
1,682
1,412 1,428 1,393
23.2% 25.5%20.5% 21.9% 21.1%
0
200
400
600
800
1000
1200
1400
1600
1800
Q2 14 Q3 14 Q4 14 Q1 15 Q2 150.00%
10.00%
20.00%
30.00%
40.00%
50.00%
60.00%
70.00%
80.00%
90.00%
EBITDA margin
1,470
1,393
26 6
-120
6 5
Q2 14 Sweden Baltics Netherlands Kazahkstan RoW Q2 15
-5%
13
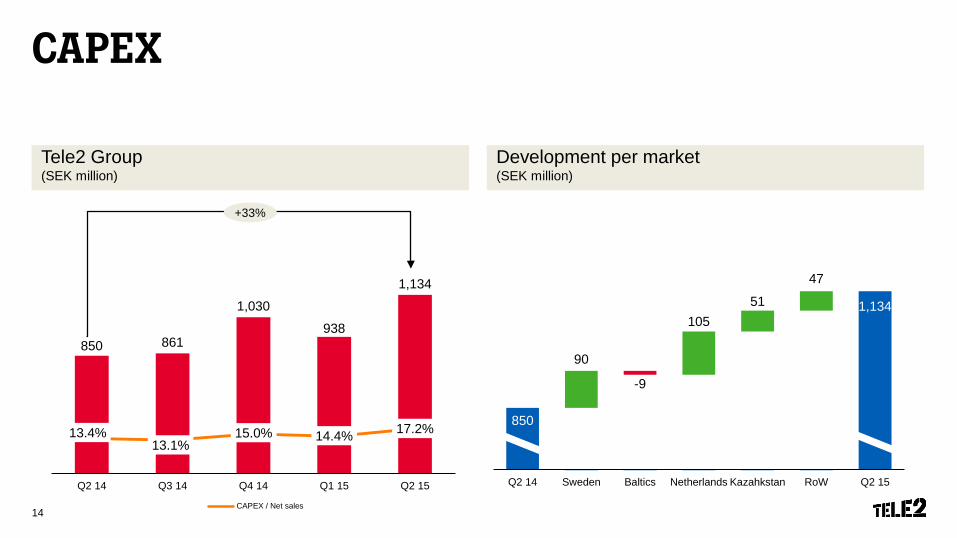
CAPEX
Tele2 Group(SEK million)
Development per market(SEK million)
850 861
1,030
938
1,134
13.4%13.1%
15.0% 14.4% 17.2%
300
500
700
900
1100
1300
Q2 14 Q3 14 Q4 14 Q1 15 Q2 150.00%
10.00%
20.00%
30.00%
40.00%
50.00%
60.00%
70.00%
80.00%
90.00%
CAPEX / Net sales
850
1,134
90
-9
10551
47
Q2 14 Sweden Baltics Netherlands Kazahkstan RoW Q2 15
+33%
14
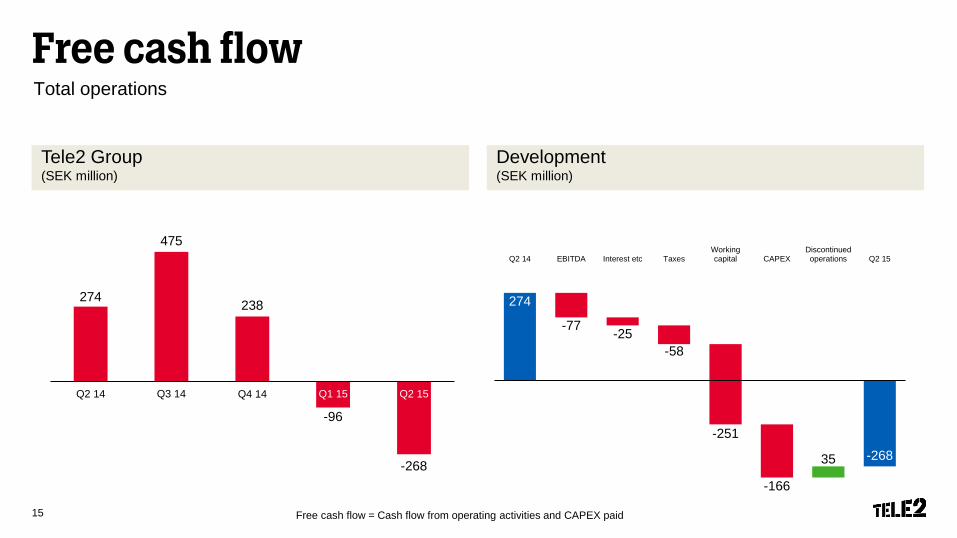
Free cash flowTotal operations
Tele2 Group(SEK million)
Development (SEK million)
Free cash flow = Cash flow from operating activities and CAPEX paid
274
475
238
-96
-268-400
-300
-200
-100
0
100
200
300
400
500
600
Q2 14 Q3 14 Q4 14 Q1 15 Q2 15
274
-77 -25-58
-251
-166
35 -268
Q2 14 EBITDA Interest etc TaxesWorkingcapital CAPEX
Discontinuedoperations Q2 15
Q2 15
15
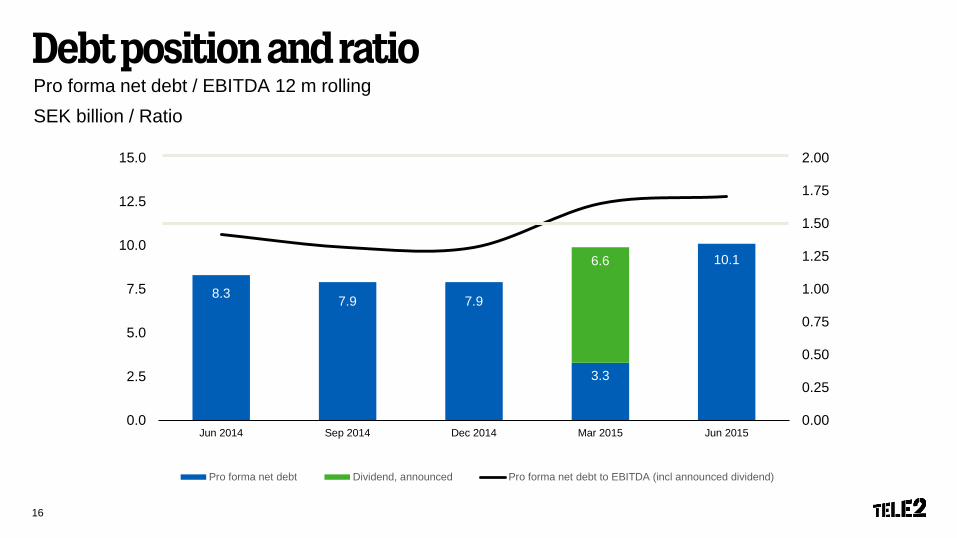
Debt position and ratioPro forma net debt / EBITDA 12 m rollingSEK billion / Ratio
8.3 7.9 7.9
3.3
10.16.6
0.00
0.25
0.50
0.75
1.00
1.25
1.50
1.75
2.00
0.0
2.5
5.0
7.5
10.0
12.5
15.0
Jun 2014 Sep 2014 Dec 2014 Mar 2015 Jun 2015
Pro forma net debt Dividend, announced Pro forma net debt to EBITDA (incl announced dividend)
16
CHALLENGER PROGRAM
Step-change productivity
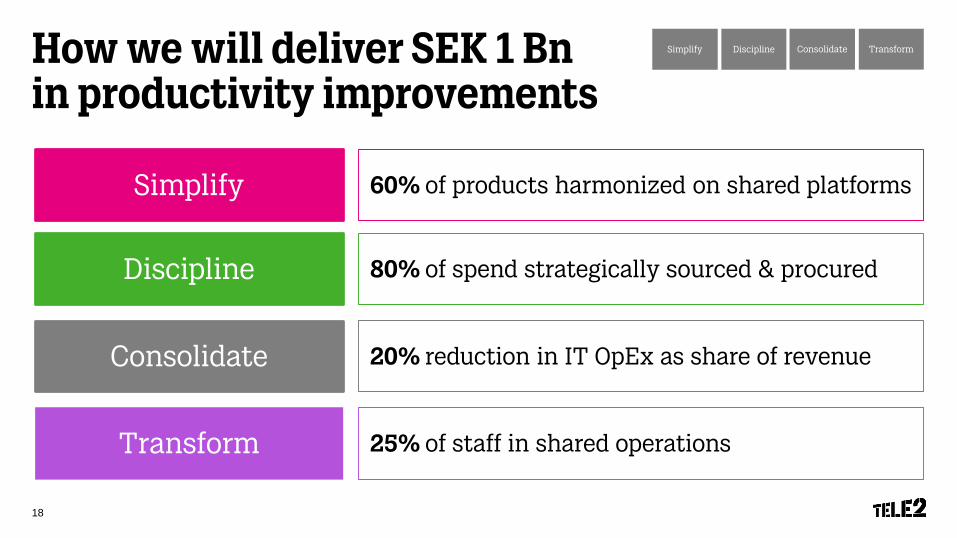
How we will deliver SEK 1 Bnin productivity improvements
Simplify
Transform
Consolidate
Discipline
Simplify Discipline Consolidate Transform
60% of products harmonized on shared platforms
80% of spend strategically sourced & procured
20% reduction in IT OpEx as share of revenue
25% of staff in shared operations
18
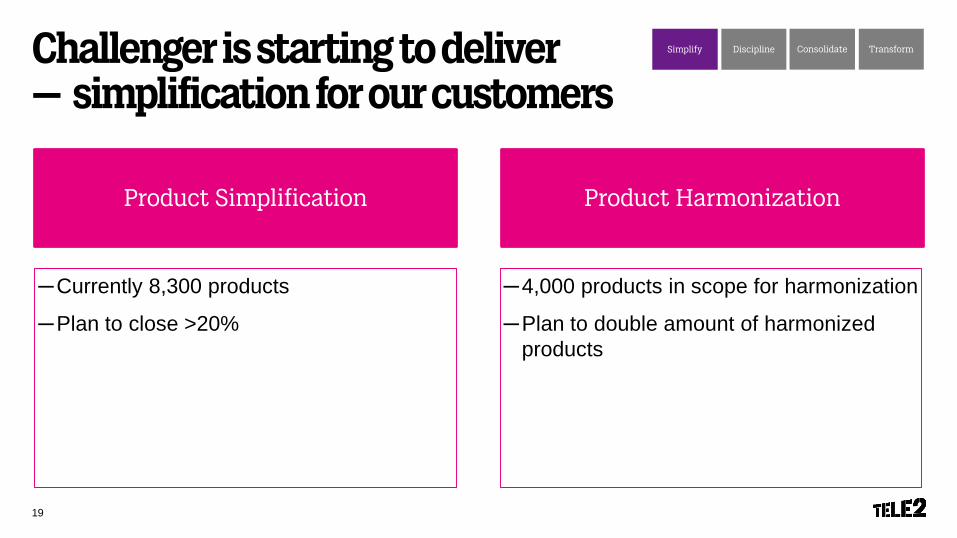
Challenger is starting to deliver – simplification for our customers
Simplify Discipline Consolidate Transform
Product Simplification
─ Currently 8,300 products
─ Plan to close >20%
Product Harmonization
─ 4,000 products in scope for harmonization
─ Plan to double amount of harmonized products
19
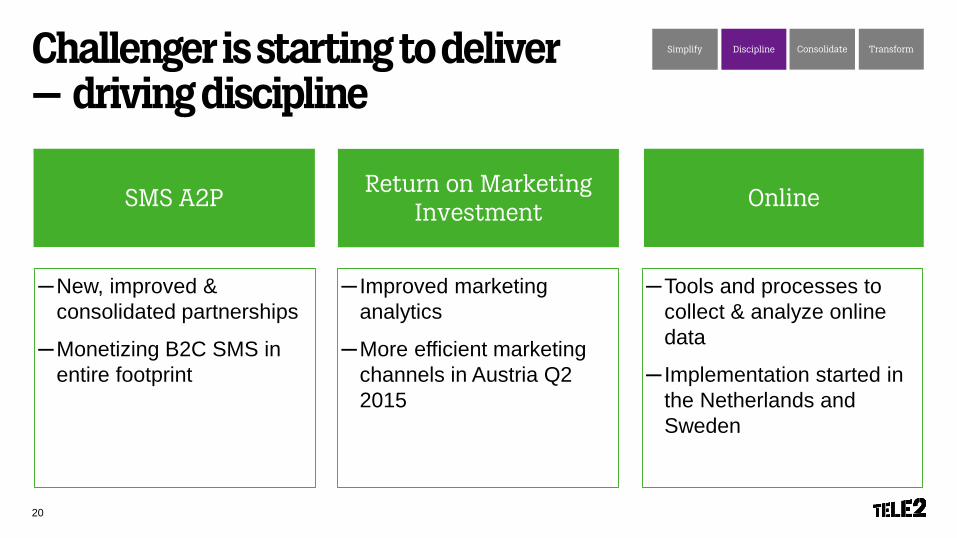
Challenger is starting to deliver – driving discipline
Simplify Discipline Consolidate Transform
SMS A2P
─ New, improved & consolidated partnerships
─ Monetizing B2C SMS in entire footprint
Online
─ Tools and processes to collect & analyze online data
─ Implementation started in the Netherlands and Sweden
Return on Marketing Investment
─ Improved marketing analytics
─ More efficient marketing channels in Austria Q2 2015
20
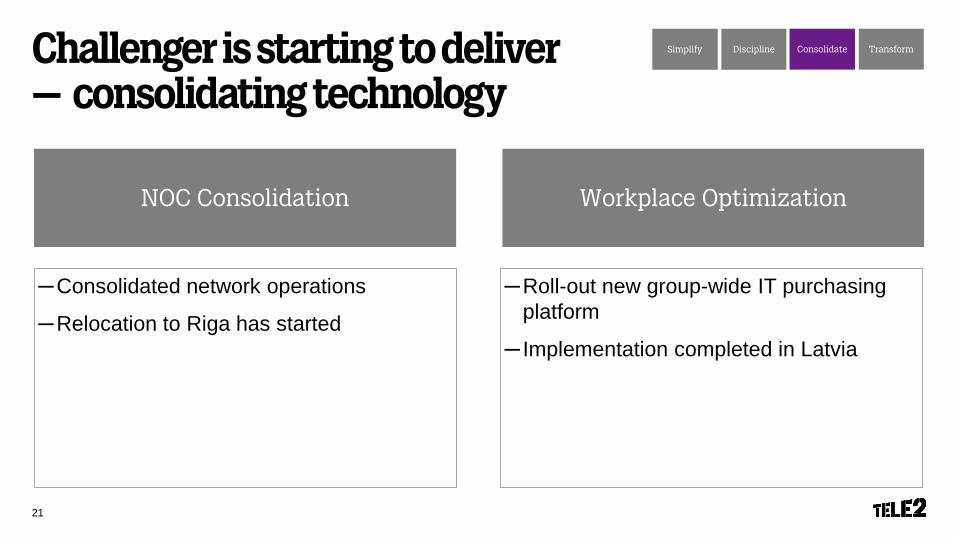
Challenger is starting to deliver – consolidating technology
Simplify Discipline Consolidate Transform
NOC Consolidation
─ Consolidated network operations
─ Relocation to Riga has started
Workplace Optimization
─ Roll-out new group-wide IT purchasing platform
─ Implementation completed in Latvia
21
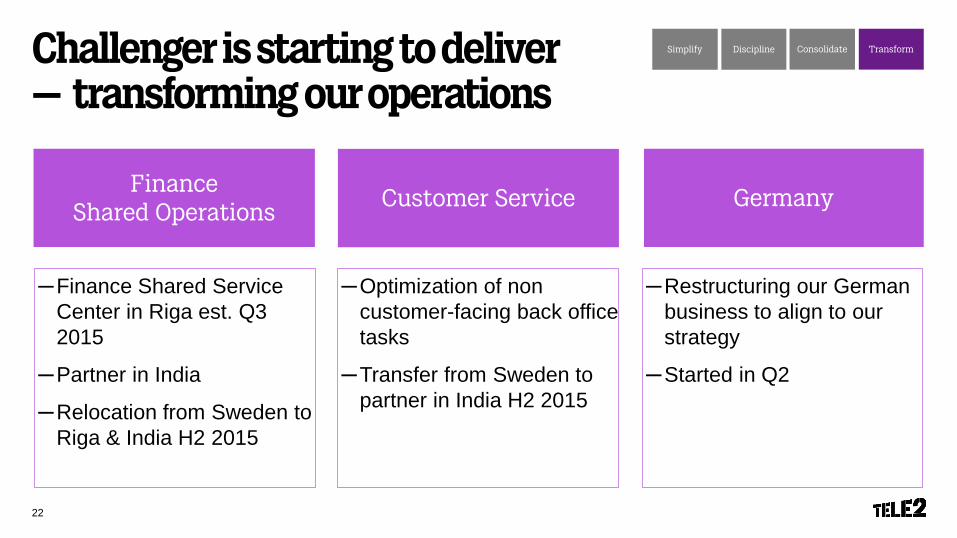
Challenger is starting to deliver – transforming our operations
Simplify Discipline Consolidate Transform
Finance Shared Operations
─ Finance Shared Service Center in Riga est. Q3 2015
─ Partner in India
─ Relocation from Sweden to Riga & India H2 2015
Germany
─ Restructuring our German business to align to our strategy
─ Started in Q2
Customer Service
─ Optimization of non customer-facing back office tasks
─ Transfer from Sweden to partner in India H2 2015
22
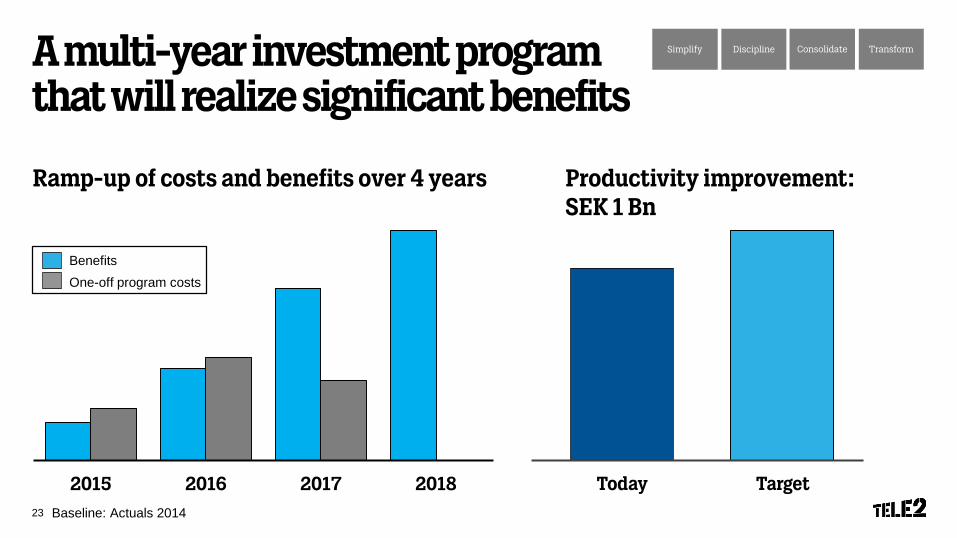
2015 2016 2017 2018
A multi-year investment program that will realize significant benefits
Baseline: Actuals 2014
Ramp-up of costs and benefits over 4 years
Simplify Discipline Consolidate Transform
Productivity improvement: SEK 1 Bn
Today Target
BenefitsOne-off program costs
23
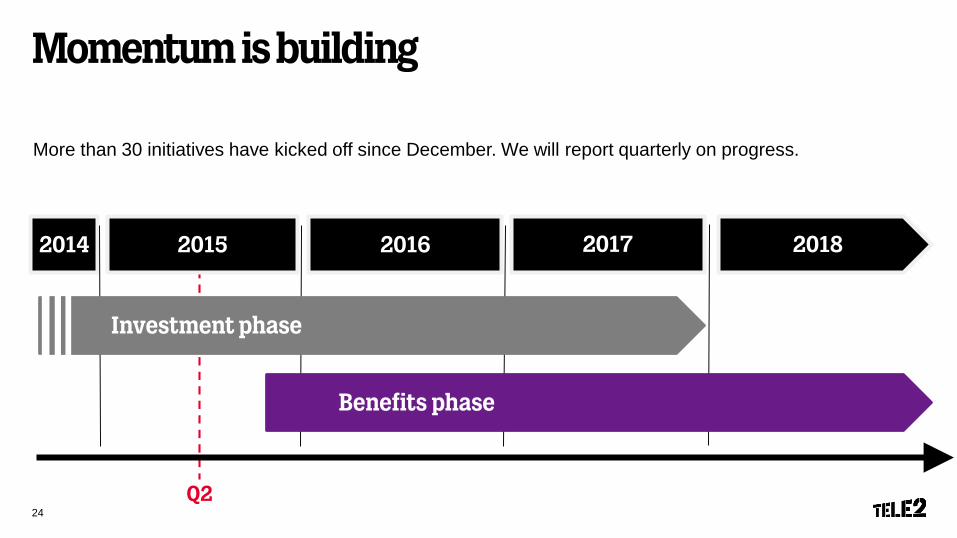
Momentum is building
2015 20162014
More than 30 initiatives have kicked off since December. We will report quarterly on progress.
Q2
2017 2018
Investment phase
Benefits phase
24
Q2 2015 Summary
25
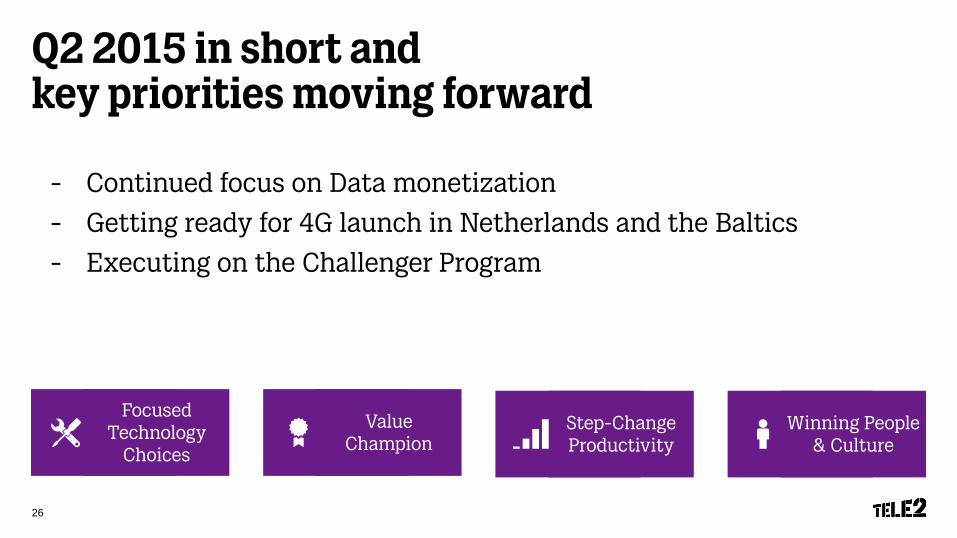
Q2 2015 in short and key priorities moving forward
- Continued focus on Data monetization
- Getting ready for 4G launch in Netherlands and the Baltics
- Executing on the Challenger Program
Winning People & Culture
Value Champion
Step-Change Productivity
Focused Technology
Choices
26
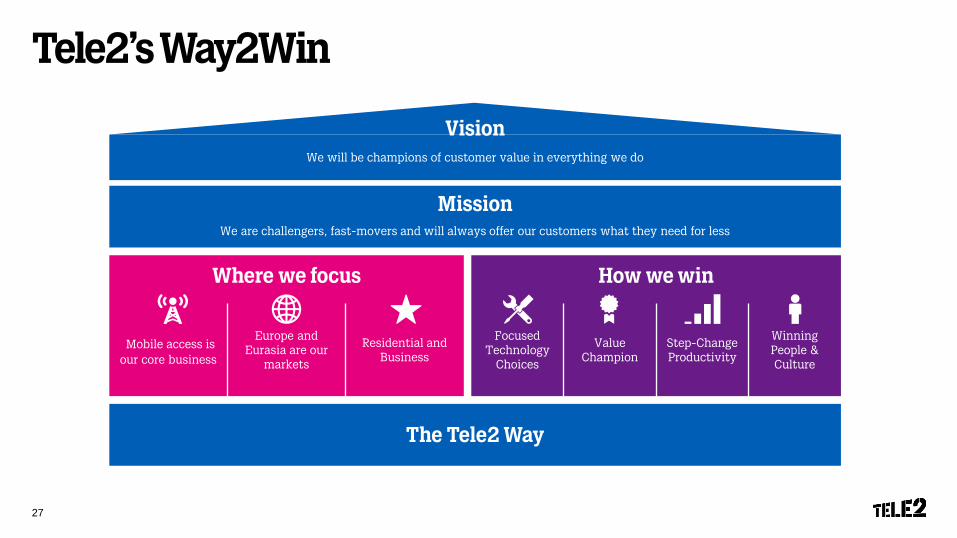
Tele2’s Way2Win
The Tele2 Way
Where we focus
We are challengers, fast-movers and will always offer our customers what they need for less
We will be champions of customer value in everything we do
Mobile access is our core business
Europe and Eurasia are our
markets
Residential and Business
How we win
Focused Technology
Choices
Value Champion
Step-Change Productivity
Winning People & Culture
Vision
Mission
27
THEEND