Q2/2015 Roadshow presentation
65
KESKO ROADSHOW CFO JUKKA ERLUND LONDON 12 June 2015
Transcript of Q2/2015 Roadshow presentation

KESKO
ROADSHOW
CFO JUKKA ERLUND
LONDON 12 June 2015
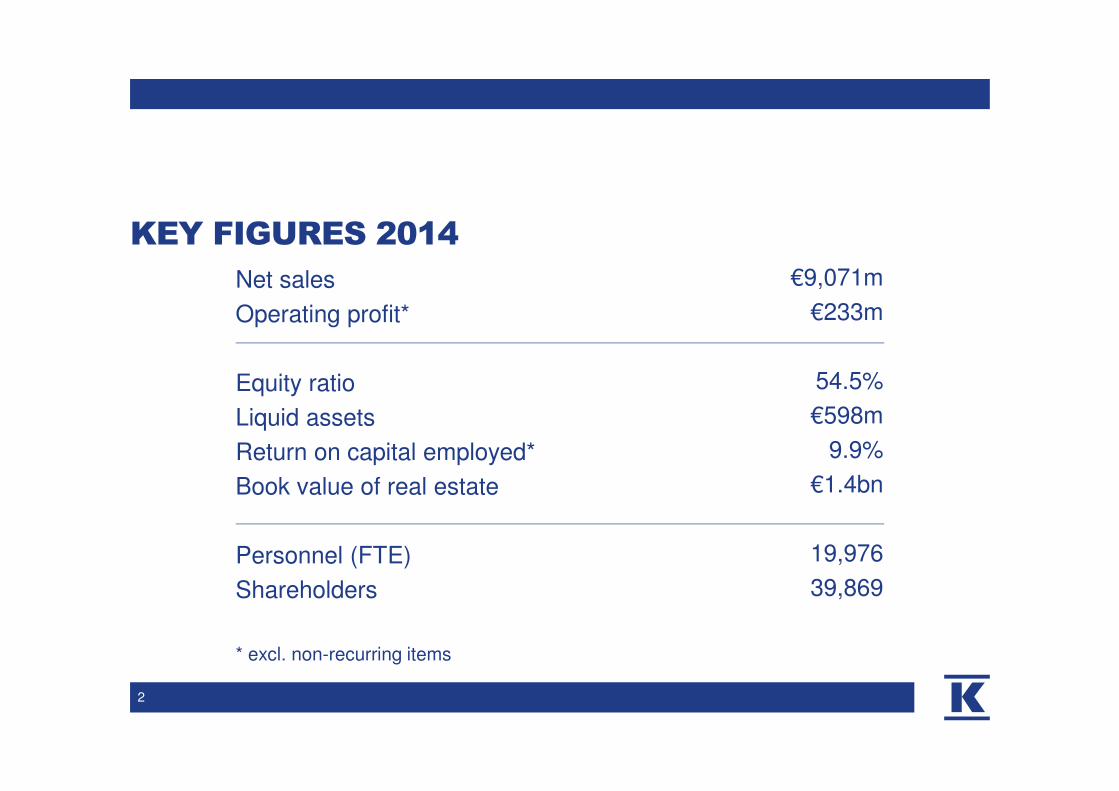
KEY FIGURES 2014
2
Net sales
Operating profit*
Equity ratio
Liquid assets
Return on capital employed*
Book value of real estate
Personnel (FTE)
Shareholders
* excl. non-recurring items
€9,071m
€233m
54.5%
€598m
9.9%
€1.4bn
19,976
39,869

• K-Group’s sales €11.3bn
• Over 1.3 million customer visits
every day
• Personnel 45,000
FOR SHOPPING TO BE FUN
3
K-GROUP

KESKO NET SALES
BY LINE OF BUSINESS
2014
4
Machinery trade 3%
Car trade 9%
Agricultural trade 4%
Sports trade 2%
Furniture trade 2%
Building and home
improvement trade 25%
Kespro 9%Grocery trade
Russia 1%
Grocery trade
Finland 44%
Grocery trade €4,754m
Home improvement and speciality goods trade €3,000m
Car and machinery trade €1,011m

KESKO NET SALES BY
COUNTRY 2014
Russia 4%
Lithuania 4%
Latvia 1%
Finland 82%
Belarus 1%
Estonia 1%
Sweden 2%
Norway 5%
Over 80% of net sales
comes from Finland
5

0
2000
4000
6000
8000
10000
2005 2006 2007 2008 2009 2010 2011 2012 2013 2014
Finland Other countries
NET SALES
6
+5.8%
+11.1%+9.3%
+3.3%
-11.9%+3.9%
+7.8% +2.4%-3.8%
€m
-2.6%

-100
0
100
200
300
400
500
2005 2006 2007 2008 2009 2010 2011 2012 2013 2014
Operating profit excl. non-recurring items Non-recurring items
OPERATING PROFIT
7
€m
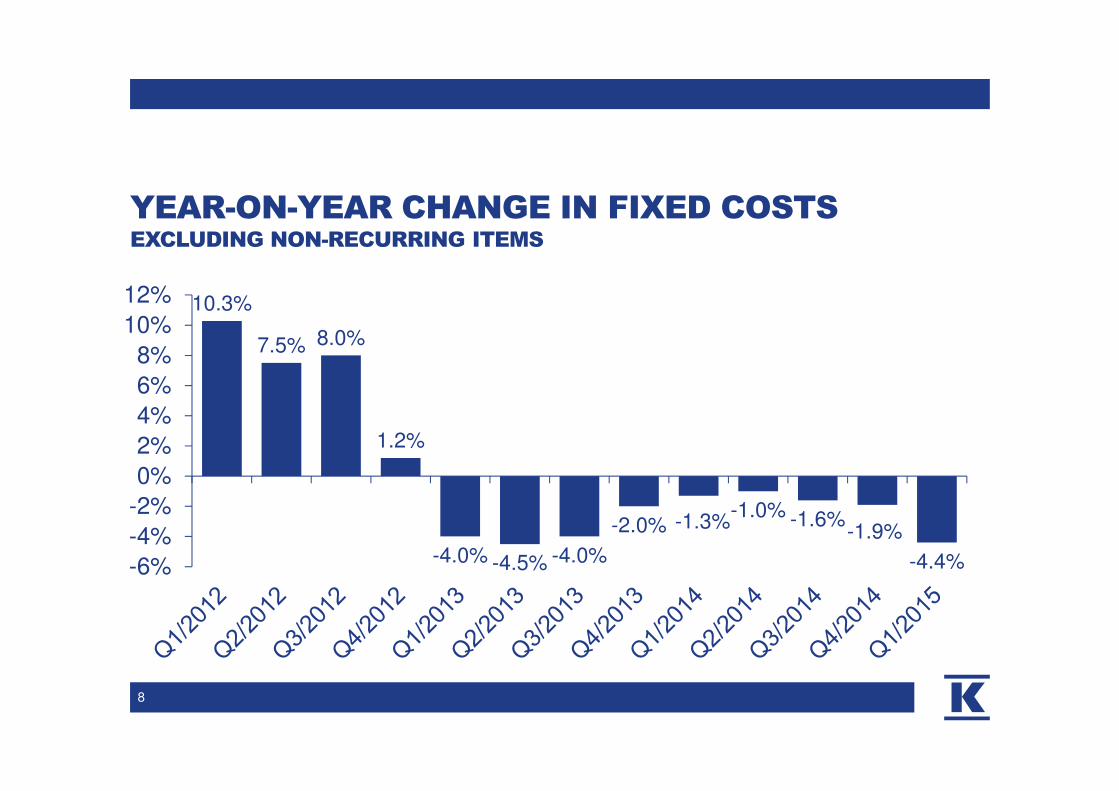
YEAR-ON-YEAR CHANGE IN FIXED COSTSEXCLUDING NON-RECURRING ITEMS
8
10.3%
7.5% 8.0%
1.2%
-4.0% -4.5% -4.0%
-2.0% -1.3%-1.0% -1.6%
-1.9%
-4.4%-6%
-4%
-2%
0%
2%
4%
6%
8%
10%
12%

RETURN ON CAPITAL EMPLOYEDMOVING 12 MO, EXCL. NON-RECURRING ITEMS
Jukka Erlund
9
Group totalHome improvement
and speciality
goods trade
Grocery trade Car and
machinery
trade
%
€1,013m €869m €161m €2,344m
Capital
employed:
21.0
2.3
17.7
10.2
0
5
10
15
20
25

STRONG FINANCIAL POSITION
10
Liquid assets €506m €532m
Interest bearing net debt €41m €25m
Equity ratio 51.5% 53.2%
Q1/2015 Q1/2014
• Expected cash flow €405 million from real estate arrangement
• Strong cash position enables growth and good dividend yield

EARNINGS / SHARE AND DIVIDEND
11
2009 2010 2011 2012 2013 2014
2.0
1.5
1.0
0.5
0.0
1.501.65
1.40
1.68
1.20
1.47
1.20
1.84
1.30
1.78
0.90
0.71
Dividend
Earnings / share excl. non-recurring items % Effective dividend yield
3.9% 3.7% 4.6% 4.8% 5.2% 5.0%€

FINANCIAL TARGETS AND
CAPITAL EXPENDITURE
• Return on capital employed 14%
• Return on equity 12%
• Interest bearing net liabilities / EBITDA < 2.5
• Capital expenditure in 2015–2017 approximately €1 billion
• Excluding possible acquisitions
12
Dividend policy: Kesko Corporation distributes at least 50% of its earnings
per share excluding non-recurring items as dividends, taking however the
company's financial position and operating strategy into account.
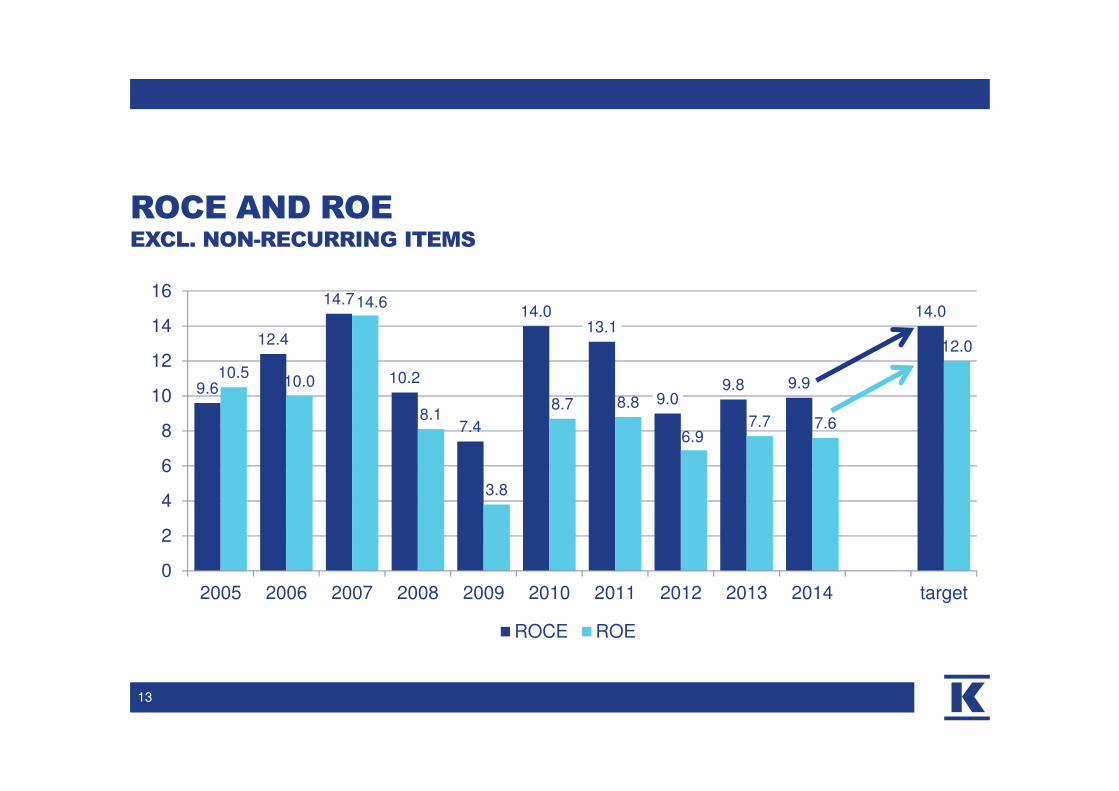
ROCE AND ROEEXCL. NON-RECURRING ITEMS
9.6
12.4
14.7
10.2
7.4
14.013.1
9.09.8 9.9
14.0
10.510.0
14.6
8.1
3.8
8.7 8.8
6.97.7 7.6
12.0
0
2
4
6
8
10
12
14
16
2005 2006 2007 2008 2009 2010 2011 2012 2013 2014 target
ROCE ROE
13

0
50
100
150
200
250
300
350
400
450
2005 2006 2007 2008 2009 2010 2011 2012 2013 2014
Capital expenditure in store sites Acquisitions Other capital expenditure
average
CAPITAL EXPENDITURE BACK TO NORMAL LEVEL
14
€m

IMPROVING PROFITABILITY
• Profitable growth in three strategic areas
• Divestment of Anttila
• Improving cost efficiency
• Enhanced sourcing operations
• Efficient support functions and synergies in core processes
• The objective is to achieve cost savings of at least €50 million in
fixed costs by the end of 2016
15

16
OPERATING
ENVIRONMENT
16

RETAIL TRADE TRENDS IN OPERATING
COUNTRIES
5/2015 Jukka Erlund
17
Source: Eurostat, excl. motor vehicles and fuels
-2
0
2
4
6
8
10
1/2013 7/2013 1/2014 7/2014 1/2015
% (
movin
g 1
2 m
o)
Estonia
Lithuania
Norway
Sweden
Latvia
Finland

CONSUMER CONFIDENCE IN FINLAND
18
0
2
4
6
8
10
12
14
16
1/0
0
7/0
0
1/0
1
7/0
1
1/0
2
7/0
2
1/0
3
7/0
3
1/0
4
7/0
4
1/0
5
7/0
5
1/0
6
7/0
6
1/0
7
7/0
7
1/0
8
7/0
8
1/0
9
7/0
9
1/1
0
7/1
0
1/1
1
7/1
1
1/1
2
7/1
2
1/1
3
7/1
3
1/1
4
7/1
4
1/1
5
Expectations for own finances
Expectation, 21st century average
Source: Statistics Finland

BUSINESS ENVIRONMENT SLOWLY RECOVERING
Finland
• Decline of purchasing power will level off, but is not expected to improve significantly in the next few years
Skandinavia and the Baltic countries
• Steady economic growth is expected to continue
Belarus
• Consumers’ purchasing power is expected to strengthen, hyperinflation is expected to ease
19

20
OPPORTUNITIES AND RISKS IN RUSSIA
• The world’s richest country in terms of raw
material reserves
• Around 150 million consumers and 13
metropolitan cities
• As yet, political and economical risks are
greater than normal
• The economy has potential for strong growth
as soon as the political situation is normalised

21
RETAIL SALES IN RUSSIA, 2000-2014
Source: PMR Online
0
5000
10000
15000
20000
25000
30000
2000 2001 2002 2003 2004 2005 2006 2007 2008 2009 2010 2011 2012 2013 2014
Non-food products Food, beverages and tobacco
RUB, bn

22
PORTFOLIO STRATEGY

Grocery trade
• Finland
• Russia
• Kespro, horeca business
Building and home improvement trade
• Europe
Car trade
• Finland
• The Baltic countries, primarily Estonia
23
KESKO STRATEGIC GROWTH AREAS
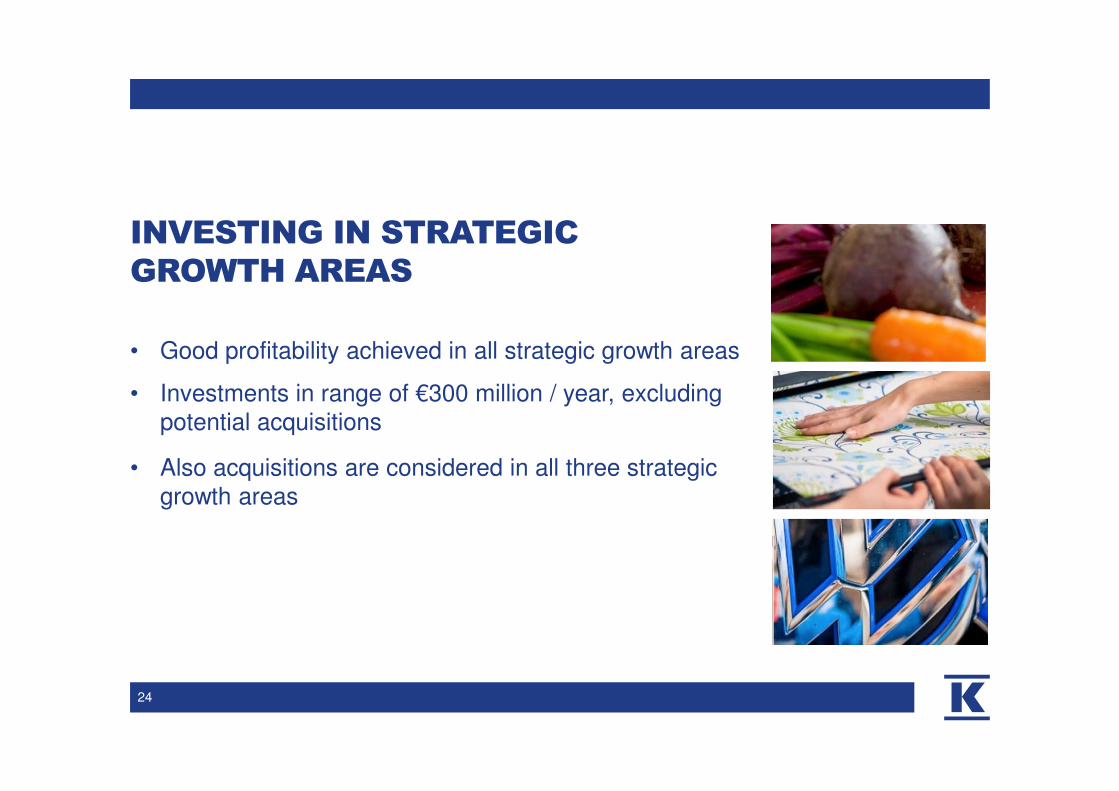
• Good profitability achieved in all strategic growth areas
• Investments in range of €300 million / year, excluding
potential acquisitions
• Also acquisitions are considered in all three strategic
growth areas
24
INVESTING IN STRATEGIC
GROWTH AREAS

KEY STRATEGIC OBJECTIVES
25
• Turning the market share in the Finnish grocery trade around
• Increasing the building and home improvement trade in Europe
• Strengthening the market leadership in the Finnish car trade
• The best omni-channel customer experience in the trading sector
• One unified Kesko, harvesting synergies

26
ALL BUSINESSES WILL BE DEVELOPED FURTHER
Shoe trade
• Finland
Sports trade
• Finland and Russia
Furniture trade
• Finland and Estonia
Agricultural trade
• Finland
Machinery trade
• Finland and the Baltic countries

MAXIMISING VALUE CREATION ALSO IN OTHER
BUSINESSES
• Important to have the best platform for Kesko’s small and medium sized businesses to succeed in tight competition
• All options which improve competitiveness of other businesses and retailer entrepreneurs are possible
27
REAL ESTATE ARRANGEMENT TO BE CLOSED
• Kesko has agreed to set up a joint real estate investment company with AMF
Pensionsförsäkring and Ilmarinen
• The combined fair value is €652 million and the properties owned by Kesko
Group companies account for €485 million
• Cash flow to Kesko will be around €405 million
• Closing expected to take place in June
28

29
GROCERY TRADE

KESKO GROCERY TRADE KEY FIGURES IN 2014
30
Kespro 17%
Grocery trade
Finland 81%
Grocery trade
Russia 2%Net sales €4,754m
Operating profit €223m
Operating margin 4.7%
ROCE 22.2%

KESKO – QUALITY LEADER IN GROCERY
• High market share of 33% in Finland
• New customer focused strategy clearly differentiates
Kesko in the market
• already improving market share development
• Steady and strong operating profit and cash flow
• Successful business concept in Russia
• Kesko is the most responsible food retailer in the world
31

STRATEGIC OBJECTIVES OF THE GROCERY
TRADE
• Turning the market share in the Finnish grocery trade around
• Further improving quality and service level
• Investments to improve the K-supermarket and K-market store network
• Customer focused renewal of the K-citymarket concept
• Improving price competitiveness and price image
• Offering leading digital services in grocery
• Developed retailer business model
32

STRATEGY FOR RUSSIA
• Increasing operations and improving profitability
in the St. Petersburg area
• Active in acquiring store sites
• K-ruoka is the best food store in the St. Petersburg area
• Identifying new growth possibilities in the Moscow area
and possibly in other metropolitan cities in Russia
33

34
INCREASING THE
HORECA BUSINESS
• Organic growth through strong international cooperation
• Differentiating the selection with private label products
• Supporting the service counter offering of the K-food stores
• Searching for expansion alternatives in Finland and the
neighbouring areas

35
BUILDING AND HOME
IMPROVEMENT TRADE
35

HOME IMPROVEMENT AND
SPECIALITY GOODS TRADE
2014
36
Sports trade€186m 6%
Shoe trade€20m 1%
Furniture trade€176m 6%
Agricultural trade€372m 12%
Others€20m 1%
Building and home improvement tradeBelarus €125m 4%
Building and home improvement tradeRussia €250m 8%
Building and homeimprovement tradeFinland€785m 26%
Building and homeimprovement tradeScandinavia €625m 21%Building and home improvement trade
Baltics €443m 15%
Net sales €3,000m
Operating profit €63m
Operating
margin2.1%
ROCE 7.9%

PROFITABLE GROWTH IN BUILDING AND HOME
IMPROVEMENT TRADE
• Market share in Finland over 40%
• Market #1 or #2 in Finland, Norway,
Estonia, Latvia, Lithuania and
Belarus
• Eight consecutive quarters of
improving profitability
• Strong position in B-2-B trade –
#1 in Finland, Norway and Estonia
37
0
10
20
30
40
50
60
70
2012 2013 2014
Operating profit, € million

38
300 STORES IN EIGHT
COUNTRIESFinland€1,190m138 stores
Sweden€197m
20 stores
Norway€671m
82 stores
Russia€250m
13 stores
Belarus€125m
11 stores
Lithuania€317m
19 stores
Latvia€53m
8 stores
Estonia78 M€
8 stores
TOTAL RETAIL SALES
€2,881m

STRATEGIC OBJECTIVES OF THE BUILDING AND
HOME IMPROVEMENT TRADE
39
• Kesko #5 in Europe – strong potential for further growth organically or
through acquisitions
• Providing excellent services from the same store network to the three
different customer segments
• A common core for all countries to ensure efficient operations
• Offering the best omni-channel digital services

40
CAR TRADE

CAR AND MACHINERY
TRADE 2014
41
Konekesko
Baltics €96m 9%
VV-Auto
€756m 75%
Konekesko
Finland €161m 16%Net sales €1,011m
Operating profit €30m
Operating margin 2.9%
ROCE 18.3%
THE CAR TRADE IS ONE OF KESKO’S THREE
STRATEGIC GROWTH AREAS
• VV-Auto’s market share in the Finnish passenger car and van trade
has risen from 15% to 21% within ten years
• Throughout recent years, Volkswagen has been the best selling car
brand in Finland and Audi has been number one in its competitive
segment
• VV-Auto’s retail net sales have quadrupled within ten years from 100
million to 400 million
• VV-Auto’s profitability has remained at a good level despite the
difficult market situation
4242

Volkswagen 12.3%
Toyota 11.9%
Skoda 9.2%
Volvo 7.3%
Ford 7.0%
Nissan 6.1%
Audi 6.0%
Kia 5.7%
Seat 1.7%
Others 32.8%
PASSENGER CAR MARKET IN FINLAND
43
• Average CO2 emissions of passengercars in 2014: 128 g/km
• Diesel cars 40%, petrol cars 60%
• Only 200 electric cars
• Golf segment 50% of total market
• Increasing segment, SUV 20%of total market
• Average age of registered carsin Finland 13.5 years
Market Share in 2014
Source: TraFi (Finnish Transport Safety Agency)

44
STRATEGIC OBJECTIVES OF THE CAR TRADE
• Co-operation with Volkswagen AG: Volkswagen aims to be the biggest car
manufacturer by 2018. Volkswagen is the biggest R&D investor in the world
• VV-Auto will focus on Volkswagen Group's car brands
• Sales growth and growing market share in Finland and in the Baltics
• Increasing retail sales by investing in new sales and service channels
• Developing customer loyalty with new finance and service models
• The best omnichannel customer experience in car trade

45

BASIC INFORMATION
46
• Established in 1940
• Listed on the Helsinki Stock Exchange (Nasdaq Helsinki) in 1960
• 40,000 shareholders
– 27% of all shares owned by non-Finnish
– 39% of B-shares owned by non-Finnish
• Market capitalisation €3.8 billion (March 31, 2015)
• Share series: A and B – voting rights 10:1
Number of shares
A shares31.7%
B shares68.3%
Voting rights
B shares
18%A shares
82%

SHAREHOLDERS
47
The largest registered shareholders
At 4/2015 by number of shares
%
1 K-retailers´ Association 3,770,339 3.77
2 Vähittäiskaupan Takaus Oy 3,491,771 3.49
3 Kruunuvuoren Satama Oy 3,438,885 3.44
4Ilmarinen Mutual Pension Insurance Company
2,110,632 2.11
5 Valluga-sijoitus Oy 1,340,439 1.34
6Varma Mutual Pension Insurance Company
1,130,986 1.13
7Foundation for Vocational Training in the Retail Trade
1,073,373 1.07
8 Elo Pension Company 1,056,968 1.06
9 Oy The English Tearoom Ab 1,000,000 1.00
10 Kesko Oyj 876,054 0.88

REAL ESTATE IN 2014
48
Owned properties
CountryArea,
1,000 m2
Finland 770
Other Nordic countries 117
Baltic countries and Belarus 113
Russia 164
Total
Carrying amount
1,164
€1,430 M
Leased properties total
1,000 m2 2,958
Classification
Strategic properties 53%
Standard properties 43%
Development properties 4%
Realisation properties 0%

THE WORLD’S MOST
SUSTAINABLE
RETAIL OPERATOR
49

KESKO IS THE MOST RESPONSIBLE FOOD AND
STAPLES RETAILER IN THE WORLD
50
In ’The Global 100 Most Sustainable Corporations in the World’ list since 2005
In the Sustainability Yearbook 2015, Kesko was classified into the bronze class
in the Food & Drug Retailers sector
Included in the Dow Jones sustainability indexes DJSI World and DJSI Europe
since 2003
Included in the FTSE4Good index focusing on responsible investment since
2009
At the top of the Nordic Carbon Disclosure Leadership climate index in 2011-
2014

OPERATING MARGIN EXCL. NON-RECURRING ITEMS
BY DIVISION
5/2015
51
1-3/2014
4-6/2014
7-9/2014
10-12/2014
1-3/2015
Grocery 4.1 4.6 5.1 4.9 3.2
Home improvement and speciality goods
-4.1 0.6 2.1 0.9 -1.6
Car and machinery 3.0 3.8 3.6 0.8 2.7
Total 0.9 2.9 3.6 2.7 1.3

KEY EVENTS 1-3/2015
52
• Sales of the grocery trade increased slightly
and profitability remained at a good level
• Profitability improved markedly in the home improvement and speciality
goods trade, sales increased in local currencies and market share grew
especially in Finland
• Divestment of Anttila will significantly improve Kesko’s profitability, but
did not yet have a material impact
on the Q1 profit
• In the car trade, profitability remained at a good level
• Kesko’s financial position is very strong

PROFIT FOR 1-3/2015
53
1-3/2015 1-3/2014
Net sales, €m 2,082 2,129
Change in net sales, % -2.2 -1.4
Operating profit excl. non-recurring items, €m 27 19
Operating margin excl. non-recurring items, % 1.3 0.9
Non-recurring items, €m -130 -32
Operating profit, €m -104 -13
Net financial items, €m 0 -2
Income tax, €m -7 3
Net profit for the period, €m -111 -12
Net profit for the period excl. non-recurring items, €m 17 14

NET SALES FOR 1-3/2015
54
€1,103m€722m
€261m
Grocery trade
Home
improvement
and speciality
goods trade
Car and machinery
trade
53%35%
13%

NET SALES FOR 1-3/2015
55
1,000
1,500
2,500
2,000
500
0
Q1/2015
2,082
Q1/2014
2,129
€m
-2.2%

OPERATING PROFIT FOR 1-3/2015EXCL. NON-RECURRING ITEMS
56
0
10
20
30
Q1/2015
26.5
Q1/2014
19.1
€m

57
FINANCIAL POSITION
1-3/2015 1-3/2014
Equity ratio, % 51.5 53.2
Liquid assets, €m 506 532
Capital expenditure, €m 52 43
Interest-bearing net liabilities, €m 41 25
Inventories, €m 764 840
Return on capital employed*, % 10.2 9.9
* excl. non-recurring items, rolling 12 mo

GROCERY TRADE
58
800
600
1,200
1,000
400
200
0
Q1/2015
1,103
Q1/2014
1,102
0
20
40
60
Q1/2015
34.9
Q1/2014
45.4
Net salesOperating profit excl.
non-recurring items€m €m

GROCERY TRADE
59
• K-food stores have lowered the prices of some 650 products – nevertheless,
the sales of the grocery trade division increased slightly and its profitability
remained at a good level
• In a consumer survey, the perception of the K-Group as Finland’s best food
expert increased significantly in the first quarter – consumers are interested in
both price and quality
• Kespro’s market share grew and profitability remained
at a good level
• In Russia, net sales were up 24% in the local currency

HOME IMPROVEMENT AND SPECIALITY GOODS
TRADE
60
722761
0
200
400
600
800
Q1/2015Q1/2014
-40
-20
0
20
Q1/2015
-11.4
Q1/2014
-31.4
Net salesOperating profit excl.
non-recurring items€m €m

HOME IMPROVEMENT AND SPECIALITY GOODS
TRADE
61
• Market position of K-rauta and Rautia strengthened in Finland and
market share is already in excess of 40%
• In Sweden, the profitability of the home improvement trade continued to
improve
• In Russia, the sales of the home improvement trade were up 17% in
roubles and operating profit improved markedly
• The divestment of Anttila will significantly improve Kesko’s profitability,
but it did not yet have a material impact on the Q1 profit

62
261272
0
100
200
300
Q1/2015Q1/2014
0
5
10
7.0
Q1/2015Q1/2014
8.2
Net sales Operating profit excl.
non-recurring items€m €m
CAR AND MACHINERY TRADE

CAR AND MACHINERY TRADE
63
• Profitability of the car trade remained at a good level
• Market share of the car trade 18.8%
• Volkswagen the most registered car brand in Finland
• The Car of the Year, VW Passat, is selling excellently
• Audi continues as number one in its competition group

64
FUTURE OUTLOOK
Estimates of the future outlook for Kesko Group's net sales and operating profit excluding non-recurring items are given for the 12 months following the reporting period (4/2015-3/2016) in comparison with the 12 months preceding the reporting period (4/2014-3/2015).
The general economic situation and the expected trend in consumer demand vary in Kesko’s different operating countries. In Finland, demand in the trading sector is expected to be weak also in the current year and the tight competitive situation in the grocery trade and the speciality goods trade is expected to continue. In Sweden, Norway and the Baltic countries, the growth in demand in the trading sector is expected to continue. In Russia, the economic situation and consumers’ purchasing power will weaken.
Kesko Group's net sales for the next 12 months are expected to be lower than the level of the preceding 12 months and the operating profit excluding non-recurring items for the next 12 months is expected to exceed the level of the preceding 12 months