Presentation of Q2 2015 results Teleconference 12 August · PDF filePresentation of Q2 2015...
12
Presentation of Q2 2015 results Teleconference 12 August 2015
Transcript of Presentation of Q2 2015 results Teleconference 12 August · PDF filePresentation of Q2 2015...

Presentation of Q2 2015 results
Teleconference
12 August 2015

2
Safe Harbor Statement
Matters discussed in this presentation may constitute forward-looking statements.
Such statements reflect TORM's current expectations and are subject to certain risks and uncertainties that could negatively impact
TORM's business.
To understand these risks and uncertainties, please read TORM's announcements to NASDAQ OMX Copenhagen.
The presentation may include statements and illustrations concerning risks, plans, objectives, goals, strategies, future events or
performance, and underlying assumptions and other statements, which are other than statements of historical facts. The forward-looking
statements in this presentation are based upon various assumptions, many of which are based, in turn, upon further assumptions,
including without limitation, TORM's examination of historical operating trends, data contained in our records and other data available from
third parties. As many of these factors are subject to significant uncertainties and contingencies which are difficult or impossible to predict
and are beyond our control, TORM makes no warranties or representations about accuracy, sequence, timeliness or completeness of the
content of this presentation.

3
Agenda
• TORM stand-alone H1 2015
• TORM post restructuring

4
Highlights for Q2 2015
Q2 2015
Results
Tanker
Bulk
Guidance
• The product tanker market continued to benefit from high refinery margins that supported
the demand for transportation of refined products
• TORM’s largest segment, MRs, achieved spot rates of USD/day 22,746 in Q2, which is
up by 73% year-on-year
• The Tanker segment reported a gross profit of USD 56m in Q2 (USD 26m)
• Freight rates remained under pressure in Q2 2015
• Q2 2015 gross profit of USD -1m (USD 1m)
Highlights
Finance
Tanker market Dry bulk market
Restructuring
process
• The new Restructuring Agreement was implemented on 13 July 2013 giving TORM
strategic and financial flexibility
• EBITDA for the second quarter of 2015 was USD 47m (Q2 2014: USD 14m)
• The result before tax for the second quarter of 2015 was USD 0m (USD -24m) after non-
recurring advisor costs of USD 10m
• Cash flow from operating activities was positive with USD 54m in the second quarter of
2015 (USD 15m)
• For the full year 2015, the combined group upward adjusts the expectations to;
‒ EBITDA in the range of USD 190-230m
‒ Profit before tax in the range of USD 115-155m

5
Product tanker freight rates continued at strong levels Highlights Tanker market Dry bulk market
East (Q2 2015)
• The LR market benefitted from the ramp-
up of refinery capacity in Saudi and UAE
• The Far East exported large volumes of
gasoil to West Africa and north-western
Europe
• Strong freight rates for trading of dirty oil
led LR2s to switch into the dirty market.
West (Q2 2015)
• Freight rates driven by high European
refinery margins yielding export volumes
to West Africa
• Considerable European export of
gasoline to the US East Coast due to US
demand and capacity restrictions
• The refineries in the Mexican Gulf area
had high export to South and Latin
America.
Source: Clarksons. Spot earnings: LR2: TC1 (Ras Tanura-> Chiba), LR1: TC5 (Ras Tanura-> Chiba) and MR: average basket of Rotterdam->NY, Bombay->Chiba, Mina
Al Ahmadi->Rotterdam, Amsterdam->Lome, Houston->Rio de Janeiro, Singapore->Sidney.
Freight rates in ‘000 USD/day

6
Agenda
• TORM stand-alone H1 2015
• TORM post restructuring

7
The Restructuring was implemented in three steps
Debt above net asset
value of TORM’s assets
written down against
warrants of 7.5% of
TORM
Part of TORM’s debt
following the write-
down was converted
to new equity
Oaktree contributed 31
product tanker vessels
(incl. six newbuildings)
with attached debt
against a majority
shareholding
No. of owned
vessels:
Debt write-down Debt-to-equity
conversion
Oaktree vessel
contribution TORM prior to the
Restructuring
NAV (USDbn):
45
-0.5
45
~0
45
~0.3
76
~0.9
1 2 3

8
The Restructuring has created a leading product tanker
company with 27,500 earning days on an annual basis TORM fleet size
8
42
117
68
6
6
4
MR LR1 LR2 Handy Total Product
Tanker
10
50
2
78
2
2
3
Dry bulk
1
Owned
Charter-in
Newbuilding
3,500 2,500 17,500 4,000 27,500 750 Annual earning
days (app.)

9
TORM has a strong capital structure after the Restructuring
Notes:
• Value of Oaktree contributed vessels isfrom 27 March 2015 and the value of TORM contributed vessel is from 30 June 2015
• TORM and Oaktree non-vessel NAV are assessed as per 28 February 2015
• TORM contributed debt, Oaktree contributed debt and capex comittment are assesed as of 13 July 2015
INDICATIVE FIGURES
- COMPILED FROM VARIOUS PUBLIC SOURCES
TORM
vessels
0.6
0.9
0.1
0.1
0.7
0.1 1.7
0.8
0.1
Capex
commitment
Total
liabilities
Total assets Oaktree
non-vessel
NAV
Oaktree
vessels
TORM non-
vessel NAV
TORM debt Oaktree
debt
Value generation in the
period from March 2015
In USDbn

10
Forecasted EBITDA for the combined company in the range of USD 190m
– USD 230m for FY2015
Earnings sensitivity
(full-year from 13 July
2015)
EBITDA (USDm)
Change in freight rates (USD/day)
Segment -2,000 -1,000 1,000 2,000
Tankers (USDm) -22 -11 11 22
Bulk (USDm) -1 -1 1 1
Total (USDm) -23 -12 12 23
EPS per 1,500 shares
(USD) -0.4 -0.2 0.2 0.4
Note:
• The financial results for 2015 will reflect Oaktree activities in the period from January 2015 until completion of TORM’s Restructuring (13 July 2015) and the combined entity from completion of
TORM’s Restructuring until 31 December 2015
• In order to annualize earnings for the EPS a multiplier of 2.129 should be applied
Profit before tax
(USDm)
EPS (USD)
EPS per 1,500 shares
(USD)
1 January – 13 July
(Oaktree)
14 July – 31 December
(TORM and Oaktree)
Full-year
(Combined)
50 - 55 140 - 180 190 - 230
30 - 35 85 - 125 115 - 155
0.0008 – 0.0013
1.3 – 1.9
Calculated based on earnings
in the period from 13 July 2015
– 31 December 2015.
11
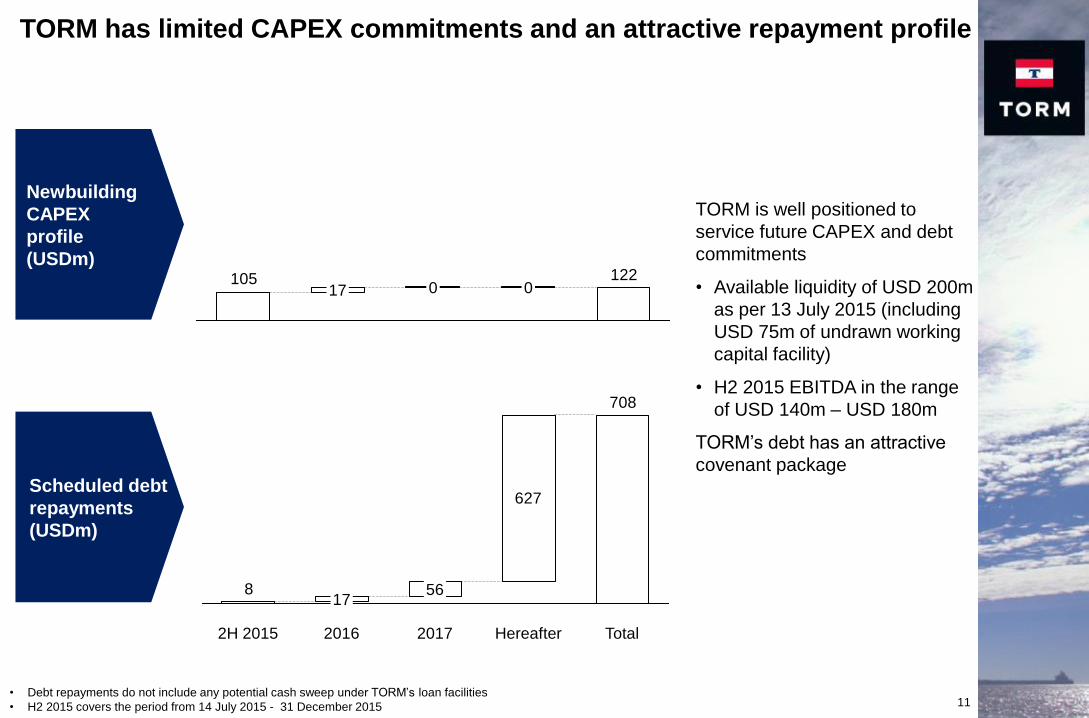
TORM has limited CAPEX commitments and an attractive repayment profile
1221050 17 0
627
708
8
Total Hereafter 2017
56
2016
17
2H 2015
TORM is well positioned to
service future CAPEX and debt
commitments
• Available liquidity of USD 200m
as per 13 July 2015 (including
USD 75m of undrawn working
capital facility)
• H2 2015 EBITDA in the range
of USD 140m – USD 180m
TORM’s debt has an attractive
covenant package
Newbuilding
CAPEX
profile
(USDm)
Scheduled debt
repayments
(USDm)
• Debt repayments do not include any potential cash sweep under TORM’s loan facilities
• H2 2015 covers the period from 14 July 2015 - 31 December 2015


![Announces Q2 results, Results Press Release & Auditors Report for June 30, 2015 [Result]](https://static.fdocuments.us/doc/165x107/577cb2af1a28aba7118c24df/announces-q2-results-results-press-release-auditors-report-for-june-30.jpg)