Daqo New Energy Corp. Q2 2015 Financial Results Presentation2015+Presentation.pdf · Q2 2015...
19
Daqo New Energy Corp. Q2 2015 Financial Results Presentation August 11, 2015
Transcript of Daqo New Energy Corp. Q2 2015 Financial Results Presentation2015+Presentation.pdf · Q2 2015...

Daqo New Energy Corp. Q2 2015 Financial Results Presentation August 11, 2015
PRIVATE & CONFIDENTIAL P. 2
This announcement contains forward-looking statements. These statements are made under the “safe harbor” provisions of the U.S. Private Securities Litigation Reform Act of 1995. These forward-looking statements can be identified by terminology such as “will”, “expects”, “anticipates”, “future”, “intends”, “plans”, “believes”, “estimates” and similar statements. The Company may also make written or oral for-ward-looking statements in its reports filed or furnished to the U.S. Securities and Exchange Commission, in its annual reports to shareholders, in press releases and other written materials and in oral statements made by its officers, directors or employees to third parties. Statements that are not historical facts, including statements about the Company’s beliefs and expectations, are forward-looking statements. Forward-looking statements involve inherent risks and uncertainties. A number of factors could cause actual results to differ materially from those contained in any forward-looking statement, including but not limited to the following: the demand for photovoltaic products and the development of photovoltaic technologies; global supply and demand for polysilicon; alternative technologies in cell manufacturing; our ability to significantly expand our polysilicon production capacity and output; the reduction in or elimination of government subsidies and economic incentives for solar energy applications; and our ability to lower our production cost. Further information regarding these and other risks is included in the reports or documents we have filed with, or furnished to, the Securities and Exchange Commission. Daqo New Energy does not undertake any obligation to update any forward-looking statement, except as required under applicable law. All information provided in this press release and in the attachments is as of the date of this press release, and Daqo New Energy undertakes no duty to update such information, except as required under applicable law.
Safe Harbor Statement
PRIVATE & CONFIDENTIAL P. 3
Business Highlights and Summary Financial Results and Update
Q&A
Agenda

PRIVATE & CONFIDENTIAL P. 4
Polysilicon production volume of 1,734 MT in Q2 2015, compared to 1,801 MT in Q1 2015; Polysilicon production volume in Q2 was impacted by the planned shutdown related to our annual facility maintenance in May 2015
Cost Structure
total production of $12.98/kg in Q2 2015, compared to $12.80/kg in Q1 2015;
cash cost of $10.60/kg in Q2 2015, compared to $10.53/kg in Q1 2015;The sequentially higher cost was due to lower production volume as a result of the planned shutdown related to our annual facility maintenance in May 2015
Polysilicon sales volume (3) of 1,363 MT in Q2 2015, compared to 1,502 MT in Q1 2015
Wafer sales volume (3) of 18.3 million pieces in Q2 2015, compared to18.1 million pieces in Q1 2015
Polysilicon ASP was $15.95/kg in Q2 2015, compared to $18.09/kg in Q1 2015
EBITDA (1) of $8.4 million (EBITDA margin: 24.6%) in Q2 2015, compared to $11.4 million (EBITDA margin: 27.3%) in Q1 2015
Non-GAAP gross margin (2) of 19.6% in Q2 2015 compared to 28.0% in Q1 2015
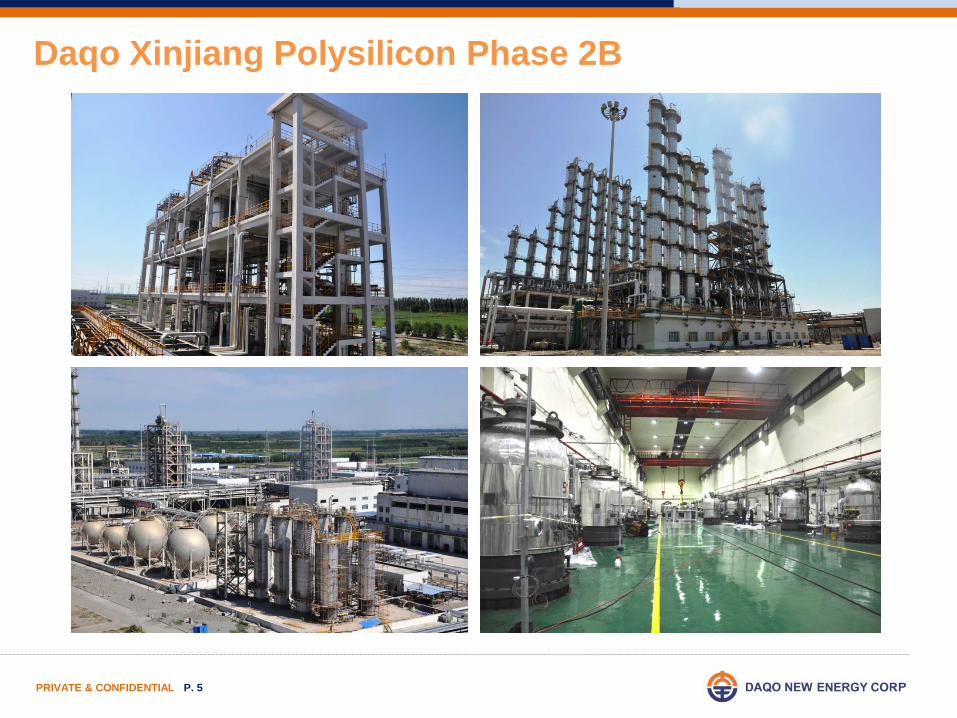
Xinjiang Phase 2B project update: Started pilot production in the end of June and expect to fully ramp up the capacities by the end of August 2015.
Xinjiang Phase 3A project: Officially launched the initial works after board approval. Expect to complete construction and installation by the end of 2016 and fully ramp up the capacity by the end of Q2 2017.
Note: (1) A non-GAAP measure which represents earnings before interest, taxes, depreciation and amortization (2) Non-GAAP margin excluded costs of $3.3 million related to polysilicon operations in Chongqing which halted production in September 2012 (3) Starting from the second quarter of 2015, the Company will report sales volumes of polysilicon and wafer, respectively, instead of shipment. The sales volume is the quantity of
the goods which has been accepted by customers and thus the corresponding revenue has been recognized during the reporting period.
Business update and Q2 2015 highlights
PRIVATE & CONFIDENTIAL P. 5
Daqo Xinjiang Polysilicon Phase 2B
PRIVATE & CONFIDENTIAL P. 6
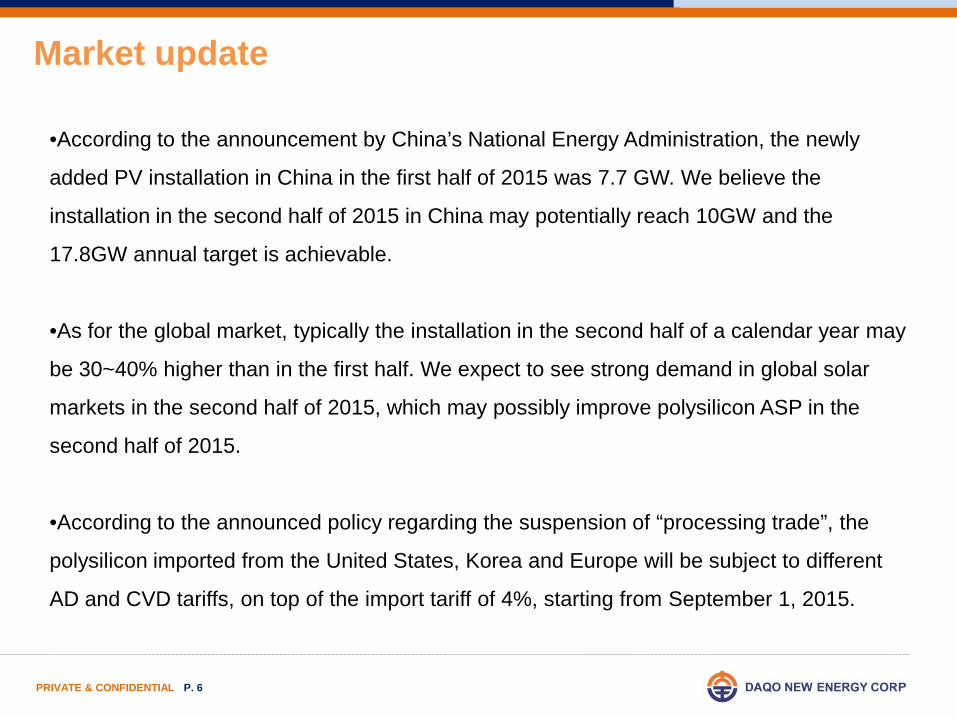
Market update
•According to the announcement by China’s National Energy Administration, the newly
added PV installation in China in the first half of 2015 was 7.7 GW. We believe the
installation in the second half of 2015 in China may potentially reach 10GW and the
17.8GW annual target is achievable.
•As for the global market, typically the installation in the second half of a calendar year may
be 30~40% higher than in the first half. We expect to see strong demand in global solar
markets in the second half of 2015, which may possibly improve polysilicon ASP in the
second half of 2015.
•According to the announced policy regarding the suspension of “processing trade”, the
polysilicon imported from the United States, Korea and Europe will be subject to different
AD and CVD tariffs, on top of the import tariff of 4%, starting from September 1, 2015.

PRIVATE & CONFIDENTIAL P. 7
Polysilicon spot market price ($/kg) Wafer ASP ($ / piece)
$16.78 $16.94 $17.45 $17.87
$21.37 $21.61 $20.83 $20.35
$18.71
$16.05
Q1 2013
Q2 Q3 Q4 Q1 2014
Q2 Q3 Q4 Q1 2015
Q2
$0.82
$0.84 $0.85 $0.84
$0.94
$0.90
$0.85
$0.88
$0.85
$0.81
Q1 2013
Q2 Q3 Q4 Q1 2014
Q2 Q3 Q4 Q1 2015
Q2
Market price trend ( by PVinsights)

PRIVATE & CONFIDENTIAL P. 8
1,734 MT production
1,363 MT sold to external customers
Solar Grade I: 99.5% in Q2 2015
Q2 2015 total production cost : $12.98 / kg
Q2 2015 cash cost: $10.60 / kg
5,000 6,150
12,150
18,000
25,000
Q1 2013 Q1 2014 Q3 2015E Q2 2017E Medium term
Phase 2A (Xinjiang)
Phase 2B (Xinjiang)
Phase 2A capacity enhancement
(Xinjiang)
Phase 3A (Xinjiang)
Phase 3B * * (Xinjiang)
Polysilicon historical and projected capacity * (MT)
Expected sales volume in Q3 2015: 2,100 ~ 2,200 MT
Xinjiang Phase 2B project update:
‒ Started pilot production in the end of June
‒ Expect to fully ramp up by the end of August
‒ Total production cost is expected to be reduce to a level
below $12.00/kg when fully ramped
Fully ramped up production date
Xinjiang polysilicon facilities update
*Wanzhou polysilicon facility discontinued polysilicon production in Q4 2012 **Anticipated total capacity: we may consider to further increase the polysilicon production capacity at our Xinjiang
site to 25,000 MT, subject to market and industry conditions.
Q2 2015 key facts Outlook

PRIVATE & CONFIDENTIAL P. 9
1,088 962
1,311 1,445
1,517 1,504
1,748 1,791 1,801
1,734
Q1 2013
Q2 Q3 Q4 Q1 2014
Q2 Q3 Q4 Q1 2015
Q2
15.83
12.21 11.82 11.98 11.75 11.48 10.72 10.88 10.53 10.60
4.76
5.43 4.16 3.77
2.74 2.65 2.33 2.35 2.27 2.38
Q1 Q2 Q3 Q4 Q1 Q2 Q3 Q4 Q1 Q2
Cash cost Depreciation
Polysilicon manufacturing overview
* The cost structures, SG&A and interest expenses only refer to the polysilicon production in Xinjiang facilities.
Production Volume (MT) Production cost, SG&A, interest ($/kg)*
2013 2014 2015
PRIVATE & CONFIDENTIAL P. 10
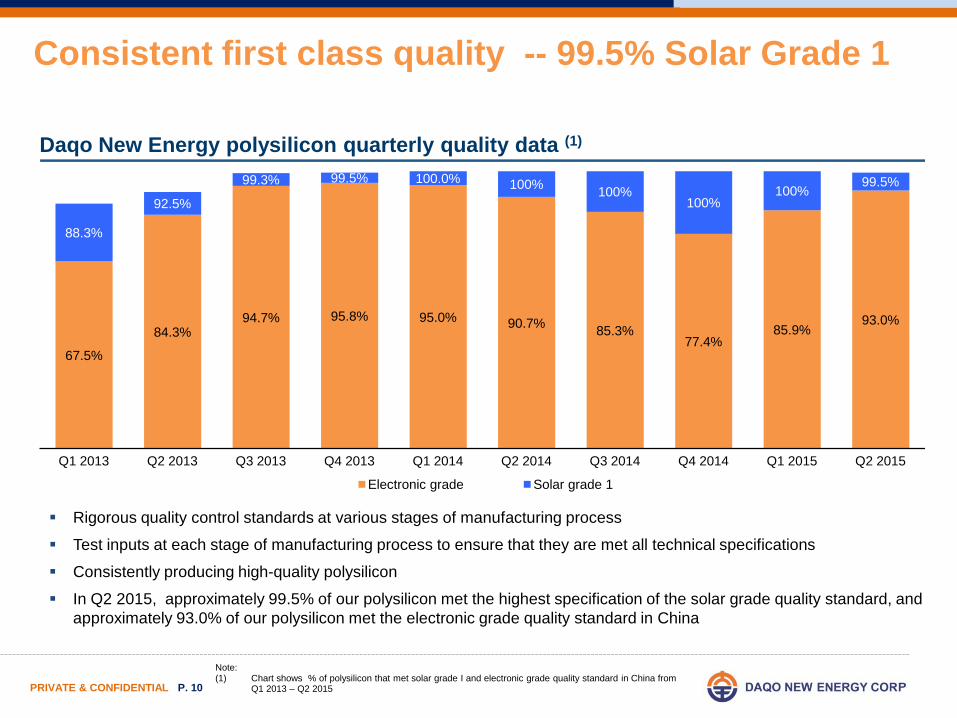
Rigorous quality control standards at various stages of manufacturing process
Test inputs at each stage of manufacturing process to ensure that they are met all technical specifications
Consistently producing high-quality polysilicon
In Q2 2015, approximately 99.5% of our polysilicon met the highest specification of the solar grade quality standard, and approximately 93.0% of our polysilicon met the electronic grade quality standard in China
67.5%
84.3% 94.7% 95.8% 95.0% 90.7% 85.3%
77.4% 85.9%
93.0%
88.3%
92.5%
99.3% 99.5% 100.0% 100% 100% 100%
100% 99.5%
Q1 2013 Q2 2013 Q3 2013 Q4 2013 Q1 2014 Q2 2014 Q3 2014 Q4 2014 Q1 2015 Q2 2015
Electronic grade Solar grade 1
Consistent first class quality -- 99.5% Solar Grade 1
Note: (1) Chart shows % of polysilicon that met solar grade I and electronic grade quality standard in China from
Q1 2013 – Q2 2015
Daqo New Energy polysilicon quarterly quality data (1)

PRIVATE & CONFIDENTIAL P. 11
Wanzhou wafer facilities update
Annual capacity of approximately
72 million pieces (310 MW)
18.3 million pieces sold to customers
Q3 2015 wafer sales volume expected to
be 17.5 ~18.0 million pieces
Q2 2015 key facts Q3 sales volume outlook
PRIVATE & CONFIDENTIAL P. 12
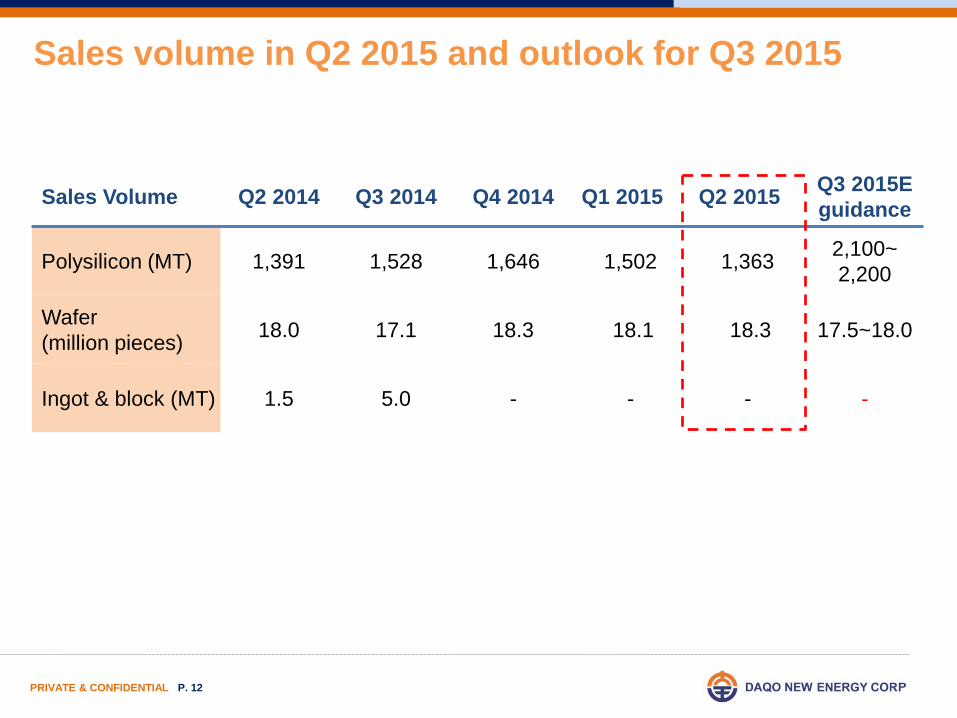
Sales Volume Q2 2014 Q3 2014 Q4 2014 Q1 2015 Q2 2015 Q3 2015E guidance
Polysilicon (MT) 1,391 1,528 1,646 1,502 1,363 2,100~ 2,200
Wafer (million pieces) 18.0 17.1 18.3 18.1 18.3 17.5~18.0
Ingot & block (MT) 1.5 5.0 - - - -
Sales volume in Q2 2015 and outlook for Q3 2015

PRIVATE & CONFIDENTIAL P. 13
Business Highlights and Summary
Financial Results and Update Q&A
Agenda

PRIVATE & CONFIDENTIAL P. 14
Q2 2015 financial highlights
Note: (1) Non-GAAP margin excluded costs related to polysilicon operations in Chongqing which halted production
in September 2012 (2) A non-GAAP measure which represents earnings before interest, taxes, depreciation and amortization
Revenues were $34.3 million, compared to $41.9 million in Q1 2015;
Polysilicon production cost of $12.98/kg in Q2 2015, compared to $12.80/kg in Q1 2015; cash cost of $10.60/kg in Q2 2015, compared to $10.53/kg in Q1 2015;
Gross profit was $3.6 million, compared to $8.5 million in Q1 2015;
Non-GAAP gross margin (1) was 19.6%, compared to 28.0% in Q1 2015;
Operating income was $1.2 million, compared to $4.1 million in Q1 2015;
EBITDA (2) was $8.4 million, compared to $11.4 million in Q1 2015;
Net loss attributable to Daqo New Energy shareholders was $0.9 million, compared to net income attributable to Daqo New Energy shareholders of $1.2 million in Q1 2015;
Loss per ADS (basic) were $0.09, compared to earnings per ADS of $0.12 in Q1 2015.

PRIVATE & CONFIDENTIAL P. 15
US$ in millions Q2 2015 Q1 2015 Change Analysis
Revenues 34.3 41.9 (7.6) Polysilicon: Sales↓ , ASP↓ Wafer: OEM↑, ASP↓
Cost of revenues (30.7) (33.4) (2.7)
Polysilicon unit production cost slightly increased due to annual maintenance; Wafer unit processing cost slightly decreased due to improved manufacturing efficiency
Gross profit (loss) 3.6 8.5 (4.9)
Gross margin 10.5% 20.2% (9.7%)
Non-GAAP Gross margin (1) 19.6% 28.0% (8.4%)
SG&A and R&D expense (3.0) (4.6) (1.6)
Other operating income 0.7 0.3 0.4
Operating income (loss) 1.2 4.1 (2.9)
Net interest expense (2.5) (3.2) 0.7
Net loss / income attributable to Daqo New Energy shareholders (0.9) 1.2 (2.1)
Basic loss / earnings per ADS (US$) (0.09) 0.12 (0.21)
EBITDA (2) 8.4 11.4 (3)
EBITDA margin (2) 24.6% 27.3% (2.7%)
P&L summary (Q2 2015 vs. Q1 2015)
Note: (1) Non-GAAP margin excluded costs related to polysilicon operations in Chongqing which halted production
in September 2012 (2) A non-GAAP measure which represents earnings before interest, taxes, depreciation and amortization
PRIVATE & CONFIDENTIAL P. 16
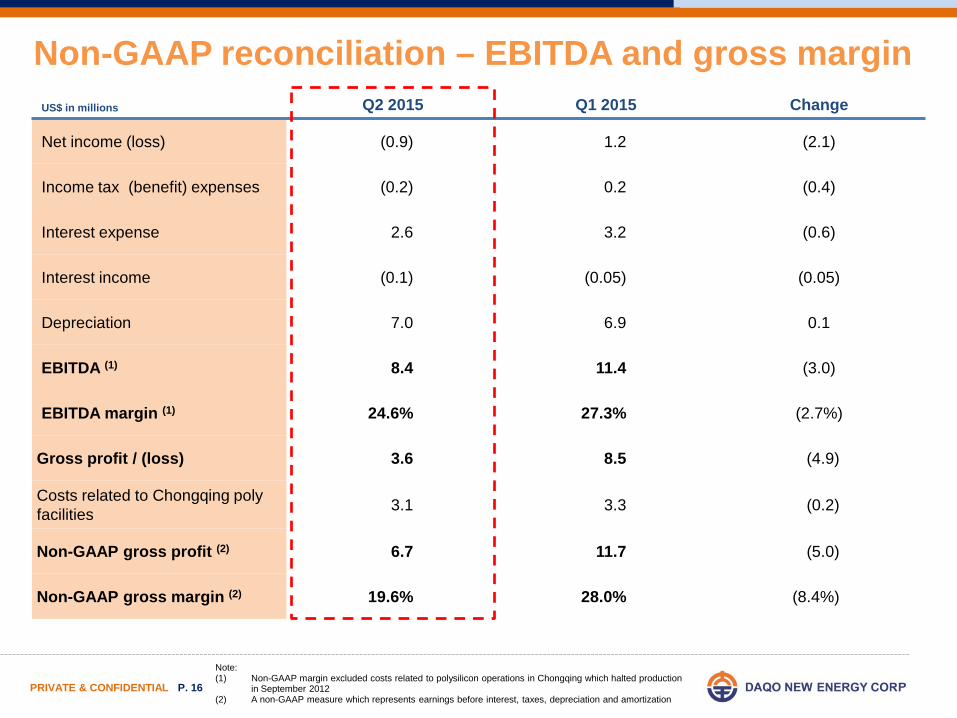
US$ in millions Q2 2015 Q1 2015 Change
Net income (loss) (0.9) 1.2 (2.1)
Income tax (benefit) expenses (0.2) 0.2 (0.4)
Interest expense 2.6 3.2 (0.6)
Interest income (0.1) (0.05) (0.05)
Depreciation 7.0 6.9 0.1
EBITDA (1) 8.4 11.4 (3.0)
EBITDA margin (1) 24.6% 27.3% (2.7%)
Gross profit / (loss) 3.6 8.5 (4.9)
Costs related to Chongqing poly facilities 3.1 3.3 (0.2)
Non-GAAP gross profit (2) 6.7 11.7 (5.0)
Non-GAAP gross margin (2) 19.6% 28.0% (8.4%)
Note: (1) Non-GAAP margin excluded costs related to polysilicon operations in Chongqing which halted production
in September 2012 (2) A non-GAAP measure which represents earnings before interest, taxes, depreciation and amortization
Non-GAAP reconciliation – EBITDA and gross margin

PRIVATE & CONFIDENTIAL P. 17
US$ in millions
6/30/2015
3/31/2015
Change (Q2 2015 vs.
Q1 2015)
6/30/2014
Cash and restricted Cash 95.1 32.2 62.9 77.7
Accounts receivable 7.0 8.8 (1.8) 6.8
Notes receivable 38.3 48.4 (10.1) 33.6
Inventories 10.5 9.4 1.1 12.1
Prepaid land use rights 28.7 28.9 (0.2) 29.3
Net PP&E 569.1 559.6 9.5 480.7
Total assets 778.1 716.9 61.2 668.8
Short-term Borrowings 166.0 148.0 18.0 141.3
Notes payable 42.4 34.9 7.5 24.1
Amount due to related party 108.9 95.7 13.2 86.5
Long-term Borrowings 100.0 74.2 25.8 112.1
Total liabilities 540.6 478.9 61.7 471.6
Total equity 237.6 238.0 (0.4) 197.2
Total liabilities and equity 778.2 716.9 61.3 668.8
Balance sheet summary

PRIVATE & CONFIDENTIAL P. 18
US$ in millions
6 months ended Jun 30, 2015
6 months ended Jun 30, 2014
Net cash provided by operating activities 32.1 29.1
Net cash (used in) investing activities (56.2) (30.9)
Net cash provided by financing activities 75.7 52.8
Effect of exchange rate changes 0.006 0.5
Net increase in cash and cash equivalents 51.6 51.4
Cash and cash equivalents at the beginning of the period 7.1 7.8
Cash and cash equivalents at the end of the period 58.6 59.3
Cash flow summary
As of June. 30, 2015, the company recorded capital expenditure of $103.9 million on XJ Phase 2B, of which $13.4 million was incurred in Q2 2015.

PRIVATE & CONFIDENTIAL P. 19
Business Highlights and Summary
Financial Results and Update Q&A
Agenda


![Announces Q2 results [Result]](https://static.fdocuments.us/doc/165x107/577ca7391a28abea748c4b21/announces-q2-results-result.jpg)