Q2-2015 Results
31
SECOND QUARTER 2015 RESULTS JULY 30, 2015
-
Upload
agnico-eagle-mines -
Category
Documents
-
view
895 -
download
0
Transcript of Q2-2015 Results
SECOND QUARTER 2015 RESULTS
JULY 30, 2015
AGNICO EAGLE | SECOND QUARTER 2015 RESULTS | 2
Forward Looking Statements
The information in this presentation has been prepared as at July 30, 2015. Certain statements contained in this document constitute “forward-looking statements” within the meaning of the United States Private Securities Litigation Reform Act of 1995 and “forward-looking information” under the provisions of Canadian provincial securities laws and are referred to herein as “forward-looking statements”. When used in this document, the words “anticipate”, “expect”, “estimate”, “forecast”, “will”, “planned” and similar expressions are intended to identify forward-looking statements. Such statements include without limitation: the Company's forward-looking production guidance, including estimated ore grades, project timelines, drilling results, metal production, mine estimates horizons, production, total cash costs per ounce, minesite costs per tonne; all-in sustaining costs and cash flows; the estimated timing and conclusions of technical reports and other studies; the methods by which ore will be extracted or processed; statements concerning expansion projects, recovery rates, mill throughput, and projected exploration expenditures, including costs and other estimates upon which such projections are based; estimates of depreciation expense, general and administrative expense and tax rates; the impact of maintenance shutdowns; statements regarding timing and amounts of capital expenditures and other assumptions; estimates of future reserves, resources, mineral production, optimization efforts and sales; estimates of mine life; estimates of future mining costs, total cash costs, minesite costs, all-in sustaining costs and other expenses; estimates of future capital expenditures and other cash needs, and expectations as to the funding thereof; statements and information as to the projected development of certain ore deposits, including estimates of exploration, development and production and other capital costs, and estimates of the timing of such exploration, development and production or decisions with respect to such exploration, development and production; estimates of reserves and resources, and statements and information regarding anticipated future exploration; the anticipated timing of events with respect to the Company’s mine sites and statements and information regarding the sufficiency of the Company’s cash resources and other statements and information regarding anticipated trends with respect to the Company's operations, exploration and the funding thereof. Such statements and information reflect the Company’s views as at the date of this document and are subject to certain risks, uncertainties and assumptions, and undue reliance should not be placed on such statements and information. Forward-looking statements are necessarily based upon a number of factors and assumptions that, while considered reasonable by Agnico Eagle as of the date of such statements, are inherently subject to significant business, economic and competitive uncertainties and contingencies. The material factors and assumptions used in the preparation of the forward looking statements contained herein, which may prove to be incorrect, include, but are not limited to, the assumptions set forth herein and in management's discussion and analysis (“MD&A”) and the Company's Annual Information Form (“AIF”) for the year ended December 31, 2104 filed with Canadian securities regulators and that are included in its Annual Report on Form 40-F for the year ended December 31, 2014 (“Form 40-F”) filed with the U.S. Securities and Exchange Commission (the “SEC”) as well as: that there are no significant disruptions affecting operations; that production, permitting and expansion at each of Agnico Eagle's properties proceeds on a basis consistent with current expectations and plans; that the relevant metals prices, exchange rates and prices for key mining and construction supplies will be consistent with Agnico Eagle's expectations; that Agnico Eagle's current estimates of mineral reserves, mineral resources, mineral grades and metal recovery are accurate; that there are no material delays in the timing for completion of ongoing growth projects; that the Company's current plans to optimize production are successful; and that there are no material variations in the current tax and regulatory environment. Many factors, known and unknown could cause the actual results to be materially different from those expressed or implied by such forward looking statements and information. Such risks include, but are not limited to: the volatility of prices of gold and other metals; uncertainty of mineral reserves, mineral resources, mineral grades and mineral recovery estimates; uncertainty of future production, capital expenditures, and other costs; currency fluctuations; financing of additional capital requirements; cost of exploration and development programs; mining risks; community protests; risks associated with foreign operations; governmental and environmental regulation; the volatility of the Company’s stock price; and risks associated with the Company’s by-product metal derivative strategies. For a more detailed discussion of such risks and other factors that may affect the Company’s ability to achieve the expectations set forth in the forward-looking statements contained in this document, see the AIF and MD&A filed on SEDAR at www.sedar.com and included in the Form 40-F filed on EDGAR at www.sec.gov, as well as the Company’s other filings with the Canadian securities regulators and the SEC. The Company does not intend, and does not assume any obligation, to update these forward-looking statements and information. For a detailed breakdown of the Company’s reserve and resource position see the Company’s press release dated February 11, 2015.

AGNICO EAGLE | SECOND QUARTER 2015 RESULTS | 3
Notes to Investors
Note Regarding the Use of Non-GAAP Financial Measures
This presentation discloses certain measures, including ‘‘total cash costs per ounce’’ and ‘‘minesite costs per tonne’’ that are not recognized measures under IFRS. This data may not be comparable to data presented by other gold producers. For a reconciliation of these measures to the most directly comparable financial information presented in the consolidated financial statements prepared in accordance with IFRS and for an explanation of how management uses these measures, see “Reconciliation of Non-GAAP Financial Performance Measures” below. Total cash costs per ounce of gold produced is presented on both a by-product basis (deducting by-product metal revenues from production costs) and co-product basis (before by-product metal revenues). Total cash costs per ounce of gold produced on a by-product basis is calculated by adjusting production costs as recorded in the consolidated statements of income (loss) for by-product revenues, unsold concentrate inventory production costs, smelting, refining and marketing charges and other adjustments, and then dividing by the number of ounces of gold produced. Total cash costs per ounce of gold produced on a co-product basis is calculated in the same manner as total cash costs per ounce of gold produced on a by-product basis except that no adjustment for by-product metal revenues is made. Accordingly, the calculation of total cash costs per ounce of gold produced on a co-product basis does not reflect a reduction in production costs or smelting, refining and marketing charges associated with the production and sale of by-product metals. Total cash costs per ounce of gold produced is intended to provide information about the cash generating capabilities of the Company’s mining operations. Management also uses these measures to monitor the performance of the Company’s mining operations. As market prices for gold are quoted on a per ounce basis, using the total cash cost per ounce of gold produced on a by-product basis measure allows management to assess a mine’s cash generating capabilities at various gold prices. Management is aware that these per ounce measures of performance can be affected by fluctuations in and exchange rates. and, in the case of total cash costs per ounce of gold produced on a by-product basis, by-product metal prices. Management compensates for these inherent limitations by using these measures in conjunction with minesite costs per tonne (discussed below) as well as other data prepared in accordance with IFRS. Management also performs sensitivity analyses in order to quantify the effects of fluctuating exchange rates and metal prices. This presentation also contains information as to estimated future total cash costs per ounce, all-in sustaining costs and minesite costs per tonne. The estimates are based upon the total cash costs per ounce, all-in sustaining costs and minesite costs per tonne that the Company expects to incur to mine gold at its mines and projects and, consistent with the reconciliation of these actual costs referred to above, do not include production costs attributable to accretion expense and other asset retirement costs, which will vary over time as each project is developed and mined. It is therefore not practicable to reconcile these forward-looking Non-GAAP financial measures to the most comparable IFRS measure.
Note Regarding Production Guidance
The gold production guidance is based on the Company’s mineral reserves but includes contingencies and assumes metal prices and foreign exchange rates that are different from those used in the reserve estimates. These factors and others mean that the gold production guidance presented in this disclosure does not reconcile exactly with the production models used to support these mineral reserves.
AGNICO EAGLE | SECOND QUARTER 2015 RESULTS | 4
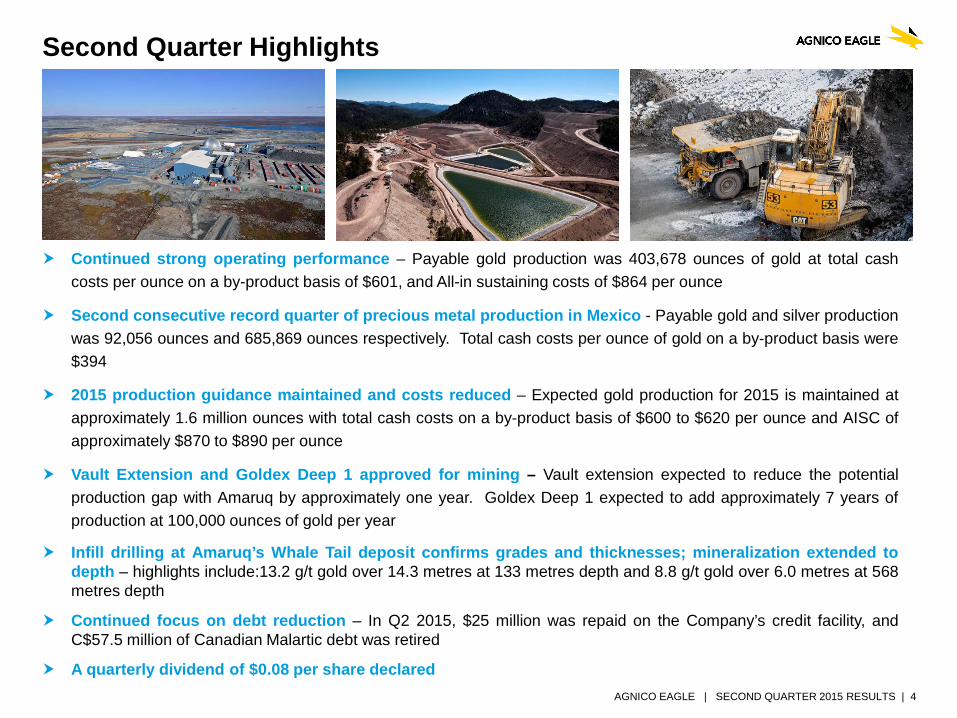
Continued strong operating performance – Payable gold production was 403,678 ounces of gold at total cash costs per ounce on a by-product basis of $601, and All-in sustaining costs of $864 per ounce
Second consecutive record quarter of precious metal production in Mexico - Payable gold and silver production was 92,056 ounces and 685,869 ounces respectively. Total cash costs per ounce of gold on a by-product basis were $394
2015 production guidance maintained and costs reduced – Expected gold production for 2015 is maintained at approximately 1.6 million ounces with total cash costs on a by-product basis of $600 to $620 per ounce and AISC of approximately $870 to $890 per ounce
Vault Extension and Goldex Deep 1 approved for mining – Vault extension expected to reduce the potential production gap with Amaruq by approximately one year. Goldex Deep 1 expected to add approximately 7 years of production at 100,000 ounces of gold per year
Infill drilling at Amaruq’s Whale Tail deposit confirms grades and thicknesses; mineralization extended to depth – highlights include:13.2 g/t gold over 14.3 metres at 133 metres depth and 8.8 g/t gold over 6.0 metres at 568 metres depth
Continued focus on debt reduction – In Q2 2015, $25 million was repaid on the Company’s credit facility, and C$57.5 million of Canadian Malartic debt was retired
A quarterly dividend of $0.08 per share declared
Second Quarter Highlights
AGNICO EAGLE | SECOND QUARTER 2015 RESULTS | 5
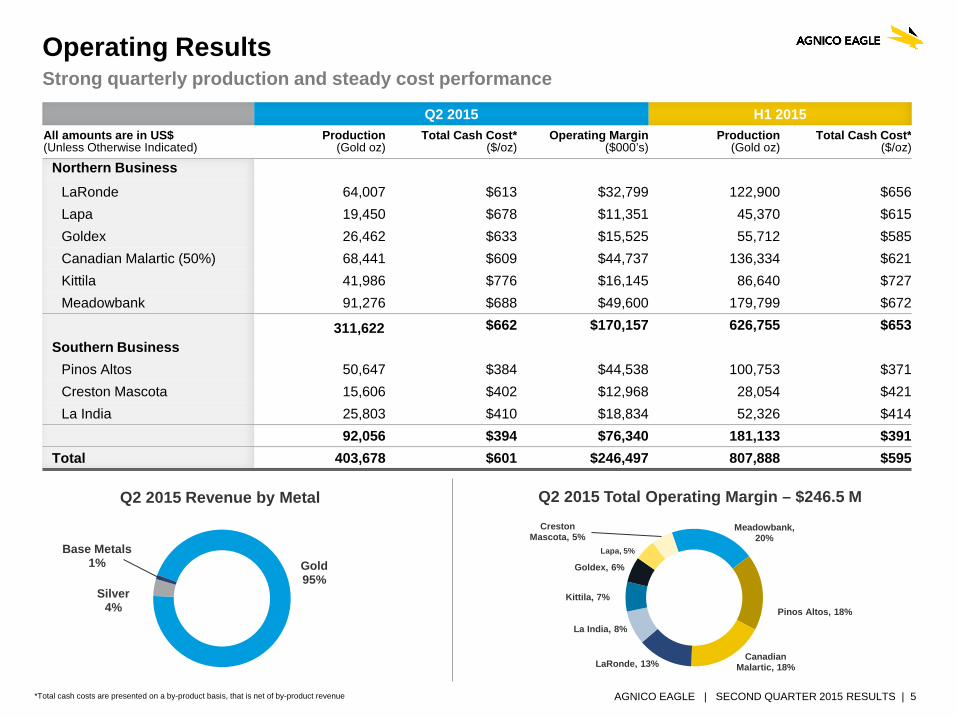
Operating Results Strong quarterly production and steady cost performance
Q2 2015 H1 2015 All amounts are in US$ (Unless Otherwise Indicated)
Production (Gold oz)
Total Cash Cost* ($/oz)
Operating Margin ($000’s)
Production (Gold oz)
Total Cash Cost* ($/oz)
Northern Business
LaRonde 64,007 $613 $32,799 122,900 $656 Lapa 19,450 $678 $11,351 45,370 $615 Goldex 26,462 $633 $15,525 55,712 $585 Canadian Malartic (50%) 68,441 $609 $44,737 136,334 $621 Kittila 41,986 $776 $16,145 86,640 $727 Meadowbank 91,276 $688 $49,600 179,799 $672
311,622 $662 $170,157 626,755 $653 Southern Business
Pinos Altos 50,647 $384 $44,538 100,753 $371 Creston Mascota 15,606 $402 $12,968 28,054 $421 La India 25,803 $410 $18,834 52,326 $414
92,056 $394 $76,340 181,133 $391 Total 403,678 $601 $246,497 807,888 $595
Q2 2015 Total Operating Margin – $246.5 M Q2 2015 Revenue by Metal Meadowbank,
20%
Pinos Altos, 18%
Canadian Malartic, 18% LaRonde, 13%
La India, 8%
Kittila, 7%
Goldex, 6%
Lapa, 5%
Creston Mascota, 5%
*Total cash costs are presented on a by-product basis, that is net of by-product revenue
Gold 95%
Silver 4%
Base Metals 1%
AGNICO EAGLE | SECOND QUARTER 2015 RESULTS | 6
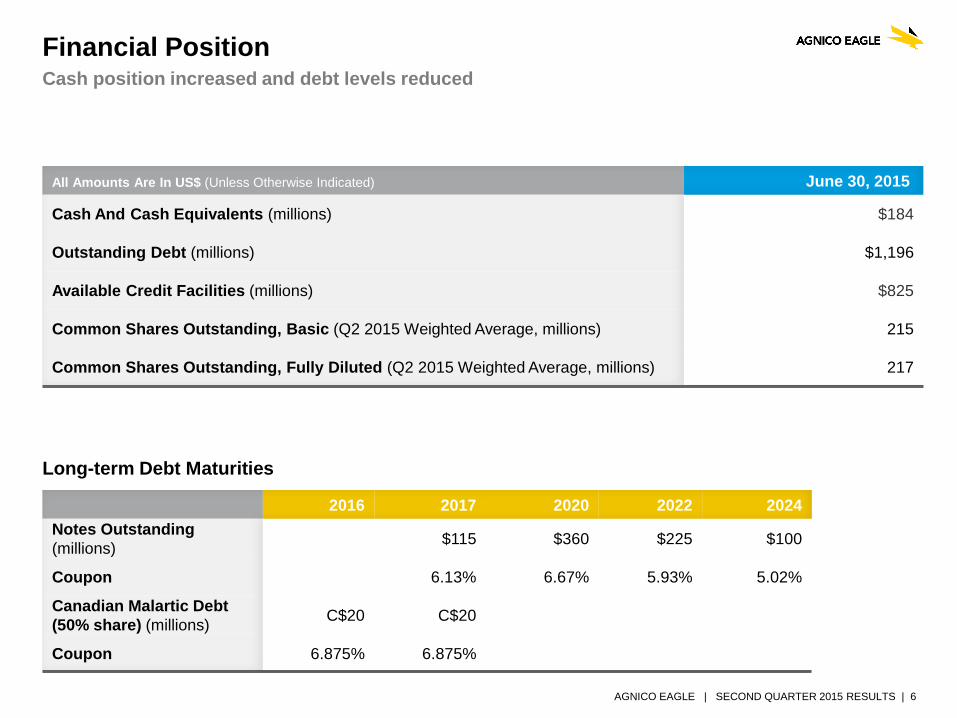
Financial Position Cash position increased and debt levels reduced
Long-term Debt Maturities
2016 2017 2020 2022 2024 Notes Outstanding (millions) $115 $360 $225 $100
Coupon 6.13% 6.67% 5.93% 5.02%
Canadian Malartic Debt (50% share) (millions) C$20 C$20
Coupon 6.875% 6.875%
All Amounts Are In US$ (Unless Otherwise Indicated) June 30, 2015
Cash And Cash Equivalents (millions) $184
Outstanding Debt (millions) $1,196
Available Credit Facilities (millions) $825
Common Shares Outstanding, Basic (Q2 2015 Weighted Average, millions) 215
Common Shares Outstanding, Fully Diluted (Q2 2015 Weighted Average, millions) 217
AGNICO EAGLE | SECOND QUARTER 2015 RESULTS | 7
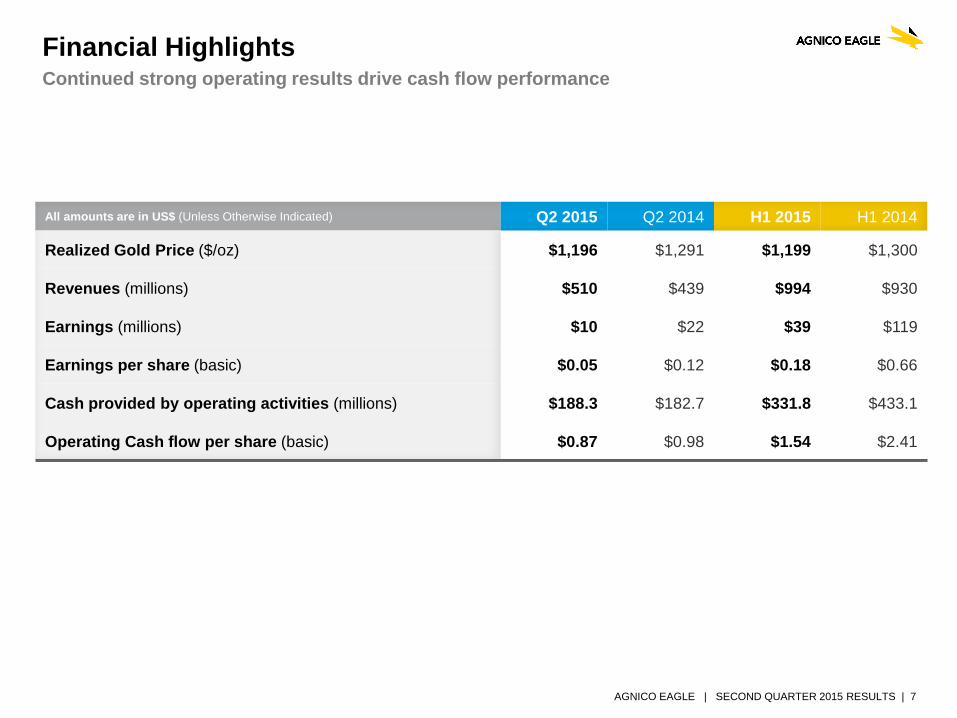
Financial Highlights Continued strong operating results drive cash flow performance
All amounts are in US$ (Unless Otherwise Indicated) Q2 2015 Q2 2014 H1 2015 H1 2014
Realized Gold Price ($/oz) $1,196 $1,291 $1,199 $1,300
Revenues (millions) $510 $439 $994 $930
Earnings (millions) $10 $22 $39 $119
Earnings per share (basic) $0.05 $0.12 $0.18 $0.66
Cash provided by operating activities (millions) $188.3 $182.7 $331.8 $433.1
Operating Cash flow per share (basic) $0.87 $0.98 $1.54 $2.41
NORTHERN BUSINESS
AGNICO EAGLE | SECOND QUARTER 2015 RESULTS | 9
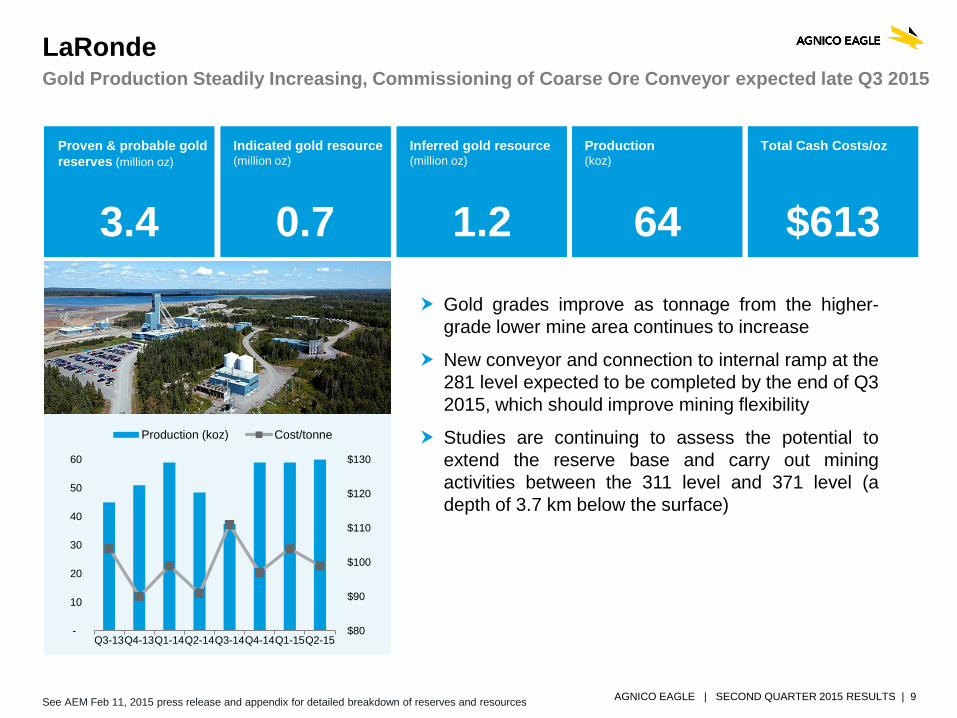
Gold grades improve as tonnage from the higher-grade lower mine area continues to increase
New conveyor and connection to internal ramp at the 281 level expected to be completed by the end of Q3 2015, which should improve mining flexibility
Studies are continuing to assess the potential to extend the reserve base and carry out mining activities between the 311 level and 371 level (a depth of 3.7 km below the surface)
LaRonde Gold Production Steadily Increasing, Commissioning of Coarse Ore Conveyor expected late Q3 2015
Proven & probable gold reserves (million oz)
3.4
Indicated gold resource (million oz)
0.7
Inferred gold resource (million oz)
1.2
Total Cash Costs/oz
$613
Production (koz)
64
See AEM Feb 11, 2015 press release and appendix for detailed breakdown of reserves and resources
$80
$90
$100
$110
$120
$130
-
10
20
30
40
50
60
Q3-13Q4-13Q1-14Q2-14Q3-14Q4-14Q1-15Q2-15
Production (koz) Cost/tonne
AGNICO EAGLE | SECOND QUARTER 2015 RESULTS | 10
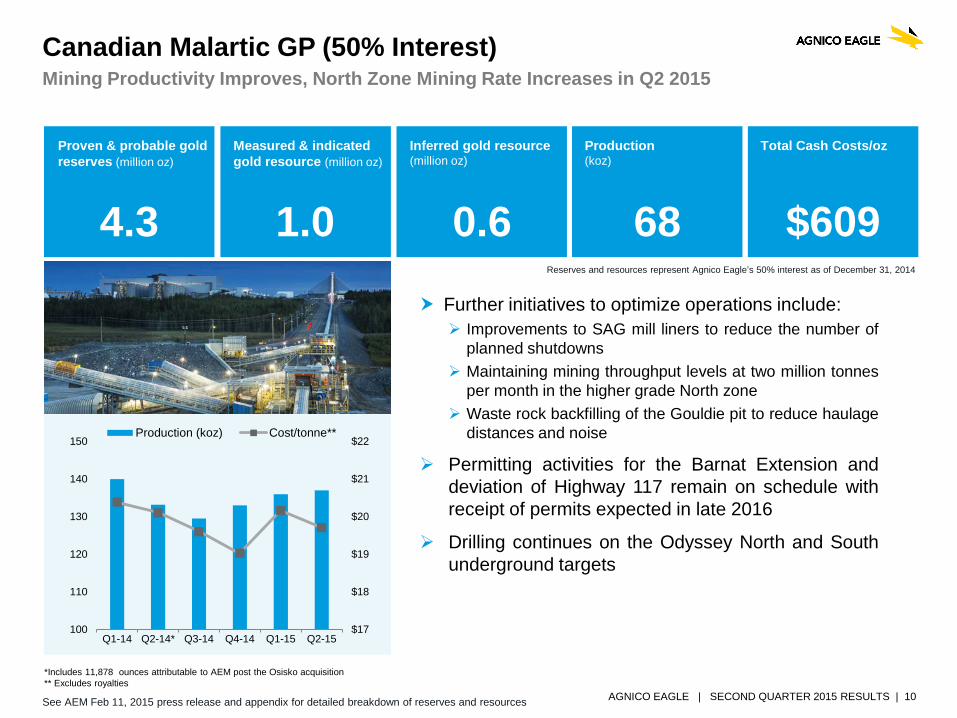
Further initiatives to optimize operations include: Improvements to SAG mill liners to reduce the number of
planned shutdowns Maintaining mining throughput levels at two million tonnes
per month in the higher grade North zone Waste rock backfilling of the Gouldie pit to reduce haulage
distances and noise
Permitting activities for the Barnat Extension and deviation of Highway 117 remain on schedule with receipt of permits expected in late 2016
Drilling continues on the Odyssey North and South underground targets
Canadian Malartic GP (50% Interest) Mining Productivity Improves, North Zone Mining Rate Increases in Q2 2015
*Includes 11,878 ounces attributable to AEM post the Osisko acquisition ** Excludes royalties
Proven & probable gold reserves (million oz)
4.3
Measured & indicated gold resource (million oz)
1.0
Inferred gold resource (million oz)
0.6
Total Cash Costs/oz
$609
Production (koz)
68 Reserves and resources represent Agnico Eagle’s 50% interest as of December 31, 2014
$17
$18
$19
$20
$21
$22
100
110
120
130
140
150
Q1-14 Q2-14* Q3-14 Q4-14 Q1-15 Q2-15
Production (koz) Cost/tonne**
See AEM Feb 11, 2015 press release and appendix for detailed breakdown of reserves and resources
AGNICO EAGLE | SECOND QUARTER 2015 RESULTS | 11
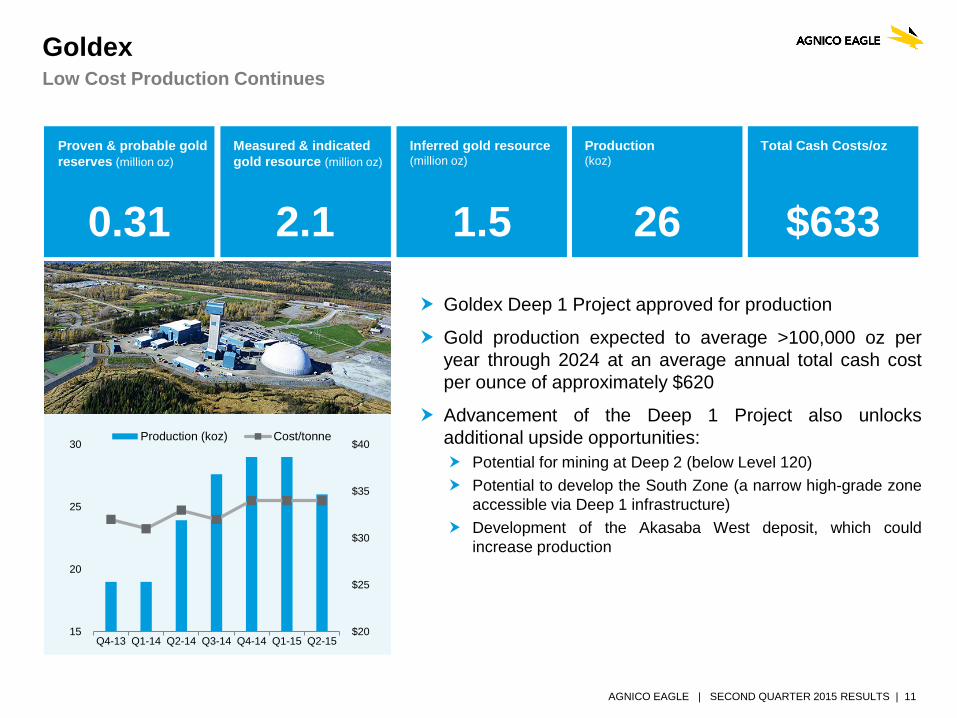
Goldex Deep 1 Project approved for production
Gold production expected to average >100,000 oz per year through 2024 at an average annual total cash cost per ounce of approximately $620
Advancement of the Deep 1 Project also unlocks additional upside opportunities: Potential for mining at Deep 2 (below Level 120) Potential to develop the South Zone (a narrow high-grade zone
accessible via Deep 1 infrastructure) Development of the Akasaba West deposit, which could
increase production
Goldex Low Cost Production Continues
Proven & probable gold reserves (million oz)
0.31
Measured & indicated gold resource (million oz)
2.1
Inferred gold resource (million oz)
1.5
Total Cash Costs/oz
$633
Production (koz)
26
$20
$25
$30
$35
$40
15
20
25
30
Q4-13 Q1-14 Q2-14 Q3-14 Q4-14 Q1-15 Q2-15
Production (koz) Cost/tonne
AGNICO EAGLE | SECOND QUARTER 2015 RESULTS | 12
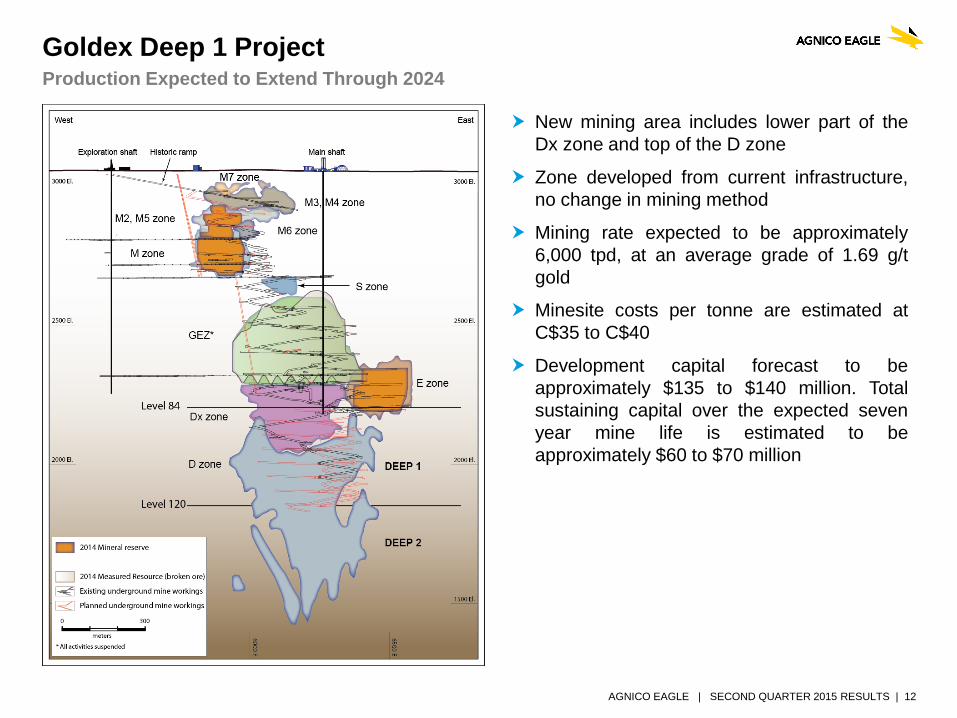
Production Expected to Extend Through 2024
New mining area includes lower part of the Dx zone and top of the D zone
Zone developed from current infrastructure, no change in mining method
Mining rate expected to be approximately 6,000 tpd, at an average grade of 1.69 g/t gold
Minesite costs per tonne are estimated at C$35 to C$40
Development capital forecast to be approximately $135 to $140 million. Total sustaining capital over the expected seven year mine life is estimated to be approximately $60 to $70 million
Goldex Deep 1 Project
AGNICO EAGLE | SECOND QUARTER 2015 RESULTS | 13
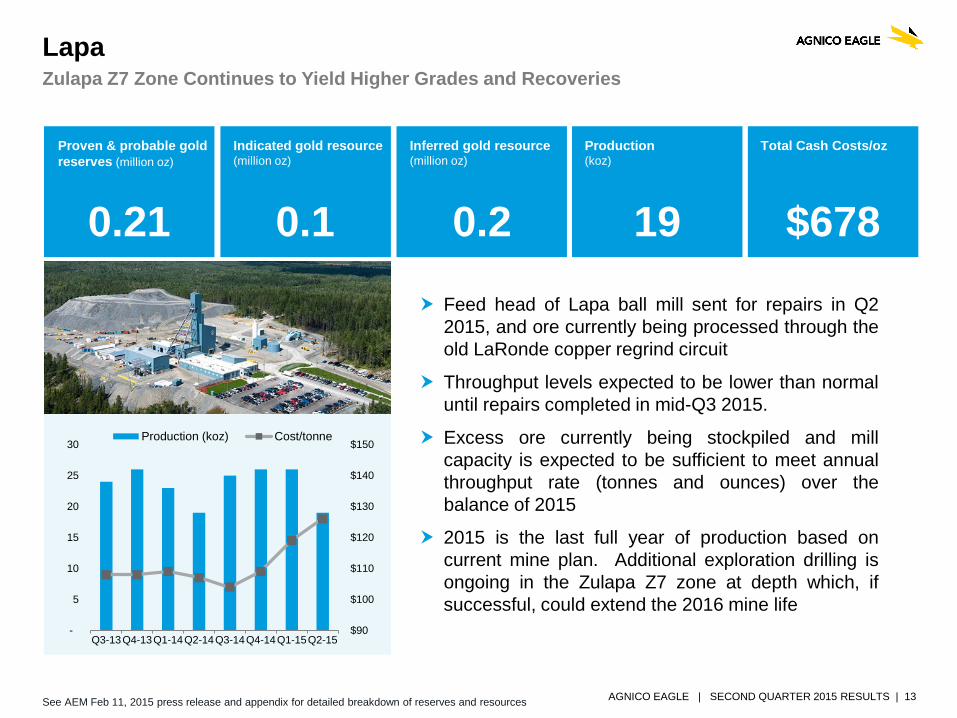
Feed head of Lapa ball mill sent for repairs in Q2 2015, and ore currently being processed through the old LaRonde copper regrind circuit
Throughput levels expected to be lower than normal until repairs completed in mid-Q3 2015.
Excess ore currently being stockpiled and mill capacity is expected to be sufficient to meet annual throughput rate (tonnes and ounces) over the balance of 2015
2015 is the last full year of production based on current mine plan. Additional exploration drilling is ongoing in the Zulapa Z7 zone at depth which, if successful, could extend the 2016 mine life
Lapa Zulapa Z7 Zone Continues to Yield Higher Grades and Recoveries
Proven & probable gold reserves (million oz)
0.21
Indicated gold resource (million oz)
0.1
Inferred gold resource (million oz)
0.2
Total Cash Costs/oz
$678
Production (koz)
19
$90
$100
$110
$120
$130
$140
$150
-
5
10
15
20
25
30
Q3-13Q4-13Q1-14Q2-14Q3-14Q4-14Q1-15Q2-15
Production (koz) Cost/tonne
See AEM Feb 11, 2015 press release and appendix for detailed breakdown of reserves and resources
AGNICO EAGLE | SECOND QUARTER 2015 RESULTS | 14
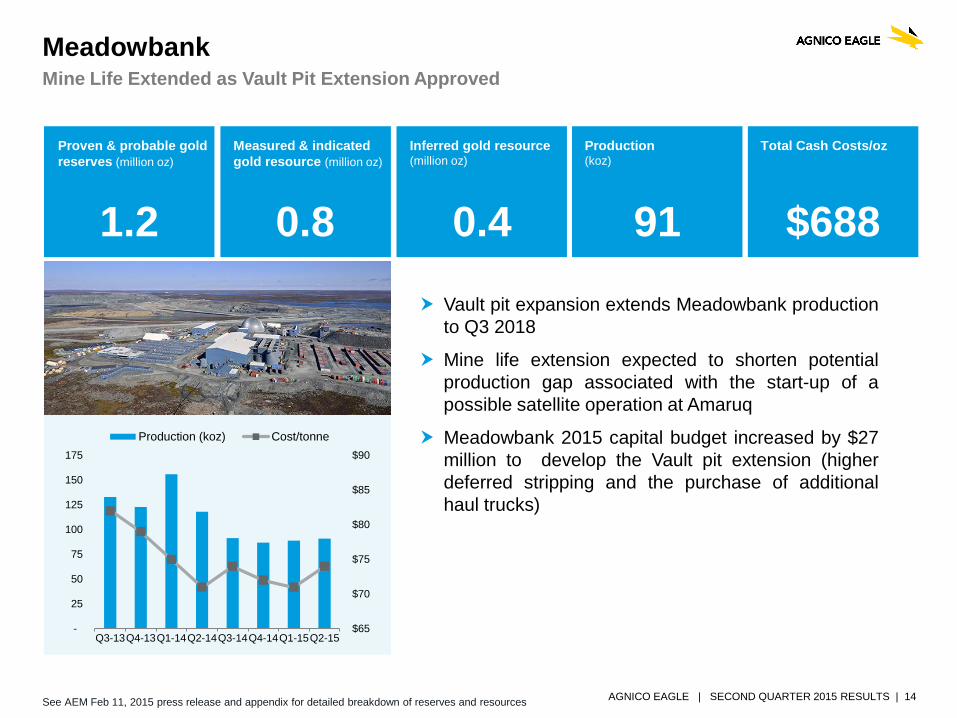
Vault pit expansion extends Meadowbank production to Q3 2018
Mine life extension expected to shorten potential production gap associated with the start-up of a possible satellite operation at Amaruq
Meadowbank 2015 capital budget increased by $27 million to develop the Vault pit extension (higher deferred stripping and the purchase of additional haul trucks)
Meadowbank Mine Life Extended as Vault Pit Extension Approved
Proven & probable gold reserves (million oz)
1.2
Measured & indicated gold resource (million oz)
0.8
Inferred gold resource (million oz)
0.4
Total Cash Costs/oz
$688
Production (koz)
91
$65
$70
$75
$80
$85
$90
-
25
50
75
100
125
150
175
Q3-13Q4-13Q1-14Q2-14Q3-14Q4-14Q1-15Q2-15
Production (koz) Cost/tonne
See AEM Feb 11, 2015 press release and appendix for detailed breakdown of reserves and resources
AGNICO EAGLE | SECOND QUARTER 2015 RESULTS | 15
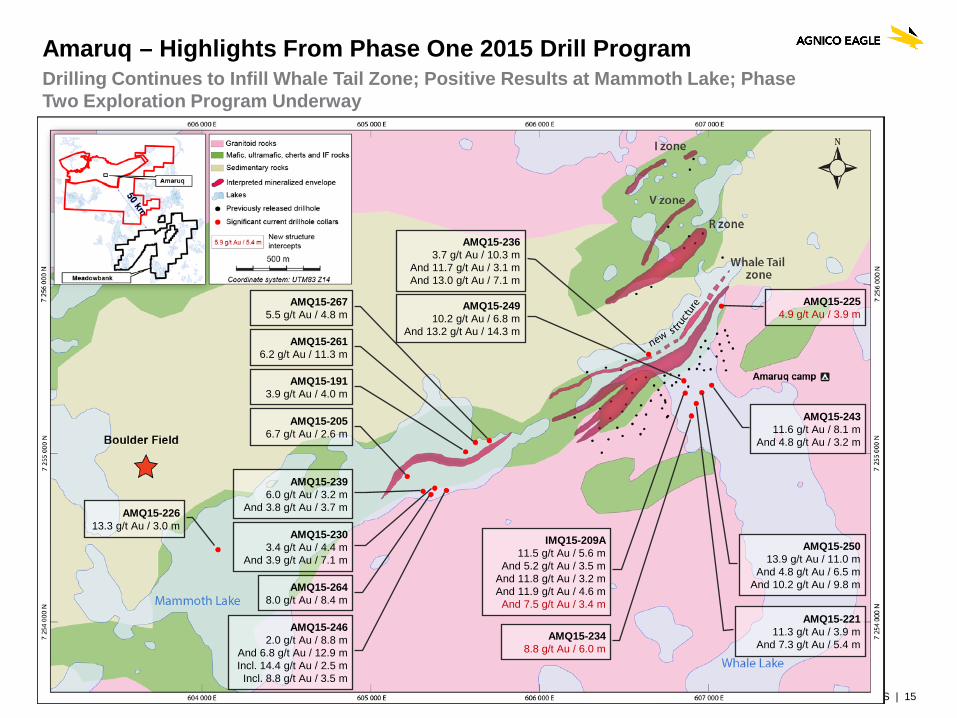
Amaruq – Highlights From Phase One 2015 Drill Program Drilling Continues to Infill Whale Tail Zone; Positive Results at Mammoth Lake; Phase Two Exploration Program Underway
AMQ15-239 6.0 g/t Au / 3.2 m
And 3.8 g/t Au / 3.7 m
AMQ15-243 11.6 g/t Au / 8.1 m
And 4.8 g/t Au / 3.2 m
AMQ15-226 13.3 g/t Au / 3.0 m
AMQ15-234 8.8 g/t Au / 6.0 m
AMQ15-249 10.2 g/t Au / 6.8 m
And 13.2 g/t Au / 14.3 m
AMQ15-205 6.7 g/t Au / 2.6 m
AMQ15-225 4.9 g/t Au / 3.9 m
AMQ15-191 3.9 g/t Au / 4.0 m
AMQ15-230 3.4 g/t Au / 4.4 m
And 3.9 g/t Au / 7.1 m
AMQ15-246 2.0 g/t Au / 8.8 m
And 6.8 g/t Au / 12.9 m Incl. 14.4 g/t Au / 2.5 m Incl. 8.8 g/t Au / 3.5 m
AMQ15-236 3.7 g/t Au / 10.3 m
And 11.7 g/t Au / 3.1 m And 13.0 g/t Au / 7.1 m
IMQ15-209A 11.5 g/t Au / 5.6 m
And 5.2 g/t Au / 3.5 m And 11.8 g/t Au / 3.2 m And 11.9 g/t Au / 4.6 m And 7.5 g/t Au / 3.4 m
AMQ15-221 11.3 g/t Au / 3.9 m
And 7.3 g/t Au / 5.4 m
AMQ15-250 13.9 g/t Au / 11.0 m
And 4.8 g/t Au / 6.5 m And 10.2 g/t Au / 9.8 m
AMQ15-261 6.2 g/t Au / 11.3 m
AMQ15-267 5.5 g/t Au / 4.8 m
AMQ15-264 8.0 g/t Au / 8.4 m
AGNICO EAGLE | SECOND QUARTER 2015 RESULTS | 16
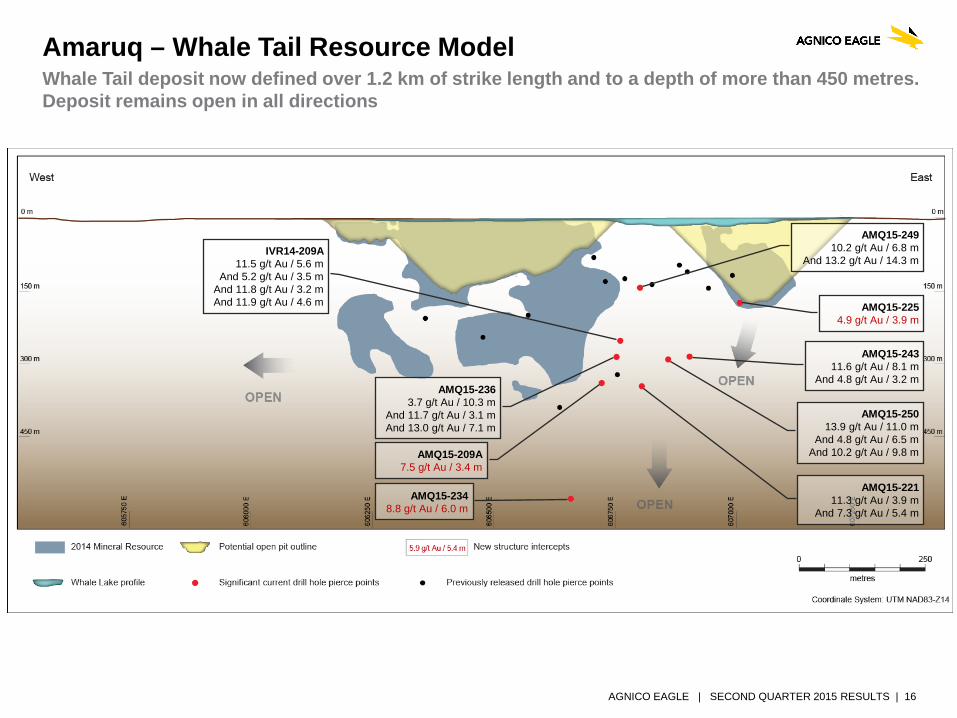
Amaruq – Whale Tail Resource Model Whale Tail deposit now defined over 1.2 km of strike length and to a depth of more than 450 metres. Deposit remains open in all directions
AMQ15-249 10.2 g/t Au / 6.8 m
And 13.2 g/t Au / 14.3 m
AMQ15-236 3.7 g/t Au / 10.3 m
And 11.7 g/t Au / 3.1 m And 13.0 g/t Au / 7.1 m
IVR14-209A 11.5 g/t Au / 5.6 m
And 5.2 g/t Au / 3.5 m And 11.8 g/t Au / 3.2 m And 11.9 g/t Au / 4.6 m
AMQ15-209A 7.5 g/t Au / 3.4 m
AMQ15-234 8.8 g/t Au / 6.0 m
AMQ15-243 11.6 g/t Au / 8.1 m
And 4.8 g/t Au / 3.2 m
AMQ15-225 4.9 g/t Au / 3.9 m
AMQ15-221 11.3 g/t Au / 3.9 m
And 7.3 g/t Au / 5.4 m
AMQ15-250 13.9 g/t Au / 11.0 m
And 4.8 g/t Au / 6.5 m And 10.2 g/t Au / 9.8 m
AGNICO EAGLE | SECOND QUARTER 2015 RESULTS | 17
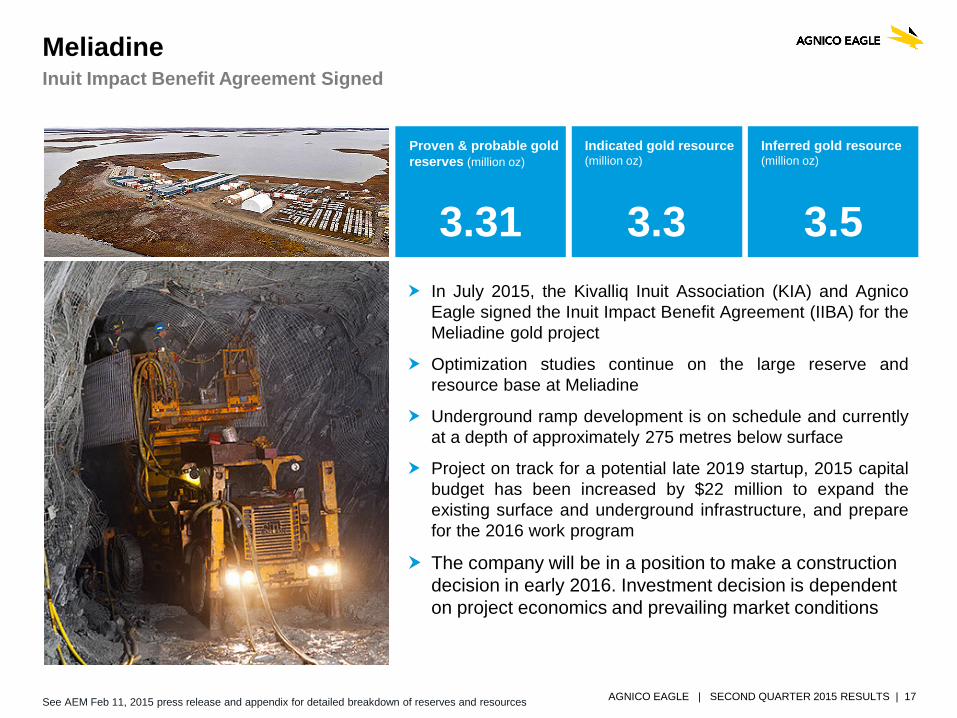
In July 2015, the Kivalliq Inuit Association (KIA) and Agnico Eagle signed the Inuit Impact Benefit Agreement (IIBA) for the Meliadine gold project
Optimization studies continue on the large reserve and resource base at Meliadine
Underground ramp development is on schedule and currently at a depth of approximately 275 metres below surface
Project on track for a potential late 2019 startup, 2015 capital budget has been increased by $22 million to expand the existing surface and underground infrastructure, and prepare for the 2016 work program
The company will be in a position to make a construction decision in early 2016. Investment decision is dependent on project economics and prevailing market conditions
Meliadine Inuit Impact Benefit Agreement Signed
Proven & probable gold reserves (million oz)
3.31
Indicated gold resource (million oz)
3.3
Inferred gold resource (million oz)
3.5
See AEM Feb 11, 2015 press release and appendix for detailed breakdown of reserves and resources
AGNICO EAGLE | SECOND QUARTER 2015 RESULTS | 18
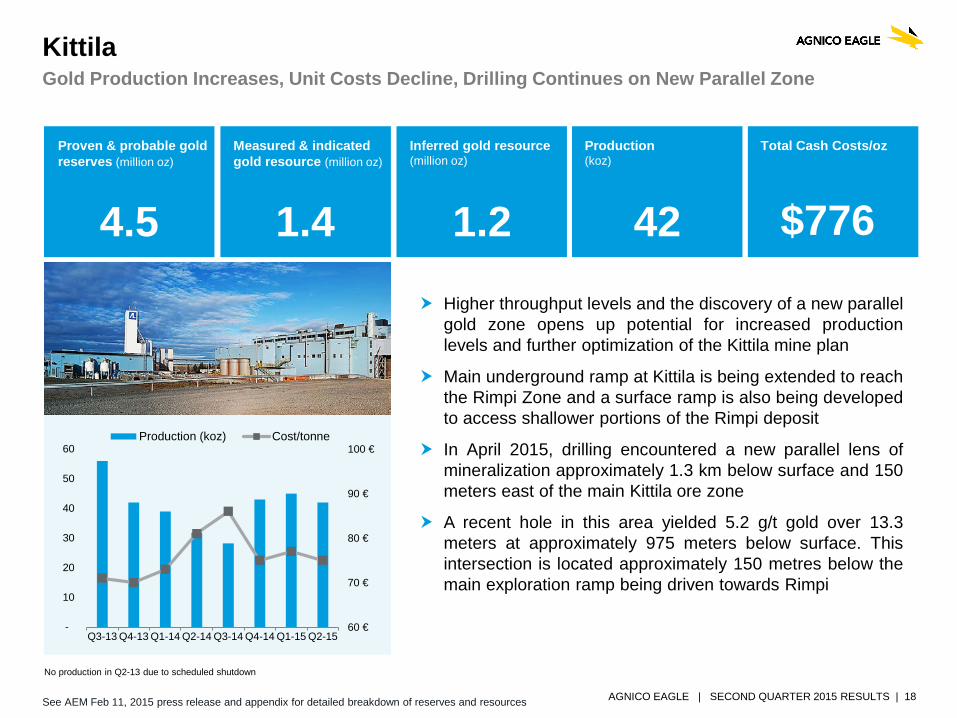
Higher throughput levels and the discovery of a new parallel gold zone opens up potential for increased production levels and further optimization of the Kittila mine plan
Main underground ramp at Kittila is being extended to reach the Rimpi Zone and a surface ramp is also being developed to access shallower portions of the Rimpi deposit
In April 2015, drilling encountered a new parallel lens of mineralization approximately 1.3 km below surface and 150 meters east of the main Kittila ore zone
A recent hole in this area yielded 5.2 g/t gold over 13.3 meters at approximately 975 meters below surface. This intersection is located approximately 150 metres below the main exploration ramp being driven towards Rimpi
Kittila Gold Production Increases, Unit Costs Decline, Drilling Continues on New Parallel Zone
No production in Q2-13 due to scheduled shutdown
Proven & probable gold reserves (million oz)
4.5
Measured & indicated gold resource (million oz)
1.4
Inferred gold resource (million oz)
1.2
Total Cash Costs/oz Production (koz)
42
60 €
70 €
80 €
90 €
100 €
-
10
20
30
40
50
60
Q3-13 Q4-13 Q1-14 Q2-14 Q3-14 Q4-14 Q1-15 Q2-15
Production (koz) Cost/tonne
$776
See AEM Feb 11, 2015 press release and appendix for detailed breakdown of reserves and resources
SOUTHERN BUSINESS
AGNICO EAGLE | SECOND QUARTER 2015 RESULTS | 20
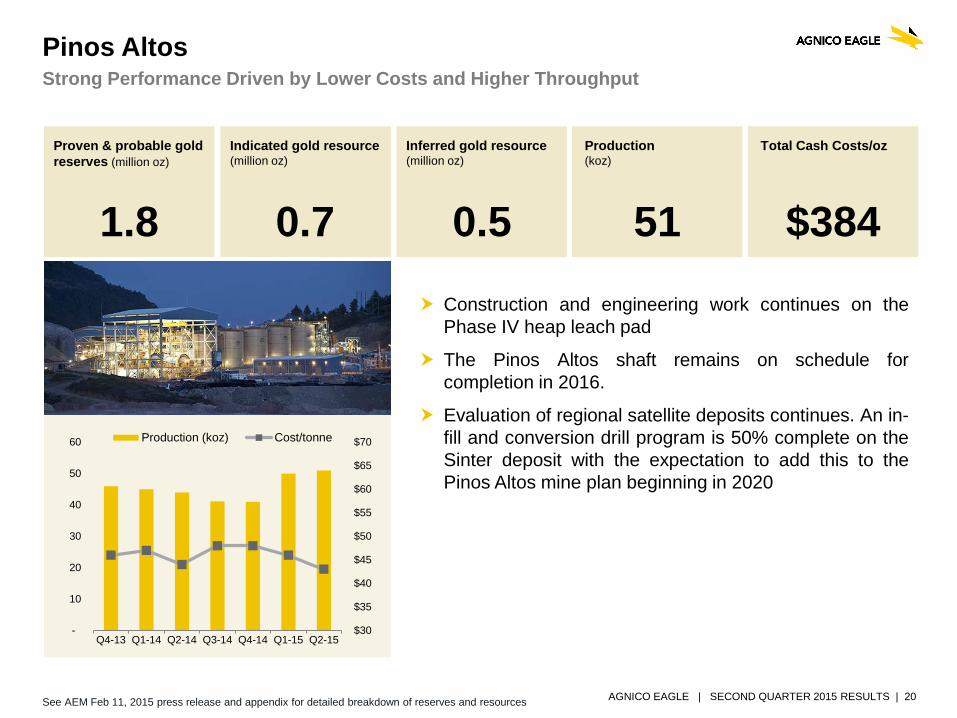
Construction and engineering work continues on the Phase IV heap leach pad
The Pinos Altos shaft remains on schedule for completion in 2016.
Evaluation of regional satellite deposits continues. An in-fill and conversion drill program is 50% complete on the Sinter deposit with the expectation to add this to the Pinos Altos mine plan beginning in 2020
Pinos Altos Strong Performance Driven by Lower Costs and Higher Throughput
Proven & probable gold reserves (million oz)
1.8
Indicated gold resource (million oz)
0.7
Inferred gold resource (million oz)
0.5
Total Cash Costs/oz
$384
Production (koz)
51
$30
$35
$40
$45
$50
$55
$60
$65
$70
-
10
20
30
40
50
60
Q4-13 Q1-14 Q2-14 Q3-14 Q4-14 Q1-15 Q2-15
Production (koz) Cost/tonne
See AEM Feb 11, 2015 press release and appendix for detailed breakdown of reserves and resources
AGNICO EAGLE | SECOND QUARTER 2015 RESULTS | 21
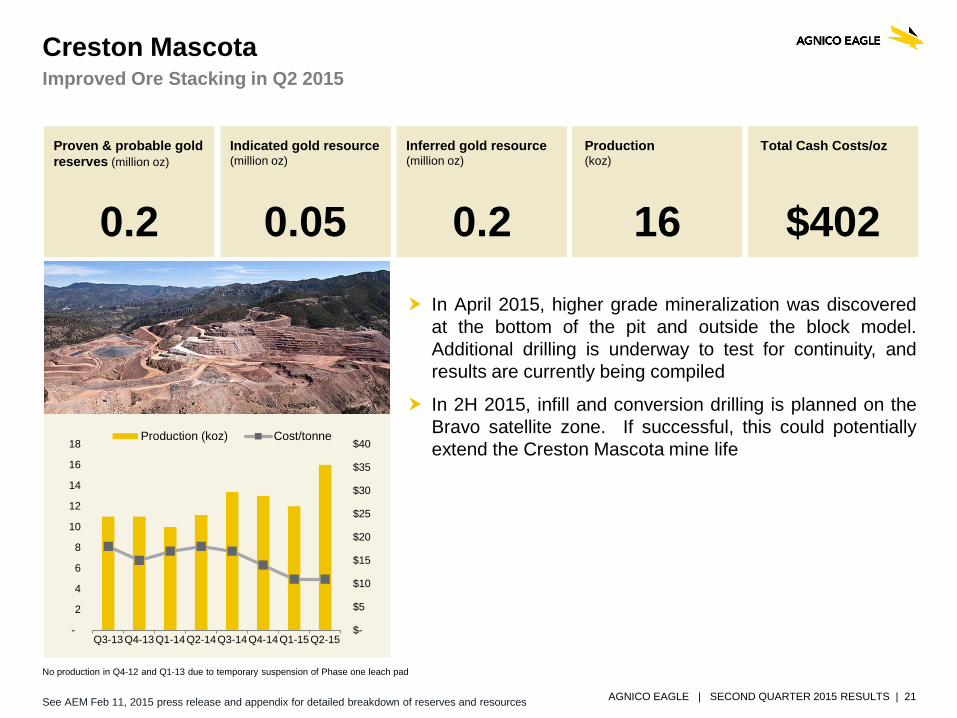
In April 2015, higher grade mineralization was discovered at the bottom of the pit and outside the block model. Additional drilling is underway to test for continuity, and results are currently being compiled
In 2H 2015, infill and conversion drilling is planned on the Bravo satellite zone. If successful, this could potentially extend the Creston Mascota mine life
Creston Mascota Improved Ore Stacking in Q2 2015
Proven & probable gold reserves (million oz)
0.2
Indicated gold resource (million oz)
0.05
Inferred gold resource (million oz)
0.2
Total Cash Costs/oz
$402
Production (koz)
16
No production in Q4-12 and Q1-13 due to temporary suspension of Phase one leach pad
$-
$5
$10
$15
$20
$25
$30
$35
$40
-
2
4
6
8
10
12
14
16
18
Q3-13Q4-13Q1-14Q2-14Q3-14Q4-14Q1-15Q2-15
Production (koz) Cost/tonne
See AEM Feb 11, 2015 press release and appendix for detailed breakdown of reserves and resources
AGNICO EAGLE | SECOND QUARTER 2015 RESULTS | 22
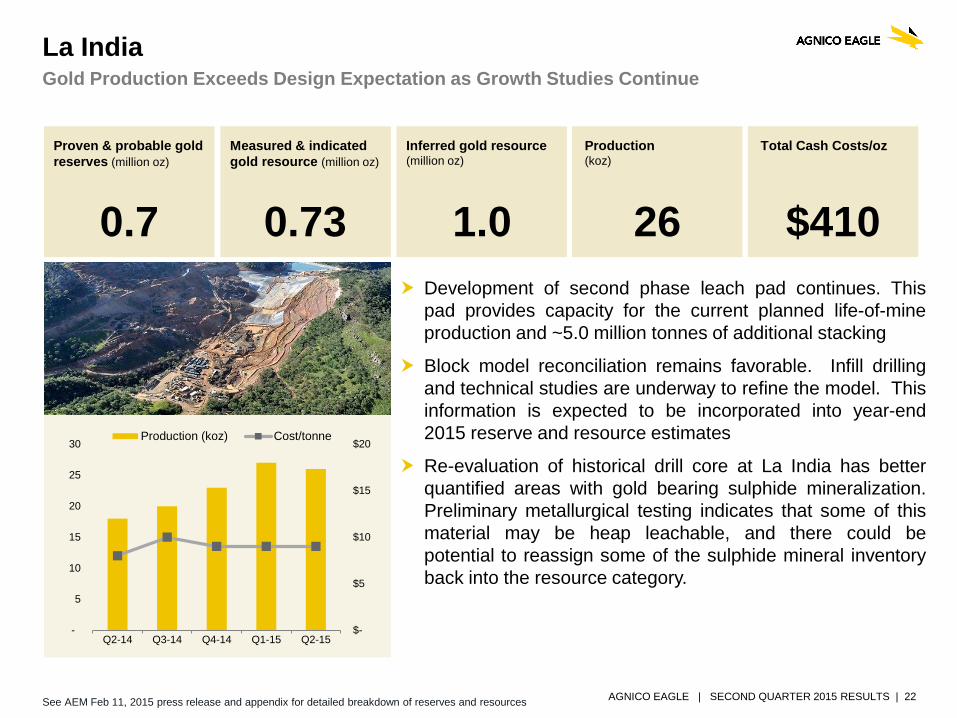
Development of second phase leach pad continues. This pad provides capacity for the current planned life-of-mine production and ~5.0 million tonnes of additional stacking
Block model reconciliation remains favorable. Infill drilling and technical studies are underway to refine the model. This information is expected to be incorporated into year-end 2015 reserve and resource estimates
Re-evaluation of historical drill core at La India has better quantified areas with gold bearing sulphide mineralization. Preliminary metallurgical testing indicates that some of this material may be heap leachable, and there could be potential to reassign some of the sulphide mineral inventory back into the resource category.
La India Gold Production Exceeds Design Expectation as Growth Studies Continue
Proven & probable gold reserves (million oz)
0.7
Measured & indicated gold resource (million oz)
0.73
Inferred gold resource (million oz)
1.0
Total Cash Costs/oz
$410
Production (koz)
26
$-
$5
$10
$15
$20
-
5
10
15
20
25
30
Q2-14 Q3-14 Q4-14 Q1-15 Q2-15
Production (koz) Cost/tonne
See AEM Feb 11, 2015 press release and appendix for detailed breakdown of reserves and resources
SUMMARY
AGNICO EAGLE | SECOND QUARTER 2015 RESULTS | 24
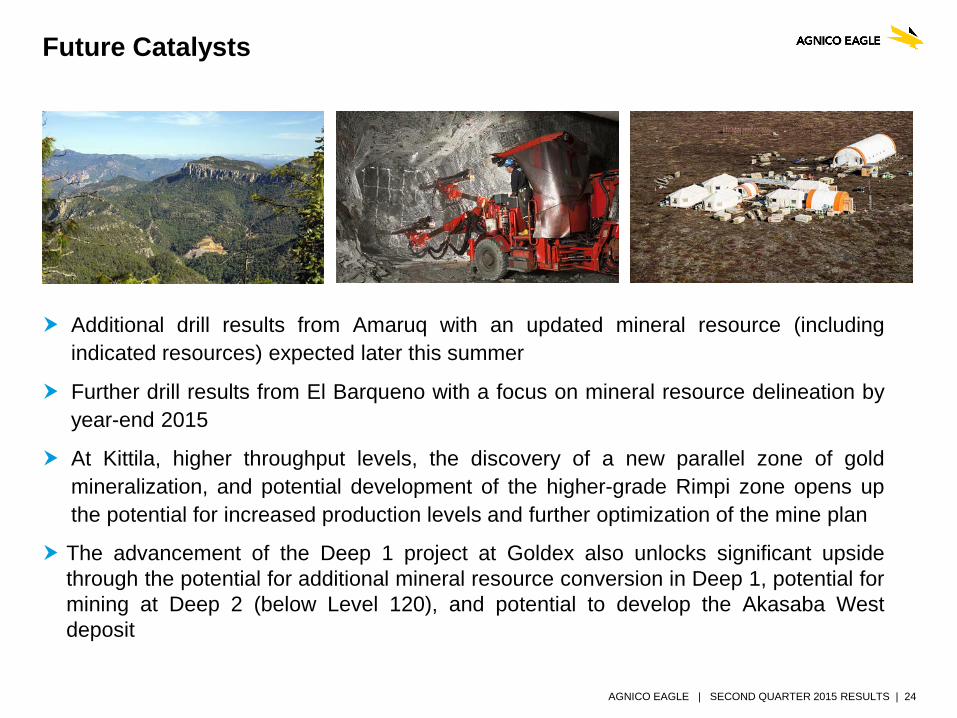
Additional drill results from Amaruq with an updated mineral resource (including indicated resources) expected later this summer
Further drill results from El Barqueno with a focus on mineral resource delineation by year-end 2015
At Kittila, higher throughput levels, the discovery of a new parallel zone of gold mineralization, and potential development of the higher-grade Rimpi zone opens up the potential for increased production levels and further optimization of the mine plan
The advancement of the Deep 1 project at Goldex also unlocks significant upside through the potential for additional mineral resource conversion in Deep 1, potential for mining at Deep 2 (below Level 120), and potential to develop the Akasaba West deposit
Future Catalysts
APPENDIX
AGNICO EAGLE | SECOND QUARTER 2015 RESULTS | 26
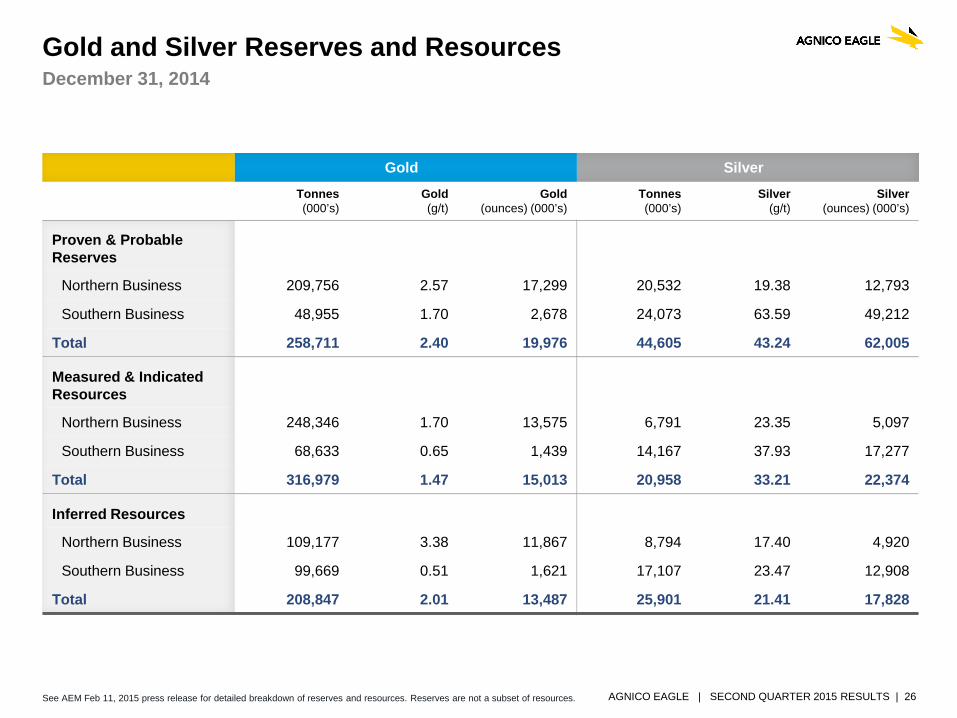
Gold and Silver Reserves and Resources December 31, 2014
Gold Silver Tonnes (000’s)
Gold (g/t)
Gold (ounces) (000’s)
Tonnes (000’s)
Silver (g/t)
Silver (ounces) (000’s)
Proven & Probable Reserves
Northern Business 209,756 2.57 17,299 20,532 19.38 12,793
Southern Business 48,955 1.70 2,678 24,073 63.59 49,212
Total 258,711 2.40 19,976 44,605 43.24 62,005
Measured & Indicated Resources
Northern Business 248,346 1.70 13,575 6,791 23.35 5,097
Southern Business 68,633 0.65 1,439 14,167 37.93 17,277
Total 316,979 1.47 15,013 20,958 33.21 22,374
Inferred Resources
Northern Business 109,177 3.38 11,867 8,794 17.40 4,920
Southern Business 99,669 0.51 1,621 17,107 23.47 12,908
Total 208,847 2.01 13,487 25,901 21.41 17,828
See AEM Feb 11, 2015 press release for detailed breakdown of reserves and resources. Reserves are not a subset of resources.

AGNICO EAGLE | SECOND QUARTER 2015 RESULTS | 27
Copper, Zinc and Lead Reserves and Resources December 31, 2014
Copper Zinc Lead Tonnes (000’s)
Copper (%)
Copper (tonnes)
Tonnes (000’s)
Zinc (%)
Zinc (tonnes)
Tonnes (000’s)
Lead (%)
Lead (tonnes)
Proven & Probable Reserves
Northern Business 20,532 0.25 51,250 20,532 0.64 131,231 20,532 0.04 8,076
Southern Business
Total 20,532 0.25 51,250 20,532 0.64 131,231 20,532 0.04 8,076
Measured & Indicated Resources
Northern Business 6,791 0.24 16,076 6,791 1.01 68,645 6,791 0.11 7,622
Southern Business
Total 6,791 0.24 16,076 6,791 1.01 68,645 6,791 0.11 7,622
Inferred Resources
Northern Business 8,794 0.26 22,552 8,794 0.84 73,977 8,794 0.07 6,359
Southern Business
Total 8,794 0.26 22,552 8,794 0.84 73,977 8,794 0.07 6,359
See AEM Feb 11, 2015 press release for detailed breakdown of reserves and resources. Reserves are not a subset of resources.
AGNICO EAGLE | SECOND QUARTER 2015 RESULTS | 28
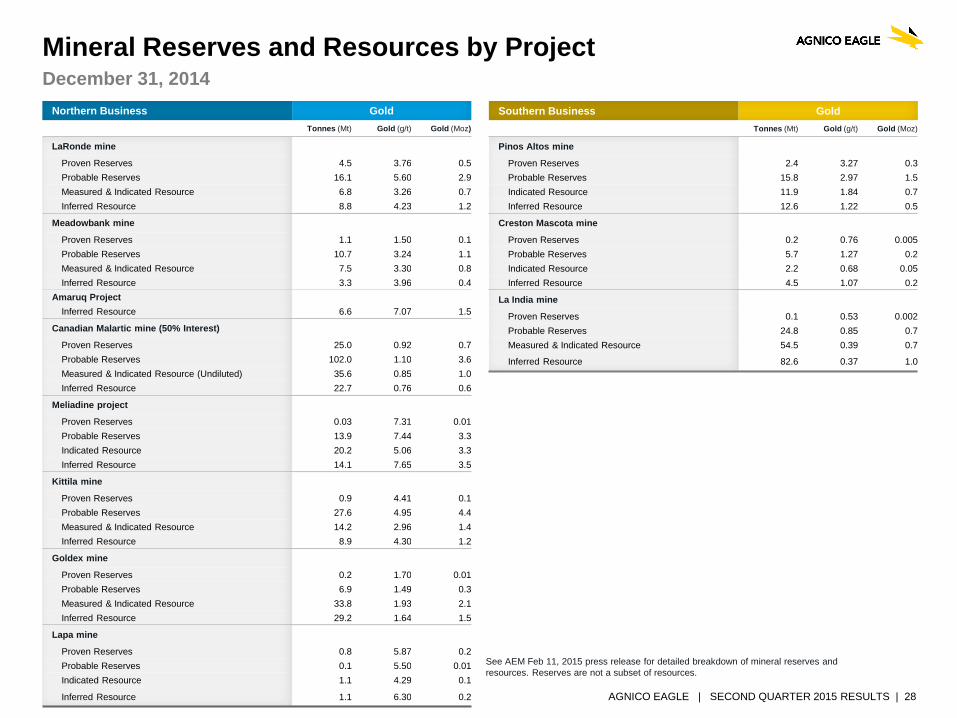
Mineral Reserves and Resources by Project December 31, 2014
See AEM Feb 11, 2015 press release for detailed breakdown of mineral reserves and resources. Reserves are not a subset of resources.
Northern Business Gold Tonnes (Mt) Gold (g/t) Gold (Moz)
LaRonde mine
Proven Reserves 4.5 3.76 0.5 Probable Reserves 16.1 5.60 2.9 Measured & Indicated Resource 6.8 3.26 0.7 Inferred Resource 8.8 4.23 1.2
Meadowbank mine
Proven Reserves 1.1 1.50 0.1 Probable Reserves 10.7 3.24 1.1 Measured & Indicated Resource 7.5 3.30 0.8 Inferred Resource 3.3 3.96 0.4
Amaruq Project Inferred Resource 6.6 7.07 1.5
Canadian Malartic mine (50% Interest)
Proven Reserves 25.0 0.92 0.7 Probable Reserves 102.0 1.10 3.6 Measured & Indicated Resource (Undiluted) 35.6 0.85 1.0 Inferred Resource 22.7 0.76 0.6
Meliadine project
Proven Reserves 0.03 7.31 0.01 Probable Reserves 13.9 7.44 3.3 Indicated Resource 20.2 5.06 3.3 Inferred Resource 14.1 7.65 3.5
Kittila mine
Proven Reserves 0.9 4.41 0.1 Probable Reserves 27.6 4.95 4.4 Measured & Indicated Resource 14.2 2.96 1.4 Inferred Resource 8.9 4.30 1.2
Goldex mine
Proven Reserves 0.2 1.70 0.01 Probable Reserves 6.9 1.49 0.3 Measured & Indicated Resource 33.8 1.93 2.1 Inferred Resource 29.2 1.64 1.5
Lapa mine
Proven Reserves 0.8 5.87 0.2 Probable Reserves 0.1 5.50 0.01 Indicated Resource 1.1 4.29 0.1
Inferred Resource 1.1 6.30 0.2
Southern Business Gold Tonnes (Mt) Gold (g/t) Gold (Moz)
Pinos Altos mine
Proven Reserves 2.4 3.27 0.3 Probable Reserves 15.8 2.97 1.5 Indicated Resource 11.9 1.84 0.7 Inferred Resource 12.6 1.22 0.5
Creston Mascota mine
Proven Reserves 0.2 0.76 0.005 Probable Reserves 5.7 1.27 0.2 Indicated Resource 2.2 0.68 0.05 Inferred Resource 4.5 1.07 0.2
La India mine
Proven Reserves 0.1 0.53 0.002 Probable Reserves 24.8 0.85 0.7 Measured & Indicated Resource 54.5 0.39 0.7
Inferred Resource 82.6 0.37 1.0
AGNICO EAGLE | SECOND QUARTER 2015 RESULTS | 29
Notes to Investors Regarding The Use of Resources
Cautionary Note to Investors Concerning Estimates of Measured and Indicated Resources
This document uses the terms “measured resources” and “indicated resources”. Investors are advised that while those terms are recognized and required by Canadian regulations, the SEC does not recognize them. Investors are cautioned not to assume that any part or all of mineral deposits in these categories will ever be converted into reserves.
Cautionary Note to Investors Concerning Estimates of Inferred Resources
This document also uses the term “inferred resources”. Investors are advised that while this term is recognized and required by Canadian regulations, the SEC does not recognize it. “Inferred resources” have a great amount of uncertainty as to their existence, and great uncertainty as to their economic and legal feasibility. It cannot be assumed that all or any part of an inferred mineral resource will ever be upgraded to a higher category. Under Canadian rules, estimates of inferred mineral resources may not form the basis of feasibility or pre-feasibility studies, except in rare cases. Investors are cautioned not to assume that part or all of an inferred resource exists, or is economically or legally mineable.
Scientific and Technical Data
Cautionary Note To U.S. Investors - The SEC permits U.S. mining companies, in their filings with the SEC, to disclose only those mineral deposits that a company can economically and legally extract or produce. Agnico Eagle Mines Limited reports mineral resource and reserve estimates in accordance with the CIM guidelines for the estimation, classification and reporting of resources and reserves in accordance with the Canadian securities regulatory authorities' (the "CSA") National Instrument 43-101 Standards of Disclosure for Mineral Projects ("NI 43-101"). These standards are similar to those used by the SEC’s Industry Guide No. 7, as interpreted by Staff at the SEC ("Guide 7"). However, the definitions in NI 43-101 differ in certain respects from those under Guide 7. Accordingly, mineral reserve information contained herein may not be comparable to similar information disclosed by U.S. companies. Under the requirements of the SEC, mineralization may not be classified as a "reserve" unless the determination has been made that the mineralization could be economically and legally produced or extracted at the time the reserve determination is made. A "final" or "bankable" feasibility study is required to meet the requirements to designate reserves under Industry Guide 7. Agnico Eagle uses certain terms in this presentation, such as "measured", "indicated", and "inferred", and "resources" that the SEC guidelines strictly prohibit U.S. registered companies from including in their filings with the SEC.
In prior periods, reserves for all properties were typically estimated using historic three-year average metals prices and foreign exchange rates in accordance with the SEC guidelines. These guidelines require the use of prices that reflect current economic conditions at the time of reserve determination, which the Staff of the SEC has interpreted to mean historic three-year average prices. Given the current lower commodity price environment, Agnico Eagle has decided to use price assumptions that are below the three-year averages. The assumptions used for the mineral reserves estimates at all mines and advanced projects as of December 31, 2014, reported by the Company on February 11, 2015, are $1,150 per ounce gold, $18.00 per ounce silver, $1.00 per pound zinc, $3.00 per pound copper, $0.91 per pound lead and C$/US$, US$/Euro and MXP/US$ exchange rates of 1.08, 1.30 and 13.00, respectively.
For the reserves estimate at the Canadian Malartic mine, the Company has decided to continue to report the reserves estimated as of June 15, 2014, reported by the Company in a news release dated August 13, 2014, minus the production to the end of 2014. The assumptions used were $1,300 per ounce gold, a cut-off grade between 0.28 g/t and 0.35 g/t gold (depending on the deposit), and a C$/US$ exchange rate of 1.10.
NI 43-101 requires mining companies to disclose reserves and resources using the subcategories of "proven" reserves, "probable" reserves, "measured" resources, "indicated" resources and "inferred" resources. Mineral resources that are not mineral reserves do not have demonstrated economic viability.
AGNICO EAGLE | SECOND QUARTER 2015 RESULTS | 30
Notes to Investors Regarding The Use of Resources
A mineral reserve is the economically mineable part of a measured and/or indicated mineral resource. It includes diluting materials and allowances for losses, which may occur when the material is mined or extracted and is defined by studies at pre-feasibility or feasibility level as appropriate that include application of modifying factors. Such studies demonstrate that, at the time of reporting, extraction could reasonably be justified.
Modifying factors are considerations used to convert mineral resources to mineral reserves. These include, but are not restricted to, mining, processing, metallurgical, infrastructure, economic, marketing, legal, environmental, social and governmental factors.
A proven mineral reserve is the economically mineable part of a measured mineral resource. A proven mineral reserve implies a high degree of confidence in the modifying factors. A probable mineral reserve is the economically mineable part of an indicated and, in some circumstances, a measured mineral resource. The confidence in the modifying factors applying to a probable mineral reserve is lower than that applying to a proven mineral reserve.
A mineral resource is a concentration or occurrence of solid material of economic interest in or on the Earth's crust in such form, grade or quality and quantity that there are reasonable prospects for eventual economic extraction. The location, quantity, grade or quality, continuity and other geological characteristics of a mineral resource are known, estimated or interpreted from specific geological evidence and knowledge, including sampling.
A measured mineral resource is that part of a mineral resource for which quantity, grade or quality, densities, shape and physical characteristics are estimated with confidence sufficient to allow the application of modifying factors to support detailed mine planning and final evaluation of the economic viability of the deposit. Geological evidence is derived from detailed and reliable exploration, sampling and testing and is sufficient to confirm geological and grade or quality continuity between points of observation. An indicated mineral resource is that part of a mineral resource for which quantity, grade or quality, densities, shape and physical characteristics are estimated with sufficient confidence to allow the application of modifying factors in sufficient detail to support mine planning and evaluation of the economic viability of the deposit. Geological evidence is derived from adequately detailed and reliable exploration, sampling and testing and is sufficient to assume geological and grade or quality continuity between points of observation. An inferred mineral resource is that part of a mineral resource for which quantity and grade or quality are estimated on the basis of limited geological evidence and sampling. Geological evidence is sufficient to imply but not verify geological and grade or quality continuity.
Investors are cautioned not to assume that part or all of an inferred resource exists, or is economically or legally mineable.
A feasibility study is a comprehensive technical and economic study of the selected development option for a mineral project that includes appropriately detailed assessments of applicable modifying factors together with any other relevant operational factors and detailed financial analysis that are necessary to demonstrate, at the time of reporting, that extraction is reasonably justified (economically mineable). The results of the study may reasonably serve as the basis for a final decision by a proponent or financial institution to proceed with, or finance, the development of the project. The confidence level of the study will be higher than that of a Pre-Feasibility Study.
The effective date for all of the Company's mineral resource and reserve estimates in this presentation is December 31, 2014. Additional information about each of the mineral projects that is required by NI 43-101, sections 3.2 and 3.3 and paragraphs 3.4 (a), (c) and (d) can be found in the Technical Reports filed by Agnico Eagle, which may be found at www.sedar.com. Other important operating information can be found in the Company's AIF and Form 40-F.
The scientific and technical information contained herein has been approved by Daniel Doucet, Senior Corporate Director, Reserve Development, and/or Alain Blackburn, Senior Vice-President, Exploration. Both Mr. Doucet and Mr. Blackburn are designated Ing. with the Ordredes ingenieurs du Québec and qualified persons as defined by NI 43-101.
Trading Symbol: AEM on TSX & NYSE
Investor Relations: 416-947-1212 [email protected]
agnicoeagle.com