Klöckner & Co - Q2 2007 Results
28
August 15, 2007 Dr. Thomas Ludwig Gisbert Rühl CEO CFO Klckner & Co AG - Q2/H1 2007 Results - Analysts and Investors Conference Call
-
Upload
kloeckner-co-se -
Category
Investor Relations
-
view
53 -
download
0
Transcript of Klöckner & Co - Q2 2007 Results
August 15, 2007
Dr. Thomas Ludwig Gisbert RühlCEO CFO
Klöckner & Co AG - Q2/H1 2007 Results -Analysts� and Investors�Conference Call
2
Agenda
1. Highlights H1 2007, market and strategyDr. Thomas Ludwig
2. Financials Q2/H1 2007 and outlookGisbert Rühl, CFO
Appendix
3
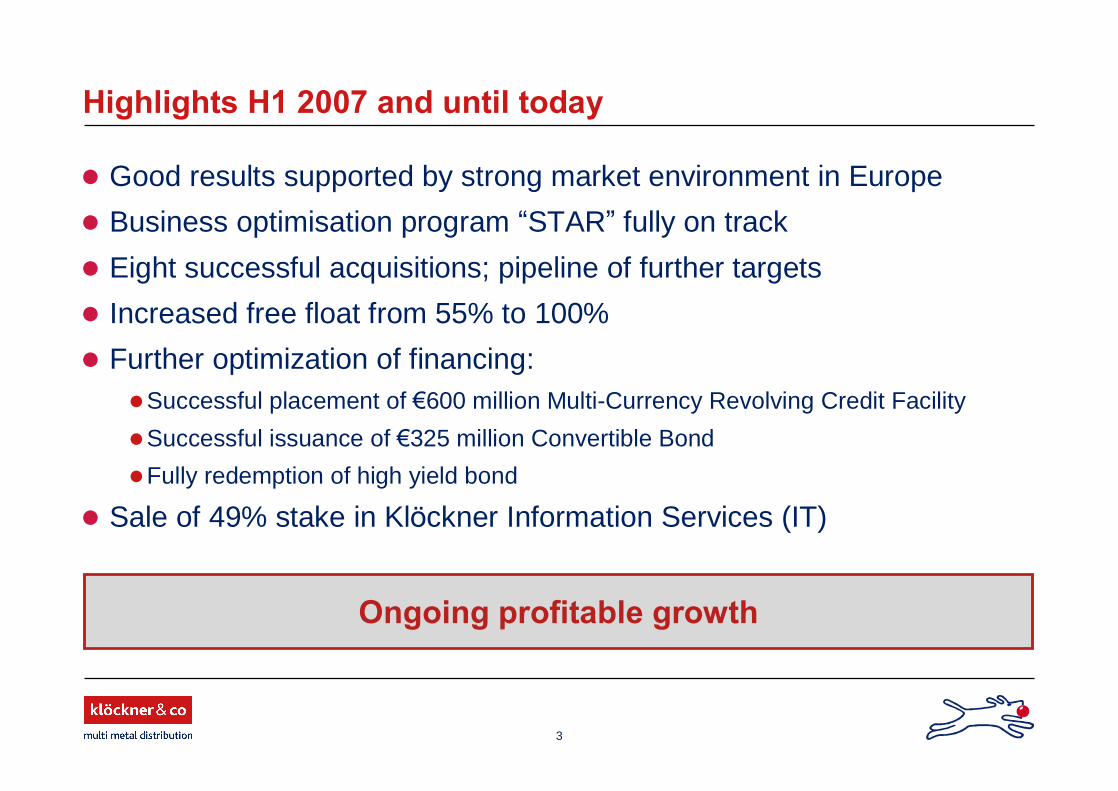
Highlights H1 2007 and until today
Good results supported by strong market environment in Europe
Business optimisation program �STAR� fully on track
Eight successful acquisitions; pipeline of further targets
Increased free float from 55% to 100%
Further optimization of financing:Successful placement of �600 million Multi-Currency Revolving Credit Facility
Successful issuance of �325 million Convertible Bond
Fully redemption of high yield bond
Sale of 49% stake in Klöckner Information Services (IT)
Ongoing profitable growth
4
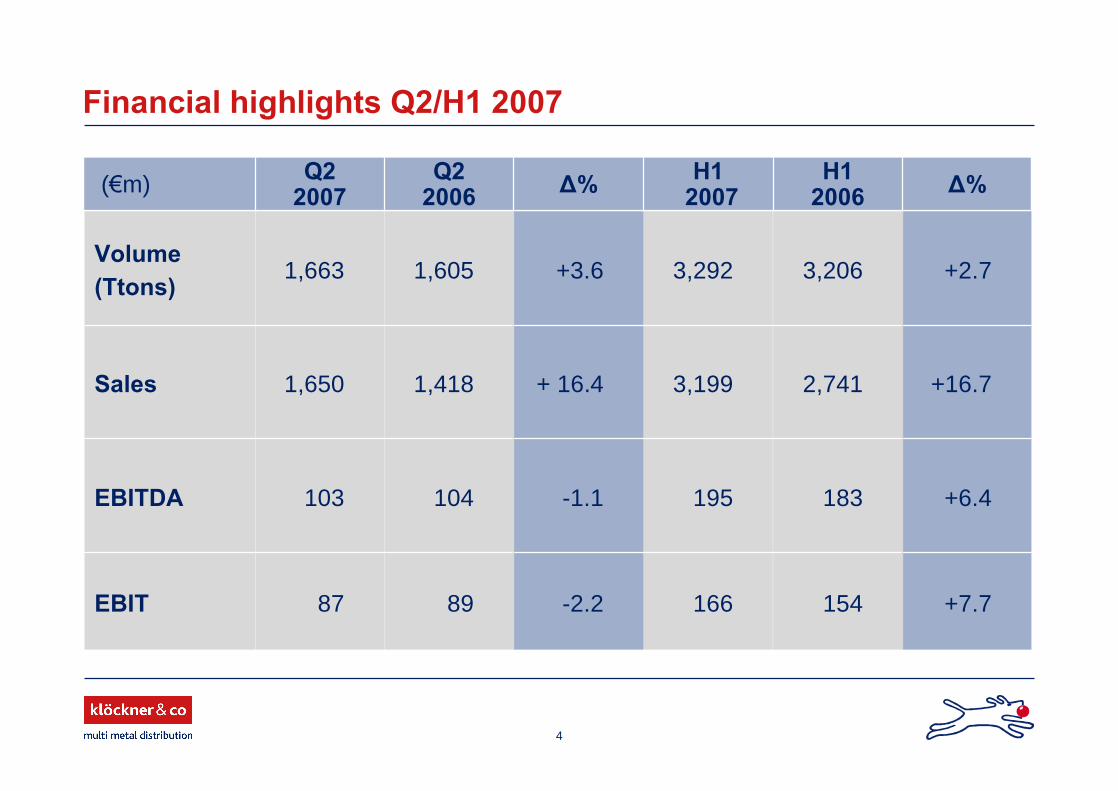
Financial highlights Q2/H1 2007
166
195
3,199
3,292
H12007
89
104
1,418
1,605
Q2 2006
+7.7154-2.287EBIT
+6.4183-1.1103EBITDA
+16.72,741+ 16.41,650Sales
+2.73,206+3.61,663Volume (Ttons)
Ä%H1 2006Ä%Q2
2007(�m)
5
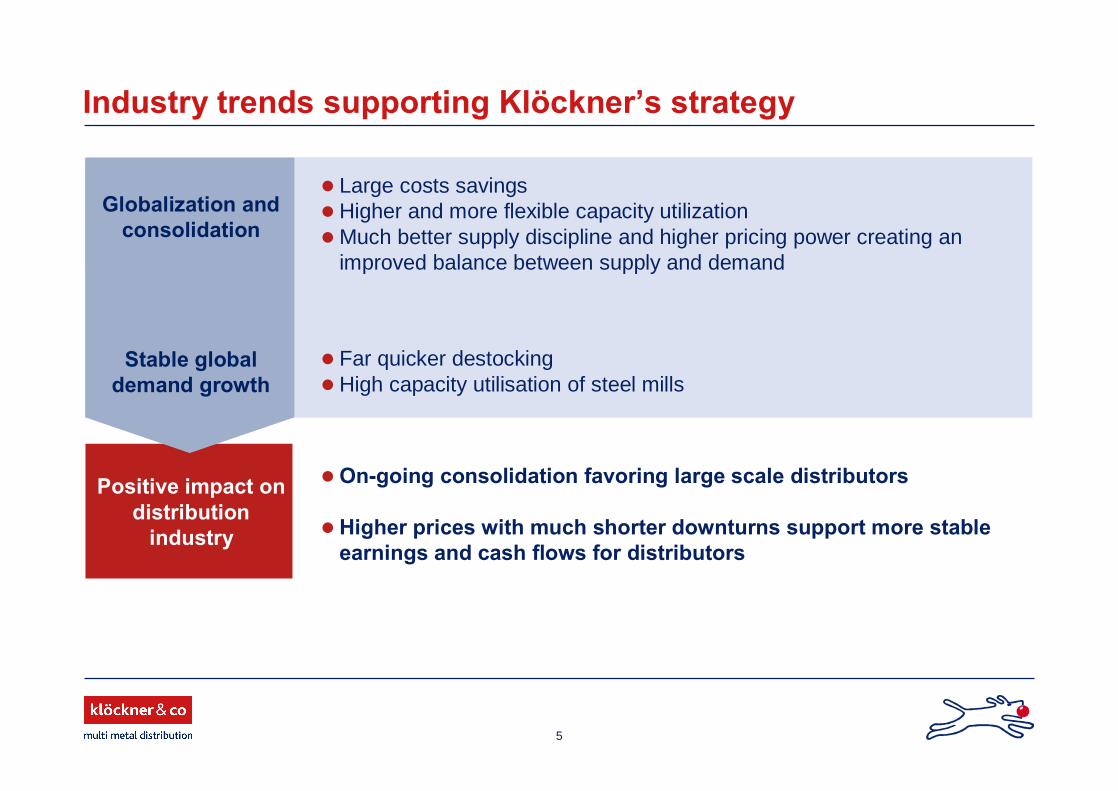
Industry trends supporting Klöckner�s strategy
Positive impact on distribution
industry
Globalization and consolidation
Stable global demand growth
Far quicker destocking High capacity utilisation of steel mills
Large costs savings Higher and more flexible capacity utilization Much better supply discipline and higher pricing power creating an
improved balance between supply and demand
On-going consolidation favoring large scale distributors
Higher prices with much shorter downturns support more stable earnings and cash flows for distributors
6
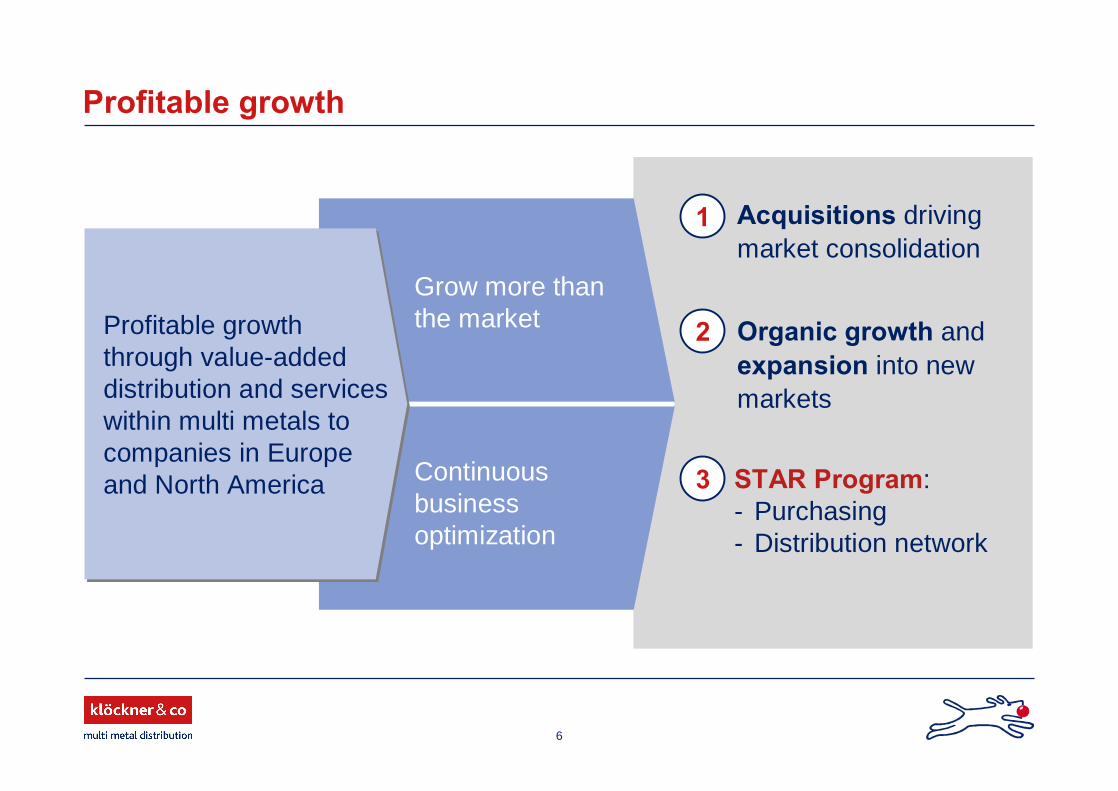
Profitable growth
Grow more thanthe market
Continuous businessoptimization
1 Acquisitions driving market consolidation
Organic growth and expansion into new markets
2
3 STAR Program:- Purchasing- Distribution network
Profitable growth through value-added distribution and services within multi metals to companies in Europe and North America
Profitable growth through value-added distribution and services within multi metals to companies in Europe and North America
7
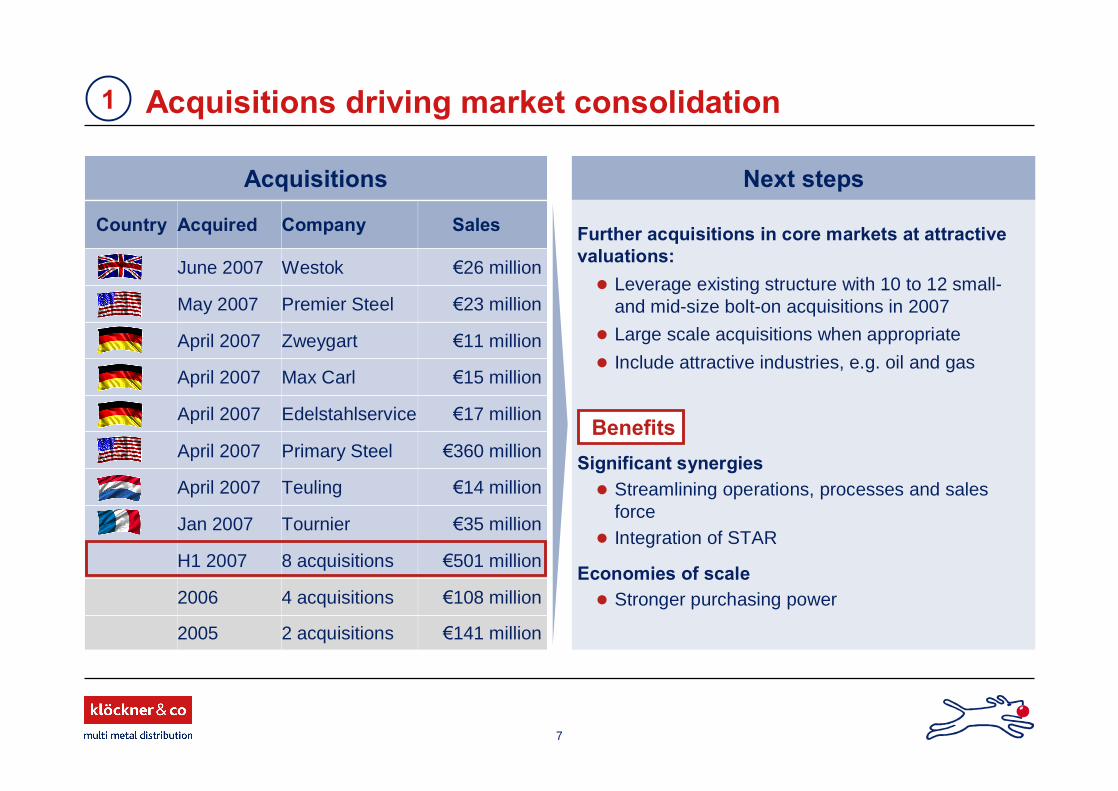
�108 million4 acquisitions2006
�501 million8 acquisitions H1 2007
�35 millionTournierJan 2007
�14 millionTeulingApril 2007
�360 millionPrimary SteelApril 2007
�17 millionEdelstahlserviceApril 2007
�15 millionMax CarlApril 2007
�11 millionZweygartApril 2007
�23 millionPremier SteelMay 2007
�26 millionWestokJune 2007
�141 million
Sales
2005
Acquired CompanyCountry
2 acquisitions
Acquisitions driving market consolidation1
Acquisitions Next steps
Significant synergies Streamlining operations, processes and sales
force Integration of STAR
Economies of scale Stronger purchasing power
Further acquisitions in core markets at attractive valuations:
Leverage existing structure with 10 to 12 small-and mid-size bolt-on acquisitions in 2007
Large scale acquisitions when appropriate
Include attractive industries, e.g. oil and gas
Benefits
8
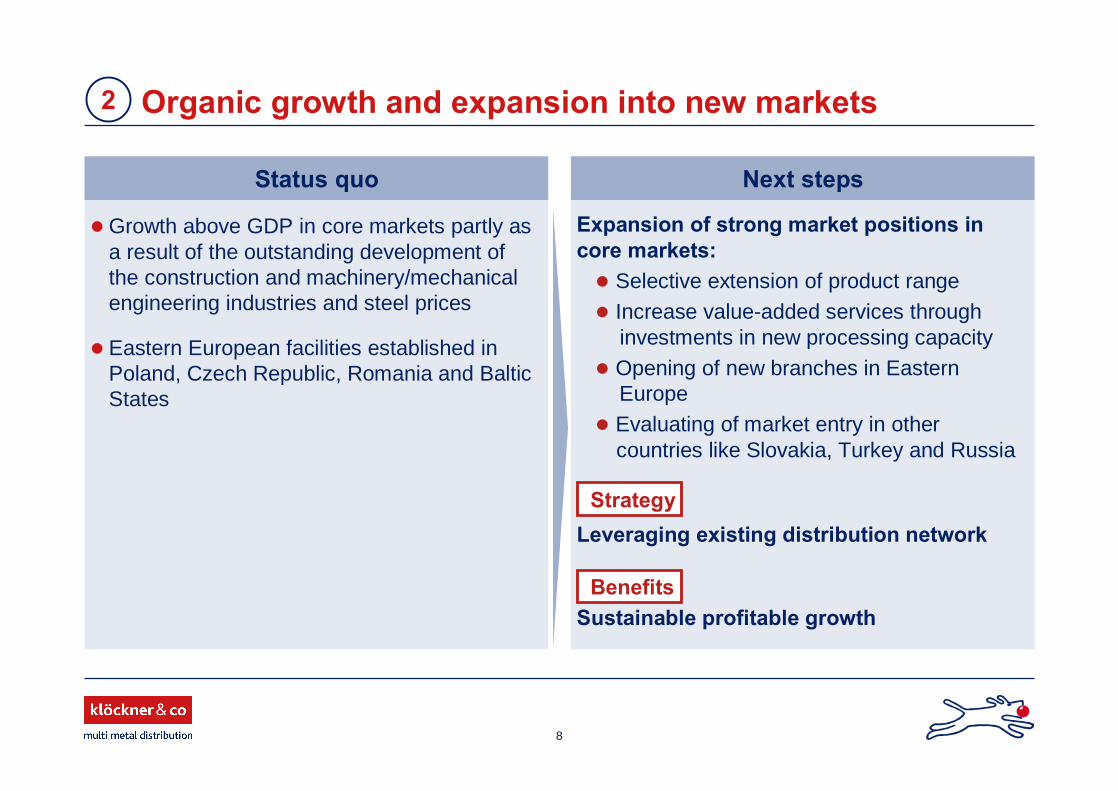
Growth above GDP in core markets partly as a result of the outstanding development of the construction and machinery/mechanical engineering industries and steel prices
Eastern European facilities established in Poland, Czech Republic, Romania and Baltic States
Organic growth and expansion into new markets2
Status quo Next steps
Expansion of strong market positions in core markets:
Selective extension of product range Increase value-added services through
investments in new processing capacity Opening of new branches in Eastern
Europe Evaluating of market entry in other
countries like Slovakia, Turkey and Russia
Leveraging existing distribution network
Sustainable profitable growth
Strategy
Benefits
9
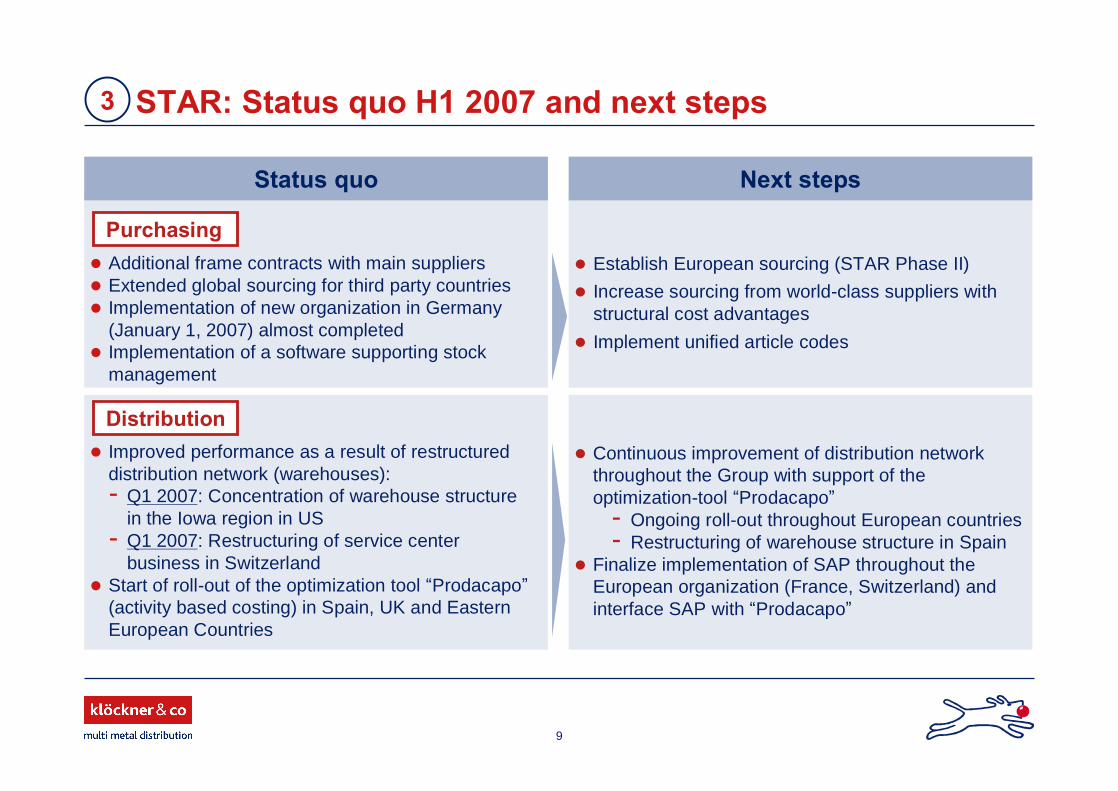
Next steps
STAR: Status quo H1 2007 and next steps3
Status quo
Establish European sourcing (STAR Phase II)
Increase sourcing from world-class suppliers with structural cost advantages
Implement unified article codes
Additional frame contracts with main suppliers Extended global sourcing for third party countries Implementation of new organization in Germany
(January 1, 2007) almost completed Implementation of a software supporting stock
management
Purchasing
Improved performance as a result of restructureddistribution network (warehouses):- Q1 2007: Concentration of warehouse structure
in the Iowa region in US- Q1 2007: Restructuring of service center
business in Switzerland Start of roll-out of the optimization tool �Prodacapo�
(activity based costing) in Spain, UK and Eastern European Countries
Continuous improvement of distribution network throughout the Group with support of the optimization-tool �Prodacapo�
- Ongoing roll-out throughout European countries- Restructuring of warehouse structure in Spain
Finalize implementation of SAP throughout the European organization (France, Switzerland) and interface SAP with �Prodacapo�
Distribution
10
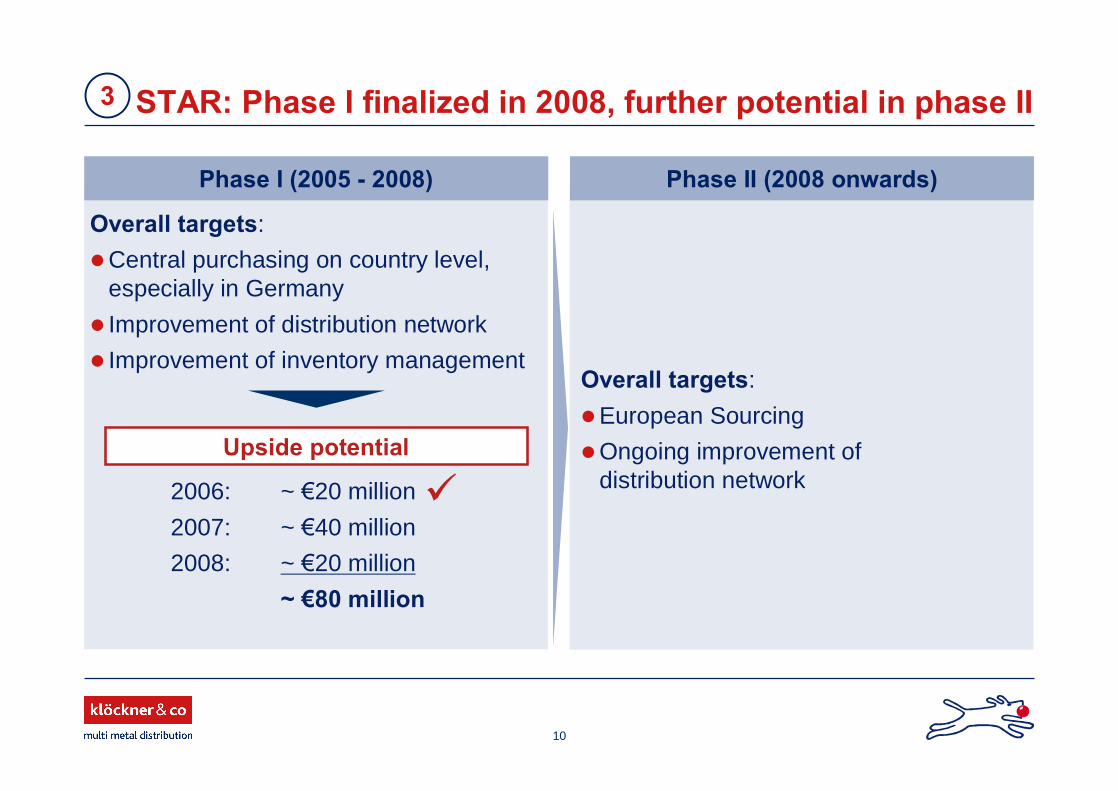
Phase II (2008 onwards)
STAR: Phase I finalized in 2008, further potential in phase II3
Phase I (2005 - 2008)
Overall targets:
Central purchasing on country level, especially in Germany
Improvement of distribution network
Improvement of inventory management
2006: ~ �20 million
2007: ~ �40 million
2008: ~ �20 million
~ �80 million
Upside potential
Overall targets:
European Sourcing
Ongoing improvement of distribution network
11
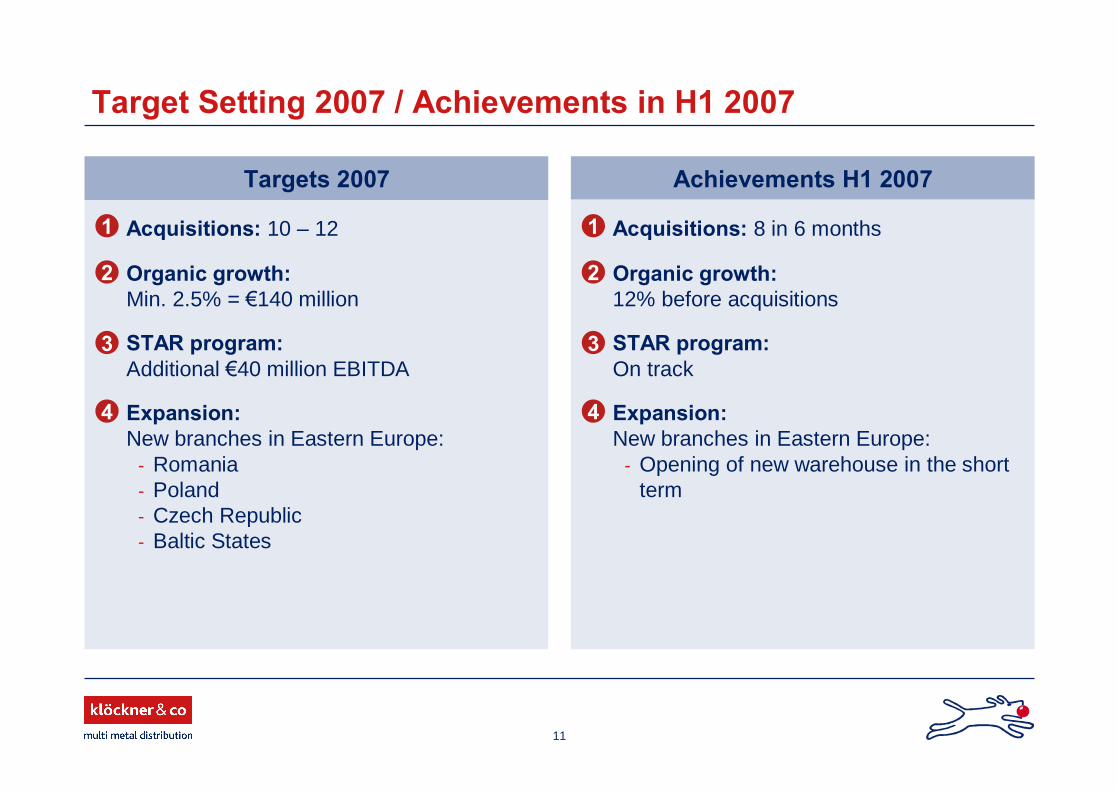
Target Setting 2007 / Achievements in H1 2007
Acquisitions: 10 � 12
Organic growth:Min. 2.5% = �140 million
STAR program:Additional �40 million EBITDA
Expansion:New branches in Eastern Europe:
- Romania- Poland- Czech Republic- Baltic States
Targets 2007 Achievements H1 2007
1
2
3
4
Acquisitions: 8 in 6 months
Organic growth:12% before acquisitions
STAR program:On track
Expansion:New branches in Eastern Europe:
- Opening of new warehouse in the short term
1
2
3
4
12
Agenda
1. Highlights H1 2007, market and strategyDr. Thomas Ludwig
2. Financials Q2/H1 2007 and outlookGisbert Rühl, CFO
Appendix
13
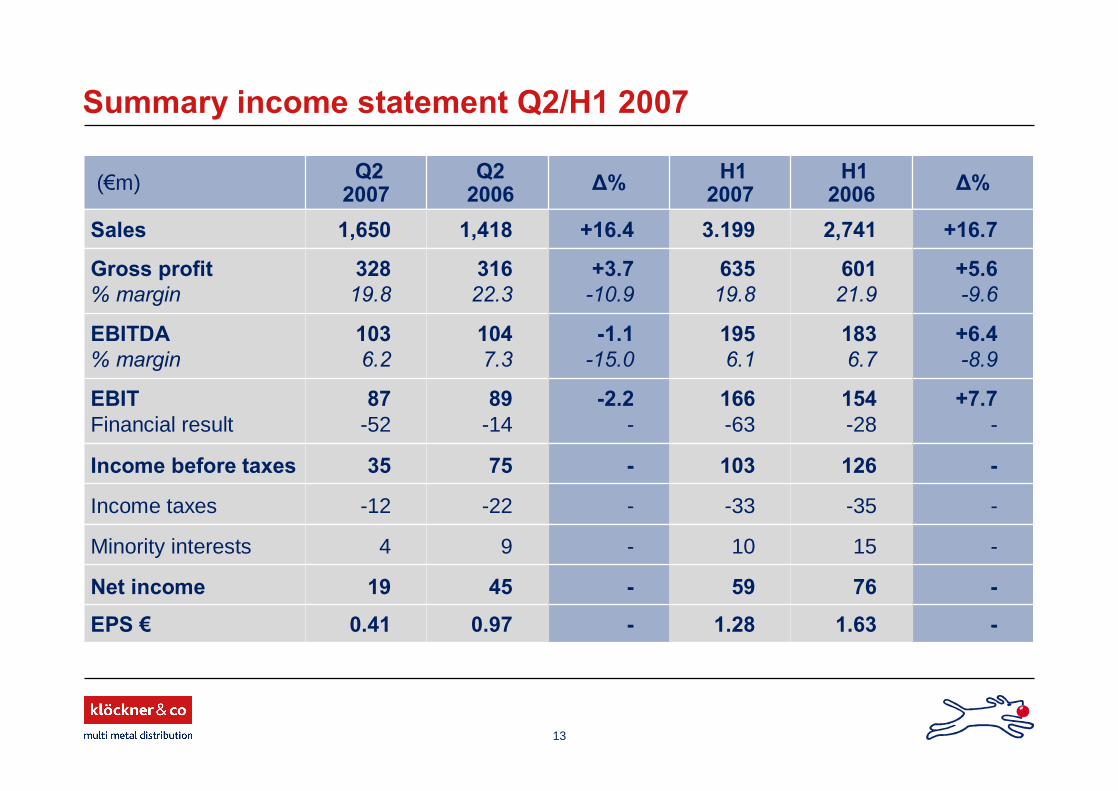
Summary income statement Q2/H1 2007
-126103-7535Income before taxes
--35-33--22-12Income taxes
-1510-94Minority interests
1.28
59
166-63
1956.1
63519.8
3.199
H1 2007
0.41
19
87-52
1036.2
32819.8
1,650
Q22007
-1.63-0.97EPS �
-76-45Net income
+5.6-9.6
60121.9
+3.7-10.9
31622.3
Gross profit% margin
89-14
1047.3
1,418
Q22006
+7.7-
154-28
-2.2 -
EBITFinancial result
+6.4-8.9
1836.7
-1.1-15.0
EBITDA% margin
+16.72,741+16.4Sales
Ä%H1 2006Ä%(�m)
14
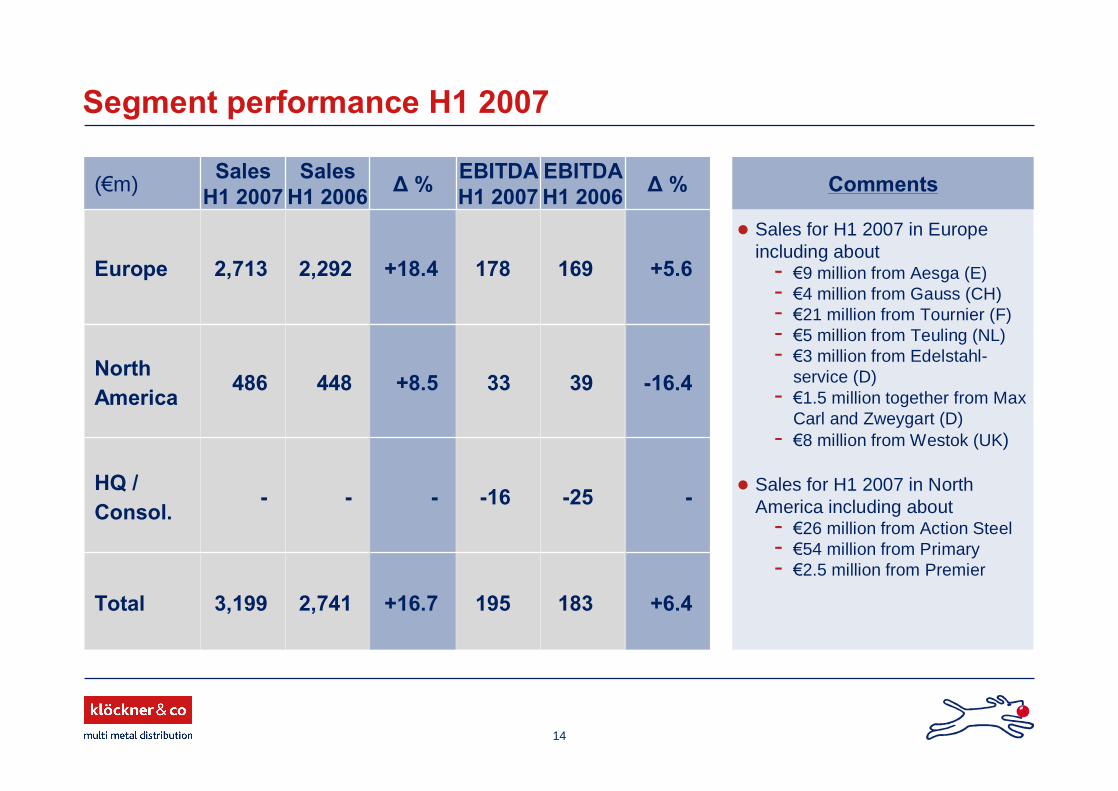
Segment performance H1 2007
Comments
Sales for H1 2007 in Europe including about
- �9 million from Aesga (E)- �4 million from Gauss (CH)- �21 million from Tournier (F)- �5 million from Teuling (NL)- �3 million from Edelstahl-
service (D)- �1.5 million together from Max
Carl and Zweygart (D)- �8 million from Westok (UK)
Sales for H1 2007 in North America including about
- �26 million from Action Steel- �54 million from Primary- �2.5 million from Premier
3,199
-
486
2,713
Sales H1 2007
+6.4183195+16.72,741Total
--25-16--HQ / Consol.
-16.43933+8.5448North America
+5.6169178+18.42,292Europe
Ä %EBITDAH1 2006
EBITDAH1 2007Ä %Sales
H1 2006(�m)
15
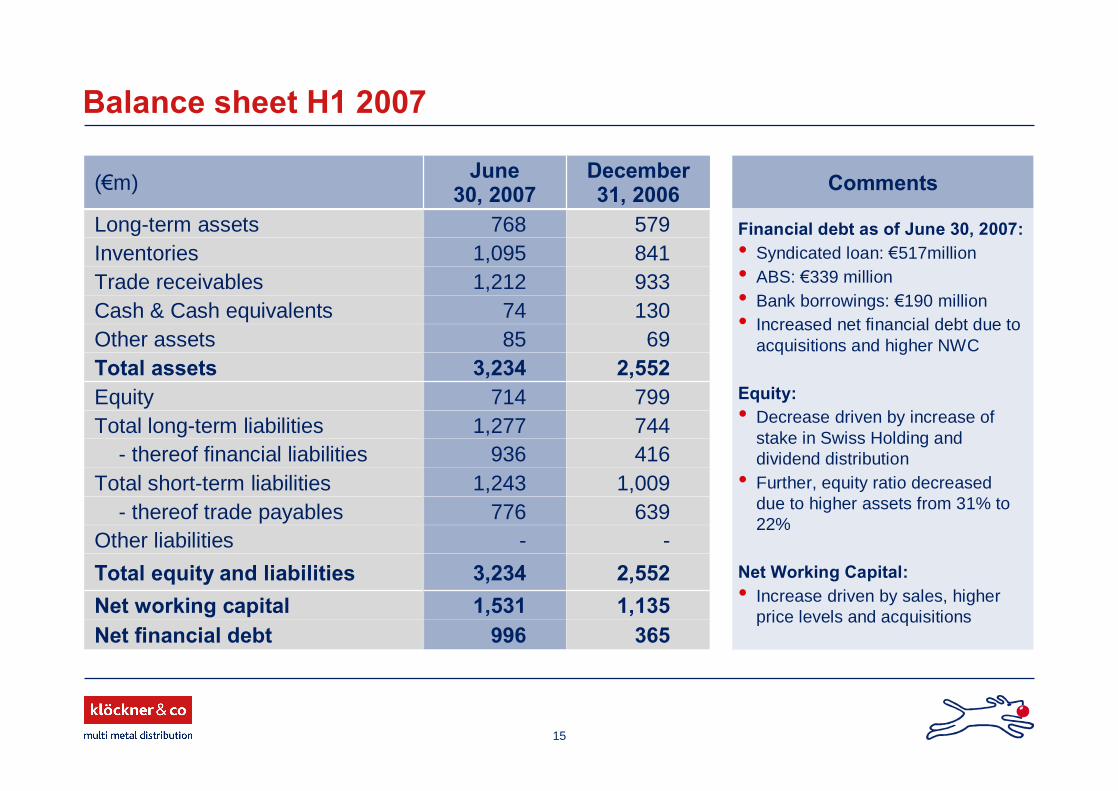
Balance sheet H1 2007
9961,5313,234
-776
1,243936
1,277714
3,2348574
1,2121,095
768
June30, 2007
933Trade receivables841Inventories579Long-term assets
130Cash & Cash equivalents69Other assets
639- thereof trade payables-Other liabilities
1,009Total short-term liabilities
744Total long-term liabilities799Equity
2,552Total assets
416- thereof financial liabilities
December31, 2006(�m)
2,552Total equity and liabilities
365Net financial debt1,135Net working capital
Comments
Financial debt as of June 30, 2007:� Syndicated loan: �517million� ABS: �339 million� Bank borrowings: �190 million� Increased net financial debt due to
acquisitions and higher NWC
Equity:� Decrease driven by increase of
stake in Swiss Holding and dividend distribution� Further, equity ratio decreased
due to higher assets from 31% to 22%
Net Working Capital:� Increase driven by sales, higher
price levels and acquisitions
16
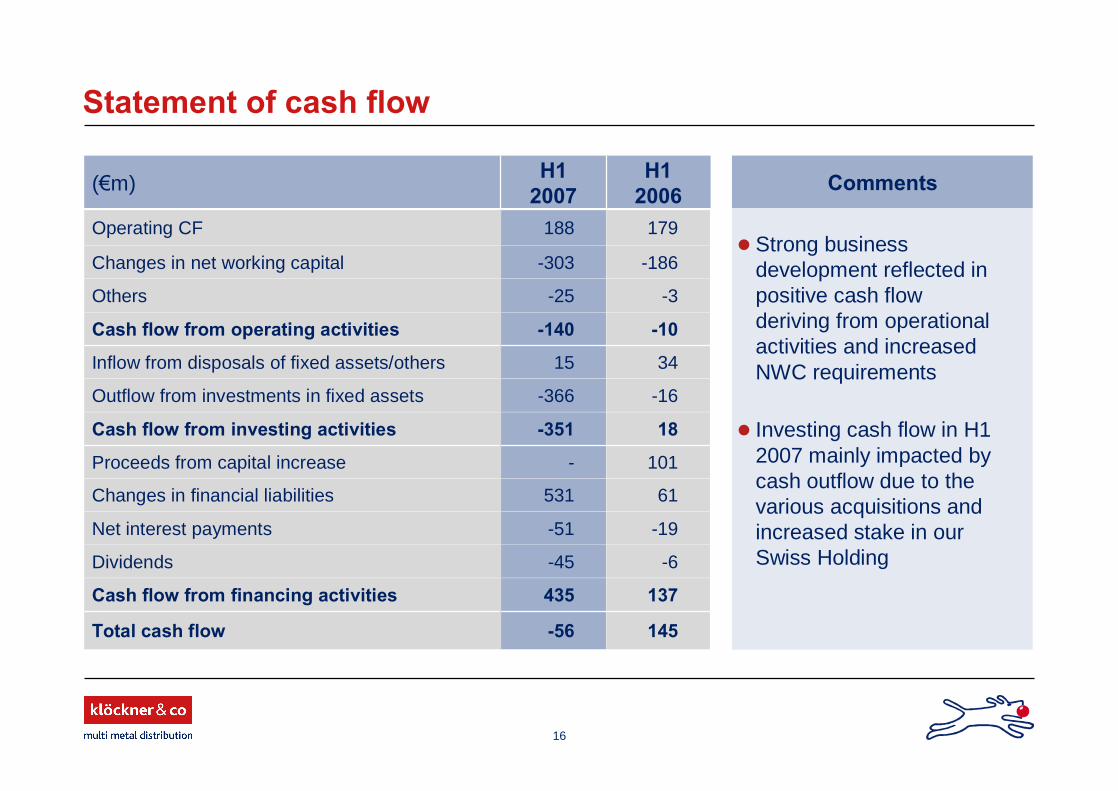
Statement of cash flow
Comments
101-Proceeds from capital increase
-3-25Others
-10-140Cash flow from operating activities
3415Inflow from disposals of fixed assets/others
-16-366Outflow from investments in fixed assets
18-351Cash flow from investing activities
-186-303Changes in net working capital
61531Changes in financial liabilities
179188Operating CF
145-56Total cash flow
137435Cash flow from financing activities
-6-45Dividends
-19-51Net interest payments
H12006
H12007(�m)
Strong business development reflected in positive cash flow deriving from operational activities and increased NWC requirements
Investing cash flow in H1 2007 mainly impacted by cash outflow due to the various acquisitions and increased stake in our Swiss Holding
17
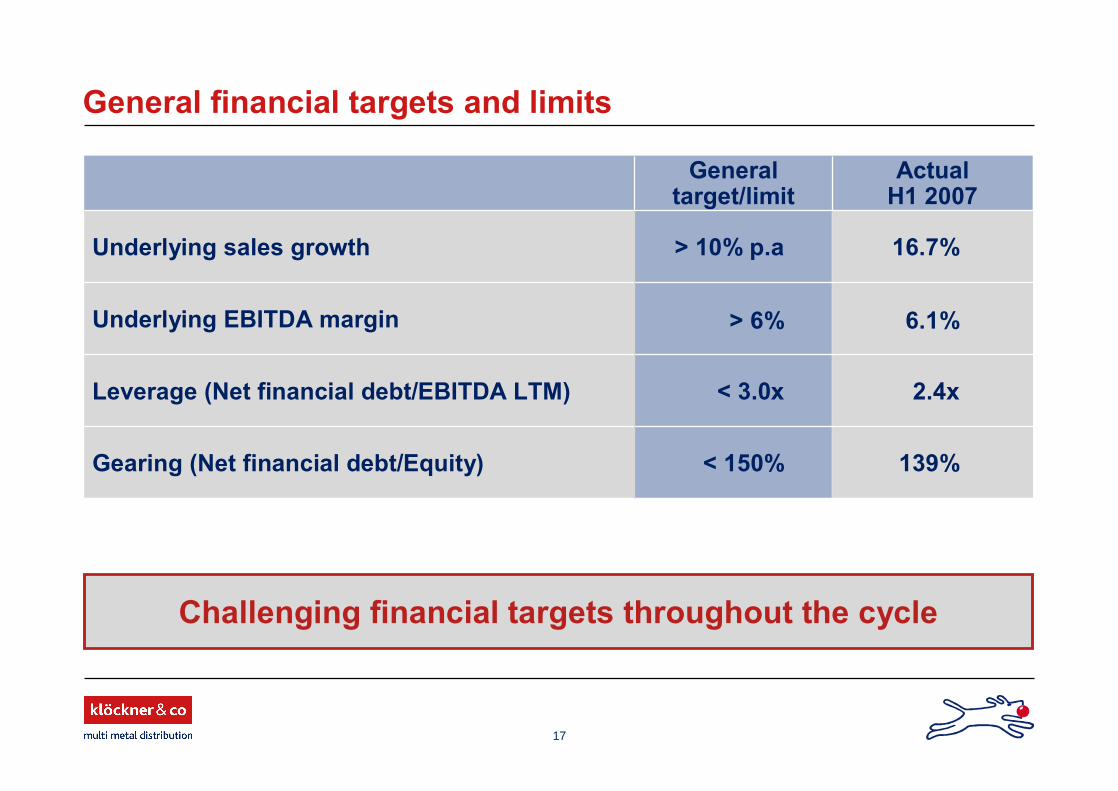
General financial targets and limits
139%< 150%Gearing (Net financial debt/Equity)
2.4x< 3.0xLeverage (Net financial debt/EBITDA LTM)
6.1%> 6%Underlying EBITDA margin
16.7%> 10% p.aUnderlying sales growth
ActualH1 2007
Generaltarget/limit
Challenging financial targets throughout the cycle
18
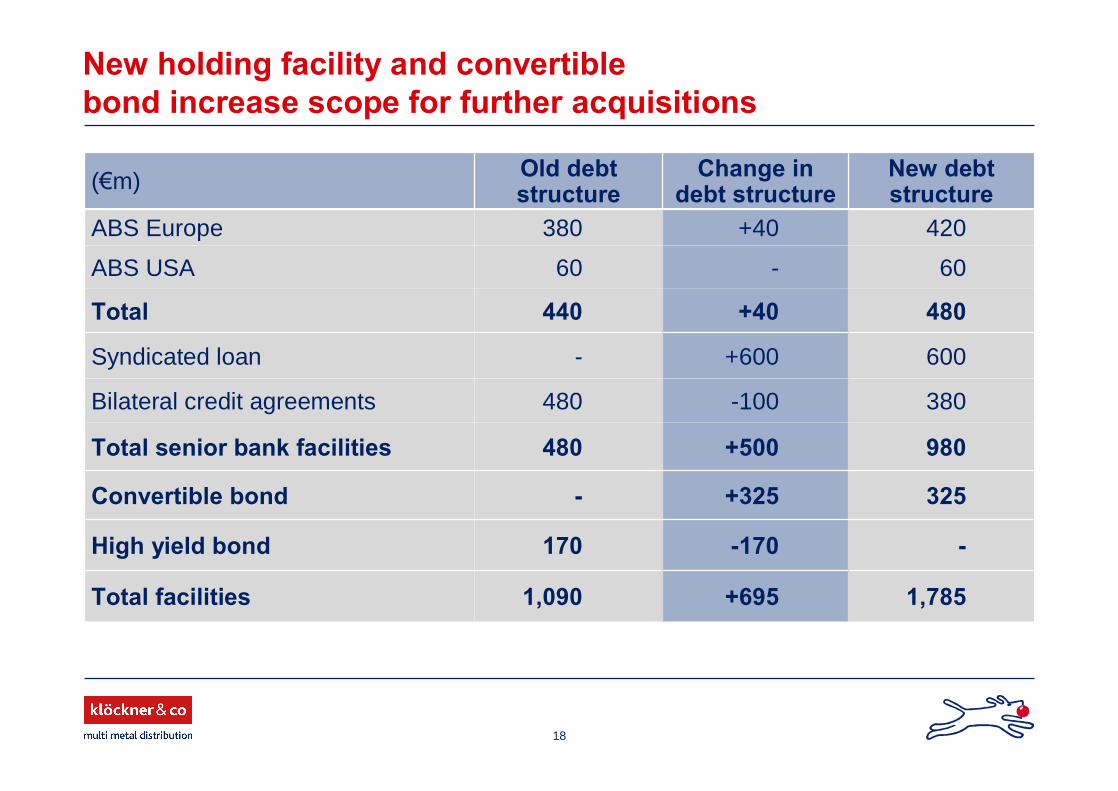
New holding facility and convertible bond increase scope for further acquisitions
325+325-Convertible bond
1,785+6951,090Total facilities
--170170High yield bond
980+500480Total senior bank facilities
380-100480Bilateral credit agreements
600+600-Syndicated loan
480+40440Total
60-60ABS USA
420+40380ABS Europe
New debtstructure
Change indebt structure
Old debtstructure(�m)
19
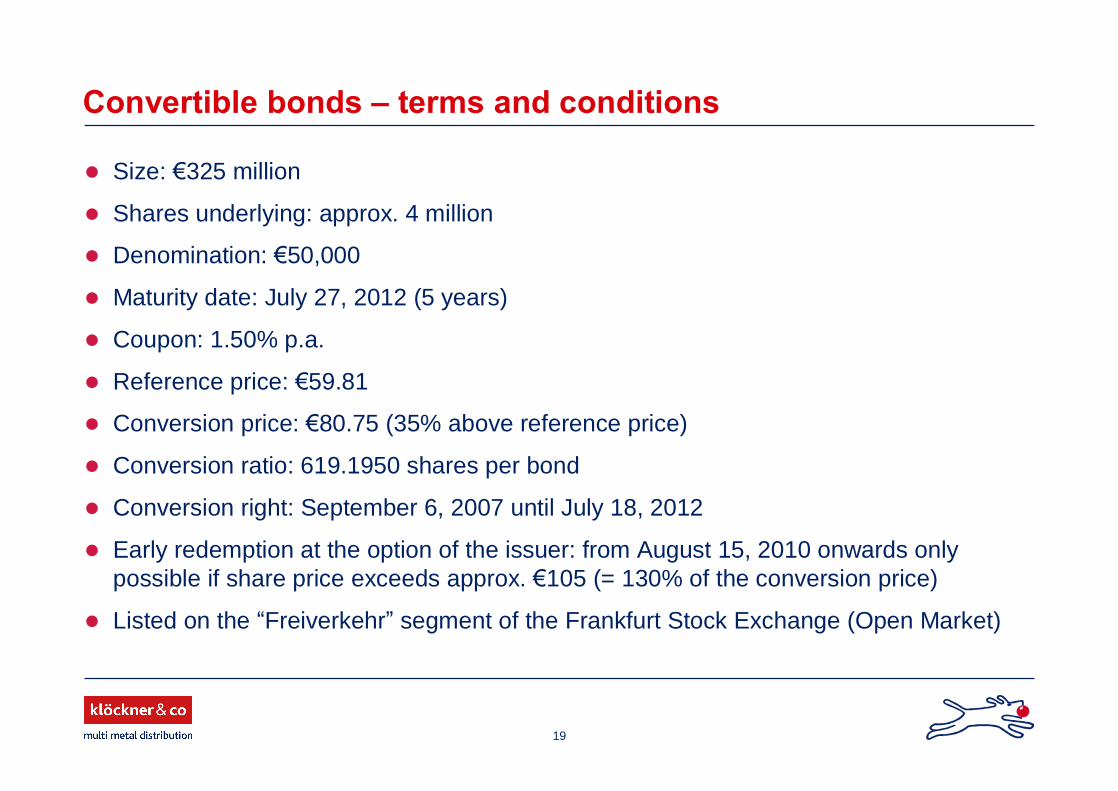
Convertible bonds � terms and conditions
Size: �325 million
Shares underlying: approx. 4 million
Denomination: �50,000
Maturity date: July 27, 2012 (5 years)
Coupon: 1.50% p.a.
Reference price: �59.81
Conversion price: �80.75 (35% above reference price)
Conversion ratio: 619.1950 shares per bond
Conversion right: September 6, 2007 until July 18, 2012
Early redemption at the option of the issuer: from August 15, 2010 onwards only possible if share price exceeds approx. �105 (= 130% of the conversion price)
Listed on the �Freiverkehr� segment of the Frankfurt Stock Exchange (Open Market)
20
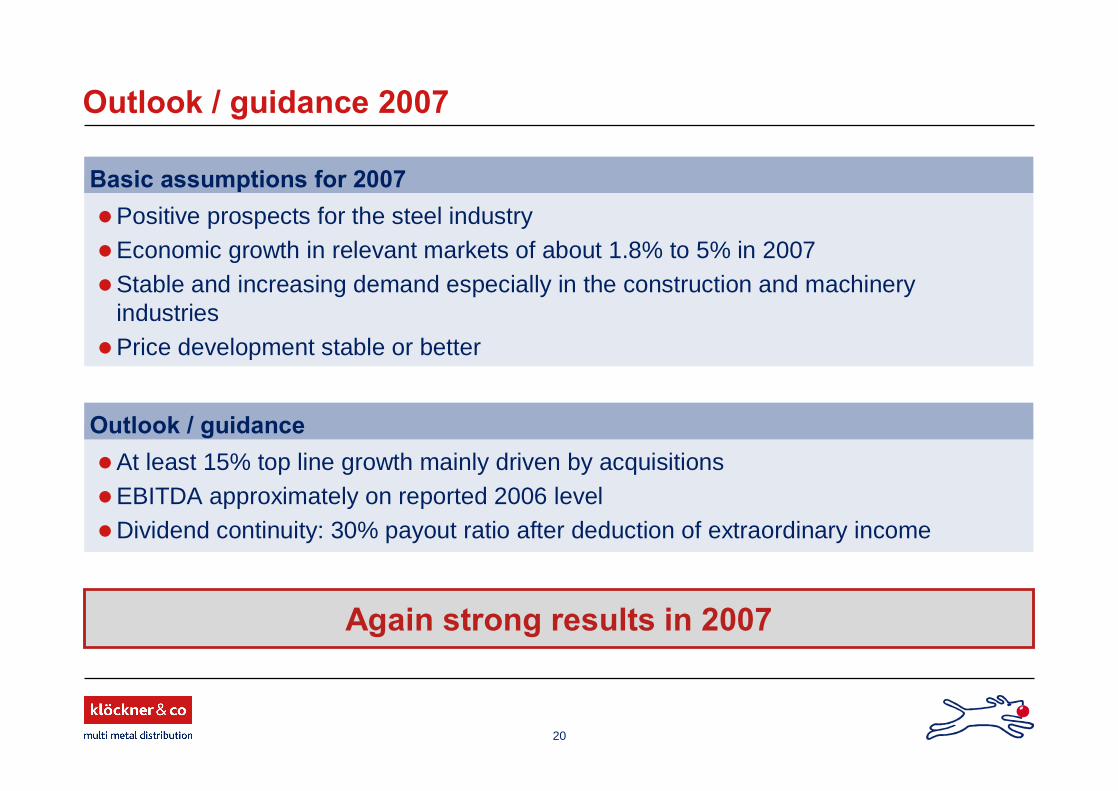
Outlook / guidance 2007
At least 15% top line growth mainly driven by acquisitions EBITDA approximately on reported 2006 levelDividend continuity: 30% payout ratio after deduction of extraordinary income
Positive prospects for the steel industryEconomic growth in relevant markets of about 1.8% to 5% in 2007Stable and increasing demand especially in the construction and machinery
industriesPrice development stable or better
Basic assumptions for 2007
Outlook / guidance
Again strong results in 2007
21
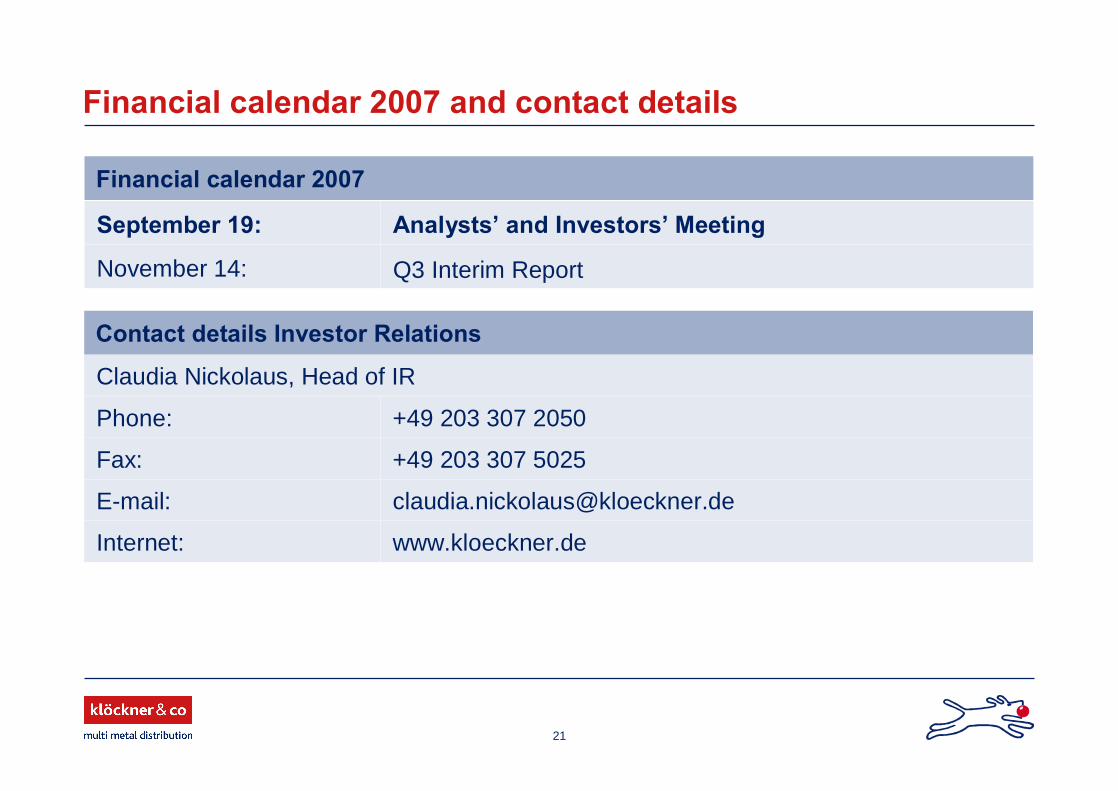
Q3 Interim ReportNovember 14:
Analysts� and Investors� MeetingSeptember 19:
Financial calendar 2007 and contact details
Financial calendar 2007
www.kloeckner.deInternet:
+49 203 307 5025Fax:
+49 203 307 2050Phone:
Claudia Nickolaus, Head of IR
Contact details Investor Relations
22
Agenda
1. Highlights H1 2007, market and strategyDr. Thomas Ludwig
2. Financials Q2/H1 2007 and outlookGisbert Rühl, CFO
Appendix
23
Appendix
Table of contents
Quarterly results 2007/2006 and FY results 2006/2005
Primary Steel
Acquisitions in Germany
24
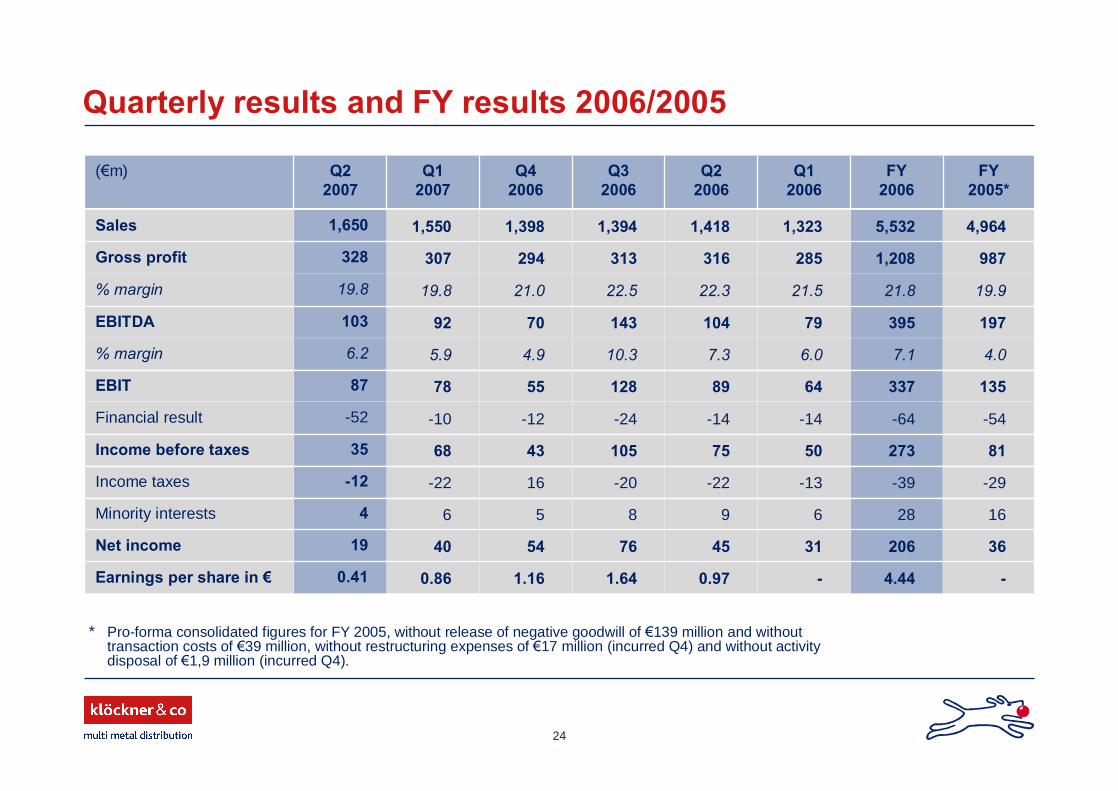
812735075105436835Income before taxes
-29-39-13-22-2016-22-12Income taxes
1628698564Minority interests
0.41
19
-52
87
6.2
103
19.8
328
1,650
Q22007
-4.44-0.971.641.160.86Earnings per share in �
362063145765440Net income
-54-64-14-14-24-12-10Financial result
13533764891285578EBIT
4.07.16.07.310.34.95.9% margin
197395791041437092EBITDA
19.921.821.522.322.521.019.8% margin
9871,208285316313294307Gross profit
4,9645,5321,3231,4181,3941,3981,550Sales
FY2005*
FY2006
Q12006
Q22006
Q32006
Q42006
Q12007
(�m)
Quarterly results and FY results 2006/2005
* Pro-forma consolidated figures for FY 2005, without release of negative goodwill of �139 million and without transaction costs of �39 million, without restructuring expenses of �17 million (incurred Q4) and without activity disposal of �1,9 million (incurred Q4).
25
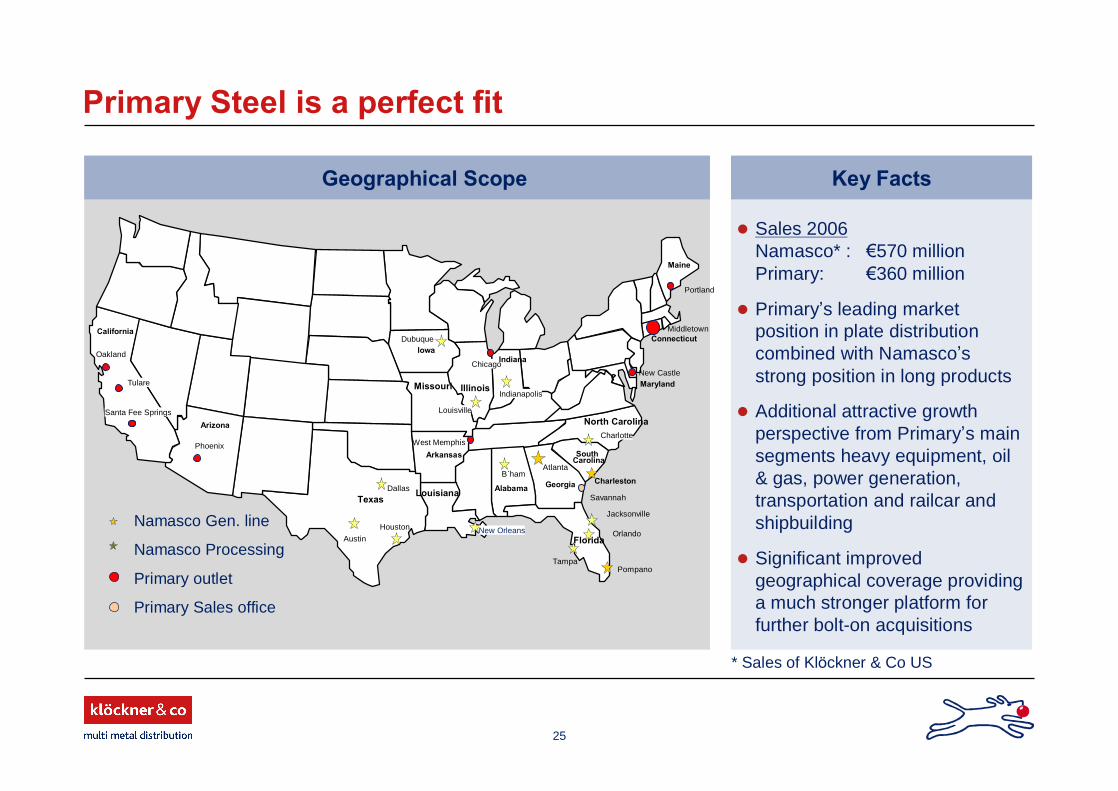
Primary Steel is a perfect fit
Key Facts
Sales 2006Namasco* : �570 million Primary: �360 million
Primary�s leading market position in plate distribution combined with Namasco�s strong position in long products
Additional attractive growth perspective from Primary�s main segments heavy equipment, oil & gas, power generation, transportation and railcar and shipbuilding
Significant improved geographical coverage providing a much stronger platform for further bolt-on acquisitions
Geographical Scope
* Sales of Klöckner & Co US
Primary outlet
Primary Sales office
Namasco Gen. line
Namasco Processing
Oakland
Houston
Missouri
Chicago
Tampa
CharlotteArizona
Arkansas
Iowa
Alabama Georgia
South Carolina
North Carolina
Indiana
Maryland
Maine
Connecticut
Florida
Louisiana
Illinois
Texas
CaliforniaDubuque
Louisville
Indianapolis
AtlantaB´ham
CharlestonDallas
AustinNew Orleans
Jacksonville
Orlando
Pompano
Phoenix
Santa Fee Springs
Tulare
West Memphis
Savannah
Portland
Middletown
New Castle
26
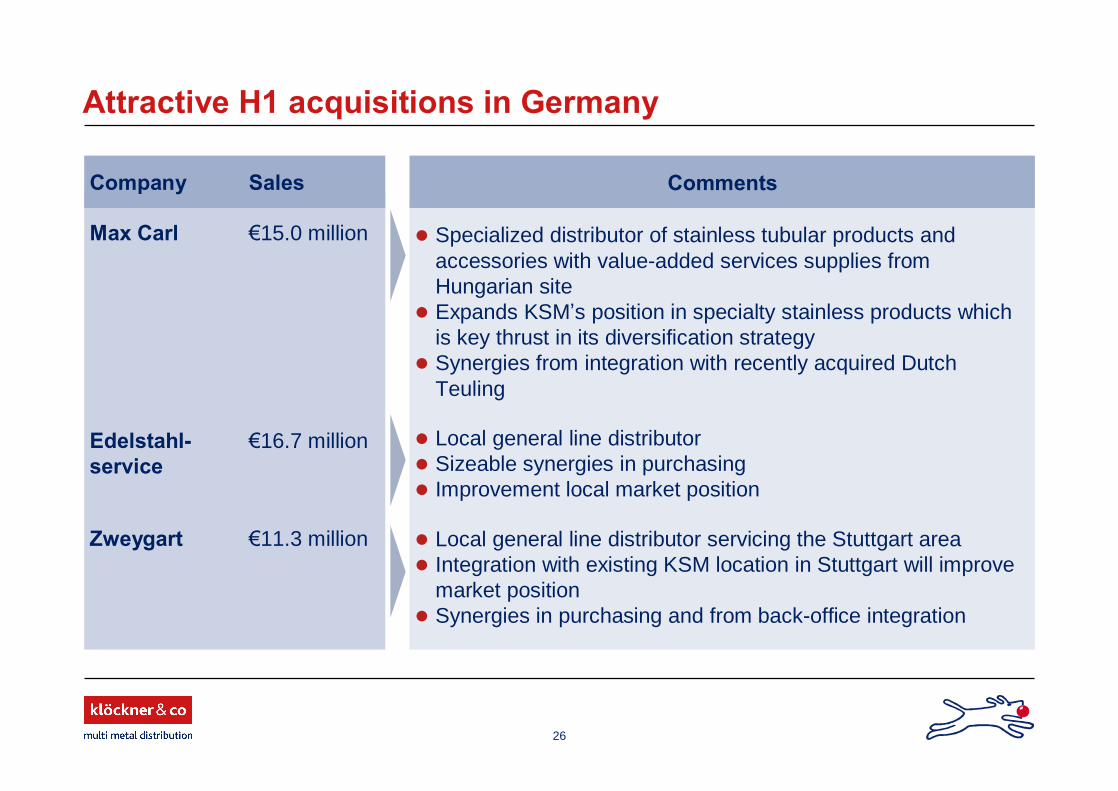
Company Sales
Attractive H1 acquisitions in Germany
Specialized distributor of stainless tubular products and accessories with value-added services supplies from Hungarian site
Expands KSM�s position in specialty stainless products which is key thrust in its diversification strategy
Synergies from integration with recently acquired Dutch Teuling
Local general line distributor Sizeable synergies in purchasing Improvement local market position
Local general line distributor servicing the Stuttgart area Integration with existing KSM location in Stuttgart will improve
market position Synergies in purchasing and from back-office integration
Comments
Max Carl �15.0 million
Edelstahl- �16.7 millionservice
Zweygart �11.3 million
27
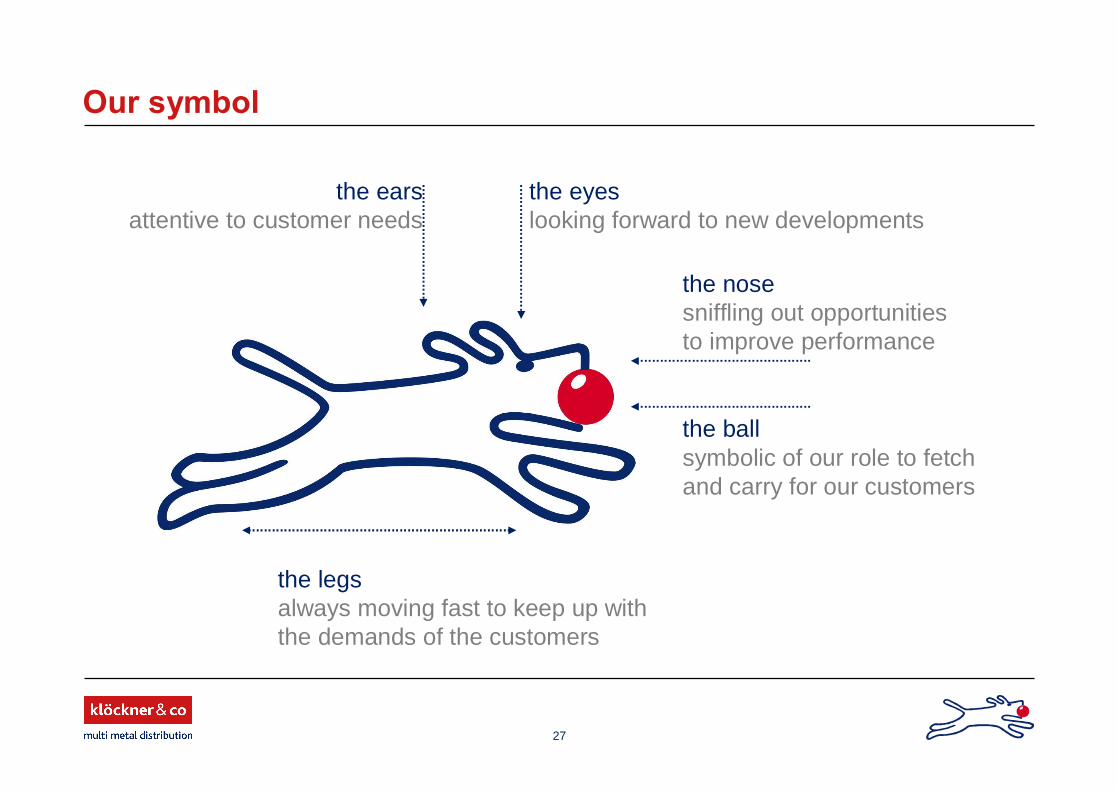
Our symbol
the earsattentive to customer needs
the eyeslooking forward to new developments
the nosesniffling out opportunitiesto improve performance
the ballsymbolic of our role to fetchand carry for our customers
the legsalways moving fast to keep up withthe demands of the customers
28
Disclaimer
This presentation contains forward-looking statements. These statements use words like "believes, "assumes," "expects" or similar formulations. Various known and unknown risks, uncertainties and other factors could lead to material differences between the actual future results, financial situation, development or performance of our company and those either expressed or implied by these statements. These factors include, among other things:
Downturns in the business cycle of the industries in which we compete; Increases in the prices of our raw materials, especially if we are unable to pass these costs
along to customers; Fluctuation in international currency exchange rates as well as changes in the general
economic climateand other factors identified in this presentation.In view of these uncertainties, we caution you not to place undue reliance on these forward-looking statements. We assume no liability whatsoever to update these forward-looking statements or to conform them to future events or developments.