WELTEC AND WHITIREIA · 2018-05-17 · WelTec and Whitireia are committed to doing the very best...
154
20 17
Transcript of WELTEC AND WHITIREIA · 2018-05-17 · WelTec and Whitireia are committed to doing the very best...

20 17

2 ANNUAL REPORT 2017

WELTEC AND WHITIREIA 3
CONTENTSVision 6
Key Statistics 8
FOREWORD
Council Chair 12
Governance 14
Chief Executive 16
Academic 26
Research and Innovation 27
Equal Education Opportunities 28
Our People 30
STATEMENT OF SERVICE PERFORMANCE
Outcomes Reporting 36
Business Plan Performance 46
Investment Plan Performance Commitments 58
FINANCIAL STATEMENTS WELTEC
Statement of Comprehensive Income 68
Statement of Changes in Equity 69
Statement of Financial Position 70
Statement of Cash Flows 71
Notes to the Financial Statement 72
Statement of Compliance and Responsibility 95
FINANCIAL STATEMENTS WHITIREIA
Statement of Financial Performance 98
Statement of Comprehensive Income 99
Statement of Changes in Equity 100
Statement of Financial Position 101
Statement of Cash Flows 102
Reconcilliation from The Net Surplus /(Deficit) to the Net Cash Flows From Operations 103
Notes to the Financial Statement 104
Statement of Compliance and Responsibility 132
OTHER FINANCIAL INFORMATION
Compulsory Student Services Levy Whitireia 136
Compulsory Student Services Levy WelTec 138
Te Whare Ako Financial Summary 140
Whitireia Community Polytechnic Childcare Centre 141
INDEPENDENT AUDITOR'S REPORT 144
ACRONYMS 150


Vision WHAKAKITENGA
Learning together. Transforming lives
Te ako ngātahi. Te whakaahua kētanga o te tangata
Distinctiveness AHUREITANGA
We are about the people of this place and we have special relationships with local Iwi: WelTec with Te Ātiawa and Whitireia with Ngāti Toa. Together, we are more than the sum of our parts.
Mā tātou, mō tātou Ko WelTec ki Te Ātiawa, ko Whitireia ki Ngāti Toa. E haere kōtui nei me kura-takahi-puni tātou.
Values NGĀ KAUPAPA E WHĀ
A sense of belonging for all learners Whakapapa
Connected through partnerships Whānaungatanga
Supporting, growing, challenging Manaaki
Doing things the right way, according to values Tikanga
Goals NGĀ WHAINGĀ
By 2021, the WelTec and Whitireia whānau will be dynamic, innovative providers of vocational education, fully integrated with the community, supporting learners to engage in their first jobs, to upskill to change roles, and to learn for life.
Whole of personPartnering through the learning and career journey. Helping learners to increase their contribution to society.
Whole of learning frameworkProviding relevant, high quality programmes and services to meet the needs of industry and the community.
Whole of communityCollaborating with and contributing to Iwi, industry, secondary schools, Pasifika and the wider community.
Whole of placeEngaging with people across the country and across the world to ensure our programmes and services are relevant, portable and high-quality.
Whole of systemTaking a system-wide perspective to the delivery of coherent, effective and efficient learning services.

EFTS by School
School of Hospitality and Tourism
360331
School of Information Technology
442
375
School of Learner Journey
55
109
School of Social Services
459466
School of Business
495554
School of Construction
677
144
School of Creativity
302
377
School of Engineering
866123
School of Health
90838
Te Wānanga Māori
123
30:70 60:40Student Gender Ratio WelTec Whitireia
Total number of Programmes
Students by Qualification Level (students can have multiple contracts for study)
Total headcount and Total EFTS
134
271
137
4133
6451
Levels
1-5
306
552
Level
6
1369
1750
Level
7
32
528
Level
8
17
69
Level
9
Key Statistics WelTec Whitireia
3746 3440
7850
6194
Headcount EFTS

Certificate Diploma Graduate Certificate /DiplomaBachelor Post Graduate Masters
1510
308
336
154
17
2325 Qualifications
awarded
957
147
275
387
300
11
2077 Qualifications
awarded
Number of Qualifications Awarded
WelTec Whitireia
WelTec Whitireia
Student Age Profile
15 or less
6035
34 139
1164 1168
519 593
98 81
4213
16-30 31-45 46-60 61 plus
Student Ethnicity (students can identify as up to three ethnicities)
Māori
Pacific
NZ European
Asian
Other
28
7
26
0
1614 1807
4678 2626
704 1104
1361 1131

Highest Secondary School Qualification
WelTec
1412
1174
2136
784
634
1224
153 100
233
7850
Whitireia
983401
305
425
986
666465
1834
129
6194
no formal secondary school qualification
14 or more credits at any level
NCEA Level 1 or School Certificate
NCEA Level 2 or 6th Form Certificate
NCEA Level 3 or bursary or Scholarship
University Entrance
Overseas qualification (includes International Baccalaureate & Cambridge Exams)
Other
Unknown
New student enrolments direct from secondary school by headcount
1810
1703
7850 total learners
6194 total learners
Wellington region New Zealand
WelTec and Whitireia contribution to Gross Domestic Product (GDP)1
$128.3M
$94.7M
WelTec and Whitireia contribution to the economy: FTEs2
1,296974
Proportion of graduates in employment and/or further study
90%91%
WelTec Whitireia
WelTec Whitireia
1 Business and Economic Research Ltd 2 Whitireia and WelTec's direct employment is estimated to have generated total employment of 974 positions regionally and 1296 nationally.

Learner Home Location
Auckland / Northland 345 931
Central North Island 1109 427
Kāpiti Coast 266 579
Upper Hutt 750 172
Porirua 451 1326
Wairarapa 190 43
Lower Hutt 2304 415
Wellington 1987 1144
South Island 387 202
Student Achievement Component (SAC) Results
Course completion
Qualification completion
Retention
Progression
79%
85%
82%
67%
75%
40%
27%
78%
WelTec Whitireia
EFTS Funding Type
SAC Level 3+* 2069 1910
International 631 1058
ITO off job training 511 0
Youth Guarantee 124 113
STAR funded student 113 18
MPTT Level 3-4* 100 55
Competitive Level 1-2* 87 126
Trades Academy 69 33
Domestic full fee paying students 21 44
ACE 16 74
DualPathways 3 4
ICT Graduate School* 2 3
English for Migrants 0 1
Total EFTS** 3746 3440
*All SAC** 2257 2094
WelTec Whitireia
** Difference due to EFTS rounding

12 ANNUAL REPORT 2017
council chair forewordForeword from Greg Campbell Chair of the Combined Council of Whitireia Community Polytechnic and the Wellington Institute of Technology
Ngā mihi o te Tau Hou kia koutou katoa. Me para te huarahi hei hikoitanga mo tātou katoa.
Welcome to the 2017 Annual Report for the Wellington Institute of Technology and Whitireia Community Polytechnic, my first as the Chair of the Combined Council of our institutions.
It was with great pleasure that I accepted the Ministerial appointment as Chair in June 2017. I was warmly welcomed by the two great Iwi of our region - Te Ātiawa and Ngāti Toa Rangatira at official ceremonies including Pōwhiri at Takapūwāhia Marae and Mihi Whakatau at Petone. I then undertook a whirlwind tour of our campuses across the Wellington region and in Auckland. What has struck me during these visits is the dedication and professionalism of our teaching and support staff, and the high quality and skills of our students showcased at the graduations and student events I have attended. Whitireia and WelTec make a difference to the lives of many tens of thousands of students who are pursuing a vocational qualification. Learning together. Transforming lives is a very apt vision for our institutions.
WelTec and Whitireia are committed to doing the very best for our rangatahi and the communities we serve. We have a collective responsibility to ensure that students who graduate with a Whitireia or WelTec qualification are in the best place to achieve all they can in their lives armed with new skills and
qualifications. It is my role as Chair, and that of the Council, to ensure the appropriate governance is in place so that our goals and aspirations are achieved.
The new Government with a different approach to tertiary education presents many opportunities to Institutes of Technology and Polytechnics. What we do as vocational learning providers is fundamental to driving a productive New Zealand economy. Figures provided by BERL3 show that WelTec and Whitireia combined generated a total of $162.6M expenditure in the Wellington regional economy and $211.6M in the national economy in 2017. Similarly, this expenditure generated a total of $94.7M in GDP (i.e. value added) in the regional economy and $128.3M in the national economy.
Even more significant is the broader economic and social contribution to the Wellington region and to New Zealand as our graduates are recruited to work for many national and international companies. Our 2017 graduate destination data also backs this up with 91% of WelTec graduates and 90% of Whitireia graduates with a qualification gaining employment and/or enrolling in further study4.
3. Business and Economic Research Ltd 4. Based on 2017 graduation destination data where graduates are surveyed 6 to 9 months following completion of a qualification at WelTec or Whitireia.
WELTEC AND WHITIREIA 13
In this Annual Report you will read about our financial performance. Whilst a disappointing result I am confident that with the new strategies and action plans we are developing and will be pursuing we will return the institutions to modest surpluses by December 2019 and strengthened financial viability by 2020. I am convinced that these plans along with a more focused strategic direction will ensure our return to financially strong institutions. I am also determined that the place of tertiary vocational education is not marginalised and that delivery is further enabled for the communities we serve. Skilled tradespeople, technicians, nurses, engineers and all the occupational groups we train are key to a functioning economy.
Along with others in the sector we are currently talking to the Government to reinforce the important role vocational education and training plays in the New Zealand economy. In the meantime, our concern is that we continue to deliver high quality programmes that give our students the skills they need. This is particularly important in the current economic climate.
The year 2017 also saw a renewed focus on health, safety and sustainability. With the enactment of new legislation our institutions faced a myriad of compliance requirements which we prioritised and proactively and systematically addressed throughout the year. Our facilities mirror the work environments our graduates enter - we are a restaurant, a construction site, a roading operation, an engineering workshop, an electrical business, a radio studio, a hospital and a child care centre.
At a governance level we focused on our obligations and responsibilities and worked hard to ensure safe places of learning for our students and staff. We remain committed to upholding the health and safety of staff, students, contractors and visitors to be of the utmost importance and we are dedicated to providing a safe and healthy environment ensuring compliance with all relevant legislative and regulatory requirements.
I would like to formally thank and recognise outgoing Chair Hon Roger Sowry who initiated the Strategic Partnership between Whitireia and WelTec and who was responsible for several significant capital projects during his time as Chair including the New Zealand Centre for Culinary and Hospitality Excellence – the joint campus in central Wellington with Le Cordon Bleu; the refurbishment of the Auckland campus, the completion of the first phase of the Wellington Regional School of Construction at Petone; and the major extension of Wikitoria Katene to house the latest simulation suite technology and which provides an integrated learning approach for health students in a state-of-the-art health building at the Porirua campus; and finally the construction of Te Kāhui Auaha which firmly establishes a New Zealand Institute of Creativity on Cuba/Dixon Streets. Roger continues his involvement with WelTec and Whitireia as a Trustee for Te Auaha.
Thank you to my fellow colleagues on Council – Deputy Chair Vaughan Renner, Dame Fran Wilde, Dr Deborah Hume, Dr Kabini Sanga, Antony Royal, Jackie Lloyd, and Nancy McIntosh-Ward for
your contribution and passion for tertiary vocational education and our institutions.
I would also like to recognise the contribution of Chief Executive Chris Gosling who guided our institutions and represented Institutes of Technology and Polytechnics through his business and education roles nationally, including being a member of the Council of Business Central. My thanks to the management and staff of Whitireia and WelTec who, throughout the year demonstrated their passionate commitment to our students and the communities we serve.
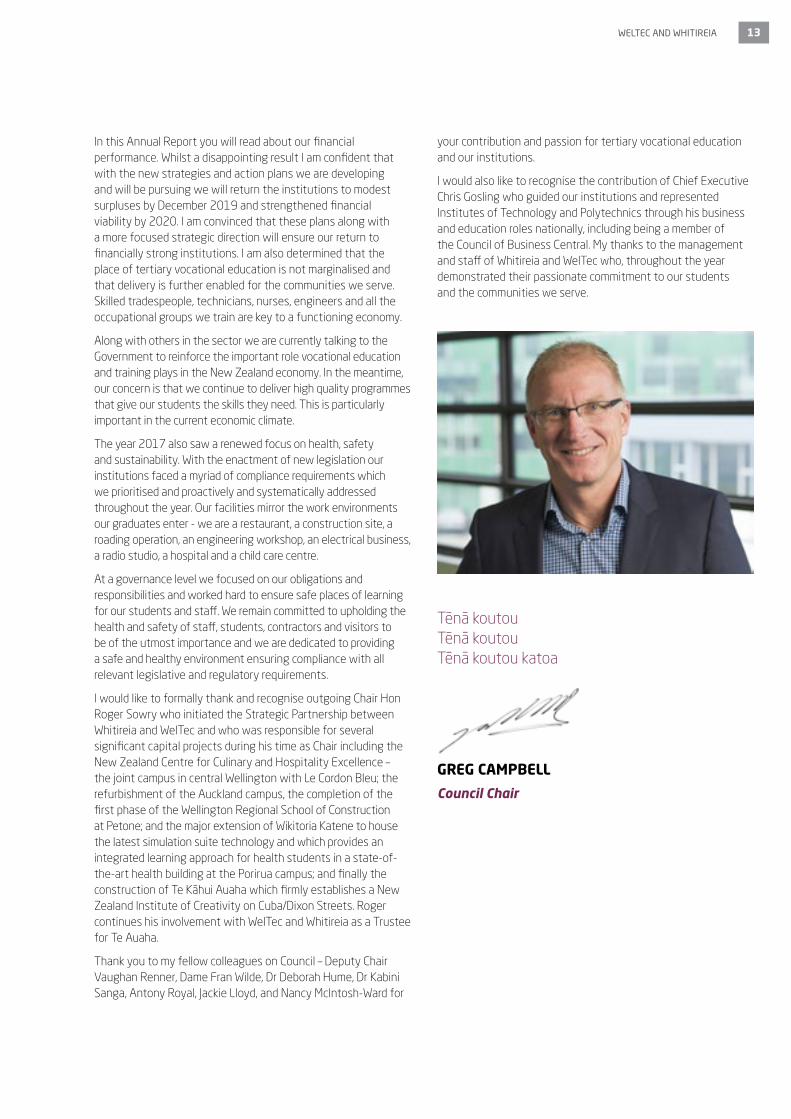
Tēnā koutou Tēnā koutou Tēnā koutou katoa
GREG CAMPBELL
Council Chair

14 ANNUAL REPORT 2017
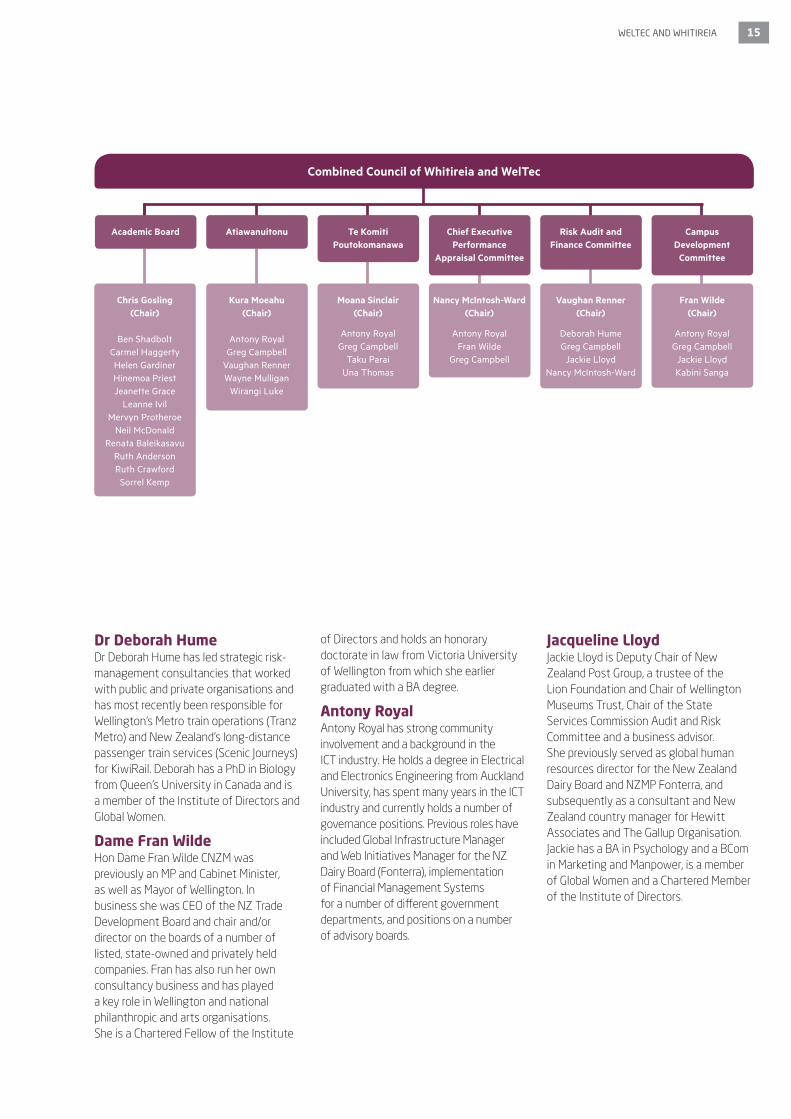
THE COUNCIL COMPRISES EIGHT MEMBERS
The subcommittees of the Council are Risk Audit and Finance; Campus Development; Chief Executive Performance Appraisal; and the Combined Academic Board.
There are two Iwi advisory groups to Council. They are Atiawanuitonu (Te Ātiawa) and Te Komiti Poutokomanawa (Ngāti Toa).
Greg CampbellCouncil Chair
Greg Campbell is Chief Executive of the Greater Wellington Regional Council. He has extensive experience in the private sector, including Chief Marketing Officer at Vodafone New Zealand and senior executive roles with The New Zealand Guardian Trust Company and ANZ Bank. Mr Campbell’s governance experience includes five years as council member of Auckland University of Technology and four years as a Director of Vodafone New Zealand.
Vaughan RennerDeputy Chair
Vaughan Renner has an MBA, and science and engineering qualifications. He is self-employed and has strong commercial, strategic planning and IT skills. Vaughan has a background in governance (currently including Westlake Governance Limited, Business Central, Business NZ, and Standards New Zealand). He is a member of the Institute of Directors. He was appointed as Deputy Chair of The Open Polytechnic of New Zealand in 2014.
Nancy McIntosh-WardNancy holds an MBA and is a Chartered Accountant. She is the former Chief Executive of the Karori Sanctuary Trust and has extensive financial, management, commercial, governance, tertiary education and marketing experience. She is currently a consultant specialising in strategy development to delivery. Nancy is a member of the Institute of Directors.
Dr. Kabini SangaKabini Sanga MNZM is an Associate Professor of Education in the Faculty of Education at Victoria University of Wellington. He holds a Doctor of Philosophy from the University of Sasketchewan, Canada. He did his early university education at the University of South Pacific, Fiji. Kabini has held a number of senior roles in education, including being the Director of the Institute of Education of the University of the South Pacific; the Director and Chief Executive Officer of the Solomon Islands College of Education, and the Chief Education Officer, Solomon Islands Ministry of Education.
governance
2017 Council of Whitireia and WelTec. Left to right back: Fran Wilde, Antony Royal, Chris Gosling (Chief Executive), Dr Kabini Sanga, Nancy McIntosh-Ward. Front: Jackie Lloyd, Greg Campbell (Chair), Vaughan Renner (Deputy Chair), Dr Deborah Hume
In 2017 we were saddened to lose a long time member of the former Whitireia Council and Kaumatua of Ngāti Toa Rangatira, Te Akapikirangi Arthur. Aka was a member of the Whitireia Council from 2000 to 2014 and was well known to members of the Whitireia whānau.
WELTEC AND WHITIREIA 15
Dr Deborah HumeDr Deborah Hume has led strategic risk-management consultancies that worked with public and private organisations and has most recently been responsible for Wellington’s Metro train operations (Tranz Metro) and New Zealand’s long-distance passenger train services (Scenic Journeys) for KiwiRail. Deborah has a PhD in Biology from Queen’s University in Canada and is a member of the Institute of Directors and Global Women.
Dame Fran Wilde Hon Dame Fran Wilde CNZM was previously an MP and Cabinet Minister, as well as Mayor of Wellington. In business she was CEO of the NZ Trade Development Board and chair and/or director on the boards of a number of listed, state-owned and privately held companies. Fran has also run her own consultancy business and has played a key role in Wellington and national philanthropic and arts organisations. She is a Chartered Fellow of the Institute
of Directors and holds an honorary doctorate in law from Victoria University of Wellington from which she earlier graduated with a BA degree.
Antony RoyalAntony Royal has strong community involvement and a background in the ICT industry. He holds a degree in Electrical and Electronics Engineering from Auckland University, has spent many years in the ICT industry and currently holds a number of governance positions. Previous roles have included Global Infrastructure Manager and Web Initiatives Manager for the NZ Dairy Board (Fonterra), implementation of Financial Management Systems for a number of different government departments, and positions on a number of advisory boards.
Jacqueline LloydJackie Lloyd is Deputy Chair of New Zealand Post Group, a trustee of the Lion Foundation and Chair of Wellington Museums Trust, Chair of the State Services Commission Audit and Risk Committee and a business advisor.She previously served as global human resources director for the New Zealand Dairy Board and NZMP Fonterra, and subsequently as a consultant and New Zealand country manager for Hewitt Associates and The Gallup Organisation. Jackie has a BA in Psychology and a BCom in Marketing and Manpower, is a member of Global Women and a Chartered Member of the Institute of Directors.
Vaughan Renner
(Chair)
Deborah Hume Greg Campbell
Jackie Lloyd Nancy McIntosh-Ward
Nancy McIntosh-Ward
(Chair)
Antony Royal Fran Wilde
Greg Campbell
Kura Moeahu
(Chair)
Antony Royal Greg Campbell
Vaughan Renner Wayne Mulligan
Wirangi Luke
Moana Sinclair
(Chair)
Antony Royal Greg Campbell
Taku Parai Una Thomas
Fran Wilde
(Chair)
Antony Royal Greg Campbell
Jackie Lloyd Kabini Sanga
Risk Audit and
Finance Committee
Chief Executive
Performance Appraisal Committee
Te Komiti
Poutokomanawa
Atiawanuitonu
Chris Gosling
(Chair)
Ben Shadbolt Carmel Haggerty Helen Gardiner Hinemoa Priest Jeanette Grace
Leanne Ivil Mervyn Protheroe
Neil McDonald Renata Baleikasavu
Ruth Anderson Ruth Crawford
Sorrel Kemp
Campus
Development Committee
Combined Council of Whitireia and WelTec
Academic Board

16 ANNUAL REPORT 2017
Chief Executive’s Foreword2017 was another successful year for our institutions in terms of the positive effect we had on our learners and our communities.
He Whakatauākī Ko te manu e kai ana i te miro, nōna te ngahere. Engari, ko te manu e kai ana i te mātauranga, nōna te ao.
The one who partakes of the flora and fauna, that will be their domain. The one who engages in education, opportunities are boundless.
THE 2017 YEAR
In 2017 Whitireia and WelTec provided quality training and learning experiences for more than 14,000 students (equating to 7,186 EFTS) in the Wellington region and Auckland. Behind that large number there is a huge variety of individual stories. Each one of those individuals was positively affected by our work. For some it may be considered as relatively minor – perhaps acquiring a new skill during a short course - but for all it will have been life changing, opening up new worlds of opportunity, providing self-confidence and launching careers.
Initial course completion data for 2017 indicates that yet again Whitireia and WelTec performed well in terms of student learning with Whitireia achieving 85% course completions and WelTec achieving 79% course completions5.
JOINT STRATEGIC FRAMEWORK
The WelTec and Whitireia Strategic Framework 2017-2021 and 2017–2018 Investment Plan laid the foundation for our strategic direction and goals for our institutions. The 2017 Business Plan, the first joint operational plan for WelTec and Whitireia, was structured around the strategic goals - Whole of person, Whole of Learning Framework, Whole of Community, Whole of Place and Whole of System. These goals connected to the six key priority areas set by the previous government - Delivering Skills for Industry, Getting At-risk Young People into a Career, Boosting achievement for Māori and Pasifika, Improving Adult Literacy and Numeracy, Strengthening Research-based Institutions and Growing International Linkages. The Business Plan set out the activities to be undertaken during the year to achieve the strategic goals.
5. Statistics derived from SAC Funded Courses
2017 Joint Leadership Team. Back, Left to right: Mark Johnston, Chris Gosling, Mark Hewistson, Mark Broadbent. Front, left to right: Ruth Anderson, Leanne Ivil, Helen Gardiner, Victoria Spackman
WELTEC AND WHITIREIA 17
Achievements are outlined later in this Annual Report along with a new format for outcomes reporting utilising Treasury’s Living Standards Framework. This is a first attempt to report against indicators of sustainable intergenerational wellbeing including Financial and Physical Capital; Natural Capital; Social and Human Capital.
Joint planning signalled a gearing up of the WelTec and Whitireia strategic partnership, the next step in a co-ordinated and strategic approach to academic planning and provision; a regionally co-ordinated approach to Māori aspirations and success; Pasifika participation and achievement; pathways for our ākonga; community and industry need; and shared services and facilities, including harmonisation of systems and processes that add value and enable further collaboration.
6. Excludes STAR, ITO, ACE, WTA, DualPathways, Domestic Full Fee 7. Statistics relate to all 2017 domestic students
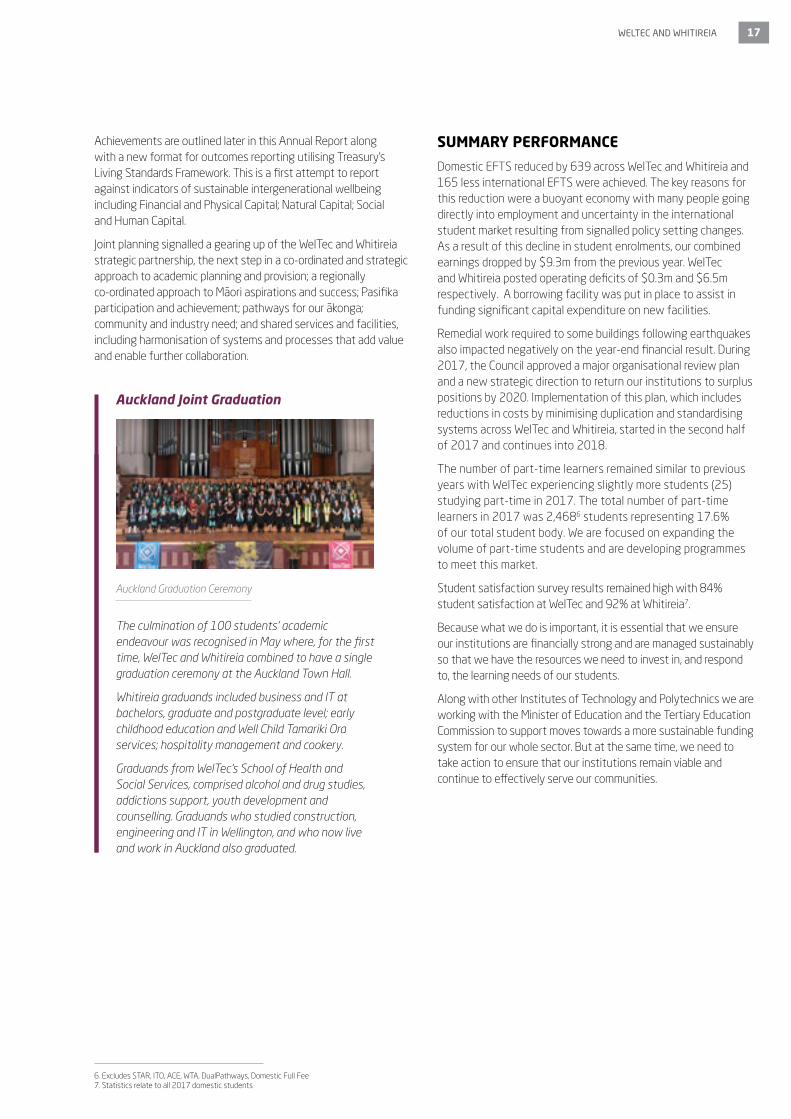
The culmination of 100 students’ academic endeavour was recognised in May where, for the first time, WelTec and Whitireia combined to have a single graduation ceremony at the Auckland Town Hall.
Whitireia graduands included business and IT at bachelors, graduate and postgraduate level; early childhood education and Well Child Tamariki Ora services; hospitality management and cookery.
Graduands from WelTec’s School of Health and Social Services, comprised alcohol and drug studies, addictions support, youth development and counselling. Graduands who studied construction, engineering and IT in Wellington, and who now live and work in Auckland also graduated.
Auckland Joint Graduation
Auckland Graduation Ceremony
SUMMARY PERFORMANCE
Domestic EFTS reduced by 639 across WelTec and Whitireia and 165 less international EFTS were achieved. The key reasons for this reduction were a buoyant economy with many people going directly into employment and uncertainty in the international student market resulting from signalled policy setting changes. As a result of this decline in student enrolments, our combined earnings dropped by $9.3m from the previous year. WelTec and Whitireia posted operating deficits of $0.3m and $6.5m respectively. A borrowing facility was put in place to assist in funding significant capital expenditure on new facilities.
Remedial work required to some buildings following earthquakes also impacted negatively on the year-end financial result. During 2017, the Council approved a major organisational review plan and a new strategic direction to return our institutions to surplus positions by 2020. Implementation of this plan, which includes reductions in costs by minimising duplication and standardising systems across WelTec and Whitireia, started in the second half of 2017 and continues into 2018.
The number of part-time learners remained similar to previous years with WelTec experiencing slightly more students (25) studying part-time in 2017. The total number of part-time learners in 2017 was 2,4686 students representing 17.6% of our total student body. We are focused on expanding the volume of part-time students and are developing programmes to meet this market.
Student satisfaction survey results remained high with 84% student satisfaction at WelTec and 92% at Whitireia7.
Because what we do is important, it is essential that we ensure our institutions are financially strong and are managed sustainably so that we have the resources we need to invest in, and respond to, the learning needs of our students.
Along with other Institutes of Technology and Polytechnics we are working with the Minister of Education and the Tertiary Education Commission to support moves towards a more sustainable funding system for our whole sector. But at the same time, we need to take action to ensure that our institutions remain viable and continue to effectively serve our communities.
18 ANNUAL REPORT 2017
IMPROVEMENT OF INTERNAL SYSTEMS
We made significant changes to internal systems to improve efficiency and effectiveness through enhanced processes and new systems.
Online student enrolment was introduced at Whitireia to enable easier access to, and faster processing of applications. A new financial system was introduced across WelTec and Whitireia improving core finance systems with a new single instance of the Tech One Finance system implemented in August 2017. Three new websites (WelTec, Whitireia and Te Auaha) with enhanced capability including an advanced Digital Student Attraction Platform went live. A new health and safety system was introduced with a major focus on capturing reporting of incidents. An online platform for staff to see and share information linked to the performance of their academic programmes was established.
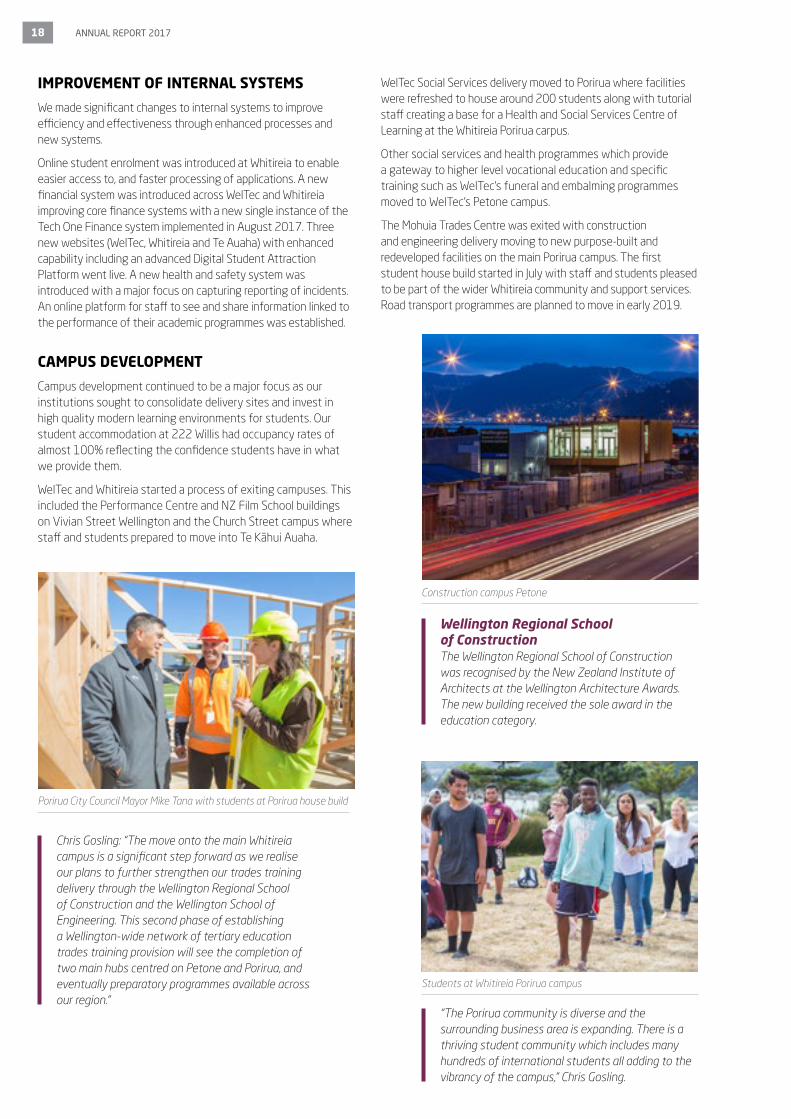
CAMPUS DEVELOPMENT
Campus development continued to be a major focus as our institutions sought to consolidate delivery sites and invest in high quality modern learning environments for students. Our student accommodation at 222 Willis had occupancy rates of almost 100% reflecting the confidence students have in what we provide them.
WelTec and Whitireia started a process of exiting campuses. This included the Performance Centre and NZ Film School buildings on Vivian Street Wellington and the Church Street campus where staff and students prepared to move into Te Kāhui Auaha.
Wellington Regional School of ConstructionThe Wellington Regional School of Construction was recognised by the New Zealand Institute of Architects at the Wellington Architecture Awards. The new building received the sole award in the education category.
Chris Gosling: “The move onto the main Whitireia campus is a significant step forward as we realise our plans to further strengthen our trades training delivery through the Wellington Regional School of Construction and the Wellington School of Engineering. This second phase of establishing a Wellington-wide network of tertiary education trades training provision will see the completion of two main hubs centred on Petone and Porirua, and eventually preparatory programmes available across our region.”
“The Porirua community is diverse and the surrounding business area is expanding. There is a thriving student community which includes many hundreds of international students all adding to the vibrancy of the campus,” Chris Gosling.
Porirua City Council Mayor Mike Tana with students at Porirua house build
Students at Whitireia Porirua campus
Construction campus Petone
WelTec Social Services delivery moved to Porirua where facilities were refreshed to house around 200 students along with tutorial staff creating a base for a Health and Social Services Centre of Learning at the Whitireia Porirua carpus.
Other social services and health programmes which provide a gateway to higher level vocational education and specific training such as WelTec’s funeral and embalming programmes moved to WelTec’s Petone campus.
The Mohuia Trades Centre was exited with construction and engineering delivery moving to new purpose-built and redeveloped facilities on the main Porirua campus. The first student house build started in July with staff and students pleased to be part of the wider Whitireia community and support services. Road transport programmes are planned to move in early 2019.

WELTEC AND WHITIREIA 19
TE KĀHUI AUAHA
Our world-class creative and arts campus, Te Kāhui Auaha, neared completion. A ceremony in July marked the laying of a mauri stone representing the life-force of Te Auaha. In September Wellington Mayor Justin Lester turned on the lights of Te Auaha at a ceremony which saw the giant A (representing a Waharoa meaning The Gateway) lighting up the building and the surrounding Cuba/Dixon Street precinct. In November as the building neared practical completion, a blessing ceremony was held prior to staff moving into the campus.
The investment in a state-of-the-art campus in the Wellington CBD to house Whitireia arts and WelTec creative programmes is very significant for our institutions. As well as representing a major investment, Te Auaha signals to the community that the strategic partnership between our institutions is meaningful and tangible.
Te Auaha signs agreement with CCCNZ“As well as attracting international students to study at our new campus, Te Auaha will work with universities and colleges overseas to bring Te Auaha to the world stage. We believe what New Zealand performers and creators offer is unique and will be highly sought after by overseas organisations,” Chris Gosling.
Mr Guo Director General CCCNZ, “This agreement marks a significant milestone for Te Auaha because it represents a step forward for promoting cultural exchanges, teaching and training, and the exchange of ideas between New Zealand and China. I hope that this agreement will lead to greater mutual cooperation and opportunities for the sharing of Chinese culture such as through providing quality Chinese dance classes to young New Zealanders who want to learn more about, and experience, authentic Chinese culture."
Placing of the mauri stone
Te Auaha signs a three-year agreement with the China Cultural Centre in New Zealand (CCCNZ)
Wellington City Mayor Justin Lester turning on the lights at Te Auaha
Students and staff traveling from the Wellington CBD to Porirua
"Tānekaha" - representing the son of Awanuiarāngi - is the name of the māuri stone which was sourced from the Waiongania River in Taranaki, a place of special significance to the ancestors of Te Ātiawa and Ngāti Toa.
The ceremony reminded us all of the important link between Te Auaha and the two Iwi we work with closely. The presence of the stone will shape the way we work in Te Kāhui Auaha,” Victoria Spackman who was appointed the Director of Te Auaha in March 2017.
BUS SERVICE
Through a connectedness model we are delivering training across the Wellington region and making tertiary education more accessible to learners. This is a very positive move for students. Towards the end of 2017 we started work on a project to implement a free transport option for students to enable them to access our campuses more easily.
20 ANNUAL REPORT 2017
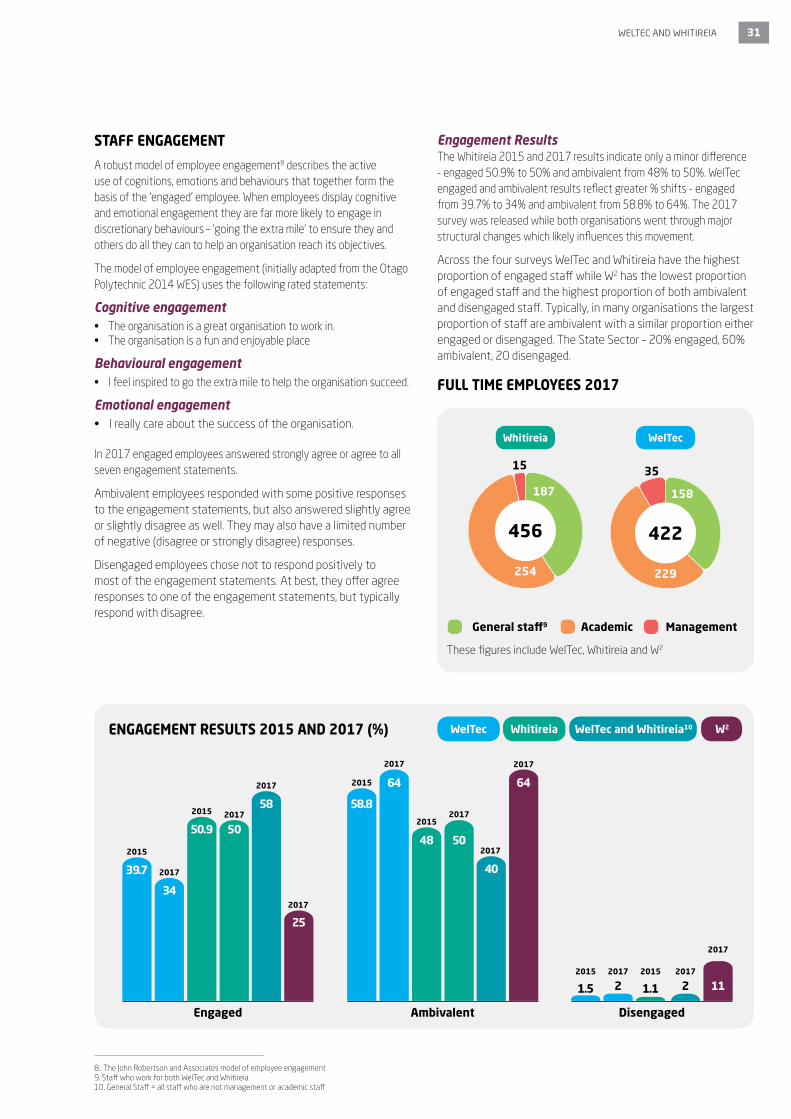
MĀORI AND PASIFIKA TRADES TRAINING
Māori and Pasifika Trades Training continued in 2017 with almost 180 learners receiving scholarships. A record number of 55 Tool Grants were processed indicating strong employment and commitment by employers to offer apprenticeships or cadetships to graduates. The governing body for Wellington is the Māori and Pasifika Trades Training Consortium which is Co-Chaired by the Industry Training Federation and Ngāti Toa. Three hui were held during the year with ITOs, industry and social agencies supporting this initiative. It is heartening to see more young women and NEETS participating in Māori and Pasifika Trades Training.
Student celebrations at Petone
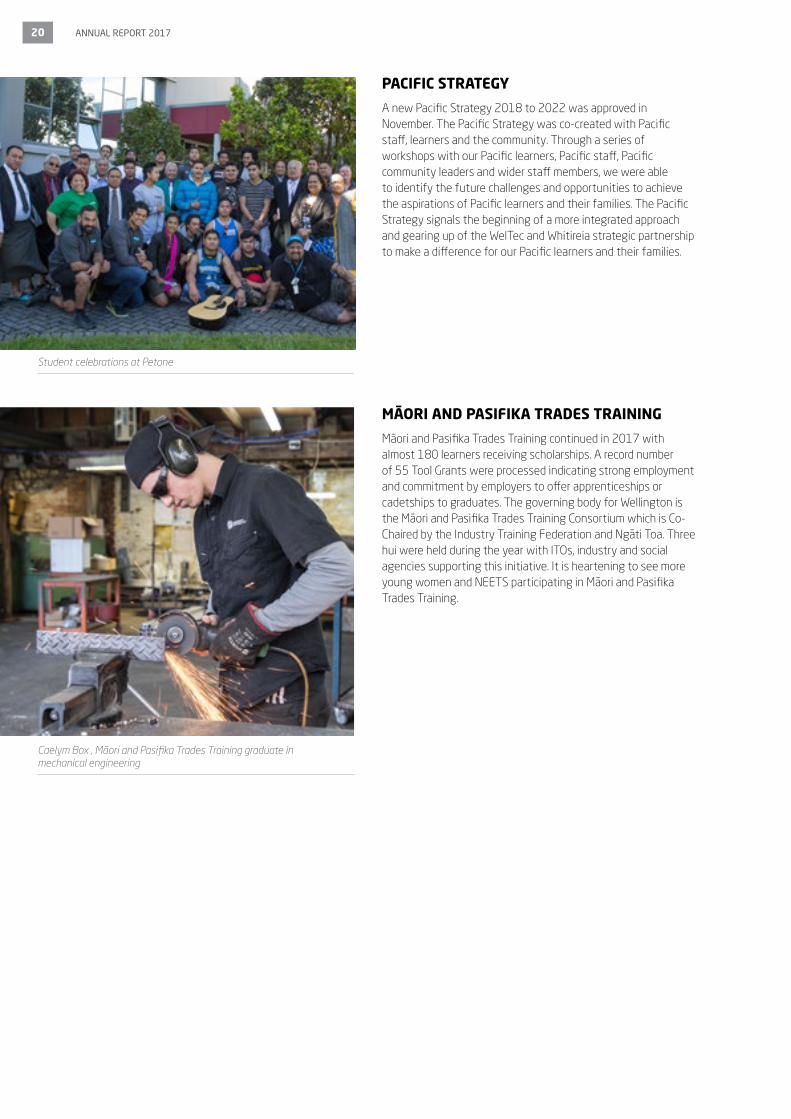
PACIFIC STRATEGY
A new Pacific Strategy 2018 to 2022 was approved in November. The Pacific Strategy was co-created with Pacific staff, learners and the community. Through a series of workshops with our Pacific learners, Pacific staff, Pacific community leaders and wider staff members, we were able to identify the future challenges and opportunities to achieve the aspirations of Pacific learners and their families. The Pacific Strategy signals the beginning of a more integrated approach and gearing up of the WelTec and Whitireia strategic partnership to make a difference for our Pacific learners and their families.
Caelym Box , Māori and Pasifika Trades Training graduate in mechanical engineering

WELTEC AND WHITIREIA 21
2017 Wellington International Student Excellence Awards Whitireia student Vineet Kaur with Chris Gosling
GROWTH IN WELLINGTON
Our institutions along with Victoria University, Massey University and WREDA (Wellington Regional Economic Development Agency) believe that there is scope to grow the number of international students in Wellington promoting the city as student friendly and a great place to study. To this end, I facilitated the Wellington International Student Growth Plan Steering Committee and hosted many international delegations with five new international partnerships signed during the year.
WelTec and Whitireia experienced strong growth in secondary-tertiary pathway programmes, particularly the Wellington Trades Academy with the Ministry of Education funding additional places in July to make a total of 260 Trades Academy students learning at our institutions in 2017. Our institutions are very appreciative of Wellington secondary school principals who support this key youth initiative which sees young people staying at secondary school, and having the opportunity to study at either of our institutions for two days per week.
The Wellington International Student Excellence AwardsThe Wellington International Student Excellence Awards were held in October 2017 with students from Whitireia and WelTec recognised for outstanding achievements. Whitireia student, Vineet Kaur, completed a Post Graduate Diploma in IT. WelTec student Yorke Yu graduated with a Graduate Diploma in Creative Technology.
Trades AcademyPrincipal of Hutt Valley High School Ross Sinclair, and Chair of the Wellington Trades Academy Partnership Committee says the Trades Academy pathway complements what secondary schools can offer. “For many students the ability to study at both secondary and tertiary institutions at once allows them to transition into the next step that energises them, opening up their futures.”
Day one of the Wellington Trades Academy at WelTec’s Petone campus
Left to Right are: Mikaira Campbell from Hutt Valley High School, Melissa du Toit – Te Aho o Te Kura Pounamu - The Correspondence School, and Baxter Morrison from St Pats Silverstream. All three students are studying hospitality as they work towards NCEA and a trades qualification.

22 ANNUAL REPORT 2017
ORGANISATIONAL CHANGES
During 2017 Whitireia and WelTec went through substantial organisational change and this change continues into 2018. Realignment of our resources to lower income necessitated a number of internal reviews, but also provided the opportunity to take a fresh look at how we do things. Heads of Schools were appointed across our institutions. This significant change meant hospitality, business, construction, engineering, health, social services, creative and IT each have one manager for both institutions to provide seamless delivery to students and a more cohesive and responsive delivery model to industry. These Schools were aligned as Centres of Learning: Health and Social Services; Business, Hospitality and Tourism; IT, Engineering and Construction; Te Wānanga Māori; and Creativity and were led by Directors to provide cohesion shaping our vocational education provision for a modern era.
Engineering student Alex Smith
Jo Young, Administrator Learner Support and Services, using APER
Industry experienceEngineering student Alex Smith is juggling employment and study, working in industry while he studies full-time. “Fortunately my office is 50 metres away from the campus. I usually spend the morning at the office, and the afternoon at WelTec.” Alex, is an automation engineer for Petone company Automation for Industry (AFI). “We design, commission and support industrial control systems - like some of the machines that Whittaker's use to produce their chocolate. Though we work in a wide range of areas throughout the industry.”
Head of Engineering Graham Carson: “Working and studying at the same time has two main advantages. The first is students can put immediately into practice what they are learning in the classroom. Secondly, students are earning an income which keeps their costs down.”APER
As part of our focus on aligning systems and structures, a team of employees developed a cloud-based structure, known as the Annual Programme Evaluation Reporting Site - APER. All matters relating to the annual self-evaluation of programmes, action plans and the ongoing moderation of programmes throughout each year are held on this site. A significant integral feature has been the development of a data dashboard. Every programme delivered at each campus is individually evaluated from a number of perspectives: enrolment data including the age, gender and ethnicity of students; achievement rates including course completions and trends over time; and, the support provided to students outside the classroom. Every Head of School and tutor accesses live and summative programme data in ways that can inform improvements in programme design and approaches to teaching.

WELTEC AND WHITIREIA 23
WORKING WITH INDUSTRIES
Wellington is a centre for many industries. The core public service is located here and five local authorities operate in the Wellington region. Engineering, ICT, Creative, Hospitality and Tourism, Health, Social Services all have a significant presence and require skilled employees. It is our role to deliver to these industries and sectors of our economies. By accessing information and evidence from many channels including direct engagement with industry, information from MBIE and our local governments, we are reviewing our programme portfolio to ensure that our current and future programmes provide our graduates the skills needed to help shape our world.
ShadowTech DayOn 22 June ShadowTech Day, a joint initiative between NZTech and WelTec, saw 120 secondary school girls spend a day in well-known ICT companies. Around 30 companies including Xero, Spark, Intergen, Te Papa, Oracle, Deloitte, Fujitsu, Trade Me, Weta Digital, NZX, ANZ, Westpac and many more hosted girls from Wellington, Manawatū and Kāpiti secondary schools for a day learning about all aspects of ICT.
Chief Executive of Engineering New Zealand Susan Freeman-Greene addresses students about the opportunities for engineers and IT professionals. At the end-of-year student showcase event Susan highlighted the pace of change facing the engineering and IT industry which provides opportunities for new graduates with fresh ideas and technical and technological skills. “Commitment, collaboration and creativity skills are essential skills for today’s workforce and these are exactly the skills being demonstrated by the students showcasing their talent.”
Hutt City Mayor Ray Wallace, “We are incredibly fortunate to have such bright young minds working in STEMM (Science, Technology, Engineering, Maths and Manufacturing).”

24 ANNUAL REPORT 2017
I am constantly amazed and honoured to be a part of our students’ journeys. A highlight for the year for me is attending graduations and seeing the pleasure, satisfaction (and sometimes relief) of not just our graduands but their whānau and wider community. It reinforces yet again the important role that our institutions play in transforming the lives of individuals and strengthening our communities and our economy. Thank you to our hard working and dedicated professional teaching team, and all our staff who enrich the learning experience for our students. I acknowledge everyone who contributed to this achievement and to the vibrancy of our campuses throughout the year.
No reira Tēnā koutou Tēnā koutou Tēnā koutou katoa
CHRIS GOSLING
Chief Executive
Hosting a week long Leadership Training Programme for a high-level Chinese delegation on SINO NZ Model Programme in July

WELTEC AND WHITIREIA 25
Te Wānanga Māori graduate 2017 - National Diploma in Reo Māori (Level 5) Kumeroa Anita Brown
Whitireia graduates of the New Zealand Certificate in Health and Wellbeing (Social and Community Services) (Level 4) (Mental Health and Addiction Support)

26 ANNUAL REPORT 2017
Academic
To advance the WelTec and Whitireia Strategic Framework 2017–2021, three key strategic documents were approved by Academic Board for implementation. The Academic Strategy 2017–2021 focuses upon delivering high quality, vocationally-relevant programmes; improving the quality of students’ learning experience; promoting and supporting the achievement of Māori, Pasifika students and youth, and ensuring students’ readiness for initial or continued employment.
Implementation of the e-Learning Strategic Framework 2017–2021 over the next five years will enable greater flexibility in teaching delivery and increase students’ access to learning opportunities at both institutions. For students studying degrees, implementation of the Research and Innovation Strategy 2017–2021 is resulting in strengthened links between teaching and relevant research evidence following increased staff participation in research and innovation activity. The Organisational Report 2016–2017, received by Academic Board in July 2017, will provide a useful baseline for determining the impact of these initiatives on priority areas going forward.
The programme of development to replace Levels 1–6 programmes with New Zealand qualifications continues and will be completed by 2019. During 2017, all new programmes of study completed, following the Tertiary Review of Qualifications initiated by the New Zealand Qualifications Authority (NZQA), were approved. This means that most current students are studying in new programmes of study, many with pathways into degrees and all with pathways into employment.
Of significance for Whitireia and WelTec in 2017 was NZQA approval of the new Bachelor of Creativity degree. This is the foundation programme for Te Auaha and will be jointly taught by Whitireia and WelTec staff at Te Kāhui Auaha, the institutions’
new purpose-built site in Wellington. The degree replaces two current degrees offered by the separate institutions and is designed to foster inter-disciplinary collaboration and close engagement with the arts sector. The programme will provide students with the opportunity to major in Digital Media, Music, Performing Arts, Toi Poutama (Māori Arts), Visual Arts, or Writing. A commitment to responsiveness to industry also prompted specific development of the Graduate Diploma in Youth Development, the Graduate Diploma in Engineering with a Building Services strand, and the Postgraduate Diploma in Speciality Care with additional endorsements in Māori Health and Nursing, Addiction, Child/Youth Health, Mental Health, Nursing, Older Adult Health, Palliative Care, Perioperative, Primary Health, and Trauma and Emergency Care.
A desire to further improve quality assurance led to Academic Board approval of the establishment of Boards of Studies for each of the six Centres of Learning delivering programmes across Whitireia and WelTec. The Boards of Studies have direct responsibility for monitoring and supporting improvements in programme development, assessment, and evaluation practices across both institutions and will report to the Programme Committee, a subcommittee of Academic Board. In the context of improving the quality of programme delivery and providing a consistent and seamless experience for students, many policies and procedures, including those relating to credit recognition, assessment, student access to results, and resolution of student complaints, have been revised and are now common to both institutions. A key initiative has been introduction of the Student Rights and Responsibilities which replaces the earlier separate Student Codes of Conduct. This better reflects the institutions’ commitment to working in partnership with students. Our partnership relationship with students is also reflected in student membership of Academic Board which was initiated in 2017.
Combined Academic Board. Back row, Left to right: Renata Baleikasavu, Gerry McCullough (to November 2017), Sorrel Kemp, Chris Gosling, Neil McDonald, Dr Ruth Crawford. Front row: Helen Gardiner, Ben Shadbolt, Dr Ruth Anderson, Hinemoa Priest, Jeanette Grace Absent: Dr Leanne Ivil and Mervyn Protheroe

WELTEC AND WHITIREIA 27
RESEARCH AND INNOVATION
Applied research and innovation activity by staff ensures that teaching is current, evidence-based, and reflects best practice in the industry. This is why staff in degree programmes are encouraged and supported to be research-active. There were a number of highlights in the 2017 year that point to progress in staff becoming increasingly engaged in applied research and in some instances, leading significant research and innovation initiatives.
Through a competitive tendering process, the Tourism Industry Association (TIA) commissioned the School of Hospitality and Tourism to complete its “State of the Industry” report. The School has gained rights to produce these reports up to 2019. This will involve collaboration with Te Auaha staff to develop an infographic-style report which will carry WelTec’s brand to New Zealand’s largest industry. The first report has received media attention, associating the WelTec brand and staff with insightful forward thinking in the tourism sector.
The School of Engineering led a project investigating the viability of a work-based degree apprenticeships. Designed by Institutes of Technology and Polytechnics, in close collaboration with employers, the programme aims to meet a skills shortage in the engineering industry, and positions WelTec to be an early to market deliverer of these proposed qualifications.
The School of Construction was commissioned by a plumbing industry partner to deliver the second phase of “What’s the Real Cost,” a project comparing installation times of different plumbing systems, ensuring best practice in industry.
Paramedic educators in the School of Health have entered into a collaboration with the Victoria University of Wellington's School of Engineering and Computer Science to develop software for the rapid processing of advanced directives for people who are non-responsive.
Following the award of one of New Zealand’s most prestigious literary honours, the Katherine Mansfield Menton Fellowship, Mandy Hager, a Te Auaha tutor teaching creative writing, published her new novel Heloise, which has been garnering critical praise. Hager’s novel is only one of the highlights of recent work from the creative writing team.
The School of Social Services and Victoria University were successful in a joint application to the Ako Aotearoa National Project Fund and received funding for a project expected to contribute to the retention, completion and outcomes for Māori and Pasifika learners. Under the leadership of Arden Perrot, the project ‘From Good to Great: the 10 Habits of Phenomenal Educators for Pasifika Learners will look at the success of delivery of the Bachelor of Youth Development programme for Pasifka learners, and reflects a strong relationship between teaching and research.
The School of Business, Auckland, is collaborating with Auckland University of Technology, to investigate the impact of non-routine problem-solving on creativity, engagement and intuition of STEM (science, technology, engineering, mathematics) tertiary students. This project was successful in obtaining funding from the Teaching and Learning Research Initiative (TLRI) and recognises potential innovations in teaching delivery.
Steve McKinlay, a Senior Tutor in the School of Information Technology, presented at a Royal Society Te Apārangi public lecture on the ethics of big data. This is a topical issue in government, and presenting at the home of New Zealand’s peak body representing the arts and sciences ensured that the talk would reach officials within government, and is a notable honour.
A joint WelTec, Whitireia, and Open Polytechnic research symposium, Innovating for Industry and Community, was held in November 2017, showcasing the growing research activity across the institutions and providing a forum for discussion of staff research activities and possibilities of collaboration. The cooperation between the institutions with Open Polytechnic will continue in 2018.
The Royal Society Te Apārangi hosted an ITP Research Managers meeting in acknowledgement of the important role that ITPs have in the applied research and innovation sector. Currently, the Whitireia and WelTec Research and Innovation Manager is the first representative of ITPs on the Ministry of Business Innovation and Employment (MBIE) Science Sector Investment Advisory Group, allowing a positive voice for research and innovation in the ITP sector.
Dr. Diane Strode presenting at the Research Symposium
2017 Research Symposium

28 ANNUAL REPORT 2017
Equal Education Opportunities
WelTec and Whitireia student support services have worked collaboratively to develop significant opportunities and strategies to eliminate unnecessary barriers to the progress of students and to support students to succeed at tertiary study.
Notable joint initiatives in frontline service included the Leadership, Employability, Action and Participation (LEAP) programme, where staff not only worked together to develop and integrate the programmes but mentored LEAP volunteers. According to the 2017 LEAP evaluation reports, Whitireia LEAP students volunteered 300 hours, and WelTec students volunteered 600 hours in many activities throughout the institutions and the region. The Master of Professional Practice (MPP) was another opportunity to jointly deliver seamless support (including library services and information literacy) to students on any campus, including by distance. Another joint project was the Student Guide which integrated all relevant information for students in an attractive and accessible format. Student services teams participated in orientation activities for students from both institutions, cross serviced each other’s students on the campuses most convenient for the students, prepared students for transitions from WelTec campuses to Whitireia campuses and vice versa, and situated resources where students can most easily use them.
Behind the scenes the teams have worked together to synchronise processes to facilitate growing seamless provision across institutions and sites. This is evidenced by the streamlining of Artena, disability service processes, and a joint MOU with CCDHB to provide a safe environment for clients to access educational opportunities as part of transition to full participation in society. The REVIVE tool to monitor students and trigger timely intervention was trialled at WelTec from early 2017, and rolled out across both institutions in late 2017.
In 2017 5,412 Wellington region and distance students received 23,602 hours of support in 21,716 interactions delivered by both student support services teams. Academic learning support was structured to offer equitable support to as many students as possible. Deliberate timetabling of classes and groups in consultation and collaboration with teaching staff, in line with priority learner parameters reached specific populations. Classes, groups and workshops comprised 33.86%, 9.19% and 5.18% respectively. Student choice drove individual interactions which occurred face-to-face (29.08%), by email (4.97%) and by phone (6.46%). Overall the most frequently accessed areas of support were academic skills (2,482), assignment support (2,942), LLN (3,147), subject specific tutorials (1,517) and study skills (818).
Whitireia students studying Health at WelTec’s Petone Campus

WELTEC AND WHITIREIA 29
The greatest concentrations of interactions with student support services across both institutions were at Level 3 (6,206 interactions) and at Level 7 (6,754 interactions).
There were 354 financial and budgeting advice interactions at WelTec and 822 interactions at Whitireia. Services included providing emergency and hardship funding for students for transport, accommodation and health services, budgeting advice and help with Studylink and WINZ. Pastoral care was available from mentors, from the Learning Commons, the Pasifika team and Tamaiti Whangai at WelTec, and from the Trades and Services faculty and Pasifika and Māori success coordinators at Whitireia. Students met with their mentors in or out of class and addressed issues which could have disadvantaged their progress. This was often coded as Engagement and totalled 3,085 interactions. Health and counselling support was provided to reduce barriers to student success. At Whitireia, the nurse had 3,271 visits and 286 students visited the doctor who is on site once a week. Counselling for both institutions was provided by Vitae.
Programmes at Whitireia and WelTec were offered which supported students with special needs, such as long-term illness, injury or learning disability, or who may be disadvantaged in terms of their ability to participate in tertiary education.
These included the Certificate in Community and Vocational Learning Skills, Certificate in Vocational Learning Skills, Wellington Trades Academy including Level 1 programmes, STAR, Gateway, and Transition from secondary school. These students were supported both internally by Ability Advisors and dedicated pastoral care staff and externally by agencies such as WorkBridge, as well as Learning Advisors, mentors and financial advisors. Second chance learners began their tertiary studies with a number of foundation programmes and were also supported by the full range of student support services.

30 ANNUAL REPORT 2017
HEALTH, SAFETY AND SUSTAINABILITY
The 2017 Strategy focused on the key areas of risk management, hazard identification, engagement and emergency management.
An audit program was developed and rolled out at the end of 2017, in preparation for a focused and strategic Health, Safety and Sustainability Plan 2018.
WELLBEING IN THE WORKPLACE
Wellbeing initiatives and services were regularly offered at both institutes including free counselling, flu vaccinations, social events, a smoke-free environment and smoke-free cessation programmes available. Discounted health insurance, workplace assessments and the use of an Occupational Health Physician to support staff returning to work from ill-health were some of the available services. Access to either a gym onsite or discounted membership was available to most staff.
The Health Safety and Sustainability team focused on wellness and sustainability through support of initiatives such as Mental Health Awareness Week, and beach clean-up days.
Through our volunteers, WelTec supports WorldSkills New Zealand to provide young people with a model of excellence in trades training and setting goals for young people to aspire to in their personal development. The contribution of staff to this worthwhile initiative was recognised at a ceremony in Petone in March.
There has been a decrease in health and safety incidents from 2016 to 2017 Health Safety and Sustainability team
Left to Right: Alison Bond, Barbera Peters, Nicola Knobel, Greg Kent
2016
89 141 12
2017
73 101 3
WELTEC WHITIREIA W2
our people
WELTEC AND WHITIREIA 31
STAFF ENGAGEMENT
A robust model of employee engagement8 describes the active use of cognitions, emotions and behaviours that together form the basis of the ‘engaged’ employee. When employees display cognitive and emotional engagement they are far more likely to engage in discretionary behaviours – ‘going the extra mile’ to ensure they and others do all they can to help an organisation reach its objectives.
The model of employee engagement (initially adapted from the Otago Polytechnic 2014 WES) uses the following rated statements:
Cognitive engagement• The organisation is a great organisation to work in.• The organisation is a fun and enjoyable place
Behavioural engagement• I feel inspired to go the extra mile to help the organisation succeed.
Emotional engagement• I really care about the success of the organisation.
In 2017 engaged employees answered strongly agree or agree to all seven engagement statements.
Ambivalent employees responded with some positive responses to the engagement statements, but also answered slightly agree or slightly disagree as well. They may also have a limited number of negative (disagree or strongly disagree) responses.
Disengaged employees chose not to respond positively to most of the engagement statements. At best, they offer agree responses to one of the engagement statements, but typically respond with disagree.
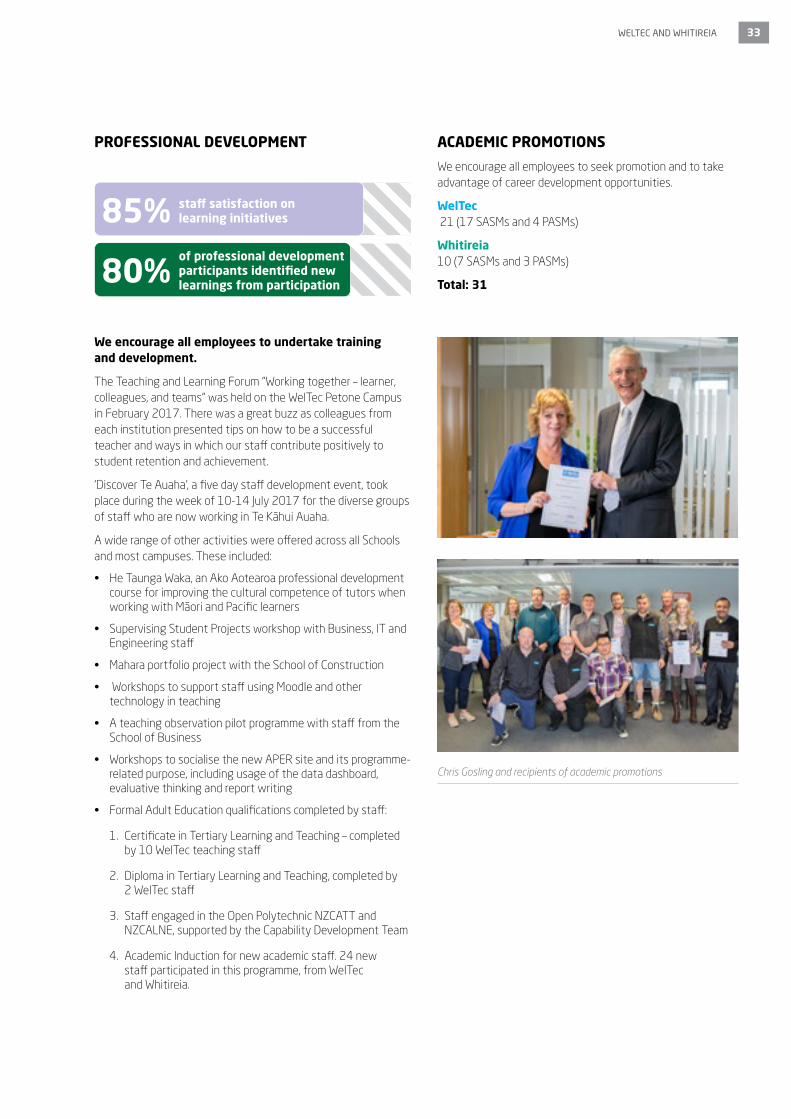
Engagement ResultsThe Whitireia 2015 and 2017 results indicate only a minor difference - engaged 50.9% to 50% and ambivalent from 48% to 50%. WelTec engaged and ambivalent results reflect greater % shifts - engaged from 39.7% to 34% and ambivalent from 58.8% to 64%. The 2017 survey was released while both organisations went through major structural changes which likely influences this movement.
Across the four surveys WelTec and Whitireia have the highest proportion of engaged staff while W2 has the lowest proportion of engaged staff and the highest proportion of both ambivalent and disengaged staff. Typically, in many organisations the largest proportion of staff are ambivalent with a similar proportion either engaged or disengaged. The State Sector – 20% engaged, 60% ambivalent, 20 disengaged.
8.. The John Robertson and Associates model of employee engagement 9. Staff who work for both WelTec and Whitireia. 10. General Staff = all staff who are not management or academic staff
WelTec Whitireia WelTec and Whitireia10 W2
FULL TIME EMPLOYEES 2017
ENGAGEMENT RESULTS 2015 AND 2017 (%)
Engaged
2015
2017
2017
2017
2017
2015
39.7
34
50.9 50
58
25
Ambivalent
2017
2017
2017
2017
2015
2015
58.8
64
48 50
64
Disengaged
2017
2017
20172015 2015
1.5 1.1 2 112
40
General staff9
These figures include WelTec, Whitireia and W2
Academic Management
15
187
254
456
35
158
229
422
WelTecWhitireia

32 ANNUAL REPORT 2017
EQUAL EMPLOYMENT OPPORTUNITIES
When recruiting people at Whitireia and WelTec, EEO information is recorded and collected. Interview panels have balanced representation with WelTec and Whitireia attracting and retaining a diverse workforce. Where possible at least one member of interview panels should be the same gender and/or ethnic group as the applicant. EEO metrics continue to be monitored and reported on.
In our recruitment and selection procedures, skills and knowledge acquired in paid employment, in the home and in the community are recognised.
Whitireia
Whitireia
Gender
36%
27%
33%4%
25%
3%
8%
64%
MaleFemale
Academic Management
WelTec
WelTec
50% 50%35%
10% 6%
26%
18%
5%
Celebrating Tokelau Language Week
General Staff
45 48 5545 50 54
WhitireiaWelTec
Academic Management
Average Age
General Staff11
General staff11 Academic Managment
NZ European
17% 26% 6%
21% 31% 7%
Māori3% 5% 0%
2% 3% 1%
Pasific3% 3% 0%
1% 2% 0%
Asian3% 5% 0%
4% 3% 0%
Others1% 3% 0%
1% 2% 0%
Unknown8% 16% 1%
6% 15% 1%
Staff Ethnicity
11. General Staff = all staff who are not management or academic staff
WELTEC AND WHITIREIA 33
PROFESSIONAL DEVELOPMENT
We encourage all employees to undertake training and development.
The Teaching and Learning Forum “Working together – learner, colleagues, and teams” was held on the WelTec Petone Campus in February 2017. There was a great buzz as colleagues from each institution presented tips on how to be a successful teacher and ways in which our staff contribute positively to student retention and achievement.
‘Discover Te Auaha’, a five day staff development event, took place during the week of 10-14 July 2017 for the diverse groups of staff who are now working in Te Kāhui Auaha.
A wide range of other activities were offered across all Schools and most campuses. These included:
• He Taunga Waka, an Ako Aotearoa professional development course for improving the cultural competence of tutors when working with Māori and Pacific learners
• Supervising Student Projects workshop with Business, IT and Engineering staff
• Mahara portfolio project with the School of Construction
• Workshops to support staff using Moodle and other technology in teaching
• A teaching observation pilot programme with staff from the School of Business
• Workshops to socialise the new APER site and its programme-related purpose, including usage of the data dashboard, evaluative thinking and report writing
• Formal Adult Education qualifications completed by staff:
1. Certificate in Tertiary Learning and Teaching – completed by 10 WelTec teaching staff
2. Diploma in Tertiary Learning and Teaching, completed by 2 WelTec staff
3. Staff engaged in the Open Polytechnic NZCATT and NZCALNE, supported by the Capability Development Team
4. Academic Induction for new academic staff. 24 new staff participated in this programme, from WelTec and Whitireia.
ACADEMIC PROMOTIONS
We encourage all employees to seek promotion and to take advantage of career development opportunities.
WelTec 21 (17 SASMs and 4 PASMs)
Whitireia 10 (7 SASMs and 3 PASMs)
Total: 31
85%
80%
staff satisfaction on learning initiatives
of professional development participants identified new learnings from participation
Chris Gosling and recipients of academic promotions
34 ANNUAL REPORT 2017
Statement of Service
Performance
WELTEC AND WHITIREIA 35
Reporting on Outcomes 36
Business Plan Performance 46
Investment Plan Performance Commitments 58
36 ANNUAL REPORT 2017
Outcomes Reporting
TOWARDS A NEW REPORTING FRAMEWORK
Although it is likely to be updated soon, the Tertiary Education Strategy 2014-2019 (TES) still provides the most important guidance on what WelTec and Whitireia do, and how the two institutions report the outcomes of their activities.
The TES has a strong focus on achieving outcomes as a means of assisting communities and individuals to realise their full potential. It also places emphasis on supporting Māori to achieve educational success as a means of enabling them to enjoy labour market success.
To promote the achievement of outcomes, the TES specifies 6 strategic priorities.
1. Delivering skills for industry
2. Getting at-risk young people into a career
3. Boosting achievement of Māori and Pasifika
4. Improving adult literacy and numeracy
5. Strengthening research-based institutions
6. Growing international linkages
Our outcomes reporting against the TES’s 6 areas of focus is embedded in the Treasury Living Standards Framework (LSF). This enables us to take a more global view of our outcomes. For example, getting at-risk young people into a career and boosting achievement for Māori and Pasifika are as much about improving human as well as social capital. As ITPs we are change agents in our communities, playing a pivotal role in improving socioeconomic wellbeing, providing skills and vocational training that enable people to be effective players in a modern augmented economy. Our learners are from diverse community groups, and include school leavers, NEETS, those in work, those returning to work, both domestic and international.
In what follows, we illustrate how we contributed to the achievement of outcomes by aligning our activities and provision with these priorities. For the first time we are reporting our contribution in terms of the Living Standards Framework.
THE LIVING STANDARDS FRAMEWORK (LSF) AND ITS RELEVANCE TO WELTEC AND WHITIREIA
The LSF is being developed by the Treasury and, although it is not yet a practical tool for assessing and guiding policy, it signals the importance of measuring wellbeing using a broad set of indicators, rather than focussing solely on narrow measures such as GDP.
The LSF is based on the idea that intergenerational wellbeing relies on the growth, distribution and sustainability of four interdependent types of capital stock which are used in combination with each other to produce a range of desirable outcomes.
The four types of capital stock are:
• Human capital• Financial and physical capital• Social capital• Natural capital.
The use of the LSF provides a vehicle for WelTec and Whitireia to report on outcomes that progress towards the TES focus of providing quality education to diverse groups that see learners reach their full potential. The use of these broad measures allows for a holistic report that exemplifies how WelTec and Whitireia work towards all 6, often interconnected, TES priorities.
The activities of WelTec and Whitireia relate most directly to growing human capital, and in doing so, meeting the objectives of the TES. According to Treasury, human capital encompasses people’s skills, knowledge, physical and mental strength. These are the things which enable people to participate fully in work, study, recreation and in society more broadly.
Importantly, however, because the 4 capital stocks are intertwined, the two institutions are, to a greater or lesser extent, also contributing to the growth, distribution and sustainability of the other three stocks.
Financial and physical capital stock includes things like houses, roads, buildings, factories, equipment and vehicles. These are the things which make up the country’s physical and financial assets which have a direct role in supporting incomes and material living conditions. For WelTec and Whitireia, under the guidance of the TES, this means ensuring learners meet their full potential through increasing both individual and community productivity.
Social capital is what describes the norms and values that underpin society. It includes things like trust, the rule of law, the Crown-Māori relationship, cultural identity, and the connections between people and communities. Growing international connections and boosting the achievement of Māori and Pasifika learners are strategic priorities that encompass building social capital.
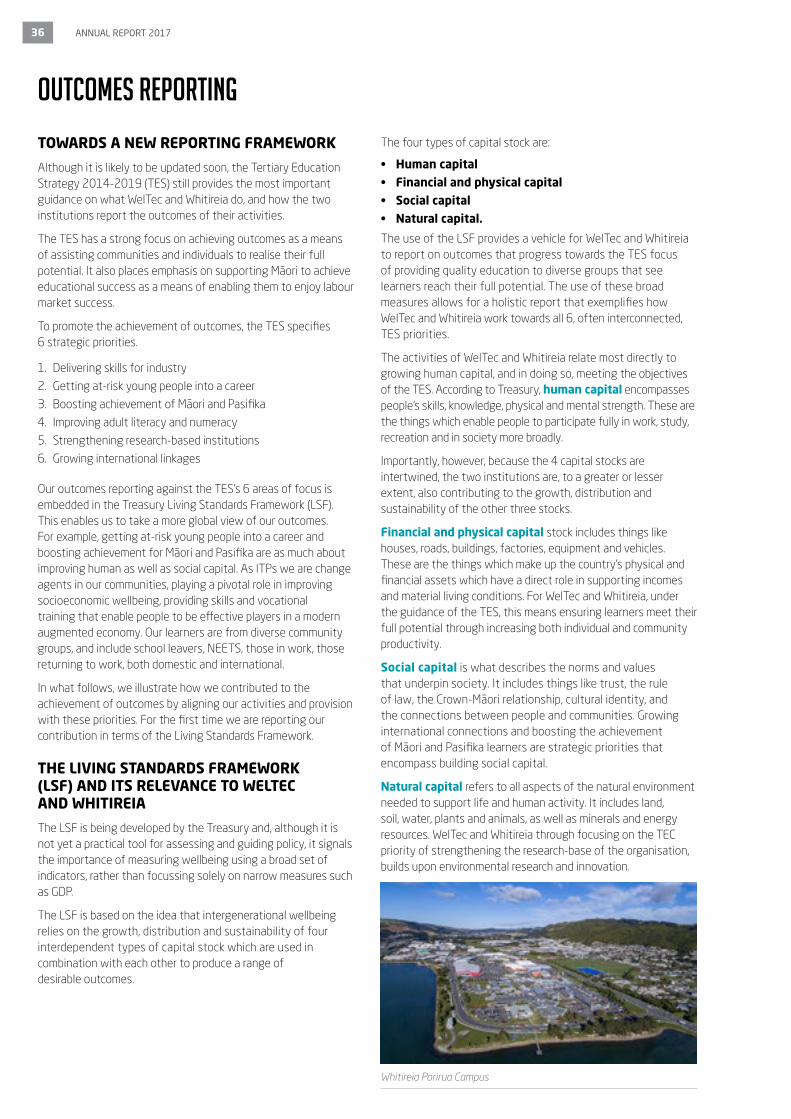
Natural capital refers to all aspects of the natural environment needed to support life and human activity. It includes land, soil, water, plants and animals, as well as minerals and energy resources. WelTec and Whitireia through focusing on the TEC priority of strengthening the research-base of the organisation, builds upon environmental research and innovation.
Whitireia Porirua Campus
WELTEC AND WHITIREIA 37
12. The percentages sum to more than 100 because a person can be involved in both employment and study.
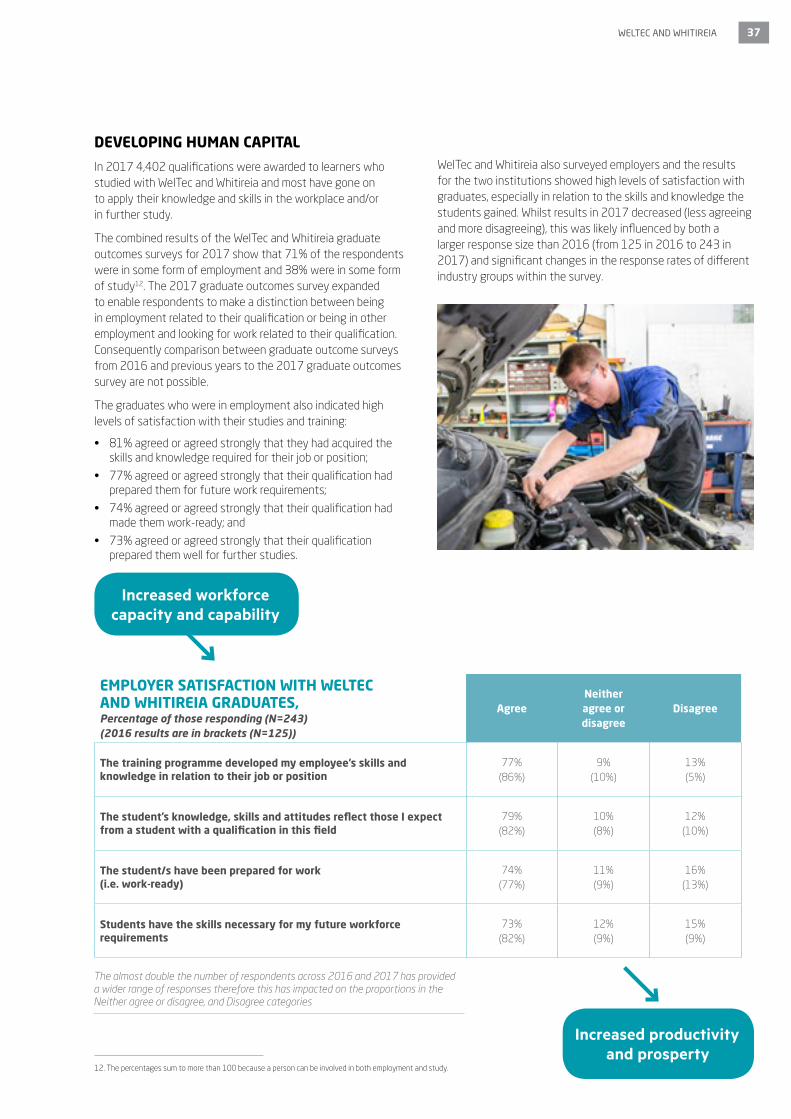
DEVELOPING HUMAN CAPITAL
In 2017 4,402 qualifications were awarded to learners who studied with WelTec and Whitireia and most have gone on to apply their knowledge and skills in the workplace and/or in further study.
The combined results of the WelTec and Whitireia graduate outcomes surveys for 2017 show that 71% of the respondents were in some form of employment and 38% were in some form of study12. The 2017 graduate outcomes survey expanded to enable respondents to make a distinction between being in employment related to their qualification or being in other employment and looking for work related to their qualification. Consequently comparison between graduate outcome surveys from 2016 and previous years to the 2017 graduate outcomes survey are not possible.
The graduates who were in employment also indicated high levels of satisfaction with their studies and training:
• 81% agreed or agreed strongly that they had acquired the skills and knowledge required for their job or position;
• 77% agreed or agreed strongly that their qualification had prepared them for future work requirements;
• 74% agreed or agreed strongly that their qualification had made them work-ready; and
• 73% agreed or agreed strongly that their qualification prepared them well for further studies.
WelTec and Whitireia also surveyed employers and the results for the two institutions showed high levels of satisfaction with graduates, especially in relation to the skills and knowledge the students gained. Whilst results in 2017 decreased (less agreeing and more disagreeing), this was likely influenced by both a larger response size than 2016 (from 125 in 2016 to 243 in 2017) and significant changes in the response rates of different industry groups within the survey.
Increased workforce capacity and capability
EMPLOYER SATISFACTION WITH WELTEC AND WHITIREIA GRADUATES, Percentage of those responding (N=243) (2016 results are in brackets (N=125))
AgreeNeitheragree or disagree
Disagree
The training programme developed my employee’s skills and knowledge in relation to their job or position
77% (86%)
9% (10%)
13% (5%)
The student’s knowledge, skills and attitudes reflect those I expect from a student with a qualification in this field
79% (82%)
10% (8%)
12% (10%)
The student/s have been prepared for work (i.e. work-ready)
74% (77%)
11% (9%)
16% (13%)
Students have the skills necessary for my future workforce requirements
73% (82%)
12% (9%)
15% (9%)
Increased productivity
and prosperty
The almost double the number of respondents across 2016 and 2017 has provided a wider range of responses therefore this has impacted on the proportions in the Neither agree or disagree, and Disagree categories
38 ANNUAL REPORT 2017
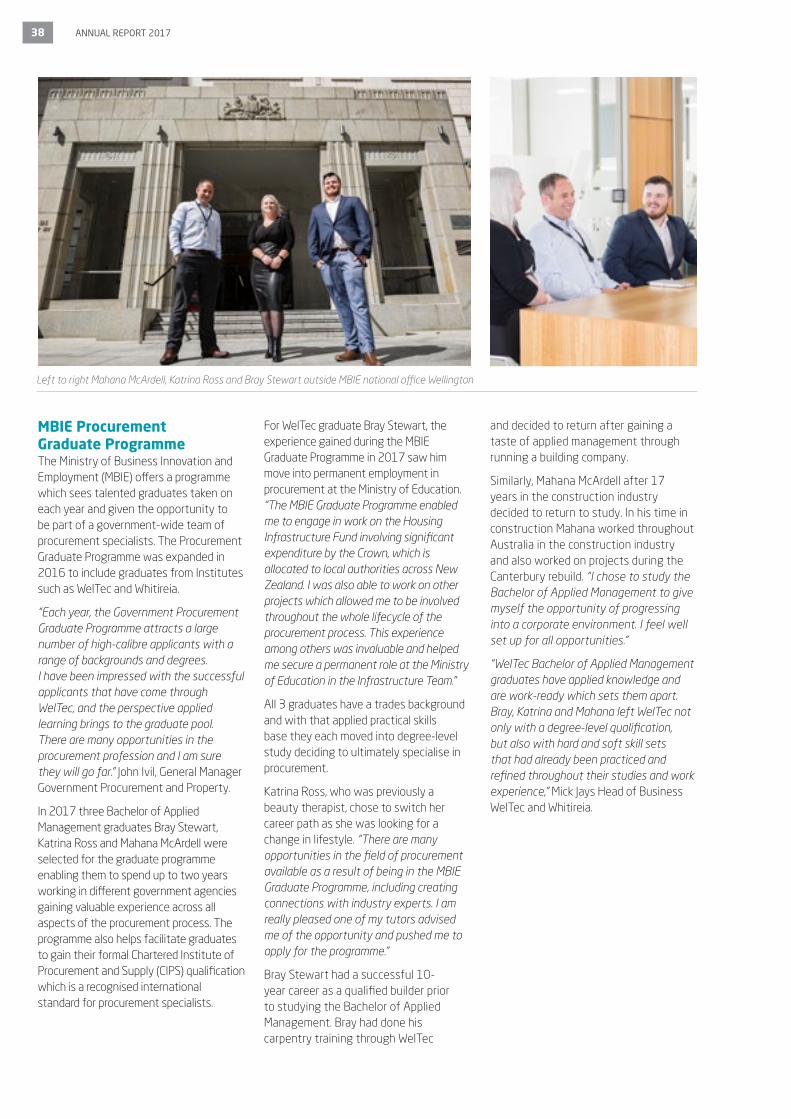
MBIE Procurement Graduate ProgrammeThe Ministry of Business Innovation and Employment (MBIE) offers a programme which sees talented graduates taken on each year and given the opportunity to be part of a government-wide team of procurement specialists. The Procurement Graduate Programme was expanded in 2016 to include graduates from Institutes such as WelTec and Whitireia.
“Each year, the Government Procurement Graduate Programme attracts a large number of high-calibre applicants with a range of backgrounds and degrees. I have been impressed with the successful applicants that have come through WelTec, and the perspective applied learning brings to the graduate pool. There are many opportunities in the procurement profession and I am sure they will go far.” John Ivil, General Manager Government Procurement and Property.
In 2017 three Bachelor of Applied Management graduates Bray Stewart, Katrina Ross and Mahana McArdell were selected for the graduate programme enabling them to spend up to two years working in different government agencies gaining valuable experience across all aspects of the procurement process. The programme also helps facilitate graduates to gain their formal Chartered Institute of Procurement and Supply (CIPS) qualification which is a recognised international standard for procurement specialists.
For WelTec graduate Bray Stewart, the experience gained during the MBIE Graduate Programme in 2017 saw him move into permanent employment in procurement at the Ministry of Education. “The MBIE Graduate Programme enabled me to engage in work on the Housing Infrastructure Fund involving significant expenditure by the Crown, which is allocated to local authorities across New Zealand. I was also able to work on other projects which allowed me to be involved throughout the whole lifecycle of the procurement process. This experience among others was invaluable and helped me secure a permanent role at the Ministry of Education in the Infrastructure Team.”
All 3 graduates have a trades background and with that applied practical skills base they each moved into degree-level study deciding to ultimately specialise in procurement.
Katrina Ross, who was previously a beauty therapist, chose to switch her career path as she was looking for a change in lifestyle. “There are many opportunities in the field of procurement available as a result of being in the MBIE Graduate Programme, including creating connections with industry experts. I am really pleased one of my tutors advised me of the opportunity and pushed me to apply for the programme.”
Bray Stewart had a successful 10-year career as a qualified builder prior to studying the Bachelor of Applied Management. Bray had done his carpentry training through WelTec
and decided to return after gaining a taste of applied management through running a building company.
Similarly, Mahana McArdell after 17 years in the construction industry decided to return to study. In his time in construction Mahana worked throughout Australia in the construction industry and also worked on projects during the Canterbury rebuild. “I chose to study the Bachelor of Applied Management to give myself the opportunity of progressing into a corporate environment. I feel well set up for all opportunities.”
“WelTec Bachelor of Applied Management graduates have applied knowledge and are work-ready which sets them apart. Bray, Katrina and Mahana left WelTec not only with a degree-level qualification, but also with hard and soft skill sets that had already been practiced and refined throughout their studies and work experience,” Mick Jays Head of Business WelTec and Whitireia.
Left to right Mahana McArdell, Katrina Ross and Bray Stewart outside MBIE national office Wellington

WELTEC AND WHITIREIA 39
Successful outcomes for Māori and Pasifika Trades Training (MPTT) In its fourth year operating, MPTT had another successful year engaging with 179 Māori and Pacific learners in pre-trades training (up to NZQA Level 4) who had experienced barriers to education and/or employment. In 2017 WelTec and Whitireia MPTT programmes extended across a variety of fields from mechanical engineering to hair and beauty, in which Māori and Pacific learners were able to access cultural support. Responding to demand from Iwi and industry, new programmes were introduced for delivery in 2018 including cookery, bakery and barbering.
Learners benefitted from working with job brokers who were able to help them become work ready and move them into apprenticeships/cadetships, employment or other further training. A record number of 55 Tool Grants were given out in 2017, helping graduates who had successfully been placed into an apprenticeship within 18 months of graduation cover the cost of the needed tools for their trade.
In 2017 the proportion of women enrolled in MPTT also increased reaching 26.3%. In the first year of MPTT 14.7% of MPTT learners identified as female, evidence of WelTec and Whitireia making progress in attracting women to the trades. Successful female graduates such as Azaria Felagai (pictured above), the recipient of the New Zealand Institute of Building ‘Most Promising First-Year Student’ award, are making steps towards
increasing gender diversity in the trades. Azaria is now successfully engaged in a carpentry cadetship with Hawkins where she studies in the evenings with WelTec. Without MPTT women like Azaria may not have realised their potential in a career path they previously may not have considered, thus increasing social health and wellbeing.
MPTT has also helped graduates such as Marcus Orzecki (Ngāti Toa) retrain after a back injury led him to rethink his career. With help from his experienced and industry-connected tutors he has been able to graduate, become employed in a relief driving role and begin looking at entering full time employment, ‘I think of my new career path as a lot fun, not just a job’.
MPTT continued to harness the talent of Māori and Pacific learners that are over-represented in New Zealand’s NEET youth, allowing them to enter into a learning environment that best supported their needs. In 2016 from a total of 205 learners, 92 entered a MPTT programme from secondary school and 32 had previously been unemployed or beneficiaries (2017 numbers not yet available). Providing a connection to community, and through the teaching and support methodologies applied throughout their time with WelTec and Whitireia, the NEETs participating in MPTT were provided with the key skills to succeed.
The MPTT model sees WelTec and Whitireia produce work-ready graduates with skills that are regionally in demand. Armed not only with a national
qualification MPTT learners achieved a Passport to Work which sets out key employability skills in demand by employers. This includes a driver licence, site safety, health and safety skills and other “softer skills” such as leadership, time management, team work and job readiness skills including CV writing and interview skills. Altogether and with the wrap around support provided by Iwi through Tamaiti Whangai, Ngāti Toa and the Pasifika Churches MPTT learners were supported to achieve and when the time came to graduate, enter the world of work in the best possible position to achieve their life goals.
MPTT has gained recognition of being a valid pathway for Māori and Pacific learners who may not have thrived in other forms of education. The collaborative approach at the core of the MPTT programme means that communities and Iwi come together, create change and are able to provide culturally responsive education.
MPTT graduate Marcus Orzecki
Azaria Felagai graduate of Māori and Pasifika Trades Training now works full time for Hawkins

40 ANNUAL REPORT 2017
GDP: $94.7 million
Employment: 974 FTEs
CONTRIBUTION TO THE WELLINGTON REGIONAL ECONOMY IN 201713:
DEVELOPING THE FINANCIAL AND PHYSICAL STOCK
The graduates of WelTec and Whitireia succeed in the workplace and are often instrumental in maintaining and developing the country’s physical assets; and the two institutions also play a significant role in maintaining the strength of the economy and, hence, the stock of financial assets.
The flow chart below illustrates (in simplified form) how WelTec and Whitireia contribute to economic growth in the Wellington region.
The two institutions’ operational expenditures generate GDP and employment, but their main and enduring effect is to produce well-educated and trained students who add to the capacity and capability of the regional and national workforce, so enabling increased levels of productivity and prosperity.
To put the contribution of Whitireia and WelTec’s operations to the Wellington regional economy into context, BERL estimates that total GDP in the region in 2017 was $31.6 billion, while employment was 236,332 FTEs. The two institutions’ contribution to GDP was, therefore, equivalent of 0.3% of the region’s total, and the contribution to employment was equivalent to 0.4% of the region’s total.
These estimates exclude the effect on the Wellington region’s economy, of spending by students to meet their living costs. Domestic students from outside Wellington inject spending into the region’s economy. Spending by international students boosts the national economy as well as the regional economy.
The two institutions’ contribution to regional GDP in 2016 was estimated to be $101.2 million, and their contribution
to regional employment was 1,017 FTEs. Between 2016 and 2017 a reduction in the number of EFTS delivered and reduction in operational income and expenditure led to a smaller contribution to GDP in 2017.
Over and above contributing to employment and GDP in the region, WelTec and Whitireia have a good record of helping to boost New Zealand’s exports. In 2017, the two institutions combined earned $23.4 million in fees from overseas students in 2017 by teaching almost 1,891 Equivalent Full-Time Students. Our international students have also contributed to New Zealand’s export earnings by bringing money into the country for their living expenses.
Increased
workforce capacity and capability
Increased
productivity and prosperty
Outcomes
GDP and
employment
Student
completions
Outputs
WelTec
and Whitireia provision
Activities
Inputs
Student fees and living expenses
Government
grants
How WelTec and Whitireia contribute to regional economic growth
13. The contributions shown are for the direct, indirect and induced effects, where the indirect and induced effects represent the flow-on, or multiplier, effects.

WELTEC AND WHITIREIA 41
CONTRIBUTING TO SOCIAL CAPITAL
As well as having the features described earlier, social capital is accumulated through activities and interventions including those that equip people with the ability to play a useful role as citizens, or that help people to live safely and securely. Social capital strongly complements human capital, as the following examples illustrate.
Rimutaka PrisonFor learners at Rimutaka Prison, 2017 was a successful year. In partnership with the Department of Corrections seven programmes were delivered, catering for 146 learners who were ready to take on the challenge of gaining a qualification under the School of Construction. At Rimutaka Prison, 2017 was also the first year a challenge was set for learners to build a house from scratch over 34 weeks. For 41.7% of Rimutaka learners it was their first year participating in tertiary education, and an opportunity to open up doors to new employment prospects and develop valued skill sets to help them succeed in their workplace, whānau and community upon release.
As one graduate identified, gaining literacy and numeracy skills was a challenge and perseverance was needed. WelTec tutors at Rimutaka Prison responded to the needs of their learners by embedding literacy and numeracy lessons into applied contexts such as painting, bricklaying and carpentry. This strategy proved successful with LNAAT results identifying all programmes at Rimutaka Prison resulting in learners increasing either their literacy or numeracy assessment results over the length of the programme, with the majority of these results identified as statistically significant. Improved literacy and numeracy skills equipped learners with a new confidence to successfully engage to be more resilience when faced with new challenges.
Furthermore, learners used their literacy and numeracy skills to complete individual portfolios showcasing the work they had completed and recording the practical skills they had applied. The results saw the first house built within Rimutaka Prison, complete with double glazed windows, insulation and three bedrooms. The house was proof learners had successfully
worked together not only to build a quality product but to gain nationally recognised qualifications to take with them once they were released from Rimutaka prison.
Success of priority learners within Rimutaka Prison was also celebrated in 2017 with 11 graduation ceremonies held. At Rimutaka Prison in 2017, 46% of learners identified as Māori, along with 13% who identified as Pacific learners and 12.3% under the age of 25 years. These priority groups saw positive course and qualification completion rates across all programmes offered within Rimutaka Prison, especially at Level 4 where all Māori and Pacific learners were enrolled successfully in the Certificate in Applied Decorating Skills qualification. At levels 2 and 3 qualification completion rates were also high in 2017.
When considering the broader impacts of our 2017 Rimutaka Prison graduates, one Level 3 New Zealand Certificate in Construction Trade Skills graduate noted ‘we learned about perseverance, about courage, about team work and leadership and most importantly being able to ask for help’. His qualification equipped him with the soft skills needed to meaningfully engage with those in his future workplace, whānau and wider community and in turn lower his risk of re-offending. In 2017, through programme delivery at Rimutaka Prison, graduates are now well equipped and qualified to one day recast their lives becoming productive and employed members of society.
Chris Gosling congratulates New Zealand Certificate in Construction Trade Skills (Allied Trades and Carpentry) graduates at Rimutaka Prison

42 ANNUAL REPORT 2017
Nga Vaka Family Violence Training Programme In 2017 Whitireia hosted the Pasfika Proud Nga Vaka Family Violence Training Programme where WelTec and Whitireia Chief Advisor Pacific Strategy and registered social worker, Jean Mitaera, led and facilitated the first delivery of the training programme. The programme came after the Champions of Change Fono in 2010, where 500 participants called for the Government and wider funders to look within Pacific cultures to inform how family violence programmes could best suit Pacific families and communities, as opposed to a limiting mainstream model.
Initiated by the Ministry of Social Development, the Nga Vaka o Kāiga Tapu or the Pacific Conceptual Framework used to address family violence in New Zealand was published in 2012. Nga Vaka o Kāiga Tapu breaks down into seven ethnic specific conceptual frameworks, of which Jean Mitaera and colleague Apii Rongo-Raea co-authored Turanga Māori, the Cook Islands Māori framework. Consequently the Nga Vaka o Kāiga Tapu framework led to the development of the Nga Vaka Family Violence Training Programme which after
piloting, evaluation and further refinement successfully took place in May 2017.
The Nga Vaka Family Violence Training Programme saw Whitireia staff, students and members of the wider Pacific community come together to gain an understanding of how family violence is defined and how family violence affects Pacific communities across New Zealand. The training included looking into the social, economic and political impacts of family violence on Pacific families and communities, and also incorporated unpacking relevant legislation and scope(s) of responsibility. “This is important because it develops a working knowledge of the limitations, extent and application of these laws given the type of violence,” Jean Mitaera.
For this programme to be delivered at the Porirua campus provided a meaningful opportunity for Whitireia to become a platform for community transformation and development. Putting action to Whitireia being about the people of their place, the Nga Vaka Family Violence Training Programme saw not only the Whitireia community but wider Porirua and Wellington region community come
together to influence positive change for victims and perpetrators of family violence.
As the Nga Vaka Family Violence Training Programme extends across a variety of professions such as teaching, nursing, social work, human resources and community workers, work is now underway to incorporate the important lessons learnt from the programme into professional development courses.
Due to the success of the Nga Vaka Family Violence Training Programme, 2018 delivery will be supported across New Zealand as well as the training for new trainers.
Jean Mitaera, “I’ve seen surprise in people when they understand the influence that they do have to support others, if not themselves, to transform their lives out of family violence and rebuild respectful relationships”.
Jean Mitaera (overlaid image) at one of the Pasifika Proud training sessions

WELTEC AND WHITIREIA 43
NURTURING NATURAL CAPITAL STOCK
Ensuring that the natural capital stock is able to support the needs of the population, without conflict with the ecosystem, requires much more than a passive approach. It requires active skills-based inputs to enable households, businesses and services to use resources sustainably, while conserving plant and animal life, and avoiding the depletion or degradation of mineral and other natural resources.
School of Engineering ensuring learners nurture the natural capital stockThe School of Engineering continued to teach learners about environmentally sustainable practices, resources and impacts within both Engineering and Built Environment programmes in 2017.
New Zealand Diploma in Architectural Technology students were challenged to design a medium density house built on shared land that has self-contained electricity and water supplies. The design also needed to consider another important component of sustainable design, ensuring the building could last across the whole of an individual’s life, from pram to wheel chair accessibility.
As part of the Bachelor of Engineering Technology final year projects, mechanical engineering student Craig Browne developed a design for a timber platform roof structure that could be constructed using locally sourced, sustainable resources and be built by unskilled, local workers. Working with client Cameron Smart of Wavefront Engineering Ltd, his design and research has potential to aid small, poorly resourced nations that see increasing demand for access to renewable energy sources.
Alongside teaching, for Academic Staff Member Dr. Najif Ismail in 2017 his research was published in the American Society of Civil Engineers, showcasing his work on developing concrete that reuses waste products and lowers the carbon footprint of concrete by 80%.
Waste Minimisation at New Zealand FestivalsLeanne Nicholas and Joany Grima of WelTec engaged in research looking into the facilitators and barriers of waste minimisation practices which are currently unregulated at New Zealand festivals. The research findings showed that the cost and time associated with developing plans, resourcing and management of service providers were central barriers, but also that festival organisers were willing to enhance their festival waste minimisation practices.
“Festival organisers learn how to “do” waste minimisation from observing other events, collaborating with colleagues, and attending workshops specific to addressing diverting waste produced at events from landfill, such as those run by the Sustainable Business Network,” Leanne Nicholas.
Image of CNC Plywood House Prototype.
Sustainable Timber Power Platform Roof Structure by Craig Browne

44 ANNUAL REPORT 2017
WHITIREIA HOSPITALITY AUDITS 1 AND 2 COMPARISON BY WEIGHT (KGS)
Organic
163
36.8
1.53
Paper and Cardboard
14
Plastics
11
Metal
01
Glass
9.615
Landfill
May 2016 July 2017
Porirua City Council, Organic Wealth Recycling Rewards Programme
In May 2016 Whitireia Hospitality instigated a free waste audit that showed 92% of their waste was either recyclable or compostable.
Fast forward to July 2017 Hospitality Programme Manager Wendy Gibson and her team started managing their waste.
This was sponsored by the Porirua City Council as part of their waste minimisation grant levy. Education workshops were carried out for staff and students to explain the recycling processes.
OUTSTANDING ACHIEVEMENTS
77%decrease in
Organic Waste
55%decrease in
paper & cardboard
100%decrease in
glass
82%decrease in all plastics
74%decrease in
overall landfill
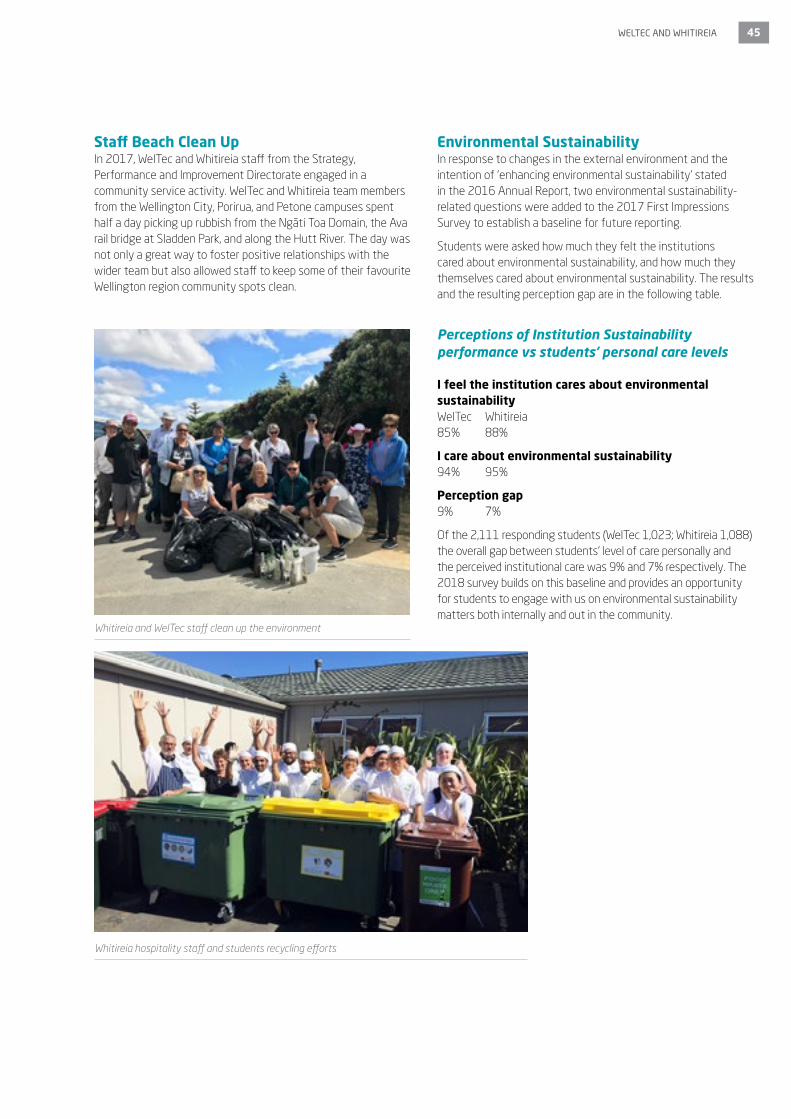
WELTEC AND WHITIREIA 45
Staff Beach Clean UpIn 2017, WelTec and Whitireia staff from the Strategy, Performance and Improvement Directorate engaged in a community service activity. WelTec and Whitireia team members from the Wellington City, Porirua, and Petone campuses spent half a day picking up rubbish from the Ngāti Toa Domain, the Ava rail bridge at Sladden Park, and along the Hutt River. The day was not only a great way to foster positive relationships with the wider team but also allowed staff to keep some of their favourite Wellington region community spots clean.
Environmental SustainabilityIn response to changes in the external environment and the intention of ‘enhancing environmental sustainability’ stated in the 2016 Annual Report, two environmental sustainability-related questions were added to the 2017 First Impressions Survey to establish a baseline for future reporting.
Students were asked how much they felt the institutions cared about environmental sustainability, and how much they themselves cared about environmental sustainability. The results and the resulting perception gap are in the following table.
Perceptions of Institution Sustainability performance vs students’ personal care levels I feel the institution cares about environmental sustainability WelTec Whitireia 85% 88%
I care about environmental sustainability 94% 95%
Perception gap 9% 7%
Of the 2,111 responding students (WelTec 1,023; Whitireia 1,088) the overall gap between students’ level of care personally and the perceived institutional care was 9% and 7% respectively. The 2018 survey builds on this baseline and provides an opportunity for students to engage with us on environmental sustainability matters both internally and out in the community.
Whitireia and WelTec staff clean up the environment
Whitireia hospitality staff and students recycling efforts

46 ANNUAL REPORT 2017
Outputs planned for in 2017 Year’s Progress
BUSINESS PLAN PERFORMANCEThe 2017 WelTec and Whitireia Business Plan is linked to both the Strategic Framework and the 2017–2018 Investment Plan. This signals a gearing up of the WelTec and Whitireia strategic partnership, the next evolutionary step in:
• a co-ordinated and strategic approach to academic planning and provision;
• a regionally co-ordinated approach to Māori aspirations and success;
• a regionally co-ordinated approach to Pasifika participation and achievement;
• a regionally co-ordinated approach to pathways for our ākonga;
• a co-ordinated regional approach to both community and industry need; and
• shared services and facilities, including harmonization of systems and processes that adds value and will enable further collaboration at a later stage.
WHOLE OF ORGANISATION ACTIVITIES
The planned activities contributed to the Strategic Goals
Whole of Learning Framework: Providing relevant and high quality programmes and services to meet the needs of industry and the community
Whole of System:Taking a system-wide perspective to the delivery of coherent, effective and efficient learning services
The Strategic Framework 2017 – 2021 is implemented The WelTec and Whitireia Business Plan 2017 and the Schedule of Activities 2017-2021 were approved by the Joint Leadership Team (JLT) and Council in February 2017.
The Strategic Framework was progressively integrated into institutional planning and decision-making procedures including the development during 2017 of revised Pacific and Academic Strategies. The framework was used as a tool for communicating the partnership values, vision and goals to staff. The 2017 Workplace Environment Survey (WES) results showed a small increase (4-5%) in staff agreement with the statement “The work I am doing is well aligned with WelTec and Whitireia strategic objectives”.
Strategic Programme Portfolio Procedures and guidelines were developed early in the year and used by the Portfolio Committee to review the Strategic Programme Portfolios of three schools and approve 10 New Ideas and 4 Programme Proposals.
Te Kāhui Auaha is ready for learning and teaching in February 2018
Te Kāhui Auaha steadily progressed towards its February 2018 opening for learning and teaching. The Building Practical Completion was achieved and the relocation project was delivered on time. Te Kāhui Auaha (the name gifted to the campus building) was formally opened in a dawn ceremony by elders from Te Ātiawa and Ngāti Toa.
Systems are in place and ready for teaching delivery to start at the building in March 2018. The setting up of venues as businesses was progressed with external bookings for 2018 confirmed.
The new Bachelor of Creativity, with majors in Digital Media, Music, Performing Arts, Toi Poutama, Visual Arts and Writing, which was planned to be a keystone offering in the new building was approved by NZQA and TEC at the end of the year for 2018 delivery.

WELTEC AND WHITIREIA 47
Outputs planned for in 2017 Year’s Progress
Consistent performance management, professional development, recruitment and health and safety systems across WelTec and Whitireia
Progress was made on developing joint WelTec and Whitireia policies and procedures to support professional development. In the 2017 WES Report, the section average for agreement with the following set of professional development measures was 77% (76% in 2015)..
• I have had access to the training I need to do my job effectively
• I have appropriate professional and personal development opportunities
• I have access to reasonable funding for my development
• I am encouraged to develop my career I am able to make use of my professional development time
An integrated approval process for recruitment for both institutes was developed and implemented. This included extending the use of an online recruitment tool for advertising and managing applications across both institutions.
Health and safety systems were integrated across WelTec and Whitireia. All health and safety guidelines were approved for online publication by the digital workplace committee in early 2018.
Centres of Learning are implemented The new Centres of Learning structure was created and a Heads of School Management team established to oversee the implementation process. The 2017 portfolio was delivered within the new schools structure.
WelTec and Whitireia Campus Development Plan is refreshed
The Mohuia Campus and the Church Street campuses were closed at the end of the year with staff and students relocating into spaces in the city, Petone and Porirua.
The Performance Centre in Vivian Street operated throughout 2017 with venue bookings ending in early 2018. The Film School premises, also in Vivian Street, will not be used beyond March 2018. Both these leases continue through 2018 however negotiations to minimise costs continue. Staff and students from these sites transferred to Te Kāhui Auaha early in 2018.
Surplus properties are in the process of being sold. This includes Commerce Crescent (Whitireia) and for WelTec it includes the selling of properties on Jackson Street, Elizabeth Street (two properties), Wakefield Street and Victoria Street Petone.
Campus Development has focused on fewer consolidated higher quality sites with leases being closed out for the smaller sites and surplus properties being sold.
In 2018, following on from the Council’s strategic planning work, the Campus Development Plan will be refreshed to align with strategic objectives.

48 ANNUAL REPORT 2017
Outputs planned for in 2017 Year’s Progress
Further implementation of the WelTec and Whitireia integrated systems
The review of WelTec and Whitireia enrolment processes was completed and a new structure that allowed for a responsive and timely student enrolment experience across WelTec and Whitireia was implemented. On-line enrolment forms are now available across both institutions.
There were significant changes to internal systems to improve efficiency and effectiveness through enhanced processes and new systems. Online student enrolment was introduced at Whitireia to enable easier access to, and faster processing, of applications, a new financial system was introduced across WelTec and Whitireia improving core finance systems with a new single instance of the TechOne Finance system implemented in August 2017. Three new websites (WelTec, Whitireia and Te Auaha) with enhanced capability including an advanced Digital Student Attraction Platform went live (WelTec’s to be finalised in 2018), a new health and safety system was introduced with a major focus on capturing reporting of incidents, and an online platform for staff to see and share information linked to the performance in/of their academic programmes.
Institutional viability and sustainability Whitireia and WelTec are addressing the financial performance challenges consistent with the overall business strategy. These actions fall into three main areas: Programme Rationalisation, Property Consolidation and Service Integration.
1. Programme Rationalisation
• Over 2018 and 2019 the Whitireia and WelTec programme portfolio will be reduced by no longer offering those with historically low enrolments.
2. Property Consolidation
• More efficient use of property (reducing lease costs where owned property is available and releasing non-strategic and surplus property for sale for reinvestment).
• Elimination of duplication, and investment in quality facilities to serve the whole region. Existing examples include Te Auaha (Creative), Wikitoria Katene (Health) and the Wellington Regional School of Construction (Trades).
• Provision from the Porirua Mohuia campus has been relocated to the main Porirua campus. Mohuia to be disposed of in 2018.
• Leased premises in Wellington City will be progressively exited as leases expire and delivery transferred to new sites (e.g. Te Kāhui Auaha) or to existing campuses at Petone and Porirua
Consolidation enables:
• The outcome of the initiatives above in the context of the overall strategy for the partnership will see, within two years, the consolidation of substantive provision within the Wellington region on campuses with high quality facilities thereby creating a hub and spoke model of delivery
These sites will operate as hubs with quality facilities and services for their specialist discipline together with entry points for disciplines offered at other sites. Business would be available at a number of sites, utilising technology to facilitate economically sustainable provision.
3. Service Integration
Since the commencement of the strategic partnership between Whitireia and WelTec a range of services have been integrated resulting in improved services and reduced costs. These include ICT, Campus Services and Procurement. Moving forward this integration of services will be further extended to provide further economies of scale across potential integration of enrolment, school administration and management, finance and other back office services.
WELTEC AND WHITIREIA 49
Outputs planned for in 2017 Year’s Progress
The new Strategic Portfolio Framework is used to review all learning programmes across WelTec and Whitireia and subsidiaries over 2017 and 2018
All academic programmes due to start in February/March 2018 were submitted to NZQA on time in 2017 and all programmes have been approved for delivery. Many of these programmes are for delivery of New Zealand qualifications developed as part of NZQA’s mandatory review of tertiary qualifications. NZQA accreditation for delivery of the new Bachelor of Creativity degree was significant as this degree is the foundation programme for Te Auaha and represents a new and different approach to teaching creative arts.
Processes were developed to ensure work-integrated learning is built into programme development.
An industry and community engagement plan that is purposeful and effective and results in relevant programmes
The Joint Leadership Team approved a new approach to industry engagement for 2018 based on Centre of Learning Industry Advisory Groups
Good teaching and learning practice is shared across Centres of Learning to improve outcomes for learners
The Teaching and Learning Forum “Working together – learner, colleagues, and teams” was held on the WelTec Petone Campus in 24 February 2017. ‘Discover Te Auaha’, a five day staff development event, took place during the week of 10-14 July 2017 for the diverse groups of staff who will be working in Te Kāhui Auaha. A wide range of other activities were offered across all schools and most campuses.
PRIORITY 1 DELIVERING SKILLS FOR INDUSTRY
Whole of Learning Framework:Providing relevant and high quality programmes and services to meet the needs of industry and the community
Whole of Person:Partnering through the learning and career journey. Helping learners to increase their contribution to society

50 ANNUAL REPORT 2017
Outputs planned for in 2017 Year’s Progress
Student, Graduate and Employer Satisfaction Surveys provide valid and reliable data that supports evaluation and improvement
A number of improvements were made to survey practice during the year which included: • Implementation of an Evaluation Kit across both institutions;• Personalised emailed invitations to participate in surveys which
resulted in increased response rates;• Investigation of alternative ways of collecting learner feedback, e.g.
collection of oral feedback at an end of year programme event in order to increase feedback from Māori respondents; and
• A Teacher Course Survey (TCS) review was completed.
The 2017 student and graduate surveys were completed for 2017 annual reporting. Student Experience satisfaction rates for 2017 (2016) were 86% (86%) for WelTec and 92% (90%) for Whitireia.
The Graduate Employment Outcomes Survey 2017 reported graduates indicating engagement in employment or further education at rates of 90% (82%) for Whitireia and 91% (77%) for WelTec. Specific satisfaction responses in relation to graduate employment outcomes were as indicated in the table below.
Whitireia and WelTec Graduate Employment Outcomes 2016-2017 by percent14
Indicator 2016 2017
In Employment I was adequately prepared for
employment (I am work-ready).
79% 81% 72% 76%
I have the skills and knowledge
I require for my job or position.
92% 90% 78% 84%
Further Study Subject-specific practical
skills and theory matched the
requirements of my further
study
NA NA 77% 78%
Overall, my qualification
prepared me well for new
studies
NA NA 70% 76%
The Employer Survey undertaken in the first two months of 2018 concludes Employers overall very satisfied in the skills and knowledge of WelTec graduates is 78% and 84% for Whitireia.
14. Low response rates in 2017 (for WelTec — 22.76% and for Whitireia — 19.58%) mean caution must be taken when interpreting the results
WELTEC AND WHITIREIA 51
Outputs planned for in 2017 Year’s Progress
Extension of the secondary/tertiary interface to further support young people at risk into tertiary education
A total of 240 Trades Academy places were filled in Semester 1 and a further 20 places were allocated by the Ministry of Education to meet demand from secondary schools providing a total of 260 places for 2017.
Dual Pathways programmes were implemented in Health from Semester 1 (Whitireia), and in Hospitality from Trimester 2 (WelTec) and Term 4 (Whitireia).
The planned 2017 portfolio is delivered; learners are supported to achieve within the new Centres of Learning
WelTec and Whitireia continued to provide Youth Guarantee and Level 1 and 2 programmes during 2017. In order to support these priority and foundation students, additional activities were held across campuses, and dedicated pastoral care staff were assigned to work closely with students and support staff delivering the programmes. Whānau events were held throughout the year to encourage families to be aware and supportive of students’ learning journeys. In addition students were involved in sporting and cultural events outside of their scheduled class times. Extra support was provided to students, along with referrals and links with outside agencies, such as Kāpiti Youth Services and Vibe where mental health and budget services were required. The TEC literacy and numeracy diagnostic tool identified those students for whom additional support was needed to complete their studies. The Revive tool, an application of the APlus+ system, was also used so student at-risk factors were identified quickly and remedial action taken to improve student success.
The joint careers model was developed and approved and will be implemented by the Director Learner Journey in 2018.
Commissioned market research was initiated in the final quarter of 2017 for mid-2018 completion. The outcomes of this research and the review of the Marketing function will inform the development of the marketing strategy.
The Social Impact Measures Final Report was completed and a first in family measure was piloted in the 2017 First Impressions Survey. A reliable set of baseline data was unable to be constructed as there were problems with the validity and reliability of the measure. The measure will be reviewed and retested in the 2018 First Impressions Survey.
PRIORITY 2 GETTING AT-RISK YOUNG PEOPLE INTO A CAREER
Whole of Person:Partnering through the learning and career journey. Helping learners to increase their contribution to society
Whole of Community:Collaborating with and contributing to Iwi, industry, secondary schools, Pasifika and the wider community
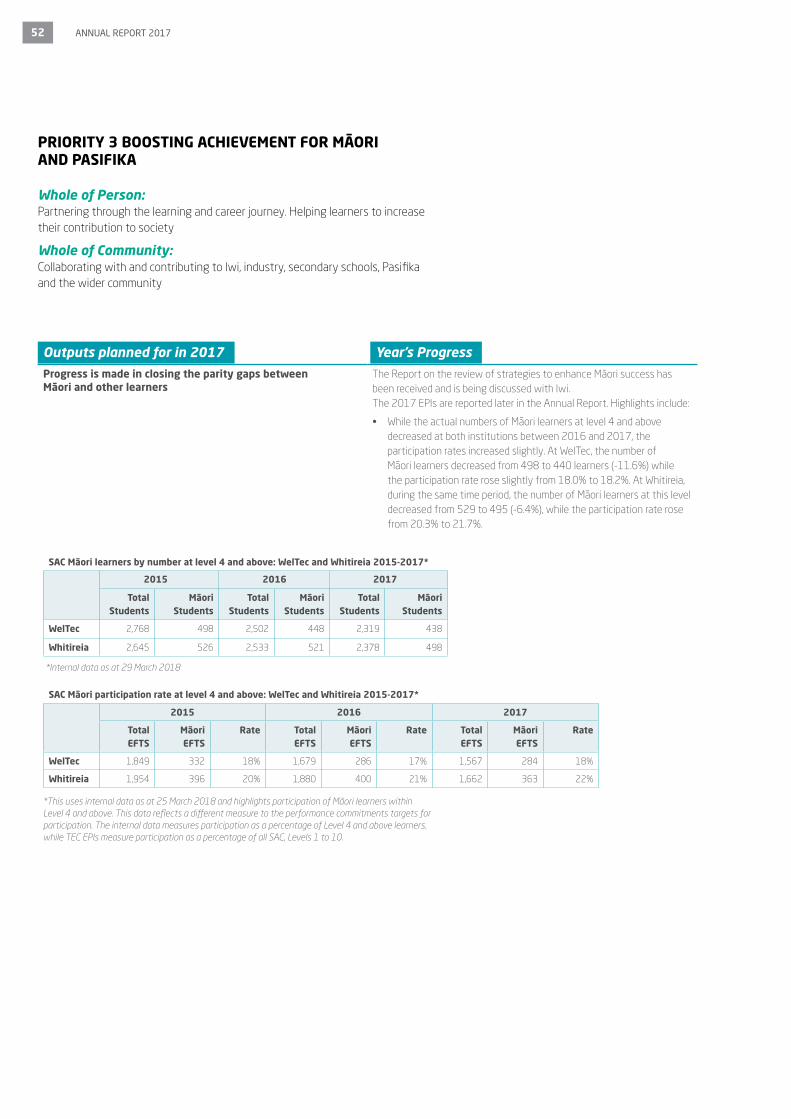
52 ANNUAL REPORT 2017
Outputs planned for in 2017 Year’s Progress
Progress is made in closing the parity gaps between Māori and other learners
The Report on the review of strategies to enhance Māori success has been received and is being discussed with Iwi. The 2017 EPIs are reported later in the Annual Report. Highlights include:
• While the actual numbers of Māori learners at level 4 and above decreased at both institutions between 2016 and 2017, the participation rates increased slightly. At WelTec, the number of Māori learners decreased from 498 to 440 learners (-11.6%) while the participation rate rose slightly from 18.0% to 18.2%. At Whitireia, during the same time period, the number of Māori learners at this level decreased from 529 to 495 (-6.4%), while the participation rate rose from 20.3% to 21.7%.
SAC Māori learners by number at level 4 and above: WelTec and Whitireia 2015-2017*
Total Students
Māori Students
Total Students
Māori Students
Total Students
Māori Students
WelTec 2,768 498 2,502 448 2,319 438
Whitireia 2,645 526 2,533 521 2,378 498
SAC Māori participation rate at level 4 and above: WelTec and Whitireia 2015-2017*
2015 2016 2017
Total EFTS
Māori EFTS
Rate Total EFTS
Māori EFTS
Rate Total EFTS
Māori EFTS
Rate
WelTec 1,849 332 18% 1,679 286 17% 1,567 284 18%
Whitireia 1,954 396 20% 1,880 400 21% 1,662 363 22%
PRIORITY 3 BOOSTING ACHIEVEMENT FOR MĀORI AND PASIFIKA
Whole of Person:Partnering through the learning and career journey. Helping learners to increase their contribution to society
Whole of Community:Collaborating with and contributing to Iwi, industry, secondary schools, Pasifika and the wider community
*This uses internal data as at 25 March 2018 and highlights participation of Māori learners within Level 4 and above. This data reflects a different measure to the performance commitments targets for participation. The internal data measures participation as a percentage of Level 4 and above learners, while TEC EPIs measure participation as a percentage of all SAC, Levels 1 to 10.
*Internal data as at 29 March 2018
2015 2016 2017

WELTEC AND WHITIREIA 53
Progress is made in closing the parity gaps between Pasifika and other learners The 2017 EPIs are reported later in the Annual Report. Highlights include:
• Key 2017 EPIs for WelTec with interim course completion results of 67% (2016 final: 72%) in SAC level 3+ and 69% (2016 final: 69%) in SAC level 4+. The interim WelTec qualification completion results for Pasifika learners is 58% (2016 final: 65%) in SAC level 3+ and 59% (2016 final: 61%) SAC level 4+. There are a number of course and qualification completion results to be presented at the next SDR in April 2018 which should have the overall completion results on par with 2016.
SAC Pasifika learners by number at level 4 and above: WelTec and Whitireia 2015-2017*
Total Students
Pasifika Students
Total Students
Pasifika Students
Total Students
Pasifika Students
WelTec 2,768 280 2,502 291 2,319 308
Whitireia 2,645 494 2,533 483 2,378 420
SAC Pasifika participation rate at level 4 and above: WelTec and Whitireia 2015-2017
2015 2016 2017
Total EFTS
Pasifika EFTS
Rate Total EFTS
Pasifika EFTS
Rate Total EFTS
Pasifika EFTS
Rate
WelTec 1,849 181 9.8% 1,679 175 10.4% 1,567 185 11.8%
Whitireia 1,954 394 20.2% 1,880 386 20.5% 1,662 324 19.5%
Outputs planned for in 2017 Year’s Progress
*Internal data as at 29 March 2018
2015 2016 2017
• Whitireia interim 2017 course completion results of 82% in Level 3+ Pasifika learners (2016 final: 80%) and 83% in level 4+ (2016 final: 79%). Pacific learners interim qualification completion results are 79% for level 3+ (2016 final: 76%) and 81% level 4+ (2016 final: 73%). Pacific learners have improved in both course and qualification completion. Course completion is mostly finalised at the December 2017 SDR, are additional qualification completion results to be presented in the April 2018 SDR.
• Between 2016 and 2017, the total number of Pacific learners in the postgraduate ICT (information and communications technology) programmes increased from none in 2016 to 1 in 2017. The participation rate of 8% in 2017.

54 ANNUAL REPORT 2017
PRIORITY 4 IMPROVING ADULT LITERACY AND NUMERACY
Whole of Person:Partnering through the learning and career journey. Helping learners to increase their contribution to society
Outputs planned for in 2017 Year’s Progress
Literacy and numeracy skills will be embedded in all levels 1-3 programmes
At both WelTec and Whitireia, 100% of levels 1-3 programmes have embedded literacy and numeracy. Work refining the embedding and improvement of learner literacy and numeracy in levels 1-3 programmes continued during 2017.
Achievement of Diagnostic Testing Targets for WelTec and Whitireia SAC level 1-3 and Youth Guarantee learners
Num
ber r
equi
ring
initi
al a
sses
smen
t
Num
ber w
ho
rece
ived
an
initi
al
asse
ssm
ent
Num
ber r
equi
ring
a pr
ogre
ss
asse
ssm
ent
Num
ber w
ho
rece
ived
a p
rogr
ess
asse
ssm
ent
Initi
al A
sses
smen
t R
ate
Prog
ress
as
sess
men
t ra
te
WelTec 2,058 1,873 1,219 774 91.0% 63.5%
Whitireia 1,480 1,091 724 410 73.7% 56.6%
91% of WelTec and 73.7 % of Whitireia SAC level 1-3 and Youth Guarantee learners were given the initial diagnostic assessment. Of the learners who completed the initial diagnostic assessment, 63.5% of WelTec learners and 56.7% of Whitireia learners completed a progress assessment (excluding those assessed at Step 4 reading or Step 5 numeracy and above)
Professional development to ensure staff have the knowledge and skills to build literacy and numeracy skills in learners and use the Assessment Tool for other cohort groups at higher levels.
The LLN reference/working group was established and developed a range of resources for tutors to use in embedding of literacy and numeracy. Of the 36 tutors teaching at Levels 1-2, 92% either have, or are currently enrolled in, NZCALNE or an equivalent qualification.

WELTEC AND WHITIREIA 55
PRIORITY 5 STRENGTHENING RESEARCH-BASED INSTITUTIONS
A more joined up approach to research across Whitireia and WelTec that strengthens the focus on developing research capability and enhancing research productivity and innovation
Outputs planned for in 2017 Year’s Progress
Develop a WelTec and Whitireia Research Plan A Research and Innovation Strategy was approved by the Academic Board.
A 2017-2021 Research Implementation Plan was drafted and will be presented to the February 2018 Academic Board.
Increase participation and capability of staff to engage in research
A WelTec and Whitireia Research Symposium – “Innovating for Industry and Community” was successfully delivered with Open Polytechnic.
57% research capable staff at WelTec participated in research during 2017. This is a substantial improvement on 2016 participation of 42%. Whitireia research capable staff is a slight improvement from 62% in 2016 to 63% in 2017 participation in research.
Increase collaborative research-based partnerships with industry
A range of new collaborative research relationships were undertaken with industry including:
• An assessment of steam availability for fire suppression at IPL, Gladstone, Westland, The School of Engineering consultancy service to Olsson Fire and Risk
• The School of Engineering and Sojol Limited working to develop a solar air heater to improve heating and ventilation of NZ homes
• Publishing (Applied) producing books and digital publications with a range of industry partners
Develop inter/trans-disciplinary projects within and across Centres of Learning
The following inter/trans-disciplinary research projects were developed:
• Tourism Industry Association (TIA) commissioned, WelTec to complete its State of the Industry report. Delivered by School of Hospitality and Tourism with School of Creativity
• Physical and Digital Anatomical Modelling, interdisciplinary project School of Health and School of Creativity
• Seismic/Disaster management schools of Engineering, IT, and Business
• From Good to Great: The 10 Habits of Phenomenal Educators for Pasifika Learners. School of Social Services sub-contract with Victoria University
• Investigating the viability of a work-based degree apprenticeship. WelTec through the School of Engineering has been commissioned by the TEC to undertake this work.
• Outdoor wireless Signal Penetration, School of IT and Zealandia
• School of IT- Developing Kapa Haka judging APP, and assisting Te Ātiawa develop a website
Prepare for the 2018 PBRF round A review of staff research outputs was completed to identify staff who exhibit a level of research activity that may attain a PBRF rating. A plan and timetable was developed and posted on the Research and Innovation home page. Workshops were held with schools for staff who will submit evidence portfolios.
56 ANNUAL REPORT 2017
PRIORITY 6 GROWING INTERNATIONAL LINKAGES
Whole of Place:Engaging with people across the country and across the world to ensure our programmes and services are relevant, portable and high-quality
Outputs planned for in 2017 Year’s Progress
A more integrated approach to marketing WelTec and Whitireia and subsidiary programmes to key international markets
During 2017, five new partnerships were formalised in China (1), Thailand (1), and India (3) with pipelines for Vietnam and the United Arab Emirates (UAE) also identified for further development in 2018. The new partnership agreements included three Memoranda of Understanding (MoU) in India. These were with Shiv Nadar University (Delhi) for Engineering/IT/Creative Industries; Jaipuria Institute of Management (Delhi) for IT/Business; and Innovative Film Academy (Bangalore) for Creative Industries.
Alumni development was postponed until after the WelTec website redevelopment had been completed.
Tutor exchange activity is likely to commence in 2018, while establishing student pathways typically takes another one to two years.
International EFTS, particularly in Auckland, are continuing to track down across both the ITP and PTE sectors due to ongoing uncertainty around New Zealand immigration policy, work rights and residency pathways for International students. There has also been significantly increased competition for students from both South and South-East Asia from other English-speaking countries, especially Canada and Australia, with work rights for international graduates extended out to as much as three or four years depending on qualifications.

WELTEC AND WHITIREIA 57
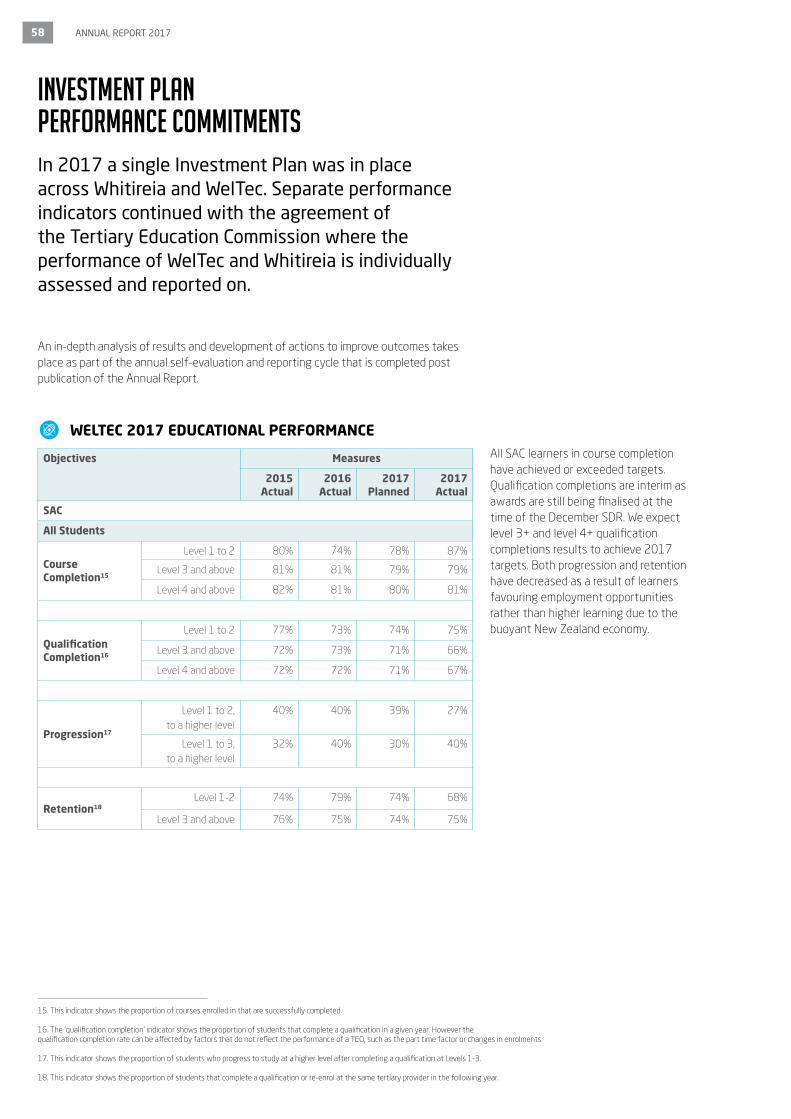
58 ANNUAL REPORT 2017
Investment Plan Performance CommitmentsIn 2017 a single Investment Plan was in place across Whitireia and WelTec. Separate performance indicators continued with the agreement of the Tertiary Education Commission where the performance of WelTec and Whitireia is individually assessed and reported on.
Objectives Measures
2015 Actual
2016 Actual
2017 Planned
2017 Actual
SAC
All Students
Course Completion15
Level 1 to 2 80% 74% 78% 87%
Level 3 and above 81% 81% 79% 79%
Level 4 and above 82% 81% 80% 81%
Qualification Completion16
Level 1 to 2 77% 73% 74% 75%
Level 3 and above 72% 73% 71% 66%
Level 4 and above 72% 72% 71% 67%
Progression17
Level 1 to 2, to a higher level
40% 40% 39% 27%
Level 1 to 3, to a higher level
32% 40% 30% 40%
Retention18Level 1-2 74% 79% 74% 68%
Level 3 and above 76% 75% 74% 75%
All SAC learners in course completion have achieved or exceeded targets. Qualification completions are interim as awards are still being finalised at the time of the December SDR. We expect level 3+ and level 4+ qualification completions results to achieve 2017 targets. Both progression and retention have decreased as a result of learners favouring employment opportunities rather than higher learning due to the buoyant New Zealand economy.
WELTEC 2017 EDUCATIONAL PERFORMANCE
An in-depth analysis of results and development of actions to improve outcomes takes place as part of the annual self-evaluation and reporting cycle that is completed post publication of the Annual Report.
15. This indicator shows the proportion of courses enrolled in that are successfully completed. 16. The ‘qualification completion’ indicator shows the proportion of students that complete a qualification in a given year. However the qualification completion rate can be affected by factors that do not reflect the performance of a TEO, such as the part time factor or changes in enrolments. 17. This indicator shows the proportion of students who progress to study at a higher level after completing a qualification at Levels 1-3. 18. This indicator shows the proportion of students that complete a qualification or re-enrol at the same tertiary provider in the following year.

WELTEC AND WHITIREIA 59
Objectives Measures
2015 Actual
2016 Actual
2017 Planned
2017 Actual
SAC
Māori19
Course Completion
Level 3 and above 75% 75% 73% 72%
Level 4 and above 76% 77% 74% 75%
Qualification Completion
Level 3 and above 65% 65% 63% 57%
Level 4 and above 63% 65% 61% 56%
ProgressionLevel 1 to 3, to a
higher level28% 38% 28% 35%
Retention Level 3 and above 73% 67% 70% 67%
Participation20
Level 1 to 2 1.6% 1.2% 0.7% 0.9%
Level 3 and above 20% 20% 17% 21%
Level 4 and above 13% 11% 11% 13%
Objectives Measures
2015 Actual
2016 Actual
2017 Planned
2017 Actual
SAC
Pasifika19
Course Completion
Level 3 and above 69% 72% 73% 67%
Level 4 and above 67% 69% 74% 69%
Qualification Completion
Level 3 and above 54% 65% 60% 58%
Level 4 and above 46% 61% 59% 59%
ProgressionLevel 1 to 3, to a
higher level26% 36% 25% 42%
Retention Level 3 and above 70% 65% 68% 67%
Participation20
Level 1 to 2 0.7% 0.8% 1.0% 0.5%
Level 3 and above 11% 12% 10% 13%
Level 4 and above 7% 7% 6% 8%
WELTEC MĀORI EDUCATIONAL PERFORMANCE
WELTEC PASIFIKA EDUCATIONAL PERFORMANCE
Māori learner achievement continues to be consistent over the last three years. Some qualification completions for 2017 are not finalised until early 2018. Qualification completion rates are therefore expected to increase after the April SDR.
Pasifika learners while not achieving the majority of 2017 targets have maintained their performance levels to previous years. One of the factors leading to the improvement in progression is due to Pasifika MPTT learners progressing into apprenticeship training through Industry Training Organisations or WelTec’s cadetships. Some qualification completions for 2017 are not finalised until early 2018. Qualification completion rates are therefore expected to increase after the April SDR.
19. % of Priority Group EFTS as % of total EFTS of the designated group. 20. Participation is calculated based on the proportion of these EFTS to all SAC EFTS at each institution.

60 ANNUAL REPORT 2017
Objectives Measures
2015 Actual
2016 Actual
2017 Planned
2017 Actual
SAC
Learners aged Under 25
Course Completion
Level 3 and above 79% 79% 77% 77%
Level 4 and above 79% 79% 77% 80%
Qualification Completion
Level 3 and above 67% 71% 65% 56%
Level 4 and above 65% 68% 64% 54%
ParticipationLevel 3 and above 58% 58% 57% 59%
Level 4 and above 43% 39% 42% 41%
WELTEC LEARNERS AGED UNDER 25 EDUCATIONAL PERFORMANCEUnder 25 learner qualification completion results are interim with awards being finalised since the submission of the December 2017 SDR. We expect the final results will achieve 2017 targets. Some qualification completions for 2017 are not finalised until early 2018. Qualification completion rates are therefore expected to increase after the April SDR.
Objectives Measures
2015 Actual
2016 Actual
2017 Planned
2017 Actual
Youth Guarantee
Course Completion
Level 1 93% 86% 80% 100%
Level 2 74% 56% 71% 57%
Level 3 81% 80% 78% 80%
Qualification Completion
Level 1 to 2 72% 52% 60% 60%
Level 3 73% 79% 71% 65%
ProgressionLevel 1 to a higher level
60% 96% 45% 50%
Level 2 toa higher level
73% 78% 67% 53%
Level 3 to a higher level
65% 59% 26% 53%
Retention Level 1 81% 94% 78%50%
Level 2 64% 67% 61%
Level 3 88% 86% 75% 77%
WELTEC YOUTH GUARANTEE EDUCATIONAL PERFORMANCEYouth Guarantee performance reflects the challenges of the learner cohort. Level 1 has very low numbers of learners which distorts the performance. Level 2 course completion is slightly above 2016. With the age of eligible learners increasing to 19 years, in some instances progression to higher level education has been impacted by the strong economy with learners choosing employment over higher qualifications towards.
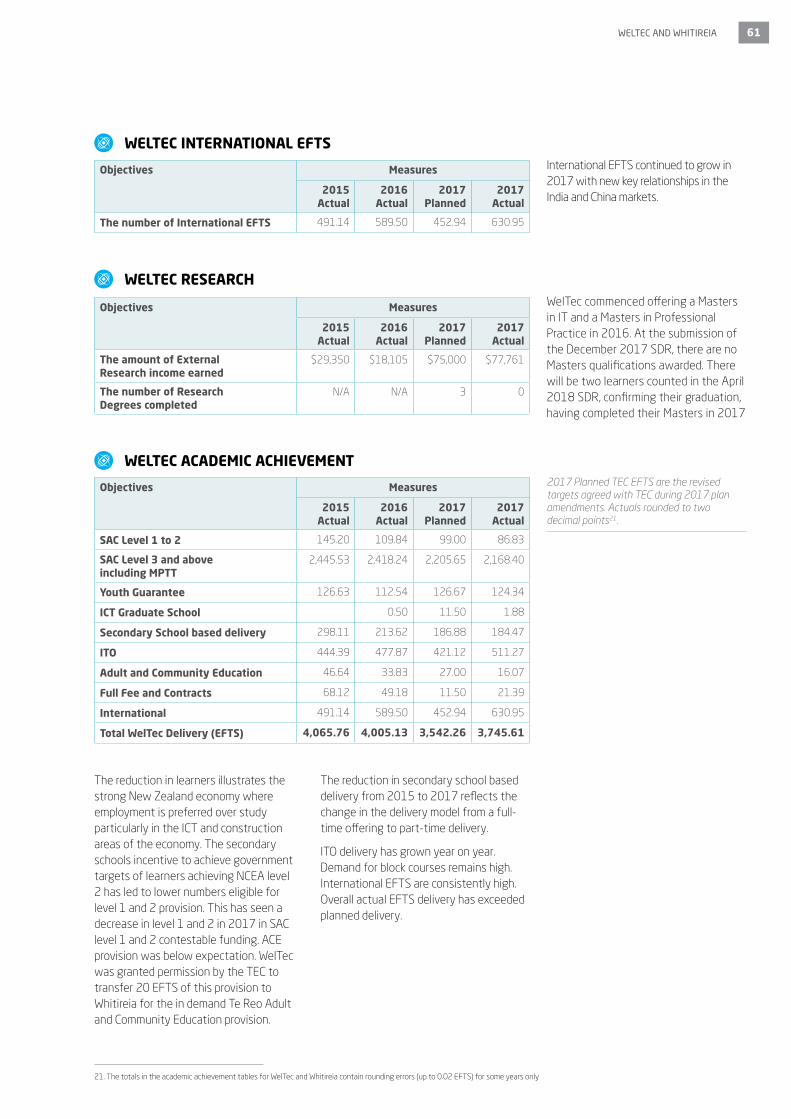
WELTEC AND WHITIREIA 61
Objectives Measures
2015 Actual
2016 Actual
2017 Planned
2017 Actual
The number of International EFTS 491.14 589.50 452.94 630.95
Objectives Measures
2015 Actual
2016 Actual
2017 Planned
2017 Actual
The amount of External Research income earned
$29,350 $18,105 $75,000 $77,761
The number of Research Degrees completed
N/A N/A 3 0
Objectives Measures
2015 Actual
2016 Actual
2017 Planned
2017 Actual
SAC Level 1 to 2 145.20 109.84 99.00 86.83
SAC Level 3 and above including MPTT
2,445.53 2,418.24 2,205.65 2,168.40
Youth Guarantee 126.63 112.54 126.67 124.34
ICT Graduate School 0.50 11.50 1.88
Secondary School based delivery 298.11 213.62 186.88 184.47
ITO 444.39 477.87 421.12 511.27
Adult and Community Education 46.64 33.83 27.00 16.07
Full Fee and Contracts 68.12 49.18 11.50 21.39
International 491.14 589.50 452.94 630.95
Total WelTec Delivery (EFTS) 4,065.76 4,005.13 3,542.26 3,745.61
WELTEC INTERNATIONAL EFTS
WELTEC RESEARCH
WELTEC ACADEMIC ACHIEVEMENT
International EFTS continued to grow in 2017 with new key relationships in the India and China markets.
WelTec commenced offering a Masters in IT and a Masters in Professional Practice in 2016. At the submission of the December 2017 SDR, there are no Masters qualifications awarded. There will be two learners counted in the April 2018 SDR, confirming their graduation, having completed their Masters in 2017
2017 Planned TEC EFTS are the revised targets agreed with TEC during 2017 plan amendments. Actuals rounded to two decimal points21.
The reduction in learners illustrates the strong New Zealand economy where employment is preferred over study particularly in the ICT and construction areas of the economy. The secondary schools incentive to achieve government targets of learners achieving NCEA level 2 has led to lower numbers eligible for level 1 and 2 provision. This has seen a decrease in level 1 and 2 in 2017 in SAC level 1 and 2 contestable funding. ACE provision was below expectation. WelTec was granted permission by the TEC to transfer 20 EFTS of this provision to Whitireia for the in demand Te Reo Adult and Community Education provision.
The reduction in secondary school based delivery from 2015 to 2017 reflects the change in the delivery model from a full-time offering to part-time delivery.
ITO delivery has grown year on year. Demand for block courses remains high. International EFTS are consistently high. Overall actual EFTS delivery has exceeded planned delivery.
21. The totals in the academic achievement tables for WelTec and Whitireia contain rounding errors (up to 0.02 EFTS) for some years only

62 ANNUAL REPORT 2017
Objectives Measures
2015 Actual
2016 Actual
2017 Planned
2017 Actual
SAC
Māori26
Course Completion
Level 3 and above 82% 79% 80% 80%
Level 4 and above 84% 81% 81% 80%
Qualification Completion
Level 3 and above 86% 72% 75% 73%
Level 4 and above 89% 72% 75% 73%
ProgressionLevel 1 to 3, to a
higher level33% 36% 30% 27%
Retention Level 3 and above 77% 76% 74% 73%
Participation27
Level 1 to 2 4% 3% 3% 1%
Level 3 and above 19% 20% 17% 22%
Level 4 and above 16% 17% 14% 17%
Objectives Measures
2015 Actual
2016 Actual
2017 Planned
2017 Actual
SAC
All Students
Course Completion22
Level 1 to 2 76% 69% 78% 71%
Level 3 and above 85% 85% 82% 85%
Level 4 and above 86% 85% 82% 86%
Qualification Completion23
Level 1 to 2 71% 65% 74% 61%
Level 3 and above 89% 84% 79% 83%
Level 4 and above 90% 83% 79% 85%
Progression24
Level 1 to 2, to a higher level
38% 39% 39% 33%
Level 1 to 3, to a higher level
31% 33% 29% 27%
Retention25Level 1-2 73% 74% 74% 71%
Level 3 and above 78% 79% 76% 79%
All SAC learners have course and qualification completion results in levels 3+ and levels 4+ metrics have exceeded the 2017 targets reflecting the utilisation of the academic support available to learners. Level 1 and 2 learners received dedicated wrap around support to achieve the results represented in the above table. The needs of these learners are often complex and varied with students entering programmes at these levels with little to no previous academic achievement at secondary school.
WHITIREIA 2017 EDUCATIONAL PERFORMANCE
WHITIREIA MĀORI EDUCATIONAL PERFORMANCEMāori learners have maintained consistent high performance achievements. Some qualification completions for 2017 are not finalised until early 2018. Qualification completion rates are therefore expected to increase after the April SDR.
22. This indicator shows the proportion of courses enrolled in that are successfully completed. 23. The ‘qualification completion’ indicator shows the proportion of students that complete a qualification in a given year. However the qualification completion rate can be affected by factors that do not reflect the performance of a TEO, such as the part time factor or changes in enrolments. 24. This indicator shows the proportion of students who progress to study at a higher level after completing a qualification at Levels 1-3. 25. This indicator shows the proportion of students that complete a qualification or re-enrol at the same tertiary provider in the following year.

WELTEC AND WHITIREIA 63
Objectives Measures
2015 Actual
2016 Actual
2017 Planned
2017 Actual
SAC
Pasifika26
Course Completion
Level 3 and above 79% 80% 76% 82%
Level 4 and above 79% 79% 77% 83%
Qualification Completion
Level 3 and above 73% 76% 70% 79%
Level 4 and above 72% 73% 72% 81%
ProgressionLevel 1 to 3, to a
higher level36% 36% 35% 27%
Retention Level 3 and above 76% 78% 73% 78%
Participation27
Level 1 to 2 3% 2% 2% 1%
Level 3 and above 18% 19% 15% 19%
Level 4 and above 16% 16% 12% 15%
WHITIREIA PASIFIKA EDUCATIONAL PERFORMANCEOur Pasifika learners have exceeded prior year achievements in course and qualification completion. The reduction in progression reflects the strong New Zealand economy with learners taking advantage of employment than advancing into higher study. Some qualification completions for 2017 are not finalised until early 2018. Qualification completion rates are therefore expected to increase after the April SDR.
Objectives Measures
2015 Actual
2016 Actual
2017 Planned
2017 Actual
SAC
Learners aged Under 2526
Course Completion
Level 3 and above 82% 82% 80% 83%
Level 4 and above 84% 82% 81% 84%
Qualification Completion
Level 3 and above 82% 76% 75% 78%
Level 4 and above 84% 75% 75% 79%
Participation27
Level 3 and above 43% 46% 41% 48%
Level 4 and above 39% 40% 36% 39%
WHITIREIA LEARNERS AGED UNDER 25 EDUCATIONAL PERFORMANCELearners under the age of 25 continue to achieve their academic achievement goals. Both course and qualification completion results exceeded targets and 2016 performance levels. The proportion of under 25 learners in level 3+ continues to grow reflecting the strong relationships Whitireia has nurtured in the secondary schools within its catchment. Some qualification completions for 2017 are not finalised until early 2018. Qualification completion rates are therefore expected to increase after the April SDR.
26. % of Priority Group EFTS as % of total EFTS of the designated group. 27. Participation is calculated based on the proportion of these EFTS to all SAC EFTS at each institution.

64 ANNUAL REPORT 2017
Objectives Measures
2015 Actual
2016 Actual
2017 Planned
2017 Actual
Youth Guarantee
Course Completion
Level 1 N/A N/A 0% N/A
Level 2 72% 67% 70% 73%
Level 3 77% 80% 76% 70%
Qualification Completion
Level 1 to 2 66% 63% 60% 63%
Level 3 73% 77% 71% 68%
ProgressionLevel 1 to a higher level
N/A N/A 0% N/A
Level 2 toa higher level
51% 40% 45% 37%
Level 3 to a higher level
17% 24% 15% 28%
Retention Level 1 N/A N/A 0% N/A
Level 2 71% 71% 61% 60%
Level 3 70% 74% 70% 79%
WHITIREIA YOUTH GUARANTEE EDUCATIONAL PERFORMANCEYouth Guarantee level 2 course completion results have improved against 2015 and 2016 actuals. Qualification completions have remained on par with 2016. Level 3 course completion results are below expected with academics currently reviewing last year’s performance with action plans on any lessons that can be learned.
Objectives Measures
2015 Actual
2016 Actual
2017 Planned
2017 Actual
The number of International EFTS 1,358.61 1,263.88 1,111.07 1,058.20
Objectives Measures
2015 Actual
2016 Actual
2017 Planned
2017 Actual
The amount of External Research income earned
$127,500 $17,000 $75,000 $17,370
The number of Research Degrees completed
0 15 4 11
WHITIREIA INTERNATIONAL EFTS
WHITIREIA RESEARCH
International enrolments declined. This was due to strong competition amongst New Zealand providers and visa changes impacting at Diploma level.
The total value of external research earned in 2017 was below expectations as low value applications were more successful in being converted into grants.
The Masters qualifications that commenced in 2014-2015 have proven to be more popular than expected leading to learners exceeding the 2017 research completion targets.
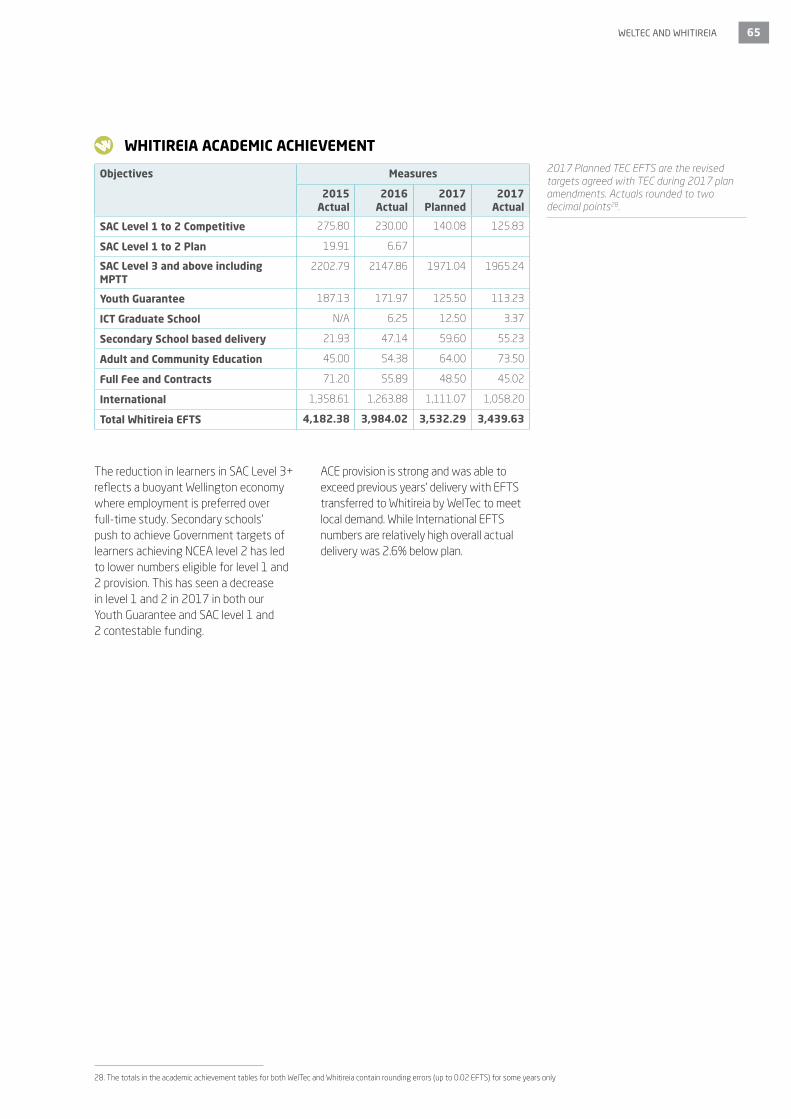
WELTEC AND WHITIREIA 65
Objectives Measures
2015 Actual
2016 Actual
2017 Planned
2017 Actual
SAC Level 1 to 2 Competitive 275.80 230.00 140.08 125.83
SAC Level 1 to 2 Plan 19.91 6.67
SAC Level 3 and above including MPTT
2202.79 2147.86 1971.04 1965.24
Youth Guarantee 187.13 171.97 125.50 113.23
ICT Graduate School N/A 6.25 12.50 3.37
Secondary School based delivery 21.93 47.14 59.60 55.23
Adult and Community Education 45.00 54.38 64.00 73.50
Full Fee and Contracts 71.20 55.89 48.50 45.02
International 1,358.61 1,263.88 1,111.07 1,058.20
Total Whitireia EFTS 4,182.38 3,984.02 3,532.29 3,439.63
WHITIREIA ACADEMIC ACHIEVEMENT2017 Planned TEC EFTS are the revised targets agreed with TEC during 2017 plan amendments. Actuals rounded to two decimal points28.
28. The totals in the academic achievement tables for both WelTec and Whitireia contain rounding errors (up to 0.02 EFTS) for some years only
The reduction in learners in SAC Level 3+ reflects a buoyant Wellington economy where employment is preferred over full-time study. Secondary schools’ push to achieve Government targets of learners achieving NCEA level 2 has led to lower numbers eligible for level 1 and 2 provision. This has seen a decrease in level 1 and 2 in 2017 in both our Youth Guarantee and SAC level 1 and 2 contestable funding.
ACE provision is strong and was able to exceed previous years’ delivery with EFTS transferred to Whitireia by WelTec to meet local demand. While International EFTS numbers are relatively high overall actual delivery was 2.6% below plan.
66 ANNUAL REPORT 2017
Financial Statements
WelTec
WELTEC AND WHITIREIA 67
Statement of Comprehensive Income 68
Statement of Changes in Equity 69
Statement of Financial Position 70
Statement of Cash flows 71
Notes to the Financial Statements 72
Statement of Compliance and Responsibility 95

68 ANNUAL REPORT 2017
Statement of Comprehensive IncomeFor the year ended 31 December 2017
The accompanying notes form part of these financial statements
ParentGroup
WELTEC
Note 2017 Actual$000
2017 Budget
Unaudited$000
2016 Actual$000
2017 Actual$000
2016 Actual$000
Revenue
Revenue from non-exchange transactions
Government funding 2 25,765 27,400 27,378 25,765 27,378
Tuition funding 3 10,599 11,874 10,114 10,599 10,114
Revenue from exchange transactions
Tuition funding 4 10,855 9,666 10,258 10,842 10,258
Other teaching 5 3,903 3,697 3,621 3,872 3,621
Other income 6 6,123 5,147 6,007 2,715 2,612
Interest and dividend income 247 537 389 246 385
Total operating income 57,492 58,321 57,767 54,039 54,368
Cost of services
Personnel 7 31,890 32,151 31,461 31,459 31,026
Teaching delivery 5,521 4,927 4,712 5,417 4,712
Administration 8 7,369 7,686 7,377 7,260 7,158
Infrastructure 9 8,859 8,465 8,377 6,032 5,581
Depreciation and amortisation 10 4,142 4,086 3,770 4,133 3,743
Total cost of services 57,781 57,315 55,697 54,301 52,220
Operating (loss)/profit (289) 1,006 2,070 (262) 2,148
Non operating items (expense)/income 11 (1,225) 2,827 (51) (1,225) 195
Share of jointly controlled entities (loss)/profit 15 (559) - 180 - -
(Loss)/profit (2,073) 3,833 2,199 (1,487) 2,343
Other comprehensive revenue and expenditure
Movement in property revaluation reserve 24 2,567 - 2,586 2,567 2,586
Movement in plant revaluation reserve 24 - - 531 - 531
Total comprehensive revenue and expenditure 494 3,833 5,316 1,080 5,460

WELTEC AND WHITIREIA 69
Statement of Changes in EquityFor the year ended 31 December 2017
The accompanying notes form part of these financial statements
Note 2017 Actual$000
2017 Budget
Unaudited$000
2016 Actual$000
2017 Actual$000
2016 Actual$000
Balance at 1 January 83,228 79,316 77,912 83,377 77,917
Comprehensive income
(Loss)/profit for the year (2,073) 3,833 2,199 (1,487) 2,343
Other comprehensive income 2,567 - 3,117 2,567 3,117
Total comprehensive income 494 3,833 5,316 1,080 5,460
Balance at 31 December 83,722 83,149 83,228 84,457 83,377
ParentGroup
WELTEC
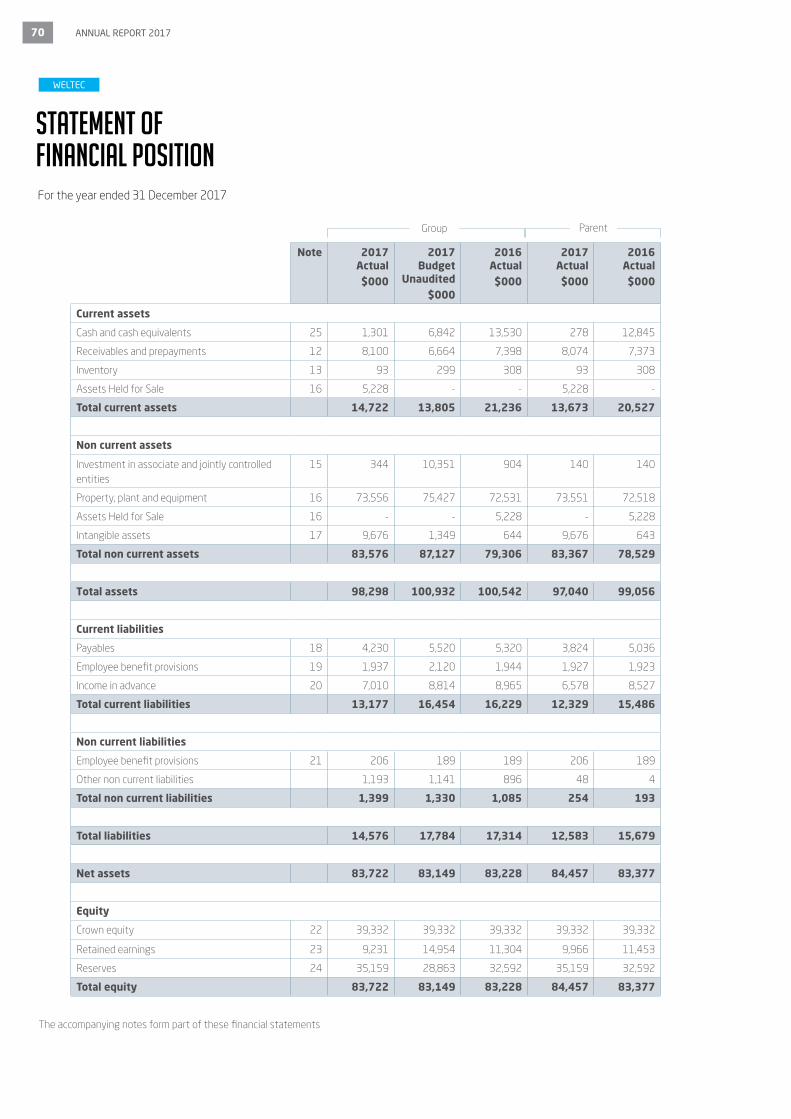
70 ANNUAL REPORT 2017
Statement of Financial Position
Note 2017 Actual$000
2017 Budget
Unaudited$000
2016 Actual$000
2017 Actual$000
2016 Actual$000
Current assets
Cash and cash equivalents 25 1,301 6,842 13,530 278 12,845
Receivables and prepayments 12 8,100 6,664 7,398 8,074 7,373
Inventory 13 93 299 308 93 308
Assets Held for Sale 16 5,228 - - 5,228 -
Total current assets 14,722 13,805 21,236 13,673 20,527
Non current assets
Investment in associate and jointly controlled entities
15 344 10,351 904 140 140
Property, plant and equipment 16 73,556 75,427 72,531 73,551 72,518
Assets Held for Sale 16 - - 5,228 - 5,228
Intangible assets 17 9,676 1,349 644 9,676 643
Total non current assets 83,576 87,127 79,306 83,367 78,529
Total assets 98,298 100,932 100,542 97,040 99,056
Current liabilities
Payables 18 4,230 5,520 5,320 3,824 5,036
Employee benefit provisions 19 1,937 2,120 1,944 1,927 1,923
Income in advance 20 7,010 8,814 8,965 6,578 8,527
Total current liabilities 13,177 16,454 16,229 12,329 15,486
Non current liabilities
Employee benefit provisions 21 206 189 189 206 189
Other non current liabilities 1,193 1,141 896 48 4
Total non current liabilities 1,399 1,330 1,085 254 193
Total liabilities 14,576 17,784 17,314 12,583 15,679
Net assets 83,722 83,149 83,228 84,457 83,377
Equity
Crown equity 22 39,332 39,332 39,332 39,332 39,332
Retained earnings 23 9,231 14,954 11,304 9,966 11,453
Reserves 24 35,159 28,863 32,592 35,159 32,592
Total equity 83,722 83,149 83,228 84,457 83,377
The accompanying notes form part of these financial statements
ParentGroup
WELTEC
For the year ended 31 December 2017
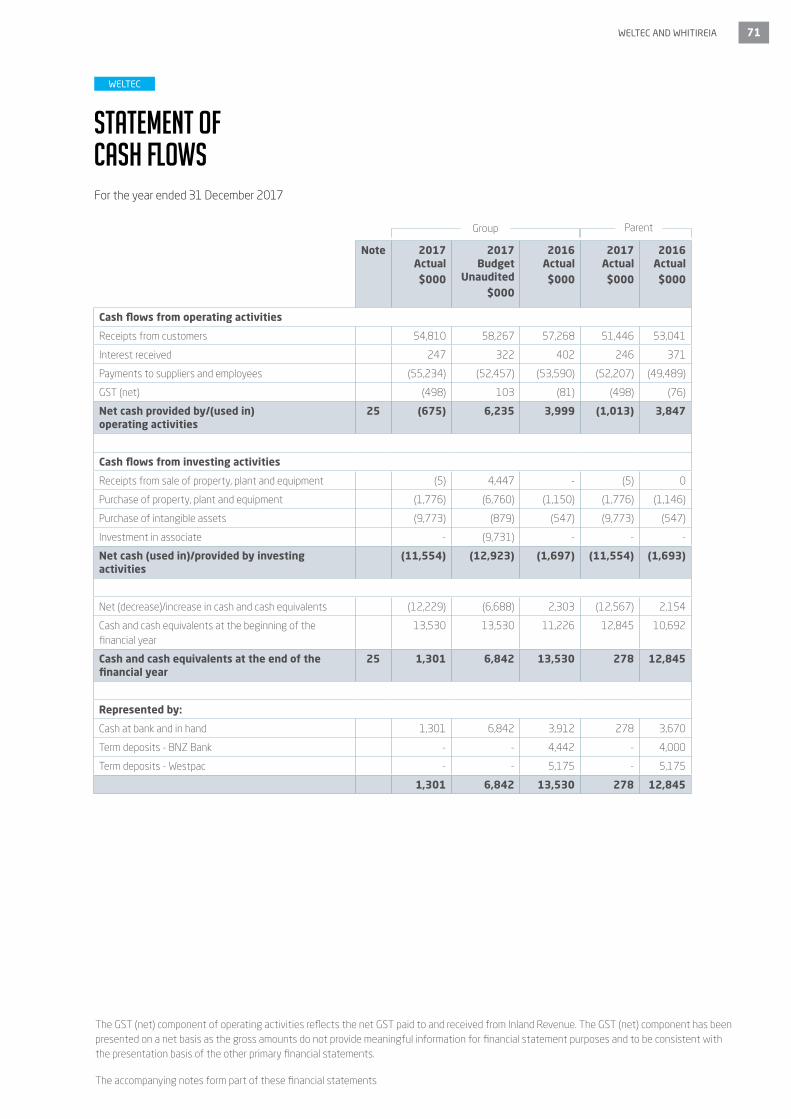
WELTEC AND WHITIREIA 71
Statement of Cash flows
The GST (net) component of operating activities reflects the net GST paid to and received from Inland Revenue. The GST (net) component has been presented on a net basis as the gross amounts do not provide meaningful information for financial statement purposes and to be consistent with the presentation basis of the other primary financial statements.
Note 2017 Actual$000
2017 Budget
Unaudited$000
2016 Actual$000
2017 Actual$000
2016 Actual$000
Cash flows from operating activities
Receipts from customers 54,810 58,267 57,268 51,446 53,041
Interest received 247 322 402 246 371
Payments to suppliers and employees (55,234) (52,457) (53,590) (52,207) (49,489)
GST (net) (498) 103 (81) (498) (76)
Net cash provided by/(used in) operating activities
25 (675) 6,235 3,999 (1,013) 3,847
Cash flows from investing activities
Receipts from sale of property, plant and equipment (5) 4,447 - (5) 0
Purchase of property, plant and equipment (1,776) (6,760) (1,150) (1,776) (1,146)
Purchase of intangible assets (9,773) (879) (547) (9,773) (547)
Investment in associate - (9,731) - - -
Net cash (used in)/provided by investing activities
(11,554) (12,923) (1,697) (11,554) (1,693)
Net (decrease)/increase in cash and cash equivalents (12,229) (6,688) 2,303 (12,567) 2,154
Cash and cash equivalents at the beginning of the financial year
13,530 13,530 11,226 12,845 10,692
Cash and cash equivalents at the end of the financial year
25 1,301 6,842 13,530 278 12,845
Represented by:
Cash at bank and in hand 1,301 6,842 3,912 278 3,670
Term deposits - BNZ Bank - - 4,442 - 4,000
Term deposits - Westpac - - 5,175 - 5,175
1,301 6,842 13,530 278 12,845
ParentGroup
For the year ended 31 December 2017
WELTEC
The accompanying notes form part of these financial statements

72 ANNUAL REPORT 2017
NOTES TO THE FINANCIAL STATEMENTS1. STATEMENT OF ACCOUNTING POLICIES FOR THE YEAR ENDED 31 DECEMBER 2017
REPORTING ENTITY
Wellington Institute of Technology (WelTec) is a Crown Entity governed by the Crown Entities Act 2004 and the Education Act 1989. It provides full-time and part-time tertiary education in New Zealand.
WelTec and Group consists of Wellington Institute of Technology and its trading subsidary WelTec Enterprises Limited (100% owned), and WelTec Enterprises Limited trading subsidary, WelTec Student Accommodation Limited (100% owned). WelTec Enterprises Limited also has a 50% interest in Le Cordon Bleu New Zealand Institute Limited Partnership which is equity accounted. WelTec has a 50% interest in W² Shared Services Limited and W² Ventures Limited. WelTec also has a 50% interest in an unincorporated joint venture, Computer Power Plus. All jointly owned entities are equity accounted into the Group financial statements.
The primary objective of WelTec and Group is to provide tertiary education services for the benefit of the community rather than making a financial return.
The financial statements of WelTec and the Group are for the year ended 31 December 2017. The financial statements were authorised for issue by the Council on 30 April 2018.
BASIS OF PREPARATION
Statement of ComplianceThe financial statements have been prepared in accordance with generally accepted accounting practice in New Zealand, and the requirements of the Crown Entities Act 2004 and the Education Act 1989. WelTec and the Group is a public benefit entity for the purpose of complying with generally accepted accounting practice in New Zealand (NZ GAAP).
The financial statements of WelTec and the Group comply with Public Benefit Entity (PBE) standards. The financial statements have been prepared in accordance with Tier 1 PBE standards.
Measurement baseThe financial statements have been prepared on a historical cost basis, except for land, buildings and plant, which have been measured at fair value, and other fair value amendments as provided for within the accounting policies.
Functional and presentation currencyThe financial statements are presented in New Zealand dollars and all values are rounded to the nearest thousand dollars ($’000), except where indicated. The functional currency of WelTec and Group is New Zealand dollars (NZ$).
Changes in accounting policiesThere have been no changes in accounting policies during the financial year.
PBE IPSAS 3 requires disclosure of the possible impact of new and revised PBE standards that have been issued but are not yet effective. The standards that may impact on WelTec and Group in future years are:
• PBE IPSAS 1 - change 'approved budget' on the financial statements to reference to 'general purpose prospective financial statements'. This standard is effective 1 January 2018.
• PBE IPSAS 34, 35, 36, 37 and 38 relate to definition and control of entities and Group accounting. WelTec does not anticipate any significant changes from current consolidation and disclosure methods. This change is effective 1 January 2019.
• PBE IPSAS 21 and 26 relate impairment of revalued assets. WelTec does not anticipate any immediate impact. This standard is effective 1 January 2019.
• PBE IPSAS 9 relates to Financial Instruments. This may change note disclosures. This standard is effective 1 January 2018.
• PBE FRS 48 relates to Service Performance Reporting. This may change note disclosures. This standard is effective 1 January 2021.
• PBE IPSAS 12, 27, and 39 changes do not impact WelTec.
SIGNIFICANT ACCOUNTING POLICIES
Basis of consolidationThe Group financial statements are prepared by adding together the like items of assets, liabilities, equity, income, expenses and cash flows on a line by line basis for all entities in the Group. All significant intra-group balances, transactions, income, and expenses are eliminated in full on consolidation.
SubsidiariesWelTec consolidates in the Group financial statements all entities where WelTec has the capacity to control the financing and operating policies of an entity so as to obtain benefits from the activities of the entity. Investments in subsidiaries are carried at cost in the WelTec parent entity financial statements and tested for impairment on an annual basis.
Associates and joint venturesWelTec's associate and joint venture investments are accounted for in the Group financial statements using the equity method. An associate is an entity over which WelTec has significant influence and that is neither a subsidiary nor an interest in a joint venture. A joint venture is an entity over which Weltec has joint control. The investment is initially recognised at cost and the carrying amount is increased or decreased to recognise the Group’s share of the profit or loss of the associate or joint venture after the date of acquisition. The Group’s share of the profit or loss is recognised in the Group profit or loss.
WELTEC
WELTEC AND WHITIREIA 73
Distributions received from an associate or joint venture reduce the carrying amount of the investment in the Group financial statements.
If the share of losses of an associate or joint venture equals or exceeds an interest in the associate or joint venture, the Group discontinues recognising its share of further losses. After the Group’s interest is reduced to zero, additional losses are provided for, and a liability is recognised, only to the extent that the Group has incurred legal or constructive obligations or made payments on behalf of the associate or joint venture. If the associate or joint venture subsequently reports profits, the Group will resume recognising its share of those profits only after its share of the profits equals the share of losses not recognised.
Where the Group transacts with an associate or joint venture, profit or losses are eliminated to the extent of the Group’s interest in the relevant associate. Investments in associates and joint ventures are carried at cost in the WelTec parent entity financial statements and tested annually for impairment. Where an impairment is determined to exists, it is recognised as a writedown through the Statement of Comprehensive Income.
RevenueRevenue is recognised to the extent that it is probable that the economic benefits will flow to WelTec and Group and the revenue can be reliably measured. The following specific criteria must also be met before revenue is recognised:
Government grantsGovernment grants are recognised when eligibility to receive the grant has been established. For Student Component Funding, entitlement is established upon the withdrawal period for an individual’s course of study having passed. For project-based grants with conditions entitlement is established upon the completion of agreed milestones consistent with the conditions specified, where the the conditions include a return obligation.
Student tuition feesRevenue from student tuition fees is recognised in the statement of comprehensive income on entitlement. Where funds have been received but not earned at balance date, an Income in Advance liability is recognised. Revenue is recognised when the course withdrawal date has passed, which is when a student is no longer entitled to a refund for withdrawing from the course. Domestic student tuition fees are subsidised by government funding and are considered non-exchange.
International student tuition feesInternational student tuition fees are accounted for as exchange transactions and recognised as revenue on a course percentage of completion basis. The percentage of compltion is measured by reference to the days of the course complted as a proportion of total course days.
Rendering of services Revenue from a contract to provide services through an exchange transaction is recognised by reference to the stage of completion of the contract at balance date.
Interest revenue Interest revenue is recognised on a time-proportionate basis that takes into account the effective yield on the financial asset.
LeasesAn operating lease is a lease that does not transfer substantially all the risks and rewards incidental to ownership of an asset. Lease payments net of lease inducements under an operating lease are recognised as an expense on a straight-line basis over the lease term.
Foreign Currency TranslationForeign exchange transactions are translated into NZ$ (the functional currency) using the exchange rates prevailing at the dates of the transactions. Foreign exchange gains and losses resulting from the settlement of such transactions and from the translation at year end of monetary assets and liabilities denominated in foreign currencies are recognised in the profit or loss.
Cash and Cash EquivalentsCash and cash equivalents represents all bank positions, which are maintained to support day to day operations. Cash and cash equivalents includes cash on hand and in banks and term investments in money market instruments, net of outstanding bank overdrafts. The carrying value of cash at bank, call deposits and term deposits < 90 days approximates their fair value. If bank overdrafts are operating they are shown within borrowings in current liabilities.
ReceivablesTrade receivables, student receivables and other receivables are recorded at their amortised cost, less any provision for impairment.
InventoriesInventory is measured at cost upon initial recognition. To the extent that inventory was received through non-exchange transactions (for no cost or nominal cost), the cost of inventory is its fair value at the date of acquisition.
Costs incurred in bringing each product to its present condition and location are accounted for as follows:
Consumables and work in progress - purchase cost on a first in, first out basis. The Groups consumables includes food stuffs and beverages, while work in progress includes framing, joinery and roofing items.
Property, Plant and EquipmentLand and buildingsLand and buildings are measured at fair value. Fair value is determined on the basis of an annual independent valuation prepared by registered valuers. Land values are based on discounted cash flows or capitalisation of net income (as determined to be appropriate by the independent valuer). Buildings are valued based on depreciated replacement cost due to their specialised nature, or based on expected market value if not specialised. This methodology is an acceptable estimate of fair value due to the lack of market-based evidence for education delivery purposes.
WELTEC

74 ANNUAL REPORT 2017
Any revaluation increase arising on the revaluation of land and buildings is credited to the appropriate revaluation reserve, except to the extent that it reverses a revaluation decrease for the same class of asset previously recorded as an expense in the statement of comprehensive income, in which case the increase is credited to the statement of comprehensive income to the extent of the decrease previously charged. A decrease in carrying amount arising on the revaluation of land and buildings is charged as an expense in the statement of comprehensive income to the extent that it exceeds the balance, if any, held in the asset revaluation reserve.
PlantPlant is measured at fair value. Fair value is determined on the basis of a three yearly independent valuation prepared by registered valuers based on discounted cash flows.
Any revaluation increase arising on the revaluation of plant is credited to the appropriate revaluation reserve, except to the extent that it reverses a revaluation decrease for the same class of asset previously recorded as an expense in the statement of comprehensive income, in which case the increase is credited to the statement of comprehensive income to the extent of the decrease previously charged. A decrease in carrying amount arising on the revaluation of plant is charged as an expense in the statement of comprehensive income to the extent that it exceeds the balance, if any, held in the asset revaluation reserve.
Other property, plant and equipmentAll other property, plant and equipment is recognised as an asset if, and only if, it is probable that future economic benefits or service potential associated with the item will flow to WelTec and Group and the cost of the item can be measured reliably.
An item of property, plant and equipment is stated at cost less accumulated depreciation and impairment. Cost includes expenditure that is directly attributable to the acquisition of the item. In the event that settlement of all or part of the purchase consideration is deferred, cost is determined by discounting the amounts payable in the future to their present value as at the date of the acquisition.
Assets under constructionAssets under construction are disclosed separately. Upon completion, the asset’s total cost is transferred to the appropriate asset class, at which point depreciation begins.
DisposalsGains and losses on disposals are determined by comparing the disposal proceeds with the carrying amount of the asset. Gains and losses on disposals are reported net in the profit or loss. When revalued assets are sold, the amounts included in revaluation reserves in respect of those assets are transferred to general funds.
DepreciationDepreciation has been provided on all property, plant and equipment, excluding land. Depreciation is calculated on a straight-line basis, at rates that expense the assets’ cost (or valuation) to their estimated residual values over their useful life.
The useful life of each class of asset is as follows:
Leasehold improvements are depreciated over the shorter period of the useful life of the asset or the unexpired period of the lease.
The residual value and useful life of an asset is reviewed, and adjusted if applicable, at each financial year end.
Intangible AssetsIntellectual property costsDevelopment costs for new intellectual property internally developed or acquired which have a benefit of more than one year have been capitalised. Such costs are expected to be recovered, and are amortised on a straight-line basis over the period of their expected useful lives, being three years.
SoftwareAll software purchased or created by WelTec and Group which have a benefit of more than one year have been capitalised. Such costs are expected to be recovered, and are amortised on a straight-line basis over the period of their expected useful lives, being three years.
Right to Use 'Right to Use' refers to items of a capital nature that WelTec and Group have not purchased, but have an agreement to use with the same access rights as if WelTec and Group was the owner. Such costs are expected to be recovered and are amortised on a straight-line basis over the period of the agreement. The agreement period will be within any relevant lease period timeframe.
Assets under constructionCourse development and software assets under construction are treated as an intangible asset until completion. Upon completion of a project, the total cost is transferred to the appropriate asset class, at which point amortisation begins.
Impairment of Property, Plant, and Equipment and Intangible AssetsAssets that are not revalued are reviewed for indicators of impairment at each balance date and whenever events or changes in circumstances indicate that the carrying amount may not be recoverable. When there is an indicator of impairment, the asset's recoverable amount is estimated. An impairment loss is recognised for the amount by which the asset's carrying amount exceeds its recoverable amount. The recoverable amount is the higher of an assets fair value less costs to sell and value in use.
Years
Buildings 10 - 50
Leasehold improvements 2 - 15
Plant 3 - 30
Equipment 3 - 5
Furniture and fittings 5
Library collection 5
Hardware 3
Motor Vehicles 5
WELTEC

WELTEC AND WHITIREIA 75
In assessing value in use, the estimated future cash flows are discounted to their present value, using a discount rate that reflects current market assessments of the time value of money.
If an asset’s carrying amount exceeds its recoverable amount, the asset is impaired and the carrying amount is written-down to the recoverable amount with an impairment loss recognised in the profit or loss.
Property Held for SaleOn 31 December 2016 various properties consisting of land and buildings were classified as held for sale. Prior to reclassification the land and buildings were recognised within WelTec Group property, plant and equipment as part of operational land and buildings. If the fair value of the land and buildings less cost to sell is higher than carrying value, no impairment loss was recognised upon the reclassification of the land and buildings as held for sale. The sale of the land and buildings is expected to be completed during 2018.
PayablesTrade payables and other accounts payable are recognised when WelTec and Group becomes obliged to make future payments resulting from the purchase of goods and services.
Employee BenefitsEmployee benefits that are due to be settled within 12 months after the end of the period in which the employee renders the related service are measured at nominal values based on accrued entitlements at current rates of pay. These include salaries and wages accrued up to balance date, annual leave earned but not yet taken at balance date and sick leave.
A liability for sick leave is recognised to the extent that absences in the coming year are expected to be greater than the sick leave entitlements earned in the coming year. The amount is calculated based on the historical average amount of additional days used by staff to cover those future absences.
A liability and an expense is recognised for bonuses, where there is a contractual obligation.
Long term employee entitlementsEmployee benefits that are due to be settled beyond 12 months after the end of the period in which the employee renders the related service, such as long service leave and retirement leave have been calculated on an actuarial basis. The calculations are based on:
• Likely future entitlements accruing to staff, based on years of service, years to entitlement, the likelihood that staff will reach the point of entitlement, and contractual entitlement information; and
• The present value of the estimated future cash flows.
Expected future payments are discounted using the official cash rate. The inflation factor is based on the expected long-term increase in remuneration for employees.
Presentation of employee entitlementsSick leave, annual leave, long service leave and retirement leave expected to be settled within 12 months of balance date are classified as a current liability. All other employee entitlements are classified as a non-current liability.
Superannuation SchemesDefined contribution schemes such as employer contributions to KiwiSaver, the Government Superannuation Scheme and other such superannuation schemes are accounted for as defned contribution schemes and are recognised as an expense in the profit or loss when incurred.
EquityEquity, being the difference between total assets and total liabilities reflects the Crown’s interest in WelTec and Group. This public equity is disaggregated and classified into a number of reserves to enable clearer identification of the specific uses/sources of accumulated funds. The components of equity are:
- Crown equity
- Retained earnings
- Reserves
ReservesWelTec and Group has an asset revaluation reserve which has been generated by the revaluation of plant, land and buildings, as outlined in the Property, Plant and Equipment policy.
Goods and Services TaxAll items in the financial statements are stated exclusive of goods and services tax (GST), except for trade and other receivables and trade and other payables, which are presented on a GST-inclusive basis. Where GST is not recoverable as input tax then it is recognised as part of the related asset or expense.
The net amount of GST recoverable from, or payable to Inland Revenue is included as part of receivables or payables in the balance sheet.
The net GST paid to, or received from Inland Revenue, including the GST relating to investing and financing activities, is classified as a net operating cash flow in the statement of cash flows.
Commitments and contingencies are disclosed exclusive of GST.
Income TaxTertiary institutions are exempt from payment of income tax, as they are treated by the Inland Revenue Department as charitable organisations. Accordingly, no income tax is provided for.
Budget FiguresThe budget figures are those approved by the Council at the beginning of the financial year. The budget figures have been prepared in accordance with NZ GAAP and are consistent with the accounting policies adopted by the Council for the preparation of the financial statements. The budget figures are not audited.
WELTEC
76 ANNUAL REPORT 2017
ProvisionsProvisions are recognised when: a present obligation (legal or constructive) arises as a result of a past event; it is probable that an outflow of resources embodying economic benefits will be required to settle the obligation; and a reliable estimate can be made of the amount of the obligation.
If the effect of the time value of money is material, provisions are determined by discounting the expected future cash flows at a pre-tax rate that reflects current market assessments of the time value of money and, where appropriate, the risks specific to the liability.
Provisions are reviewed at each balance date, and adjusted to reflect the current best estimate. When it is no longer probable that an outflow of resources embodying economic benefits will be required to settle the obligation, the provision shall be reversed.
Where discounting is used, the increase in the provision due to the passage of time is recognised as a finance cost.
Cost of ServicesWelTec and Group has presented an analysis of its cost of services on the face of the statement of comprehensive income and within the notes to the accounts utilising a classification based on the underlying nature of the expenses.
Critical accounting estimates and assumptionsIn preparing these financial statements, WelTec and Group has made estimates and assumptions concerning the future. These estimates and assumptions may differ from the subsequent actual results. Estimates and assumptions are continually evaluated and are based on historical experience and other factors, including expectations or future events that are believed to be reasonable under the circumstances. The estimates and assumptions that have a significant risk of causing a material adjustment to the carrying amounts of assets and liabilities within the next financial year are discussed below:
Trade and other receivablesNote 12 provides information about the estimates and assumptions exercised in the provisioning for doubtful debts.
Investment in associated and jointly controlled entitiesNote 15 provides information about the estimates and assumptions exercised in the impairment of investment in associated and jointly controlled entities.
Land, buildings and plant valuation and assets held for saleNote 16 provides information about the estimates and assumptions exercised in the measurement of revalued land, buildings and plant, and the carrying value of held for sale assets.
Retirement leaveNote 21 provides information about the estimates and assumptions exercised in the measurement of retirement leave.
Critical judgements in applying accounting policiesManagement has exercised the following critical judgements in applying accounting policies for the year ended 31 December 2017:
Crown-owned land and buildingsCrown-owned land and buildings are included as part of WelTec and Group’s property, plant and equipment. Although legal title has not been transferred, the Crown has vested all the normal risks and rewards of ownership to WelTec and Group.
Restrictions on disposal of these Crown owned land and buildings are in place, as per section 192 of the Education Act 1989.
Distinction between revenue and capital contributionsMost Crown funding received is operational in nature and is provided by the Crown under the authority of an expense appropriation and is recognised as revenue. Where funding is received from the Crown under the authority of a capital appropriation, WelTec and Group accounts for the funding as an equity injection directly in equity. Information about equity injections recognised in equity is disclosed in note 22.
WELTEC
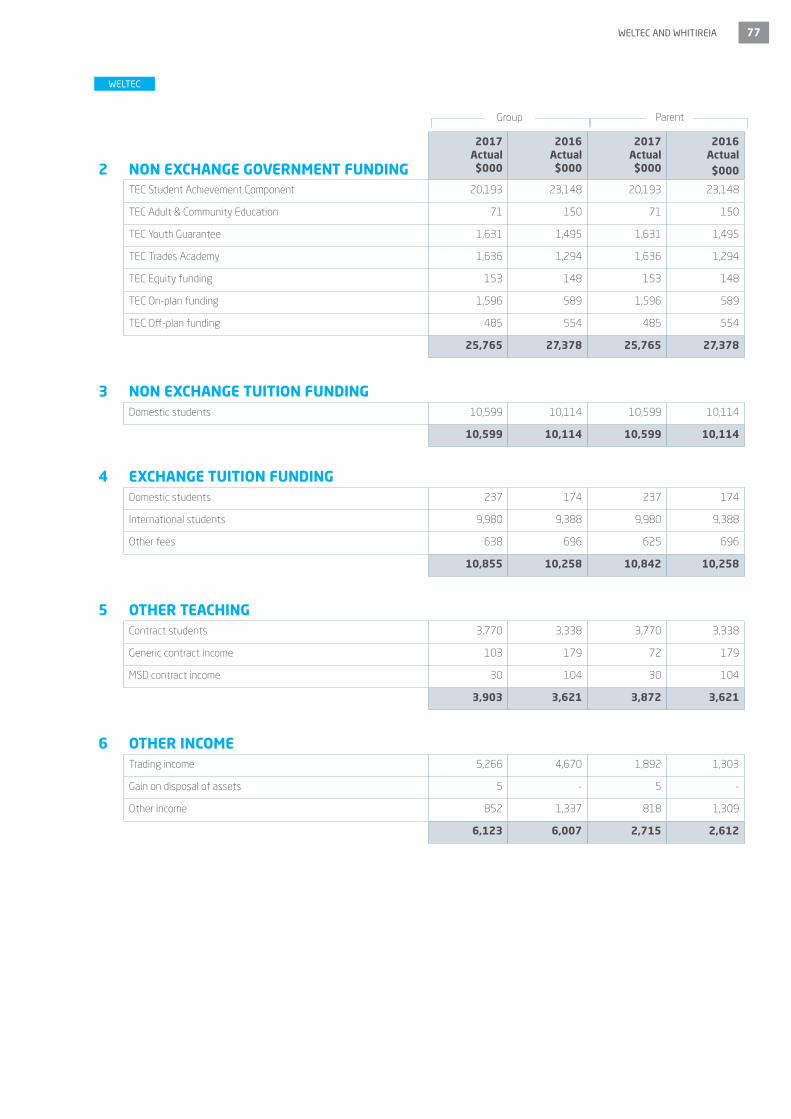
WELTEC AND WHITIREIA 77
2 NON EXCHANGE GOVERNMENT FUNDING
2017 Actual $000
2016 Actual $000
2017 Actual $000
2016 Actual$000
TEC Student Achievement Component 20,193 23,148 20,193 23,148
TEC Adult & Community Education 71 150 71 150
TEC Youth Guarantee 1,631 1,495 1,631 1,495
TEC Trades Academy 1,636 1,294 1,636 1,294
TEC Equity funding 153 148 153 148
TEC On-plan funding 1,596 589 1,596 589
TEC Off-plan funding 485 554 485 554
25,765 27,378 25,765 27,378
3 NON EXCHANGE TUITION FUNDINGDomestic students 10,599 10,114 10,599 10,114
10,599 10,114 10,599 10,114
4 EXCHANGE TUITION FUNDINGDomestic students 237 174 237 174
International students 9,980 9,388 9,980 9,388
Other fees 638 696 625 696
10,855 10,258 10,842 10,258
5 OTHER TEACHINGContract students 3,770 3,338 3,770 3,338
Generic contract income 103 179 72 179
MSD contract income 30 104 30 104
3,903 3,621 3,872 3,621
6 OTHER INCOMETrading income 5,266 4,670 1,892 1,303
Gain on disposal of assets 5 - 5 -
Other income 852 1,337 818 1,309
6,123 6,007 2,715 2,612
ParentGroup
WELTEC

78 ANNUAL REPORT 2017
WELTEC
2017 Actual $000
2016 Actual $000
2017 Actual $000
2016 Actual
$000
7 PERSONNELStaff Compensation:
Short term employee benefits 30,379 30,270 29,970 29,846
Defined contribution plan employer contributions 716 709 705 698
Associated personnel expenses 795 482 784 482
31,890 31,461 31,459 31,026
8 ADMINISTRATIONAdministrative expenditure 7,022 7,078 6,923 6,886
Non personnel research expense 190 45 190 45
Bad debts expense 46 15 46 -
Doubtful debts increase/(decrease) (24) 90 (24) 90
Remuneration of auditors - external audit 135 148 125 137
7,369 7,377 7,260 7,158
9 INFRASTRUCTUREInformation & computer technology 1,076 910 1,059 890
Insurance 644 762 501 642
Loss on disposal of assets - 27 - 27
Operating leases 4,681 4,370 2,407 2,096
Occupancy 2,458 2,308 2,065 1,925
8,859 8,377 6,032 5,581
10 DEPRECIATION & AMORTISATIONDepreciation 3,909 3,482 3,900 3,464
Amortisation 233 288 233 279
4,142 3,770 4,133 3,743
11 NON OPERATING ITEMSRedundancy expense 45 51 45 51
Impairment of investment in LCBNZI Limited Partnership (note 15) 1,050 - 1,050 -
Campus relocation & earthquake repairs 130 - 130 -
WelTec Student Accommodation transfer - - - (246)
1,225 51 1,225 (195)
ParentGroup

WELTEC AND WHITIREIA 79
2017 Actual $000
2016 Actual $000
2017 Actual $000
2016 Actual
$000
12 TRADE AND OTHER RECEIVABLESStudent receivables 5,196 4,709 5,196 4,709
Trade receivables and prepayments 2,471 1,842 2,410 1,819
Related party receivables (note 31) 683 1,120 718 1,120
less provision for impairment (250) (274) (250) (274)
8,100 7,398 8,074 7,373
Fair value
Student receivables are inclusive of exchange and non-exchange transactions. All student fees are due before a course commences or upon enrolment if the course has already begun. Student fee receivables are non-interest bearing and are generally paid in full by course commencement date. Therefore, their carrying value approximates their fair value.
Other receivables are non-interest bearing and are generally settled on 30-day terms. Therefore the carrying value of other receivables approximates their fair value.
The ageing profile of student receivables as at year end is detailed below.
Not past due 4,734 4,315 4,734 4,315
Past due 1 – 30 days 29 18 29 18
Past due 31 – 60 days 70 83 70 83
Past due 61 – 90 days 6 17 6 17
Past due over 90 days 357 275 357 275
5,196 4,709 5,196 4,709
All receivables greater than 30 days in age are considered to be past due. There are provisions for impairment on receivables with overdue amounts. Due to the large number of student fee receivables, the impairment assessment is performed on a collective basis, based on an analysis of past collection history and debt write-offs.
Movements in the provision for impairment of receivables are as follows:
At 1 January (274) (233) (274) (233)
Provisions reversed during the year - - - -
Bad debts written off against provision during the year 46 50 46 50
Provision released/(additional provision made) during the year (22) (90) (22) (90)
At 31 December (250) (274) (250) (274)
13 INVENTORYWork in progress - at cost 27 281 27 281
Finished goods - at cost 66 27 66 27
93 308 93 308
ParentGroup
WELTEC

80 ANNUAL REPORT 2017
14 INVESTMENT IN SUBSIDIARY 2017 Actual $000
2016 Actual $000
2017 Actual $000
2016 Actual
$000
Share in WelTec Enterprises Limited - - - -
Share in W2 Ventures Limited - - - -
Share in WelTec Student Accomodation Limited - - - -
- - - -
All subsidiaries have a 31 December balance date.
WelTec established WelTec Enterprises Limited in 2014. WelTec Enterprises Limited has ownership interest in WelTec Student Accommodation Limited (100%), and Le Cordon Bleu Limited Partnership (50%).
WelTec established W² Ventures Limited to be the holding company for any subsidiary or associated entity owned on a 50%/50% basis with Whitireia Community Polytechnic. As at 31 December no trading had been undertaken by W² Ventures Limited.
WelTec Student Accommodation Limited provides student accommodation services located at 222 Willis Street, Wellington.
15 INVESTMENT IN ASSOCIATE AND JOINTLY CONTROLLED ENTITIES
2017 Actual $000
2016 Actual $000
Investment in Associate (Parent and Group)
MotorTrain Limited - -
MotorTrain Limited is a shell company in which WelTec holds a 25% interest. No transactions were incurred during the year.
Investment in jointly controlled entities
W2 Shared Services Limited
W² Shared Services Limited is jointly owned on a 50%:50% basis with Whitireia Community Polytechnic and began trading in January 2015 to replace the unincorpated joint venture structure utilised in 2014. W2 Shared Services Limited has nil net assets, nil profit and no equity invested. WelTec and Whitireia are debtors to W2 Shared Services Limited. Refer Related Parties note.
Le Cordon Bleu New Zealand Institute Limited Partnership
WelTec Enterprises Limited holds the Group's investment in Le Cordon Bleu New Zealand Institute (LCBNZI), being a 50% investment in the Le Cordon Bleu New Zealand Institute Limited Partnership and a 50% shareholding in LCB Management NZ Limited, the General Partner of the Limited Partnership.
WelTec and LCBNZI jointly developed premises in the New Zealand Centre for Culinary and Hospitality Arts, lower Cuba Street in Wellington City. WelTec’s School of Hospitality and the LCBNZI Cuisine School co-locate in this facility. Academic delivery commenced in September 2012. WelTec fully impaired its investment in LCBNZI in 2013 ($3.15M) based on forecasted financial results for the medium term. WelTec invested further capital in May 2017 ($1M) as a result of shareholding restructuring within LCBNZI. WelTec has fully impaired this investment in LCBNZI based on forecasted financial results for the medium term.
ParentGroup
WELTEC
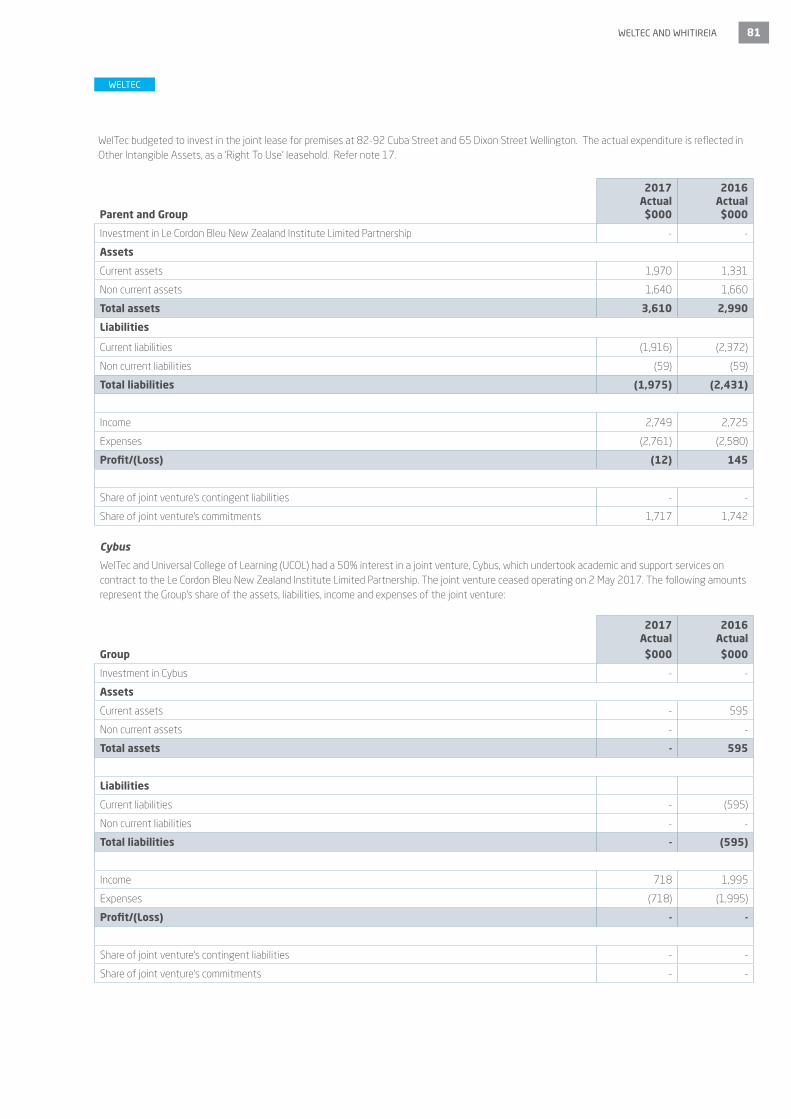
WELTEC AND WHITIREIA 81
Parent and Group
2017 Actual $000
2016 Actual $000
Investment in Le Cordon Bleu New Zealand Institute Limited Partnership - -
Assets
Current assets 1,970 1,331
Non current assets 1,640 1,660
Total assets 3,610 2,990
Liabilities
Current liabilities (1,916) (2,372)
Non current liabilities (59) (59)
Total liabilities (1,975) (2,431)
Income 2,749 2,725
Expenses (2,761) (2,580)
Profit/(Loss) (12) 145
Share of joint venture's contingent liabilities - -
Share of joint venture's commitments 1,717 1,742
Cybus
WelTec and Universal College of Learning (UCOL) had a 50% interest in a joint venture, Cybus, which undertook academic and support services on contract to the Le Cordon Bleu New Zealand Institute Limited Partnership. The joint venture ceased operating on 2 May 2017. The following amounts represent the Group's share of the assets, liabilities, income and expenses of the joint venture:
Group
2017 Actual$000
2016 Actual$000
Investment in Cybus - -
Assets
Current assets - 595
Non current assets - -
Total assets - 595
Liabilities
Current liabilities - (595)
Non current liabilities - -
Total liabilities - (595)
Income 718 1,995
Expenses (718) (1,995)
Profit/(Loss) - -
Share of joint venture’s contingent liabilities - -
Share of joint venture’s commitments - -
WELTEC
WelTec budgeted to invest in the joint lease for premises at 82-92 Cuba Street and 65 Dixon Street Wellington. The actual expenditure is reflected in Other Intangible Assets, as a 'Right To Use' leasehold. Refer note 17.

82 ANNUAL REPORT 2017
Computer Power Plus
WelTec and Whitireia Community Polytechnic have a 50% interest in a joint venture, Computer Power Plus, which undertakes academic and support services on contract to Whitireia New Zealand Limited. The following amounts represent the group's share of the assets, liabilities, income and expenses of the joint venture:
Parent
2017 Actual$000
2016 Actual$000
Investment in Computer Power Plus 140 140
Group
Investment in Computer Power Plus 344 903
Assets
Current assets 277 765
Non current assets 444 386
Total assets 721 1,151
Liabilities
Current liabilities (378) (248)
Total liabilities (378) (248)
Income 2,306 2,500
Expenses (2,865) (2,320)
Profit/(Loss) (559) 180
Share of joint venture’s contingent liabilities - -
Share of joint venture’s commitments 1,070 577
16 PROPERTY, PLANT AND EQUIPMENT
GROUP 2017 $000
Land
and
B
uild
ings
Leas
ehol
d Im
prov
emen
t
Pla
nt
Equi
pmen
t
Har
dwar
e
Furn
itur
e an
d Fi
ttin
gs
Mot
or
Veh
icle
s
Libr
ary
Co
llect
ion
Ass
ets
Hel
d fo
r Sa
le
Ass
ets
unde
r
Cons
truc
tion
Tota
l
Gross Carrying Amount
Balance as at 1 January
63,615 9,910 1,685 1,755 9,737 2,608 300 2,380 5,228 - 97,219
Additions 534 - 201 9 1,237 137 44 165 - 40 2,367
Disposals - - (7) (72) - - - - - - (79)
Reclassifications - - 145 (145) - - - - - - -
Net revaluation increments/ decrements
1,024 - - - - - - - - - 1,024
Balance as at 31 December
65,173 9,910 2,024 1,548 10,974 2,745 344 2,545 5,228 40 100,531
WELTEC
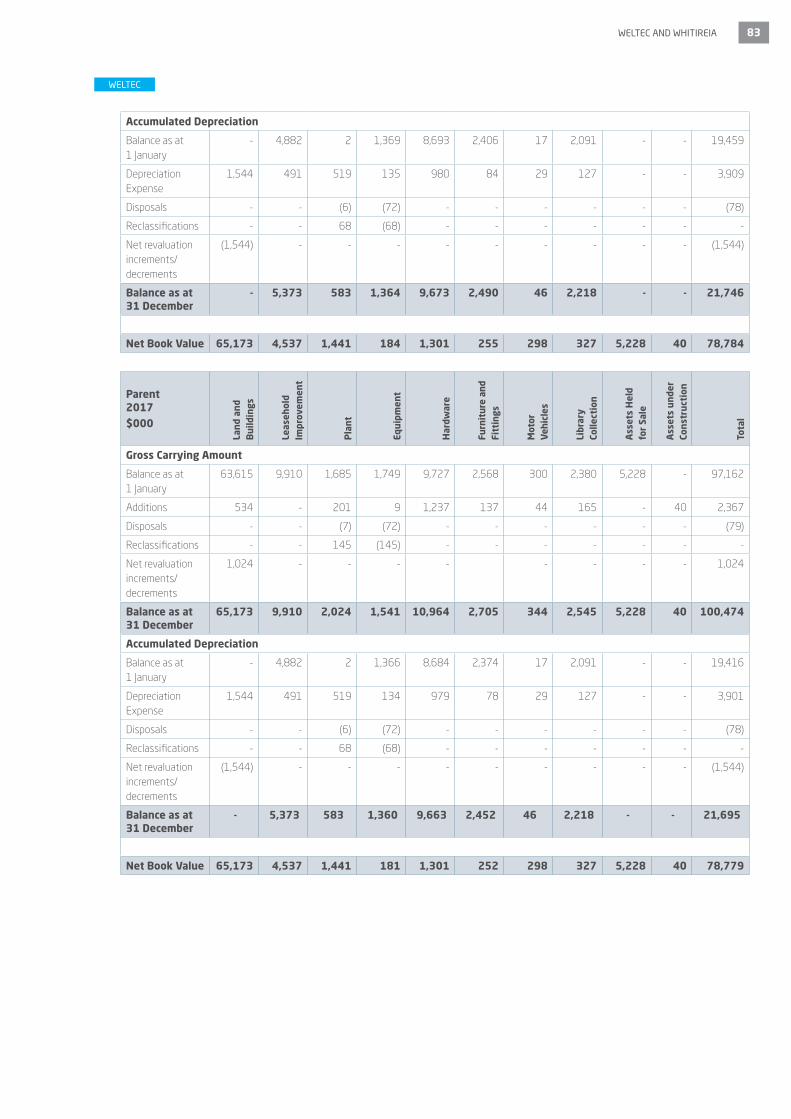
WELTEC AND WHITIREIA 83
Accumulated Depreciation
Balance as at 1 January
- 4,882 2 1,369 8,693 2,406 17 2,091 - - 19,459
Depreciation Expense
1,544 491 519 135 980 84 29 127 - - 3,909
Disposals - - (6) (72) - - - - - - (78)
Reclassifications - - 68 (68) - - - - - - -
Net revaluation increments/ decrements
(1,544) - - - - - - - - - (1,544)
Balance as at 31 December
- 5,373 583 1,364 9,673 2,490 46 2,218 - - 21,746
Net Book Value 65,173 4,537 1,441 184 1,301 255 298 327 5,228 40 78,784
Parent 2017 $000
Land
and
B
uild
ings
Leas
ehol
d Im
prov
emen
t
Pla
nt
Equi
pmen
t
Har
dwar
e
Furn
itur
e an
d Fi
ttin
gs
Mot
or
Veh
icle
s
Libr
ary
Co
llect
ion
Ass
ets
Hel
d fo
r Sa
le
Ass
ets
unde
r
Cons
truc
tion
Tota
l
Gross Carrying Amount
Balance as at 1 January
63,615 9,910 1,685 1,749 9,727 2,568 300 2,380 5,228 - 97,162
Additions 534 - 201 9 1,237 137 44 165 - 40 2,367
Disposals - - (7) (72) - - - - - - (79)
Reclassifications - - 145 (145) - - - - - - -
Net revaluation increments/ decrements
1,024 - - - - - - - - 1,024
Balance as at 31 December
65,173 9,910 2,024 1,541 10,964 2,705 344 2,545 5,228 40 100,474
Accumulated Depreciation
Balance as at 1 January
- 4,882 2 1,366 8,684 2,374 17 2,091 - - 19,416
Depreciation Expense
1,544 491 519 134 979 78 29 127 - - 3,901
Disposals - - (6) (72) - - - - - - (78)
Reclassifications - - 68 (68) - - - - - - -
Net revaluation increments/ decrements
(1,544) - - - - - - - - - (1,544)
Balance as at 31 December
- 5,373 583 1,360 9,663 2,452 46 2,218 - - 21,695
Net Book Value 65,173 4,537 1,441 181 1,301 252 298 327 5,228 40 78,779
WELTEC
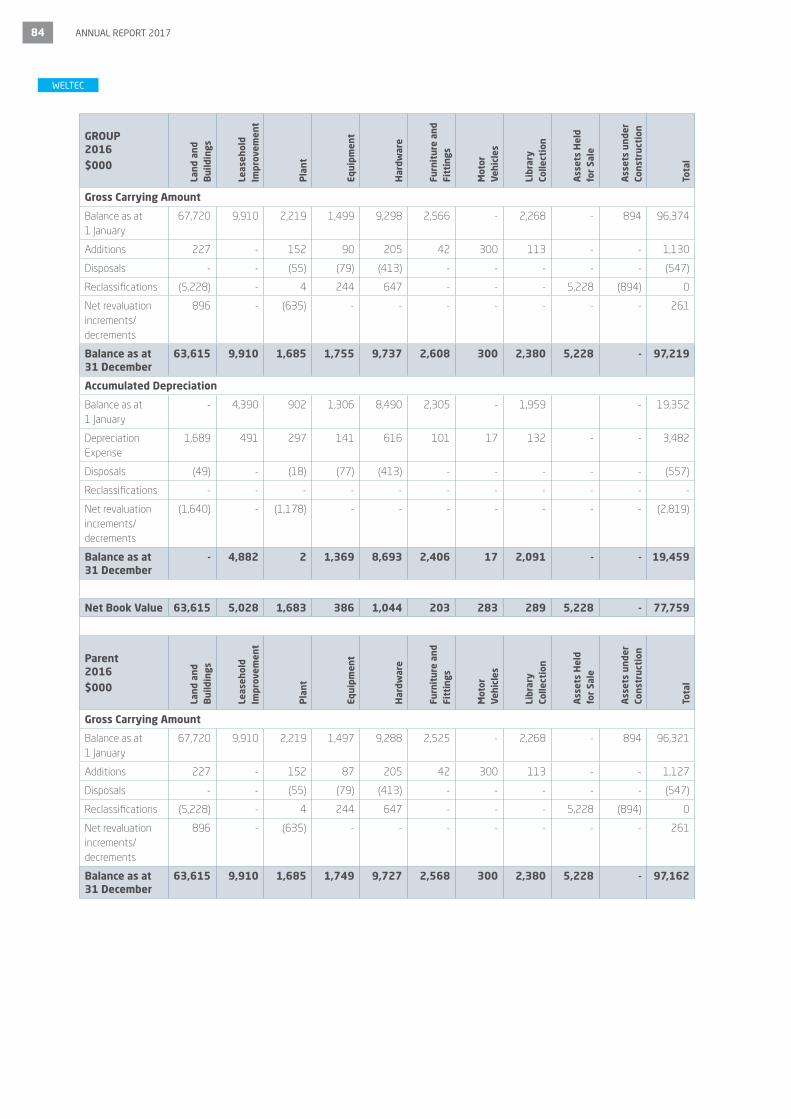
84 ANNUAL REPORT 2017
GROUP 2016 $000
Land
and
B
uild
ings
Leas
ehol
d Im
prov
emen
t
Pla
nt
Equi
pmen
t
Har
dwar
e
Furn
itur
e an
d Fi
ttin
gs
Mot
or
Veh
icle
s
Libr
ary
Co
llect
ion
Ass
ets
Hel
d fo
r Sa
le
Ass
ets
unde
r
Cons
truc
tion
Tota
l
Gross Carrying Amount
Balance as at 1 January
67,720 9,910 2,219 1,499 9,298 2,566 - 2,268 - 894 96,374
Additions 227 - 152 90 205 42 300 113 - - 1,130
Disposals - - (55) (79) (413) - - - - - (547)
Reclassifications (5,228) - 4 244 647 - - - 5,228 (894) 0
Net revaluation increments/ decrements
896 - (635) - - - - - - - 261
Balance as at 31 December
63,615 9,910 1,685 1,755 9,737 2,608 300 2,380 5,228 - 97,219
Accumulated Depreciation
Balance as at 1 January
- 4,390 902 1,306 8,490 2,305 - 1,959 - 19,352
Depreciation Expense
1,689 491 297 141 616 101 17 132 - - 3,482
Disposals (49) - (18) (77) (413) - - - - - (557)
Reclassifications - - - - - - - - - - -
Net revaluation increments/ decrements
(1,640) - (1,178) - - - - - - - (2,819)
Balance as at 31 December
- 4,882 2 1,369 8,693 2,406 17 2,091 - - 19,459
Net Book Value 63,615 5,028 1,683 386 1,044 203 283 289 5,228 - 77,759
Parent 2016 $000
Land
and
B
uild
ings
Leas
ehol
d Im
prov
emen
t
Pla
nt
Equi
pmen
t
Har
dwar
e
Furn
itur
e an
d Fi
ttin
gs
Mot
or
Veh
icle
s
Libr
ary
Co
llect
ion
Ass
ets
Hel
d fo
r Sa
le
Ass
ets
unde
r
Cons
truc
tion
Tota
l
Gross Carrying Amount
Balance as at 1 January
67,720 9,910 2,219 1,497 9,288 2,525 - 2,268 - 894 96,321
Additions 227 - 152 87 205 42 300 113 - - 1,127
Disposals - - (55) (79) (413) - - - - - (547)
Reclassifications (5,228) - 4 244 647 - - - 5,228 (894) 0
Net revaluation increments/ decrements
896 - (635) - - - - - - - 261
Balance as at 31 December
63,615 9,910 1,685 1,749 9,727 2,568 300 2,380 5,228 - 97,162
WELTEC
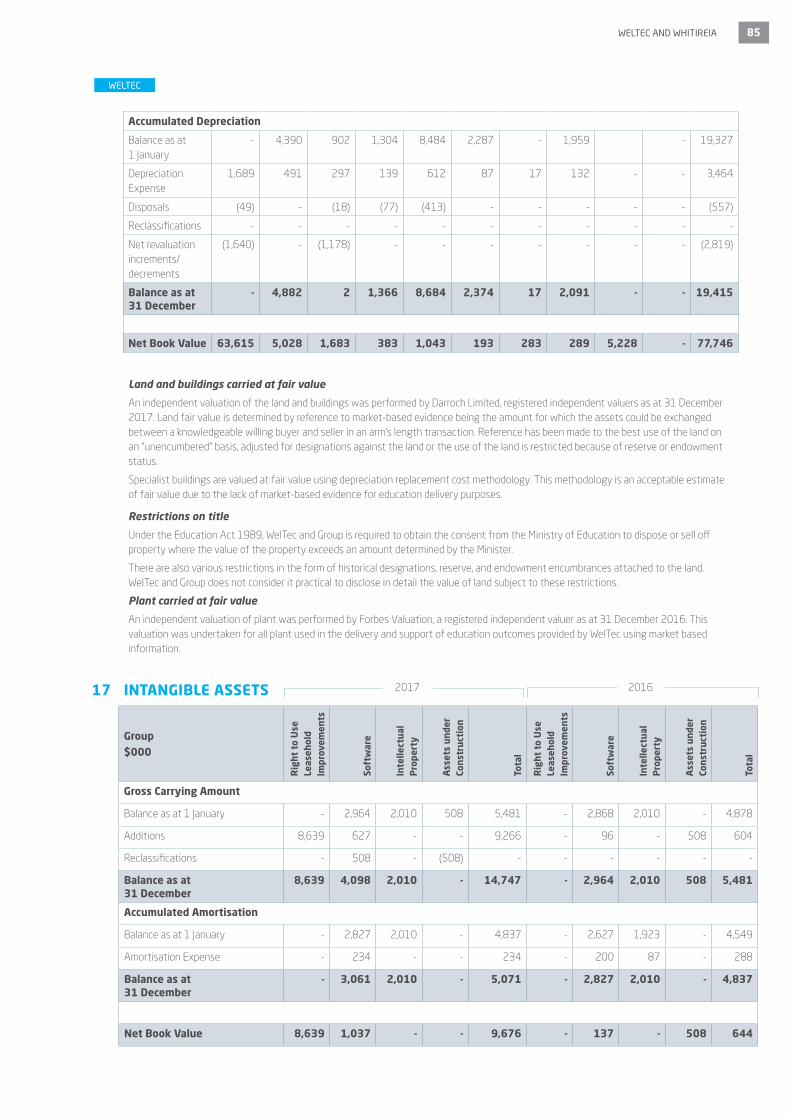
WELTEC AND WHITIREIA 85
17 INTANGIBLE ASSETS
Group$000
Rig
ht t
o U
se
Leas
ehol
d Im
prov
emen
ts
Soft
war
e
Inte
llect
ual
Pro
pert
y
Ass
ets
unde
r
Cons
truc
tion
Tota
l
Rig
ht t
o U
se
Leas
ehol
d Im
prov
emen
ts
Soft
war
e
Inte
llect
ual
Pro
pert
y
Ass
ets
unde
r
Cons
truc
tion
Tota
l
Gross Carrying Amount
Balance as at 1 January - 2,964 2,010 508 5,481 - 2,868 2,010 - 4,878
Additions 8,639 627 - - 9,266 - 96 - 508 604
Reclassifications - 508 - (508) - - - - - -
Balance as at 31 December
8,639 4,098 2,010 - 14,747 - 2,964 2,010 508 5,481
Accumulated Amortisation
Balance as at 1 January - 2,827 2,010 - 4,837 - 2,627 1,923 - 4,549
Amortisation Expense - 234 - - 234 - 200 87 - 288
Balance as at 31 December
- 3,061 2,010 - 5,071 - 2,827 2,010 - 4,837
Net Book Value 8,639 1,037 - - 9,676 - 137 - 508 644
Accumulated Depreciation
Balance as at 1 January
- 4,390 902 1,304 8,484 2,287 - 1,959 - 19,327
Depreciation Expense
1,689 491 297 139 612 87 17 132 - - 3,464
Disposals (49) - (18) (77) (413) - - - - - (557)
Reclassifications - - - - - - - - - - -
Net revaluation increments/ decrements
(1,640) - (1,178) - - - - - - - (2,819)
Balance as at 31 December
- 4,882 2 1,366 8,684 2,374 17 2,091 - - 19,415
Net Book Value 63,615 5,028 1,683 383 1,043 193 283 289 5,228 - 77,746
Land and buildings carried at fair value
An independent valuation of the land and buildings was performed by Darroch Limited, registered independent valuers as at 31 December 2017. Land fair value is determined by reference to market-based evidence being the amount for which the assets could be exchanged between a knowledgeable willing buyer and seller in an arm’s length transaction. Reference has been made to the best use of the land on an "unencumbered" basis, adjusted for designations against the land or the use of the land is restricted because of reserve or endowment status.
Specialist buildings are valued at fair value using depreciation replacement cost methodology. This methodology is an acceptable estimate of fair value due to the lack of market-based evidence for education delivery purposes.
Restrictions on title
Under the Education Act 1989, WelTec and Group is required to obtain the consent from the Ministry of Education to dispose or sell off property where the value of the property exceeds an amount determined by the Minister.
There are also various restrictions in the form of historical designations, reserve, and endowment encumbrances attached to the land. WelTec and Group does not consider it practical to disclose in detail the value of land subject to these restrictions.
Plant carried at fair value
An independent valuation of plant was performed by Forbes Valuation, a registered independent valuer as at 31 December 2016. This valuation was undertaken for all plant used in the delivery and support of education outcomes provided by WelTec using market based information.
WELTEC
20162017

86 ANNUAL REPORT 2017
18 TRADE AND OTHER PAYABLES
2017 Actual $000
2016 Actual $000
2017 Actual $000
2016 Actual
$000
Trade payables 2,893 3,494 2,489 3,850
Related party payable (note 31) 759 750 759 112
Goods and services tax (GST) payable 578 1,076 576 1,074
4,230 5,320 3,824 5,036
Trade payables are non-interest bearing and are normally settled on 30-day terms, therefore the carrying value of payables approximates their fair value.
19 CURRENT EMPLOYEE BENEFIT PROVISIONSAccrued employee payments (167) (117) (163) (124)
Annual and discretionary leave 1,812 1,784 1,798 1,769
Current long service leave 27 51 27 51
Sick leave 265 227 265 227
1,937 1,944 1,927 1,923
A provision is recognised for post employment benefits payable to employees. Employees are entitled to annual leave pay, long service leave and retirement leave pay. Annual leave and sick leave entitlements expected to be settled within 12 months of the balance date are measured at the current rates of pay and classified as current liabilities.
ParentGroup
WELTEC
17 INTANGIBLE ASSETS
Parent$000
Rig
ht t
o U
se
Leas
ehol
d Im
prov
emen
ts
Soft
war
e
Inte
llect
ual
Pro
pert
y
Ass
ets
unde
r
Cons
truc
tion
Tota
l
Rig
ht t
o U
se
Leas
ehol
d Im
prov
emen
ts
Soft
war
e
Inte
llect
ual
Pro
pert
y
Ass
ets
unde
r
Cons
truc
tion
Tota
l
Gross Carrying Amount
Balance as at 1 January - 2,937 2,010 508 5,455 - 2,841 2,010 - 4,851
Additions 8,639 627 - - 9,266 - 96 - 508 604
Reclassifications - 508 - (508) - - - - - -
Balance as at 31 December
8,639 4,071 2,010 - 14,721 - 2,937 2,010 508 5,455
Accumulated Amortisation
Balance as at 1 January - 2,801 2,010 - 4,811 - 2,610 1,923 - 4,532
Amortisation Expense - 234 - - 234 - 192 87 - 279
Balance as at 31 December
- 3,034 2,010 - 5,045 - 2,801 2,010 - 4,811
Net Book Value 8,639 1,037 - - 9,676 - 136 - 508 643
20162017
Other Intangible Assets, is a 'Right To Use' the leasehold of the joint lease for premises at 82-92 Cuba Street and 65 Dixon Street Wellington, with Whitireia Community Polytechnic.
There are no restrictions over the title of WelTec or Group’s intangible assets, nor are any intangible assets pledged as security for liabilities.

WELTEC AND WHITIREIA 87
20 INCOME IN ADVANCE
2017 Actual $000
2016 Actual $000
2017 Actual $000
2016 Actual
$000
Student income in advance 6,399 8,234 6,399 8,238
Other income in advance 611 731 179 289
7,010 8,965 6,578 8,527
21 NON CURRENT EMPLOYEE BENEFIT PROVISIONSLong Service leave 84 88 84 88
Retirement leave 122 101 122 101
206 189 206 189
Entitlements related to long service leave and retirement leave have been calculated at the present value of future cash flows determined on an actuarial basis and classified as non-current liabilities. Two key assumptions used in calculating this liability include the discount rate of 1.86 (2016: 2.02) and the salary inflation factor of 1% (2016: 1%). Any changes in these assumptions will impact on the carrying amount of the liability.
Expected future payments are discounted using forward discount rates as provided by the Treasury. The salary inflation factor has been determined after considering historical salary inflation patterns and referencing the Treasury time series of Fiscal and Economic Indicators.
If the salary inflation factor were to increase or decrease by 1% from that used, with all other factors held constant, the carrying amount of the retirement leave would be $4,000 higher/lower and the long service leave would be $4,000 higher/lower.
If the discount rate used were to increase or decrease by 1% from that used, with all other factors held constant, the carrying amount of the retirement leave would be $5,000 higher/lower while the long service leave would be $5,000 higher/lower.
22 CROWN EQUITY Opening balance 39,332 39,332 39,332 39,332
Closing balance 39,332 39,332 39,332 39,332
Crown Equity represents the total investment the Crown has in WelTec. It is comprised of two components, Notional Equity - the carrying value of Crown-owned land and buildings at the date the Crown vested all the normal risks and rewards of ownership to WelTec, and Received Equity - actual cash payments received.
Capital Management
WelTec is subject to the financial management and accountability provisions of the Education Act 1989, which includes restrictions in relation to: disposing of assets or interests in assets, ability to mortgage or otherwise charge assets or interests in assets, granting leases of land or buildings or parts of buildings, and borrowing.
WelTec manages its revenues, expenses, assets, liabilities and general financial dealings prudently and in a manner that promotes the current and future interests of the community. WelTec's equity is largely managed as a by-product of managing revenues, expenses, assets, liabilities and general financial dealings.
The objective of managing WelTec's equity is to ensure that it effectively and efficiently achieves the goals and objectives for which it has been established, while remaining a going concern.
23 RETAINED EARNINGSOpening balance 11,304 9,105 11,453 9,110
Profit / (loss) (2,073) 2,199 (1,487) 2,343
Balance at end of financial year 9,231 11,304 9,966 11,453
ParentGroup
WELTEC
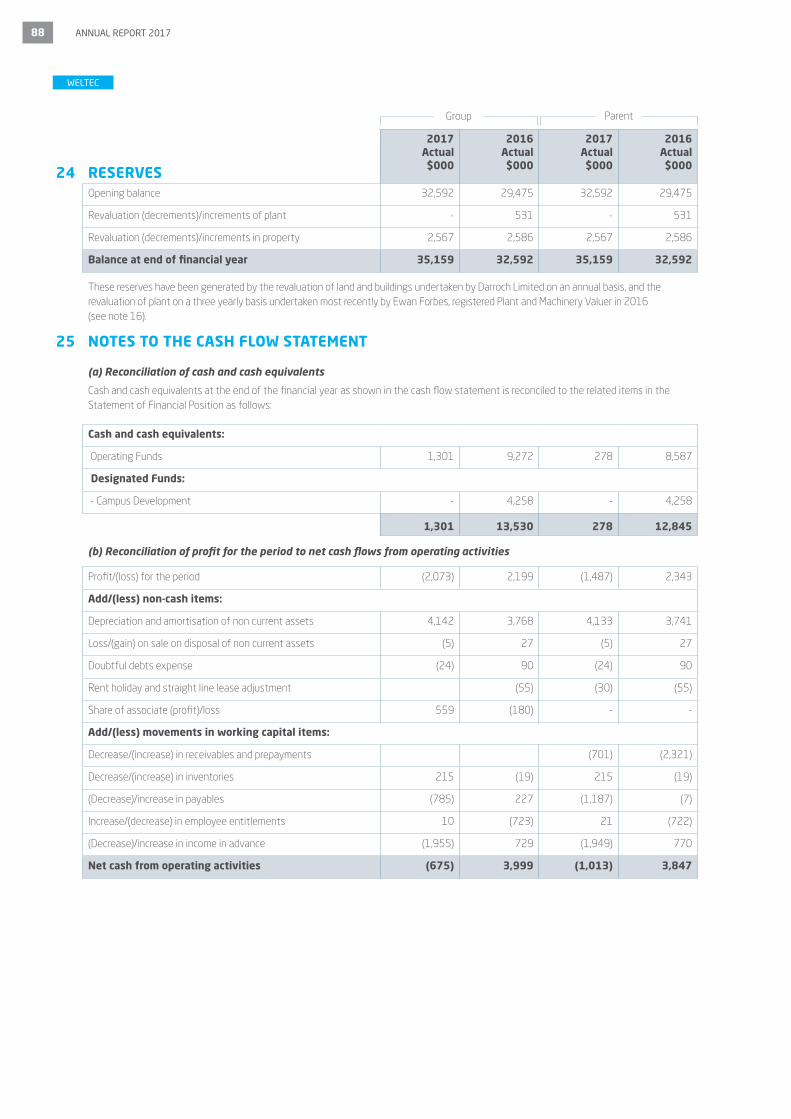
88 ANNUAL REPORT 2017
24 RESERVES
2017 Actual $000
2016 Actual $000
2017 Actual $000
2016 Actual
$000
Opening balance 32,592 29,475 32,592 29,475
Revaluation (decrements)/increments of plant - 531 - 531
Revaluation (decrements)/increments in property 2,567 2,586 2,567 2,586
Balance at end of financial year 35,159 32,592 35,159 32,592
These reserves have been generated by the revaluation of land and buildings undertaken by Darroch Limited on an annual basis, and the revaluation of plant on a three yearly basis undertaken most recently by Ewan Forbes, registered Plant and Machinery Valuer in 2016 (see note 16).
25 NOTES TO THE CASH FLOW STATEMENT
(a) Reconciliation of cash and cash equivalents
Cash and cash equivalents at the end of the financial year as shown in the cash flow statement is reconciled to the related items in the Statement of Financial Position as follows:
Cash and cash equivalents:
Operating Funds 1,301 9,272 278 8,587
Designated Funds:
- Campus Development - 4,258 - 4,258
1,301 13,530 278 12,845
(b) Reconciliation of profit for the period to net cash flows from operating activities
Profit/(loss) for the period (2,073) 2,199 (1,487) 2,343
Add/(less) non-cash items:
Depreciation and amortisation of non current assets 4,142 3,768 4,133 3,741
Loss/(gain) on sale on disposal of non current assets (5) 27 (5) 27
Doubtful debts expense (24) 90 (24) 90
Rent holiday and straight line lease adjustment (55) (30) (55)
Share of associate (profit)/loss 559 (180) - -
Add/(less) movements in working capital items:
Decrease/(increase) in receivables and prepayments (701) (2,321)
Decrease/(increase) in inventories 215 (19) 215 (19)
(Decrease)/increase in payables (785) 227 (1,187) (7)
Increase/(decrease) in employee entitlements 10 (723) 21 (722)
(Decrease)/increase in income in advance (1,955) 729 (1,949) 770
Net cash from operating activities (675) 3,999 (1,013) 3,847
ParentGroup
WELTEC

WELTEC AND WHITIREIA 89
26 EXPLANATION OF MAJOR VARIANCES AGAINST BUDGET
Statement of comprehensive income
WelTec Parent
The 2017 WelTec parent operating deficit of $0.3m was $1.5m less than budget. This was due to domestic student demand challenges faced during the year.
WelTec finished 2017 having achieved 98.2% of SAC Level 3 and above of Investment Plan funding targets.
WelTec experienced increased income from international students, and favourable ITO contract work and Trades Academy work compared to budget.
Cost of Services were managed throughout the year to help offset reduced revenue levels. Savings were achieved in personnel consistent with lower student numbers. Administration costs savings were achieved through reduced travel and accommodation and printing costs. Infrastructure costs included earthquake remedial work.
Subsidiaries and jointly controlled entities
2017 was the fourth year of operation for WelTec Student Accommodation Limited, trading as 222 Willis, which reported a loss due to accountancy treatment of recording lease costs over the life of the lease as straight line, rather than cash paid. Occupancy rates were favourable to budget. 222 Willis would have been profitable if the lease was cash accounted. .
W2 Shared Services Limited commenced trading as a limited liability company in 2015, having operated as an unincorporated joint venture in 2014. WelTec and Whitireia each hold a 50% shareholding in the company. W2 performed better than budget in costs, and achieved a planned breakeven result in 2017 for the two customers, WelTec and Whitireia.
Computer Power Plus generated a deficit result due to domestic student demand challenges. WelTec has reflected 50% of this deficit via an equity accounting entry within the accounts within the consolidated profit for the Group. No dividend/distribution was declared for 2017.
Group Balance Sheet and Cash flows
Cash and cash equivalents finished 2017 $5.5m lower than budget. This reflects Assets held for sale that were not disposed of during 2017.
Receivables are higher than budget reflecting TEC receivable due for 2018 students enrolled during 2017.
Property, plant and equipment did not reach budgeted levels in 2017, however the annual revaluation increased the carrying value of the assets.
WELTEC

90 ANNUAL REPORT 2017
27 COMMITMENTS2017 Actual
$0002016 Actual
$000
(a) Capital expenditure commitments
Buildings - 553
Equipment - 135
Hardware - 55
Furniture and fittings 90 -
90 743
(b) Lease commitments
Non cancellable operating lease commitments are disclosed in note 28 to the financial statements.
28 LEASES(a) Leasing arrangements
WelTec and Group enter into operating leases for buildings and vehicles:
- Building premises are leased for WelTec satellite delivery offices in Auckland and Christchurch, and for WelTec delivery in Wellington city. The length of terms of these leases vary from under 12 months to 22 years, with rights to renewal on a number of contracts.
- WelTec Student Accommodation Limited has entered into an operating lease for the building located at 222 Willis Street, Wellington. The initial lease term is for 15 years with further rights to renewal included within the contract.
-WelTec and Whitireia have entered into a joint 21 year lease for premises at 82-92 Cuba Street and 65 Dixon Street Wellington. The two institutions are jointly and severally liable for the lease costs and 34% of the lease commitment has been included in the operating commitments.
- Vehicles are leased over 3 - 5 year terms depending on the type of vehicle concerned.
Group and Parent
2017 Actual $000
2016 Actual $000
2017 Actual $000
2016 Actual $000
(b) Non-cancellable operating lease payments
Not longer than 1 year 5,030 4,040 2,004 1,985
Between 1 and 5 years 16,336 15,466 7,293 6,666
Longer than 5 years 37,508 39,620 21,964 21,722
58,874 59,126 31,261 30,373
29 CONTINGENT LIABILITIES
WelTec has no contingent liabilities as at 31 December 2017. (Nil: 2016).
ParentGroup
WELTEC
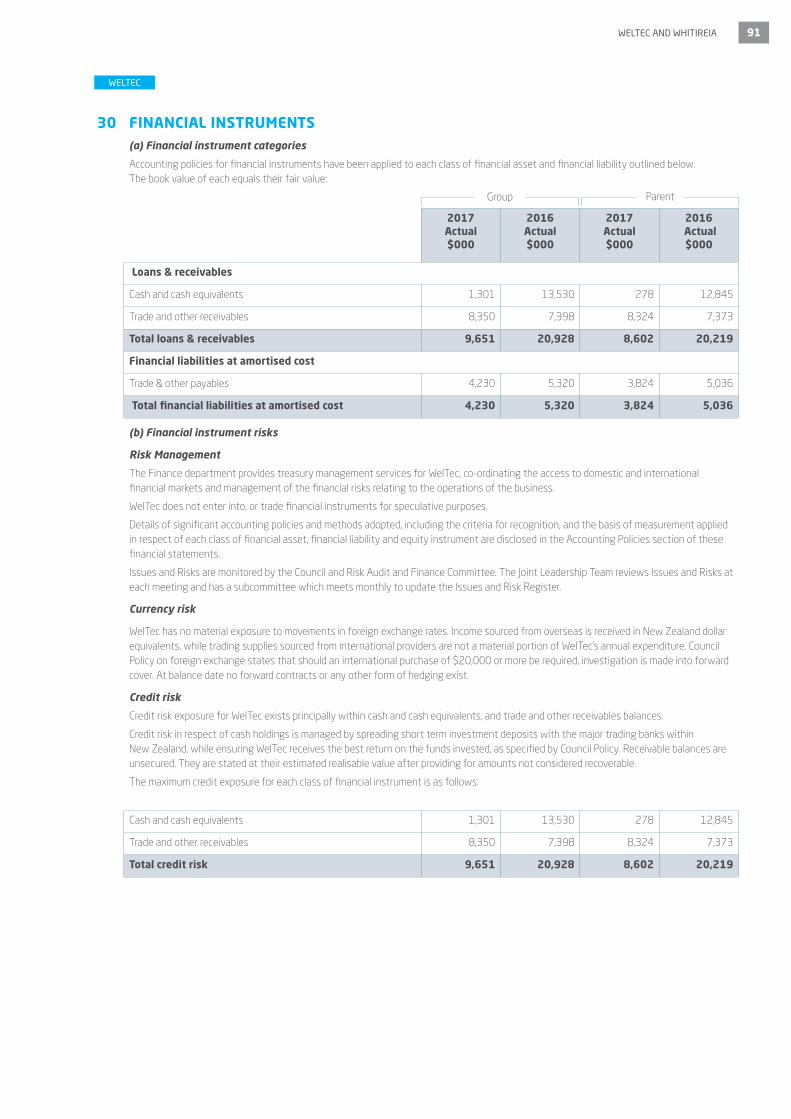
WELTEC AND WHITIREIA 91
ParentGroup
30 FINANCIAL INSTRUMENTS(a) Financial instrument categories
Accounting policies for financial instruments have been applied to each class of financial asset and financial liability outlined below. The book value of each equals their fair value:
2017 Actual $000
2016 Actual $000
2017 Actual $000
2016 Actual $000
Loans & receivables
Cash and cash equivalents 1,301 13,530 278 12,845
Trade and other receivables 8,350 7,398 8,324 7,373
Total loans & receivables 9,651 20,928 8,602 20,219
Financial liabilities at amortised cost
Trade & other payables 4,230 5,320 3,824 5,036
Total financial liabilities at amortised cost 4,230 5,320 3,824 5,036
(b) Financial instrument risks
Risk Management
The Finance department provides treasury management services for WelTec, co-ordinating the access to domestic and international financial markets and management of the financial risks relating to the operations of the business.
WelTec does not enter into, or trade financial instruments for speculative purposes.
Details of significant accounting policies and methods adopted, including the criteria for recognition, and the basis of measurement applied in respect of each class of financial asset, financial liability and equity instrument are disclosed in the Accounting Policies section of these financial statements.
Issues and Risks are monitored by the Council and Risk Audit and Finance Committee. The Joint Leadership Team reviews Issues and Risks at each meeting and has a subcommittee which meets monthly to update the Issues and Risk Register.
Currency risk
WelTec has no material exposure to movements in foreign exchange rates. Income sourced from overseas is received in New Zealand dollar equivalents, while trading supplies sourced from international providers are not a material portion of WelTec's annual expenditure. Council Policy on foreign exchange states that should an international purchase of $20,000 or more be required, investigation is made into forward cover. At balance date no forward contracts or any other form of hedging exist.
Credit risk
Credit risk exposure for WelTec exists principally within cash and cash equivalents, and trade and other receivables balances.
Credit risk in respect of cash holdings is managed by spreading short term investment deposits with the major trading banks within New Zealand, while ensuring WelTec receives the best return on the funds invested, as specified by Council Policy. Receivable balances are unsecured. They are stated at their estimated realisable value after providing for amounts not considered recoverable
The maximum credit exposure for each class of financial instrument is as follows:
Cash and cash equivalents 1,301 13,530 278 12,845
Trade and other receivables 8,350 7,398 8,324 7,373
Total credit risk 9,651 20,928 8,602 20,219
WELTEC

92 ANNUAL REPORT 2017
The credit quality of financial assets that are neither past due nor impaired can be assessed by reference to Standard and Poor’s credit ratings (if available) or to historical information about counterparty default rates:
2017 Actual $000
2016 Actual $000
2017 Actual $000
2016 Actual $000
Counterparties with credit ratings
Cash and cash equivalents AA- rating 1,301 13,530 278 12,845
Total cash and cash equivalents 1,301 13,530 278 12,845
Counterparties without credit ratings
Trade and other receivables with no defaults in the past 8,350 7,398 8,324 7,373
Total trade and other receivables 8,350 7,398 8,324 7,373
Liquidity risk
WelTec manages liquidity risk by maintaining adequate reserves to ensure the provision of educational services for the foreseeable future. This is completed by continuously monitoring and forecasting cash flows for the medium term. The maximisation of operational inflows and efficient management of operational and investing outflows ensures sufficient cash reserves are maintained. An overdraft facility of $5M (2016: Nil) was arranged for December 2017 to April 2018, however this was never drawn down during this time.
Contractual maturity analysis of financial liabilities
The table below analyses financial liabilities into relevant maturity groupings based on the remaining period at the balance date to the contractual maturity date.
ParentGroup
Carrying amount
$000
Contractual Cash flow
$000
Less than 6 months
$000
6-12 months $000
1-2 years $000
Group 2017
Trade and other payables 4,230 4,230 4,230 - -
Total 4,230 4,230 4,230 - -
Parent 2017
Trade and other payables 3,824 3,824 3,824 - -
Total 3,824 3,824 3,824 - -
Group 2016
Trade and other payables 5,320 5,320 5,320 - -
Total 5,320 5,320 5,320 - -
Parent 2016
Trade and other payables 5,036 5,036 5,036 - -
Total 5,036 5,036 5,036 - -
WELTEC

WELTEC AND WHITIREIA 93
Interest rate risk
WelTec has exposure to interest rate risk to the extent that it has outstanding investments at fixed rates. The interest rates risk on investments is managed through the use of short term investments, in accordance with Council Policy. No significant exposure to interest rate risk exists on the remaining financial assets and liabilities.
Sensitivity analysis
The table below illustrates the potential profit or loss and equity impact for reasonably possible market movements, with all other variables held constant, based on financial instrument exposures at the balance date.
Profit -50bps $000
Profit +50bps
$000
Profit -50bps $000
Profit +50bps
$000
Group and Institute Interest rate risk
Financial Assets
Cash and cash equivalents (1) 1 (7) 7
Other financial assets - - - -
Total sensitivity (1) 1 (7) 7
Explanation of interest rate risk sensitivity
The interest rate sensitivity is based on a reasonable possible movement in interest rates, with all other variables held constant, measured on a basis points (bps) movement. For example, a decrease in 25 bps is equivalent to a decrease in interest rates of 0.25%. The sensitivity for interest rate swaps has been calculated using a derivative valuation model based on a parallel shift in interest rates of -50bps/+50bps.
31 RELATED PARTY DISCLOSURESWelTec and Whitireia are related parties as a consequence of the joint council. The general nature of the trading between WelTec and Whitireia is shared employee and operating costs, including shared premises. Whitireia was contracted to deliver Trades Academy delivery for WelTec during 2017. The transactions are at cost.
Transactions with key management personnel
Key management personnel includes the Council and executive management. Whitireia and WelTec have a Joint Leadership Team (consisting of the CEO and seven Directors). The costs of Council members and JLT are shared between Whitireia and WelTec on a 50/50% basis.
The figures below represent 50% of councillors total compensation.
2017 Actual $000
2016 Actual $000
2017 Actual $000
2016 Actual
$000
Joint Leadership Team (8 FTE x 50%) (2016: 9 FTE x 50%)
930 1,417 930 1417
Council members (paid jointly by WelTec and Whitireia)
Greg Campbell (Current Chairperson) 12 - 12 -
Roger Sowry (Prior Chair) 10 20 10 20
Vaughan Renner (Deputy Chairperson) 12 12 12 12
Deborah Hume 10 10 10 10
Nancy McIntosh - Ward 10 10 10 10
Antony Royal 10 10 10 10
Kabini Sanga 10 10 10 10
Fran Wilde 10 10 10 10
Jackie Lloyd 10 10 10 10
94 92 94 92
20162017
ParentGroup
WELTEC

94 ANNUAL REPORT 2017
2017 Actual $000
2016 Actual $000
Subsidiary
WelTec Student Accomodation Limited
Debtor for services provided by WelTec 35 52
Payable for services provided by WelTec Student Accommodation Limited - -
2017 Actual $000
2016 Actual $000
Associate
MotorTrain Limited
No related party transactions were entered into during the year - -
LCBNZI Limited Partnership
Services provided by WelTec and Group 1,560 236
Debtor for services provided by WelTec and Group 281 170
Payable for services provided by LCBNZI 759 638
LCB Management Limited
No related party transactions were entered into during the year - -
Jointly Controlled Entity
Computer Power Joint Venture
Services provided by WelTec 247 271
Debtor for services provided by WelTec 295 312
Cybus Joint Venture
Services provided by WelTec 34 228
Debtor for services provided by WelTec - 582
W² Shared Services Limited
Services provided by WelTec - -
Services received from W² 2,099 2,179
Debtor for services provided by WelTec 107 254
Payable for services provided by W² - 112
32 CHANGES IN ACCOUNTING ESTIMATES
There have been no changes in accounting estimates during the period.
33 EVENTS AFTER BALANCE DATE
There are no events after balance date to report.
Parent
Group and Parent
Related party transactions with subsidiary, associate, and jointly controlled entity
During the reporting period WelTec and Group entered into transactions with LCBNZI Limited Partnership, a partnership in which WelTec holds an equity interest through WelTec Enterprises Limited (refer note 15). These transactions occurred within a normal supplier relationship on terms and conditions no more or less favourable than those which it is reasonable to expect WelTec would have adopted if dealing with the partnership as per any independent third party.
WELTEC

WELTEC AND WHITIREIA 95
WELTEC
Council Chair Chief Executive30 April 2018 30 April 2018
STATEMENT OF COMPLIANCE AND RESPONSIBILITY FOR THE YEAR ENDED 31 DECEMBER 2017
Signed by
STATEMENT OF COMPLIANCE
The Council and management of Wellington Institute of Technology confirm that all the statutory requirements in relation to this annual report, as outlined in the Education Act 1989, have been met.
STATEMENT OF RESPONSIBILITY
The Council and management accept responsibility for the preparation of the annual financial statements and judgements used in them, and hereby adopt the financial statements as presented. They also accept responsibility for establishing and maintaining a system of internal control designed to provide reasonable assurance as to the integrity and reliability of financial reporting and service performance reporting.
In the Council and management’s opinion, the annual financial statements for the year ended 31 December 2017 fairly reflect the financial position, financial performance and service performance achievements of the Wellington Institute of Technology and Group.

96 ANNUAL REPORT 2017
Financial Statements
Whitireia
WELTEC AND WHITIREIA 97
Statement of Financial Performance 98
Statement of Comprehensive Income 99
Statement of Changes in Equity 100
Statement of Financial Position 101
Statement of Cash Flows 102
Reconciliation from the net surplus / (deficit)to the net cash flows from operations 103
Notes to the Financial Statements 104
Statement of Compliance and Responsibility 132
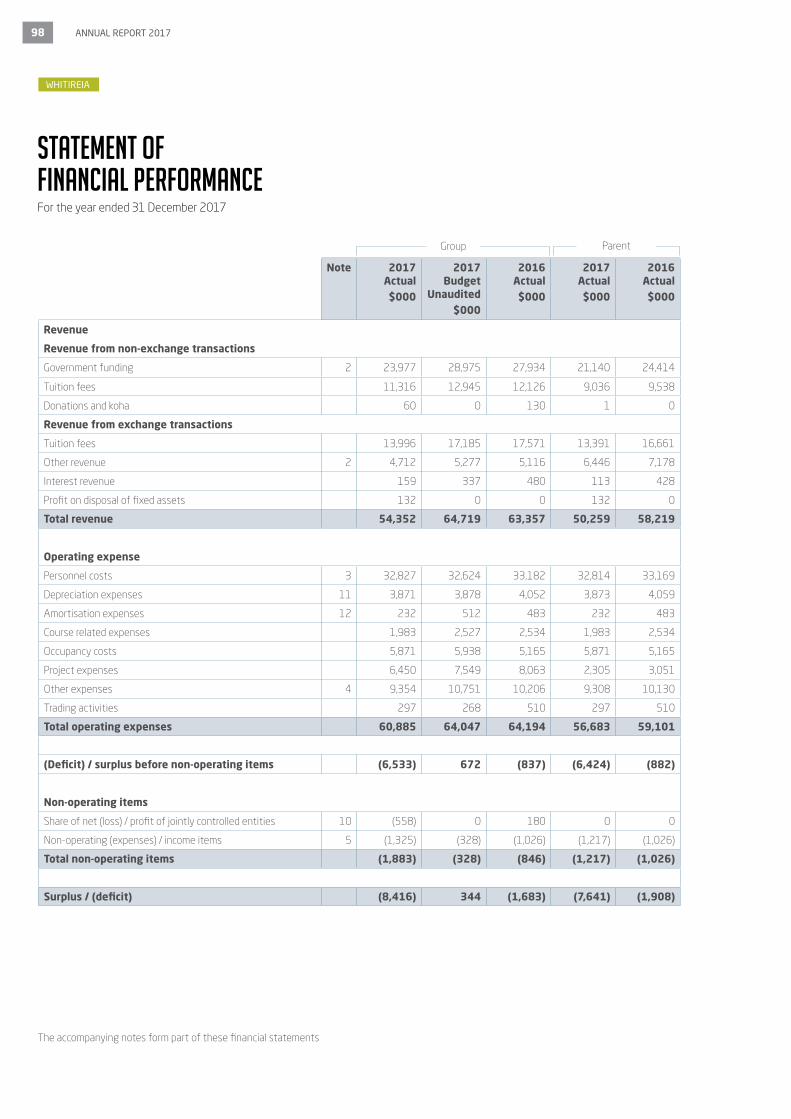
98 ANNUAL REPORT 2017
The accompanying notes form part of these financial statements
STATEMENT OF FINANCIAL PERFORMANCEFor the year ended 31 December 2017
Note 2017 Actual$000
2017 Budget
Unaudited$000
2016 Actual$000
2017 Actual$000
2016 Actual$000
Revenue
Revenue from non-exchange transactions
Government funding 2 23,977 28,975 27,934 21,140 24,414
Tuition fees 11,316 12,945 12,126 9,036 9,538
Donations and koha 60 0 130 1 0
Revenue from exchange transactions
Tuition fees 13,996 17,185 17,571 13,391 16,661
Other revenue 2 4,712 5,277 5,116 6,446 7,178
Interest revenue 159 337 480 113 428
Profit on disposal of fixed assets 132 0 0 132 0
Total revenue 54,352 64,719 63,357 50,259 58,219
Operating expense
Personnel costs 3 32,827 32,624 33,182 32,814 33,169
Depreciation expenses 11 3,871 3,878 4,052 3,873 4,059
Amortisation expenses 12 232 512 483 232 483
Course related expenses 1,983 2,527 2,534 1,983 2,534
Occupancy costs 5,871 5,938 5,165 5,871 5,165
Project expenses 6,450 7,549 8,063 2,305 3,051
Other expenses 4 9,354 10,751 10,206 9,308 10,130
Trading activities 297 268 510 297 510
Total operating expenses 60,885 64,047 64,194 56,683 59,101
(Deficit) / surplus before non-operating items (6,533) 672 (837) (6,424) (882)
Non-operating items
Share of net (loss) / profit of jointly controlled entities 10 (558) 0 180 0 0
Non-operating (expenses) / income items 5 (1,325) (328) (1,026) (1,217) (1,026)
Total non-operating items (1,883) (328) (846) (1,217) (1,026)
Surplus / (deficit) (8,416) 344 (1,683) (7,641) (1,908)
ParentGroup
WHITIREIA
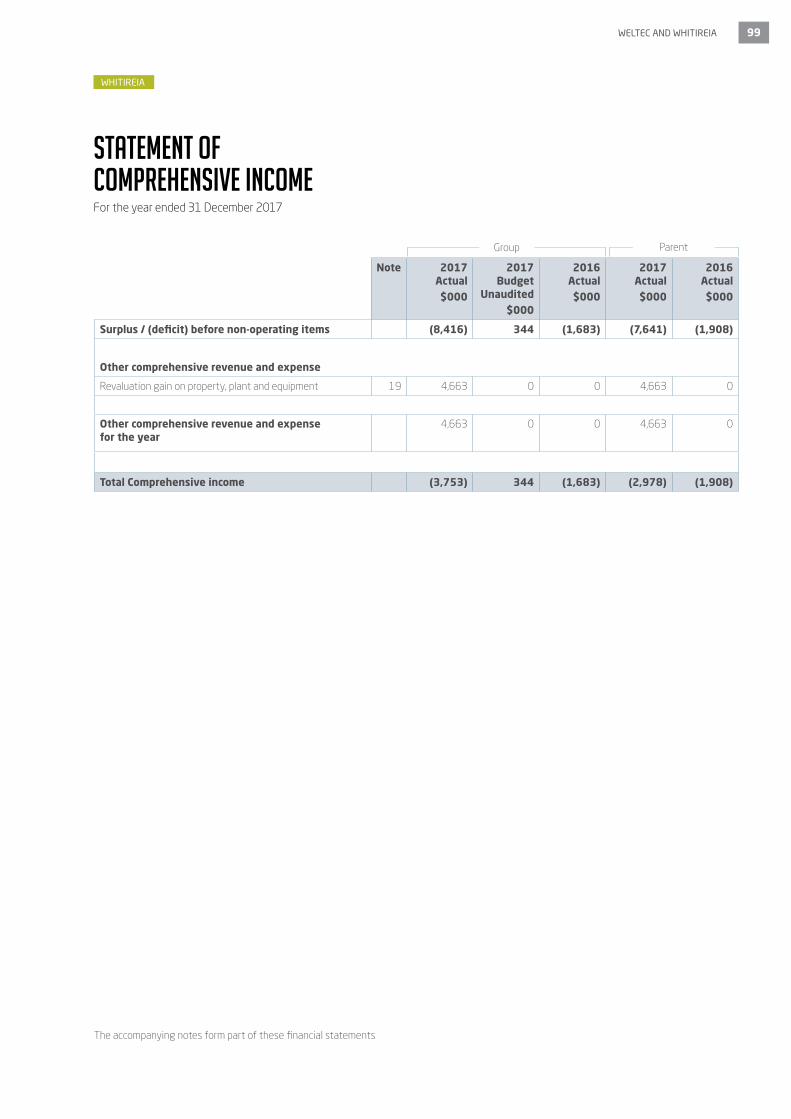
WELTEC AND WHITIREIA 99
The accompanying notes form part of these financial statements
Statement of Comprehensive IncomeFor the year ended 31 December 2017
WHITIREIA
Note 2017 Actual$000
2017 Budget
Unaudited$000
2016 Actual$000
2017 Actual$000
2016 Actual$000
Surplus / (deficit) before non-operating items (8,416) 344 (1,683) (7,641) (1,908)
Other comprehensive revenue and expense
Revaluation gain on property, plant and equipment 19 4,663 0 0 4,663 0
Other comprehensive revenue and expense for the year
4,663 0 0 4,663 0
Total Comprehensive income (3,753) 344 (1,683) (2,978) (1,908)
ParentGroup
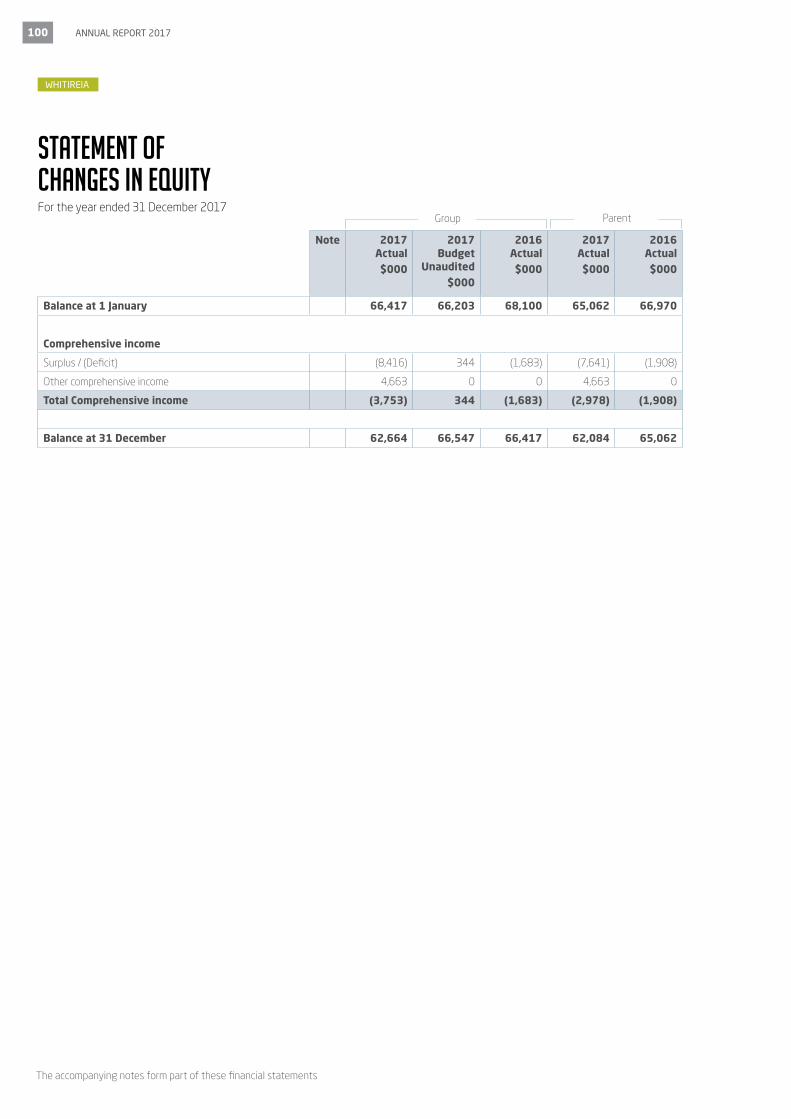
100 ANNUAL REPORT 2017
Statement of Changes in EquityFor the year ended 31 December 2017
The accompanying notes form part of these financial statements
Note 2017 Actual$000
2017 Budget
Unaudited$000
2016 Actual$000
2017 Actual$000
2016 Actual$000
Balance at 1 January 66,417 66,203 68,100 65,062 66,970
Comprehensive income
Surplus / (Deficit) (8,416) 344 (1,683) (7,641) (1,908)
Other comprehensive income 4,663 0 0 4,663 0
Total Comprehensive income (3,753) 344 (1,683) (2,978) (1,908)
Balance at 31 December 62,664 66,547 66,417 62,084 65,062
ParentGroup ParentGroup
WHITIREIA

WELTEC AND WHITIREIA 101
STATEMENT OF FINANCIAL POSITIONas at 31 December 2017
The accompanying notes form part of these financial statements
Note 2017 Actual$000
2017 Budget
Unaudited$000
2016 Actual$000
2017 Actual$000
2016 Actual$000
Current Assets
Cash and cash equivalents 6 4,326 2,322 4,891 3,692 4,226
Debtors and other receivables 7 7,866 6,113 8,089 6,333 6,309
Inventory 8 88 208 208 88 208
Prepayments 436 514 503 432 503
Taxation 18 0 0 0 0
Term deposits 9 373 389 2,389 0 2,000
Assets held for sale 13 325 0 636 325 636
Total current assets 13,432 9,546 16,717 10,870 13,882
Non-current assets
Investment in controlled entity 9 0 0 0 693 1,346
Investment in joint controlled entity 10 344 776 903 140 140
Property, plant and equipment 11 92,515 84,295 70,422 92,521 70,428
Intangible assets 12 702 1,402 1,219 702 458
Total non-current assets 93,561 86,473 72,544 94,056 72,372
Total Assets 106,993 96,019 89,261 104,926 86,254
Current liabilities
Creditors and other payables 14 4,941 4,636 7,441 4,717 6,654
Special accounts 15 25 82 82 15 78
Revenue received in advance 16 12,728 14,128 10,841 11,475 9,979
Employee entitlements 17 2,478 2,122 1,996 2,478 1,996
Current provisions 18 464 448 407 464 407
Loans and borrowings 20 13,900 0 0 13,900 0
Total current liabilities 34,536 21,416 20,766 33,049 19,114
Non-current liabilities
Employee Entitlements 17 112 162 162 112 162
Revenue received in advance 16 8,153 0 0 8,153 0
Provisions 18 1,528 7,894 1,916 1,528 1,916
Total non-current liabilities 9,793 8,056 2,078 9,793 2,078
Total Liabilities 44,329 29,472 22,844 42,842 21,192
Net Assets 62,664 66,547 66,417 62,084 65,062
Equity
General reserves 19 39,390 47,936 47,806 38,822 46,463
Property revaluation reserves 19 23,262 18,599 18,599 23,262 18,599
Restricted reserves 19 12 12 12 0 0
62,664 66,547 66,417 62,084 65,062
ParentGroup
WHITIREIA
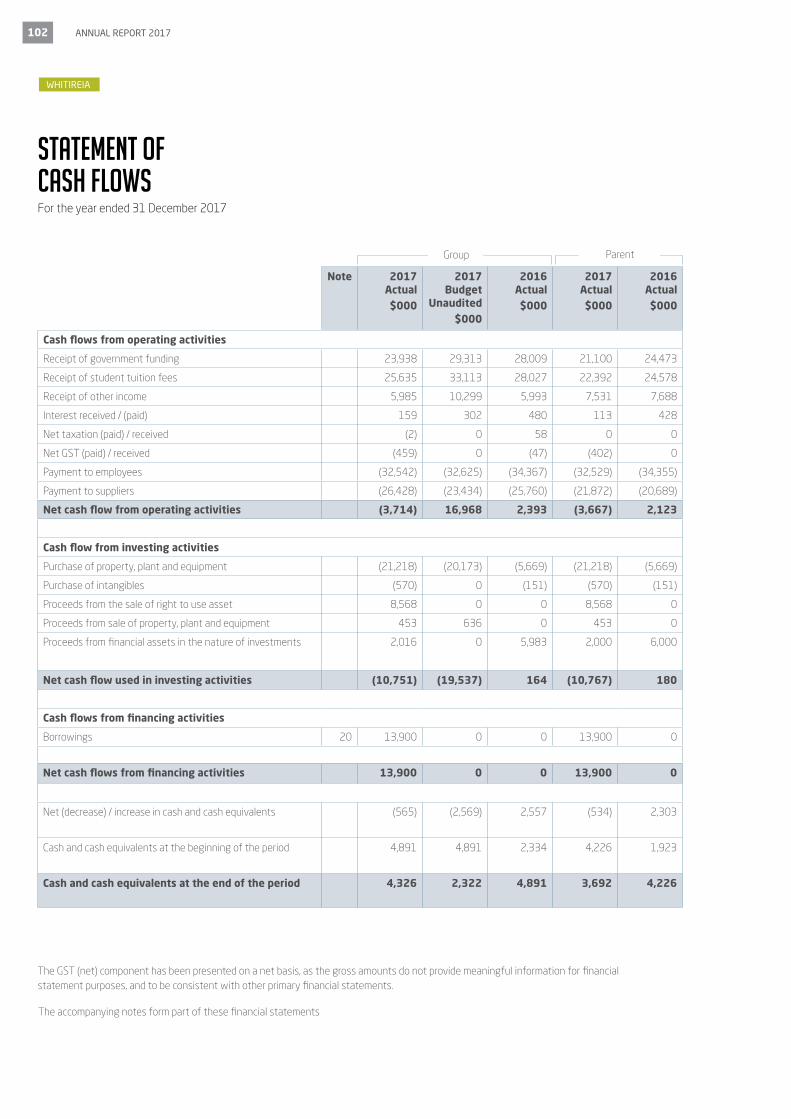
102 ANNUAL REPORT 2017
STATEMENT OF CASH FLOWSFor the year ended 31 December 2017
The accompanying notes form part of these financial statements
Note 2017 Actual$000
2017 Budget
Unaudited$000
2016 Actual$000
2017 Actual$000
2016 Actual$000
Cash flows from operating activities
Receipt of government funding 23,938 29,313 28,009 21,100 24,473
Receipt of student tuition fees 25,635 33,113 28,027 22,392 24,578
Receipt of other income 5,985 10,299 5,993 7,531 7,688
Interest received / (paid) 159 302 480 113 428
Net taxation (paid) / received (2) 0 58 0 0
Net GST (paid) / received (459) 0 (47) (402) 0
Payment to employees (32,542) (32,625) (34,367) (32,529) (34,355)
Payment to suppliers (26,428) (23,434) (25,760) (21,872) (20,689)
Net cash flow from operating activities (3,714) 16,968 2,393 (3,667) 2,123
Cash flow from investing activities
Purchase of property, plant and equipment (21,218) (20,173) (5,669) (21,218) (5,669)
Purchase of intangibles (570) 0 (151) (570) (151)
Proceeds from the sale of right to use asset 8,568 0 0 8,568 0
Proceeds from sale of property, plant and equipment 453 636 0 453 0
Proceeds from financial assets in the nature of investments 2,016 0 5,983 2,000 6,000
Net cash flow used in investing activities (10,751) (19,537) 164 (10,767) 180
Cash flows from financing activities
Borrowings 20 13,900 0 0 13,900 0
Net cash flows from financing activities 13,900 0 0 13,900 0
Net (decrease) / increase in cash and cash equivalents (565) (2,569) 2,557 (534) 2,303
Cash and cash equivalents at the beginning of the period 4,891 4,891 2,334 4,226 1,923
Cash and cash equivalents at the end of the period 4,326 2,322 4,891 3,692 4,226
ParentGroup ParentGroup
The GST (net) component has been presented on a net basis, as the gross amounts do not provide meaningful information for financial statement purposes, and to be consistent with other primary financial statements.
WHITIREIA

WELTEC AND WHITIREIA 103
Reconciliation from the net surplus / (deficit) to the net cash flows from operationsFor the year ended 31 December 2017
Note 2017 Actual$000
2017 Budget
Unaudited$000
2016 Actual$000
2017 Actual$000
2016 Actual$000
(Deficit) / Surplus from the statement of comprehensive income
(8,416) 344 (1,683) (7,641) (1,908)
Adjustment for:
Depreciation 3,871 3,878 4,052 3,873 4,059
Amortisation 232 512 483 232 483
Share of associate (loss)/profit 559 0 (180) 0 0
Profit on disposal of fixed assets (132) 0 0 (132) 0
Impairment of goodwill 762 0 0 0 0
Impairment of investment in subsidaries 0 0 0 652 0
Movement in doubtful debt provision 28 0 39 28 39
Total non-cash items 5,320 4,390 4,394 4,653 4,581
Add / (less) movements in working capital items
Decrease / (increase) in inventories 120 0 74 120 74
Decrease / (increase) in debtors and other receivables 195 5,586 1,397 (52) 795
Decrease / (increase) in prepayments 67 (11) 210 71 210
Decrease / (increase) in taxation receivable (18) 0 58 0 0
Increase / (decrease) in creditors and other payables (2,971) (2,805) 1,838 (2,415) 1,869
Increase / (decrease) in revenue received in advance 1,887 3,287 (2,284) 1,496 (1,886)
Increase / (decrease) in employee entitlements 432 158 (1,185) 432 (1,186)
Increase / (decrease) in provisions (330) 6,019 (426) (331) (426)
Net movement in working capital items (618) 12,234 (318) (679) (550)
Net cash flow from operating activity (3,714) 16,968 2,393 (3,667) 2,123
ParentGroup
WHITIREIA

104 ANNUAL REPORT 2017
NOTES TO THE FINANCIAL STATEMENTS1. STATEMENT OF ACCOUNTING POLICIES FOR THE YEAR ENDED 31 DECEMBER 2017
REPORTING ENTITY
Whitireia Community Polytechnic (Whitireia) is a Tertiary Education Institution (TEI) governed by the Crown Entities Act 2004 and the Education Act 1989.
Whitireia and Group consists of Whitireia Community Polytechnic and its trading subsidiaries, Whitireia New Zealand Limited (WNZL) (100% owned) and Whitireia Foundation (100% interest). The group also consists of non-trading subsidiaries Whitireia Enterprises Ltd (100% owned) and W2 Ventures Limited (50% owned).
Whitireia has a 50% interest in W2 Shared Services Ltd. Whitireia also has a 50% interest in one unincorporated joint venture – Computer Power Plus which is equity accounted into the Group financial statements. All subsidiaries are incorporated and domiciled in New Zealand.
The primary objective of the Whitireia and Group is to provide tertiary education services for the benefit of the community rather than making a financial return.
The financial statements of the Whitireia and Group are for the year ended 31 December 2017. The financial statements were authorised for issue by the Council on 30 April 2018.
BASIS OF PREPARATION
Statement of ComplianceThe financial statements of Whitireia and Group have been prepared in accordance with the requirements of the Crown Entities Act 2004 and the Education Act 1989, which includes the requirement to comply with New Zealand generally accepted accounting practice (NZ GAAP).
These financial statements have been prepared in accordance with Tier 1 PBE accounting standards. They comply with Public Benefit Entity (PBE) Standards, and other applicable financial reporting standards as appropriate for public benefit entities.
Measurement baseThe financial statements have been prepared on a historical cost basis, except for assets classified as held for sale and land and buildings, which have been measured at fair value or except where otherwise stated within the following accounting policies.
Functional and presentation currencyThe financial statements are presented in New Zealand dollars and all values are rounded to the nearest thousand dollars ($000). The functional currency of Whitireia and its subsidiaries is New Zealand Dollars (NZ$).
Changes in accounting policiesDuring the year there have been no changes in accounting policies.
PBE IPSAS 3 requires disclosure of the possible impact of new and revised PBE standards that have been issued but are not yet effective. The standards that may impact on Whitireia and Group in future years are:
• PBE IPSAS 1 - change 'approved budget' on the financial statements to reference to 'general purpose prospective financial statements'. This standard is effective 1 January 2018.
• PBE IPSAS 34, 35, 36, 37 and 38 relate to definition and control of entities and Group accounting. Whitireia does not anticipate any significant changes from current consolidation and disclosure methods. This change is effective 1 January 2019.
• PBE IPSAS 21 and 26 relate impairment of revalued assets. Whitireia does not anticipate any immediate impact. This standard is effective 1 January 2019.
• PBE IPSAS 9 relates to Financial Instruments. This may change note disclosures. This standard is effective 1 January 2018.
• PBE FRS 48 relates to Service Performance Reporting. This may change note disclosures. This standard is effective 1 January 2021.
• PBE IPSAS 12, 27, and 39 changes do not impact Whitireia.
SIGNIFICANT ACCOUNTING POLICIES
Basis of consolidationThe group financial statements are prepared by adding together like items of assets, liabilities, equity, income, expenses, and cash flows on a line-by-line basis. All significant intragroup balances, transactions, income, and expenses are eliminated on consolidation.
SubsidiariesWhitireia consolidates in the group financial statements all entities where Whitireia has the capacity to control the financing and operating policies of an entity so as to obtain benefits from the activities of the entity. This power exists where Whitireia controls the majority voting power on the governing body or where such policies have been irreversibly predetermined by Whitireia or where the determination of such policies is unable to materially impact the level of potential ownership benefits that arise from the activities of the subsidiary.
Inter-company transactions, balances and unrealised gains on transactions between group entities are eliminated. Unrealised losses are also eliminated. Accounting policies of subsidiaries have been changed where necessary to ensure consistency with the policies adopted by the group.
Investments in subsidiaries are carried at cost in the Whitireia's parent entity financial statements.
WHITIREIA
WELTEC AND WHITIREIA 105
Jointly Controlled EntitiesWhitireia and Group’s jointly controlled entities interest is accounted for using the equity method. Investments in jointly controlled entities are initially recognised at cost and the carrying amount is increased or decreased to recognise the appropriate share of the profit or loss of the jointly controlled entity after the date of acquisition. Whitireia and Group's share of the profit or loss is recognised in the Group profit or loss. Distributions received from a jointly controlled entity reduce the carrying amount of the investment in the Group financial statements.
If the share of losses of a jointly controlled entity equals or exceeds the interest in the jointly controlled entity, the Group discontinues recognising its share of further losses. After the Group’s interest is reduced to zero, additional losses are provided for, and a liability is recognised, only to the extent that the Group has incurred legal or constructive obligations or made payments on behalf of the jointly controlled entity. If the jointly controlled entity subsequently reports profits, the Group will resume recognising its share of those profits only after its share of the profits equals the share of losses not recognised.
Where the Group transacts with a jointly controlled entity, profit or losses are eliminated to the extent of the Group’s interest in the relevant jointly controlled entity. Investments in a jointly controlled entity are carried at cost in the Whitireia parent entity financial statements.
RevenueRevenue is measured at the fair value of consideration received or receivable.
Government grants and research incomeGovernment funding is Whitireia’s main source of operational funding from the Tertiary Education Commission (TEC). Whitireia considers this funding to be non-exchange and recognised as revenue when the course withdrawal date has passed, based on the number of eligible students enrolled in the course at that date and the value of the course.
Whitireia considers Performance-Based Research Funding (PBRF) to be non-exchange in nature. PBRF funding is specifically identified by the TEC as being for a funding period as required by section 159YA of the Education Act 1989. Whitireia recognises its confirmed allocation of PBRF funding at the commencement of the specified funding period, which is the same as Whitireia’s financial year. PBRF revenue is measured based upon Whitireia’s entitlement adjusted for any adjustments as part of the final wash-up process. Indicative funding for future periods is not recognised until confirmed for the future period.
Other grants are recognised as revenue when they become receivable unless there is an obligation in substance to return the funds if conditions of the grant are not met. If there is such an obligation, the grants are initially recorded as grants received in advance when received and recognised as revenue when the conditions of the grant are satisfied.
Domestic student tuition feesDomestic student tuition fees are subsidised by government funding and are considered non-exchange. Revenue is recognised when the course withdrawal date has passed, which is when a student is no longer entitled to a refund for withdrawing from the course.
International student tuition feesInternational student tuition fees are accounted for as exchange transactions and recognised as revenue on a course percentage of completion basis. The percentage of completion is measured by reference to the days of the course completed as a proportion of total course days.
Donations, bequests, and pledgesDonations and bequests are recognised as revenue when the right to receive the fund or asset has been established, unless there is an obligation in substance to return the funds if conditions of the donation or bequest are not met. If there is such an obligation, they are initially recorded as revenue in advance when received and recognised as revenue when the conditions are satisfied. Pledges are not recognised as asset or revenue until the pledged item is received.
Sale of goodsRevenue from sale of goods is recognised when the product is sold to the customer.
Interest and dividendsInterest income is recognised using the effective interest method.
Dividends are recognised when the right to receive payment has been established.
WHITIREIA
106 ANNUAL REPORT 2017
ScholarshipsScholarships awarded by Whitireia that reduce the amount of tuition fees payable by the student are offset against student fees revenue.
Borrowing costsBorrowing costs are recognised as an expense in the financial year in which they are incurred.
LeasesThe determination of whether an arrangement is or contains a lease is based on the substance of the arrangement at inception date. The substance of the arrangement depends on whether fulfilment of the arrangement is dependent on the use of a specific asset or assets or the arrangement conveys a right to use the asset, even if that right is not explicitly specified in an arrangement.
Finance leasesA finance lease is a lease that transfers to the lessee substantially all the risks and rewards incidental to ownership of an asset, whether or not title is eventually transferred. At the start of the lease term, finance leases are recognised as assets and liabilities in the statement of financial position at the lower of the fair value of the leased item and the present value of the minimum lease payments.
The finance charge is charged to the surplus or deficit over the lease period so as to produce a constant periodic rate of interest on the remaining balance of the liability.
The amount recognised as an asset is depreciated over its useful life. If there is no certainty as to whether Whitireia and Group will obtain ownership at the end of the lease term, the asset is fully depreciated over the shorter of the lease term and its useful life.
Operating leases
Operating leases are leases that do not transfer substantially all the risks and benefits incidental to ownership of the leased item to the Group. Operating lease payments are recognised as an operating expense in surplus or deficit on a straight-line basis over the lease term. Lease incentives received are recognised in the surplus or deficit over the lease term as an integral part of the total lease expense.
Cash and cash equivalentsCash and cash equivalents in the statement of financial position comprise cash on hand, deposits held at call with banks, and other short-term highly liquid investments with original maturities of three months or less that are readily convertible to known amounts of cash and which are subject to insignificant risk of changes in value.
For the purposes of the statement of cash flows, cash and cash equivalents consist of cash and cash equivalents as defined above.
ReceivablesReceivables are recorded at their face value, less any provision for impairment.
Foreign currency transactionsTransactions in foreign currencies are initially accounted for at the ruling rate of exchange on the date of the transaction.
Trade creditors and debtors denominated in foreign currency are reported at the statement of financial position reporting date by applying the exchange rate on that date. Exchange differences arising from the settlement of creditors, or from reporting of creditors at rates different from those at which they were initially recorded during the period, are recognised as income or expenses in the period in which they arise.
Non-monetary items that are measured in terms of historical cost in a foreign currency are translated using the exchange rate as at the date of the initial transaction. Non-monetary items measured at fair value in a foreign currency are translated using exchange rates at the date when the fair value was determined.
Other financial assets (including investment in other entities)Financial assets are initially recognised at fair value plus transaction costs unless they are carried at fair value through surplus or deficit in which case the transaction costs are recognised in the surplus or deficit.
Financial assets are derecognised when the rights to receive cash flows from the financial assets have expired or have been transferred and Whitireia and Group has transferred substantially all the risks and rewards of ownership.
There are four categories of financial assets under PBE IPSAS 29. Whitireia holds financial assets classified as loans and other receivables. Classification of the financial asset depends on the purpose for which the instruments were acquired.
Loans and receivables are non-derivative financial assets with fixed or determinable payments that are not quoted in an active market. They are included in current assets, except for maturities greater than 12 months after the balance date, which are included in non-current assets. Related party receivables that are repayable on demand are classified as a non-current asset because repayment of the receivable is not expected within 12 months of the balance date.
After initial recognition loans and receivables are measured at amortised cost using the effective interest method less any provision for impairment. Gains and losses when the asset is impaired or derecognised are recognised in the surplus or deficit.
Impairment of financial assetsAt each balance date, Whitireia and Group assesses whether there is any objective evidence that a financial asset or Group of assets is impaired. Any impairment losses are recognised in surplus or deficit.
WHITIREIA

WELTEC AND WHITIREIA 107
Loans and receivables (including cash and cash equivalents and debtors and other receivables)Impairment of a loan or a receivable is established when there is objective evidence that Whitireia and Group will not be able to collect amounts due according to the original terms of the debt. Significant financial difficulties of the debtor, probability that the debtor will enter into bankruptcy and the default in payments are considered indicators that the asset is impaired. The amount of the impairment is the difference between the asset’s carrying amount and the present value of estimated future cash flows, discounted using the original effective interest rate. For debtors and other receivables, the carrying amount of the asset is reduced through the use of an allowance account, and the amount of the loss is recognised in the surplus or deficit. When the receivable is uncollectible, it is written-off against the allowance account. Overdue receivables that have been renegotiated are reclassified as current (i.e. not past due). For other financial assets, impairment losses are recognised directly against the instruments carrying amount.
InventoriesInventory is measured at cost upon initial recognition. To the extent where inventory was received through non-exchange transactions (for no cost or for a nominal cost), the cost of the inventory is its fair value at the date of acquisition.
After initial recognition, inventories held for resale are valued at the lower of cost or net realisable value. Net realisable value is the estimated selling price in the ordinary course of business, less estimated costs of completion and the estimated costs to make the sale, exchange, or distribution.
Property, plant and equipmentProperty, plant and equipment consists of the following asset classes: land and buildings, plant and machinery, motor vehicles, computer hardware, furniture and fittings and artwork, library collection, office equipment, leasehold improvements and communication systems.
Land is measured at fair value, and buildings are measured at fair value less accumulated depreciation and impairment losses. All other asset classes are measured at deemed cost on acquisition less any accumulated depreciation and impairment losses.
WHITIREIA
RevaluationsLand and buildings are revalued with sufficient regularity to ensure that the carrying amount does not differ materially from fair value at least every two years.
The carrying values of revalued assets are assessed biannually by independent valuers to ensure that they do not differ materially from fair value. If there is evidence supporting a material difference, then the off-cycle asset classes are revalued.
Land and buildings revaluation movements are accounted for on a class of asset basis.
The net revaluation results are credited or debited to other comprehensive income and is accumulated to an asset revaluation reserve in equity for that class of asset. Where this would result in a debit balance in the asset revaluation reserve, this balance is not recognised in other comprehensive income but is recognised in the surplus or deficit. Any subsequent increase on revaluation that reverses a previous decrease in value recognised in the surplus or deficit will be recognised first in the surplus or deficit up to the amount previously expensed, and then recognised in other comprehensive income.
AdditionsThe cost of an item of property, plant and equipment is recognised as an asset if, and only if, it is probable that future economic benefits or service potential associated with the item will flow to Whitireia and Group and the cost of the item can be measured reliably.
Work in progress is recognised at cost less impairment and is not depreciated.
In most instances, an item of property, plant and equipment is initially recognised at its cost. Where an asset is acquired at no cost, or for a nominal cost, it is recognised at fair value as at the date of acquisition.

108 ANNUAL REPORT 2017
DisposalsGains and losses on disposals are determined by comparing the disposal proceeds with the carrying amount of the asset. Gains and losses on disposals are reported net in the surplus or deficit.
DepreciationDepreciation is provided on a straight-line basis on all property, plant, and equipment other than land and work in progress at rates that will write off the cost, (or valuation) of the assets to their residual values over their useful lives.
The useful lives and associated depreciation rates of major classes of assets have been estimated as follows:
Leasehold improvements are depreciated over the unexpired period of the lease or the estimated useful lives of the improvements, whichever is the shorter.
For revalued assets, any accumulated depreciation as at the revaluation date is eliminated against the gross carrying amounts of the assets and the net amounts are restated to the revalued amounts of the assets.
The residual value and useful life of an asset is reviewed, and adjusted if applicable, at each financial year end.
An asset’s carrying amount is written down immediately to its recoverable amount, or recoverable service amount, if the asset’s carrying amount is greater than its estimated recoverable amount or recoverable service amount. Please refer to policy on impairment of non-financial assets below.
DerecognitionAn item of property, plant and equipment is derecognised upon disposal or when no further future economic benefits or service potential are expected from its use or disposal.
Gains and losses on disposals are determined by comparing proceeds with the carrying amount. These are included in surplus or deficit.
Upon disposal or derecognition, any revaluation reserve relating to the particular asset being sold is transferred to accumulated comprehensive revenue and expense.
Intangible assetsIntangible assets acquired separately are measured on initial recognition at cost. The cost of intangible assets acquired in a
non-exchange transaction is their fair value at the date of the exchange. The cost of intangible assets acquired in a business combination is their fair value at the date of acquisition.
Following initial recognition, intangible assets are carried at cost less any accumulated amortisation and accumulated impairment losses. Internally generated intangibles, excluding capitalised development costs, are not capitalised and the related expenditure is reflected in surplus or deficit in the period in which the expenditure is incurred.
The useful lives of intangible assets are assessed as either finite or indefinite.
Intangible assets with finite lives are amortised over the useful economic life and assessed for impairment whenever there is an indication that the intangible asset may be impaired.This amortisation is recognised as an expense.
The amortisation period and the amortisation method for an intangible asset with a finite useful life are reviewed at least at the end of each reporting period. Changes in the expected useful life or the expected pattern of consumption of future economic benefits or service potential embodied in the asset are considered to modify the amortisation period or method, as appropriate, and are treated as changes in accounting estimates.
Gains or losses arising from derecognition of an intangible asset are measured as the difference between the net disposable proceeds and the carrying amount of the asset and are recognised in surplus or deficit when the asset is derecognised.
GoodwillGoodwill is initially recognised at cost, being the excess of the aggregate of the consideration transferred and the amount recognised for non-controlling interests, and any previous interest held, over the net identifiable assets acquired and liabilities assumed. If the fair value of the net assets acquired is in excess of the aggregate consideration transferred, the Group re-assesses whether it has correctly identified all of the assets acquired and all of the liabilities assumed and reviews the procedures used to measure the amounts to be recognised at the acquisition date. If the re-assessment still results in an excess of the fair value of net assets acquired over the aggregate consideration transferred, then the gain is recognised in surplus or deficit.
After initial recognition, goodwill is measured at cost less accumulated impairment losses. For the purpose of impairment testing, goodwill acquired in a business combination is, from the acquisition date, allocated to the Group’s cash-generating units that are expected to benefit from the combination, irrespective of whether other assets or liabilities of the acquisition are assigned to those units.
Years
Buildings 10 - 50
Plant and Machinery 5 - 10
Motor Vehicles 5
Computer Hardware 5
Furniture and fittings 10
Library collection 8
Office equipment 5
Leasehold Improvement 1 - 12
Communication systems 4
WHITIREIA

WELTEC AND WHITIREIA 109
WHITIREIA
Where goodwill forms part of a cash-generating unit and part of the operation within that unit is disposed of, the goodwill associated with the operation disposed of is included in the carrying amount of the operation when determining the gain or loss on disposal of the operation. Goodwill disposed of in this circumstance is measured based on the relative values of the operation disposed of and the portion of the cash-generating unit retained.
Research and development costsResearch costs are expensed as incurred. Development expenditures on an individual project are recognised as an intangible asset when the Group can demonstrate:
• The technical feasibility of completing the intangible asset so that the asset will be available for use or sale;
• Its intention and ability to complete and use or sell the asset;• How the asset will generate future economic benefits or
service potential; and• The ability to measure reliably the expenditure during
development. Following initial recognition of the development expenditure as an asset, the asset is carried at cost less accumulated amortisation and accumulated impairment losses. Amortisation of the asset begins when development is complete and the asset is available for use. It is amortised over the period of expected future benefit. During the period of development, the asset is tested for impairment annually.
SoftwareThe Group holds several computer software packages for internal use, including purchased software and software developed in-house by the Group.
Purchased software is recognised and measured at the cost incurred to acquire the software. Developed software is recognised and measured during the development stage in accordance with the Research and development paragraph above. Costs that are directly associated with the development of the software, including employee costs, are capitalised as an intangible asset. Staff training costs and costs associated with maintaining computer software are recognised as expenses in surplus or deficit when incurred.
Course development costsCourse development costs relate to development of educational courses and are capitalised if purchased wholly from other institutes of learning.
AmortisationA summary of the policies applied to the Group’s intangible assets is, as follows:
Impairment of property, plant, and equipment and intangible assetsIntangible assets that have an indefinite useful life, or not yet available for use, and goodwill, are not subject to amortisation and are tested annually for impairment. Assets that have a finite useful life are reviewed for indicators of impairment at each balance date. When there is an indicator of impairment the asset’s recoverable amount is estimated. An impairment loss is recognised for the amount by which the asset’s carrying amount exceeds its recoverable amount. The recoverable amount is the higher of an asset’s fair value less costs to sell and value in use.
Value in use is depreciated replacement cost for an asset where the future economic benefits and service potential are not primarily dependent on the asset’s ability to generate net cash inflows and where Whitireia and Group would, if deprived of the asset, replace its remaining future economic benefits or service potential.
The value in use for cash-generating assets is the present value of expected future cash flows.
If an asset’s carrying amount exceeds its recoverable amount, the asset is impaired and the carrying amount is written-down to the recoverable amount. For revalued assets the impairment loss is recognised in other comprehensive income to the extent the impairment loss does not exceed the amount in the revaluation reserve in equity for that same class of asset. Where that results in a debit balance in the revaluation reserve, the balance is recognised in the surplus or deficit.
For assets not carried at a revalued amount, the total impairment loss is recognised in the surplus or deficit.
Impairment related to goodwill cannot be reversed. The reversal of an impairment loss on a revalued asset is credited to other comprehensive income and increases the asset revaluation reserve for that class of asset. However, to the extent that an impairment loss for that class of asset was previously recognised in the surplus or deficit, a reversal of the impairment loss is also recognised in the surplus or deficit.
Life Amortisation method
Internally generated or
acquired
Computer Software 5 years Straight line Some acquired and some internally
generated
110 ANNUAL REPORT 2017
WHITIREIA
Assets held for saleProperties that are not required for service delivery and are intended to be sold are classified as held for sale.
Gains and losses arising from a change in the fair value of properties held for sale are recognised in the surplus or deficit.
Creditors and other payablesCreditors and other payables are initially measured at fair value and subsequently measured at amortised cost using the effective interest method.
Employee entitlementsWages, salaries, annual leave and sick leaveLiabilities for wages and salaries (including non-monetary benefits), annual leave and accumulating sick leave are recognised in surplus or deficit during the period in which the employee rendered the related services, and are generally expected to be settled within 12 months of the reporting date. The liabilities for these short-term benefits are measured at the amounts expected to be paid when the liabilities are settled. Expenses for non-accumulating sick leave are recognised when the leave is taken and are measured at rates paid or payable.
Long service leave and retirement leaveEmployees of Whitireia and Group become eligible for long service leave and retirement leave after a certain number of years of employment, depending on their contract. The liability for long service leave and retirement leave is recognised and measured at the present value of expected future payments to be made in respect of services provided by employees up to the reporting date using the projected unit credit method. The Group’s liability is based on an actuarial valuation. Actuarial gains and losses on the long-term incentives are fully accounted for in the Statement of Financial Performance.
Superannuation schemesObligations for contributions to KiwiSaver and the Government Superannuation Fund are accounted for as defined contribution schemes recognised as an expense in the surplus or deficit as incurred.
ProvisionsA provision is recognised for future expenditure of uncertain amount or timing when there is a present obligation (either legal or constructive) as a result of a past event, it is probable that expenditures will be required to settle the obligation and a reliable estimate can be made of the amount of the obligation.
Provisions are measured at the present value of the expenditures expected to be required to settle the obligation using a pre-tax discount rate that reflects current market assessments of the time value of money and the risks specific to the obligation. The increase in the provision due to the passage of time is recognised as an interest expense and is included as “finance costs”.
BorrowingBorrowings on normal commercial terms are initially recognised at the amount borrowed plus transaction costs. Interest due on the borrowings is subsequently accrued and added to the borrowings balance. Borrowings are classified as current liabilities unless the Institute or Group has an unconditional right to defer settlement of the liability for at least 12 months after the balance date.
Equity Equity is measured as the difference between total assets and total liabilities. Equity is disaggregated and classified into a number of components. The components of equity are:
• General reserves;• Property revaluation reserves;• Restricted reserves.
Property revaluation reservesThis reserve relates to the revaluation of property to fair value.
Goods and Services Tax (GST)All items in the financial statements are stated exclusive of GST, except for debtors and other receivables and creditors and other payables, which are presented on a GST inclusive basis. Where GST is not recoverable as input tax then it is recognised as part of the related asset or expense.
The net amount of GST recoverable from, or payable to, the Inland Revenue Department (IRD) is included as part of receivables or payables in the statement of financial position.
The net GST paid to, or received from, the IRD, including GST relating to investing and financing activities, is classified as net operating cash flow in the statement of cash flows.
Commitments and contingencies are disclosed exclusive of GST.
Income TaxWhitireia Community Polytechnic and WNZL are exempt from income tax, pursuant to section 55BA (as amended) of the Income Tax Act 2007. Whitireia Foundation is exempt from income tax, pursuant to sections CW 41 and 42 of the Income Tax Act 2007.
Budget figuresThe budget figures are those approved by Council at the start of the financial year. The budget figures have been prepared in accordance with NZ GAAP, using accounting policies that are consistent with those adopted by the Council in preparing these financial statements. The budget figures are not audited.
WELTEC AND WHITIREIA 111
WHITIREIA
Cost AllocationThe cost of service for each significant activity of Whitireia and Group has been derived using the cost allocation system outlined below.
Direct costs are those costs directly attributable to a significant activity. Indirect costs are those costs that cannot be identified in an economically feasible manner with a specific significant activity.
Direct costs are charged directly to significant activities. Indirect costs are charged to a central activity.
Critical accounting estimates and assumptionsIn preparing these financial statements, estimates and assumptions have been made concerning the future. These estimates and assumptions may differ from subsequent actual results. Estimates and assumptions are continually evaluated and are based on historical experience and other factors, including expectations or future events that are believed to be reasonable under the circumstances. The estimates and assumptions that have a significant risk of causing a material adjustment to the carrying amounts of assets and liabilities within the next financial year are discussed below.
Property revaluationsNote 11 provides information about the estimates and assumptions exercised in the measurement of revalued land, buildings.
Critical judgements in applying accounting policiesManagement has exercised the following critical judgements in applying accounting policies for the year ended 31 December 2017.
Distinction between revenue and capital contributionsMost Crown funding received is operational in nature and is provided by the Crown under the authority of an expense appropriation and is recognised as revenue. Where funding is received from the Crown under the authority of a capital appropriation, Whitireia and Group accounts for the funding as a capital contribution directly in equity.
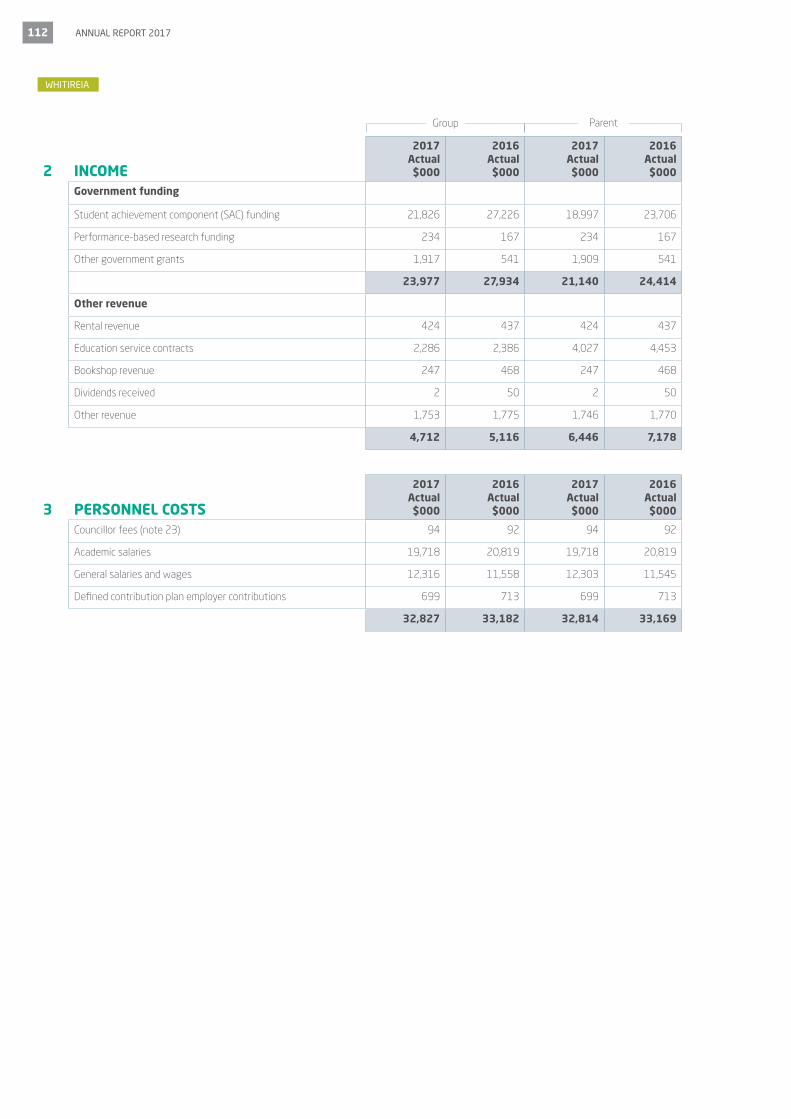
112 ANNUAL REPORT 2017
WHITIREIA
3 PERSONNEL COSTS
2017 Actual $000
2016 Actual $000
2017 Actual $000
2016 Actual $000
Councillor fees (note 23) 94 92 94 92
Academic salaries 19,718 20,819 19,718 20,819
General salaries and wages 12,316 11,558 12,303 11,545
Defined contribution plan employer contributions 699 713 699 713
32,827 33,182 32,814 33,169
ParentGroup
WHITIREIA
2 INCOME
2017 Actual $000
2016 Actual $000
2017 Actual $000
2016 Actual $000
Government funding
Student achievement component (SAC) funding 21,826 27,226 18,997 23,706
Performance-based research funding 234 167 234 167
Other government grants 1,917 541 1,909 541
23,977 27,934 21,140 24,414
Other revenue
Rental revenue 424 437 424 437
Education service contracts 2,286 2,386 4,027 4,453
Bookshop revenue 247 468 247 468
Dividends received 2 50 2 50
Other revenue 1,753 1,775 1,746 1,770
4,712 5,116 6,446 7,178

WELTEC AND WHITIREIA 113
WHITIREIA
4 OTHER EXPENSES
2017 Actual $000
2016 Actual $000
2017 Actual $000
2016 Actual $000
Audit Fees - current year 174 169 133 128
Audit fees - prior years 24 16 24 16
Advertising and public relations 851 543 851 543
Bad debts expensed 45 63 45 63
Bank Charges 64 72 64 72
Catering 132 166 132 166
Commissions paid 2,075 2,741 2,075 2,741
Consultants & Legal 449 462 445 430
Consumables 0 46 0 46
Equipment Lease 146 274 146 274
Export Education Levy 87 81 87 81
Fees and subscriptions 209 321 209 321
Graduation costs 139 128 139 128
Grants & Scholarships 9 0 9 0
Immigration Visa Fees 41 48 41 48
Information technology 3,064 3,153 3,064 3,153
Insurance 282 351 282 351
International Contacts Activities 0 52 0 52
Interest Paid 60 0 60 0
Motor Vehicle Expenses 1 71 1 71
Office Costs 233 270 233 270
Operating lease payments 242 0 242 0
Other operating 134 0 133 0
Postage 40 60 40 60
Professional development fees 0 148 0 148
Repairs & Maintenance Information Technology 45 40 45 40
Sundry Expenses 276 279 276 277
Travel & Accommodation 488 612 488 612
Whitireia Scholarships 44 40 44 39
9,354 10,206 9,308 10,130
ParentGroupGroup
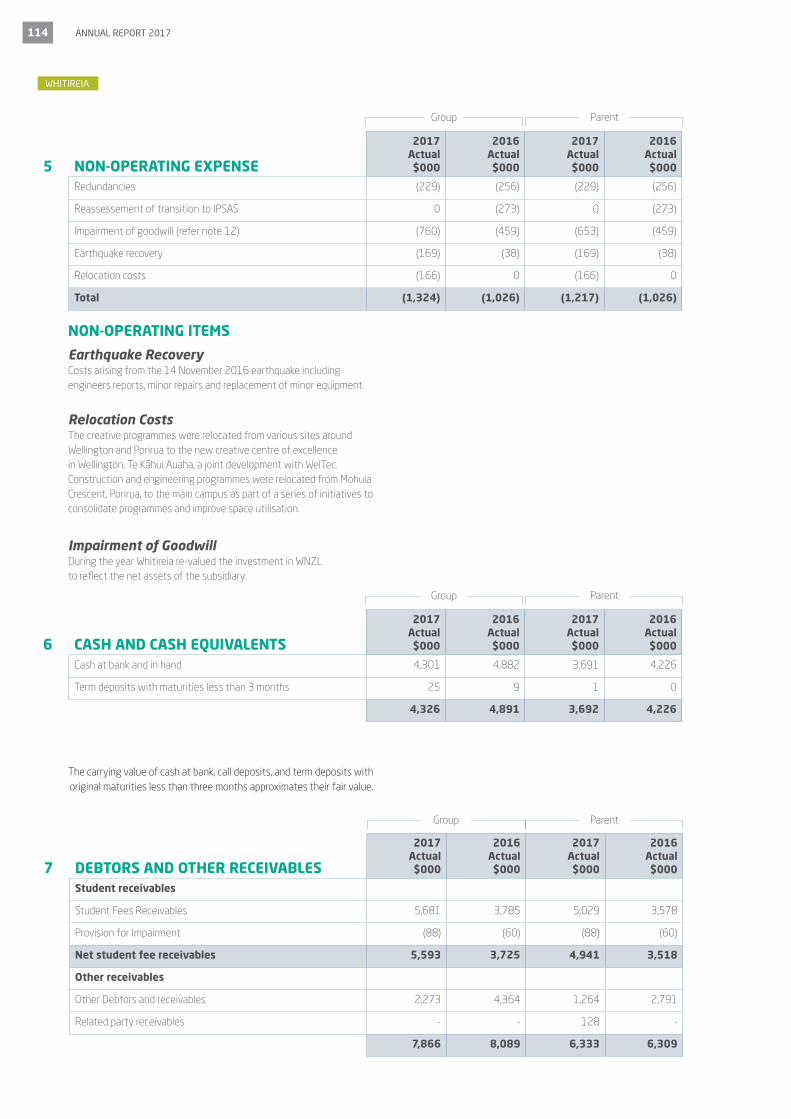
114 ANNUAL REPORT 2017
NON-OPERATING ITEMS
Earthquake RecoveryCosts arising from the 14 November 2016 earthquake including engineers reports, minor repairs and replacement of minor equipment.
Relocation CostsThe creative programmes were relocated from various sites around Wellington and Porirua to the new creative centre of excellence in Wellington, Te Kāhui Auaha, a joint development with WelTec. Construction and engineering programmes were relocated from Mohuia Crescent, Porirua, to the main campus as part of a series of initiatives to consolidate programmes and improve space utilisation.
Impairment of GoodwillDuring the year Whitireia re-valued the investment in WNZL to reflect the net assets of the subsidiary.
The carrying value of cash at bank, call deposits, and term deposits with original maturities less than three months approximates their fair value.
5 NON-OPERATING EXPENSE
2017 Actual $000
2016 Actual $000
2017 Actual $000
2016 Actual $000
Redundancies (229) (256) (229) (256)
Reassessement of transition to IPSAS 0 (273) 0 (273)
Impairment of goodwill (refer note 12) (760) (459) (653) (459)
Earthquake recovery (169) (38) (169) (38)
Relocation costs (166) 0 (166) 0
Total (1,324) (1,026) (1,217) (1,026)
ParentGroup
6 CASH AND CASH EQUIVALENTS
2017 Actual $000
2016 Actual $000
2017 Actual $000
2016 Actual $000
Cash at bank and in hand 4,301 4,882 3,691 4,226
Term deposits with maturities less than 3 months 25 9 1 0
4,326 4,891 3,692 4,226
ParentGroup
WHITIREIA
7 DEBTORS AND OTHER RECEIVABLES
2017 Actual $000
2016 Actual $000
2017 Actual $000
2016 Actual $000
Student receivables
Student Fees Receivables 5,681 3,785 5,029 3,578
Provision for Impairment (88) (60) (88) (60)
Net student fee receivables 5,593 3,725 4,941 3,518
Other receivables
Other Debtors and receivables 2,273 4,364 1,264 2,791
Related party receivables - - 128 -
7,866 8,089 6,333 6,309
ParentGroup

WELTEC AND WHITIREIA 115
Fair valueStudent fees are due before a course commences or are due on enrolment if the course has already begun. Student fee receivables are non-interest bearing and are payable in full by course commencement date. Therefore, their carrying value approximates their fair value.
Other receivables are non-interest bearing and are generally settled on 30-day terms. Therefore, the carrying value of other receivables approximates their fair value.
ImpairmentThe ageing profile of student fee receivables at year end is detailed below:
WHITIREIA
ParentGroup
2017
Gross $'000
Impairment $'000
Net $'000
Gross $'000
Impairment $'000
Net $'000
Not past due 2,738 0 2,738 2,427 0 2,427
Past due 31 - 60 days 2,032 0 2,032 1,760 0 1,760
Past due 61 - 90 days 501 0 501 465 0 465
Past due over 90 days 410 (88) 322 377 (88) 289
Total 5,681 (88) 5,593 5,029 (88) 4,941
2016
Not past due 2,578 0 2,578 2,542 0 2,542
Past due 31 - 60 days 816 0 816 659 0 659
Past due 61 - 90 days 181 0 181 180 0 180
Past due over 90 days 210 (60) 150 197 (60) 137
Total 3,785 (60) 3,725 3,578 (60) 3,518
Due to the large number of student fee receivables, the impairment assessment is performed on a collective basis, based upon an analysis of past collection history and debt write-offs.
Movements in the provision for impairment of student fee receivables are as follows:
2017 Actual $000
2016 Actual $000
2017 Actual $000
2016 Actual $000
At 1 January 60 21 60 21
Additional provisions made during the year 28 39 28 39
Receivables written off during the year 0 0 0 0
At 31 December 88 60 88 60
ParentGroup
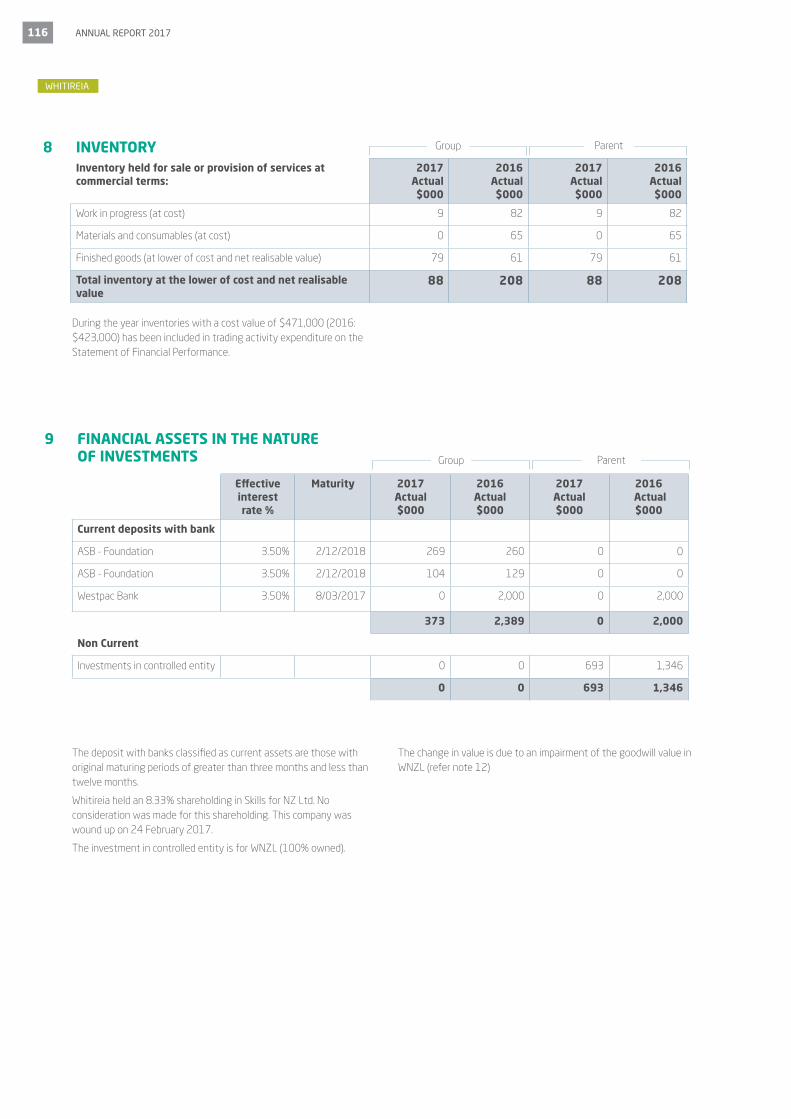
116 ANNUAL REPORT 2017
WHITIREIA
8 INVENTORYInventory held for sale or provision of services at commercial terms:
2017 Actual $000
2016 Actual $000
2017 Actual $000
2016 Actual $000
Work in progress (at cost) 9 82 9 82
Materials and consumables (at cost) 0 65 0 65
Finished goods (at lower of cost and net realisable value) 79 61 79 61
Total inventory at the lower of cost and net realisable value
88 208 88 208
During the year inventories with a cost value of $471,000 (2016: $423,000) has been included in trading activity expenditure on the Statement of Financial Performance.
9 FINANCIAL ASSETS IN THE NATURE OF INVESTMENTS
Effective interest rate %
Maturity 2017 Actual $000
2016 Actual $000
2017 Actual $000
2016 Actual $000
Current deposits with bank
ASB - Foundation 3.50% 2/12/2018 269 260 0 0
ASB - Foundation 3.50% 2/12/2018 104 129 0 0
Westpac Bank 3.50% 8/03/2017 0 2,000 0 2,000
373 2,389 0 2,000
Non Current
Investments in controlled entity 0 0 693 1,346
0 0 693 1,346
ParentGroup
The deposit with banks classified as current assets are those with original maturing periods of greater than three months and less than twelve months.
Whitireia held an 8.33% shareholding in Skills for NZ Ltd. No consideration was made for this shareholding. This company was wound up on 24 February 2017.
The investment in controlled entity is for WNZL (100% owned).
The change in value is due to an impairment of the goodwill value in WNZL (refer note 12)
ParentGroup

WELTEC AND WHITIREIA 117
WHITIREIA
10 INVESTMENT IN JOINTLY CONTROLLED ENTITIES
Group
Parent
2017 Actual$000
2016 Actual$000
Investment in Computer Power Plus 140 140
Group
Investment in Computer Power Plus 344 903
Assets
Current assets 277 765
Non current assets 444 386
Total assets 721 1,151
Liabilities
Current liabilities (378) (248)
Total liabilities (378) (248)
Income 2,306 2,500
Expenses (2,865) (2,320)
Profit/(Loss) (559) 180
Share of joint venture’s contingent liabilities - -
Share of joint venture’s commitments 1070 577
W2 Shared Services LimitedW2 Shared Services Limited is jointly owned on a 50%:50% basis with WelTec and began trading in January 2015 to replace the unincorporated joint venture structure utilised in 2014. W2 Shared Services Limited has nil net assets, nil profit and no equity invested. WelTec and Whitireia are debtors to W2 Shared Services Limited. Refer Related Parties note.
Computer Power PlusWelTec and Whitireia have a 50% interest in a joint venture, Computer Power Plus, which undertakes academic and support services on contract to WNZL. The following amounts represent the Group’s share of the assets, liabilities, income and expenses of the joint venture:
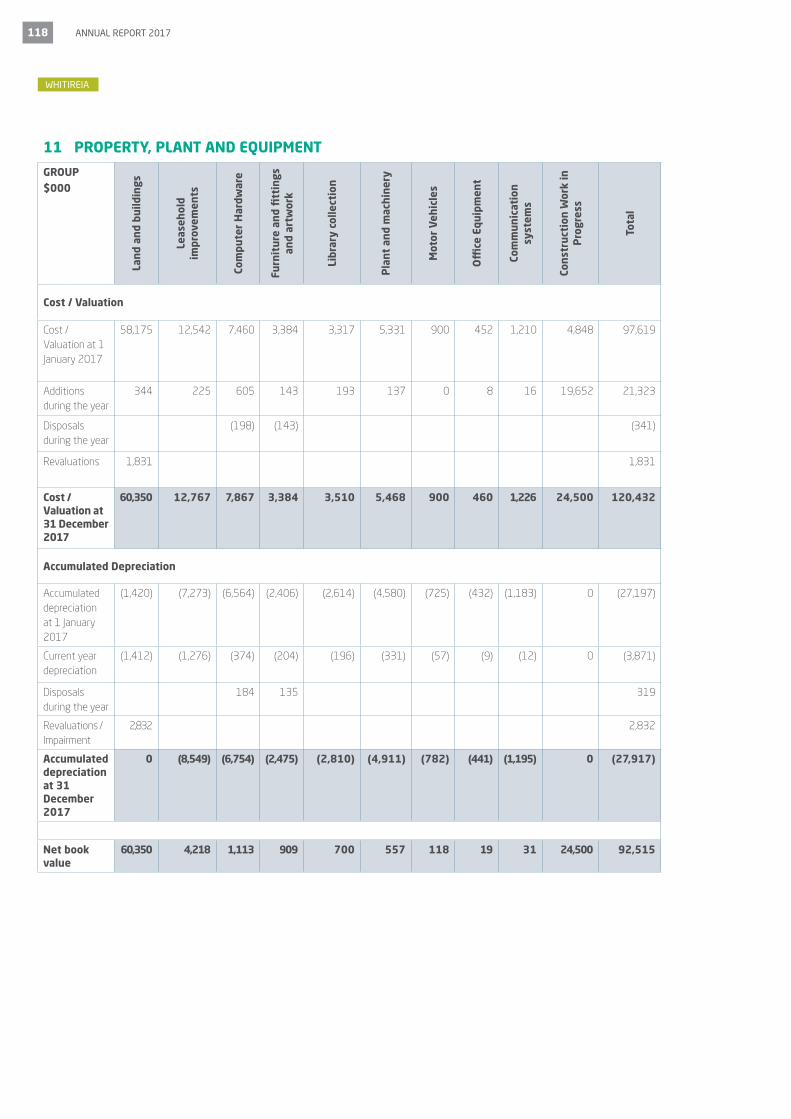
118 ANNUAL REPORT 2017
11 PROPERTY, PLANT AND EQUIPMENT
GROUP $000
Land
and
bui
ldin
gs
Leas
ehol
d im
prov
emen
ts
Com
pute
r H
ardw
are
Furn
itur
e an
d fi
ttin
gs
and
artw
ork
Libr
ary
colle
ctio
n
Pla
nt a
nd m
achi
nery
Mot
or V
ehic
les
Offi
ce E
quip
men
t
Com
mun
icat
ion
syst
ems
Cons
truc
tion
Wor
k in
P
rogr
ess
Tota
l
Cost / Valuation
Cost / Valuation at 1 January 2017
58,175 12,542 7,460 3,384 3,317 5,331 900 452 1,210 4,848 97,619
Additions during the year
344 225 605 143 193 137 0 8 16 19,652 21,323
Disposals during the year
(198) (143) (341)
Revaluations 1,831 1,831
Cost / Valuation at 31 December 2017
60,350 12,767 7,867 3,384 3,510 5,468 900 460 1,226 24,500 120,432
Accumulated Depreciation
Accumulated depreciation at 1 January 2017
(1,420) (7,273) (6,564) (2,406) (2,614) (4,580) (725) (432) (1,183) 0 (27,197)
Current year depreciation
(1,412) (1,276) (374) (204) (196) (331) (57) (9) (12) 0 (3,871)
Disposals during the year
184 135 319
Revaluations / Impairment
2,832 2,832
Accumulated depreciation at 31 December 2017
0 (8,549) (6,754) (2,475) (2,810) (4,911) (782) (441) (1,195) 0 (27,917)
Net book value
60,350 4,218 1,113 909 700 557 118 19 31 24,500 92,515
WHITIREIA

WELTEC AND WHITIREIA 119
GROUP $000
Land
and
bui
ldin
gs
Leas
ehol
d im
prov
emen
ts
Com
pute
r H
ardw
are
Furn
itur
e an
d fi
ttin
gs
and
artw
ork
Libr
ary
colle
ctio
n
Pla
nt a
nd m
achi
nery
Mot
or V
ehic
les
Offi
ce E
quip
men
t
Com
mun
icat
ion
syst
ems
Cons
truc
tion
Wor
k in
P
rogr
ess
Tota
l
Cost / Valuation
Cost / Valuation at 1 January 2016
57,712 12,190 6,947 3,289 3,172 5,054 837 440 1,199 1,067 91,907
Additions during the year
463 352 523 95 145 280 63 12 11 3,781 5,725
Disposals during the year
(10) (3) (13)
Revaluations 0
Cost / Valuation at 31 December 2016
58,175 12,542 7,460 3,384 3,317 5,331 900 452 1,210 4,848 97,619
Accumulated Depreciation
Accumulated depreciation at 1 January 2016
0 (6,002) (6,113) (2,229) (2,406) (4,182) (674) (426) (1,073) 0 (23,105)
Current year depreciation
(1,420) (1,221) (458) (177) (208) (401) (51) (6) (110) (4,052)
Disposals during the year
7 3 10
Revaluations / Impairment
(50) (50)
Accumulated depreciation at 31 December 2016
(1,420) (7,273) (6,564) (2,406) (2,614) (4,580) (725) (432) (1,183) 0 (27,197)
Net book value
56,755 5,269 896 978 703 751 175 20 27 4,848 70,422
WHITIREIA
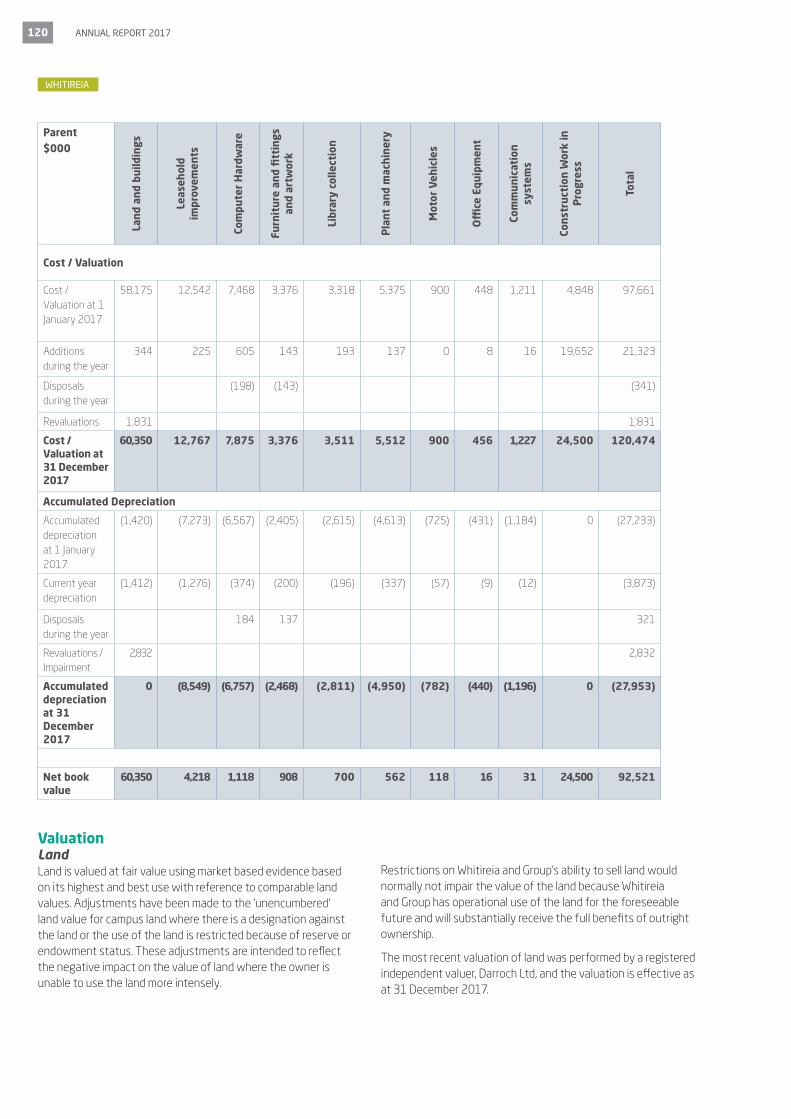
120 ANNUAL REPORT 2017
Valuation LandLand is valued at fair value using market based evidence based on its highest and best use with reference to comparable land values. Adjustments have been made to the ‘unencumbered’ land value for campus land where there is a designation against the land or the use of the land is restricted because of reserve or endowment status. These adjustments are intended to reflect the negative impact on the value of land where the owner is unable to use the land more intensely.
Restrictions on Whitireia and Group’s ability to sell land would normally not impair the value of the land because Whitireia and Group has operational use of the land for the foreseeable future and will substantially receive the full benefits of outright ownership.
The most recent valuation of land was performed by a registered independent valuer, Darroch Ltd, and the valuation is effective as at 31 December 2017.
WHITIREIA
Parent$000
Land
and
bui
ldin
gs
Leas
ehol
d im
prov
emen
ts
Com
pute
r H
ardw
are
Furn
itur
e an
d fi
ttin
gs
and
artw
ork
Libr
ary
colle
ctio
n
Pla
nt a
nd m
achi
nery
Mot
or V
ehic
les
Offi
ce E
quip
men
t
Com
mun
icat
ion
syst
ems
Cons
truc
tion
Wor
k in
P
rogr
ess
Tota
l
Cost / Valuation
Cost / Valuation at 1 January 2017
58,175 12,542 7,468 3,376 3,318 5,375 900 448 1,211 4,848 97,661
Additions during the year
344 225 605 143 193 137 0 8 16 19,652 21,323
Disposals during the year
(198) (143) (341)
Revaluations 1,831 1,831
Cost / Valuation at 31 December 2017
60,350 12,767 7,875 3,376 3,511 5,512 900 456 1,227 24,500 120,474
Accumulated Depreciation
Accumulated depreciation at 1 January 2017
(1,420) (7,273) (6,567) (2,405) (2,615) (4,613) (725) (431) (1,184) 0 (27,233)
Current year depreciation
(1,412) (1,276) (374) (200) (196) (337) (57) (9) (12) (3,873)
Disposals during the year
184 137 321
Revaluations / Impairment
2,832 2,832
Accumulated depreciation at 31 December 2017
0 (8,549) (6,757) (2,468) (2,811) (4,950) (782) (440) (1,196) 0 (27,953)
Net book value
60,350 4,218 1,118 908 700 562 118 16 31 24,500 92,521

WELTEC AND WHITIREIA 121
BuildingsSpecialised buildings (e.g. campuses) are valued at fair value using optimised depreciated replacement cost because no reliable data is available for buildings designed for education delivery purposes.
Optimised depreciated replacement cost is determined using a number of significant assumptions. Significant assumptions include the following:
• The replacement asset is based on the reproduction cost of the specific assets with adjustments where appropriate for obsolescence due to over design or surplus capacity;
• The replacement cost is derived from recent construction contracts of similar assets and Property Institute of New Zealand cost information;
• Estimating the remaining useful life of assets; and
• Straight-line depreciation has been applied in determining the depreciated replacement cost value of the asset.
The most recent valuation of buildings was performed by a registered independent valuer, Darroch Ltd, and the valuation is effective as at 31 December 2017.
Restrictions on titleThere are also various restrictions in the form of historic designations, reserve, and endowment encumbrances attached to land. Whitireia and Group does not consider it practical to disclose in detail the value of land subject to these restrictions.
WHITIREIA
Parent$000
Land
and
bui
ldin
gs
Leas
ehol
d im
prov
emen
ts
Com
pute
r H
ardw
are
Furn
itur
e an
d fi
ttin
gs
and
artw
ork
Libr
ary
colle
ctio
n
Pla
nt a
nd m
achi
nery
Mot
or V
ehic
les
Offi
ce E
quip
men
t
Com
mun
icat
ion
syst
ems
Cons
truc
tion
Wor
k in
P
rogr
ess
Tota
l
Cost / Valuation
Cost / Valuation at 1 January 2016
57,712 12,190 6,955 3,281 3,173 5,098 837 436 1,200 1,067 91,949
Additions during the year
463 352 523 95 145 280 63 12 11 3,781 5,725
Disposals during the year
(10) (3) (13)
Revaluations 0
Cost / Valuation at 31 December 2016
58,175 12,542 7,468 3,376 3,318 5,375 900 448 1,211 4,848 97,661
Accumulated Depreciation
Accumulated depreciation at 1 January 2016
0 (6,002) (6,116) (2,228) (2,407) (4,206) (674) (425) (1,074) 0 (23,132)
Current year depreciation
(1,420) (1,221) (458) (177) (208) (408) (51) (6) (110) (4,059)
Disposals during the year
7 1 8
Revaluations / Impairment
(50) (50)
Accumulated depreciation at 31 December 2016
(1,420) (7,273) (6,567) (2,405) (2,615) (4,613) (725) (431) (1,184) 0 (27,233)
Net book value
56,755 5,269 901 971 703 762 175 17 27 4,848 70,428

122 ANNUAL REPORT 2017
12 INTANGIBLE ASSETS
Soft
war
e $
00
0
Goo
dwill
$
00
0
Soft
war
e D
evel
opm
ent
in
Pro
gres
s $
00
0
Tota
l $
00
0
Soft
war
e $
00
0
Soft
war
e D
evel
opm
ent
in P
rogr
ess
$0
00
20
16
Tot
al
$0
00
Balance at 1 January 2017
Cost 4,412 761 94 5,267 4,412 94 4,506
Accumulated amortisation and impairment
(4,048) 0 0 (4,048) (4,048) 0 (4,048)
364 761 94 1,219 364 94 458
Additions 476 0 0 476 476 0 476
Transfers 94 0 (94) 0 94 (94) 0
Impairment 0 (761) 0 (761) 0 0 0
Amortisation (232) 0 0 (232) (232) 0 (232)
338 (761) (94) (517) 338 (94) 244
Balance at 31 December 2017
Cost 4,982 761 0 5,743 4,982 0 4,982
Accumulated amortisation and impairment (4,280) (761) 0 (5,041) (4,280) 0 (4,280)
702 0 0 702 702 0 702
Balance at 1 January 2016
Cost 4,195 761 39 4,995 4,195 39 4,234
Accumulated amortisation and impairment (3,444) 0 0 (3,444) (3,444) 0 (3,444)
751 761 39 1,551 751 39 790
Additions 217 0 55 272 217 55 272
Impairment (121) 0 0 (121) (121) 0 (121)
Amortisation (483) 0 0 (483) (483) 0 (483)
(387) 0 55 (332) (387) 55 (332)
Balance at 31 December 2016
Cost 4,412 761 94 5,267 4,412 94 4,506
Accumulated amortisation and impairment (4,048) 0 0 (4,048) (4,048) 0 (4,048)
364 761 94 1,219 364 94 458
Group Parent
There are no restrictions over the title of intangible assets. No intangible assets are pledged as security for liabilities.
GoodwillDuring the year the Group wrote off goodwill of $761,000 relating to the investment in WNZL. The impairment was based on the net assets of WNZL at 31 December 2017.
WHITIREIA
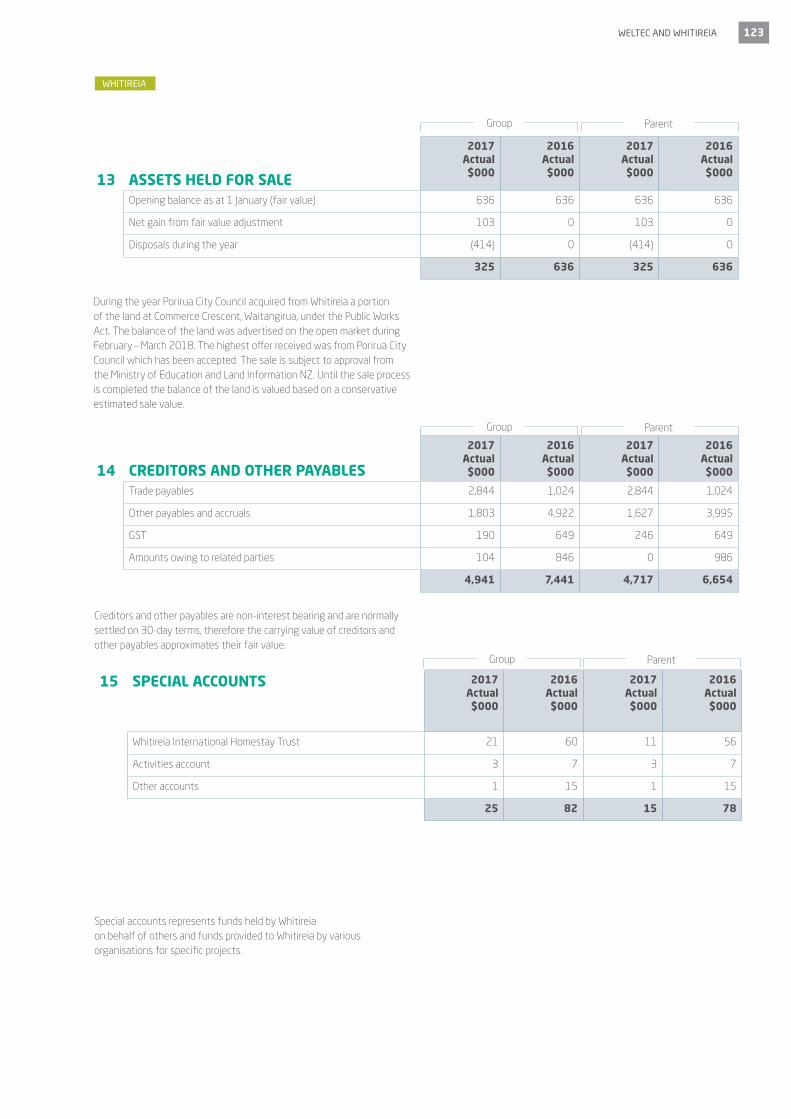
WELTEC AND WHITIREIA 123
13 ASSETS HELD FOR SALE
2017 Actual $000
2016 Actual $000
2017 Actual $000
2016 Actual
$000
Opening balance as at 1 January (fair value) 636 636 636 636
Net gain from fair value adjustment 103 0 103 0
Disposals during the year (414) 0 (414) 0
325 636 325 636
ParentGroup
WHITIREIA
During the year Porirua City Council acquired from Whitireia a portion of the land at Commerce Crescent, Waitangirua, under the Public Works Act. The balance of the land was advertised on the open market during February – March 2018. The highest offer received was from Porirua City Council which has been accepted. The sale is subject to approval from the Ministry of Education and Land Information NZ. Until the sale process is completed the balance of the land is valued based on a conservative estimated sale value.
ParentGroup
14 CREDITORS AND OTHER PAYABLES
2017 Actual $000
2016 Actual $000
2017 Actual $000
2016 Actual
$000
Trade payables 2,844 1,024 2,844 1,024
Other payables and accruals 1,803 4,922 1,627 3,995
GST 190 649 246 649
Amounts owing to related parties 104 846 0 986
4,941 7,441 4,717 6,654
ParentGroup
Creditors and other payables are non-interest bearing and are normally settled on 30-day terms, therefore the carrying value of creditors and other payables approximates their fair value.
15 SPECIAL ACCOUNTS 2017 Actual $000
2016 Actual $000
2017 Actual $000
2016 Actual
$000
Whitireia International Homestay Trust 21 60 11 56
Activities account 3 7 3 7
Other accounts 1 15 1 15
25 82 15 78
Special accounts represents funds held by Whitireia on behalf of others and funds provided to Whitireia by various organisations for specific projects.

124 ANNUAL REPORT 2017
17 EMPLOYEE ENTITLEMENTS Current provision
2017 Actual $000
2016 Actual $000
2017 Actual $000
2016 Actual
$000
Accrued pay (145) (209) (145) (209)
Accrued leave 2,332 2,043 2,332 2,043
Sick leave 196 131 196 131
Long service leave 9 7 9 7
Retirement leave 86 24 86 24
2,478 1,996 2,478 1,996
Non-current provision
Long service leave 36 46 36 46
Retirement leave 76 116 76 116
Total non-current portion 112 162 112 162
Total employee entitlements 2,590 2,158 2,590 2,158
ParentGroup
ParentGroup
WHITIREIA
16 REVENUE RECEIVED IN ADVANCE
2017 Actual $000
2016 Actual $000
2017 Actual $000
2016 Actual
$000
Student revenue in advance 11,064 10,841 10,721 9,979
Other revenue in advance 9,817 0 8,907 0
20,881 10,841 19,628 9,979
Employees are entitled to annual leave pay, long service leave pay and retirement leave. Annual leave entitlements expected to be settled within 12 months of the balance sheet date are measured at the current rates of pay and classified as current liabilities.
Entitlements related to long service leave and retirement leave have been calculated on an actuarial basis. The provision is affected by a number of assumptions including expected length of service, attrition rate, and salary increase.
Other revenue in advance includes $8.6m from WelTec for the 'Right To Use' the leasehold of the joint lease for premises at 82-92 Cuba Street and 65 Dixon Street, Wellington, for 21 years. Refer to note 22 for more details on the lease.
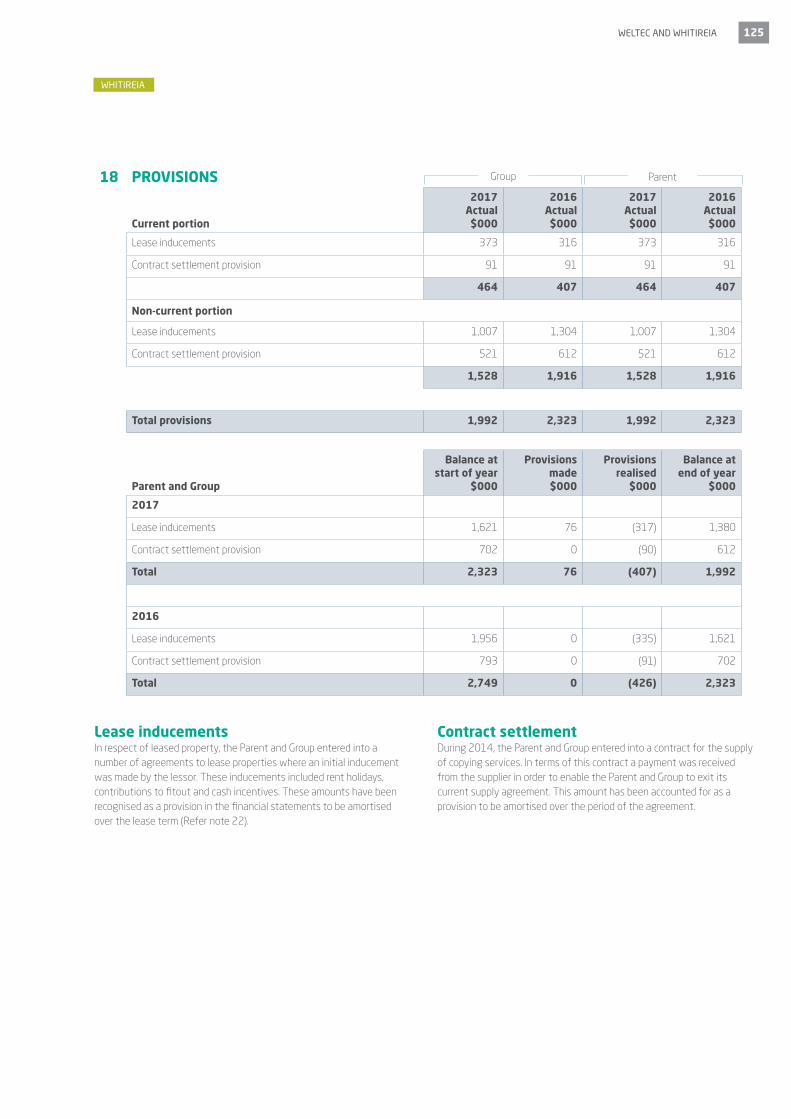
WELTEC AND WHITIREIA 125
WHITIREIA
Parent and Group
Balance at start of year
$000
Provisions made $000
Provisions realised
$000
Balance at end of year
$000
2017
Lease inducements 1,621 76 (317) 1,380
Contract settlement provision 702 0 (90) 612
Total 2,323 76 (407) 1,992
2016
Lease inducements 1,956 0 (335) 1,621
Contract settlement provision 793 0 (91) 702
Total 2,749 0 (426) 2,323
ParentGroup18 PROVISIONS
Current portion
2017 Actual $000
2016 Actual $000
2017 Actual $000
2016 Actual
$000
Lease inducements 373 316 373 316
Contract settlement provision 91 91 91 91
464 407 464 407
Non-current portion
Lease inducements 1,007 1,304 1,007 1,304
Contract settlement provision 521 612 521 612
1,528 1,916 1,528 1,916
Total provisions 1,992 2,323 1,992 2,323
Lease inducementsIn respect of leased property, the Parent and Group entered into a number of agreements to lease properties where an initial inducement was made by the lessor. These inducements included rent holidays, contributions to fitout and cash incentives. These amounts have been recognised as a provision in the financial statements to be amortised over the lease term (Refer note 22).
Contract settlementDuring 2014, the Parent and Group entered into a contract for the supply of copying services. In terms of this contract a payment was received from the supplier in order to enable the Parent and Group to exit its current supply agreement. This amount has been accounted for as a provision to be amortised over the period of the agreement.
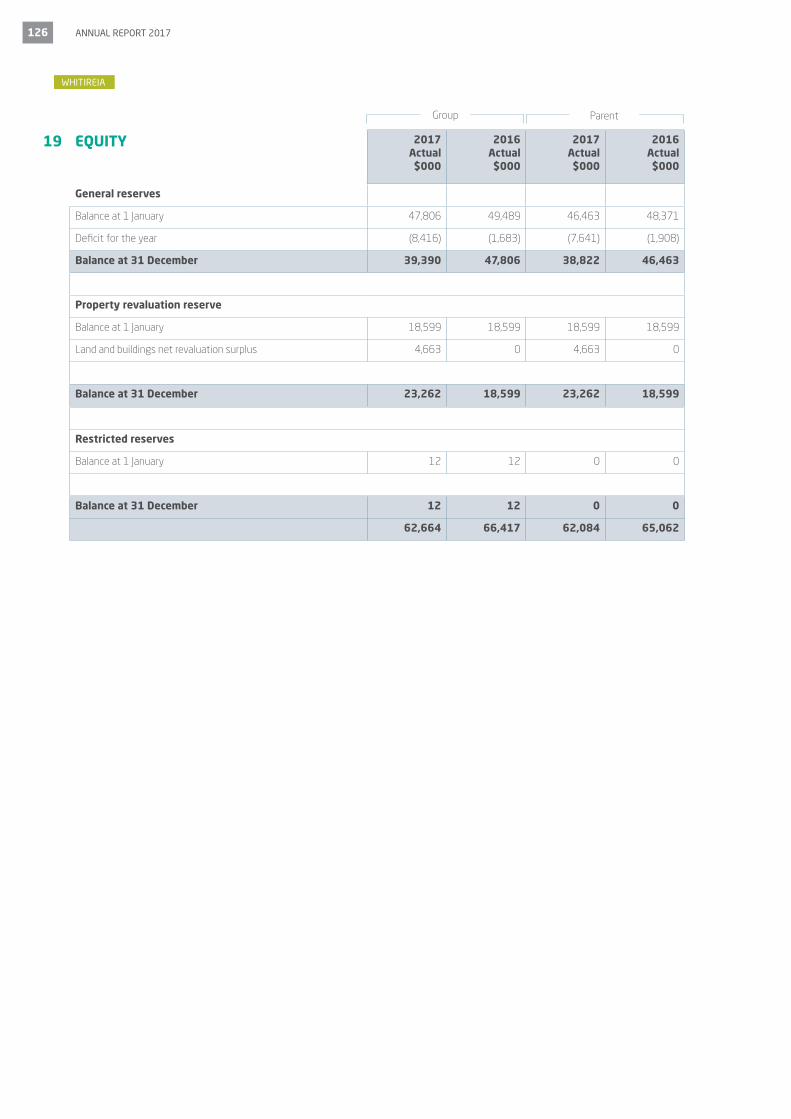
126 ANNUAL REPORT 2017
19 EQUITY 2017 Actual $000
2016 Actual $000
2017 Actual $000
2016 Actual
$000
General reserves
Balance at 1 January 47,806 49,489 46,463 48,371
Deficit for the year (8,416) (1,683) (7,641) (1,908)
Balance at 31 December 39,390 47,806 38,822 46,463
Property revaluation reserve
Balance at 1 January 18,599 18,599 18,599 18,599
Land and buildings net revaluation surplus 4,663 0 4,663 0
Balance at 31 December 23,262 18,599 23,262 18,599
Restricted reserves
Balance at 1 January 12 12 0 0
Balance at 31 December 12 12 0 0
62,664 66,417 62,084 65,062
ParentGroup
WHITIREIA

WELTEC AND WHITIREIA 127
20 FINANCIAL RISK MANAGEMENT OBJECTIVES AND POLICYThe Group’s principal financial instruments comprise bank deposits, cash and short-term deposits.
The Group has various other financial instruments such as trade debtors and trade creditors, which arise directly from its operations.
Issues and Risks are monitored by the Council and Risk Audit and Finance Committee.
The Joint Leadership Team reviews Issues and Risks at each meeting and has a subcommittee which meets monthly to update the Issues and Risk Register.
Credit RiskWith the exception of Student Fees the Group trades only with recognised, creditworthy third parties.
Receivable balances are monitored on an ongoing basis with the result that the Group’s exposure to bad debts is not significant.
With respect to the credit risk arising from the other financial assets of the Group, which comprise cash and cash equivalents and available-for-sale financial assets, the Group’s exposure to credit risk arises from default of the counter party, with a maximum exposure equal to the carrying amount of these instruments.
There are no significant concentrations of credit risk within the Group.
Interest rate riskThe tables below illustrate the potential effect on the surplus or deficit and equity (excluding general funds) for reasonably possible market movements, with all other variables held constant, based on financial instrument exposures at balance date.
-50 bpsSurplus and
other equity
+150 bpsSurplus and
other equity
-50 bpsSurplus and
other equity
+150 bpsSurplus and
other equity
Group
Financial Assets
Cash and cash equivalents (22) 65 (24) 73
Financial assets in the nature of investments (2) 6 (12) 36
Loans and borrowings 70 (209) 0 0
Total sensitivity 46 (138) (36) 109
Parent
Financial Assets
Cash and cash equivalents (18) 55 (21) 63
Financial assets in the nature of investments (12) 0 (10) 30
Loans and borrowings 0 (209) 0 0
Total sensitivity (30) (153) (31) 93
The interest rate sensitivity is based on a reasonable possible movement in interest rates, with all other variables held constant, measured as a basis points (bps) movement. For example a decrease in 50 bps is equivalent to a decrease in interest rates of 0.5%.
20162017
WHITIREIA

128 ANNUAL REPORT 2017
CATEGORIES OF FINANCIAL ASSETS AND LIABILITIES
Note 2017 Actual $000
2016 Actual $000
2017 Actual $000
2016 Actual $000
Loans and receivables
Cash and cash equivalents 6 4,326 4,891 3,692 4,226
Debtors and other receivables 7 7,866 8,089 6,205 6,309
Financial assets in the nature of investments 9 373 2,389 0 3,346
12,565 15,369 9,897 13,881
Financial liabilities measured at amortised cost
Creditors and other payables 14 4,941 7,441 4,589 6,654
Loans and borrowings 13,900 0 13,900 0
Total financial liabilities measured at amortised cost 18,841 7,441 18,489 6,654
ParentGroup
ParentGroup
WHITIREIA
Credit quality of financial assets The credit quality of financial assets that are neither past due nor impaired can be assessed by reference to Standard and Poor’s credit ratings (if available) or to historical information about counterparty default rates:
2017 Actual $000
2016 Actual $000
2017 Actual $000
2016 Actual $000
Counterparties with credit ratings
Cash at bank and term deposits
AA - 4,699 7,280 3,692 6,226
Total cash at bank and term deposits 4,699 7,280 3,692 6,226
Debtors and other receivables
Existing counterparty without defaults in the past 7,866 8,089 6,205 6,309
Total debtors and other receivables 7,866 8,089 6,205 6,309
Liquidity RiskLiquidity risk: Is the risk that Whitireia and the group will encounter difficulty raising liquid funds to meet commitments as they fall due. Prudent liquidity risk management implies maintaining sufficient cash, the availability of funding through an adequate amount of committed credit facilities and the ability to close out market positions. Whitireia and the group aims to maintain flexibility in funding by arranging committed credit lines when required.
Whitireia has approval from the Secretary for Education for a credit line of up to $14 million. Whitireia has a credit line in place with ANZ (previously with Westpac) which is adjusted as required to meet Whitireia liquidity requirements and reserves policy. This facility is repayable on demand and accordingly has been classified as a current liability. As at 31 December 2017 $13.9 million had been drawn from the facility (2016: nil) with a cash and cash equivalents balance of $4.3 million. The interest rate on the facility at 31 December was 3.67%.
In meeting its liquidity requirements, the Polytechnic and group maintains a target level of investments that must mature within specified timeframes.
Borrowing Covenants: In granting borrowing approval the Secretary for Education has imposed four borrowing covenants. Three of the four borrowing were breached at year end. They are; 1.Minimum Revenue of $55 million (actual: $54.4 million), 2. Cash Flow from Operations ratio of at least 98% (actual: 93.8%) and 3. a Debt to Equity ratio of no greater than 15% (actual: 18.2%). The fourth covenant, Liquidity Ratio, was not breached, with actual liquidity of 7.4% against a minimum requirement of 3%. The breach of borrowing covenants has been reported to the TEC, the Ministry of Education and the ANZ bank. The breach has been acknowledged by the TEC and ANZ. It has been confirmed by the ANZ that the lending facility will continue despite the breaches. The borrowing covenants will be reviewed during 2018.
Trade and other payables (note 14) are all due and payable within 6 months of the balance date.
There are no financial instruments held at fair value.

WELTEC AND WHITIREIA 129
21 CAPITAL MANAGEMENTThe Parent and Group’s capital is its equity, which comprises accumulated funds and other reserves. Equity is represented by net assets.
The Parent and Group are subject to the financial management and accountability provisions of the Education Act 1989, which includes restrictions in relation to: disposing of assets or interests in assets, ability to mortgage or otherwise charge assets or interests in assets, granting leases of land or buildings or parts of buildings, and borrowing.
The Parent and Group manages its equity as a by-product of prudently managing revenues, expenses, assets, liabilities, investments, and general financial dealings to ensure the Parent and Group effectively achieves its objectives and purpose, whilst remaining a going concern.
22 COMMITMENTS AND CONTINGENCIESOperating lease commitments – Parent and Group as lesseeThe Parent and Group has entered into commercial leases on buildings where it is not in the best interest of the Parent and Group to purchase these assets. These leases have an average life of between one and twenty one years. There are no restrictions placed upon the lessee by entering into these leases.
Future minimum rentals payable under non-cancellable operating leases as at 31 December are as follows:
2017 Actual $000
2016 Actual $000
2017 Actual $000
2016 Actual $000
Operating Commitments
Due within one year 5,242 3,814 5,242 3,814
Due after one year but less than five years 16,826 17,745 16,826 17,745
Due after five years 40,686 44,926 40,686 44,926
62,754 66,485 62,754 66,485
Whitireia and WelTec have entered into a joint lease for premises at 82-92 Cuba Street and 65 Dixon Street, Wellington. The two institutions are jointly and severally liable for the lease costs and 66% of the lease commitment has been included in the operating commitments based on Whitireia expected usage.
CAPITAL COMMITMENTS At 31 December the Parent had the following commitments.
2017 Actual $000
2016 Actual $000
Te Auaha Centre development 871 20,437
Porirua campus upgrade 500 0
Website refresh 0 307
1,371 20,744
Legal ClaimsThe Parent and Group has no legal claims pending at 31 December 2017. (2016: $Nil).
Other contingent liabilitiesThe Parent and Group has no other contingent liabilities (2016: Nil).
Contingent assetsThe Parent and Group has no contingent assets (2016: Nil).
Parent
ParentGroup
WHITIREIA
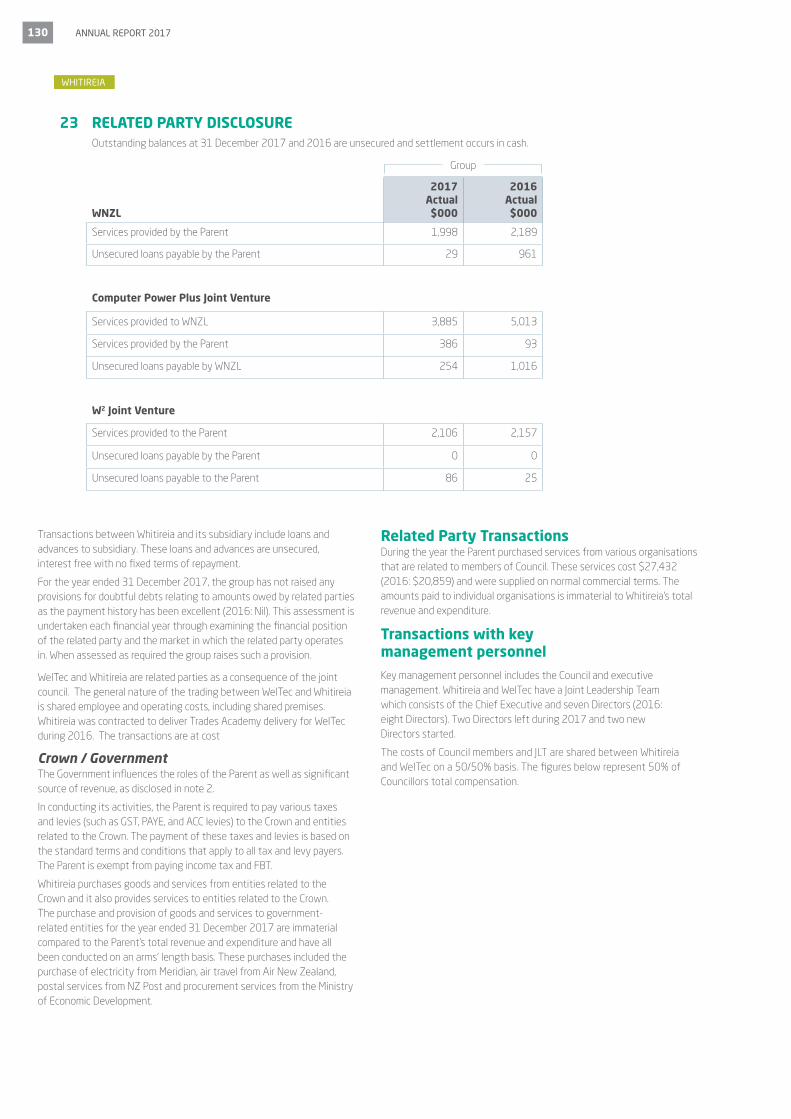
130 ANNUAL REPORT 2017
23 RELATED PARTY DISCLOSUREOutstanding balances at 31 December 2017 and 2016 are unsecured and settlement occurs in cash.
WNZL
2017 Actual $000
2016 Actual $000
Services provided by the Parent 1,998 2,189
Unsecured loans payable by the Parent 29 961
Computer Power Plus Joint Venture
Services provided to WNZL 3,885 5,013
Services provided by the Parent 386 93
Unsecured loans payable by WNZL 254 1,016
W2 Joint Venture
Services provided to the Parent 2,106 2,157
Unsecured loans payable by the Parent 0 0
Unsecured loans payable to the Parent 86 25
Group
WHITIREIA
Transactions between Whitireia and its subsidiary include loans and advances to subsidiary. These loans and advances are unsecured, interest free with no fixed terms of repayment.
For the year ended 31 December 2017, the group has not raised any provisions for doubtful debts relating to amounts owed by related parties as the payment history has been excellent (2016: Nil). This assessment is undertaken each financial year through examining the financial position of the related party and the market in which the related party operates in. When assessed as required the group raises such a provision.
WelTec and Whitireia are related parties as a consequence of the joint council. The general nature of the trading between WelTec and Whitireia is shared employee and operating costs, including shared premises. Whitireia was contracted to deliver Trades Academy delivery for WelTec during 2016. The transactions are at cost
Crown / GovernmentThe Government influences the roles of the Parent as well as significant source of revenue, as disclosed in note 2.
In conducting its activities, the Parent is required to pay various taxes and levies (such as GST, PAYE, and ACC levies) to the Crown and entities related to the Crown. The payment of these taxes and levies is based on the standard terms and conditions that apply to all tax and levy payers. The Parent is exempt from paying income tax and FBT.
Whitireia purchases goods and services from entities related to the Crown and it also provides services to entities related to the Crown. The purchase and provision of goods and services to government-related entities for the year ended 31 December 2017 are immaterial compared to the Parent's total revenue and expenditure and have all been conducted on an arms’ length basis. These purchases included the purchase of electricity from Meridian, air travel from Air New Zealand, postal services from NZ Post and procurement services from the Ministry of Economic Development.
Related Party TransactionsDuring the year the Parent purchased services from various organisations that are related to members of Council. These services cost $27,432 (2016: $20,859) and were supplied on normal commercial terms. The amounts paid to individual organisations is immaterial to Whitireia's total revenue and expenditure.
Transactions with key management personnelKey management personnel includes the Council and executive management. Whitireia and WelTec have a Joint Leadership Team which consists of the Chief Executive and seven Directors (2016: eight Directors). Two Directors left during 2017 and two new Directors started.
The costs of Council members and JLT are shared between Whitireia and WelTec on a 50/50% basis. The figures below represent 50% of Councillors total compensation.

WELTEC AND WHITIREIA 131
Councillor Fees
24 EVENTS AFTER BALANCE DATEExcept as already disclosed, there were no other events that have occurred between 31 December 2017 and the date of this report. (2016: None)
25 EXPLANATIONS OF MAJOR VARIANCES AGAINST BUDGET
WHITIREIA
Statement of Financial PerformanceRevenue for the Parent was $9.1m below budget due to lower student numbers. This was partially offset by lower expenditure of $2.1m. The Parent’s operating result was a deficit of $6.4m against a budget surplus of $0.5m.
Statement of Financial PositionA combination of lower revenue and the significant investment in Te Kāhui Auaha resulted in the Parent borrowing $13.9m during the year and ending with a cash balance of $3.7m against a budget of $2.3m.
ParentGroup
2017 Actual $000
2016 Actual $000
2017 Actual $000
2016 Actual
$000
Joint Leadership Team (8 FTE x 50%) (2016: 9 FTE x 50%)
930 914 930 914
Council members (paid jointly by WelTec and Whitireia)
Greg Campbell (Current Chairperson) 12 - 12 -
Roger Sowry (Prior Chair) 10 20 10 20
Vaughan Renner (Deputy Chairperson) 12 12 12 12
Deborah Hume 10 10 10 10
Nancy McIntosh - Ward 10 10 10 10
Antony Royal 10 10 10 10
Kabini Sanga 10 10 10 10
Fran Wilde 10 10 10 10
Jackie Lloyd 10 10 10 10
94 92 94 92

132 ANNUAL REPORT 2017
WHITIREIA
Council Chair Chief Executive30 April 2018 30 April 2018
STATEMENT OF COMPLIANCE AND RESPONSIBILITY FOR THE YEAR ENDED 31 DECEMBER 2017
Signed by
STATEMENT OF COMPLIANCE
The Council and management of Whitireia Community Polytechnic confirm that all the statutory requirements in relation to this annual report, as outlined in the Education Act 1989, have been met.
STATEMENT OF RESPONSIBILITY
The Council and management accept responsibility for the preparation of the annual financial statements and judgements used in them, and hereby adopt the financial statements as presented. They also accept responsibility for establishing and maintaining a system of internal control designed to provide reasonable assurance as to the integrity and reliability of financial reporting and service performance reporting.
In the Council and management’s opinion, the annual financial statements for the year ended 31 December 2017 fairly reflect the financial position, financial performance and service performance achievements of the Whitireia Community Polytechnic.

WELTEC AND WHITIREIA 133

134 ANNUAL REPORT 2017
Other Financial Information
WELTEC AND WHITIREIA 135
Compulsory Student Services Levy Whitireia 136
Compulsory Student Services Levy WelTec 138
Te Whare Ako Financial Summary 140
Whitireia Community Polytechnic Childcare Centre 141

136 ANNUAL REPORT 2017
WHITIREIA COMPULSORY STUDENT SERVICES FEE 2017
(EXCLUDING GST)
The compulsory student services fee charged by Whitireia per domestic and international Equivalent Full Time Student in 2017 was $220 GST inclusive. This fee was the same amount that was charged in 2016. The following statement of income and expenditure reflects the activity, which Whitireia in consultation and partnership with student representatives has completed in 2017 utilising in part funding provided by Compulsory Student Services Fees:
PARTNERSHIP WITH STUDENTS
WelTec and Whitireia worked together to engage with the students around the setting of the fee amount and all the allocation of expenditure. While the consultation process was the same for each institute, the Whitireia Student Council advised us on what their communities required so the allocation meet the needs of the individual institutions.
Students were provided with the opportunity to engage in the setting of the Compulsory Student Services Fee (CSSF) along with setting expenditure priorities through a range of options such as general student forums, information posted on the Student Connection Facebook page, information and discussion forums on Moodle, meeting with the student councils and print and digital posters.
The Whitireia Student Council were in the early stages of forming and asked for $10,000 to support their development and activities, including elections for the council.
SERVICE PROVISION
Advocacy and legal adviceWhitireia continued with a contract with the New Zealand Union of Students Associations (NZUSA) to provide independent advocacy and support, and this was in place during 2016 and 2017. NZUSA provided training for student groups in dealing with concerns and complaints and also support for student voice representatives for each class.
Whitireia implemented an on-campus independent advocacy service in 2015 which has gained the trust of students as reflected in the increase in students using the service in 2017 by over 100%. The support for students advocating for themselves with assistance reduced the number of students using NZUSA from seven in 2016 to four in 2017.
Careers information and guidanceCareers support and development is provided through a range of service across Whitireia from pre-enrolment advice to help students select the best programme of study for the individual, in class career development workshops and preparation for work. Learner support and services team members provided CV and interview workshops throughout the year as well as two Employability Weeks. Further career provision and enhancement is planned in 2018 with the restructuring of the student support services.
Surplus / (Deficit)
(16)
(49)
(2)
(55)
(1)
(35)
(68)
(2)
(32)
(260)
(50)
Expenditure
38
117
4
130
3
84
161
6
77
620
654
Income
22
68
2
75
2
49
93
4
45
360
604
Advocacy & legal advice $000
Careers info $000
Clubs & Societies $000
Counselling services & pastoral care $000
Employment info $000
Financial support & advice $000
Health Services $000
Media $000
Sports, recreation & cultural activities $000
Total 2017 $000
Total 2016 $000

WELTEC AND WHITIREIA 137
Counselling and pastoral care services
Vitae Counselling, a nationwide provider, continued to provide independent, confidential support both on and off campus to students through an annually-reviewed contract. This covered students on all campuses including Auckland. They also provide supervision for pastoral care staff to ensure appropriate and safe responses to student issues. Whitireia has had an on-site counsellor on the Porirua Campus one day a week since 2015 which has increased the number of youth using the service.
Pastoral support was provided for students by pastoral care staff, Māori and Pasifika teams who were responsible for 1-1 appointments, in-class, after hours and off-campus support, facilitating financial assistance and providing advice and welfare services.
Employment adviceJob Brokerage, supporting students into post-study employment, was provided by Whitireia, one FTE in 2017. The number of positions available continues to grow as does the number of students accessing placements. The student services team provides interview and CV information in hard and e-copy, and opportunities for interview practice to support work placements.
Whitireia implemented a driver licencing scheme in 2017 to support students into work. This is a subsidised scheme that provides students with support for licence tests and access to driver training. The uptake for this scheme was high at Whitireia in 2017 with over 100 students taking part.
Student Job Search provided short-term employment opportunities with the contract for SJS taken over by the Student Services with the disestablishment of the Students Association. Numbers taking up SJS opportunities continue to grow.
Finance advice and supportThe Student Financial Advisors worked on a 1-1 basis with students offering StudyLink and RealMe assistance, as well as budgeting information and advice. Assisting students in these areas has been a focus in 2017, aiming to empower them to have better control over their own finances.
Students are offered emergency financial assistance in hardship situations, including emergency accommodation and health-related care, as appropriate.
Health servicesPrimary healthcare is provided to Whitireia students through doctor and nursing services. As part of the wellness focus of this service students are now offered free flu vaccinations to minimise illness while they are studying. Additional services such as physiotherapy are also provided.
Sports, recreation and cultural activitiesOrientation at the beginning of each trimester is an important event, attended by over 3000 students across programmes. The Student Hub Coordinator ensures that activities are run throughout the year in many areas, such as sporting events (badminton, cricket, rugby etc), events (e.g. Amazing Race, Earth Day, Mental Health Awareness) language weeks (Te Wiki o Te Reo Māori, Samoan etc), international cultural celebrations (e.g. Chinese language week, Diwali).
Supporting the Student Voice Representatives and the Student Council means that students are able to have student-led and directed activities which are in tune with student needs and requests.
Sporting equipment is available for student use on campus, including basketball hoops, volleyball nets and table tennis tables.
MediaAll student-led events are supported by Marketing and student services in creating posters and other student communications, including Moodle and Facebook. The number of digital screens for providing information to students continues to be added to for wider coverage across campuses.
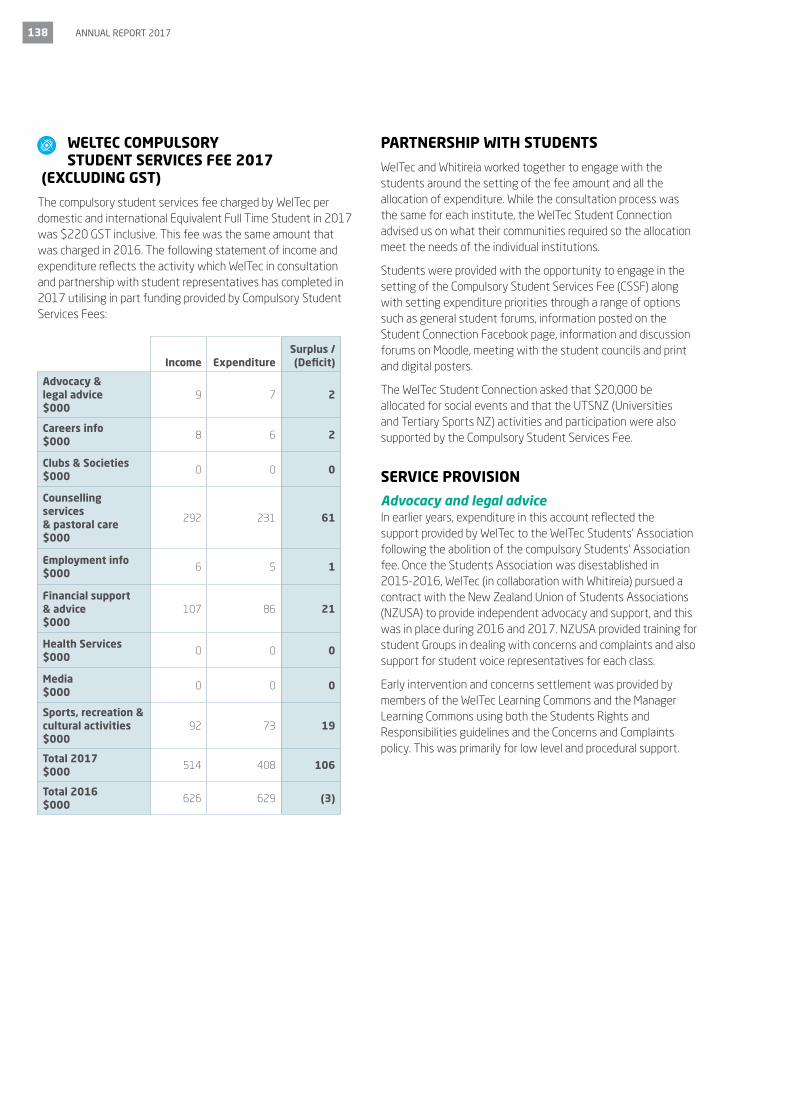
138 ANNUAL REPORT 2017
WELTEC COMPULSORY STUDENT SERVICES FEE 2017
(EXCLUDING GST)
The compulsory student services fee charged by WelTec per domestic and international Equivalent Full Time Student in 2017 was $220 GST inclusive. This fee was the same amount that was charged in 2016. The following statement of income and expenditure reflects the activity which WelTec in consultation and partnership with student representatives has completed in 2017 utilising in part funding provided by Compulsory Student Services Fees:
PARTNERSHIP WITH STUDENTS
WelTec and Whitireia worked together to engage with the students around the setting of the fee amount and all the allocation of expenditure. While the consultation process was the same for each institute, the WelTec Student Connection advised us on what their communities required so the allocation meet the needs of the individual institutions.
Students were provided with the opportunity to engage in the setting of the Compulsory Student Services Fee (CSSF) along with setting expenditure priorities through a range of options such as general student forums, information posted on the Student Connection Facebook page, information and discussion forums on Moodle, meeting with the student councils and print and digital posters.
The WelTec Student Connection asked that $20,000 be allocated for social events and that the UTSNZ (Universities and Tertiary Sports NZ) activities and participation were also supported by the Compulsory Student Services Fee.
SERVICE PROVISION
Advocacy and legal adviceIn earlier years, expenditure in this account reflected the support provided by WelTec to the WelTec Students' Association following the abolition of the compulsory Students' Association fee. Once the Students Association was disestablished in 2015-2016, WelTec (in collaboration with Whitireia) pursued a contract with the New Zealand Union of Students Associations (NZUSA) to provide independent advocacy and support, and this was in place during 2016 and 2017. NZUSA provided training for student Groups in dealing with concerns and complaints and also support for student voice representatives for each class.
Early intervention and concerns settlement was provided by members of the WelTec Learning Commons and the Manager Learning Commons using both the Students Rights and Responsibilities guidelines and the Concerns and Complaints policy. This was primarily for low level and procedural support.
Surplus / (Deficit)
2
2
0
61
1
21
0
0
19
106
(3)
Expenditure
7
6
0
231
5
86
0
0
73
408
629
Income
9
8
0
292
6
107
0
0
92
514
626
Advocacy & legal advice $000
Careers info $000
Clubs & Societies $000
Counselling services & pastoral care $000
Employment info $000
Financial support & advice $000
Health Services $000
Media $000
Sports, recreation & cultural activities $000
Total 2017 $000
Total 2016 $000
WELTEC AND WHITIREIA 139
Careers information and guidanceCareers support and development is provided through a range of service across WelTec from pre-enrolment advice to help students select the best programme of study for the individual, in class career development workshops and preparation for work. Learner support and services team members provided CV and interview workshops throughout the year as well as two Employability Weeks. Further career provision and enhancement is planned in 2018 for WelTec with the restructuring of the student support services.
Counselling and pastoral care servicesVitae Counselling, a nationwide provider, continued to provide independent, confidential support both on and off campus to students through an annually-reviewed contract. This covered students on all campuses including Auckland. They also provide supervision for pastoral care staff to ensure appropriate and safe responses to student issues. An on-site counsellor was implemented at the WelTec Petone Campus in the second trimester for tw afternoons a week.
Pastoral support was provided for students by mentors in the Learning Commons, Tamaiti Whangai and Pasifika teams who were responsible for 1-1 appointments, in-class, after hours and off-campus support, facilitating financial assistance and providing advice and welfare services.
Employment adviceThe student services team provides interview and CV information in hard and e-copy, and opportunities for interview practice to support work placements.
WelTec implemented a driver licencing scheme in 2017 to support students into work. This is a subsidised scheme that provides student with support for licence tests and access to driver training.
Student Job Search provided short-term employment opportunities with the contract for SJS taken over by the Student Services with the disestablishment of the Students Association. Numbers taking up SJS opportunities continue to grow.
Finance advice and supportThe Student Financial Advisors worked on a 1-1 basis with students offering StudyLink and RealMe assistance, as well as budgeting information and advice. Assisting students in these areas has been a focus in 2017, aiming to empower them to have better control over their own finances.
Students are offered emergency financial assistance in hardship situations, including emergency accommodation and health-related care, as appropriate.
Health servicesHealth services for WelTec students was provided by off-campus referrals while an RFI and RFP process to set up a Health Centre took place. Funds were allocated in 2017 for a health service to be in place but the procurement process took longer than expected which has resulted in the funds being unspent. These funds will be used in 2018 for the health service provision and wellness activities. A continued focus on mental health and wellbeing awareness was maintained throughout the year with advertising on the digital media network and the Student Connection Facebook page, as well as two weeks dedicated to health and wellbeing with stalls and community groups coming on to campus to help support students.
Sports, recreation and cultural activitiesOrientation at the beginning of each trimester is an important event, attended by over 1000 students across programmes. The Student Liaison and Events Coordinator ensures that activities are run throughout the year in many areas, such as sporting events (badminton, cricket, rugby etc), events (e.g. Amazing Race, Earth Day, Mental Health Awareness) language weeks (Te Wiki o Te Reo Māori, Samoan etc), international cultural celebrations (e.g. Chinese language week, Diwali).
Supporting the Student Voice Representatives and the Student Council meant that students are able to have student-led and directed activities which are in tune with student needs and requests.
Sporting equipment is available for student use on campus, including basketball hoops, volleyball nets and table tennis tables
MediaAll student-led events are supported by Marketing and student services in creating posters and other student communications, including Moodle and Facebook. The number of digital screens for providing information to students continues to be added to for wider coverage across campuses.

140 ANNUAL REPORT 2017
Te Whare Ako Financial Summary
Te Whare Ako is a Business Unit within WelTec providing early childhood education services. WelTec holds a separate licence from the Ministry of Education for the provision of these services. This financial summary does not reflect occupancy costs or depreciation on buildings and equipment used by the unit.
Income
2017 Actual $000
2016 Actual $000
Government grants 387 387
Childcare fees 113 110
ISS subsidy 73 59
Other fees - -
573 556
Expenses
Employee benefits 524 521
Other direct costs 47 38
571 559
Trading contribution 2 (3)

WELTEC AND WHITIREIA 141
Whitireia Community Polytechnic Childcare Centre Financial Summary
The Childcare Centre is run as a separate trading entity within Whitireia. It operates under licence from the Ministry of Education to provide childcare primarily for staff and students at Whitireia. This financial summary does not reflect occupancy costs or depreciation on buildings and equipment used by the unit.
Income
2017 Actual $000
2016 Actual $000
Government grants 256 242
Childcare fees 35 35
ISS subsidy 51 68
Other fees - -
342 345
Expenses
Employee benefits 363 358
Other direct costs 23 35
386 393
Trading contribution (44) (48)
142 ANNUAL REPORT 2017
INDEPENDENT AUDITOR’S
REPORTS

WELTEC AND WHITIREIA 143
WelTec 144 Whitireia 147
144
Responsibilities of the Council for the financial statements and the statement of service performance
The Council is responsible on behalf of the Polytechnic and group for preparing financial statements that are fairly presented and that comply with generally accepted accounting practice in New Zealand.
The Council is also responsible on behalf of the Polytechnic and group for preparing a statement of service performance that is fairly presented.
The Council is responsible for such internal control as it determines is necessary to enable it to prepare financial statements and a statement of service performance that are free from material misstatement, whether due to fraud or error.
In preparing the financial statements and the statement of service performance, the Council is responsible on behalf of the Polytechnic and group for assessing the Polytechnic and group’s ability to continue as a going concern. The Council is also responsible for disclosing, as applicable, matters related to going concern and using the going concern basis of accounting, unless the Council intends to liquidate the Polytechnic and group or to cease operations, or has no realistic alternative but to do so.
The Council’s responsibilities arise from the Crown Entities Act 2004 and the Education Act 1989.
Responsibilities of the auditor for the audit of the financial statements and the statement of service performance
Our objectives are to obtain reasonable assurance about whether the financial statements and the statement of service performance, as a whole, are free from material misstatement, whether due to fraud or error, and to issue an auditor’s report that includes our opinion.
Reasonable assurance is a high level of assurance, but is not a guarantee that an audit carried out in accordance with the Auditor-General’s Auditing Standards will always detect a material misstatement when it exists. Misstatements are differences or omissions of amounts or disclosures, and can arise from fraud or error. Misstatements are considered material if, individually or in the aggregate, they could reasonably be expected to influence the decisions of readers taken on the basis of these financial statements and statement of service performance.
For the budget information reported in the financial statements and the statement of service performance, our procedures were limited to checking that the information agreed to the Polytechnic andgroup’s Council approved budget and Investment plan.
We did not evaluate the security and controls over the electronic publication of the financial statements and the statement of service performance.
As part of an audit in accordance with the Auditor-General’s Auditing Standards, we exercise professional judgement and maintain professional scepticism throughout the audit. Also:
• We identify and assess the risks of material misstatement of the financial statements and thestatement of service performance, whether due to fraud or error, design and perform auditprocedures responsive to those risks, and obtain audit evidence that is sufficient and appropriateto provide a basis for our opinion. The risk of not detecting a material misstatement resultingfrom fraud is higher than for one resulting from error, as fraud may involve collusion, forgery,intentional omissions, misrepresentations, or the override of internal control.
• We obtain an understanding of internal control relevant to the audit in order to design auditprocedures that are appropriate in the circumstances, but not for the purpose of expressing anopinion on the effectiveness of the Polytechnic and group’s internal control.
• We evaluate the appropriateness of accounting policies used and the reasonableness ofaccounting estimates and related disclosures made by the Council.
• We conclude on the appropriateness of the use of the going concern basis of accounting by theCouncil and, based on the audit evidence obtained, whether a material uncertainty exists relatedto events or conditions that may cast significant doubt on the Polytechnic and group’s ability tocontinue as a going concern. If we conclude that a material uncertainty exists, we are required todraw attention in our auditor’s report to the related disclosures in the financial statements andthe statement of service performance or, if such disclosures are inadequate, to modify our
A member firm of Ernst & Young Global Limited
Chartered Accountants
INDEPENDENT AUDITOR’S REPORT
TO THE READERS OF WELLINGTON INSTITUTE OF TECHNOLOGY AND GROUP’S
FINANCIAL STATEMENTS AND STATEMENT OF SERVICE PERFORMANCE
FOR THE YEAR ENDED 31 DECEMBER 2017
The Auditor-General is the auditor of Wellington Institute of Technology (the Polytechnic) and group. The Auditor-General has appointed me, Stuart Mutch, using the staff and resources of Ernst & Young, to carry out the audit of the financial statements and statement of service performance of the Polytechnic and group on his behalf.
Opinion
We have audited:
• the financial statements of the Polytechnic and group on pages 68 to 94, that comprise thestatement of financial position as at 31 December 2017, the statement of comprehensiveincome, statement of changes in equity and statement of cash flows for the year ended on thatdate and the notes to the financial statements that include accounting policies and otherexplanatory information; and
• the statement of service performance of the Polytechnic and group on pages 58 to 61.
In our opinion:
• the financial statements of the Polytechnic and group on pages 68 to 94:
− present fairly, in all material respects:
- the financial position as at 31 December 2017; and
- the financial performance and cash flows for the year then ended; and
− comply with generally accepted accounting practice in New Zealand in accordance with Public Benefit Entity Reporting Standards; and
• the statement of service performance of the Polytechnic and group on pages 58 to 61 presentsfairly, in all material respects, the Polytechnic and group’s service performance achievementsmeasured against the proposed outcomes described in the investment plan for the year ended31 December 2017.
Our audit was completed on 30 April 2018. This is the date at which our opinion is expressed.
The basis for our opinion is explained below. In addition, we outline the responsibilities of the Council and our responsibilities relating to the financial statements and the statement of service performance, we comment on other information, and we explain our independence.
Basis for our opinion
We carried out our audit in accordance with the Auditor-General’s Auditing Standards, which incorporate the Professional and Ethical Standards and the International Standards on Auditing (New Zealand) issued by the New Zealand Auditing and Assurance Standards Board. Our responsibilities under those standards are further described in the Responsibilities of the auditor section of our report.
We have fulfilled our responsibilities in accordance with the Auditor-General’s Auditing Standards.
We believe that the audit evidence we have obtained is sufficient and appropriate to provide a basis for our opinion.
WELTEC
145
Responsibilities of the Council for the financial statements and the statement of service performance
The Council is responsible on behalf of the Polytechnic and group for preparing financial statements that are fairly presented and that comply with generally accepted accounting practice in New Zealand.
The Council is also responsible on behalf of the Polytechnic and group for preparing a statement of service performance that is fairly presented.
The Council is responsible for such internal control as it determines is necessary to enable it to prepare financial statements and a statement of service performance that are free from material misstatement, whether due to fraud or error.
In preparing the financial statements and the statement of service performance, the Council is responsible on behalf of the Polytechnic and group for assessing the Polytechnic and group’s ability to continue as a going concern. The Council is also responsible for disclosing, as applicable, matters related to going concern and using the going concern basis of accounting, unless the Council intends to liquidate the Polytechnic and group or to cease operations, or has no realistic alternative but to do so.
The Council’s responsibilities arise from the Crown Entities Act 2004 and the Education Act 1989.
Responsibilities of the auditor for the audit of the financial statements and the statement of service performance
Our objectives are to obtain reasonable assurance about whether the financial statements and the statement of service performance, as a whole, are free from material misstatement, whether due to fraud or error, and to issue an auditor’s report that includes our opinion.
Reasonable assurance is a high level of assurance, but is not a guarantee that an audit carried out in accordance with the Auditor-General’s Auditing Standards will always detect a material misstatement when it exists. Misstatements are differences or omissions of amounts or disclosures, and can arise from fraud or error. Misstatements are considered material if, individually or in the aggregate, they could reasonably be expected to influence the decisions of readers taken on the basis of these financial statements and statement of service performance.
For the budget information reported in the financial statements and the statement of service performance, our procedures were limited to checking that the information agreed to the Polytechnic andgroup’s Council approved budget and Investment plan.
We did not evaluate the security and controls over the electronic publication of the financial statements and the statement of service performance.
As part of an audit in accordance with the Auditor-General’s Auditing Standards, we exercise professional judgement and maintain professional scepticism throughout the audit. Also:
• We identify and assess the risks of material misstatement of the financial statements and thestatement of service performance, whether due to fraud or error, design and perform auditprocedures responsive to those risks, and obtain audit evidence that is sufficient and appropriateto provide a basis for our opinion. The risk of not detecting a material misstatement resultingfrom fraud is higher than for one resulting from error, as fraud may involve collusion, forgery,intentional omissions, misrepresentations, or the override of internal control.
• We obtain an understanding of internal control relevant to the audit in order to design auditprocedures that are appropriate in the circumstances, but not for the purpose of expressing anopinion on the effectiveness of the Polytechnic and group’s internal control.
• We evaluate the appropriateness of accounting policies used and the reasonableness ofaccounting estimates and related disclosures made by the Council.
• We conclude on the appropriateness of the use of the going concern basis of accounting by theCouncil and, based on the audit evidence obtained, whether a material uncertainty exists relatedto events or conditions that may cast significant doubt on the Polytechnic and group’s ability tocontinue as a going concern. If we conclude that a material uncertainty exists, we are required todraw attention in our auditor’s report to the related disclosures in the financial statements andthe statement of service performance or, if such disclosures are inadequate, to modify our
A member firm of Ernst & Young Global Limited
Chartered Accountants
INDEPENDENT AUDITOR’S REPORT
TO THE READERS OF WELLINGTON INSTITUTE OF TECHNOLOGY AND GROUP’S
FINANCIAL STATEMENTS AND STATEMENT OF SERVICE PERFORMANCE
FOR THE YEAR ENDED 31 DECEMBER 2017
The Auditor-General is the auditor of Wellington Institute of Technology (the Polytechnic) and group. The Auditor-General has appointed me, Stuart Mutch, using the staff and resources of Ernst & Young, to carry out the audit of the financial statements and statement of service performance of the Polytechnic and group on his behalf.
Opinion
We have audited:
• the financial statements of the Polytechnic and group on pages 68 to 94, that comprise thestatement of financial position as at 31 December 2017, the statement of comprehensiveincome, statement of changes in equity and statement of cash flows for the year ended on thatdate and the notes to the financial statements that include accounting policies and otherexplanatory information; and
• the statement of service performance of the Polytechnic and group on pages 58 to 61.
In our opinion:
• the financial statements of the Polytechnic and group on pages 68 to 94:
− present fairly, in all material respects:
- the financial position as at 31 December 2017; and
- the financial performance and cash flows for the year then ended; and
− comply with generally accepted accounting practice in New Zealand in accordance with Public Benefit Entity Reporting Standards; and
• the statement of service performance of the Polytechnic and group on pages 58 to 61 presentsfairly, in all material respects, the Polytechnic and group’s service performance achievementsmeasured against the proposed outcomes described in the investment plan for the year ended31 December 2017.
Our audit was completed on 30 April 2018. This is the date at which our opinion is expressed.
The basis for our opinion is explained below. In addition, we outline the responsibilities of the Council and our responsibilities relating to the financial statements and the statement of service performance, we comment on other information, and we explain our independence.
Basis for our opinion
We carried out our audit in accordance with the Auditor-General’s Auditing Standards, which incorporate the Professional and Ethical Standards and the International Standards on Auditing (New Zealand) issued by the New Zealand Auditing and Assurance Standards Board. Our responsibilities under those standards are further described in the Responsibilities of the auditor section of our report.
We have fulfilled our responsibilities in accordance with the Auditor-General’s Auditing Standards.
We believe that the audit evidence we have obtained is sufficient and appropriate to provide a basis for our opinion.
WELTEC

146
opinion. Our conclusions are based on the audit evidence obtained up to the date of our auditor’s report. However, future events or conditions may cause the Polytechnic and group to cease to continue as a going concern.
• We evaluate the overall presentation, structure and content of the financial statements and thestatement of service performance, including the disclosures, and whether the financialstatements and the statement of service performance represent the underlying transactions andevents in a manner that achieves fair presentation.
• We obtain sufficient appropriate audit evidence regarding the financial statements and thestatement of service performance of the entities or business activities within the group toexpress an opinion on the consolidated financial statements and the consolidated statement ofservice performance. We are responsible for the direction, supervision and performance of thegroup audit. We remain solely responsible for our audit opinion.
We communicate with the Council regarding, among other matters, the planned scope and timing of theaudit and significant audit findings, including any significant deficiencies in internal control that weidentify during our audit.
Our responsibilities arise from the Public Audit Act 2001.
Other information
The Council is responsible for the other information. The other information comprises the informationincluded on pages to 56, and 138 to 140 ut does not include the financial statements and thestatement of service performance, and our auditor’s report thereon.
Our opinion on the financial statements and the statement of service performance does not cover the other information and we do not express any form of audit opinion or assurance conclusion thereon.
In connection with our audit of the financial statements and the statement of service performance, ourresponsibility is to read the other information. In doing so, we consider whether the other information ismaterially inconsistent with the financial statements and the statement of service performance or ourknowledge obtained in the audit, or otherwise appears to be materially misstated. If, based on our work,we conclude that there is a material misstatement of this other information, we are required to report thatfact. We have nothing to report in this regard.
Independence
We are independent of the Polytechnic and group in accordance with the independence requirements ofthe Auditor-General’s Auditing Standards, which incorporate the independence requirements ofProfessional and Ethical Standard 1 (Revised): Code of Ethics for Assurance Practitioners issued by the New Zealand Auditing and Assurance Standards Board.
Other than the audit, we have no relationship with or interests in the Polytechnic or any of its subsidiaries.
Stuart MutchErnst & YoungOn behalf of the Auditor-GeneralWellington, New Zealand
WELTEC

147
opinion. Our conclusions are based on the audit evidence obtained up to the date of our auditor’s report. However, future events or conditions may cause the Polytechnic and group to cease to continue as a going concern.
• We evaluate the overall presentation, structure and content of the financial statements and thestatement of service performance, including the disclosures, and whether the financialstatements and the statement of service performance represent the underlying transactions andevents in a manner that achieves fair presentation.
• We obtain sufficient appropriate audit evidence regarding the financial statements and thestatement of service performance of the entities or business activities within the group toexpress an opinion on the consolidated financial statements and the consolidated statement ofservice performance. We are responsible for the direction, supervision and performance of thegroup audit. We remain solely responsible for our audit opinion.
We communicate with the Council regarding, among other matters, the planned scope and timing of theaudit and significant audit findings, including any significant deficiencies in internal control that weidentify during our audit.
Our responsibilities arise from the Public Audit Act 2001.
Other information
The Council is responsible for the other information. The other information comprises the informationincluded on pages to 56, and 138 to 140 ut does not include the financial statements and thestatement of service performance, and our auditor’s report thereon.
Our opinion on the financial statements and the statement of service performance does not cover the other information and we do not express any form of audit opinion or assurance conclusion thereon.
In connection with our audit of the financial statements and the statement of service performance, ourresponsibility is to read the other information. In doing so, we consider whether the other information ismaterially inconsistent with the financial statements and the statement of service performance or ourknowledge obtained in the audit, or otherwise appears to be materially misstated. If, based on our work,we conclude that there is a material misstatement of this other information, we are required to report thatfact. We have nothing to report in this regard.
Independence
We are independent of the Polytechnic and group in accordance with the independence requirements ofthe Auditor-General’s Auditing Standards, which incorporate the independence requirements ofProfessional and Ethical Standard 1 (Revised): Code of Ethics for Assurance Practitioners issued by the New Zealand Auditing and Assurance Standards Board.
Other than the audit, we have no relationship with or interests in the Polytechnic or any of its subsidiaries.
Stuart MutchErnst & YoungOn behalf of the Auditor-GeneralWellington, New Zealand
Chartered Accountants
INDEPENDENT AUDITOR’S REPORT
TO THE READERS OF WHITIREIA COMMUNITY POLYTECHNIC AND GROUP’S FINANCIAL STATEMENTS AND STATEMENT OF SERVICE PERFORMANCE
FOR THE YEAR ENDED 31 DECEMBER 2017
The Auditor-General is the auditor of Whitireia Community Polytechnic (the Polytechnic) and group. The Auditor-General has appointed me, Stuart Mutch, using the staff and resources of Ernst & Young, to carry out the audit of the financial statements and statement of service performance of the Polytechnic and group on his behalf.
Opinion
We have audited:
the financial statements of the Polytechnic and group on pages 98 to 131, that comprise the statement of financial position as at 31 December 2017, the statement of comprehensive income, statement of changes in equity and statement of cash flows for the year ended on that date and the notes to the financial statements that include accounting policies and other explanatory information; and
the statement of service performance of the Polytechnic and group on pages 62 to 65.
In our opinion:
the financial statements of the Polytechnic and group on pages 98 to 131:
present fairly, in all material respects:
- the financial position as at 31 December 2017; and
- the financial performance and cash flows for the year then ended; and comply with generally accepted accounting practice in New Zealand in accordance with
Public Benefit Entity Reporting Standards; and
the statement of service performance of the Polytechnic and group on pages 62 to 65 presents fairly, in all material respects, the Polytechnic and group’s service performance achievements measured against the proposed outcomes described in the investment plan for the year ended 31 December 2017.
Our audit was completed on 30 April 2018. This is the date at which our opinion is expressed.
The basis for our opinion is explained below. In addition, we outline the responsibilities of the Council and our responsibilities relating to the financial statements and the statement of service performance, we comment on other information, and we explain our independence.
Basis for our opinion
We carried out our audit in accordance with the Auditor-General’s Auditing Standards, which incorporate the Professional and Ethical Standards and the International Standards on Auditing (New Zealand) issued by the New Zealand Auditing and Assurance Standards Board. Our responsibilities under those standards are further described in the Responsibilities of the auditor section of our report.
We have fulfilled our responsibilities in accordance with the Auditor-General’s Auditing Standards.
We believe that the audit evidence we have obtained is sufficient and appropriate to provide a basis for our opinion.
Responsibilities of the Council for the financial statements and the statement of service performance
The Council is responsible on behalf of the Polytechnic and group for preparing financial statements that are fairly presented and that comply with generally accepted accounting practice in New Zealand.
A member firm of Ernst & Young Global Limited
WHITIREIA

148
The Council is also responsible on behalf of the Polytechnic and group for preparing a statement of service performance that is fairly presented.
The Council is responsible for such internal control as it determines is necessary to enable it to prepare financial statements and a statement of service performance that are free from material misstatement, whether due to fraud or error.
In preparing the financial statements and the statement of service performance, the Council is responsible on behalf of the Polytechnic and group for assessing the Polytechnic and group’s ability to continue as a going concern. The Council is also responsible for disclosing, as applicable, matters related to going concern and using the going concern basis of accounting, unless the Council intends to liquidate the Polytechnic and group or to cease operations, or has no realistic alternative but to do so.
The Council’s responsibilities arise from the Crown Entities Act 2004 and the Education Act 1989.
Responsibilities of the auditor for the audit of the financial statements and the statement of service performance
Our objectives are to obtain reasonable assurance about whether the financial statements and the statement of service performance, as a whole, are free from material misstatement, whether due to fraud or error, and to issue an auditor’s report that includes our opinion.
Reasonable assurance is a high level of assurance, but is not a guarantee that an audit carried out in accordance with the Auditor-General’s Auditing Standards will always detect a material misstatement when it exists. Misstatements are differences or omissions of amounts or disclosures, and can arise from fraud or error. Misstatements are considered material if, individually or in the aggregate, they could reasonably be expected to influence the decisions of readers taken on the basis of these financial statements and statement of service performance.
For the budget information reported in the financial statements and the statement of service performance, our procedures were limited to checking that the information agreed to the Polytechnic and group’s Council approved budget and Investment plan.
We did not evaluate the security and controls over the electronic publication of the financial statements and the statement of service performance.
As part of an audit in accordance with the Auditor-General’s Auditing Standards, we exercise professional judgement and maintain professional scepticism throughout the audit. Also:
• We identify and assess the risks of material misstatement of the financial statements and thestatement of service performance, whether due to fraud or error, design and perform auditprocedures responsive to those risks, and obtain audit evidence that is sufficient and appropriateto provide a basis for our opinion. The risk of not detecting a material misstatement resultingfrom fraud is higher than for one resulting from error, as fraud may involve collusion, forgery,intentional omissions, misrepresentations, or the override of internal control.
• We obtain an understanding of internal control relevant to the audit in order to design auditprocedures that are appropriate in the circumstances, but not for the purpose of expressing anopinion on the effectiveness of the Polytechnic and group’s internal control.
• We evaluate the appropriateness of accounting policies used and the reasonableness ofaccounting estimates and related disclosures made by the Council.
• We conclude on the appropriateness of the use of the going concern basis of accounting by theCouncil and, based on the audit evidence obtained, whether a material uncertainty exists relatedto events or conditions that may cast significant doubt on the Polytechnic and group’s ability tocontinue as a going concern. If we conclude that a material uncertainty exists, we are required todraw attention in our auditor’s report to the related disclosures in the financial statements andthe statement of service performance or, if such disclosures are inadequate, to modify ouropinion. Our conclusions are based on the audit evidence obtained up to the date of ourauditor’s report. However, future events or conditions may cause the Polytechnic and group tocease to continue as a going concern.
WHITIREIA
149
• We evaluate the overall presentation, structure and content of the financial statements and thestatement of service performance, including the disclosures, and whether the financialstatements and the statement of service performance represent the underlying transactions andevents in a manner that achieves fair presentation.
• We obtain sufficient appropriate audit evidence regarding the financial statements and thestatement of service performance of the entities or business activities within the group toexpress an opinion on the consolidated financial statements and the consolidated statement ofservice performance. We are responsible for the direction, supervision and performance of thegroup audit. We remain solely responsible for our audit opinion.
We communicate with the Council regarding, among other matters, the planned scope and timing of theaudit and significant audit findings, including any significant deficiencies in internal control that weidentify during our audit.
Our responsibilities arise from the Public Audit Act 2001.
Other information
The Council is responsible for the other information. The other information comprises the information included on pages 6 to 56, 136 to 137 and 141 but does not include the financial statements and thestatement of service performance, and our auditor’s report thereon.
Our opinion on the financial statements and the statement of service performance does not cover the other information and we do not express any form of audit opinion or assurance conclusion thereon.
In connection with our audit of the financial statements and the statement of service performance, ourresponsibility is to read the other information. In doing so, we consider whether the other information ismaterially inconsistent with the financial statements and the statement of service performance or ourknowledge obtained in the audit, or otherwise appears to be materially misstated. If, based on our work,we conclude that there is a material misstatement of this other information, we are required to report thatfact. We have nothing to report in this regard.
Independence
We are independent of the Polytechnic and group in accordance with the independence requirements ofthe Auditor-General’s Auditing Standards, which incorporate the independence requirements ofProfessional and Ethical Standard 1 (Revised): Code of Ethics for Assurance Practitioners issued by the New Zealand Auditing and Assurance Standards Board.
Other than the audit, we have no relationship with or interests in the Polytechnic or any of its subsidiaries.
Stuart MutchErnst & YoungOn behalf of the Auditor-GeneralWellington, New Zealand
WHITIREIA

150 ANNUAL REPORT 2017
ACE Adult and Community Education
APER Annual Programme Evaluation Report
CCDHB Capital and Coast District Health Board
CE Chief Executive
CEO Chief Executive Officer
EEdO Equal Education Opportunities
EEO Equal Employment Opportunities
EFTS Equivalent Full-Time Student
EPIs Educational Performance Indicators
GST Goods & Services Tax
ICT Information and Communications Technology
ITO Industry Training Organisation
ITP Institutes of Technology and Polytechnics
JLT Joint leadership Team
LCBNZI Le Cordon Bleu New Zealand Institute
LLN Language Literacy and Numeracy
MAHARA “Remember” in Te Reo and is the name of the e-portfolio that Level 4 construction students complete
LNAAT Literacy and Numeracy for Adults Assessment Tool
MBA Master of Business Administration
MBIE Ministry of Business Innovation and Employment
MoU Memorandum of Understanding
MPTT Māori and Pasifika Trades Training
NCEA National Certificate of Educational Achievement NEETS Not in Education, Employment or Training
NSN National Student Number
NZCATT NZ Cert Adult Teaching and Training
NZCALNE New Zealand Certificate in Adult Literacy and Numeracy Education
NZ GAAP New Zealand Generally Accepted Accounting Principles
NZQA New Zealand Qualifications Authority
NZQF New Zealand Qualifications Framework
PASM Principal Academic Staff Member
REVIVE An application of the APlus+ system
SAC Student Achievement Component
SASM Senior Academic Staff Member
SDR Single Data Return
STAR Secondary/Tertiary Alignment Resources
TEC Tertiary Education Commission
TCS Teacher Course Survey
WINZ Work and Income
WES Work Environment Survey
WNZL Whitireia New Zealand Limited
W2 Shared services company that operates between WelTec and Whitireia covering ICT, campus services/facilities and procurement
WREDA Wellington Regional Economic Development Agency
WTA Wellington Trades Academy
ACRONYMS

WELTEC AND WHITIREIA 151
www.weltec.ac.nz www.whitireia.ac.nz
0800 944 847 [email protected]
0800 935 832 [email protected]

152 ANNUAL REPORT 2017

WELTEC AND WHITIREIA 153

154 ANNUAL REPORT 2017
20 17