Well-to-Wheels analysis of future automotive fuels and ...
38
21/10/2020 1 JEC WTW v5 Well-to-Wheels analysis of future automotive fuels and powertrains in the European context Prussi Matteo a , Scarlat Nicolae a , de Prada, Luis b , Yugo, Marta c a JRC - Unit C.2 – Ispra b EUCAR c Concawe Methodological approach Nicolae Scarlat JRC – Directorate C - Energy, Transport and Climate Energy Efficiency and Renewables - Unit C.2
Transcript of Well-to-Wheels analysis of future automotive fuels and ...

21/10/2020
1
JEC WTW v5Well-to-Wheels analysis of future automotive fuels
and powertrains in the European context
Prussi Matteoa, Scarlat Nicolae a, de Prada, Luis b , Yugo, Marta c
a JRC - Unit C.2 – Ispra
b EUCAR
c Concawe
Methodological approach
Nicolae Scarlat
JRC – Directorate C - Energy, Transport and Climate Energy Efficiency and Renewables - Unit C.2

21/10/2020
2
in a transparent and objective manner
a consensual Well-to-Wheels assessment of:
- energy use
and
- GHG emissions
Establish
for a wide range of automotive fuels and powertrains , relevant to Europe in 2025+
JEC WTW - Goals
Analysis updated as technologies evolve
Common methodology and data-set
JEC WTW Data from JEC WtW are normally used and cited by numerous scientists world-wide and elements of it directly feed into EU policies. Currently, JEC WTW has been used as source for:
• DG-MOVE report "State of the art on alternative fuels transport systems in the European Union - 2020 update ",
• DG-CLIMA study "Determining the environmental impacts of conventional and alternatively fuelled vehicles through LCA ”, performed by a consortium led by RICARDO.
• Data have been supplied for work of the IPCC WG3 LCA data (call for data on climate footprints and costs of mitigation options within the transport sector).

21/10/2020
3
Attributional vs Consequential
To complement the analysis, a detailed section comparing attributional and consequential CO 2allocation methods to refining products (focus on gasoline and diesel) is included (NEW!).
The JEC use a consequential approach as it aimsto guide judgements on the potential benefits ofsubstituting conventional fuels/vehicles byalternatives and for future fuels , to understandwhere the additional energy resource wouldcome from (if demand for a new fuel were toincrease).
We invite JEC readers and LCA practitioner notto directly apply JEC results without taking intoconsideration the methodological approachchosen.
Comparison between attributional (A-LCA) and consequential (C-LCA) approaches
Summary. Refinery allocation results based on extended literature review
Methodology: Co-product emissions JEC vs REDIIA given (fuel) production process may produce multiple products*
* Co-productsDifferent routes can have very different implications in terms of energy, GHG, or cost …and it must be realised that economics – rather than energy use or GHG balance – are likely to dictate which routes are the most popular in real life.
• RED and RED Recast allocate GHG emissions to biofuels and co-products by energy content (LHV), i.e.:
• Emissions are allocated to the main product and on co-products on the basis of their respective energy contents
Allocation methods have the attraction of being simpler to implement Any benefit from a co-product depends on what the by-product substitutes: allocation methods take no account of this
• JEC methodology uses a substitution method , i.e.:
• All energy and emissions generated by the process are allocated to the main or desired product;
• The co-product generates an energy and emission credit equal to the energy and emissions saved by not producing what the co-product is most likely to displace.
Closer representation of “real-life”: economic choices of stakeholders Uncertainty: outcomes dependent on fate of co-products
Co-products in RED and RED Recast Co-products in JEC WTW Methodology

21/10/2020
4
JEC WTW v5. What’s new?
New pathways
Major update of JEC v4 pathways
Changes respect to version 4
78
Well Tank Wheels
New technologies, new fuels and new feedstocks.
HDV
NEW!
Heavy Duty section!
Class 4 and 5
PCNEDC & WLTP cyclesModelling work!
174
Current 2025+
WTT Cost Analysison selected biofuel routes
The JEC Well-to-Wheels study is a technical analysis of the energy use and GHG emissions of possible road fuel and powertrain configurations in the European context for a time horizon of 2025+.
This study is not intended to commit the JEC partne rs to deliver any particular technology or conclusion included in the study .
***
For a full description of the study including assumptions, calculations and results, please consult the full set of reports and appendices available at:
https://ec.europa.eu/jrc/en/jec
Disclaimer
21/10/2020
5
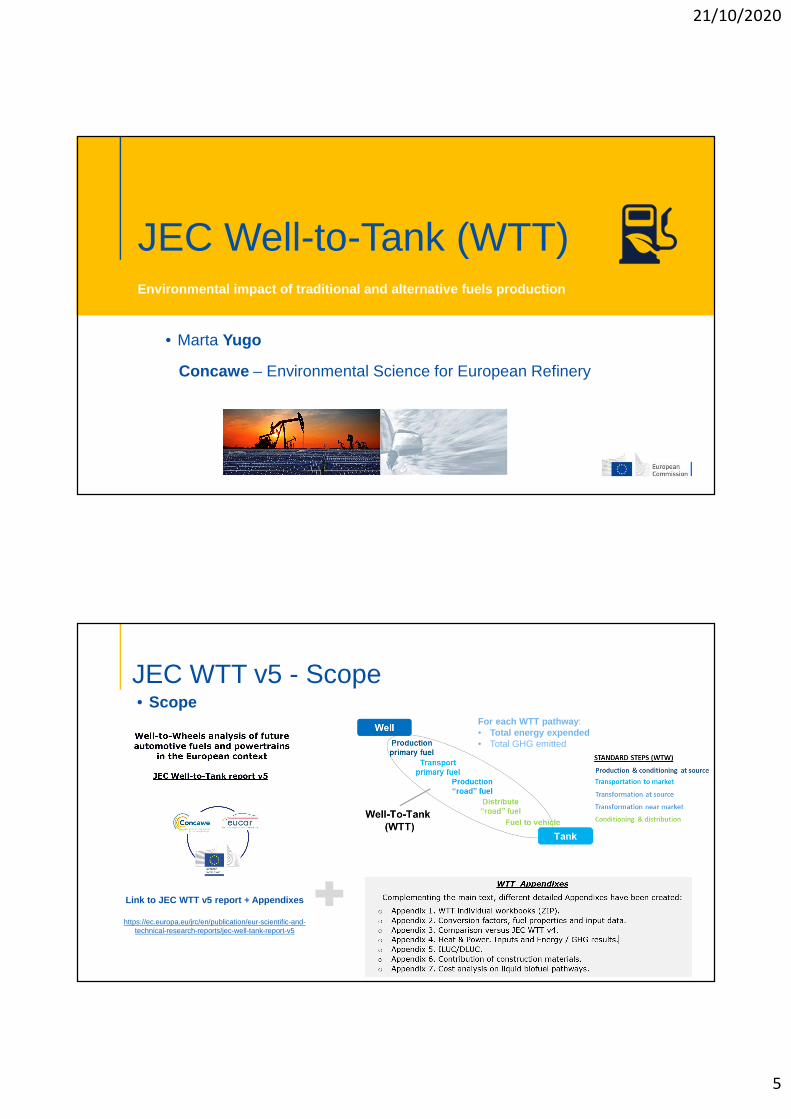
JEC Well-to-Tank (WTT)
• Marta Yugo
Concawe – Environmental Science for European Refinery
Environmental impact of traditional and alternative fuels production
JEC WTT v5 - Scope• Scope
Link to JEC WTT v5 report + Appendixes
https://ec.europa.eu/jrc/en/publication/eur-scientific-and-technical-research-reports/jec-well-tank-report-v5
For each WTT pathway :• Total energy expended• Total GHG emitted

21/10/2020
6
JEC WTT v5 - Pathways analysed
Schematic representation of JEC WTT GHG intensity calculation for fuel pathways and its use in the JEC WTW integration
Example. Waste wood based pathway (Ethanol – WWET1b)
JEC WTT v5 IN NUMBERS
JEC WTT v5 – Pathways analysedJEC WTT v5 IN NUMBERS• Scope
• Resource categories
• Total WTT pathways
• New pathways
• Synthetic fuel pathways investigated
7
252
78
54
From Resource to fuel: production routes
(Pathways)
• Crude oil
• Natural gas
• Coal
• Electricity production
• Biomass / Waste
Crop based
Waste
Wood
• Hydrogen
• Power-to-fuels (e-fuels)
Role of CCSFor each WTT pathway i ndication of Technology & Commercial readiness
levels (TRL & CRL)(NEW!)
Major updated versus JEC WTT v4

21/10/2020
7
JEC WTT v5 – Pathways analysedJEC WTT v5 IN NUMBERS• Scope
• Resource categories
• Total WTT pathways
• New pathways
• Synthetic fuel pathways investigated
7
252
78
54
Final fuels (“families”)
(Pathways)
• Gasoline/diesel fuels (& ED95 & AdBlue components)
• Synthetic Fischer-Tropsch diesel (GLT, BTl, CTL, PtD)
• Pyrolysis / HTL diesel/gasoline
• CNG/LNG, CBM/LBM, SNG/LNG, LPG
• Ethanol
• FAME, FAEE and HVO
• Methanol
• Ethers (MTBE, ETBE/ DME, OME)
• Electricity
• Hydrogen
Thanks to the members of the JEC expert group assisted by LBST!
~40~40 Experts involved
10 • Final fuels (“families”)
Major updated versus JEC WTT v4
For each WTT pathway i ndication of Technology & Commercial readiness
levels (TRL & CRL)(NEW!)
Conversion pathways based on:
STATE-OF-THE-ART
• Updated / New pathways based on recent literature review and/or empirical data to reflect new
technologies, fuels and feedstocks.• Data from other Associations (e.g. NGVA),
Technology Providers included.• Stakeholders / experts are invited to contribute!
JEC WTT v5 – Resource to fuels
252
New fuels: e.g. ED95. Ethanol with ignition improver fulfilling SS 155437. ED95 can be used in dedicated compression ignition engines.
/ waste

21/10/2020
8
Conversion pathways based on:
STATE-OF-THE-ART
• Updated / New pathways based on recent literature review and/or empirical data to reflect new
technologies, fuels and feedstocks.• Data from other Associations (e.g. NGVA),
Technology Providers included.• Stakeholders / experts are invited to contribute!
JEC WTT v5 – Technology to fuels
252
New fuels: e.g. ED95. Ethanol with ignition improver fulfilling SS 155437. ED95 can be used in dedicated compression ignition engines.
0
10
20
30
40
50
60
70
80
90
100
COHOP1 COHOP2 COHOP3
Tota
l G
HG
in
c. c
om
bu
stio
n
(g C
O2
eq/M
fin
al f
ue
l)
Production & conditioning at source Transformation at source
0
4
8
12
16
20
COD1 COD1C COG1 COG1CWT
T G
HG
em
issi
on
s (
g C
O2
eq/M
J fin
al
fue
l)
Example. Crude oil based fuelsWTT GHG emissions (w/o and with combustion) (g CO2eq/MJfuel)
Crude oil production/transport
JEC WTT v5: 10 g CO2eq/MJprod
(WTT v4: 4.7 g CO2eq/MJprod)
Transformation (Refining – Marginal Diesel)
JEC WTT v5: 7.2 g CO2eq/MJprod
(WTT v4: 8.6 g CO2/MJ marginal diesel)
INPUTS updated (examples):
• Electricity mix (LV including upstream losses) Current EU mix (2016 - JRC / EEA): 110 g CO2eq/MJ
(~29% RES) EU mix (2030 - IEA NPS + En. Eff improve. for
combustion power plants): 75 g CO2eq/MJ (45% RES)
• Crude oil extraction from Exergia et al.
• Refining products from latest Concawe’s analysis
• Biofuel pathways inputs for forestry residue collection, transport & distribution, etc. aligned to RED II
• CNG / LNG pathways distances and quality per location updated; EU mix included as indication.
JEC WTT v5 – Updated PathwaysConversion pathways
based on:
Recent StudiesSTATE-OF-THE-ART
252Production & conditioning at source Transformation at source
Transportation to market Transformation near market
Conditioning & distribution

21/10/2020
9
0
10
20
30
40
50
60
70
80
90
100
COHOP1 COHOP2 COHOP3
Tota
l G
HG
in
c. c
om
bu
stio
n
(g C
O2
eq/M
fin
al f
ue
l)
Production & conditioning at source Transformation at source
0
4
8
12
16
20
COD1 COD1C COG1 COG1CWT
T G
HG
em
issi
on
s (
g C
O2
eq/M
J fin
al
fue
l)
JEC WTT v5 – New Pathways
New HOP (High Octane Gasoline)Oil based gasoline, Ethanol and Ethers
100 RON and 102 RON (E5eq and E10eq)(Source: Concawe)
Diesel + Carbon Capture and Storage (CCS)
CCS schemes added to a number of selected pathways to assess
the potential impact (WTT)
Examples:
• Gasoline / Diesel + CCS• Biofuel + CCS (BECCS / Negative emissions)• High octane gasoline (HOP)• Pyrolysis / HTL based gasoline & diesel• H2 from methane cracking
• Power-to-fuels (Carbon Capture and Usage)
• POME (Palm Oil Mill Effluent)• 100% Bio-based ETBE (Global Bio-energy)• CNG/CBG from sludge• SNG from RES
• ED95• adBlue• …
Conversion pathways based on:
New technologies, new feedstocks, new fuels
78 Production & conditioning at source Transformation at source
Transportation to market Transformation near market
Conditioning & distribution
Example. Crude oil based fuelsWTT GHG emissions (w/o and with combustion) (g CO2eq/MJfuel)
Code:WW: wood residue WF: farmed wood BL: Black liquor xC: With CCS SD: synthetic diesel GPx: natural gas
JEC WTT v5 - WTT – Synthetic fuels• Synthetic fuel (Part I. Biomass, waste, organic mat erial)
(Example of pathways investigated)
Syn-diesel (XTL) Fischer-Tropsch with/wo CCS) from gas, coal, wood
Pyrolysis / HTL
CTL
GTL
With CCS
HV
O
Ele
ctric
ity
2016
2030
OMEMethanol DME Bio-SNG
Pro
du
ctio
n &
co
nd
itio
nin
g a
t so
urc
eTr
ansf
orm
ati
on
at
sou
rce
Tran
spo
rtat
ion
to
mar
ket
Tran
sfo
rma
tio
n n
ear
mar
ket
Co
nd
itio
nin
g &
dis
trib
uti
on
54
21/10/2020
10
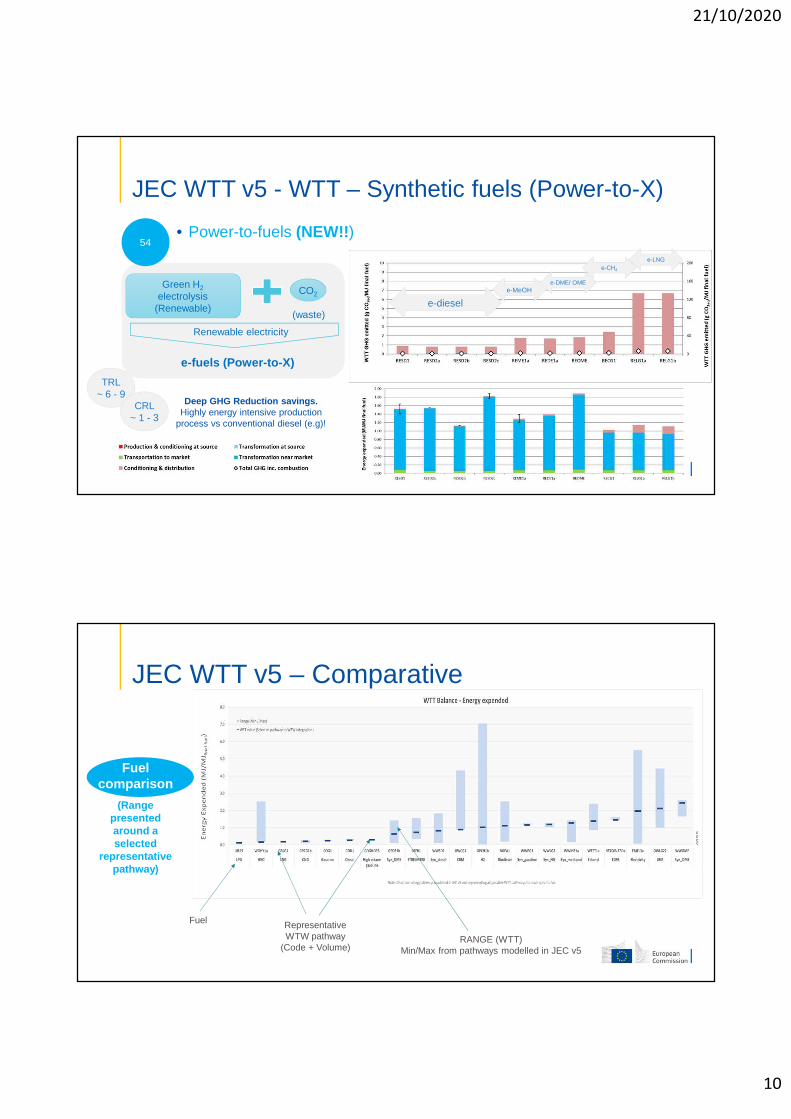
JEC WTT v5 - WTT – Synthetic fuels (Power-to-X)
• Power-to-fuels (NEW!!)
e-diesele-MeOH
e-DME/ OME
e-CH4
e-LNG
Deep GHG Reduction savings.Highly energy intensive production
process vs conventional diesel (e.g)!
Green H2electrolysis
(Renewable)
CO2
(waste)
e-fuels (Power-to-X)
Renewable electricity
TRL ~ 6 - 9
CRL ~ 1 - 3
54
JEC WTT v5 – Comparative
Fuel comparison
(Range presented around a selected
representative pathway)
Representative WTW pathway
(Code + Volume) RANGE (WTT)
Min/Max from pathways modelled in JEC v5
Fuel

21/10/2020
11
JEC WTT v5 – Comparative
RESOURCE COMPARISON
Ranges per type of feedstock/resource
into final fuels
(Only for pathways included in JEC v5)
-200 0 200 400 600
Electricity (Overall)
Hydrogen
Syn_methanol
Syn_OME
Syn_NG
Syn_DME
Syn_diesel
Biogas (Overall)
LBM
CBM
Heat
Hydrogen
Waste (Overall)
HVO
Biodiesel
Wood (Overall)
Syn_OME
Syn_gasoline
Syn_NG
Ethanol
Hydrogen
Syn_methanol
Syn_DME
Heat
CHP
Syn_diesel
Crops (Overall)
ED95
Biodiesel
ETBE
HVO
Ethanol
Fossil (Overall)
Syn_OME
Heat
CHP
ETBE
Syn_methanol
LNG
MTBE
Syn_diesel
Diesel
Gasoline
High octane gasoline
Hydrogen
Syn_DME
LPG
CNG
Ele
ctri
city
Bio
ga
sW
aste
Wo
od
Cro
ps
Foss
il
WTT GHG emissions (g CO2eq/MJ final fuel)
-2.00 0.00 2.00 4.00 6.00 8.00
Electricity (Overall)
Hydrogen
Syn_OME
Syn_DME
Syn_methanol
Syn_NG
Syn_diesel
Biogas (Overall)
Hydrogen
LBM
CBM
Heat
Waste (Overall)
HVO
Biodiesel
Wood (Overall)
Syn_OME
Ethanol
Syn_gasoline
Syn_NG
Hydrogen
Heat
Syn_methanol
Syn_DME
Syn_diesel
CHP
Crops (Overall)
ETBE
ED95
Ethanol
HVO
Biodiesel
Fossil (Overall)
Syn_OME
ETBE
Syn_diesel
Syn_methanol
Syn_DME
MTBE
High octane gasoline
Diesel
Gasoline
Heat
LNG
LPG
CNG
Hydrogen
CHPE
lect
rici
tyB
iog
as
Wa
ste
Wo
od
/ S
tra
wC
rop
sFo
ssil
WTT energy expended (MJ/MJ final fuel)
Hydrogen
Waste (Overall)
HVO
Biodiesel
Wood (Overall)
Syn_OME
Syn_gasoline
Syn_NG
Ethanol
Hydrogen
Syn_methanol
Syn_DME
Heat
CHP
Syn_diesel
Crops (Overall)
ED95
Biodiesel
ETBE
HVO
Ethanol
Fossil (Overall)
Wa
ste
Wo
od
Cro
ps
JEC WTT v5 – Comparative
RESOURCE COMPARISON
Ranges per type of feedstock/resource
into final fuels
(Only for pathways included in JEC v5)
-200 0 200
RESOURCE
Final fuels produced by means of a certain resource/feedstock
Range for a specific fuel(Min / max from the pathways
modelled in JEC WTTv5)
Range for a specific resource(Min / max from the pathways
modelled in JEC WTTv5)
0 200 400
WTT GHG emissions (g CO2eq/MJ final fuel)

21/10/2020
12
JEC WTT v5 – Cost analysisCost
of G
HG
savin
gs for
the investigate
d
pro
duction p
ath
ways in 2
014-2
016
Note.
Total production
costs
= CAPEX
(Investment)
+
OPEX
(cost of feedstocks and operational
costs).
12% capital charge rate <> ~ 8% return
on investment wo taxes.
20% uncertainty range on CAPEX
(BTL
JEC Tank-to-Wheels (TTW)
• Luis de Prada
EUCAR – Research programme manager
Version 5 for passenger cars and heavy-duty vehicle s

21/10/2020
13
Introduction
The Tank-to-Wheels (TTW) study aims to provide technology-neutral comparison of powertrain and energy carrier combinations by estimating GHG emissions or energy efficiency.
Passenger Cars (PC)
MAIN RESULTS

21/10/2020
14
Introduction
TTW passenger cars (PC) :
• Representative of EU market, • Generic C-segment passenger car (2015 and 2025+), • TTW simulations to reflect changes in test cycles from NEDC (New
European Drive Cycle) to WLTP (Worldwide Harmonized Light duty Test Procedure).
• PC simulations have been performed by AVL List GmbH using Cruise software (as in Version4).
Fuels and powertrain configurations considered

21/10/2020
15
Fuels and powertrain configurations considered
Ranges:
• BEV range: 150km (2015), 2 variants (2025+) 200km and 400km
• PHEV EV range: 50km (2015), 100km (2025+)
• REEV EV range: 100km (2015), 200km (2025+)
Terminology:• DISI: Direct Injection Spark Ignition• DICI: Direct Injection Compression Ignition• HEV: Hybrid Electric Vehicle • MHEV: Mild Hybrid Electric Vehicle (48v)• PHEV: Plug-In Hybrid Electric Vehicle• REEV: Range Extender Electric Vehicle• BEV: Battery Electric Vehicle• FCEV: Fuel Cell driven Electric Vehicle• LPG: Liquefied Petroleum Gas• CNG: Compressed Natural Gas• FAME: Biodiesel (B100)• DME: Di-Methyl-Ether• FT-Diesel: Paraffinic diesel (EN15940)• HVO: Hydro-treated Vegetable Oil
Results
CO2 equivalent emission and energy consumption for 2015 and 2025+ variants

21/10/2020
16
Results• Due to improvements in future powertrain technology, as
well as with the support of fuel quality, ICE powered vehicles will continue to deliver TTW GHG emission reductions and energy savings compared to the 2015 baseline. Future Diesel-type engines will keep energy efficiency benefit.
• Hybridisation (Mild (48v) and Full-Hybrids) will deliver additional reductions in both domains (gasoline and diesel).
• Additional GHG and energy consumption reductions can be achieved with deeper electrification, i.e. PHEV, REEV as well as FCEV and BEV powertrains. However, main differentiator between PHEV and REEV is battery size rather than ICE integration.
Results
• Alternative Fuels in ICE vehicles (e.g. CNG, HVO…) have a GHG emissions reduction effect compared to their fossil equivalents on TTW perspective, however not reflected in current legislation.
• Future legislation will concentrate on reducing real driving emissions – the contribution of sustainable renewable and efficiency-aiding fuels will therefore become more important.

21/10/2020
17
HEAVY DUTY VEHICLES (HDV)
MAIN RESULTS
Introduction
TTW heavy-duty vehicles (HD) :
• New in version 5;• Representative of EU market, • Generic long-haul vehicles and specific fuels leveraging VECTO tool (2016
and 2025+), TTW simulations to reflect groups 4 and 5
• HD simulations have been performed by FVT from Graz University of Technology using VECTO software.
21/10/2020
18
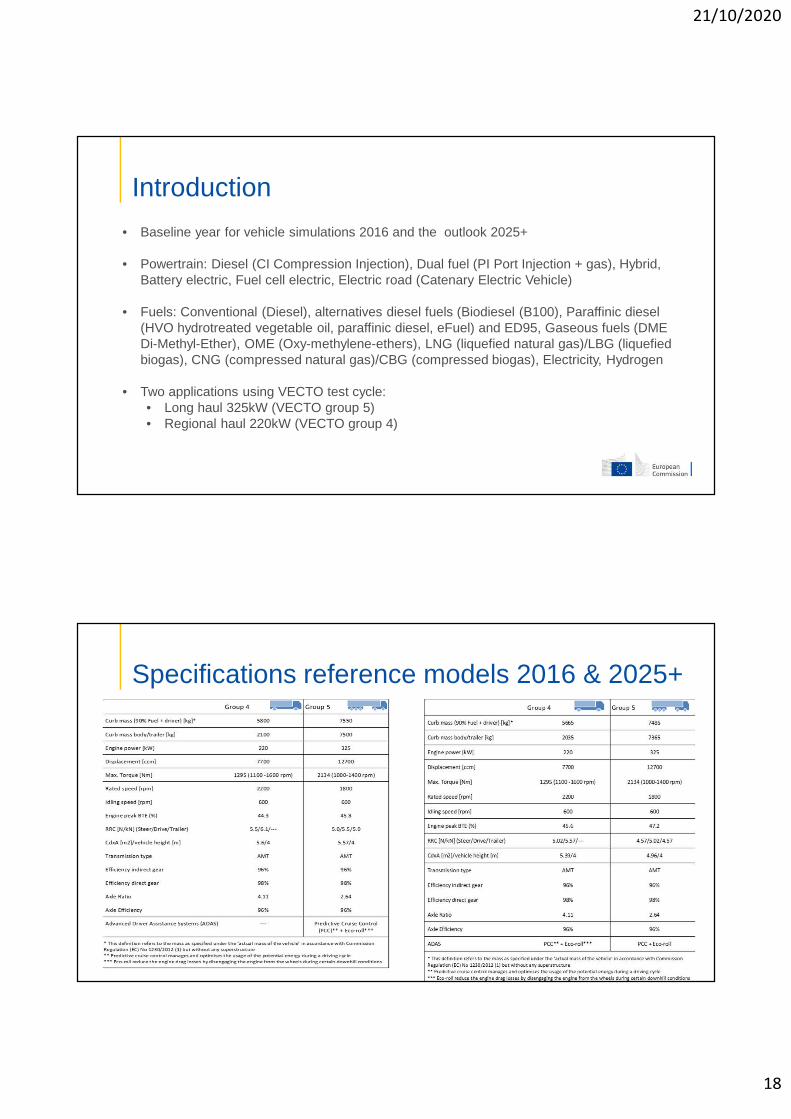
Introduction
• Baseline year for vehicle simulations 2016 and the outlook 2025+
• Powertrain: Diesel (CI Compression Injection), Dual fuel (PI Port Injection + gas), Hybrid, Battery electric, Fuel cell electric, Electric road (Catenary Electric Vehicle)
• Fuels: Conventional (Diesel), alternatives diesel fuels (Biodiesel (B100), Paraffinic diesel (HVO hydrotreated vegetable oil, paraffinic diesel, eFuel) and ED95, Gaseous fuels (DME Di-Methyl-Ether), OME (Oxy-methylene-ethers), LNG (liquefied natural gas)/LBG (liquefied biogas), CNG (compressed natural gas)/CBG (compressed biogas), Electricity, Hydrogen
• Two applications using VECTO test cycle: • Long haul 325kW (VECTO group 5) • Regional haul 220kW (VECTO group 4)
Specifications reference models 2016 & 2025+

21/10/2020
19
Fuel and powertrain configurations consideredPowertrain
Fuel
ICE CI
(Diesel)
ICE PI
(Gasoline)
ICE CI +
HEV
ICE PI +
HEVBEV FCEV
CEV
(electric
road)
Diesel B0 Both
Diesel B7 market
blendBoth Both
DME Both
ED95 Both
Electricity Both Both
Biodiesel (B100) Both
Paraffinic Diesel Both
CNG Both Group 4
Hydrogen Both
LNG (EU mix.) Both Both Group 5
OME Both
Fuel and powertrain configurations consideredFuel Type Description
Diesel B0 Diesel fulfilling EN590, with no FAME addition.
Diesel B7 market blend Diesel fulfilling EN590, with up to 7% FAME addition.
FAME (B100) Fatty Acid Methyl Esters biodiesel (B100) specified in EN14214.
ED95Ethanol with ignition improver fulfilling SS 155437. ED95 can be used in dedicated compression ignition engines.
Paraffinic DieselParaffinic Diesel fulfilling EN 15940. Gas to liquid (GtL or XtL) or Hydrogenated Vegetable oils (HVO).
DMEDiMethyl Ether, CH3OCH3, fulfilling base fuel standard ISO 16861. It can be used in dedicated compression ignition engines.
OMEOxymethylene Ether, CH3O(CH2O)nCH3, n=3,4,5. OME can be used in dedicated compression ignition engines.
H-CNG (2016) Compressed Natural Gas, EU mix of H-Gas,specified in EN 16723-2.
H-CNG (2030) Compressed Natural Gas, projected EU mix of H-Gas for 2030.
Hydrogen (CGH2) Compressed hydrogen at 700 bar.
LNG (EU mix. 2016/2030) Liquified Natural Gas, specified in EN 16723-2.
21/10/2020
20
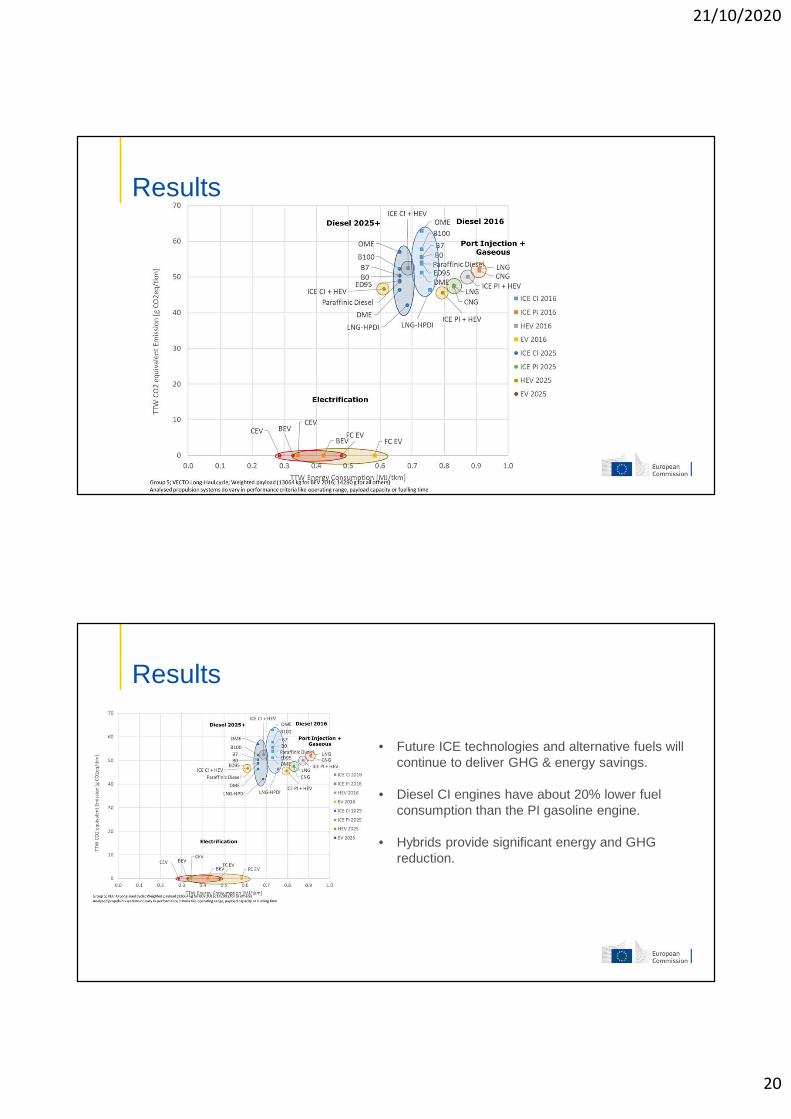
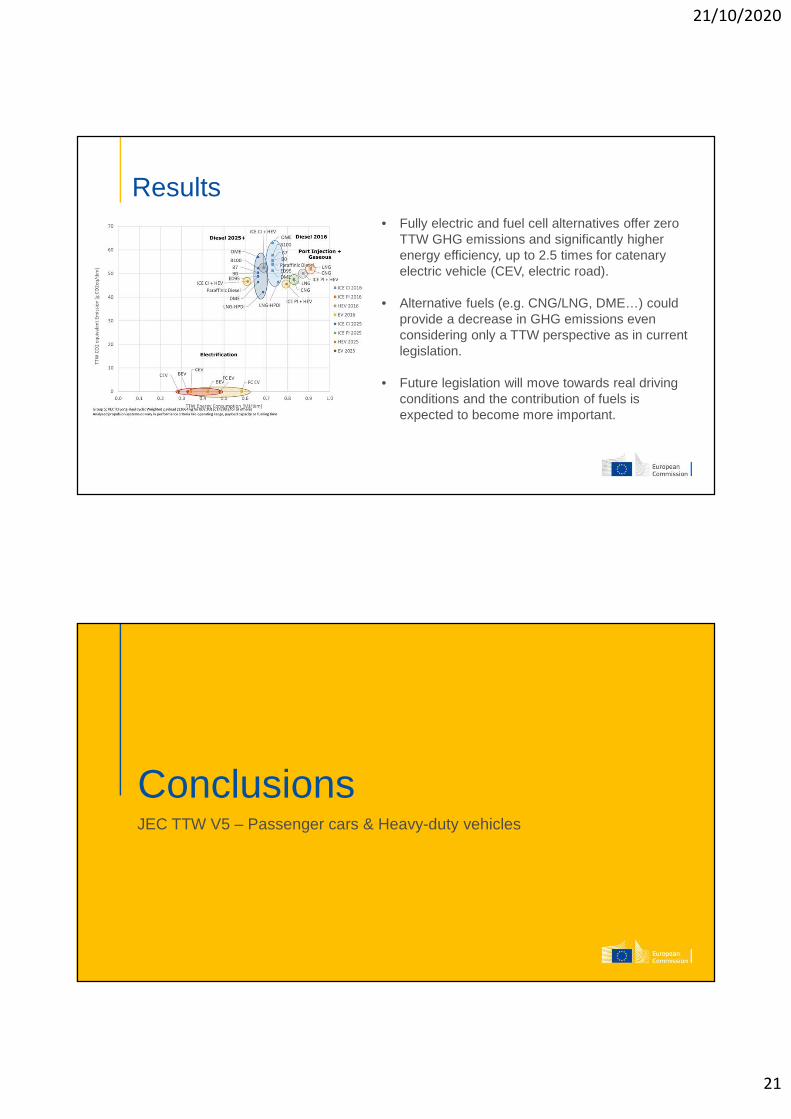
Results
Results
• Future ICE technologies and alternative fuels will continue to deliver GHG & energy savings.
• Diesel CI engines have about 20% lower fuel consumption than the PI gasoline engine.
• Hybrids provide significant energy and GHG reduction.
21/10/2020
21
Results• Fully electric and fuel cell alternatives offer zero
TTW GHG emissions and significantly higher energy efficiency, up to 2.5 times for catenary electric vehicle (CEV, electric road).
• Alternative fuels (e.g. CNG/LNG, DME…) could provide a decrease in GHG emissions even considering only a TTW perspective as in current legislation.
• Future legislation will move towards real driving conditions and the contribution of fuels is expected to become more important.
ConclusionsJEC TTW V5 – Passenger cars & Heavy-duty vehicles

21/10/2020
22
Takeaways
• Due to improvements in future powertrain technology, as well as with the support of fuel quality, ICE powered vehicles will continue to deliver TTW GHG emission reductions and energy savings compared to the baselines.
• Hybridisation will deliver additional energy and GHG reduction.
• Alternative Fuels in ICE vehicles offer GHG emissions reduction effect compared to their fossil equivalents on TTW perspective.
• The contribution of fuels to achieve energy and GHG reductions will become more important.
JEC Well-to-Wheels (WTW)
Matteo Prussi
JRC – Directorate C - Energy, Transport and Climate Energy Efficiency and Renewables - Unit C.2
Version 5

21/10/2020
23
JEC WTW v5. Scheme
For each WTW pathway , calculate:• Total energy required• Total GHG emitted
> 250 Resource to fuel pathways
> 1500 possible combinations!
Integration
>60 powertrains combinations
FLEETWTTfuel
gCO2 / MJ
TTWPowertrain efficiency MJ / km
Penetration of alternative powertrains

21/10/2020
24
For each fuel group (i.e. ethanol, biodiesel, etc.) we selected a maximum of 5 WTT pathways for WTW integration
Pathways selection criteria
• Biodiesel
• HVO
• Ethanol
• Compressed Biomethane
• Electricity
• …
WTW integration
FUELS SELECTED PATHWAY
MAIN RESULTS
(for a specific reference year)
SELECTED POWERTRAIN
Key to pathway codes
COG1 Conventional gasoline
OWCG1 Municipal waste (closed digestate)
OWCG21 Manure (closed digestate)
OWCG22 Manure (open digestate)
OWCG4 Maize, whole plant (closed digestate)
WWCG2 Syn-methane from Waste wood
RECG1 Syn-methane from renewable electricity
• PC: Class-C, single configuration.
• HDV: Class V, single configuration.

21/10/2020
25
WTW integration
Passenger Cars (PC)
MAIN RESULTS

21/10/2020
26
Example of integration: Biodiesel
The potential GHG saving offeredby the use of biodiesel are strongly related to the feedstock used.
They vary from ~50%, versus equivalent fossil diesel DISI in the case of rape seed oil, up to~90% when waste oil routes are explored .
Example of integration: EthanolCurrently, gasoline with different ethanol blends is available in the European Market. E5 (5%v ethanol) and E10 (10%v) ethanol are included as a reference .
WTW GHG emission savings varying from 30 up to ~90%, versus conventional gasoline (100% fossil).
The best GHG performance for pathways where process by-products are valorised in the production cycle , to reduce energy demand.
Interesting GHG savings can be achieved using residues and wastes, as residual wood and straw:• waste wood based pathways could perform
~70% better WTW than a conventional gasoline engine.
21/10/2020
27
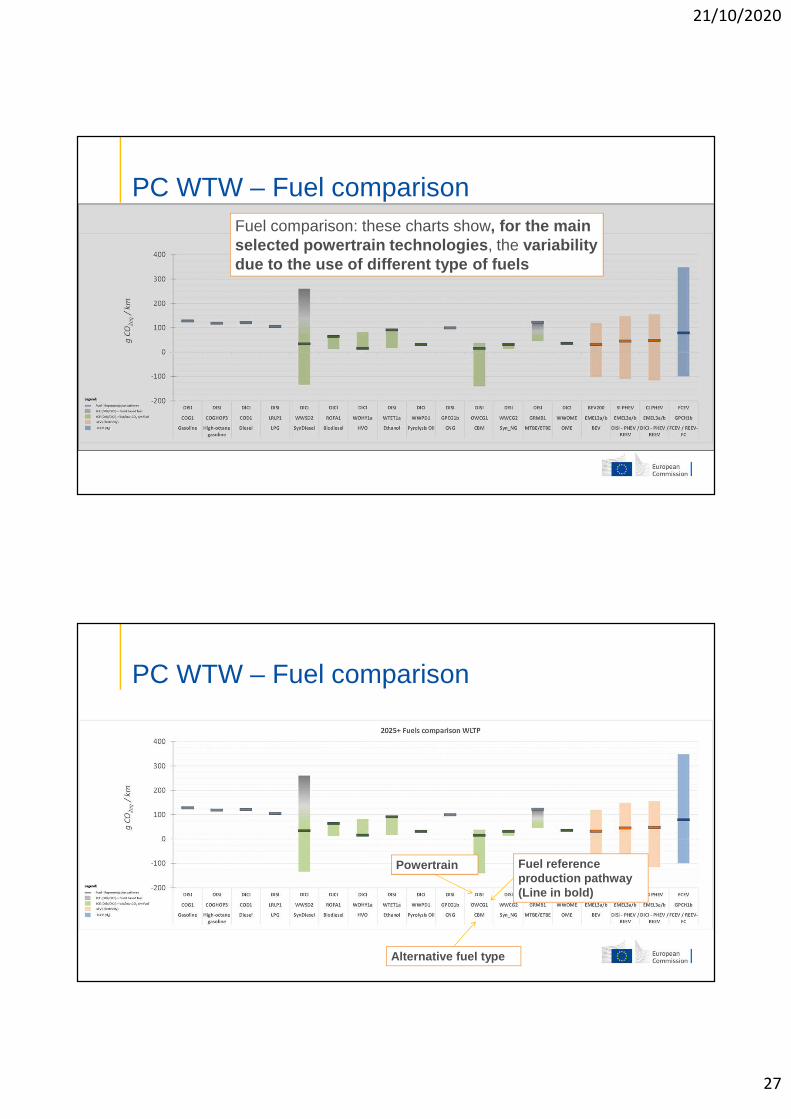
PC WTW – Fuel comparisonFuel comparison: these charts show, for the main selected powertrain technologies , the variability due to the use of different type of fuels
PC WTW – Fuel comparison
Fuel reference production pathway (Line in bold)
Alternative fuel type
Powertrain
21/10/2020
28
Main outcomes – fuel comparison
1. Almost all the alternative fuels analysed offer a better WTW performance than conventional oil based gasoline/diesel when used in Internal Combustion Engines (DISI/DICI).
2. Pathways, such as alternative fuels based on waste cooking oil (WOHY1a) offer significant WTW performance improvements.
3. Electricity and Hydrogen are energy vectors, so their WTW potential to lower CO2 emissions depend on the primary source of energ y used for the production.
4. The use of renewable electricity for xEVs and H2 production for FCEVoffer one of the lowest WTW intensive combinations .
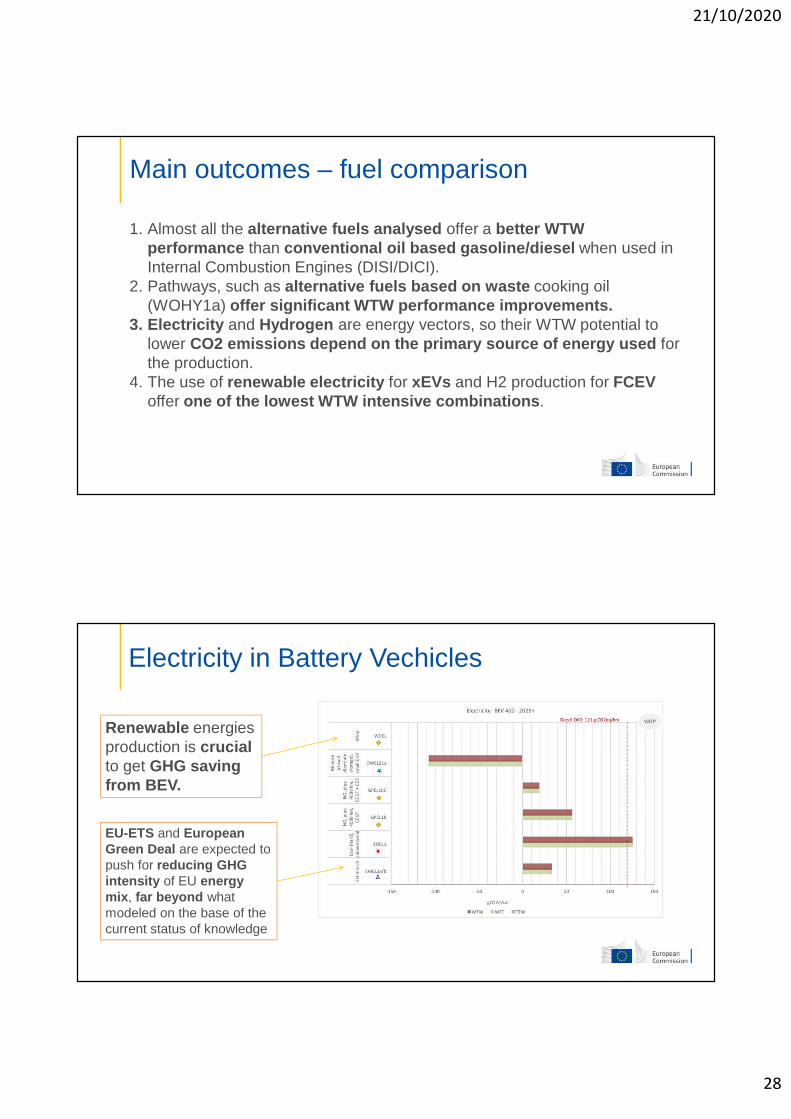
Electricity in Battery Vechicles
Renewable energies production is crucialto get GHG saving from BEV.
EU-ETS and European Green Deal are expected to push for reducing GHG intensity of EU energy mix , far beyond what modeled on the base of the current status of knowledge

21/10/2020
29
PC WTW – Powertrains(2015 – NEDC / 2025+ WLTP)
Powertrain comparison: in these charts, the impactof modifications in the main powertrain technologies through, for example different levels of hybridization or battery sizes, are explored for each type of fuel and its representative feedstock/conversion pathway.
PC WTW – Powertrains(2015 – NEDC / 2025+ WLTP)
Fuel reference production pathway
Alternative fuel type
Different powertrains

21/10/2020
30
PC WTW – Powertrains(2015 – NEDC / 2025+ WLTP)
Significant improve along the WTW is expected for all the investigated fuel/powertrain combinations.
PC WTW – Powertrains(2015 – NEDC / 2025+ WLTP)
Increase in the number of powertrain options
21/10/2020
31
Main outcomes – powertrains
1. Generally speaking, the hybridization of ICEs offers an effective option to reduce fuel consumption , up to ~25% .
2. For gasoline/DISI type of engines , the combination of high compression with a high octane gasoline (102 RON) offers a similarperformance than DICI (diesel) vehicles when approaching 2025+ .
3. The xEVs technology is expected to improve significantly towards 2025+ (including battery size increase). In 2015, FCEV and PHEV/REEV offer similar WTW results (~15% better performance of the latter versus FCEV.
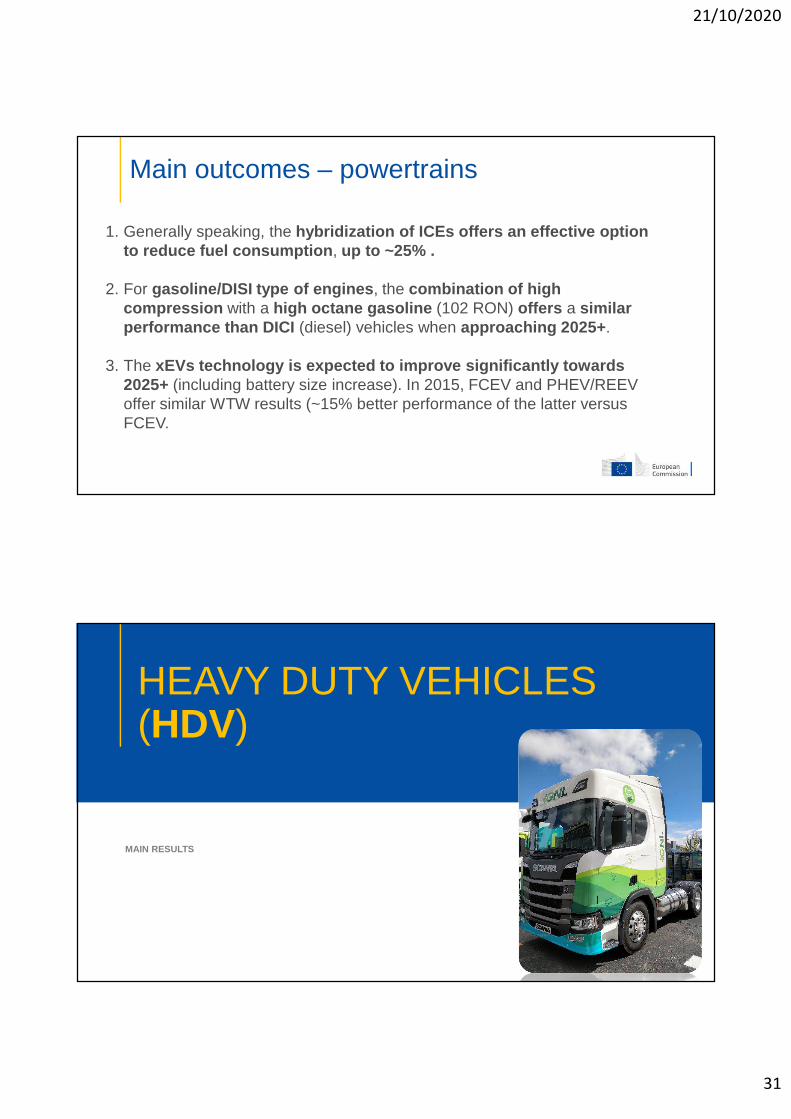
HEAVY DUTY VEHICLES (HDV)
MAIN RESULTS
21/10/2020
32
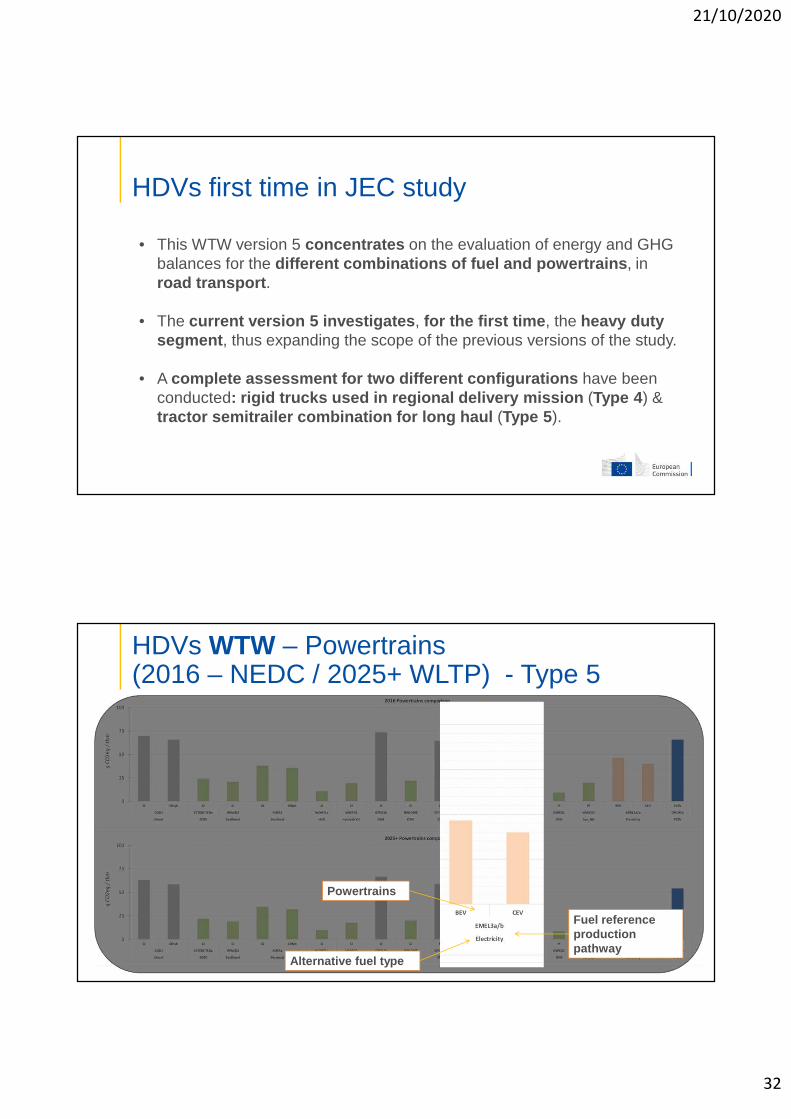
HDVs first time in JEC study
• This WTW version 5 concentrates on the evaluation of energy and GHG balances for the different combinations of fuel and powertrains , in road transport .
• The current version 5 investigates , for the first time , the heavy duty segment , thus expanding the scope of the previous versions of the study.
• A complete assessment for two different configuration s have been conducted: rigid trucks used in regional delivery mission (Type 4 ) & tractor semitrailer combination for long haul (Type 5 ).
HDVs WTW – Powertrains(2016 – NEDC / 2025+ WLTP) - Type 5
Fuel reference production pathway
Alternative fuel type
Powertrains

21/10/2020
33
PC WTW – Powertrains(2015 – NEDC / 2025+ WLTP) - Type 5
• As for PC, the hybridisation of ICEs offers an effective option to reduce fuel consumption, up to ~7%.• HPDI offers significant energy savings when compare d to SI engines leading to about up to 12% lower
GHG emissions in 2016 and in 2025+ compared to SI engines with the same fuel.
HDVs WTW – Powertrains(2016 – NEDC / 2025+ WLTP) - Type 5

21/10/2020
34
PC WTW – Powertrains - Type 5EU electricity mix is used as a proxy .
In the transition , the reaction of the whole electricity productionsystem will define GHG emissions , related to a marginalincrease in electricity demand for road sector .
EU-ETS and European Green Dealare expected to push for reducing GHG intensity of EU energy mix , far beyond what modeled on the base of the current status of knowledge.
2016
2025+
Electricity driven powertrains - Catenary
CEV are mainly operated at catenary mode and partly at battery (BEV) mode
21/10/2020
35
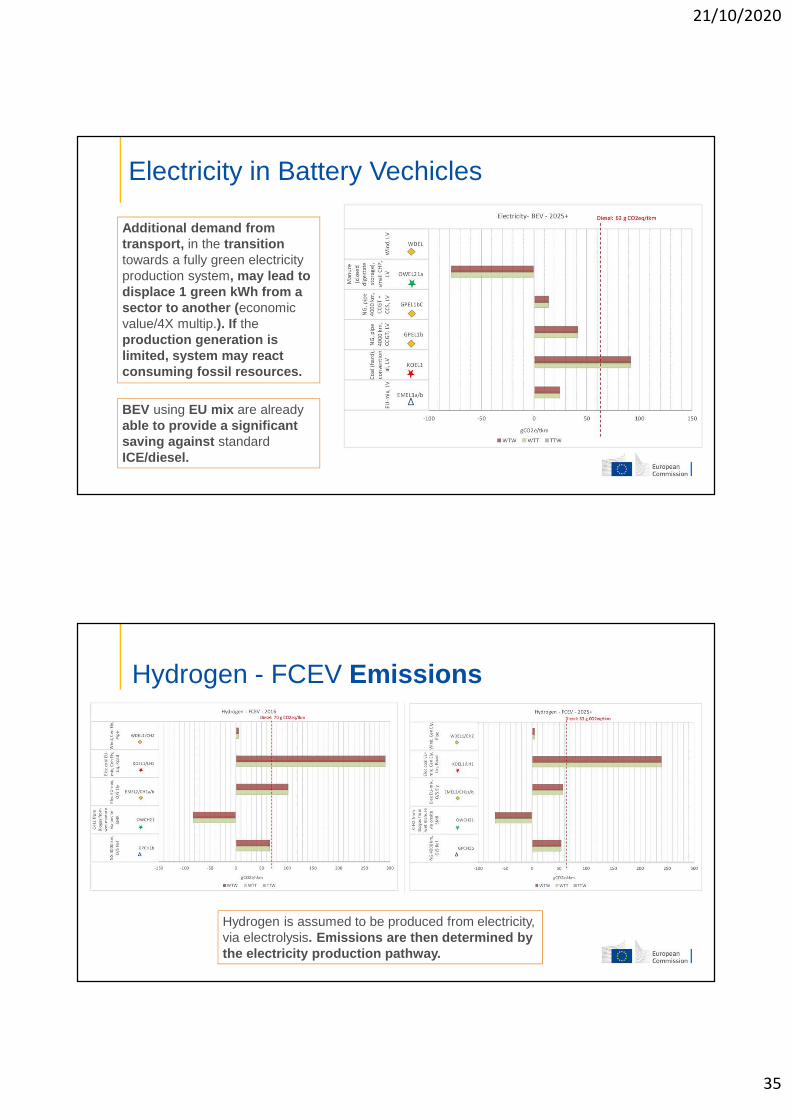
Electricity in Battery Vechicles
Additional demand from transport, in the transitiontowards a fully green electricity production system, may lead to displace 1 green kWh from a sector to another ( economic value/4X multip.). If theproduction generation is limited, system may react consuming fossil resources.
BEV using EU mix are alreadyable to provide a significant saving against standardICE/diesel.
Hydrogen - FCEV Emissions
Hydrogen is assumed to be produced from electricity, via electrolysis. Emissions are then determined by the electricity production pathway.

21/10/2020
36
Hydrogen - FCEV Energy expanded
Strong reduction in energy demand expected for all the analysed pathways.
Hydrogen - FCEV Energy expanded
The WTW energy use for FCEVcombined with the selected pathways is higher than that for conventional diesel used in CI engines .
Significant amount of primaryenergy required for H2 production using electrolysis => overall systemefficiency issue.

21/10/2020
37
Conclusions
Conclusions• When the WTT and TTW results are combined , factors such as the
conversion pathways , the feedstock/resource used, together with the specific powertrain technology in the 2015/2025+ timeframe have a strong impact on the final results .
• Electricity in BEV and PHEV, e-fuels in ICE as well as Hydrogen in FCEV are promising options but their potential for GHG saving is mainly determined by the pathway of the electricity production and/or by the system reaction from displacement of the kWh from a sector (i.eindustry) to another (i.e. transport).

21/10/2020
38
FEEDBACK, COMMENTS...
Suggestions and enquiries are welcome, simply contact usthrough the JEC WTW website or, for specific questions to:
• JEC WTW: [email protected] [email protected]
• JEC WTT: [email protected]• JEC TTW: [email protected]
https://ec.europa.eu/jrc/en/jec
Thank you
© European Union 2020
Unless otherwise noted the reuse of this presentation is authorised under the CC BY 4.0 license. For any use or reproduction of elements that are not owned by the EU, permission may need to be sought directly from the respective right holders.
Slide xx: element concerned, source: e.g. Fotolia.com; Slide xx: element concerned, source: e.g. iStock.com
The views expressed here are purely those of the authors and may not, under any circumstances, be regarded as an official position of the European Commission.