JEC WTW study 12/2005. HyCARE Symposium Slide 1 Well-to-Wheels analysis of future automotive fuels...
38
JEC WTW study 12/2005. HyCARE Symposium Slide 1 Well-to-Wheels analysis of future automotive fuels and powertrains in the European context A joint study by EUCAR / JRC / CONCAWE Overview of Results
-
date post
21-Dec-2015 -
Category
Documents
-
view
215 -
download
0
Transcript of JEC WTW study 12/2005. HyCARE Symposium Slide 1 Well-to-Wheels analysis of future automotive fuels...
JEC WTW study 12/2005. HyCARE SymposiumSlide 1
Well-to-Wheels analysis of future automotive fuels and powertrains
in the European context
A joint study by EUCAR / JRC / CONCAWE
Overview of Results

JEC WTW study 12/2005. HyCARE Symposium Slide 2
Outline
WTW study objectives and scope
Critical vehicle assumptions
Hydrogen Pathways Hydrogen vehicles (ICE and FC)
Hydrogen from natural gas
Liquid v. Compressed
Hydrogen from biomass
Hydrogen via electrolysis
Costs
Potential hydrogen production from biomass
Hydrogen v. other alternative fuels CNG
Biomass-derived fuels
Cost comparison
Alternative uses of biomass

JEC WTW study 12/2005. HyCARE Symposium Slide 3
Study Objectives
Establish, in a transparent and objective manner, a consensual well-to-wheels energy use and GHG emissions assessment of a wide range of automotive fuels and powertrains relevant to Europe in 2010 and beyond.
Consider the viability of each fuel pathway and estimate the associated macro-economic costs.
Have the outcome accepted as a reference by all relevant stakeholders.
Focus on 2010+
Marginal approach for energy supplies

JEC WTW study 12/2005. HyCARE Symposium Slide 4
Tank-to-Wheels Matrix
Powertrains PISI DISI DICI HybridPISI
HybridDISI
HybridDICI
FC HybridFC
Ref. +hyb. FC
FuelsGasoline 2002
2010+2002
2010+2010+ 2010+ 2010+
Diesel fuel 20022010+
2010+ 2010+
LPG 2002 2010+
CNG Bi-Fuel 20022010+
CNG (dedicated) 20022010+
2010+
Diesel/Bio-diesel blend95/5
20022010+
2010+
Gasoline/Ethanol blend95/5
20022010+
20022010+
2010+
Bio-diesel 20022010+
20022010+
MTBE/ETBE 20022010+
20022010+
20022010+
20022010+
DME 20022010+
2010+
Synthetic diesel fuel 20022010+
2010+
Methanol 2010+
Naphtha 2010+
Compressed hydrogen 2010+ 2010+ 2010+ 2010+
Liquid hydrogen 2010+ 2010+ 2010+ 2010+
JEC WTW study 12/2005. HyCARE Symposium Slide 5
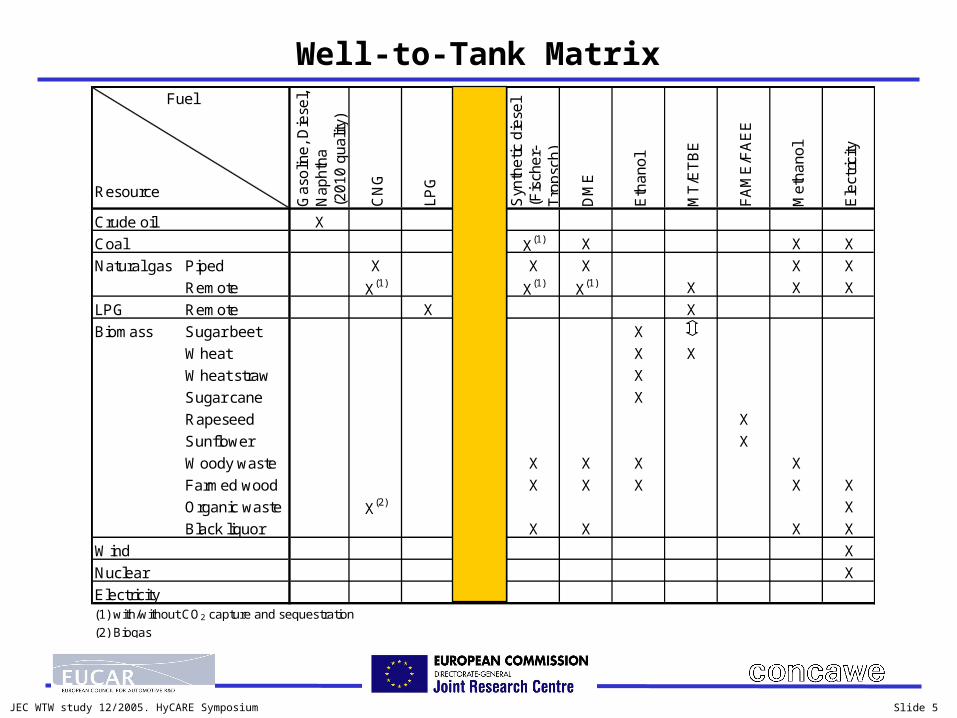
Well-to-Tank Matrix
Ga
solin
e, D
iese
l, N
aph
tha
(20
10 q
ualit
y)
CN
G
LPG
Hyd
rog
en(c
om
p.,
liqui
d)
Syn
the
tic d
iese
l (F
isch
er-
Tro
psch
)
DM
E
Eth
ano
l
MT
/ET
BE
FA
ME
/FA
EE
Me
tha
nol
Ele
ctric
ity
Crude oil X
Coal X(1) X(1) X X X
Natural gas Piped X X(1) X X X X
Remote X(1) X X(1) X(1) X X X
LPG Remote X X
Biomass Sugar beet X
Wheat X X
Wheat straw X
Sugar cane X
Rapeseed X
Sunflower X
Woody waste X X X X X
Farmed wood X X X X X X
Organic waste X(2) X
Black liquor X X X X X
Wind X
Nuclear X
Electricity X(1) with/without CO2 capture and sequestration
(2) Biogas
Fuel
Resource

JEC WTW study 12/2005. HyCARE Symposium Slide 6
Vehicle Assumptions
Simulation of GHG emissions and energy use calculated for a model vehicle Representing the European C-segment (4-seater Sedan) Not fully representative of EU average fleet New European Driving Cycle (NEDC)
For each fuel, the vehicle platform was adapted to meet minimum performance criteria Speed, acceleration, gradeability etc Criteria reflect European customer expectations
Compliance with Euro 3/4 was ensured for the 2002 / 2010 case
No assumptions were made with respect to availability and market share of the vehicle technology options proposed for 2010+
Heavy duty vehicles (truck and buses) not considered in this study

JEC WTW study 12/2005. HyCARE Symposium Slide 8
Common vehicle minimum performance criteria
All technologies fulfil at least minimal customer performance criteria
“Vehicle / Fuel” combinations comply with emissions regulations The 2002 vehicles comply with Euro III The 2010+ vehicles comply with Euro IV
Acceleration
Time lag
0-100 km/h
Time lag
0-50 km/h
Time lag
80-120 km/h
in 4th gear
Range
Gradeability
at 1 km/h
Top speed
< 4 s > 4.0 m/s2
> 30 %
< 13 s
< 13 s > 180 km/h
> 600 km
JEC WTW study 12/2005. HyCARE Symposium Slide 9
HYDROGEN PATHWAYS

JEC WTW study 12/2005. HyCARE Symposium Slide 10
Characteristics of hydrogen ICE vehicles
1.3 l downsized turbocharged engine Engine map derived from test bench data Same energy efficiency map for both compressed and liquid hydrogen Lean-burn mode and high rate of turbo charging gives same torque curve
as gasoline
Gasoline C-H2 L-H2
PowertrainDisplacement l 1.6 1.3 1.3Powertrain kW 77 77 77Engine mass kg 120 120 120Gearbox mass kg 50 50 50Storage SystemTank pressure MPa 0.1 35/70 Atmo.Tank net capacity kg 31.5 9 9Tank mass empty kg 15 120 109Tank mass increase including 90% fuel
kg 0 85 74
VehicleReference mass kg 1181 1181 1181Vehicle mass kg 1181 1266 1255Cycle test mass kg 1250 1360 1360Performance mass kg 1321 1406 1395
PISIPISI

JEC WTW study 12/2005. HyCARE Symposium Slide 11
Characteristics of hydrogen FC vehicles
Drive
train
Electric
motor
Fuel
cell
Power
controller
Or
Hydrogen tank
(compressed or liquid)
Liquid fuelGasoline
Methanol
Naphtha
Diesel
Reformer
Optional battery
(hybrid)
Drive
train
Drive
train
Electric
motor
Electric
motor
Fuel
cell
Fuel
cell
Power
controller
Power
controller
Or
Hydrogen tank
(compressed or liquid)
Liquid fuelGasoline
Methanol
Naphtha
Diesel
Reformer
Optional battery
(hybrid)
0%
10%
20%
30%
40%
50%
60%
0% 10% 20% 30% 40% 50% 60% 70% 80% 90% 100%
% Net power
H2 FCGasoline FCMethanol FC
Fuel cell powertrain efficiency
JEC WTW study 12/2005. HyCARE Symposium Slide 12
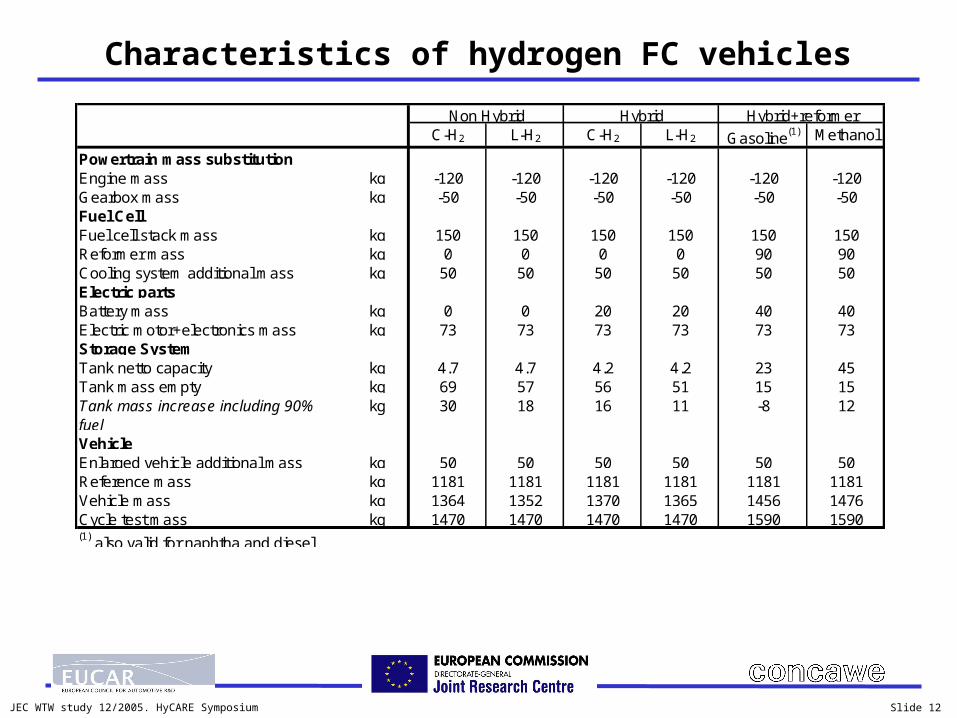
Characteristics of hydrogen FC vehicles
C-H2 L-H2 C-H2 L-H2 Gasoline(1) Methanol
Powertrain mass substitutionEngine mass kg -120 -120 -120 -120 -120 -120Gearbox mass kg -50 -50 -50 -50 -50 -50Fuel CellFuel cell stack mass kg 150 150 150 150 150 150Reformer mass kg 0 0 0 0 90 90Cooling system additional mass kg 50 50 50 50 50 50Electric partsBattery mass kg 0 0 20 20 40 40Electric motor+electronics mass kg 73 73 73 73 73 73Storage SystemTank netto capacity kg 4.7 4.7 4.2 4.2 23 45Tank mass empty kg 69 57 56 51 15 15Tank mass increase including 90% fuel
kg 30 18 16 11 -8 12
VehicleEnlarged vehicle additional mass kg 50 50 50 50 50 50Reference mass kg 1181 1181 1181 1181 1181 1181Vehicle mass kg 1364 1352 1370 1365 1456 1476Cycle test mass kg 1470 1470 1470 1470 1590 1590(1) also valid for naphtha and diesel
Hybrid+reformerNon Hybrid Hybrid
JEC WTW study 12/2005. HyCARE Symposium Slide 13
0
100
200
300
400
500
600
700
800
900
0 200 400 600 800 1000 1200
Total WTW energy (MJ / 100 km)
WT
W G
HG
em
iss
ion
s (
g C
O 2eq /
km
Gasoline
Diesel fuel
C-H2 ex NG, ICE
C-H2 ex NG, FC
C-H2 ex coal, ICE
C-H2 ex coal, FC
C-H2 ex wood, ICE
C-H2 ex wood, FC
C-H2 ex NG+ely, ICE
C-H2 ex NG+ely, FC
C-H2 ex coal+ely, ICE
C-H2 ex coal+ely, FC
C-H2 ex wood+ely, ICE
C-H2ex wood+ely, FC
C-H2 ex nuclear elec, ICE
C-H2 ex nuclear elec, FC
C-H2 ex wind elec, ICE
C-H2 ex wind elec, FC
C-H2 ex EU-mix elec, ICE
C-H2 ex EU-mix elec, FC
L-H2 ex NG, ICE
L-H2 ex NG, FC
L-H2 ex wood, ICE
L-H2 ex wood, FC
L-H2 ex EU-mix elec, ICE
L-H2 ex EU-mix elec, FC
L-H2 ex NG+ely, ICE
L-H2 ex NG+ely, FC
L-H2 ex coal+ely, ICE
L-H2 ex coal+ely, FC
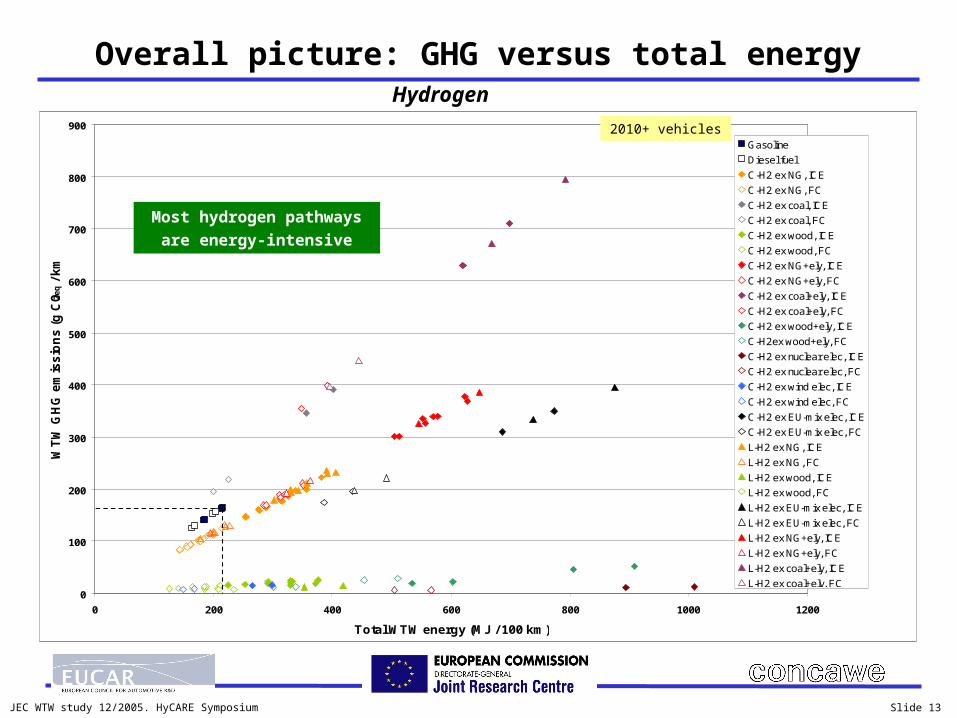
Overall picture: GHG versus total energyHydrogen
Most hydrogen pathways
are energy-intensive
2010+ vehicles

JEC WTW study 12/2005. HyCARE Symposium Slide 14
WTW GHG
0 50 100 150 200 250
C-H2 PISI
L-H2 PISI
C-H2 PISI hyb.
C-H2 FC
C-H2 FC hyb.
g CO2eq / km
WTW energy
0 100 200 300 400
C-H2 PISI
L-H2 PISI
C-H2 PISI hyb.
C-H2 FC
C-H2 FC hyb.
MJ / 100 km
TTW
WTT
ICE v. Fuel Cell, Liquid v. Compressed
Fuel cells have the potential to deliver a large efficiency gain Liquid hydrogen is less energy-efficient than compressed hydrogen
2010+ vehicles
Hydrogen from natural gas

JEC WTW study 12/2005. HyCARE Symposium Slide 15
WTW GHG
0 50 100 150 200 250 300
NG 4000 km,on-site ref
NG 4000 km,central ref, pipe
LNG, central ref,pipe
Coal EU-mix,central ref, pipe
Wood, on-sitegasifier
Wood , centralgasifier, pipe
Wood , blackliquor
g CO2eq / km
WTW energy
0 50 100 150 200 250 300
NG 4000 km, on-site ref
NG 4000 km,central ref, pipe
LNG, central ref,pipe
Coal EU-mix,central ref, pipe
Wood, on-sitegasifier
Wood , centralgasifier, pipe
Wood , blackliquor
MJ / 100 km
TTW
WTT
Impact of hydrogen production route
Source: WTW Report, Figures 8.4.2-1a/b
Direct hydrogen production via reforming
Hydrogen from renewables gives low GHGBut comparison with other uses is required
Figures for 2010+
non-hybrid FC vehicles

JEC WTW study 12/2005. HyCARE Symposium Slide 16
WTW energy
0 200 400 600 800
NG 4000 km, on-site ref
NG 4000 km, CCGT, on-site ely
NG 4000 km, CCGT, central ely,pipe
Wood, on-site gasifier+ely
Elec EU-mix, on-site ely
Elec coal EU-mix, on-site ely
Elec nuclear, on-site ely
Wind, central ely, pipe
MJ / 100 km
TTW
WTT
WTW GHG
0 200 400 600
NG 4000 km, on-site ref
NG 4000 km, CCGT, on-site ely
NG 4000 km, CCGT, central ely,pipe
Wood, on-site gasifier+ely
Elec EU-mix, on-site ely
Elec coal EU-mix, on-site ely
Elec nuclear, on-site ely
Wind, central ely, pipe
g CO2eq / km
Impact of hydrogen production routeHydrogen production via electrolysis
Electrolysis is less energy efficient than direct hydrogen production
Figures for 2010+
non-hybrid FC vehicles
Ely=electrolysis

JEC WTW study 12/2005. HyCARE Symposium Slide 17
WTW energy
0 100 200 300 400
C-H2 ex NG (4000km), PISI
C-H2 ex NG (4000km), FC
C-H2 ex wood,FC
Gasoline
Naphtha
MeOH ex NG(4000 km)
MeOH ex Coal(EU-mix)
MeOH ex Wood
MJ / 100 km
TTW
WTT
Reformer + FC
Directhydrogen
WTW GHG
0 100 200 300 400
C-H2 ex NG (4000km), PISI
C-H2 ex NG (4000km), FC
C-H2 ex wood,FC
Gasoline
Naphtha
MeOH ex NG(4000 km)
MeOH ex Coal(EU-mix)
MeOH ex Wood
g CO2eq / km
TTW
WTT
Total GHG
Reformer+ FC
Directhydrogen
Impact of hydrogen production route: on-board reformers
On-board reforming of gasoline/naphtha is better than direct use in an ICE but not as good as direct fuel cell
Could provide supply flexibility during fuel cell introduction
2010+ vehicles

JEC WTW study 12/2005. HyCARE Symposium Slide 18
CO2 capture and storage (CC&S)
The concept of isolating CO2 produced in combustion or conversion processes and injecting it into suitable geological formations has been gaining credibility in the last few years
There is considerable scope for storage in various types of geological formations
CO2 capture and transport technologies are available Easier when CO2 is produced in nearly pure form Transport in supercritical state (compressed) by pipeline or ship
The main issues are Long-term integrity and safety of storage Legal aspects Cost
The complete technological packages are under development CO2 removal potential given here is only indicative
Preliminary assessment based on data from the IEA greenhouse gas group and other literature sources
Cost data not included as available info not considered sufficiently reliable and consistent
JEC WTW study 12/2005. HyCARE Symposium Slide 19
WTW energy
0 100 200 300 400
CNG: LNG,Dedicated
Syn-diesel, RemGTL
Syn-diesel, Coal(CTL)
DME: Rem
C-H2, NG 4000km, Cen Ref, ICE
C-H2, NG 4000km, Cen Ref, FC
MJ / 100 km
With CCS
Standard processes
WTW GHG
0 100 200 300 400
CNG: LNG,Dedicated
Syn-diesel,Rem GTL
Syn-diesel,Coal (CTL)
DME: Rem
C-H2, NG 4000km, Cen Ref,
ICE
C-H2, NG 4000km, Cen Ref,
FC
g CO2eq/ km
With CCS
Standard processes
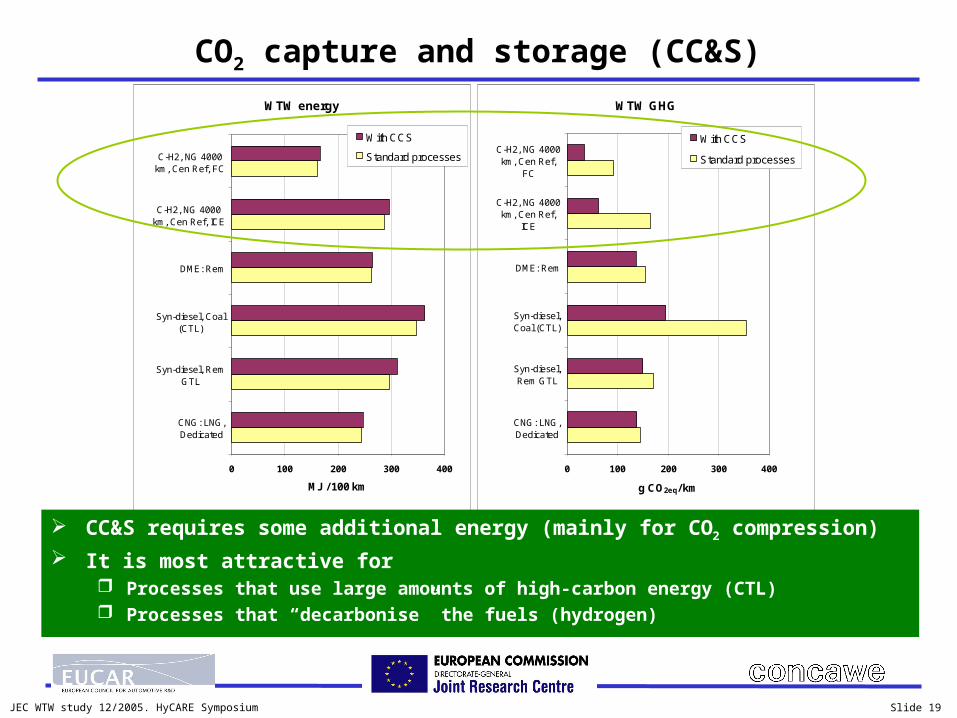
CO2 capture and storage (CC&S)
CC&S requires some additional energy (mainly for CO2 compression)
It is most attractive for Processes that use large amounts of high-carbon energy (CTL) Processes that “decarbonise” the fuels (hydrogen)

JEC WTW study 12/2005. HyCARE Symposium Slide 20
Cost of fossil fuels substitution and CO2 avoided
Some cost elements are dependent on scale (e.g. distribution infrastructure, number of alternative vehicles etc)
As a common calculation basis we assumed that 5% of the relevant vehicle fleet (SI, CI or both) converts to the alternative fuel This is not a forecast, simply a way of comparing each fuel option under
the same conditions If this portion of the EU transportation demand were to be replaced by
alternative fuels and powertrain technologies, the GHG savings vs. incremental costs would be as indicated
Costs of CO2 avoided are calculated from incremental capital and operating costs for fuel production and distribution, and for the vehicle
The costs, as calculated, are valid for a steady-state situation where 5% of the relevant conventional fuels have been replaced by an alternative. Additional costs are likely to be incurred during the transition period, especially where a new distribution infrastructure is required.

JEC WTW study 12/2005. HyCARE Symposium Slide 21
Costing basis
We considered the cost from a macro-economic point of view (cost to “EU inc.”) The cost of internationally traded commodities is the market price
whether imported or produced within Europe (unless the production cost in Europe is higher)
The 12% capital charge excludes the tax element (internal)
Cost elements considered For fuels produced within Europe
Raw material cost Production cost (capital charge + fixed operating costs + energy/chemicals
costs)
For imported fuels: market price Distribution and retail costs Additional cost of alternative vehicles (compared to state-of-the-art
gasoline PISI)

JEC WTW study 12/2005. HyCARE Symposium Slide 22
Costing basis: oil price
Oil price is important because It sets the cost of fossil fuels It influences the cost of virtually all other materials and services
We have considered two oil price scenarios 25 €/bbl (30 $/bbl) 50 €/bbl (60 $/bbl)
All other cost elements are adjusted according to an “Oil Cost Factor” (OCF) representing the fraction of the cost element that will follow the oil price
JEC WTW study 12/2005. HyCARE Symposium Slide 23
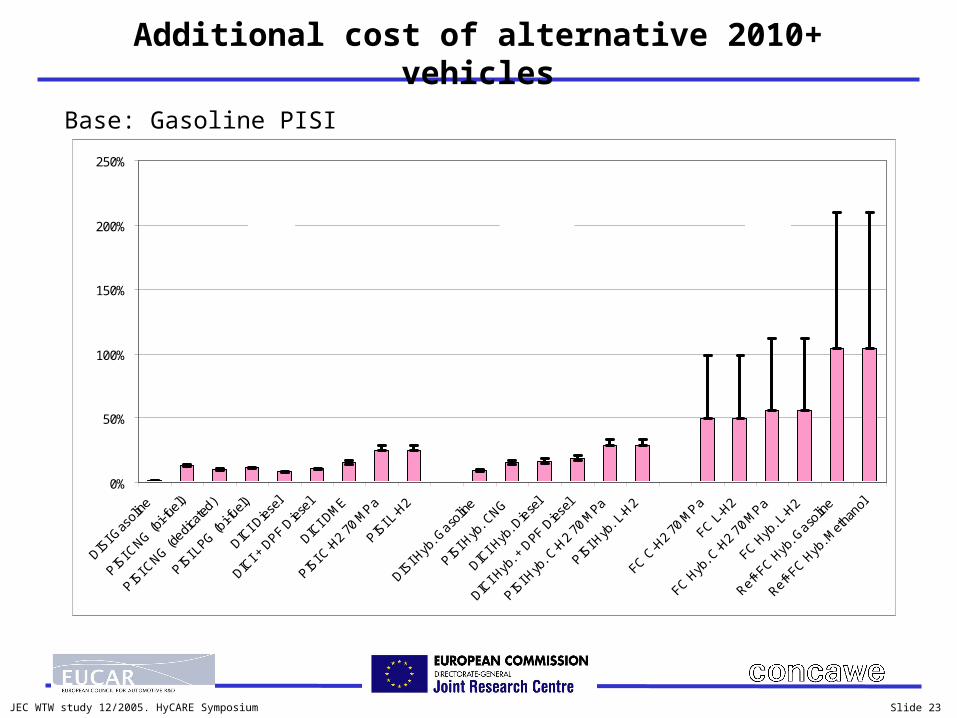
Additional cost of alternative 2010+ vehicles
Base: Gasoline PISI
0%
50%
100%
150%
200%
250%
DISI G
asoli
ne
PISI C
NG (bi-f
uel)
PISI C
NG (dedic
ated
)
PISI L
PG (bi-fu
el)
DICI D
iesel
DICI +
DPF D
iesel
DICI D
ME
PISI C
-H2 70
MPa
PISI L
-H2
DISI H
yb. G
asolin
e
PISI H
yb. C
NG
DICI H
yb. D
iese
l
DICI H
yb. +
DPF D
iesel
PISI H
yb. C
-H2
70 M
Pa
PISI H
yb. L
-H2
FC C-H
2 70
MPa
FC L-H
2
FC Hyb
. C-H
2 70 M
Pa
FC Hyb
. L-H
2
Ref+FC H
yb. G
asolin
e
Ref+FC H
yb. M
etha
nol
ICEs FCsHybrids
JEC WTW study 12/2005. HyCARE Symposium Slide 24
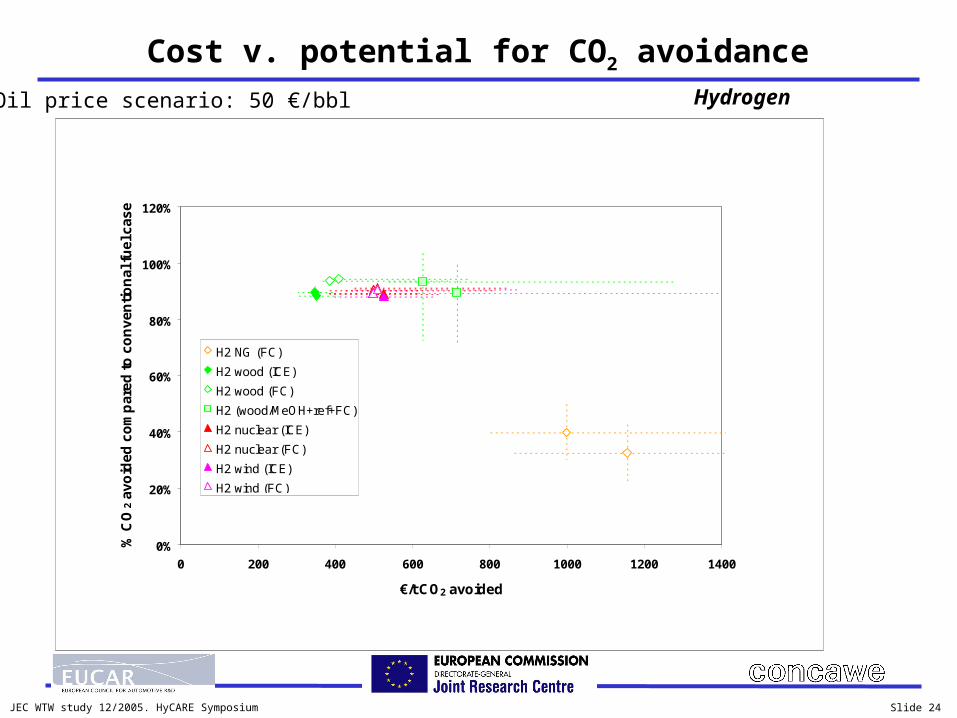
Cost v. potential for CO2 avoidance
Oil price scenario: 50 €/bbl Hydrogen
0%
20%
40%
60%
80%
100%
120%
0 200 400 600 800 1000 1200 1400
€/t CO2 avoided
% C
O2
av
oid
ed
co
mp
are
d t
o c
on
ve
nti
on
al f
ue
l ca
se
H2 NG (FC)
H2 wood (ICE)
H2 wood (FC)
H2 (wood/MeOH+ref+FC)
H2 nuclear (ICE)
H2 nuclear (FC)
H2 wind (ICE)
H2 wind (FC)

JEC WTW study 12/2005. HyCARE Symposium Slide 25
Cost of CO2 avoidance v. cost of substitutionOil price scenario: 50 €/bbl Hydrogen
0
500
1000
1500
2000
2500
3000
0 200 400 600 800 1000 1200 1400
€/t CO2 avoided
€ s
pe
nt
/ t f
os
sil f
ue
l su
bst
itu
ted
H2 NG (FC)
H2 wood (ICE)
H2 wood (FC)
H2 (wood/MeOH+ref+FC)
H2 nuclear (ICE)
H2 nuclear (FC)
H2 wind (ICE)
H2 wind (FC)

JEC WTW study 12/2005. HyCARE Symposium Slide 26
Cost of substitution v. CO2 avoidanceOil price scenario: 50 €/bbl Hydrogen
0
1000
2000
3000
4000
5000
6000
-500% -400% -300% -200% -100% 0% 100% 200%
% CO2 avoided compared to conventional fuel case
€ s
pe
nt
/ t f
os
sil
fue
l su
bs
titu
ted
H2 NG (ICE)
H2 NG (FC)
H2 coal (ICE)
H2 coal (FC)
H2 wood (ICE)
H2 wood (FC)
H2 NG+ely (ICE)
H2 NG+ely (FC)
H2 coal+ely (ICE)
H2 coal+ely (FC)
H2 nuclear (ICE)
H2 nuclear (FC)
H2 wind (ICE)
H2 wind (FC)
H2 (Gasoline+ref+FC)
H2 (NG/MeOH+ref+FC)
H2 (Coal/MeOH+ref+FC)
H2 (wood/MeOH+ref+FC)

JEC WTW study 12/2005. HyCARE Symposium Slide 27
Hydrogen production potential from biomass
Max hydrogen scenario Woody biomass from all available land to hydrogen (used in a fuel cell vehicle) Surplus sugar beet and wheat straw to ethanol Organic waste to biogas
2012 projections including:Set-asidesSugar beet surplusAgricultural yield improvementsWheat straw surplusUnused wood wasteOrganic waste to biogas
But excludingCurrently not cultivated landPastures
0%
5%
10%
15%
20%
25%
Max hydrogen (ICE) Max hydrogen (FC)
Fraction of total road fuels marketreplaced (for constant distance driven)
Fraction of WTW fossil energy avoided
Diesel EU-25 road fuel marketin 2015: 297 Mt/a

JEC WTW study 12/2005. HyCARE Symposium Slide 28
HYDROGEN v. OTHER ALTERNATIVE FUELS

JEC WTW study 12/2005. HyCARE Symposium Slide 29
Conventional fuels from crude oil
Continued developments in engine and vehicle technologies will reduce energy use and GHG emissions Spark ignition engines have more potential for improvement than diesel Hybridization can provide further GHG and energy use benefits
100
120
140
160
180
200
220
150 170 190 210 230 250 270
WTW energy (MJ / 100 km)
WT
W G
HG
(g
CO
2e
q /
km)
Gasoline 2002
Gasoline2010 hyb.
Gasoline 2010
Conv. Diesel 2002
Conv. Diesel 2010
PISI
DISI
DPF
no DPF
Conv. Diesel 2010 hyb.

JEC WTW study 12/2005. HyCARE Symposium Slide 30
WTW GHG
0 50 100 150 200
Gasoline PISI
Conv. DieselDICI+DPF
CNG (4000 km) PISI
CNG PISI hyb.
C-H2 PISI
C-H2 PISI hyb.
C-H2 FC
C-H2 FC hyb.
g CO2eq / km
TTW
WTT
ICE
FC
WTW energy
0 100 200 300 400
Gasoline PISI
Conv. DieselDICI+DPF
CNG (4000 km)PISI
CNG PISI hyb.
C-H2 PISI
C-H2 PISI hyb.
C-H2 FC
C-H2 FC hyb.
MJ / 100 km
TTW
WTT
ICE
FC
Hydrogen v. CNG
If hydrogen is produced from NG, GHG emissions savings compared to direct use as CNG are only achieved with fuel cell vehicles
2010+ vehicles

JEC WTW study 12/2005. HyCARE Symposium Slide 31
WTW GHG
0 50 100 150 200 250
Gasoline
Pulp to animal feed
Pulp to heat
Conv. Boiler
NG GT+CHP
Lignite CHP
Straw CHP
Conv. Boiler
NG GT+CHP
Lignite CHP
Straw CHP
Wheat straw
Farmed wood
Sugar cane
g CO2eq / km
Sugar beet
Wheat
DDGS as animal feed
DDGS as fuel
TTW WTT
WTW fossil energy
-50 0 50 100 150 200 250
Gasoline
Pulp to animal feed
Pulp to heat
Conv. Boiler
NG GT+CHP
Lignite CHP
Straw CHP
Conv. Boiler
NG GT+CHP
Lignite CHP
Straw CHP
Wheat straw
Farmed wood
Sugar cane
MJfo / 100 km
Sugar beet
Wheat
TTW WTT
DDGS as animal feed
DDGS as fuel
Ethanol
All figures for
2010+ PISI vehicles
Conventional production of ethanol as practiced in Europe gives modest fossil energy/GHG savings compared with gasoline Existing European pathways can be improved by use of co-generation and/or use of by-
products for heat Choice of crop and field N2O emissions play a critical part Advanced processes (from wood or straw) can give much higher savings

JEC WTW study 12/2005. HyCARE Symposium Slide 32
WTW GHG
0 50 100 150 200
Conv. Diesel
RME: glycerineas chemical
RME: glycerineas animal feed
REE: glycerineas chemical
REE: glycerineas animal feed
SME: glycerineas chemical
SME: glycerineas animal feed
g CO2eq / km
TTW WTT
WTW fossil energy
0 50 100 150 200 250
Conv. Diesel
RME: glycerine aschemical
RME: glycerine asanimal feed
REE: glycerine aschemical
REE: glycerine asanimal feed
SME: glycerine aschemical
SME: glycerine asanimal feed
MJfo / 100 km
TTW WTT
Bio-diesel
Bio-diesel saves fossil energy and GHG compared to conventional diesel Field N2O emissions play a big part in the GHG balance and are responsible for the large
uncertainty Use of glycerine has a relatively small impact Sunflower is more favourable than rape
All figures for
2010+ DICI+DPF vehicle
JEC WTW study 12/2005. HyCARE Symposium Slide 33
WTW GHG
0 100 200 300 400
Conv. diesel DICI+DPF
CNG bi-fuel (LNG)
NG Remote (GTL)
Coal (CTL)
Farmed wood (BTL)
Waste wood via BL (BTL)
Remote NG
Coal
Farmed wood
Waste wood via BL
g CO2eq / km
Syn-dieselDICI+DPF
DMEDICI
WTW energy
0 100 200 300 400 500
Conv. diesel DICI+DPF
CNG bi-fuel (LNG)
NG Remote (GTL)
Coal (CTL)
Farmed wood (BTL)
Waste wood via BL (BTL)
Remote NG
Coal
Farmed wood
Waste wood via BL
MJ / 100 km
TTW
WTT
Syn-dieselDICI+DPF
DMEDICI
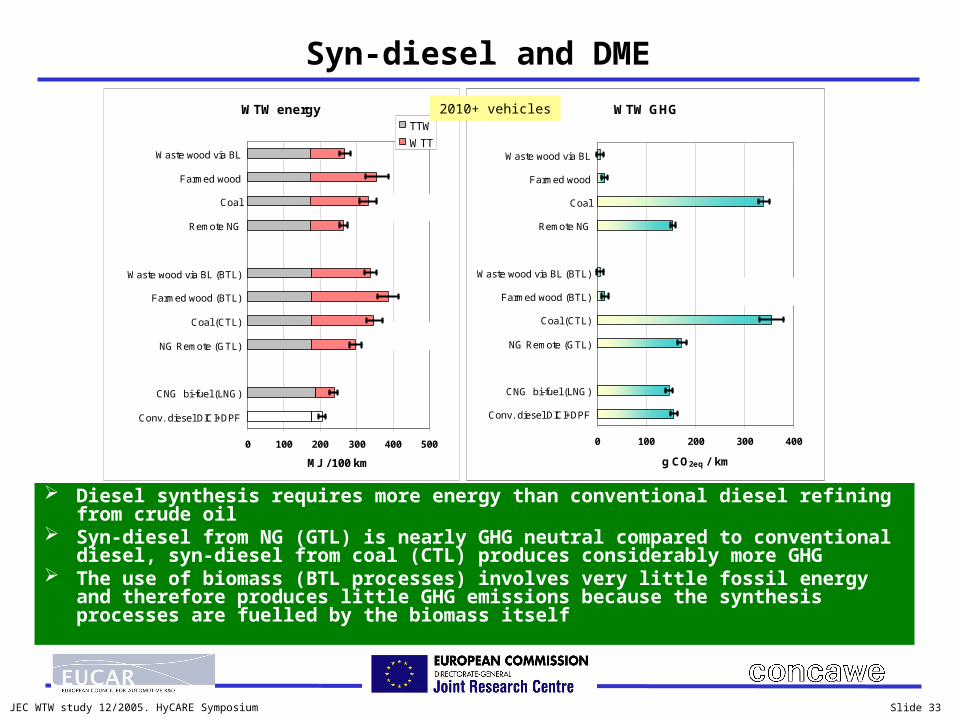
Syn-diesel and DME
Diesel synthesis requires more energy than conventional diesel refining from crude oil
Syn-diesel from NG (GTL) is nearly GHG neutral compared to conventional diesel, syn-diesel from coal (CTL) produces considerably more GHG
The use of biomass (BTL processes) involves very little fossil energy and therefore produces little GHG emissions because the synthesis processes are fuelled by the biomass itself
2010+ vehicles
JEC WTW study 12/2005. HyCARE Symposium Slide 34
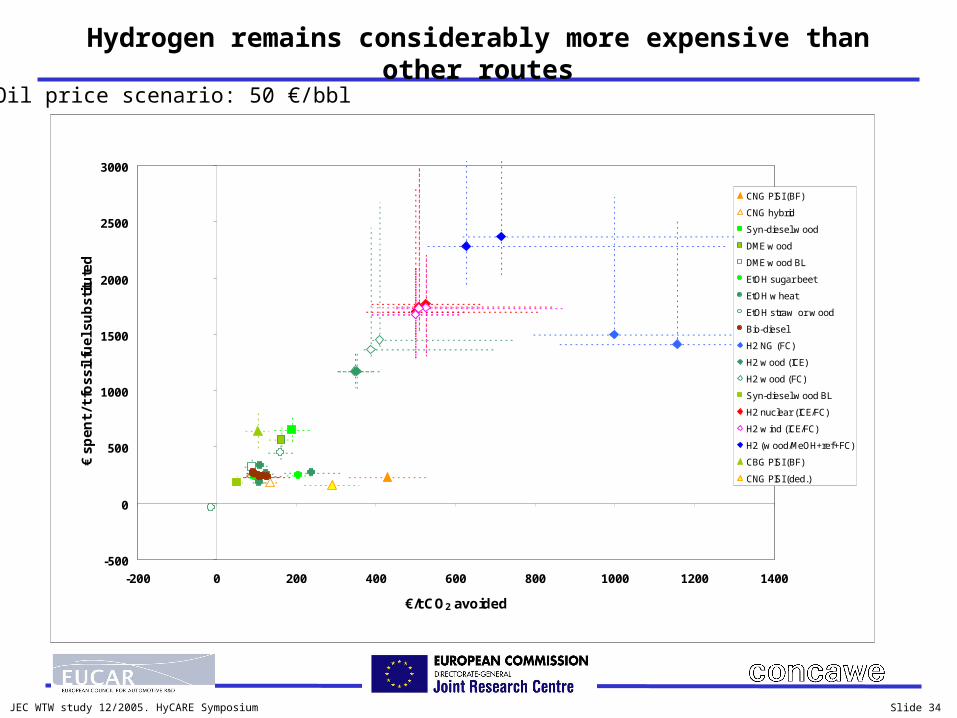
Hydrogen remains considerably more expensive than other routes
-500
0
500
1000
1500
2000
2500
3000
-200 0 200 400 600 800 1000 1200 1400
€/t CO2 avoided
€ s
pe
nt
/ t f
os
sil
fue
l su
bs
titu
ted
CNG PISI (BF)
CNG hybrid
Syn-diesel w ood
DME w ood
DME w ood BL
EtOH sugar beet
EtOH w heat
EtOH straw or w ood
Bio-diesel
H2 NG (FC)
H2 w ood (ICE)
H2 w ood (FC)
Syn-diesel w ood BL
H2 nuclear (ICE/FC)
H2 w ind (ICE/FC)
H2 (w ood/MeOH+ref+FC)
CBG PISI (BF)
CNG PISI (ded.)
Oil price scenario: 50 €/bbl

JEC WTW study 12/2005. HyCARE Symposium Slide 35
The potential of biomass in Europe: overview
2012 projections including:Set-asidesSugar beet surplusAgricultural yield improvementsWheat straw surplusUnused wood wasteOrganic waste to biogas
But excludingCurrently not cultivated landPastures
Conventional Biofuels: Wheat and sugar beet to ethanol, oilseeds to bio-diesel, wheat straw not used
All other scenarios: Surplus sugar beet and wheat straw to ethanolOrganic waste to biogas
Max ethanol: Woody biomass from all available land to ethanol
Max syn-diesel: Woody biomass from all available land to syn-dieselAlso produces naphtha
Max DME: Woody biomass from all available land to DME
Max Hydrogen: Woody biomass from all available land to hydrogen (used in a fuel cell vehicle)
0.0%
5.0%
10.0%
15.0%
20.0%
25.0%
ConventionalBiofuels
Max ethanol Max syn-diesel Max DME Max hydrogen(ICE)
Max hydrogen(FC)
Fraction of total road fuels market replaced (for constant distance driven)
Fraction of WTW fossil energy avoided
+ 1.8% for naphtha co-production

JEC WTW study 12/2005. HyCARE Symposium Slide 36
There are many ways of using gas
Potential for CO2 avoidance from 1 MJ remote gas (as LNG)
Substitution of marginal electricity is likely to be the most CO2 efficient
Only fuel cell vehicles can come close
-20 0 20 40 60 80
Electricity ex LNG (vsCoal, state-of-the-art)
CNG ex LNG
Syn-diesel (GTL)
CH2 ex LNG, on sitereforming, FC
C-H2 ex LNG, centralreforming, FC
C-H2 ex LNG, centralreforming, ICE
g CO2 avoided / MJ natural gas
Reference case:
2010 ICE with
conventional fuel

JEC WTW study 12/2005. HyCARE Symposium Slide 37
There are many ways of using wind power
Potential for CO2 avoidance from 1 MJ wind electricity
Substitution of marginal electricity is likely to be the most CO2 efficient
Only fuel cell vehicles can come close Issues related to energy storage must also be taken into account
0 50 100 150 200 250 300
Electricity (vs NG,CCGT)
Electricity (vs Coal,state-of-the-art)
C-H2, centralelectrolysis, FC
C-H2, centralelectrolysis, ICE
g CO2 avoided / MJ wind electricity
Reference case:
2010 ICE with
conventional fuel
JEC WTW study 12/2005. HyCARE Symposium Slide 38
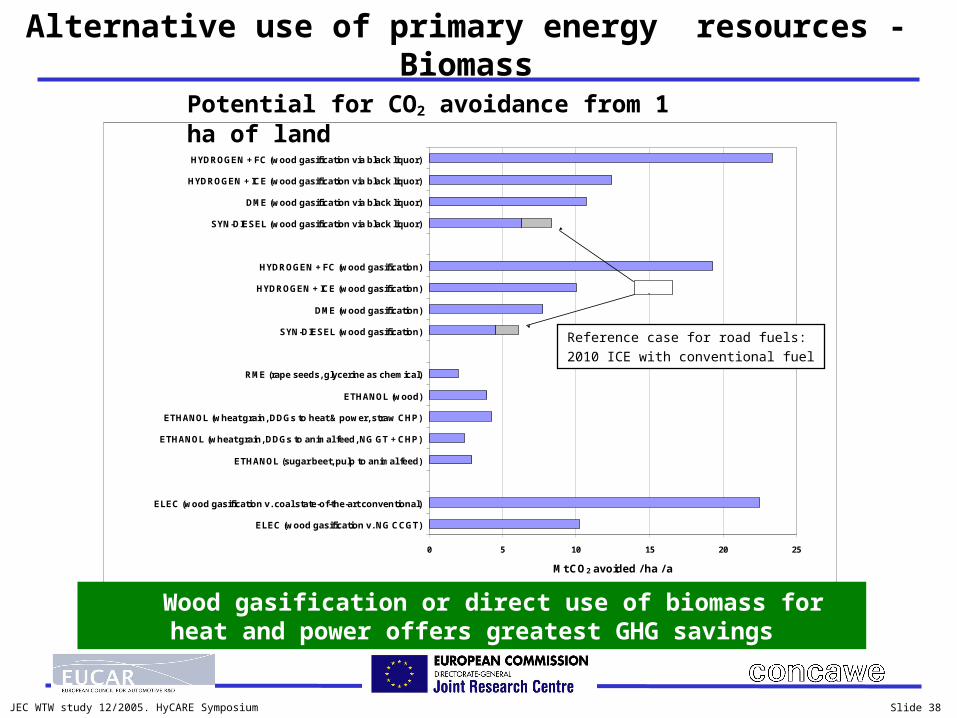
0 5 10 15 20 25
ELEC (wood gasification v. NG CCGT)
ELEC (wood gasification v. coal state-of-the-art conventional)
ETHANOL (sugar beet, pulp to animal feed)
ETHANOL (wheat grain, DDGs to animal feed, NG GT + CHP)
ETHANOL (wheat grain, DDGs to heat & power, straw CHP)
ETHANOL (wood)
RME (rape seeds, glycerine as chemical)
SYN-DIESEL (wood gasification)
DME (wood gasification)
HYDROGEN + ICE (wood gasification)
HYDROGEN + FC (wood gasification)
SYN-DIESEL (wood gasification via black liquor)
DME (wood gasification via black liquor)
HYDROGEN + ICE (wood gasification via black liquor)
HYDROGEN + FC (wood gasification via black liquor)
Mt CO2 avoided / ha / a
Naphtha
Alternative use of primary energy resources - Biomass
Wood gasification or direct use of biomass for heat and power offers greatest GHG savings
Potential for CO2 avoidance from 1 ha of land
Reference case for road fuels:
2010 ICE with conventional fuel
JEC WTW study 12/2005. HyCARE Symposium Slide 39
The study report will be available on the WEB:http://ies.jrc.cec.eu.int/WTW
For questions / inquiries / requests / notes
to the consortium,
please use the centralised mail address:
Well-to-Wheels analysis of future automotive fuels and powertrains
in the European context