Welcome to Root Cause Analysis & The Global 8D Problem...
27
Operational Excellence Consulting LLC – Frank G Adler, PhD – Managing Partner 1 October 2015 – v 3.0 Welcome to Root Cause Analysis & The Global 8D Problem Solving Process Quality Day Conference 2015: “Creating & Sustaining a Quality Culture” October 30, 2015 Frank G. Adler, Ph.D. Principal & Managing Partner Operational Excellence Consulting LLC [email protected] www.operational-excellence-consulting.com 2 October 2015 – v 3.0 Agenda & Key Learning Points: 1. Discuss the differences and synergy between Six Sigma, Lean Management and the 8D Problem Solving Process 2. Provide an overview of the 8D Problem Solving Process 3. Describe the purpose and objective of each phase of the 8D Problem Solving Process 4. Introduce the 8D Problem Solving Worksheet and some of the key problem-solving tools integrated into the 8D Problem Solving Process 5. Illustrate the 8D Problem Solving Process using a simple case study Agenda & Key Learning Points
-
Upload
nguyendieu -
Category
Documents
-
view
246 -
download
10
Transcript of Welcome to Root Cause Analysis & The Global 8D Problem...

Operational Excellence Consulting LLC – Frank G Adler, PhD – Managing Partner
1 October 2015 – v 3.0
Welcome to
Root Cause Analysis & The Global 8D Problem
Solving Process
Quality Day Conference 2015:
“Creating & Sustaining a Quality Culture”
October 30, 2015
Frank G. Adler, Ph.D.
Principal & Managing Partner
Operational Excellence Consulting LLC
www.operational-excellence-consulting.com
2 October 2015 – v 3.0
Agenda & Key Learning Points:
1. Discuss the differences and synergy between Six Sigma, Lean
Management and the 8D Problem Solving Process
2. Provide an overview of the 8D Problem Solving Process
3. Describe the purpose and objective of each phase of the 8D
Problem Solving Process
4. Introduce the 8D Problem Solving Worksheet and some of the
key problem-solving tools integrated into the 8D Problem
Solving Process
5. Illustrate the 8D Problem Solving Process using a simple case
study
Agenda & Key Learning Points

Operational Excellence Consulting LLC – Frank G Adler, PhD – Managing Partner
3 October 2015 – v 3.0
Six Sigma → Reducing Process Variability
Process
Inputs Process
Outputs
Customer
The Process
Step
1
Step
2
Step
3
Step
4
6M’s = MANPOWER
MEASURE
METHODS
MATERIALS
MACHINES
MOTHER NATURE
Y’s X’s
)x,...,x,x,f(x=Y k321
4 October 2015 – v 3.0
Six Sigma → The Roadmap to Reduce Variation
Improved Process
Define
Measure X1 X3 X7 X14…
X24 X32 X38
Analyze X3 X14…
X21 X24 X38
Improve X3 X14 X16 X38
Control
X1 X2 X3 X4 X5 X6 X7… X37 X38 X39 X40
X3 X14 X38
1st “Hit List”
10 - 15 X’s
Screened List 8 - 10 X’s
Found Critical Xs
4 - 8 X’s
Controlling Critical Xs
3 - 5 X’s
All Xs • Process Variables Maps
• Cause &Effects Matrix
• Capability Study
• MSA
• Process FMEA
• Multi-Vari Studies
• Hypothesis Testing
• Design of Experiments (DOE)
• Mistake Proofing
• Control Plans
• Project Charter
Project Ys
Operational Excellence Consulting LLC – Frank G Adler, PhD – Managing Partner
5 October 2015 – v 3.0
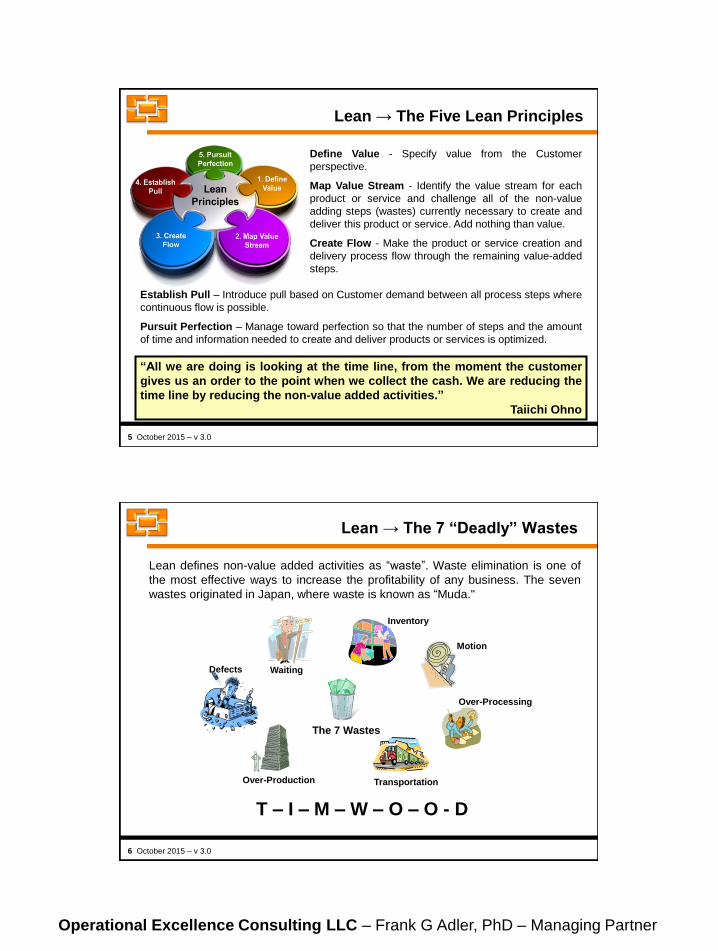
Lean → The Five Lean Principles
Define Value - Specify value from the Customer
perspective.
Map Value Stream - Identify the value stream for each
product or service and challenge all of the non-value
adding steps (wastes) currently necessary to create and
deliver this product or service. Add nothing than value.
Create Flow - Make the product or service creation and
delivery process flow through the remaining value-added
steps.
Establish Pull – Introduce pull based on Customer demand between all process steps where
continuous flow is possible.
Pursuit Perfection – Manage toward perfection so that the number of steps and the amount
of time and information needed to create and deliver products or services is optimized.
“All we are doing is looking at the time line, from the moment the customer
gives us an order to the point when we collect the cash. We are reducing the
time line by reducing the non-value added activities.”
Taiichi Ohno
6 October 2015 – v 3.0
Lean → The 7 “Deadly” Wastes
Lean defines non-value added activities as “waste”. Waste elimination is one of
the most effective ways to increase the profitability of any business. The seven
wastes originated in Japan, where waste is known as “Muda."
T – I – M – W – O – O - D
Inventory
Over-Processing
Waiting
Transportation
Defects
Motion
Over-Production
The 7 Wastes

Operational Excellence Consulting LLC – Frank G Adler, PhD – Managing Partner
7 October 2015 – v 3.0
Lean → The Roadmap to Reduce Lead Time
Improved Process
Define
Measure
X1 X3 X7 X14… X24 X32 X38
Analyze
X3 X14… X21 X24 X38
Improve X3 X14 X16 X38
Control
X1 X2 X3 X4 X5 X6 X7… X37 X38 X39 X40
X3 X14 X38
1st “Hit List”
Screened List
Found Critical Xs
Controlling Critical Xs
All Xs
• Value Stream Map
• MSA
• Spaghetti Diagram
• Waste Walk
• Ohno Circle
• 5S Visual Workplace
• Quick Changeover (SMED)
• Kanban & Pull Systems
• Mistake-Proofing & Poka-Yoke
• Standardized Work
• Control Plans
• Project Charter
Project Ys
8 October 2015 – v 3.0
“Change-Induced” vs. “Day-One-Deviation”
Change
Performance SHOULD
Past Present
DE
VIA
TIO
N
Performance ACTUAL
Performance SHOULD
Present
DE
VIA
TIO
N
Day One
When the process performance once met the SHOULD and no longer does, then you have a “Change-Induced” problem.
When a condition required for achieving the SHOULD never existed, then you have a “Day-One-Deviation” problem.
8D Problem Solving Process Lean or Six Sigma DMAIC Process
Special Cause Variation Common Cause Variation

Operational Excellence Consulting LLC – Frank G Adler, PhD – Managing Partner
9 October 2015 – v 3.0
Problem Solving Process - The Terminology
Symptom – A quantifiable event or effect, experienced by a Customer
(internal & external), that may indicate the existence of one or more
problems.
Problem – A deviation from an expectation or standard; a perceived
gap between the existing state and a desired state. In the context of the
8D Problem Solving Process the cause(s) of the problem is not known.
Possible Cause – Any cause, identified for example through Process
Variables Mapping, Brainstorming or a Fishbone Diagram, that describes
how a Problem or Failure Mode effect may occur.
Most Likely Cause – A cause, identified based on available or collected
data, that best explains the Problem Description or Failure Mode.
Root Cause – A verified cause that convincingly supports and explains
ALL facts available and thus accounts for the problem. Root causes are
the fundamental, underlying reasons for a Problem or Failure Mode.
10 October 2015 – v 3.0
The 8D Problem Solving Process
1 • Establish the Team
2 • Describe the Problem
3 • Develop Interim Containment Actions
4 • Define and Verify Root Cause(s) and Escape Point(s)
5 • Choose and Verify Permanent Corrective Actions
6 • Implement and Validate Permanent Corrective Actions
7 • Prevent Recurrence
8 • Recognize Team and Individual Contributions

Operational Excellence Consulting LLC – Frank G Adler, PhD – Managing Partner
11 October 2015 – v 3.0
Purpose: Establish a small group of people with the process and/or product
knowledge, allocated time, authority, and skills in the required technical
disciplines to solve the problem and implement corrective actions.
Review the problem or improvement opportunity
Review priorities, scope and complexity
Identify if a team is needed
Identify team members and establish the team
Nominate a team leader and project champion
Establish basic team guidelines
Consider team building exercises
“Establish the Team” Key Activities
12 October 2015 – v 3.0
The Problem Solving Team:
Are the people affected by the problem represented?
Does each person have a reason for being on the team?
Do the team members agree on membership?
Is the team large enough to include all necessary inputs, but small
enough to act effectively?
The Champion of the team has been identified?
The Team Leader has been identified?
Need for a Facilitator to coach the process has been
considered?
Have all the roles and responsibilities been reviewed
and are agreed upon?
“Phase D1” Checklist Questionnaire

Operational Excellence Consulting LLC – Frank G Adler, PhD – Managing Partner
13 October 2015 – v 3.0
The 8D Problem Solving Process
1 • Establish the Team
2 • Describe the Problem
3 • Develop Interim Containment Actions
4 • Define and Verify Root Cause(s) and Escape Point(s)
5 • Choose and Verify Permanent Corrective Actions
6 • Implement and Validate Permanent Corrective Actions
7 • Prevent Recurrence
8 • Recognize Team and Individual Contributions
14 October 2015 – v 3.0
Purpose: Describe the internal or external problem by identifying “what is wrong
with what” and detailing the problem in quantifiable terms.
Develop a Problem Statement (5 Whys)
Develop a Problem Description using the “IS – IS NOT Matrix”
Develop a flowchart of the process and identify critical process steps with
respect to the Problem Description
Develop a Fishbone Diagram or Process Variables Map to identify possible
causes?
Determine whether this problem describes a “something changed” or
a “day-one-deviation” situation
Establish a high-level project plan, including milestones,
project goals and objectives
“Describe the Problem” Key Activities

Operational Excellence Consulting LLC – Frank G Adler, PhD – Managing Partner
15 October 2015 – v 3.0
“If I had an hour to save the world I would spend 59 minutes defining
the problem and one minute finding solutions.”
Albert Einstein
16 October 2015 – v 3.0
Problem Solving Process - The Terminology
Symptom – A quantifiable event or effect, experienced by a Customer
(internal & external), that may indicate the existence of one or more
problems.
Problem – A deviation from an expectation or standard; a perceived
gap between the existing state and a desired state. In the context of the
8D Problem Solving Process the cause(s) of the problem is not known.
Possible Cause – Any cause, identified for example through Process
Variables Mapping, Brainstorming or a Fishbone Diagram, that describes
how a Problem or Failure Mode effect may occur.
Most Likely Cause – A cause, identified based on available or collected
data, that best explains the Problem Description or Failure Mode.
Root Cause – A verified cause that convincingly supports and explains
ALL facts available and thus accounts for the problem. Root causes are
the fundamental, underlying reasons for a Problem or Failure Mode.

Operational Excellence Consulting LLC – Frank G Adler, PhD – Managing Partner
17 October 2015 – v 3.0
There are two steps to develop a good Problem Statement.
The first step is used to identify the object and the defect and develop the
initial Problem Statement.
The object and the defect are defined by asking “What is wrong with what?”
“What is wrong?” is the defect
The defect is an unwanted characteristic present in a product or
process – broken, missing, wrong, too short, …
“… with what?” is the object
The object is the name given to a specific product, process or
service that exhibits the defect
The Problem Statement (Step 1)
18 October 2015 – v 3.0
The Problem Statement (Step 2)
Once the initial problem statement (object & defect) is established, the second step
is to use the “5 Why’s” and ask “Why would this situation occur?” or “Why is
that happening to that object?”
The objective is to refine the initial problem statement to
determine the problem, rather than the symptom of the problem
focus efforts on a single problem with a single root cause
get as near as possible to the root cause using existing knowledge &
information
check if the root cause of the problem is really unknown

Operational Excellence Consulting LLC – Frank G Adler, PhD – Managing Partner
19 October 2015 – v 3.0
Problem Statement & 5 Whys – Example
What is the Problem Statement (Object & Defect)?
WHY? → The tool was not in inventory.
WHY? → The supplier did not deliver the replacement tools.
WHY? → The supplier did not receive our purchase order on-time.
WHY? → We did not submit the purchase order on time.
We did not have the “right” rework tool.
WHY? → We don’t know.
Initial Problem
Statement
Final Problem
Statement
20 October 2015 – v 3.0
The Problem Description
The Problem Description defines the boundaries of the problem, in terms of what it is
and what it is not but could be.
Scientific description of any event can be made by providing information on
What the problem is and what it is not but could be? - Identity
IS - The long brackets are missing,
IS NOT - The short brackets are not missing (but could be)
Where the problem is and where it is not but could be? - Location
IS - The order entry defects are in direct ship orders
IS NOT - The order entry defects are not in stock orders (but could be)
When the problem occurs and when it does not but could? - Timing
IS - The clips started breaking in early 2010
IS NOT – The clips did not break before early 2010 (but could have)
How big the problem is and how big it is not but could be? - Size
IS - About 50% of the paychecks
IS NOT – Not all paychecks are incorrect (but could be)

Operational Excellence Consulting LLC – Frank G Adler, PhD – Managing Partner
21 October 2015 – v 3.0
The “IS – IS NOT” Matrix
8D PROBLEM SOLVING PROCESS WORKSHEET
Problem Statement (What is wrong with what?):
Red Felt Tip Marker Leaks
IS IS NOT DISTINCTIONS CHANGES TEST FOR MOST LIKELY CAUSES
(+) (-) (?)
Describe what does occur Describe what does not occur, but
could occur
What could explain the IS-IS NOT? (People, Methods, Material,
Machines, Environment)
What has changed in, on, around or about this distinction? When
did it change?
<Define Possible Root Cause Theory>
What?
Object:
Defect:
Where?
Where is the object when the defect is observed? Where is the defect on the object? Are there
any pattern or trends identifiable?
When?
When was the defect observed first? Can or was the defect be
observed before, during or after other events? When since has the
defect occurred? Are there any pattern or trends identifiable?
How Big?
How many objects have the defect? What is the size of a single defect? How many defects are on
each object? Are there any pattern or trends identifiable?
1
2
3
4
5
2
3
4
5
22 October 2015 – v 3.0
Problem Solving Process - The Terminology
Symptom – A quantifiable event or effect, experienced by a Customer
(internal & external), that may indicate the existence of one or more
problems.
Problem – A deviation from an expectation or standard; a perceived
gap between the existing state and a desired state. In the context of the
8D Problem Solving Process the cause(s) of the problem is not known.
Possible Cause – Any cause, identified for example through Process
Variables Mapping, Brainstorming or a Fishbone Diagram, that describes
how a Problem or Failure Mode effect may occur.
Most Likely Cause – A cause, identified based on available or collected
data, that best explains the Problem Description or Failure Mode.
Root Cause – A verified cause that convincingly supports and explains
ALL facts available and thus accounts for the problem. Root causes are
the fundamental, underlying reasons for a Problem or Failure Mode.

Operational Excellence Consulting LLC – Frank G Adler, PhD – Managing Partner
23 October 2015 – v 3.0
Identifying “All” Possible Causes
To learn more about a specific problem and to identify “all” possible
causes, the 8D Problem Solving Team needs to better understand the
process that causes the problem.
These tools work very well in a team environment to ensure that
everyone has a voice and every voice is being heard.
Select the Fishbone Diagram or Process Variables Map based on the
problem you need to solve and/or your personal or team’s preference.
The following tools are widely used to facilitate this activity.
Process Flowchart Map
and
Fishbone Diagram or Process Variables Map
24 October 2015 – v 3.0
The Fishbone Diagram, sometimes also called Cause-and-Effect Diagram or
Ishikawa Diagram, is another way of looking at the possible causes of a
problem. It organizes large numbers of potential causes into pre-defined
categories, e.g. 6Ms or 4 Ps, or team-defined categories.
Fishbone or Ishikawa Diagram
6M’s = MEN
MEASURE
METHODS
MATERIALS
MACHINES
+ MOTHER NATURE
4P’s = PLANT
POLICIES
PEOPLE
PROCEDURES
Machines
Materials Methods
MotherNature
Trunk
Primary Possible Cause Category
Main Branch
Minor Branch
Second-Level
Possible Causes
Men/People
Problem
Statement

Operational Excellence Consulting LLC – Frank G Adler, PhD – Managing Partner
25 October 2015 – v 3.0
Process Variables Map
Process Step Inputs & Characteristics (Xs) Type Process Step Process Step Outputs & Characteristics (Ys)
INPUTS Coffee Machine (clean) C "Clean" Coffee Machine
Think 6 M's Coffee Maker or Operator (experienced) U Coffee Machine plugged in Power Outlet
Man Power Outlet (functional) C
Machine
Material
Method
Measure
Mother Earth
Coffee Machine (clean) C Filter in Coffee Machine
Coffee Maker or Operator (experienced) U Water in Coffee Machine
Coffee Powder (right, fresh) C/U
Coffee Filter (right size, non-defective) C/U
Spoon (clean, right size) C
Instructions (correct) C
Coffee Machine (clean) C "Correct" Amount of Water in Coffee Machine
Coffee Maker or Operator (experienced) U
Coffee Pot (clean, non-broken) C
Water Faucet (functional) C
Water (clean, fresh) C/U
Instructions (correct) C
Process: Coffee Making Process
Preparing Coffee
Machine
(1. Checking for
Cleanliness
2. Checking that
machine is plugged into
power outlet)
Adding Water into
Coffee Machine
(1. Filling coffee pot with
water
2. Filling water into
coffee machine)
Adding Coffee into
Coffee Machine
(1. Getting coffee filter
2. Placing coffee filter
into coffee machine
3. Getting coffee powder
4. Adding coffee powder
into coffee filter)
26 October 2015 – v 3.0
1 • Establish the Team
2 • Describe the Problem
3 • Develop Interim Containment Actions
4 • Define and Verify Root Cause(s) and Escape Point(s)
5 • Choose and Verify Permanent Corrective Actions
6 • Implement and Validate Permanent Corrective Actions
7 • Prevent Recurrence
8 • Recognize Team and Individual Contributions
The 8D Problem Solving Process

Operational Excellence Consulting LLC – Frank G Adler, PhD – Managing Partner
27 October 2015 – v 3.0
“Develop Interim Containment Actions” Key Activities
Purpose: Define, verify and implement Interim Containment Action to isolate
the effects of the problem from any internal and/or external Customer until
Permanent Corrective (Preventive) Action are implemented.
Define potential Interim Containment Action
Verify effectiveness of potential Interim Containment Action
Select and implement Interim Containment Action
Validate effectiveness of implemented Interim
Containment Action with the Customer
28 October 2015 – v 3.0
Key Concepts of Interim Containment Actions
Typically chosen without much data or knowledge about the situation.
Temporary “fix” that works against the effect of the problem.
Protects the downstream process or the Customer from the effect of the
problem.
Contains the problem from a cost, quality, timing perspective.
“Buys time” to identify and resolve the root cause of the problem.
Needs normally to be documented.
Is not a “Band Aid”, which may be forgotten.
…

Operational Excellence Consulting LLC – Frank G Adler, PhD – Managing Partner
29 October 2015 – v 3.0
1 • Establish the Team
2 • Describe the Problem
3 • Develop Interim Containment Actions
4 • Define and Verify Root Cause(s) and Escape Point(s)
5 • Choose and Verify Permanent Corrective Actions
6 • Implement and Validate Permanent Corrective Actions
7 • Prevent Recurrence
8 • Recognize Team and Individual Contributions
The 8D Problem Solving Process
30 October 2015 – v 3.0
“Define and Verify Root Causes” Key Activities
Purpose: Isolate and verify the root cause by testing each root cause theory
against the Problem Description and test data. Isolate and verify the place in
the process where the effect of the root cause could have been detected and
contained but was not (escape point).
Establish any additional data collection plans needed to learn more about
the problem and/or possible causes.
Utilize the Fishbone Diagram or Process Variables Map created earlier to
identify the most likely cause(s).
Isolate and verify the most likely cause(s) by testing each Root Cause
Theory against the Problem Description and the
collected data.
Isolate and verify the place in the process where the
effect of the root cause could have been detected
and contained but was not (escape point).

Operational Excellence Consulting LLC – Frank G Adler, PhD – Managing Partner
31 October 2015 – v 3.0
“You’re neither right not wrong because people agree with you.
You’re right because your facts and your reasoning are right.“
Warren Buffett – Investor & Billionaire
32 October 2015 – v 3.0
Problem Solving Process - The Terminology
Symptom – A quantifiable event or effect, experienced by a Customer
(internal & external), that may indicate the existence of one or more
problems.
Problem – A deviation from an expectation or standard; a perceived
gap between the existing state and a desired state. In the context of the
8D Problem Solving Process the cause(s) of the problem is not known.
Possible Cause – Any cause, identified for example through Process
Variables Mapping, Brainstorming or a Fishbone Diagram, that describes
how a Problem or Failure Mode effect may occur.
Most Likely Cause – A cause, identified based on available or collected
data, that best explains the Problem Description or Failure Mode.
Root Cause – A verified cause that convincingly supports and explains
ALL facts available and thus accounts for the problem. Root causes are
the fundamental, underlying reasons for a Problem or Failure Mode.

Operational Excellence Consulting LLC – Frank G Adler, PhD – Managing Partner
33 October 2015 – v 3.0
Strategies to identify “Most Likely Causes”
Eliminating Possible Causes or identifying Most Likely Causes
through
Process Knowledge
Experience with similar Situations or Processes
Logbooks of past Events
Checks and Audits
5 Whys Analysis
Comparative Analysis (Distinctions & Changes)
Correlation Analysis (Box Plots & Scatter Plots & …)
Process Failure Mode and Effects Analysis
…
Possible Causes Most Likely Causes
34 October 2015 – v 3.0
Comparative Analysis
8D PROBLEM SOLVING PROCESS WORKSHEET
Problem Statement (What is wrong with what?):
Red Felt Tip Marker Leaks
IS IS NOT DISTINCTIONS CHANGES TEST FOR MOST LIKELY CAUSES
(+) (-) (?)
Describe what does occur Describe what does not occur, but
could occur
What could explain the IS-IS NOT? (People, Methods, Material,
Machines, Environment)
What has changed in, on, around or about this distinction?
When did it change?
<Define Possible Root Cause Theory>
What? Object: Red felt tip marker Blue, black or green marker
Defect: Leaks Totally dry
Where? Tip Barrel (side or base)
Where is the object when the defect is observed? Where is the defect on the object? Are there
any pattern or trends identifiable?
… …
When? First seen two weeks ago Before two weeks ago
When was the defect observed first? Can or was the defect be
observed before, during or after other events? When since has the defect occurred? Are there
any pattern or trends identifiable?
… …
How Big? All red felt tip markers (100%)
Just some red felt tip markers (less than 100%)
How many objects have the defect? What is the size of a
single defect? How many defects are on each object? Are
there any pattern or trends identifiable?
… …
1
1
1
1
2
2
2
2

Operational Excellence Consulting LLC – Frank G Adler, PhD – Managing Partner
35 October 2015 – v 3.0
Comparative Analysis
The Comparative Analysis is the third part of the 8D Problem Solving
Process Worksheet.
The Comparative Analysis connects the facts from the Problem Description
(“IS – IS NOT” Matrix) with the analysis of possible and most likely causes
using the Process Flowchart and the C&E Matrix or Why-Why Diagram or
Fishbone Diagram, as well as any other information and data available.
Step 1: Compare each “IS” with its corresponding/contrasting “IS NOT”. List
any known distinctions and uncommon factors that could explain the “IS”
and “IS NOT”.
Ask: What is unique, odd, different, distinctive, unusual about the “IS”?
Consider the most likely causes identified so far.
Step 2: List all known changes in distinctions and uncommon factors.
Ask: What has changed in, on, around or about this distinction and
uncommon factors?
36 October 2015 – v 3.0
Problem Solving Process - The Terminology
Symptom – A quantifiable event or effect, experienced by a Customer
(internal & external), that may indicate the existence of one or more
problems.
Problem – A deviation from an expectation or standard; a perceived
gap between the existing state and a desired state. In the context of the
8D Problem Solving Process the cause(s) of the problem is not known.
Possible Cause – Any cause, identified for example through Process
Variables Mapping, Brainstorming or a Fishbone Diagram, that describes
how a Problem or Failure Mode effect may occur.
Most Likely Cause – A cause, identified based on available or collected
data, that best explains the Problem Description or Failure Mode.
Root Cause – A verified cause that convincingly supports and explains
ALL facts available and thus accounts for the problem. Root causes are
the fundamental, underlying reasons for a Problem or Failure Mode.
Operational Excellence Consulting LLC – Frank G Adler, PhD – Managing Partner
37 October 2015 – v 3.0
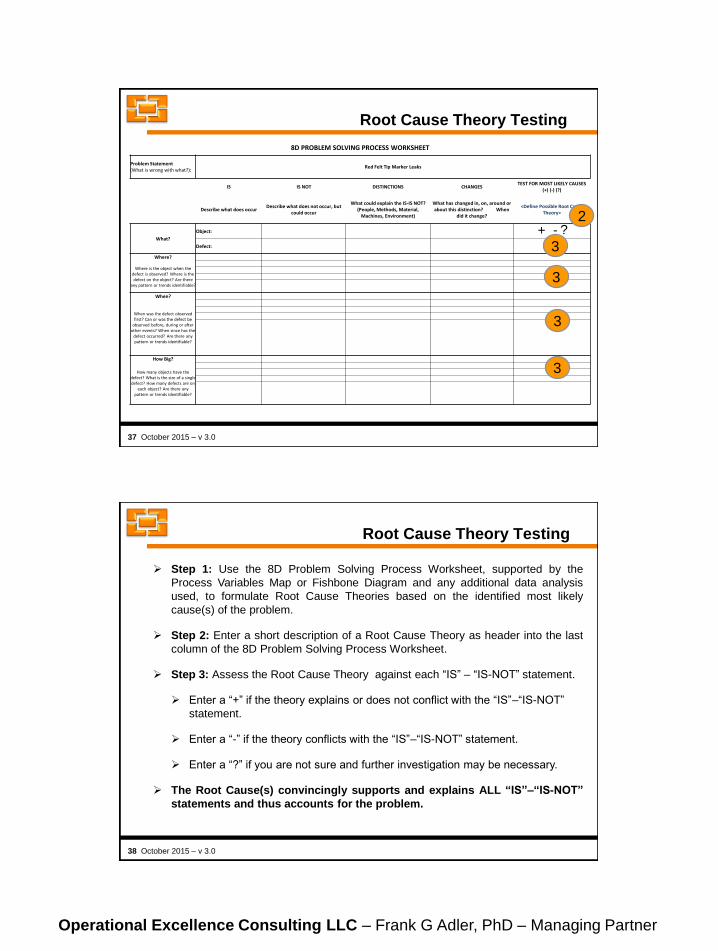
Root Cause Theory Testing
8D PROBLEM SOLVING PROCESS WORKSHEET
Problem Statement (What is wrong with what?):
Red Felt Tip Marker Leaks
IS IS NOT DISTINCTIONS CHANGES TEST FOR MOST LIKELY CAUSES
(+) (-) (?)
Describe what does occur Describe what does not occur, but
could occur
What could explain the IS-IS NOT? (People, Methods, Material,
Machines, Environment)
What has changed in, on, around or about this distinction? When
did it change?
<Define Possible Root Cause Theory>
What?
Object:
Defect:
Where?
Where is the object when the defect is observed? Where is the defect on the object? Are there
any pattern or trends identifiable?
When?
When was the defect observed first? Can or was the defect be
observed before, during or after other events? When since has the
defect occurred? Are there any pattern or trends identifiable?
How Big?
How many objects have the defect? What is the size of a single defect? How many defects are on
each object? Are there any pattern or trends identifiable?
2
3
3
3
3 + - ?
38 October 2015 – v 3.0
Root Cause Theory Testing
Step 1: Use the 8D Problem Solving Process Worksheet, supported by the
Process Variables Map or Fishbone Diagram and any additional data analysis
used, to formulate Root Cause Theories based on the identified most likely
cause(s) of the problem.
Step 2: Enter a short description of a Root Cause Theory as header into the last
column of the 8D Problem Solving Process Worksheet.
Step 3: Assess the Root Cause Theory against each “IS” – “IS-NOT” statement.
Enter a “+” if the theory explains or does not conflict with the “IS”–“IS-NOT”
statement.
Enter a “-” if the theory conflicts with the “IS”–“IS-NOT” statement.
Enter a “?” if you are not sure and further investigation may be necessary.
The Root Cause(s) convincingly supports and explains ALL “IS”–“IS-NOT”
statements and thus accounts for the problem.

Operational Excellence Consulting LLC – Frank G Adler, PhD – Managing Partner
39 October 2015 – v 3.0
Root Cause Verification
Active Verification is a process where …
… the problem solver uses the variable thought to be the root cause to
make the effect come and go. Both coming and going are important tests
to confirm root causes.
Passive Verification is done by observation.
With passive verification, you look for the presence of the root cause
without changing anything. If you cannot prove the presence of the root
cause, then chances are great that this most likely cause is not the root
cause.
Step 1: Identify, document and perform a passive and/or active
root cause verification method.
Step 2: Continue with the 8D Problem Solving Process if the
passive and/or active root cause verification was successful.
Otherwise, develop and test additional Root Cause Theories.
40 October 2015 – v 3.0
Escape Point Identification
Step 1: Using the Process Flowchart, identify Escape Point(s)
for the verified root cause(s).
Step 2: Determine if Control Points were missing or ineffective
to detect the root cause of the problem at the escape point.
Control System: A control system is a system deployed to monitor the product
or process and ensure compliance to Customer requirements. It consists of
responsibilities, procedures and resources. You may have one or more control
points where the product or process is checked.
Control Point: A control point is a location within the control system where the
product or process is checked for compliance to certain specified require-
ments. There may be multiple locations within a control system.
Escape Point: The escape point is the earliest location in the process, closest
to the root cause, where the problem could have been detected, but was not.

Operational Excellence Consulting LLC – Frank G Adler, PhD – Managing Partner
41 October 2015 – v 3.0
1 • Establish the Team
2 • Describe the Problem
3 • Develop Interim Containment Actions
4 • Define and Verify Root Cause(s) and Escape Point(s)
5 • Choose and Verify Permanent Corrective Actions
6 • Implement and Validate Permanent Corrective Actions
7 • Prevent Recurrence
8 • Recognize Team and Individual Contributions
The 8D Problem Solving Process
42 October 2015 – v 3.0
“Choose Permanent Corrective Actions” Key Activities
Purpose: Select the best Permanent Corrective Actions to remove the root
cause and to address the escape point in the process. Verify that both
decisions will be successful when implemented and not cause any undesirable
effects.
Develop solution(s) to remove the root cause(s)
Develop solution(s) to address the escape point(s)
Select the best solution(s) to remove the root cause(s)
Select the best solution(s) to address the escape point(s)
Verify that effectiveness of the selected solutions
Verify that selected solutions do not cause any
undesirable effects

Operational Excellence Consulting LLC – Frank G Adler, PhD – Managing Partner
43 October 2015 – v 3.0
Sixteen Human Error Modes
1. Omission
2. Excessive / insufficient repetition
3. Wrong order
4. Early / late execution
5. Execution of restricted work
6. Incorrect selection
7. Incorrect counting
8. Misrecognition
9. Failing to sense danger
10. Incorrect holding
11. Incorrect positioning
12. Incorrect orientation
13. Incorrect motion
14. Improper holding
15. Inaccurate motion
16. Insufficient avoidance
44 October 2015 – v 3.0
Six Mistake Proofing Principles
1. Elimination seeks to eliminate an error-prone process step by
redesigning the product or process so that the task or part is no longer
necessary.
Example: An example of elimination is the use of ambient-
light sensors to turn outside lighting on and off.
2. Prevention modifies the product or process so that it is impossible to
make a mistake or that a mistake becomes a defect.
Example: An example would be the change from a rectangular to a
round manhole.

Operational Excellence Consulting LLC – Frank G Adler, PhD – Managing Partner
45 October 2015 – v 3.0
Six Mistake Proofing Principles
3. Replacement substitutes a more reliable process to improve
repeatability. This includes use of robotics or automation that prevents
a manual assembly error.
Example: An example would be the coin dispenser in food
stores preventing that customers are getting short changed.
4. Facilitation is the most used principle and employs techniques and
combining steps to make a process step easier to perform or less error-
prone. This includes visual controls including color coding, marking or
labeling parts; checklists that list all tasks that need to be performed;
exaggerated asymmetry to facilitate correct orientation of parts.
Example: An example would be to color code parts that are similar in
shape or the use of a slipping-type torque wrench to prevent over
tightening.
46 October 2015 – v 3.0
Six Mistake Proofing Principles
5. Detection involves identifying a mistake before further processing
occurs so that the operator can quickly correct the defect.
Example: Examples would include a weld counter to ensure the correct
number of welds or a software modification that will not allow incorrect
entries.
6. Mitigation seeks to minimize the effects of the mistake. This includes
mechanisms that reduce the impact of a error and defect; products
designed with low-cost, simple rework procedures when an error is
discovered; extra design margin or redundancy in products to
compensate for the effects of errors.
Example: An example would be a smoke or heat detector
detecting a hazardous situation.

Operational Excellence Consulting LLC – Frank G Adler, PhD – Managing Partner
47 October 2015 – v 3.0
1 • Establish the Team
2 • Describe the Problem
3 • Develop Interim Containment Actions
4 • Define and Verify Root Cause(s) and Escape Point(s)
5 • Choose and Verify Permanent Corrective Actions
6 • Implement and Validate Permanent Corrective Actions
7 • Prevent Recurrence
8 • Recognize Team and Individual Contributions
The 8D Problem Solving Process
48 October 2015 – v 3.0
Purpose: Plan and implement selected Permanent Corrective Actions,
remove the Interim Containment Action. Monitor long-term results.
Implement the best solution(s) to remove the root cause(s)
Implement the best solution(s) to address the escape point(s)
Validate the effectiveness of the implemented solutions from the
Customer perspective
Monitor the effectiveness of the implemented solutions and assure that
they do not cause any undesirable effects
Remove Interim Containment Action
“Implement Corrective Actions” Key Activities

Operational Excellence Consulting LLC – Frank G Adler, PhD – Managing Partner
49 October 2015 – v 3.0
1 • Establish the Team
2 • Describe the Problem
3 • Develop Interim Containment Actions
4 • Define and Verify Root Cause(s) and Escape Point(s)
5 • Choose and Verify Permanent Corrective Actions
6 • Implement and Validate Permanent Corrective Actions
7 • Prevent Recurrence
8 • Recognize Team and Individual Contributions
The 8D Problem Solving Process
50 October 2015 – v 3.0
Purpose: Modify the necessary systems, including policies, methods,
and procedures, to prevent recurrence of the problem and similar ones.
Identify opportunities to improve and standardize systems, policies,
methods and procedures for the present problem
Identify opportunities to improve and standardize systems, policies,
methods and procedures for similar problems
“Prevent Recurrence” Key Activities

Operational Excellence Consulting LLC – Frank G Adler, PhD – Managing Partner
51 October 2015 – v 3.0
Process Control Plan – Objective
A Control Plan is a written statement of an organization’s quality planning
actions for a specific process, product, or service.
The Objective of an effective Process Control Plan is to
operate processes consistently on target with minimum variation,
which results in minimum waste and rework
assure that product and process improvements that have been
identified and implemented become institutionalized
provide for adequate training in all standard operating procedures,
work instructions and tools
Customer
Requirements
Product & Part
Characteristics
Process
Input & Output
Characteristics
Process
Controls
Process
Control
Plan
52 October 2015 – v 3.0
1 • Establish the Team
2 • Describe the Problem
3 • Develop Interim Containment Actions
4 • Define and Verify Root Cause(s) and Escape Point(s)
5 • Choose and Verify Permanent Corrective Actions
6 • Implement and Validate Permanent Corrective Actions
7 • Prevent Recurrence
8 • Recognize Team and Individual Contributions
The 8D Problem Solving Process

Operational Excellence Consulting LLC – Frank G Adler, PhD – Managing Partner
53 October 2015 – v 3.0
“Recognize the Team” Key Activities
Purpose: Complete the team experience and sincerely recognize both team
and individual contributions. Celebrate success and identify lessons learned.
Perform a final review of the problem solving project
Finalize and archive project documentation
Recognize the team’s success and individual contributions
Capture lessons learned and integrate findings into the 8D Problem
Solving Process
Reward and celebrate
54 October 2015 – v 3.0
“The rate at which organizations learn may soon become the only sustainable source of competitive advantage.
Peter Senge
Frank G Adler, Ph.D.
Principal & Managing Partner
Operational Excellence Consulting LLC
Phone: + 1 (888) 372 - 8705
Email: [email protected]
Website: www.operational-excellence-consulting.com
OPERATIONAL EXCELLENCE
C O N S U L T I N G