8D for planning
117
Watch th This product is copyrighted a However, feel free to distribut professionals. Every effort has b of any calculations, however no as to its accuracy. If you have su feel free to cont
-
Upload
dranilshinde -
Category
Documents
-
view
251 -
download
0
Transcript of 8D for planning

Watch the Video
This product is copyrighted and protected by federal law. However, feel free to distribute or share with other Six Sigma
professionals. Every effort has been made to ensure the accuracy of any calculations, however no guarantee is expressed or implied as to its accuracy. If you have suggestions for improvement please
feel free to contact 6ixSigma.org
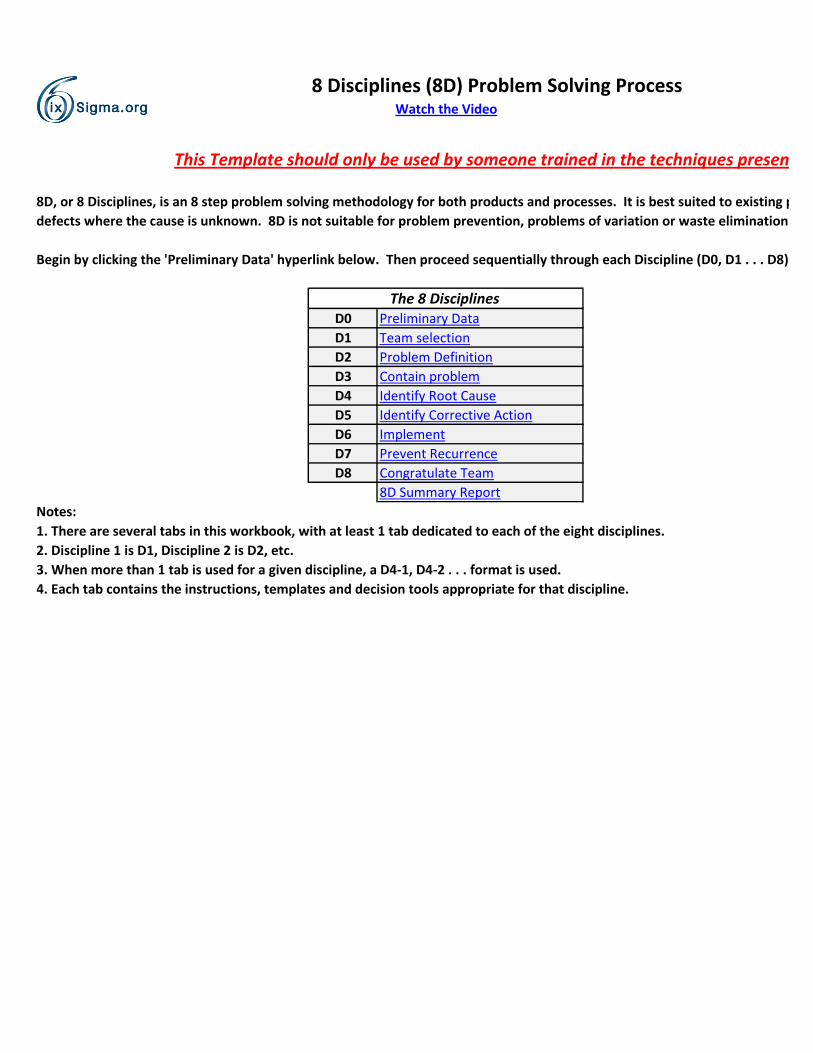
8 Disciplines (8D) Problem Solving Process
This Template should only be used by someone trained in the techniques presented herein
Begin by clicking the 'Preliminary Data' hyperlink below. Then proceed sequentially through each Discipline (D0, D1 . . . D8)
D0
D1
D2
D3
D4
D5
D6
D7
D8
Notes:
1. There are several tabs in this workbook, with at least 1 tab dedicated to each of the eight disciplines.
2. Discipline 1 is D1, Discipline 2 is D2, etc.
3. When more than 1 tab is used for a given discipline, a D4-1, D4-2 . . . format is used.
4. Each tab contains the instructions, templates and decision tools appropriate for that discipline.
Watch the Video
8D Summary Report
8D, or 8 Disciplines, is an 8 step problem solving methodology for both products and processes. It is best suited to existing problems involving
defects where the cause is unknown. 8D is not suitable for problem prevention, problems of variation or waste elimination.
Implement
Prevent Recurrence
Congratulate Team
The 8 Disciplines
Identify Corrective Action
Preliminary Data
Team selection
Problem Definition
Contain problem
Identify Root Cause

This Template should only be used by someone trained in the techniques presented herein
Begin by clicking the 'Preliminary Data' hyperlink below. Then proceed sequentially through each Discipline (D0, D1 . . . D8)
8D, or 8 Disciplines, is an 8 step problem solving methodology for both products and processes. It is best suited to existing problems involving
defects where the cause is unknown. 8D is not suitable for problem prevention, problems of variation or waste elimination.

8D Instructions
Next >>>
Lot or Batch Number:
Failure Rate:
Product Name:
D0 - Preliminary Data
Customer:
Date of Failure:
Part Number or Description of Failed Item:
Customer Address:
Tracking Number:
Time of Failure:
Watch the Video
8D Instructions
Next >>>
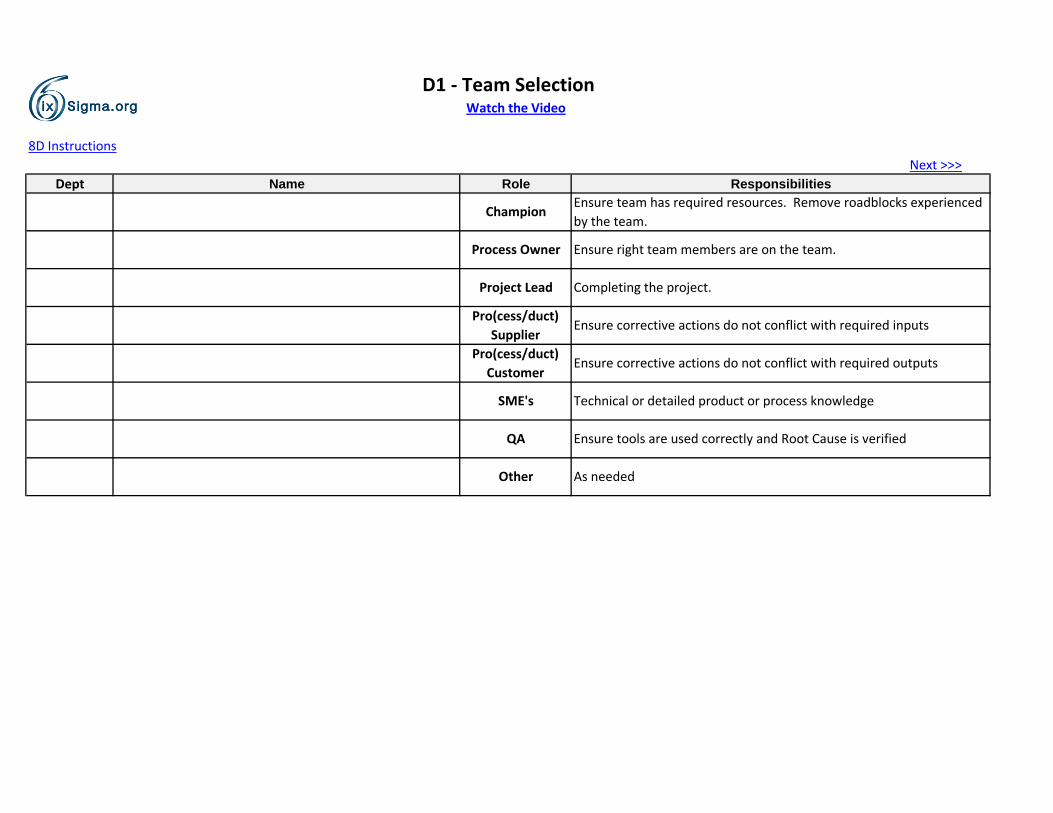
Dept
Other As needed
D1 - Team Selection
SME's Technical or detailed product or process knowledge
QA Ensure tools are used correctly and Root Cause is verified
Pro(cess/duct)
SupplierEnsure corrective actions do not conflict with required inputs
Pro(cess/duct)
CustomerEnsure corrective actions do not conflict with required outputs
Process Owner Ensure right team members are on the team.
Project Lead Completing the project.
Watch the Video
Name Role Responsibilities
ChampionEnsure team has required resources. Remove roadblocks experienced
by the team.

D2 - Problem Definition
Watch the VideoWatch the Video
8D Instructions
Answer the following questions and then summarize the results below.Answer the following questions and then summarize the results below.
What the problem
IS
What else it might be but
IS NOT More InfoWho reported the problem? Who did not report the problem?
Who is affected by the problem? Who is not affected by the problem?
What is the product ID or reference number? What ID's or reference # are not affected?
What is (describe) the defect? What is not the defect?
Where does the problem occur? Where is it not occurring but could?
Where was the problem first observed? Where else might it occur?
When was the problem first reported? When was the problem not reported?
When was the problem last reported? When might it reappear?
Why is this a problem? Why is this not a problem?
Why should this be fixed now? Why is the problem urgent?
How often is the problem observed? How often is it not observed?
How is the problem measured? How accurate is the measurement?
Can the problem be isolated? Replicated? Is there a trend? Has the problem occurred previously?
Customer: Incident Date: 01/00/00 Part Number:
What is the start of the pro(cess/duct)? What is the end of the pro(cess/duct)?
Lot #: Application: 0 Failure Rate:
Based on answers to the questions above, please describe the problem and/or the opportunity
What the problem
IS
What else it might be but
IS NOT More Info
WH
AT
WH
O Customer A & B Customer C
WH
ERE
WH
YW
HEN
OTH
ERH
OW
MIS
CP
RO
BLE
M
DES
CR
IPTI
ON
SCO
PE
0 0
0 0.00%

Note: the description of the problem should use a noun - verb format and not have any opinions, judgments,
assumptions, presumed causes, solutions, blame or compound problems contained in it.
PR
OB
LEM
DES
CR
IPTI
ON

Next >>>
Answer the following questions and then summarize the results below.
More Info
D2 - Problem Definition
0
0.00%

Next >>>
8D Instructions
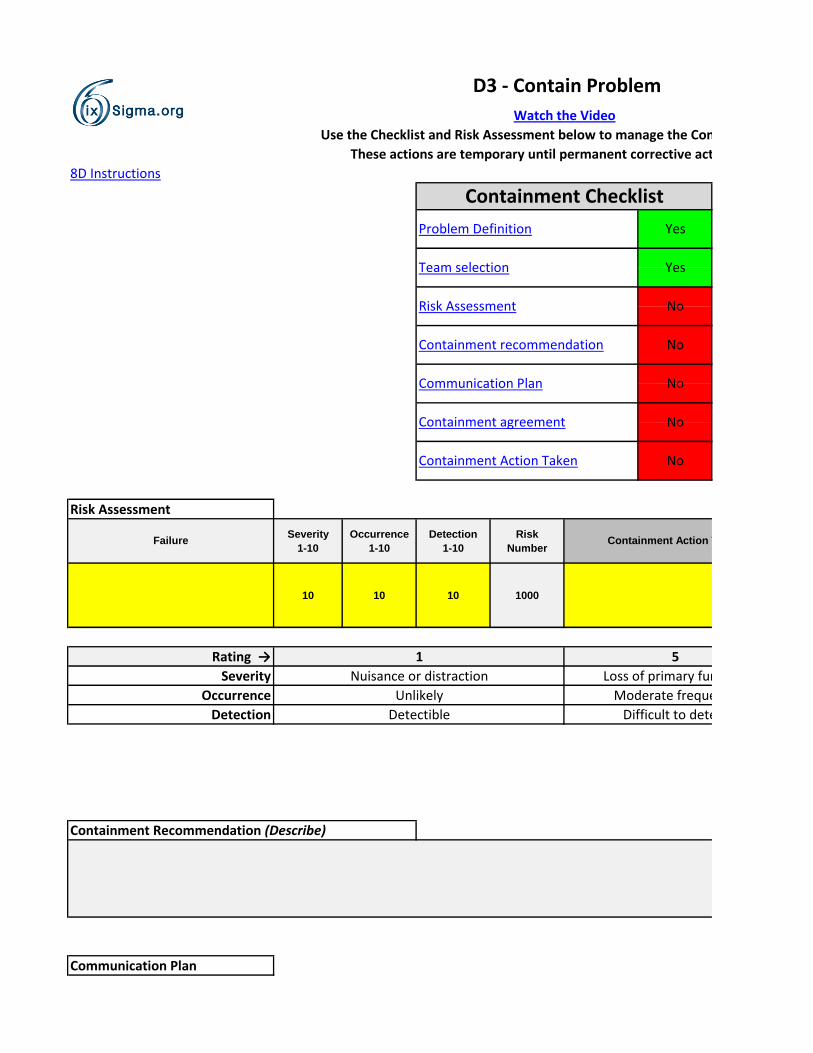
Severity
1-10
Occurrence
1-10
Detection
1-10
Risk
Number
10 10 10 1000
Containment Recommendation (Describe)
Communication Plan
Team selection
Risk Assessment
Yes
Yes
No
D3 - Contain Problem
Use the Checklist and Risk Assessment below to manage the Containment Action
Containment Checklist
Problem Definition
These actions are temporary until permanent corrective action is taken
Watch the Video
Rating →
Loss of primary function
Moderate frequency
Difficult to detect
Severity
Occurrence
Detection
Failure Containment Action Taken
No
No
No
No
Communication Plan
Containment agreement
Containment recommendation
Containment Action Taken
Risk Assessment
1
Nuisance or distraction
Unlikely
Detectible
5
What are we
doing & why?
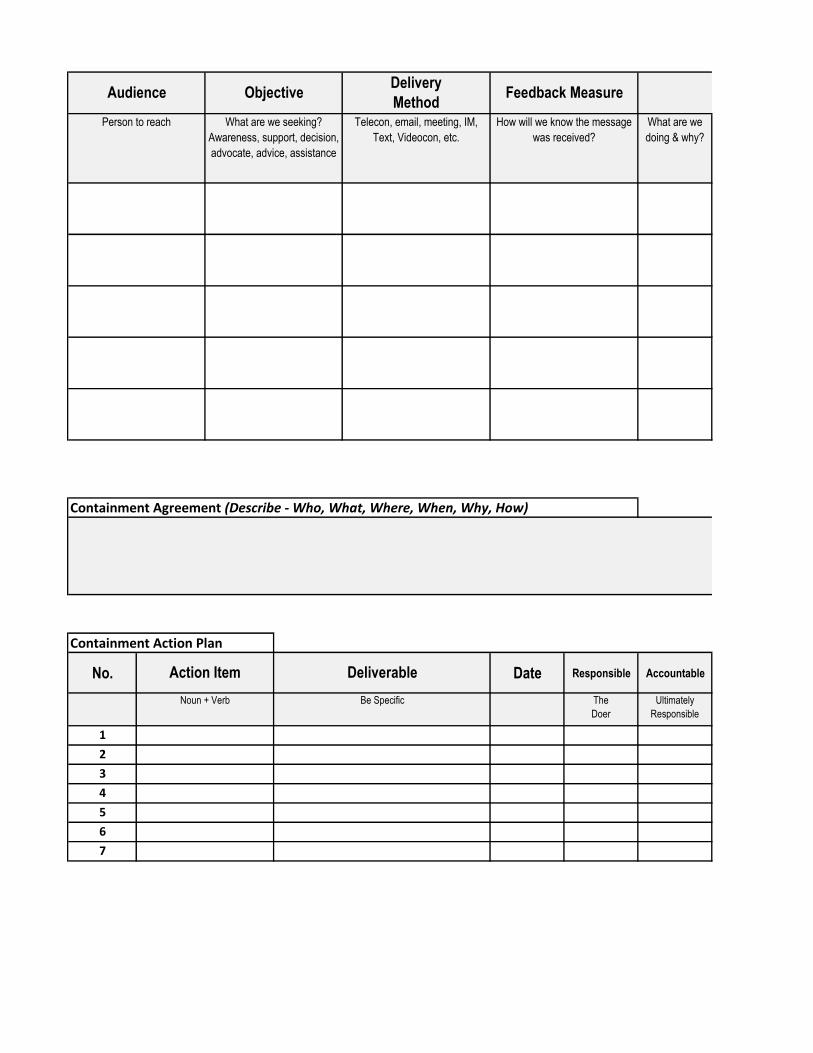
Containment Agreement (Describe - Who, What, Where, When, Why, How)
Containment Action Plan
No. Date Responsible Accountable
The
Doer
Ultimately
Responsible
1
2
3
4
5
6
7
Action Item
Noun + Verb Be Specific
How will we know the message
was received?
Key Message
Person to reach What are we seeking?
Awareness, support, decision,
advocate, advice, assistance
Telecon, email, meeting, IM,
Text, Videocon, etc.
Audience ObjectiveDelivery
MethodFeedback Measure
Deliverable

Next >>>
Revised
Severity
1-10
Revised
Occurrence
1-10
Revised
Detection
1-10
Risk
Number
5 5 5 125
D3 - Contain Problem
Use the Checklist and Risk Assessment below to manage the Containment Action
These actions are temporary until permanent corrective action is taken
Loss of primary function
Moderate frequency
Difficult to detect
Containment Action Taken
10
Loss of life or loss of significant $
Almost certain
Cannot detect
5

Assigned Due date Failure
What does it
mean to the
person?
What does the
person need
to do
differently?
What support
can the person
expect from us?
Who will
deliver the
message
Completion
date
Consult Inform
Advisor or
Consultant
Needs to Know
Next >>>
Notes
Key Message
8D Instructions
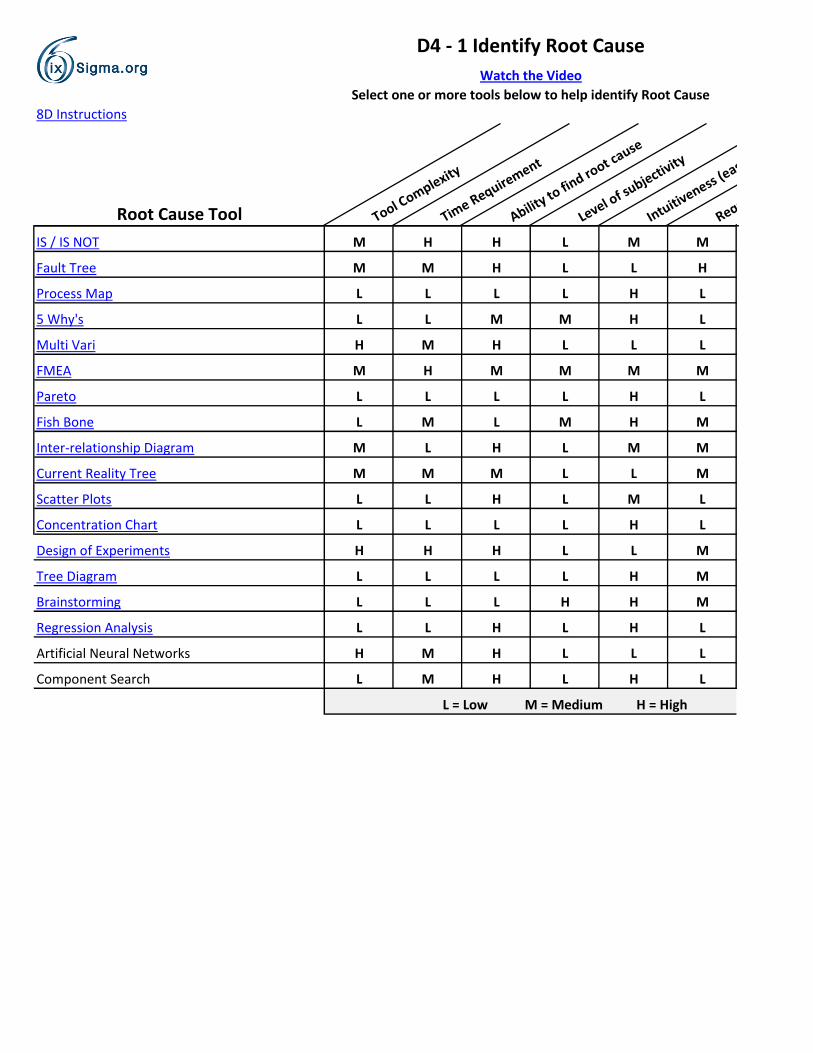
Select one or more tools below to help identify Root Cause
D4 - 1 Identify Root Cause
Watch the Video
Root Cause Tool Tool Complexity
Time Require
ment
Ability to
find ro
ot cause
Level of subjectiv
ity
Intuitiveness (e
ase of use)
Requires X Functio
nal Team
IS / IS NOT M H H L M M
Fault Tree M M H L L H
Process Map L L L L H L
5 Why's L L M M H L
Multi Vari H M H L L L
FMEA M H M M M M
Pareto L L L L H L
Fish Bone L M L M H M
Inter-relationship Diagram M L H L M M
Current Reality Tree M M M L L M
Scatter Plots L L H L M L
Concentration Chart L L L L H L
Design of Experiments H H H L L M
Tree Diagram L L L L H M
Brainstorming L L L H H M
Regression Analysis L L H L H L
Artificial Neural Networks H M H L L L
Component Search L M H L H L
L = Low M = Medium H = High
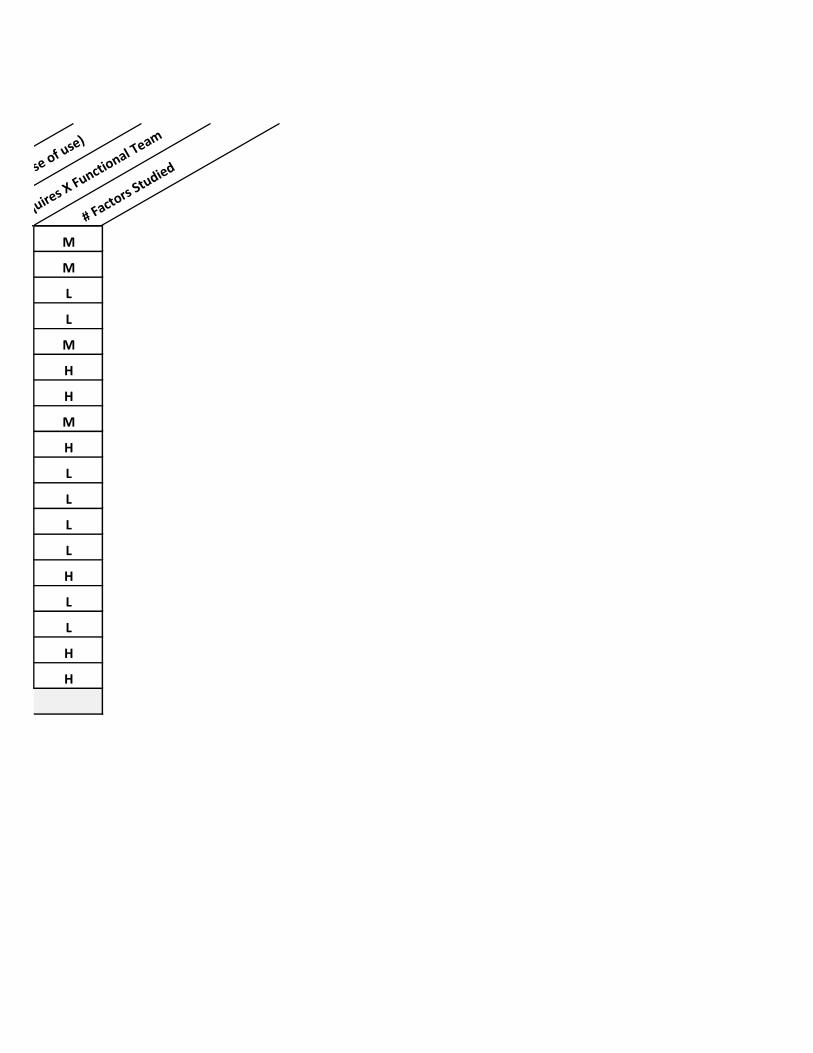
Select one or more tools below to help identify Root Cause
D4 - 1 Identify Root Cause
Level of subjectiv
ity
Intuitiveness (e
ase of use)
Requires X Functio
nal Team
# Factors Studied
M
M
L
L
M
H
H
M
H
L
L
L
L
H
L
L
H
H
L = Low M = Medium H = High

D4 - 2 IS / IS NOT
Watch the VideoWatch the Video
Root Cause List Complete the 'Problem Definition' on tab D2 Before Proceeding
8D Instructions
What the problem
IS
What else it might be but
IS NOT More InfoWho reported the problem? Who did not report the problem?
Who is affected by the problem? Who is not affected by the problem?
What is the product ID or reference number? What ID's or reference # are not affected?
What is (describe) the defect? What is not the defect?
Where does the problem occur? Where is it not occurring but could?
Where was the problem first observed? Where else might it occur?
When was the problem first reported? When was the problem not reported?
When was the problem last reported? When might it reappear?
Why is this a problem? Why is this not a problem?
Why should this be fixed now? Why is the problem urgent?
How often is the problem observed? How often is it not observed?
How is the problem measured? How accurate is the measurement?
Can the problem be isolated? Replicated? Is there a trend? Has the problem occurred previously?
Customer: Incident Date: 0 Part Number:
What is the start of the pro(cess/duct)? What is the end of the pro(cess/duct)?
Lot #: Application: 0 Failure Rate:
Based on answers to the questions above, please describe the problem and/or the opportunity
What the problem
IS
What else it might be but
IS NOT More Info
WH
AT
WH
O
0
0
WH
ERE
WH
EN
0
WH
YH
OW
0
0
OTH
ERSC
OP
E
0
0
0 0
0.00%
0
Customer C
0
0
0
0
0
MIS
CP
RO
BLE
M
DES
CR
IPTI
ON
Customer A & B
0
0
0
0
0
0
0
0
0
0
0
0
0
0
0
0 0
0
0
0
0
0
0
0
0
0
0

PR
OB
LEM
DES
CR
IPTI
ON
0
D4 - 2 IS / IS NOT
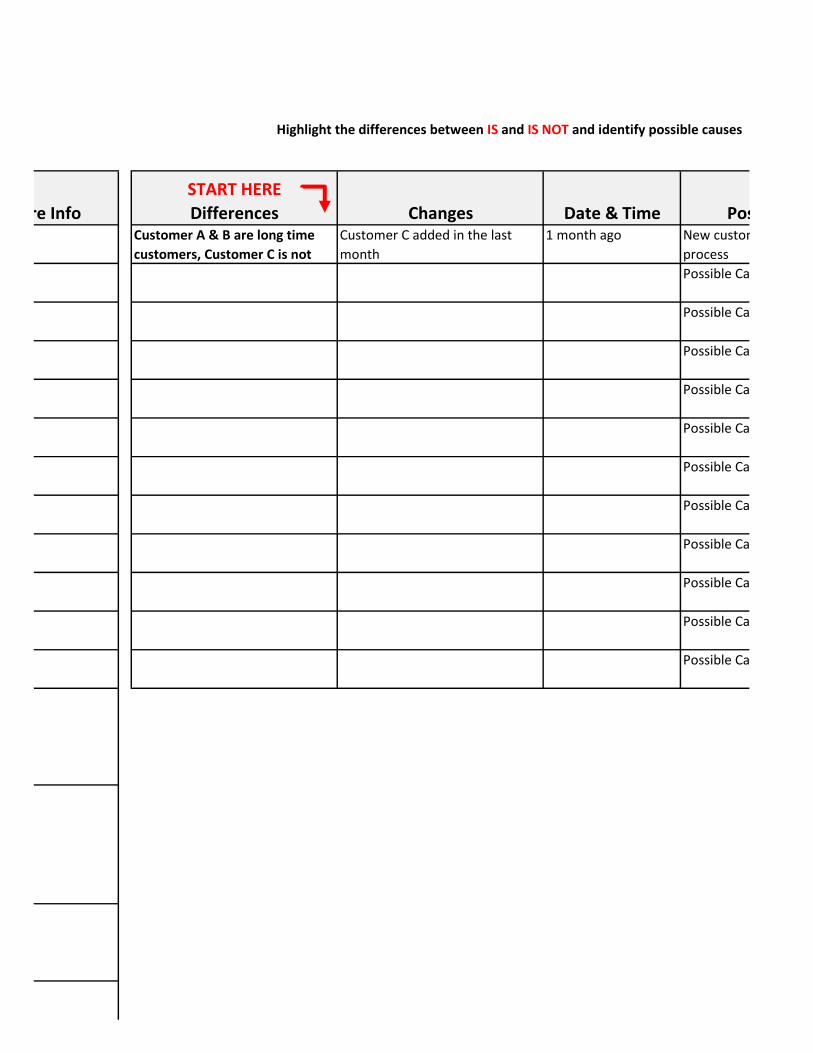
Highlight the differences between IS and IS NOT and identify possible causes
More Info
START HERE
Differences Changes Date & Time Possible Cause
Possible Cause 2
Customer A & B are long time
customers, Customer C is not
Customer C added in the last
month
1 month ago New customer onboarding
process
Possible Cause 3
0
0
Possible Cause 5
Possible Cause 4
Possible Cause 6
Possible Cause 7
Possible Cause 9
Possible Cause 8
Possible Cause 10
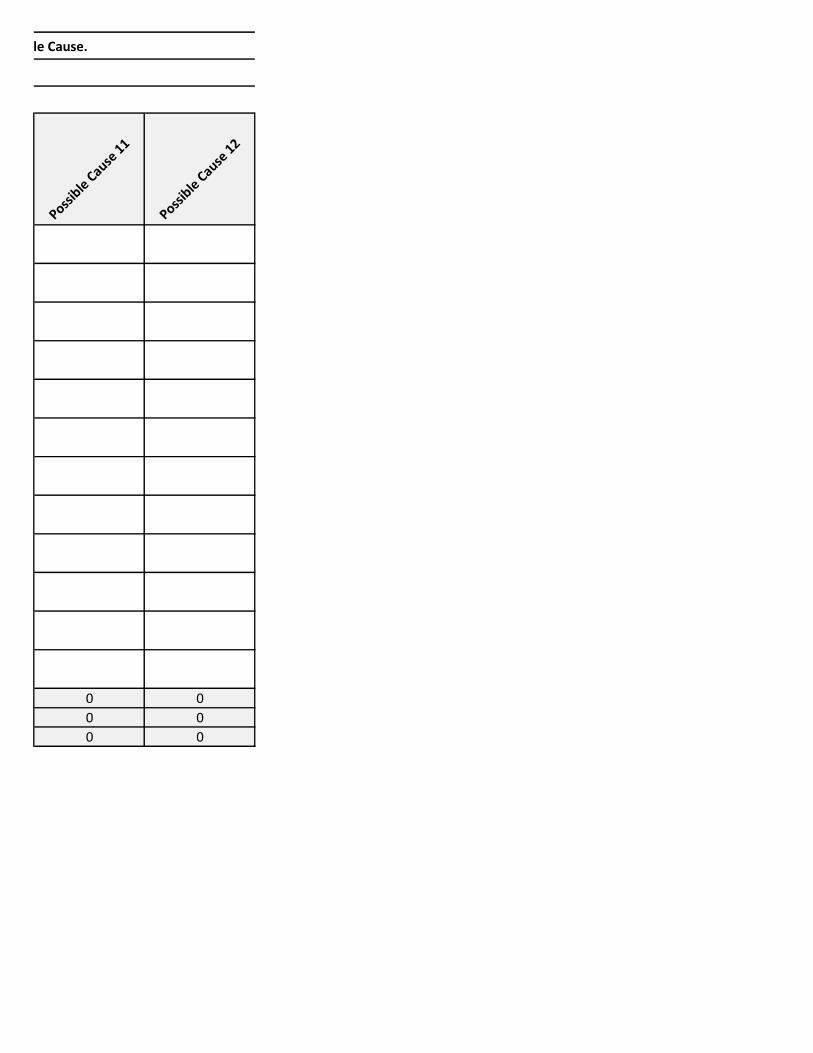
Possible Cause 11
0
0
Possible Cause 12
0.00%
0
0
0
0
0
0
0
0
0
0
0
0
0

0
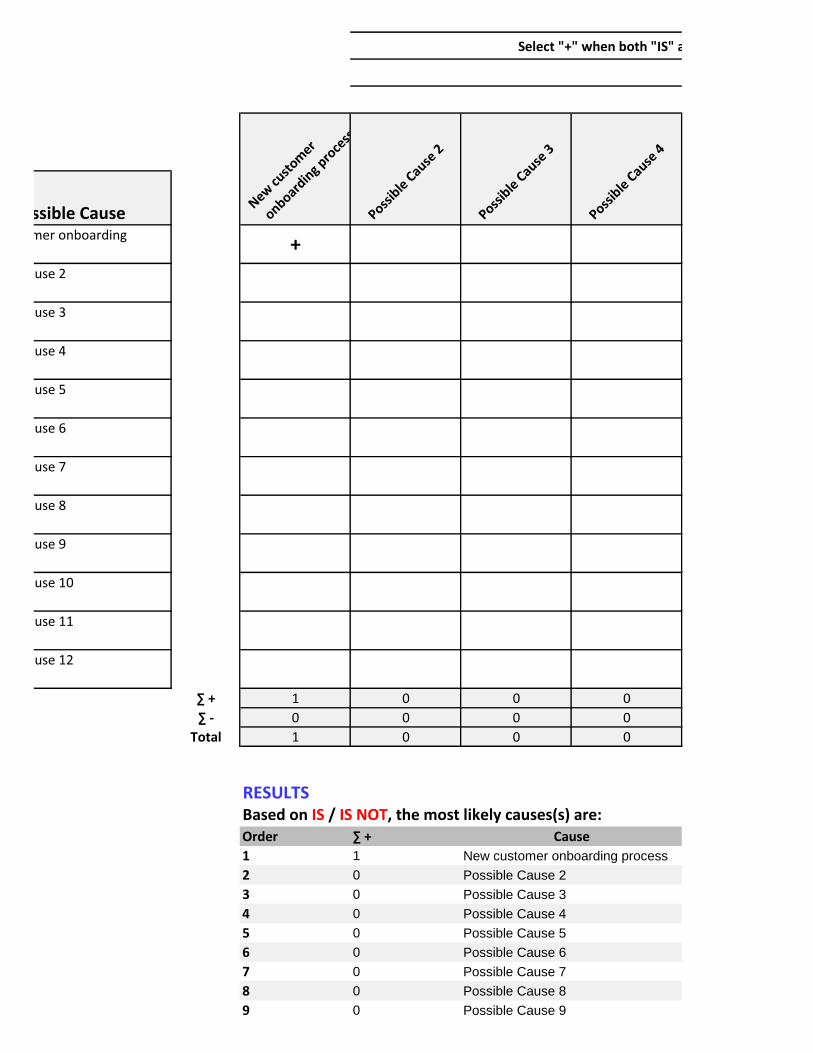
∑ + 1 0 0 0
∑ - 0 0 0 0
Total 1 0 0 0
RESULTSBased on IS / IS NOT, the most likely causes(s) are:Order ∑ +
1 1 New customer onboarding process
2 0 Possible Cause 2
3 0 Possible Cause 3
4 0 Possible Cause 4
5 0 Possible Cause 5
6 0 Possible Cause 6
7 0 Possible Cause 7
8 0 Possible Cause 8
9 0 Possible Cause 9
Select "+" when both "IS" and "IS NOT" are explained by the Possible Cause. Select "-" when "IS" or "IS NOT" is explained by the Possible Cause.
Highlight the differences between IS and IS NOT and identify possible causes
Possible CauseNew
cust
omer
onboardin
g pro
cess
Possib
le C
ause 2
Possib
le C
ause 3
Possib
le C
ause 4
Possible Cause 2
New customer onboarding
process+
Possible Cause 3
Possible Cause 5
Possible Cause 4
Possible Cause 6
Possible Cause 7
Possible Cause 9
Possible Cause 8
Possible Cause 10
Possible Cause 11
Possible Cause 12
Cause
10 0 Possible Cause 10
11 0 Possible Cause 11
12 0 Possible Cause 12
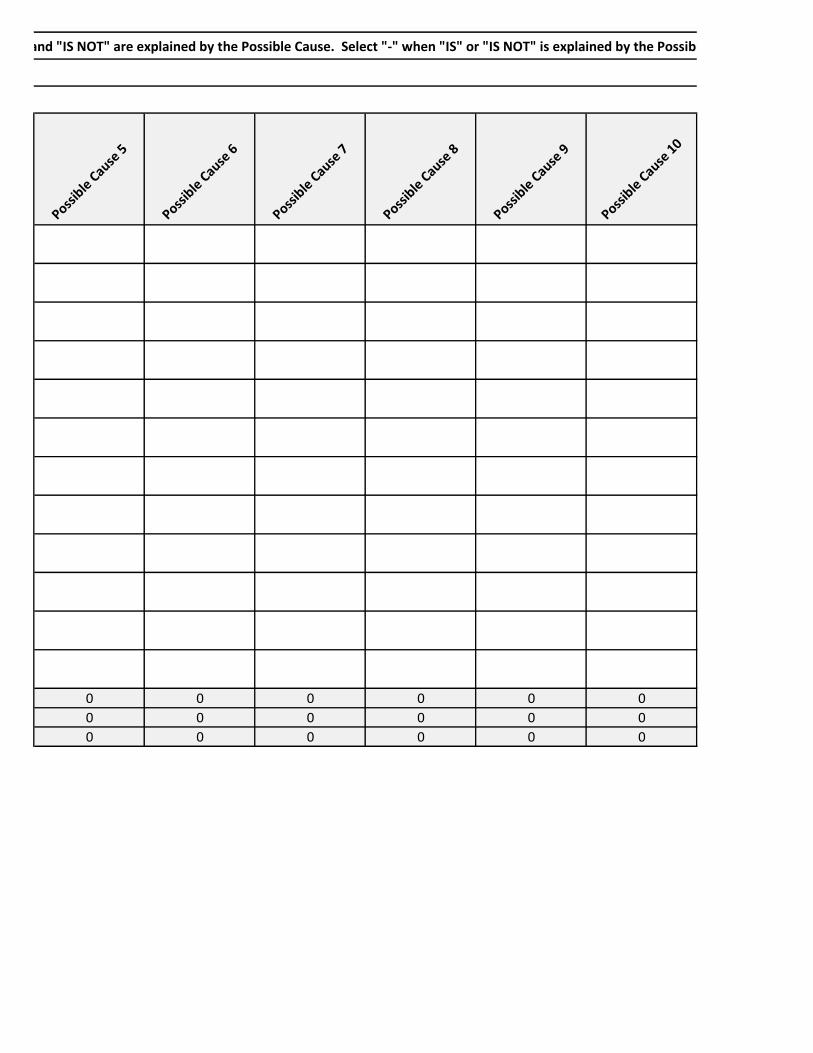
Select "+" when both "IS" and "IS NOT" are explained by the Possible Cause. Select "-" when "IS" or "IS NOT" is explained by the Possible Cause.
Possib
le C
ause 9
Possib
le C
ause 1
0
Possib
le C
ause 5
Possib
le C
ause 6
Possib
le C
ause 7
Possib
le C
ause 8
0 0 0 0 0 0
0 0 0 0 0 0
0 0 0 0 0 0
Possib
le C
ause 9
Possib
le C
ause 1
0
Possib
le C
ause 5
Possib
le C
ause 6
Possib
le C
ause 7
Possib
le C
ause 8

Select "+" when both "IS" and "IS NOT" are explained by the Possible Cause. Select "-" when "IS" or "IS NOT" is explained by the Possible Cause.
Possib
le C
ause 1
1
Possib
le C
ause 1
2
0 0
0 0
0 0
Possib
le C
ause 1
1
Possib
le C
ause 1
2


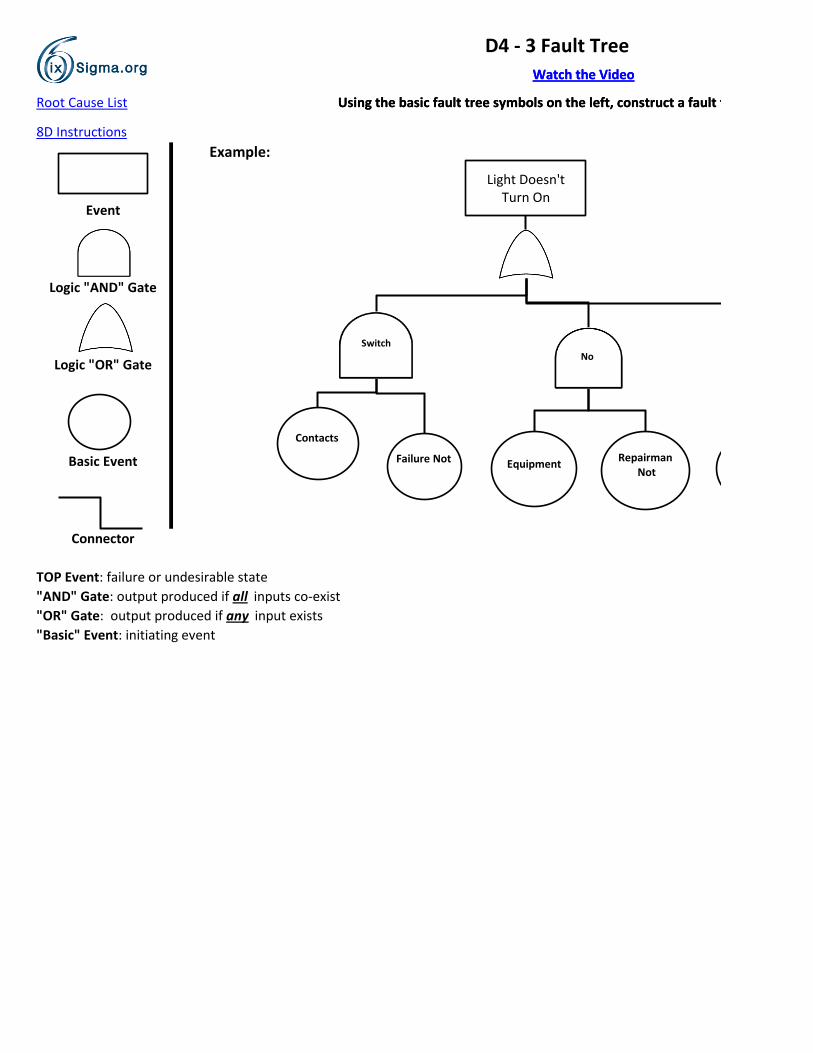
D4 - 3 Fault Tree
Watch the VideoWatch the Video
Using the basic fault tree symbols on the left, construct a fault tree hereRoot Cause List Using the basic fault tree symbols on the left, construct a fault tree here
8D Instructions
TOP Event: failure or undesirable state
"AND" Gate: output produced if all inputs co-exist
"OR" Gate: output produced if any input exists
"Basic" Event: initiating event
Connector
Event
Logic "AND" Gate
Logic "OR" Gate
Basic Event
Example:
Light Doesn't Turn On
Switch No
Contacts
Repairman Not
Equipment Failure Not

Step 1: Identify Failure (TOP Event)
Step 2: Identify first level contributors
Step 3: Link contributors to Failure using logic gates
Step 4: Identify second level contributors
Step 5: Link second level contributors to Failure
using logic gates
Step 6: Repeat Step 4 and Step 5 for subsequent
level contributors
Step 7: Review all "Basic Events" for likely Root Cause
D4 - 3 Fault Tree
Instructions:
Using the basic fault tree symbols on the left, construct a fault tree here
Bulb Burned
Bulb
Bulb Not

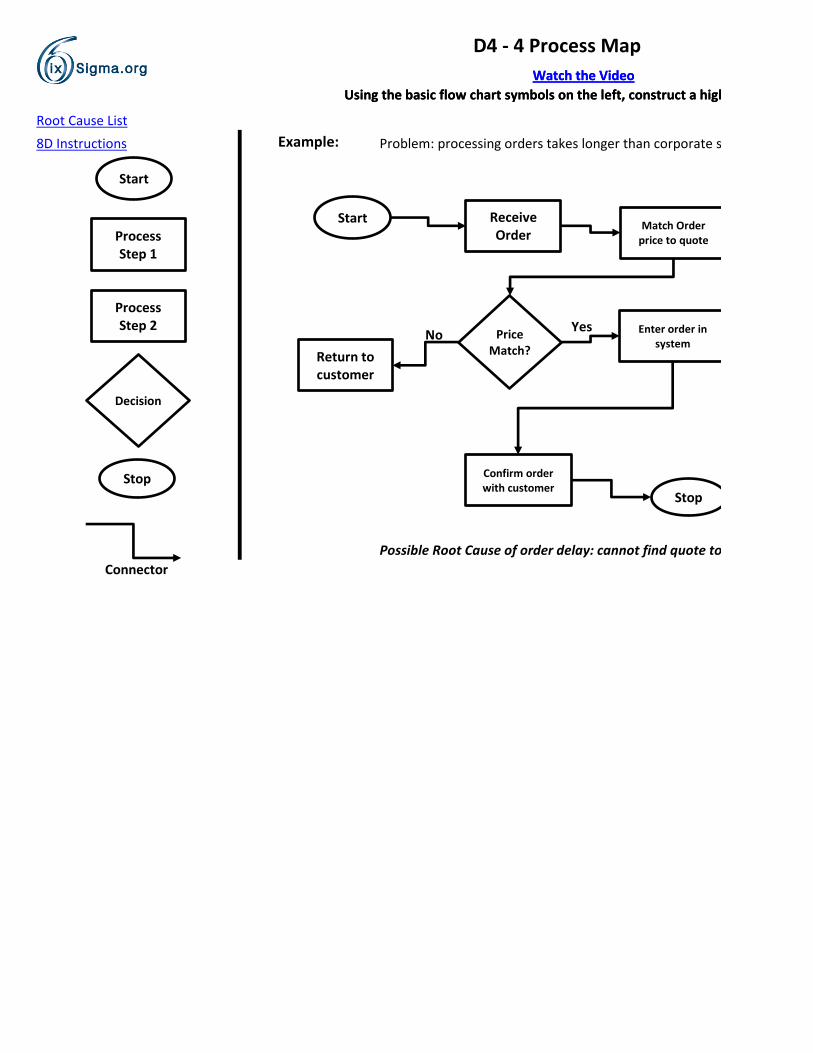
D4 - 4 Process Map
Watch the Video
Using the basic flow chart symbols on the left, construct a high level process map
Watch the Video
Using the basic flow chart symbols on the left, construct a high level process map
Root Cause List
8D Instructions Problem: processing orders takes longer than corporate standard
Possible Root Cause of order delay: cannot find quote to match price
Connector
Example:
Start
Stop
Process Step 1
Process Step 2
Decision
Start Receive Order
Match Order price to quote
Enter order in system
Confirm order with customer
Stop
Price Match? Return to
customer
No Yes
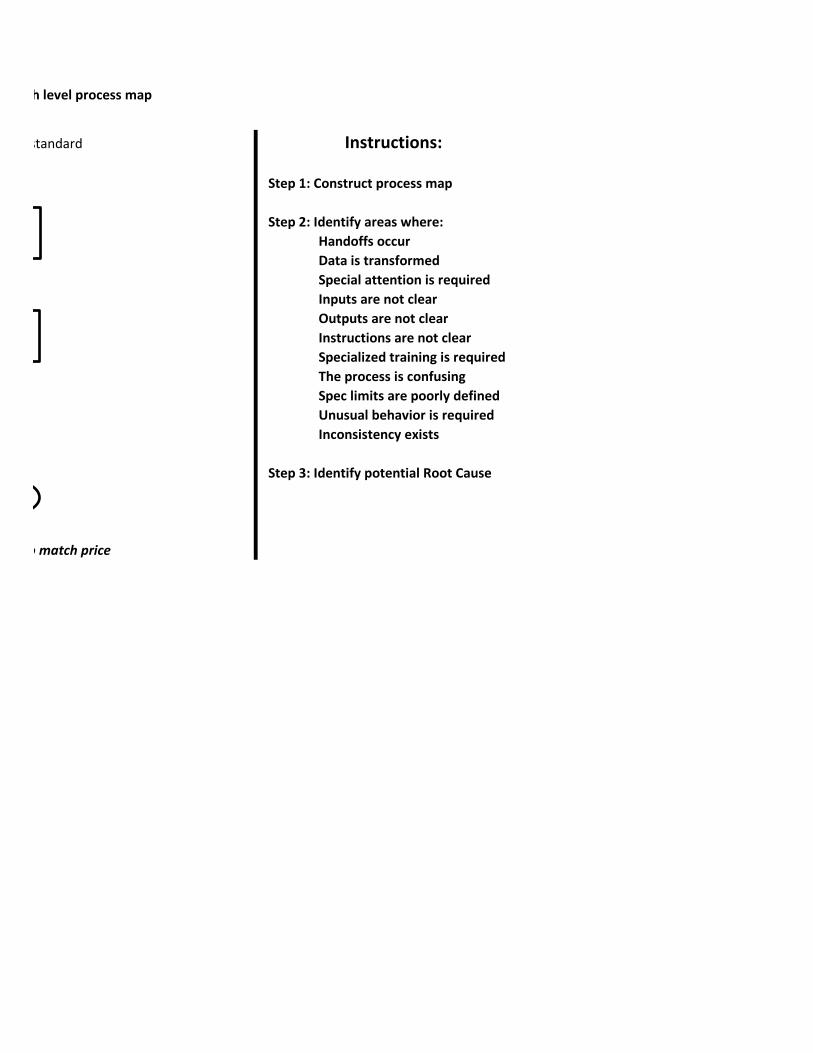
Problem: processing orders takes longer than corporate standard
Step 1: Construct process map
Step 2: Identify areas where:
Handoffs occur
Data is transformed
Special attention is required
Inputs are not clear
Outputs are not clear
Instructions are not clear
Specialized training is required
The process is confusing
Spec limits are poorly defined
Unusual behavior is required
Inconsistency exists
Step 3: Identify potential Root Cause
Possible Root Cause of order delay: cannot find quote to match price
Instructions:
Using the basic flow chart symbols on the left, construct a high level process map
D4 - 4 Process Map

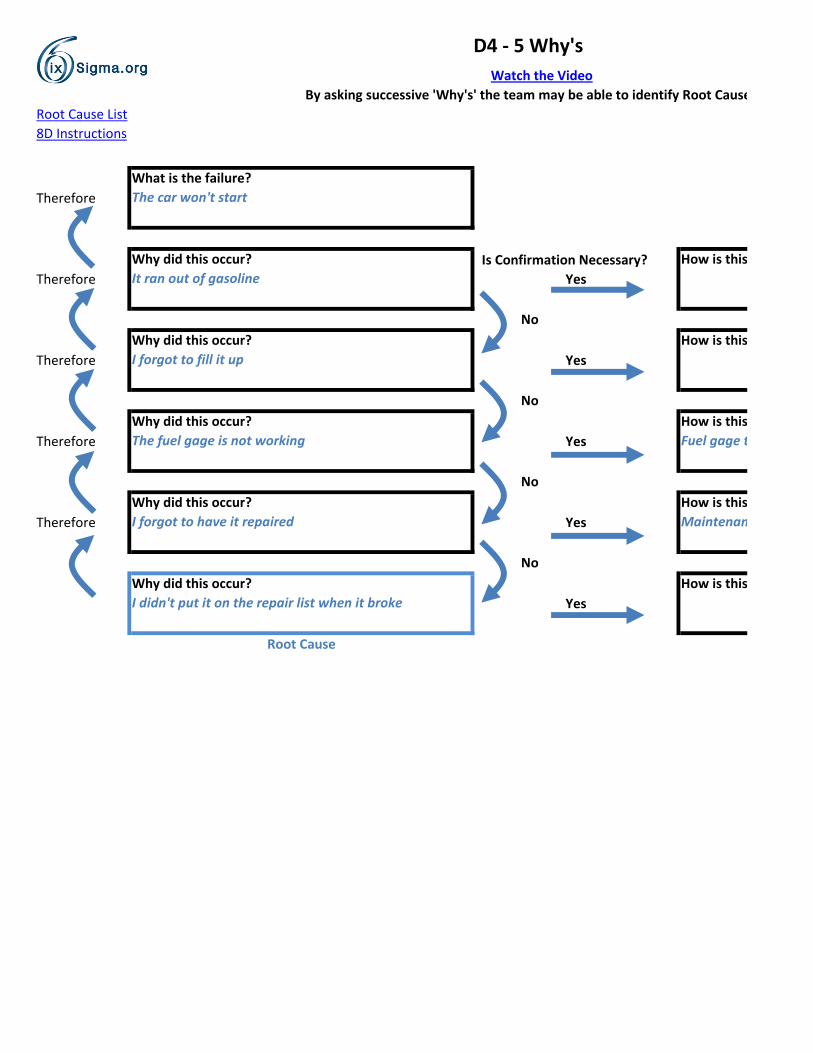
D4 - 5 Why's
Root Cause List
8D Instructions
Therefore
Is Confirmation Necessary?
Therefore Yes
No
Therefore Yes
No
Therefore Yes
No
Therefore Yes
No
Yes
Root Cause
How is this confirmed?
How is this confirmed?
How is this confirmed?
Fuel gage testing
How is this confirmed?
Maintenance records
How is this confirmed? See D6
What is the failure?
The car won't start
Why did this occur?
It ran out of gasoline
Why did this occur?
I forgot to fill it up
Why did this occur?
The fuel gage is not working
Why did this occur?
I forgot to have it repaired
Why did this occur?
I didn't put it on the repair list when it broke
By asking successive 'Why's' the team may be able to identify Root Cause
Watch the Video

STEP 1 : Define the problem. What is the product, process or service that has failed.
STEP 2 : Ask: Why did this occur?
STEP 3 : Answer: Does this reason need to ne confirmed? If No proceed to next 'Why?'
If Yes, then record how confirmation was made.
STEP 4 : Repeat Step 2 & 3 until Root Cause is identified.
STEP 5 : Verify Root Cause by starting at the probable Root Cause and connecting
it to the previous cause using 'Therefore'
STEP 6 : Repeat Step 5 until you reach the problem
STEP 7 : If there is a logical connection between each pair of statements back
to the problem then you have likely found the Root Cause
Instructions:
How is this confirmed?
How is this confirmed?
How is this confirmed?
Fuel gage testing
How is this confirmed?
Maintenance records
How is this confirmed? See D6
By asking successive 'Why's' the team may be able to identify Root Cause
D4 - 5 Why's

STEP 1 : Define the problem. What is the product, process or service that has failed.
STEP 3 : Answer: Does this reason need to ne confirmed? If No proceed to next 'Why?'
STEP 5 : Verify Root Cause by starting at the probable Root Cause and connecting
STEP 7 : If there is a logical connection between each pair of statements back
to the problem then you have likely found the Root Cause

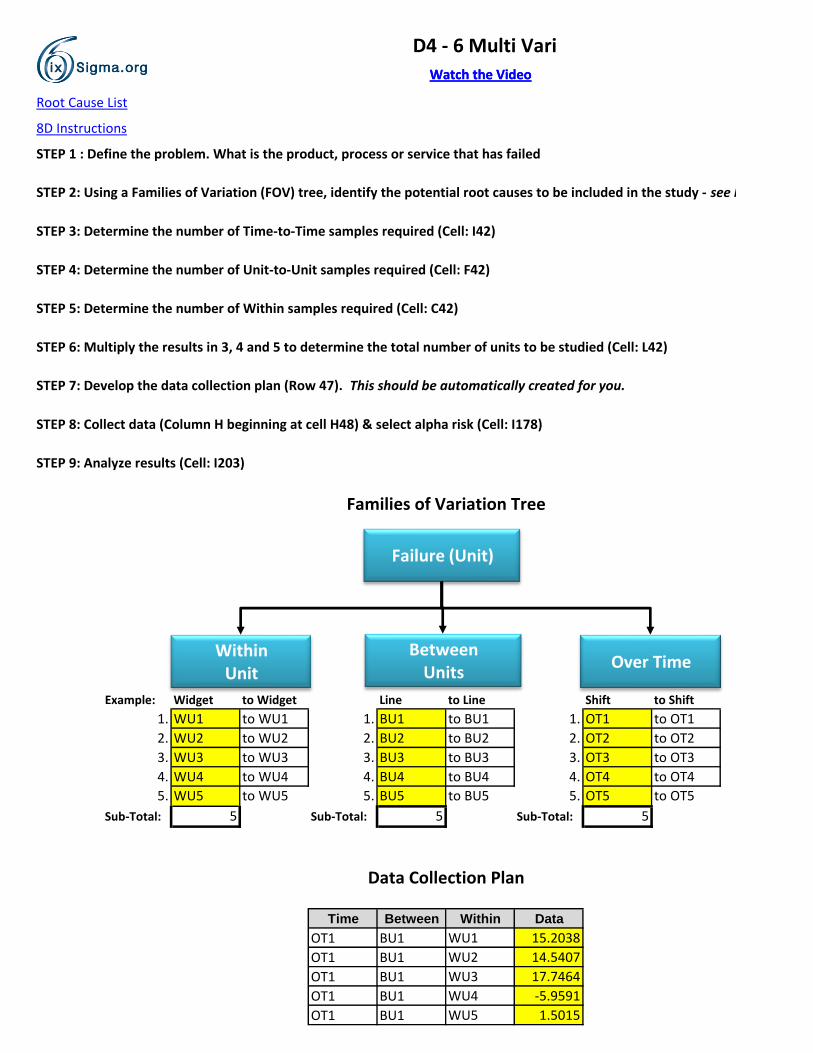
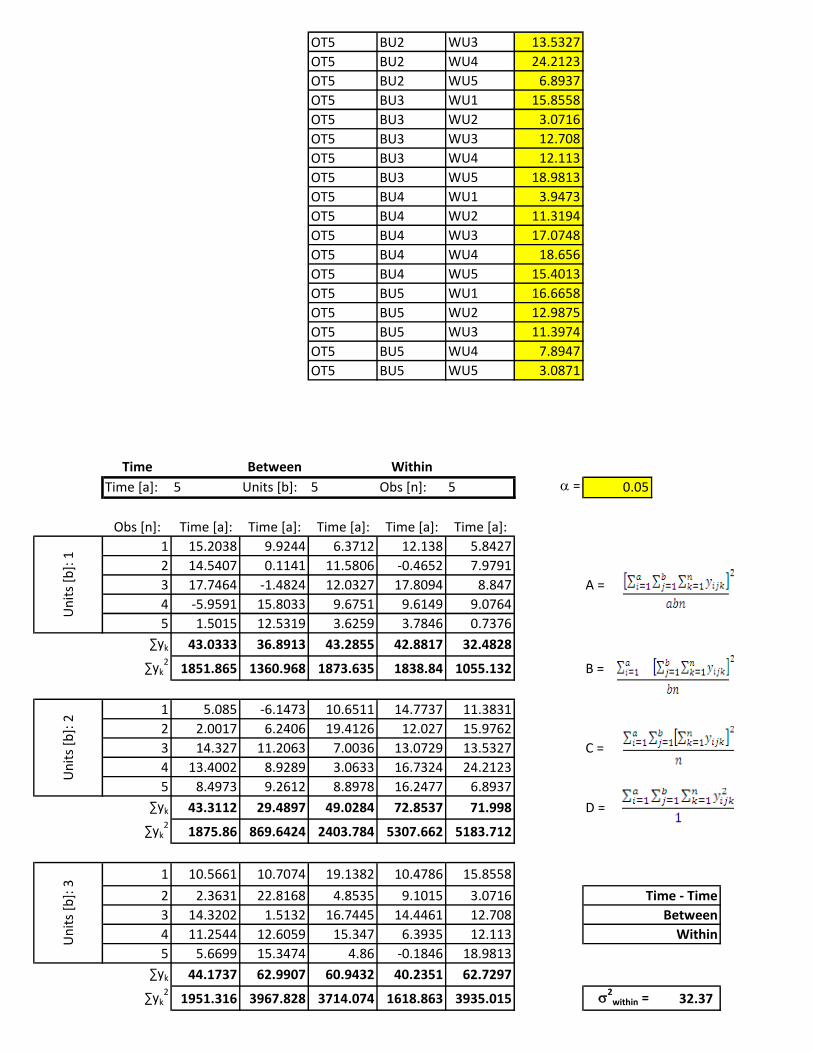
D4 - 6 Multi Vari
Watch the VideoWatch the Video
Root Cause List
8D Instructions
STEP 1 : Define the problem. What is the product, process or service that has failed
STEP 2: Using a Families of Variation (FOV) tree, identify the potential root causes to be included in the study - see below
STEP 3: Determine the number of Time-to-Time samples required (Cell: I42)
STEP 4: Determine the number of Unit-to-Unit samples required (Cell: F42)
STEP 5: Determine the number of Within samples required (Cell: C42)
STEP 6: Multiply the results in 3, 4 and 5 to determine the total number of units to be studied (Cell: L42)
STEP 7: Develop the data collection plan (Row 47). This should be automatically created for you.
STEP 8: Collect data (Column H beginning at cell H48) & select alpha risk (Cell: I178)
STEP 9: Analyze results (Cell: I203)
Example: Widget to Widget Line to Line Shift to Shift
1. WU1 to WU1 1. BU1 to BU1 1. OT1 to OT1
2. WU2 to WU2 2. BU2 to BU2 2. OT2 to OT2
3. WU3 to WU3 3. BU3 to BU3 3. OT3 to OT3
4. WU4 to WU4 4. BU4 to BU4 4. OT4 to OT4
5. WU5 to WU5 5. BU5 to BU5 5. OT5 to OT5
Sub-Total: 5 Sub-Total: 5 Sub-Total: 5
Time Between Within Data
OT1 BU1 WU1 15.2038
OT1 BU1 WU2 14.5407
OT1 BU1 WU3 17.7464
OT1 BU1 WU4 -5.9591
OT1 BU1 WU5 1.5015
Families of Variation Tree
Data Collection Plan
Failure (Unit)
Within Unit
Over Time Between
Units
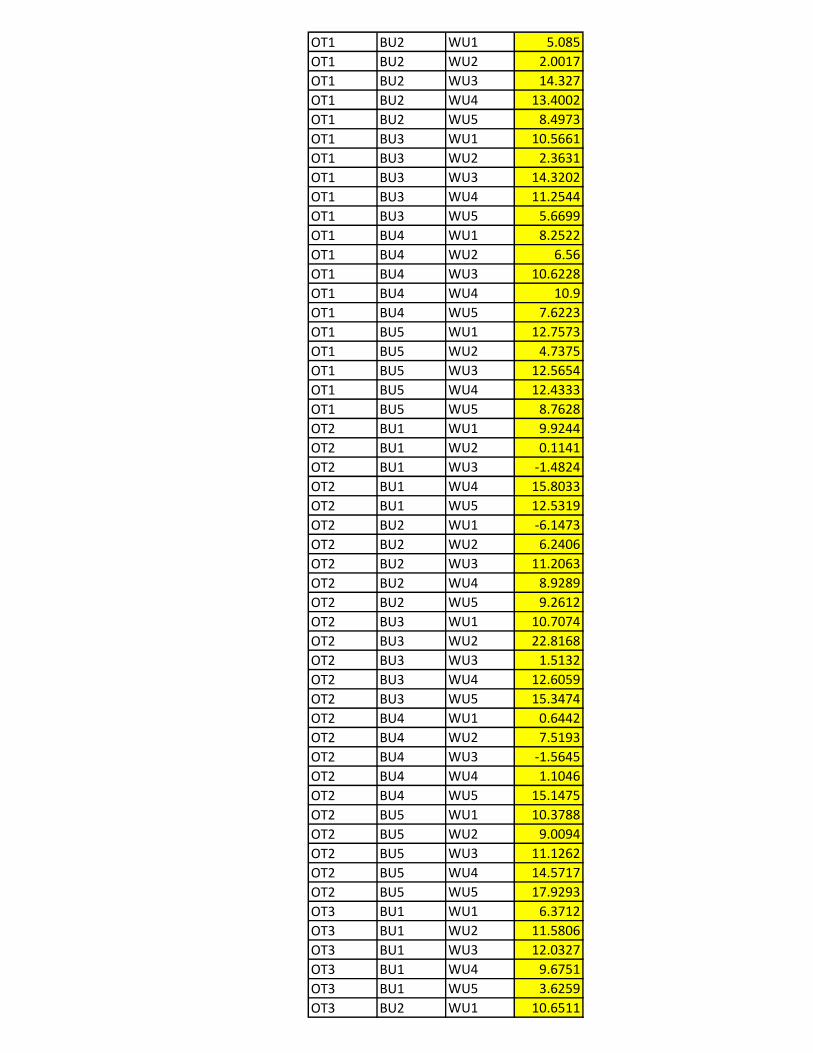
OT1 BU2 WU1 5.085
OT1 BU2 WU2 2.0017
OT1 BU2 WU3 14.327
OT1 BU2 WU4 13.4002
OT1 BU2 WU5 8.4973
OT1 BU3 WU1 10.5661
OT1 BU3 WU2 2.3631
OT1 BU3 WU3 14.3202
OT1 BU3 WU4 11.2544
OT1 BU3 WU5 5.6699
OT1 BU4 WU1 8.2522
OT1 BU4 WU2 6.56
OT1 BU4 WU3 10.6228
OT1 BU4 WU4 10.9
OT1 BU4 WU5 7.6223
OT1 BU5 WU1 12.7573
OT1 BU5 WU2 4.7375
OT1 BU5 WU3 12.5654
OT1 BU5 WU4 12.4333
OT1 BU5 WU5 8.7628
OT2 BU1 WU1 9.9244
OT2 BU1 WU2 0.1141
OT2 BU1 WU3 -1.4824
OT2 BU1 WU4 15.8033
OT2 BU1 WU5 12.5319
OT2 BU2 WU1 -6.1473
OT2 BU2 WU2 6.2406
OT2 BU2 WU3 11.2063
OT2 BU2 WU4 8.9289
OT2 BU2 WU5 9.2612
OT2 BU3 WU1 10.7074
OT2 BU3 WU2 22.8168
OT2 BU3 WU3 1.5132
OT2 BU3 WU4 12.6059
OT2 BU3 WU5 15.3474
OT2 BU4 WU1 0.6442
OT2 BU4 WU2 7.5193
OT2 BU4 WU3 -1.5645
OT2 BU4 WU4 1.1046
OT2 BU4 WU5 15.1475
OT2 BU5 WU1 10.3788
OT2 BU5 WU2 9.0094
OT2 BU5 WU3 11.1262
OT2 BU5 WU4 14.5717
OT2 BU5 WU5 17.9293
OT3 BU1 WU1 6.3712
OT3 BU1 WU2 11.5806
OT3 BU1 WU3 12.0327
OT3 BU1 WU4 9.6751
OT3 BU1 WU5 3.6259
OT3 BU2 WU1 10.6511
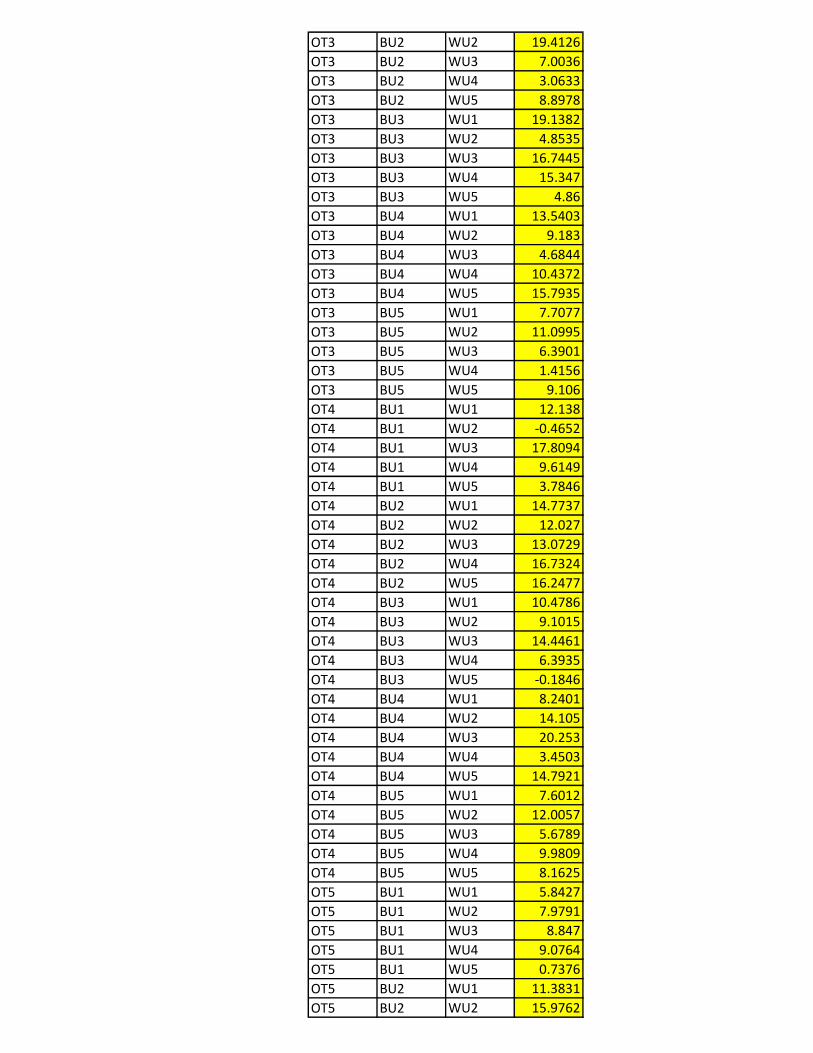
OT3 BU2 WU2 19.4126
OT3 BU2 WU3 7.0036
OT3 BU2 WU4 3.0633
OT3 BU2 WU5 8.8978
OT3 BU3 WU1 19.1382
OT3 BU3 WU2 4.8535
OT3 BU3 WU3 16.7445
OT3 BU3 WU4 15.347
OT3 BU3 WU5 4.86
OT3 BU4 WU1 13.5403
OT3 BU4 WU2 9.183
OT3 BU4 WU3 4.6844
OT3 BU4 WU4 10.4372
OT3 BU4 WU5 15.7935
OT3 BU5 WU1 7.7077
OT3 BU5 WU2 11.0995
OT3 BU5 WU3 6.3901
OT3 BU5 WU4 1.4156
OT3 BU5 WU5 9.106
OT4 BU1 WU1 12.138
OT4 BU1 WU2 -0.4652
OT4 BU1 WU3 17.8094
OT4 BU1 WU4 9.6149
OT4 BU1 WU5 3.7846
OT4 BU2 WU1 14.7737
OT4 BU2 WU2 12.027
OT4 BU2 WU3 13.0729
OT4 BU2 WU4 16.7324
OT4 BU2 WU5 16.2477
OT4 BU3 WU1 10.4786
OT4 BU3 WU2 9.1015
OT4 BU3 WU3 14.4461
OT4 BU3 WU4 6.3935
OT4 BU3 WU5 -0.1846
OT4 BU4 WU1 8.2401
OT4 BU4 WU2 14.105
OT4 BU4 WU3 20.253
OT4 BU4 WU4 3.4503
OT4 BU4 WU5 14.7921
OT4 BU5 WU1 7.6012
OT4 BU5 WU2 12.0057
OT4 BU5 WU3 5.6789
OT4 BU5 WU4 9.9809
OT4 BU5 WU5 8.1625
OT5 BU1 WU1 5.8427
OT5 BU1 WU2 7.9791
OT5 BU1 WU3 8.847
OT5 BU1 WU4 9.0764
OT5 BU1 WU5 0.7376
OT5 BU2 WU1 11.3831
OT5 BU2 WU2 15.9762
OT5 BU2 WU3 13.5327
OT5 BU2 WU4 24.2123
OT5 BU2 WU5 6.8937
OT5 BU3 WU1 15.8558
OT5 BU3 WU2 3.0716
OT5 BU3 WU3 12.708
OT5 BU3 WU4 12.113
OT5 BU3 WU5 18.9813
OT5 BU4 WU1 3.9473
OT5 BU4 WU2 11.3194
OT5 BU4 WU3 17.0748
OT5 BU4 WU4 18.656
OT5 BU4 WU5 15.4013
OT5 BU5 WU1 16.6658
OT5 BU5 WU2 12.9875
OT5 BU5 WU3 11.3974
OT5 BU5 WU4 7.8947
OT5 BU5 WU5 3.0871
Time Between Within
Time [a]: 5 Units [b]: 5 Obs [n]: 5 a = 0.05
Obs [n]: Time [a]: Time [a]: Time [a]: Time [a]: Time [a]:
1 15.2038 9.9244 6.3712 12.138 5.8427
2 14.5407 0.1141 11.5806 -0.4652 7.9791
3 17.7464 -1.4824 12.0327 17.8094 8.847 A =
4 -5.9591 15.8033 9.6751 9.6149 9.0764
5 1.5015 12.5319 3.6259 3.7846 0.7376
∑yk 43.0333 36.8913 43.2855 42.8817 32.4828
∑yk2
1851.865 1360.968 1873.635 1838.84 1055.132 B =
1 5.085 -6.1473 10.6511 14.7737 11.3831
2 2.0017 6.2406 19.4126 12.027 15.9762
3 14.327 11.2063 7.0036 13.0729 13.5327 C =
4 13.4002 8.9289 3.0633 16.7324 24.2123
5 8.4973 9.2612 8.8978 16.2477 6.8937
∑yk 43.3112 29.4897 49.0284 72.8537 71.998 D =
∑yk2
1875.86 869.6424 2403.784 5307.662 5183.712
1 10.5661 10.7074 19.1382 10.4786 15.8558
2 2.3631 22.8168 4.8535 9.1015 3.0716
3 14.3202 1.5132 16.7445 14.4461 12.708
4 11.2544 12.6059 15.347 6.3935 12.113
5 5.6699 15.3474 4.86 -0.1846 18.9813
∑yk 44.1737 62.9907 60.9432 40.2351 62.7297
∑yk2
1951.316 3967.828 3714.074 1618.863 3935.015 s2
within = 32.37
Un
its
[b]:
1U
nit
s [b
]: 2
Un
its
[b]:
3
Time - Time
Between
Within
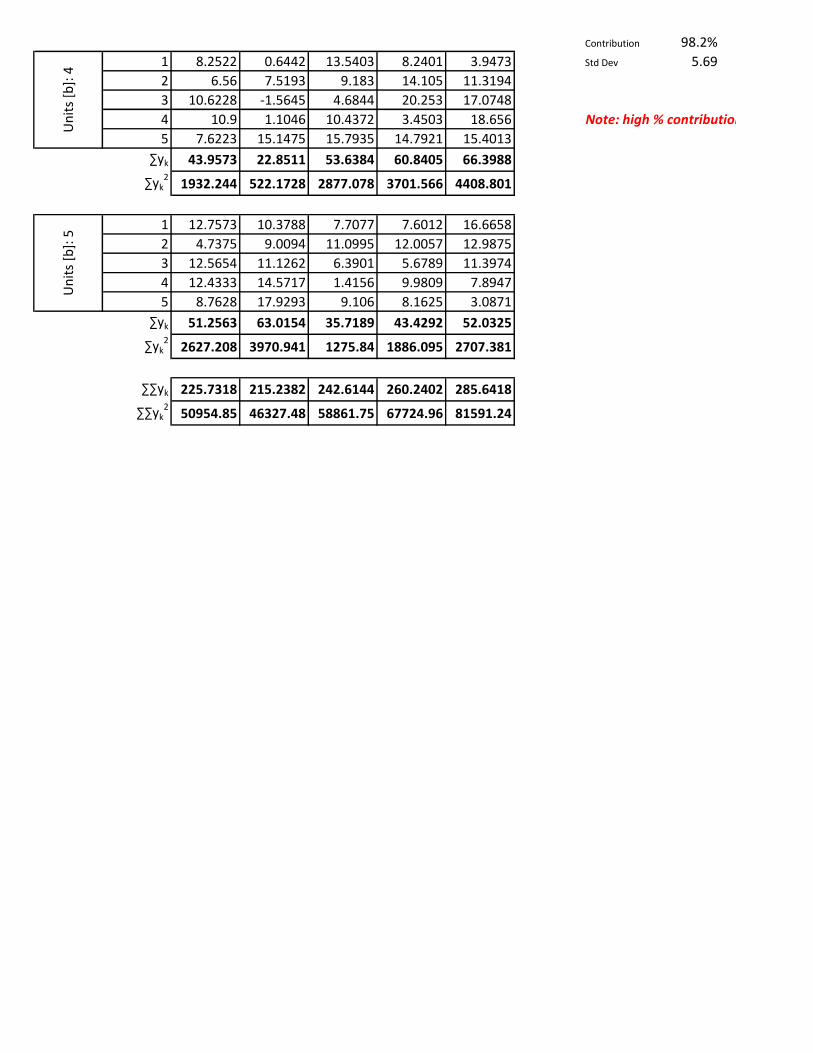
Contribution 98.2%
1 8.2522 0.6442 13.5403 8.2401 3.9473 Std Dev 5.69
2 6.56 7.5193 9.183 14.105 11.3194
3 10.6228 -1.5645 4.6844 20.253 17.0748
4 10.9 1.1046 10.4372 3.4503 18.656 Note: high % contribution may indicate that the family is, or contains, the root cause
5 7.6223 15.1475 15.7935 14.7921 15.4013
∑yk 43.9573 22.8511 53.6384 60.8405 66.3988
∑yk2
1932.244 522.1728 2877.078 3701.566 4408.801
1 12.7573 10.3788 7.7077 7.6012 16.6658
2 4.7375 9.0094 11.0995 12.0057 12.9875
3 12.5654 11.1262 6.3901 5.6789 11.3974
4 12.4333 14.5717 1.4156 9.9809 7.8947
5 8.7628 17.9293 9.106 8.1625 3.0871
∑yk 51.2563 63.0154 35.7189 43.4292 52.0325
∑yk2
2627.208 3970.941 1275.84 1886.095 2707.381
∑∑yk 225.7318 215.2382 242.6144 260.2402 285.6418
∑∑yk2
50954.85 46327.48 58861.75 67724.96 81591.24
Un
its
[b]:
4U
nit
s [b
]: 5

D4 - 6 Multi Vari
STEP 2: Using a Families of Variation (FOV) tree, identify the potential root causes to be included in the study - see below
125 < < < Total Data Points Required


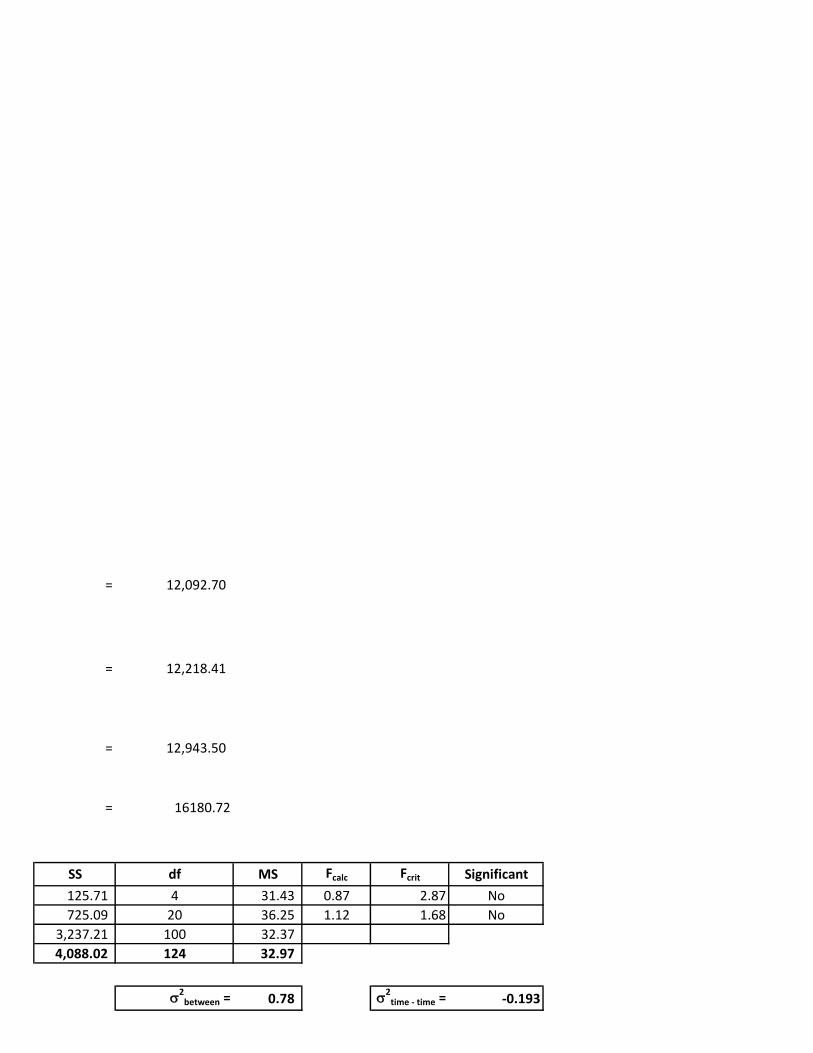
= 12,092.70
= 12,218.41
= 12,943.50
= 16180.72
SS df MS Fcalc Fcrit Significant
125.71 4 31.43 0.87 2.87 No
725.09 20 36.25 1.12 1.68 No
3,237.21 100 32.37
4,088.02 124 32.97
s2
between = 0.78 s2
time - time = -0.193

Contribution 2.4% Contribution -0.6%
Std Dev 0.88 Std Dev #NUM!
Note: high % contribution may indicate that the family is, or contains, the root cause


D4 - 7 Failure Modes and Effects Analysis
Watch the Video
Complete the FMEA (columns A:I) and select the high scoring Risk Priority Number (RPN)'s as potential root causes (refer to Cell A24 in this tab)
Watch the Video
Complete the FMEA (columns A:I) and select the high scoring Risk Priority Number (RPN)'s as potential root causes (refer to Cell A24 in this tab)
Root Cause List
8D Instructions
Process Step /
Input
Potential Failure
Mode
Potential Failure
Effects
Potential
CausesCurrent Controls
What is the
process step or
input under
investigation?
In what ways
does the Key
Input go wrong?
What is the
impact on the
Key Output
Variables
(Customer
Requirements)?
What causes the
Key Input to go
wrong?
What are the
existing controls
and procedures
(inspection and
test) that prevent
either the cause or
the Failure Mode?
Match Order
price to Quote
price
Cannot find
correct quote
Delay in entering
order8
Quote filing not
properly
organized
2 None 8 128
Price doesn't
match
Delay in entering
order8
Customer
references wrong
quote
4
Create new quote
or return Order to
customer
2 64
0
0
0
0
0
0
0
0
0
0
RESULTSBased on the FMEA, the most likely causes(s) are:
Order RPN
1 128 Quote filing not properly organized
2 64 Customer references wrong quote
3 0 0
4 0 0
5 0 0
6 0 0
7 0 0
8 0 0
9 0 0
10 0 0
11 0 0
12 0 0
Cause
S
E
V
E
R
I
T
Y
O
C
C
U
R
R
E
N
C
E
D
E
T
E
C
T
I
O
N
R
P
N
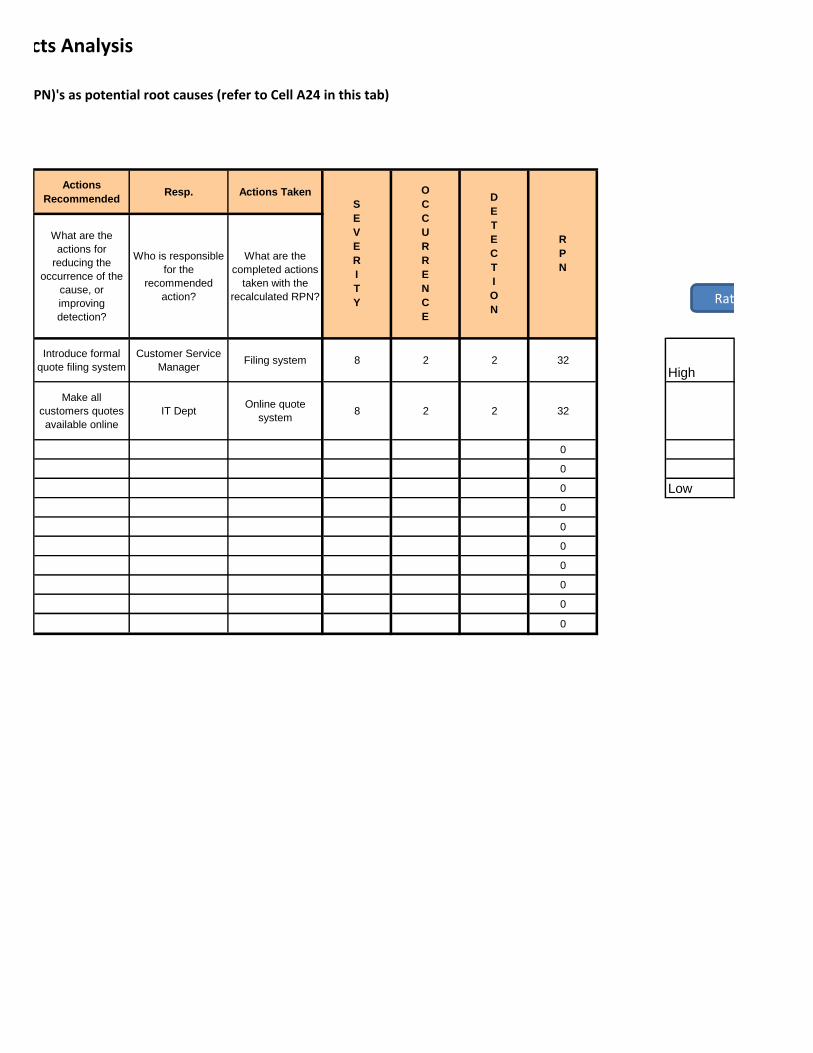
Actions
RecommendedResp. Actions Taken
What are the
actions for
reducing the
occurrence of the
cause, or
improving
detection?
Who is responsible
for the
recommended
action?
What are the
completed actions
taken with the
recalculated RPN?
Introduce formal
quote filing system
Customer Service
ManagerFiling system 8 2 2 32
High
Make all
customers quotes
available online
IT DeptOnline quote
system8 2 2 32
0
0
0 Low
0
0
0
0
0
0
0
D4 - 7 Failure Modes and Effects Analysis
Complete the FMEA (columns A:I) and select the high scoring Risk Priority Number (RPN)'s as potential root causes (refer to Cell A24 in this tab)
O
C
C
U
R
R
E
N
C
E
D
E
T
E
C
T
I
O
N
R
P
N
S
E
V
E
R
I
T
Y Rating
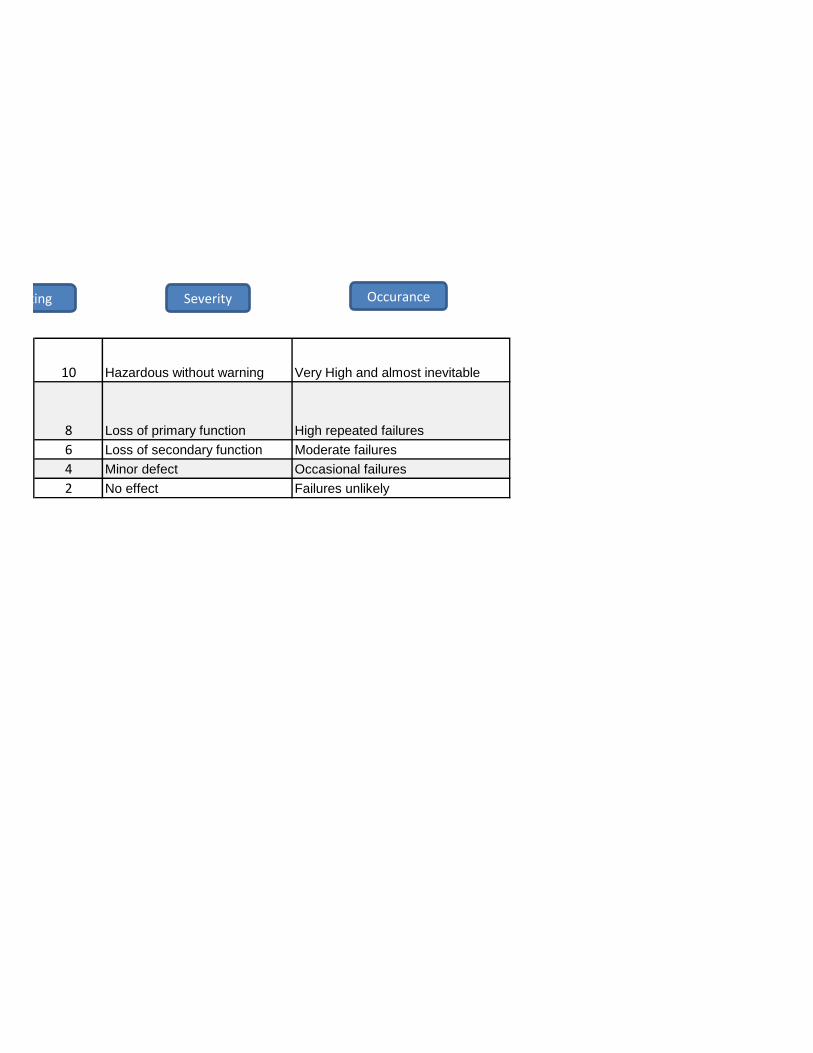
10 Hazardous without warning Very High and almost inevitable
8 Loss of primary function High repeated failures
6 Loss of secondary function Moderate failures
4 Minor defect Occasional failures
2 No effect Failures unlikely
Rating Severity Occurance
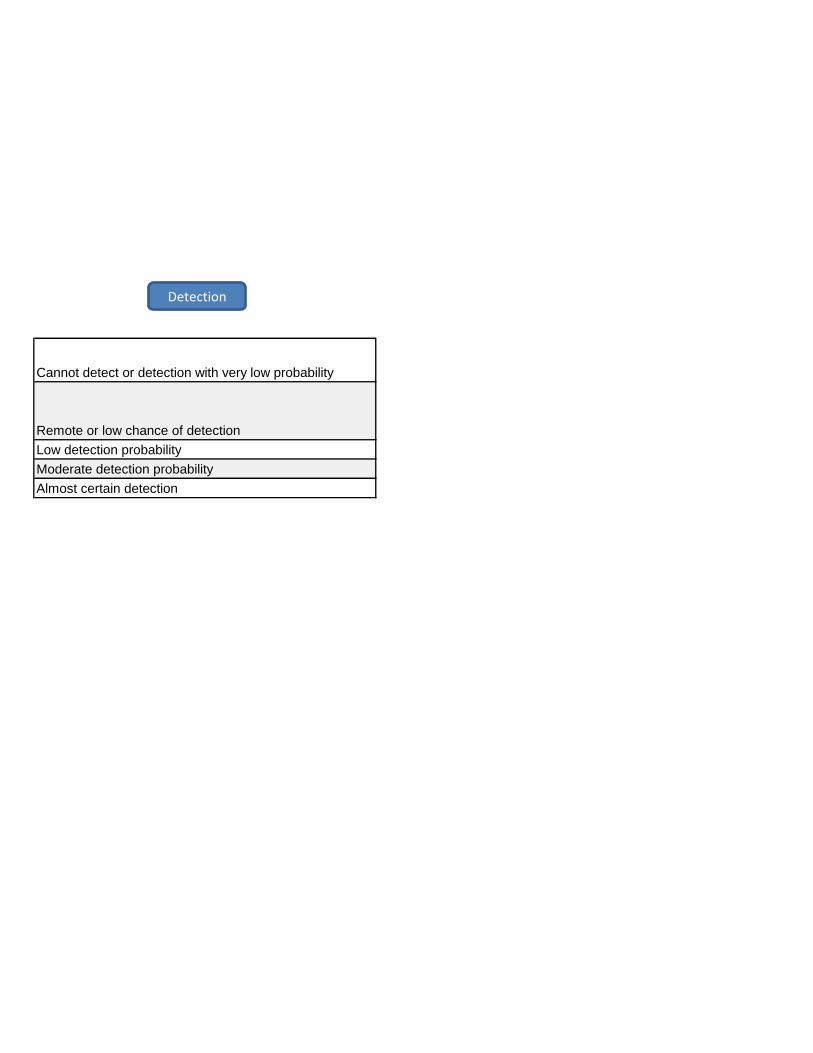
Cannot detect or detection with very low probability
Remote or low chance of detection
Low detection probability
Moderate detection probability
Almost certain detection
Detection
D4 - 8 Pareto
Watch the Video
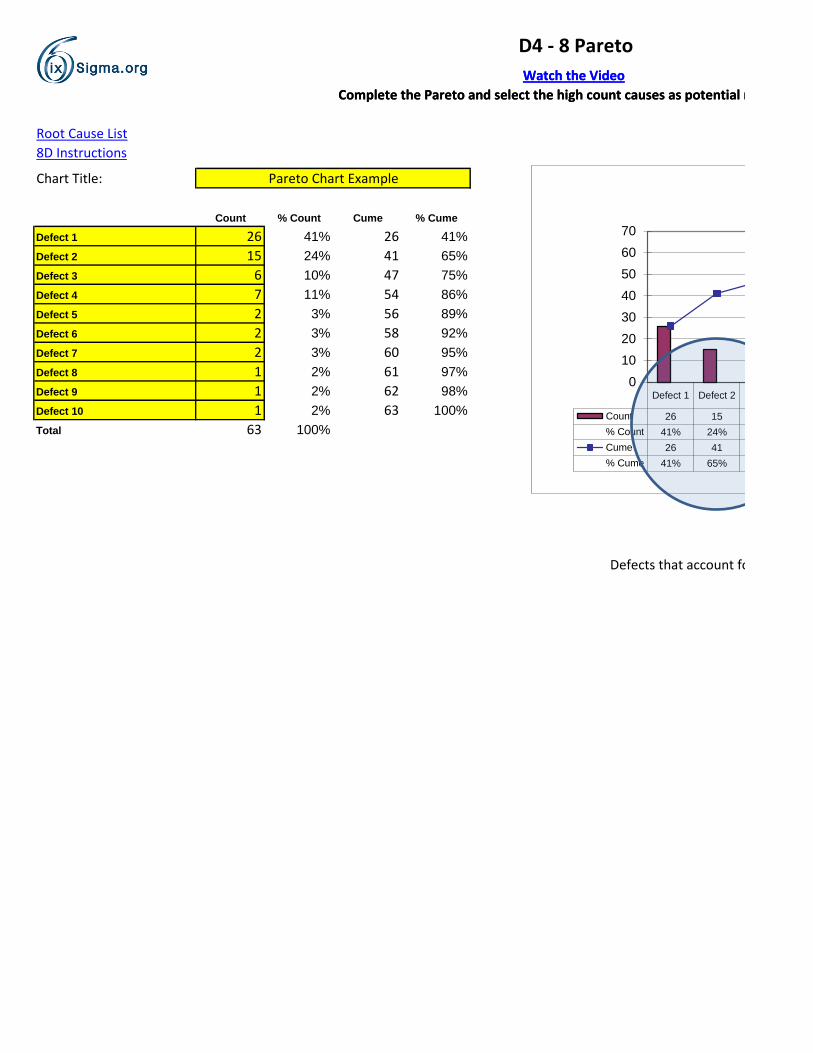
Complete the Pareto and select the high count causes as potential root causes
Watch the Video
Complete the Pareto and select the high count causes as potential root causes
Root Cause List
8D Instructions
Chart Title:
Count % Count Cume % Cume
Defect 1 26 41% 26 41%
Defect 2 15 24% 41 65%
Defect 3 6 10% 47 75%
Defect 4 7 11% 54 86%
Defect 5 2 3% 56 89%
Defect 6 2 3% 58 92%
Defect 7 2 3% 60 95%
Defect 8 1 2% 61 97%
Defect 9 1 2% 62 98%
Defect 10 1 2% 63 100%
Total 63 100%
Defects that account for 80% of observed frequencies are treated as Root Cause
Pareto Chart Example
Defect 1 Defect 2 Defect 3
Count 26 15
% Count 41% 24%
Cume 26 41
% Cume 41% 65%
0
10
20
30
40
50
60
70

Defects that account for 80% of observed frequencies are treated as Root Cause
D4 - 8 Pareto
Complete the Pareto and select the high count causes as potential root causes
Defect 3 Defect 4 Defect 5 Defect 6 Defect 7 Defect 8 Defect 9Defect
10
6 7 2 2 2 1 1 1
10% 11% 3% 3% 3% 2% 2% 2%
47 54 56 58 60 61 62 63
75% 86% 89% 92% 95% 97% 98% 100%
Pareto Chart Example

D4 - 9 Fish Bone
Watch the Video
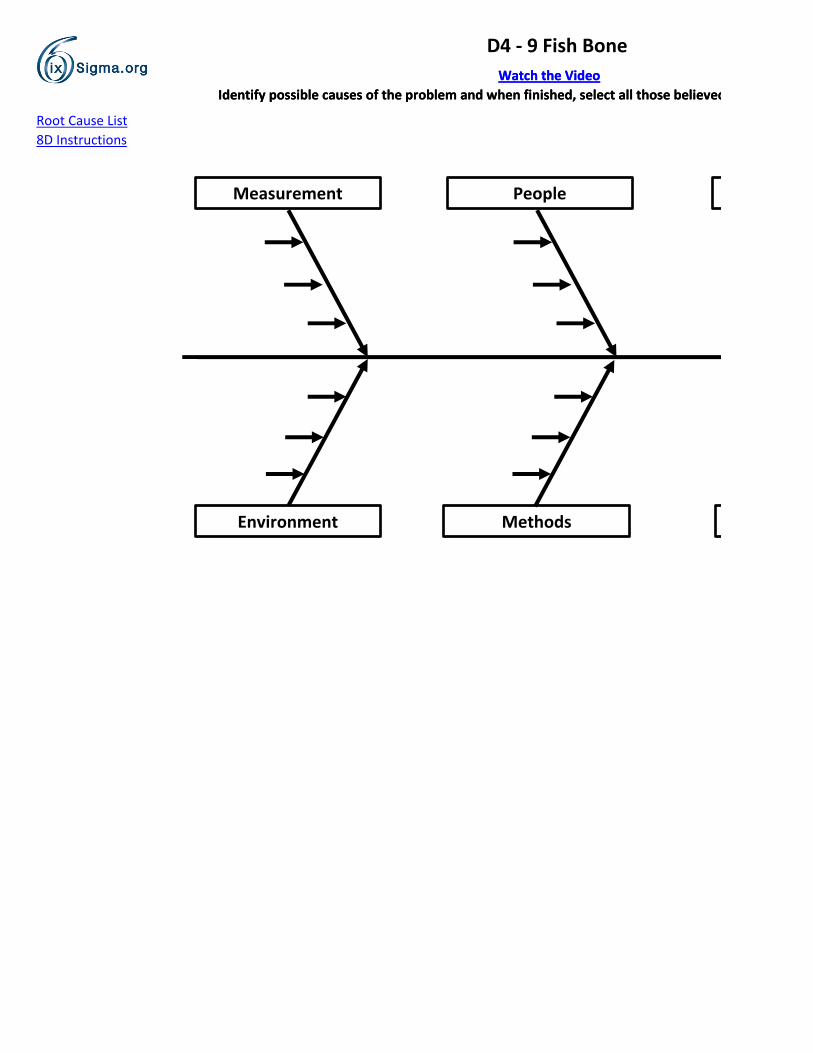
Identify possible causes of the problem and when finished, select all those believed to be potential root causes
Watch the Video
Identify possible causes of the problem and when finished, select all those believed to be potential root causes
Root Cause List
8D Instructions
Measurement People
Environment Methods
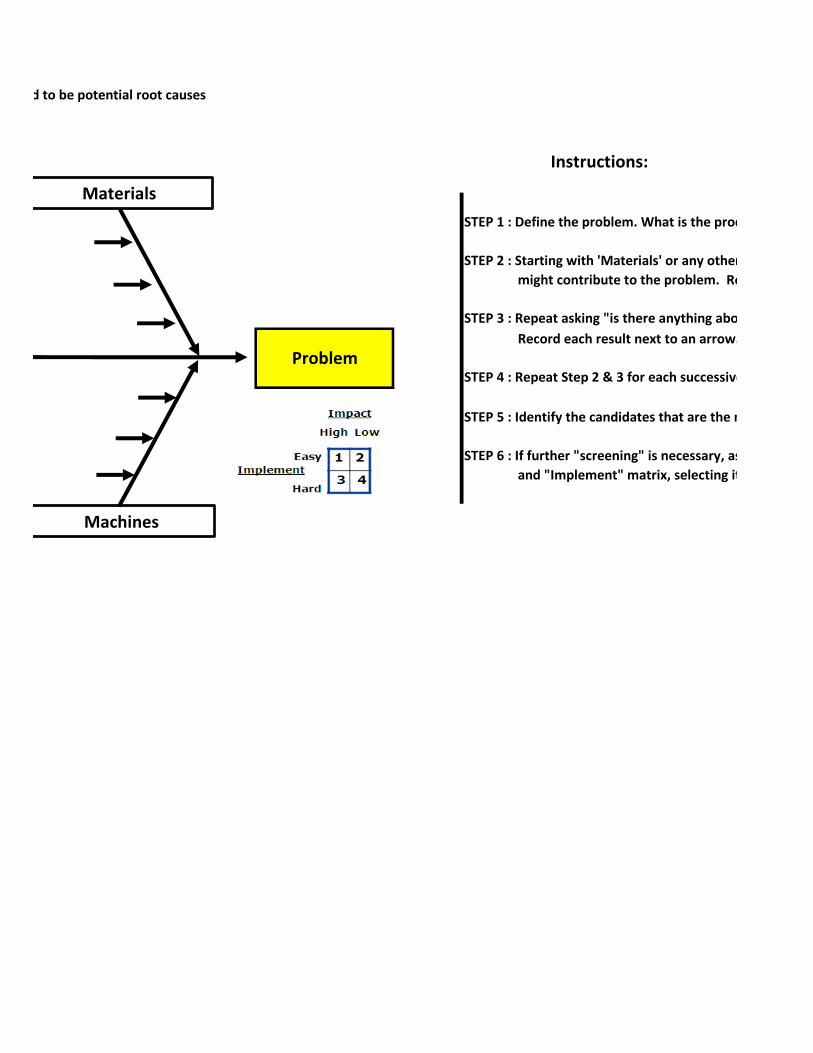
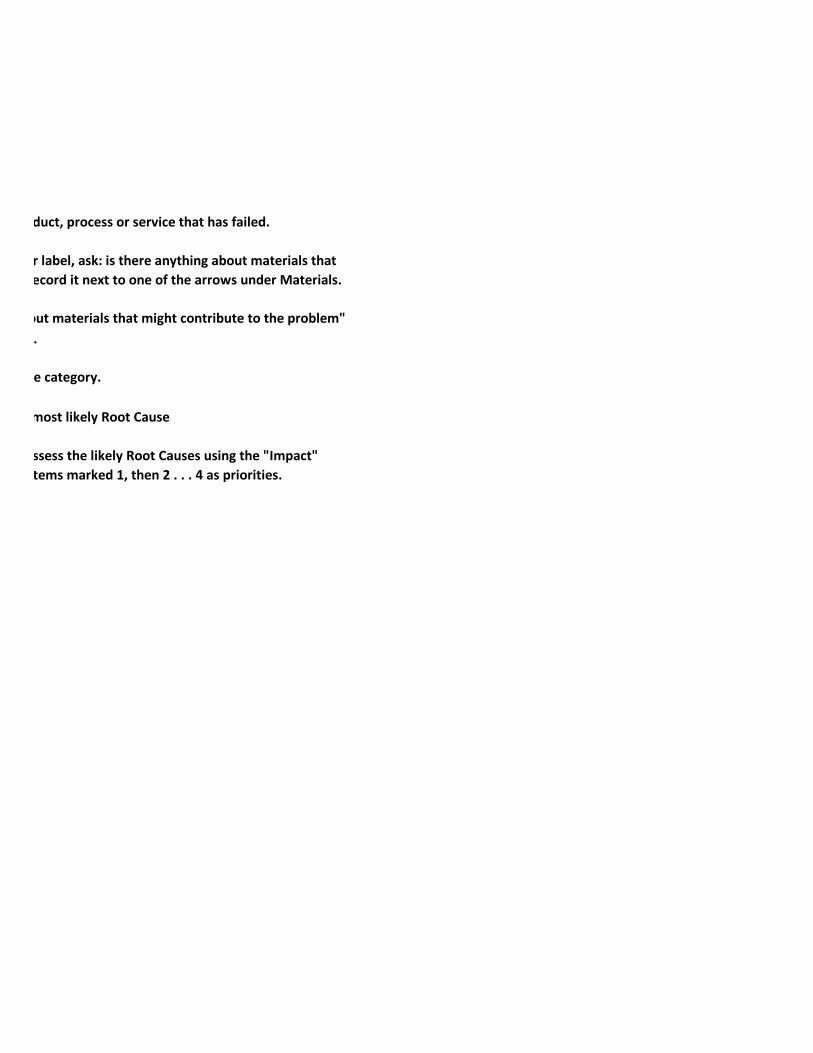
STEP 1 : Define the problem. What is the product, process or service that has failed.
STEP 2 : Starting with 'Materials' or any other label, ask: is there anything about materials that
might contribute to the problem. Record it next to one of the arrows under Materials.
STEP 3 : Repeat asking "is there anything about materials that might contribute to the problem"
Record each result next to an arrow.
STEP 4 : Repeat Step 2 & 3 for each successive category.
STEP 5 : Identify the candidates that are the most likely Root Cause
STEP 6 : If further "screening" is necessary, assess the likely Root Causes using the "Impact"
and "Implement" matrix, selecting items marked 1, then 2 . . . 4 as priorities.
Problem
D4 - 9 Fish Bone
Identify possible causes of the problem and when finished, select all those believed to be potential root causes
Instructions:
Materials
Machines
STEP 1 : Define the problem. What is the product, process or service that has failed.
STEP 2 : Starting with 'Materials' or any other label, ask: is there anything about materials that
might contribute to the problem. Record it next to one of the arrows under Materials.
STEP 3 : Repeat asking "is there anything about materials that might contribute to the problem"
Record each result next to an arrow.
STEP 4 : Repeat Step 2 & 3 for each successive category.
STEP 5 : Identify the candidates that are the most likely Root Cause
STEP 6 : If further "screening" is necessary, assess the likely Root Causes using the "Impact"
and "Implement" matrix, selecting items marked 1, then 2 . . . 4 as priorities.
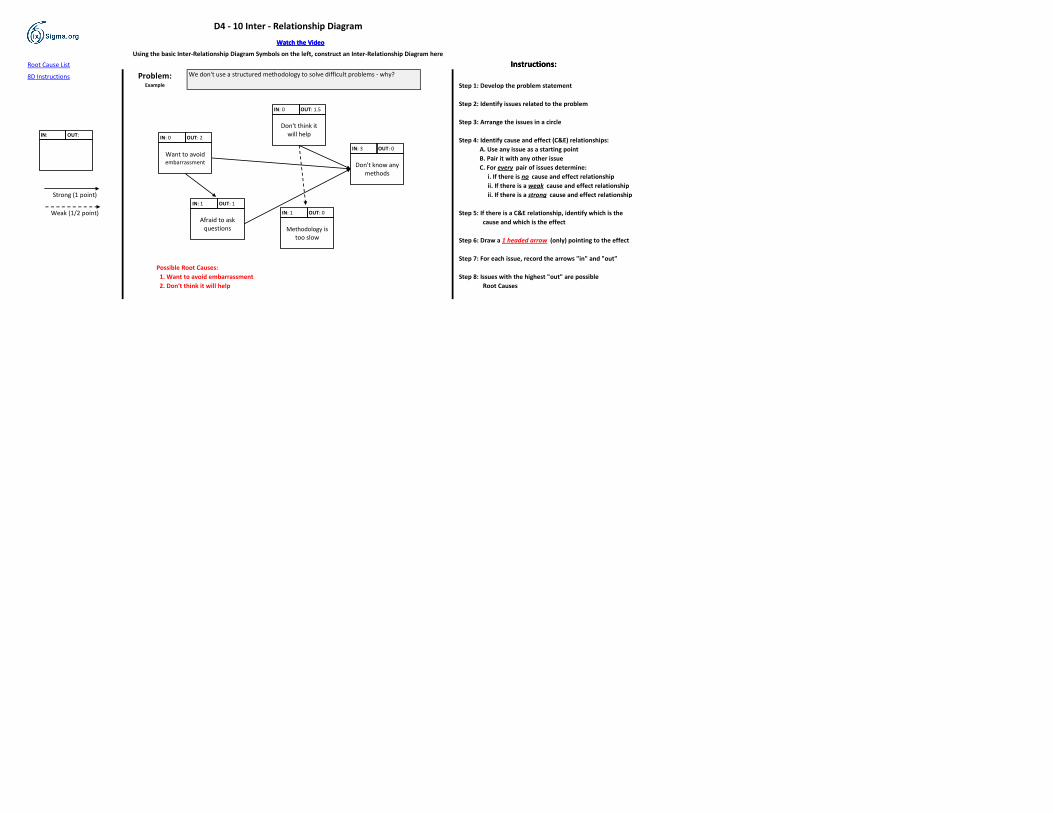
D4 - 10 Inter - Relationship Diagram
Watch the Video
Instructions:Using the basic Inter-Relationship Diagram Symbols on the left, construct an Inter-Relationship Diagram here
Watch the Video
Root Cause List
8D Instructions
Step 1: Develop the problem statement
Step 2: Identify issues related to the problem
Step 3: Arrange the issues in a circle
Step 4: Identify cause and effect (C&E) relationships:
A. Use any issue as a starting point
B. Pair it with any other issue
C. For every pair of issues determine:
i. If there is no cause and effect relationship
ii. If there is a weak cause and effect relationship
ii. If there is a strong cause and effect relationship
Step 5: If there is a C&E relationship, identify which is the
cause and which is the effect
Step 6: Draw a 1 headed arrow (only) pointing to the effect
Step 7: For each issue, record the arrows "in" and "out"
Possible Root Causes:
1. Want to avoid embarrassment Step 8: Issues with the highest "out" are possible
2. Don't think it will help Root Causes
Weak (1/2 point)
Instructions:We don't use a structured methodology to solve difficult problems - why?Problem:
Example
Strong (1 point)
IN: OUT:
Don't know any methods
IN: 3 OUT: 0
Don't think it will help
IN: 0 OUT: 1.5
Methodology is too slow
IN: 1 OUT: 0
Afraid to ask questions
IN: 1 OUT: 1
Want to avoid embarrassment
IN: 0 OUT: 2
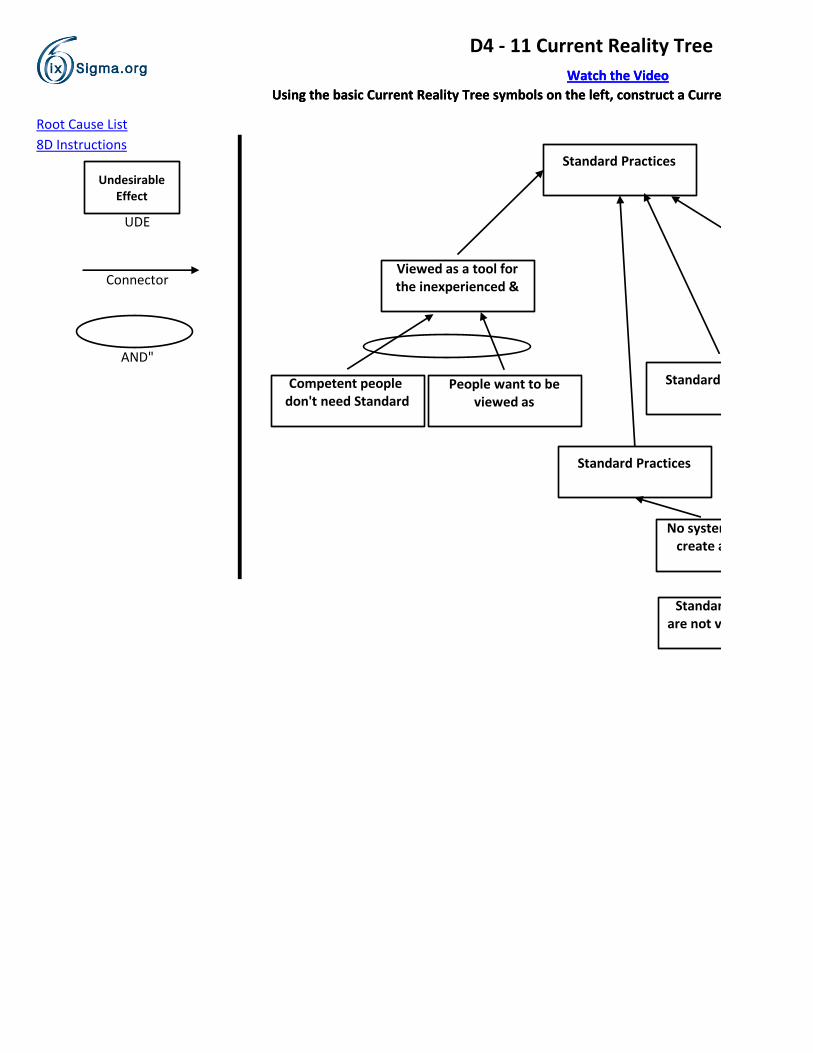
D4 - 11 Current Reality Tree
Watch the Video
Using the basic Current Reality Tree symbols on the left, construct a Current Reality Tree here
Watch the Video
Using the basic Current Reality Tree symbols on the left, construct a Current Reality Tree here
Root Cause List
8D Instructions
AND"
UDE
Connector
Undesirable Effect
Standard Practices
Viewed as a tool for the inexperienced &
People want to be viewed as
Competent people don't need Standard
Standard Practices
Standard Practices
No systemcreate and update
Standard Practicesare not valued by the
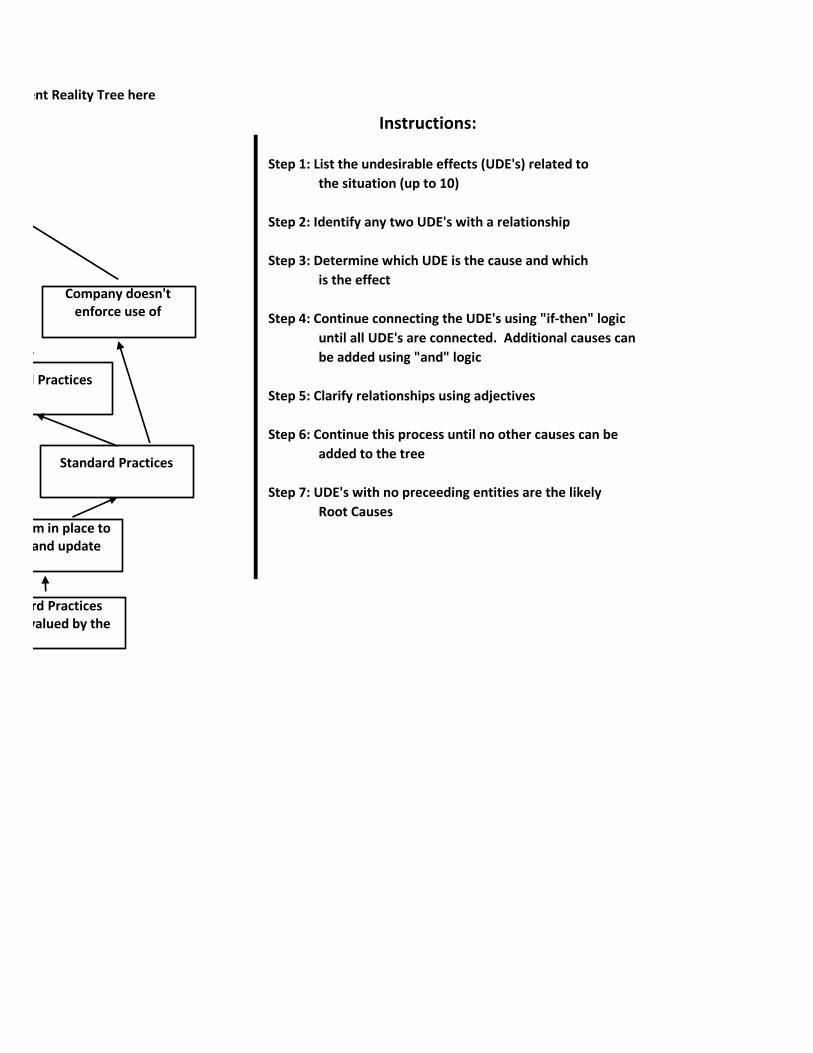
Step 1: List the undesirable effects (UDE's) related to
the situation (up to 10)
Step 2: Identify any two UDE's with a relationship
Step 3: Determine which UDE is the cause and which
is the effect
Step 4: Continue connecting the UDE's using "if-then" logic
until all UDE's are connected. Additional causes can
be added using "and" logic
Step 5: Clarify relationships using adjectives
Step 6: Continue this process until no other causes can be
added to the tree
Step 7: UDE's with no preceeding entities are the likely
Root Causes
Instructions:
Using the basic Current Reality Tree symbols on the left, construct a Current Reality Tree here
D4 - 11 Current Reality Tree
Company doesn't enforce use of
Standard Practices
Standard Practices
No system in place to create and update
Standard Practices are not valued by the

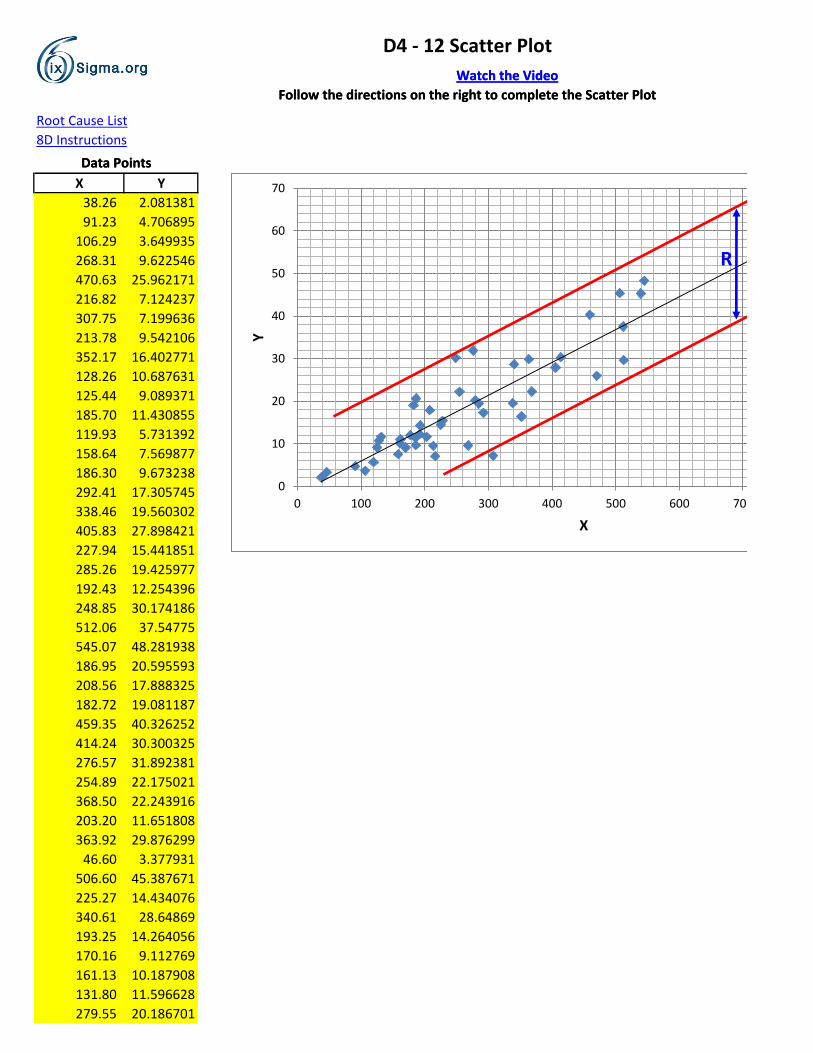
D4 - 12 Scatter Plot
Watch the Video
Follow the directions on the right to complete the Scatter Plot
Watch the Video
Follow the directions on the right to complete the Scatter Plot
Root Cause List
8D Instructions
Data Points
X Y
38.26 2.081381
91.23 4.706895
106.29 3.649935
268.31 9.622546
470.63 25.962171
216.82 7.124237
307.75 7.199636
213.78 9.542106
352.17 16.402771
128.26 10.687631
125.44 9.089371
185.70 11.430855
119.93 5.731392
158.64 7.569877
186.30 9.673238
292.41 17.305745
338.46 19.560302
405.83 27.898421
227.94 15.441851
285.26 19.425977
192.43 12.254396
248.85 30.174186
512.06 37.54775
545.07 48.281938
186.95 20.595593
208.56 17.888325
182.72 19.081187
459.35 40.326252
414.24 30.300325
276.57 31.892381
254.89 22.175021
368.50 22.243916
203.20 11.651808
363.92 29.876299
46.60 3.377931
506.60 45.387671
225.27 14.434076
340.61 28.64869
193.25 14.264056
170.16 9.112769
161.13 10.187908
131.80 11.596628
279.55 20.186701
Data Points
0
10
20
30
40
50
60
70
0 100 200 300 400 500 600 700
Y
X
R

161.96 11.07718
512.89 29.678582
807.69 59.404809
177.67 12.047774
539.72 45.28834
D4 - 12 Scatter Plot
Follow the directions on the right to complete the Scatter Plot
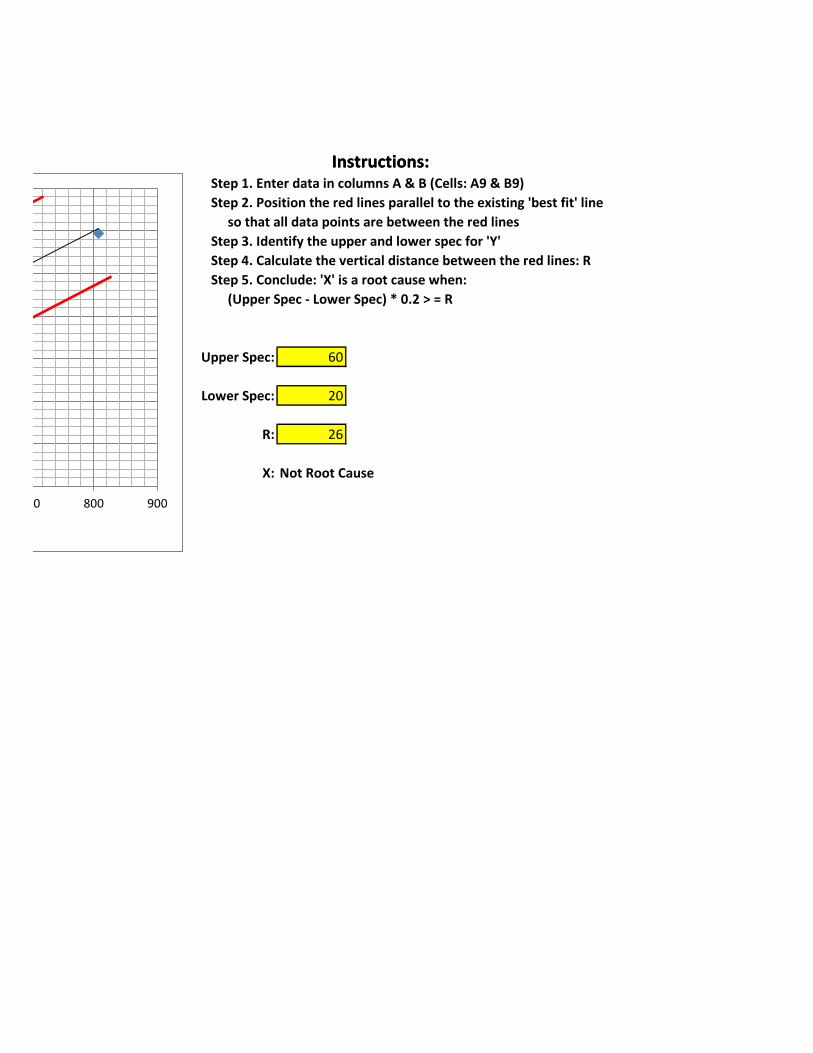
Instructions:Step 1. Enter data in columns A & B (Cells: A9 & B9)
Step 2. Position the red lines parallel to the existing 'best fit' line
so that all data points are between the red lines
Step 3. Identify the upper and lower spec for 'Y'
Step 4. Calculate the vertical distance between the red lines: R
Step 5. Conclude: 'X' is a root cause when:
(Upper Spec - Lower Spec) * 0.2 > = R
Upper Spec: 60
Lower Spec: 20
R: 26
X: Not Root Cause
Instructions:
700 800 900


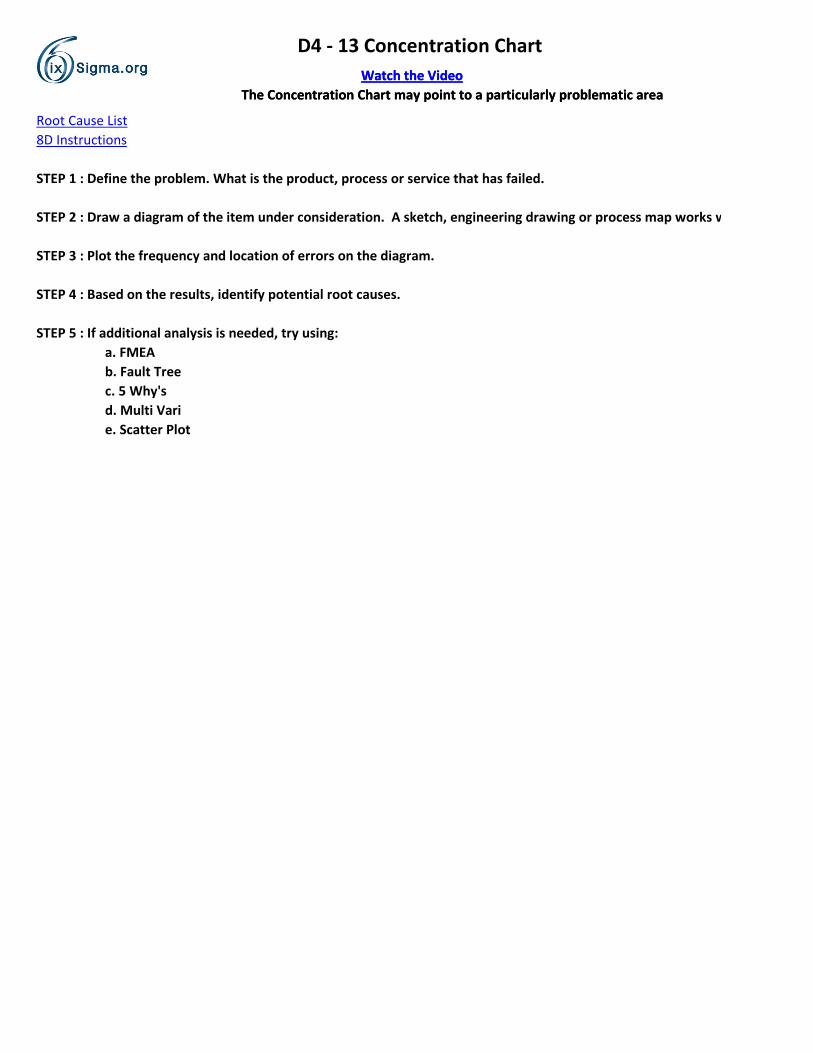
D4 - 13 Concentration Chart
Watch the Video
The Concentration Chart may point to a particularly problematic area
Watch the Video
The Concentration Chart may point to a particularly problematic area
Root Cause List
8D Instructions
STEP 1 : Define the problem. What is the product, process or service that has failed.
STEP 2 : Draw a diagram of the item under consideration. A sketch, engineering drawing or process map works well.
STEP 3 : Plot the frequency and location of errors on the diagram.
STEP 4 : Based on the results, identify potential root causes.
STEP 5 : If additional analysis is needed, try using:
a. FMEA
b. Fault Tree
c. 5 Why's
d. Multi Vari
e. Scatter Plot

STEP 2 : Draw a diagram of the item under consideration. A sketch, engineering drawing or process map works well.
D4 - 13 Concentration Chart
The Concentration Chart may point to a particularly problematic area

D4-14
Root Cause List
8D Instructions
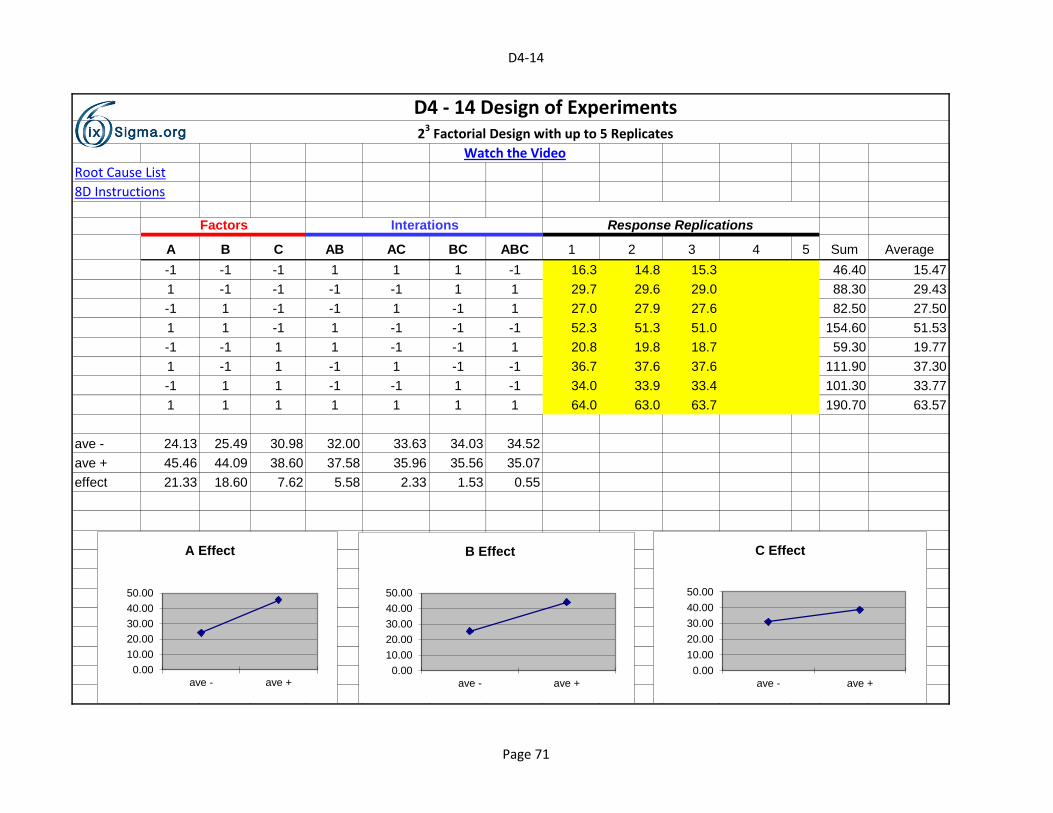
A B C AB AC BC ABC 1 2 3 4 5 Sum Average
-1 -1 -1 1 1 1 -1 16.3 14.8 15.3 46.40 15.47
1 -1 -1 -1 -1 1 1 29.7 29.6 29.0 88.30 29.43
-1 1 -1 -1 1 -1 1 27.0 27.9 27.6 82.50 27.50
1 1 -1 1 -1 -1 -1 52.3 51.3 51.0 154.60 51.53
-1 -1 1 1 -1 -1 1 20.8 19.8 18.7 59.30 19.77
1 -1 1 -1 1 -1 -1 36.7 37.6 37.6 111.90 37.30
-1 1 1 -1 -1 1 -1 34.0 33.9 33.4 101.30 33.77
1 1 1 1 1 1 1 64.0 63.0 63.7 190.70 63.57
ave - 24.13 25.49 30.98 32.00 33.63 34.03 34.52
ave + 45.46 44.09 38.60 37.58 35.96 35.56 35.07
effect 21.33 18.60 7.62 5.58 2.33 1.53 0.55
D4 - 14 Design of Experiments23 Factorial Design with up to 5 Replicates
Response ReplicationsFactors Interations
Watch the Video
0.00
10.00
20.00
30.00
40.00
50.00
ave - ave +
A Effect
0.00
10.00
20.00
30.00
40.00
50.00
ave - ave +
B Effect
0.00
10.00
20.00
30.00
40.00
50.00
ave - ave +
C Effect
Page 71
D4-14
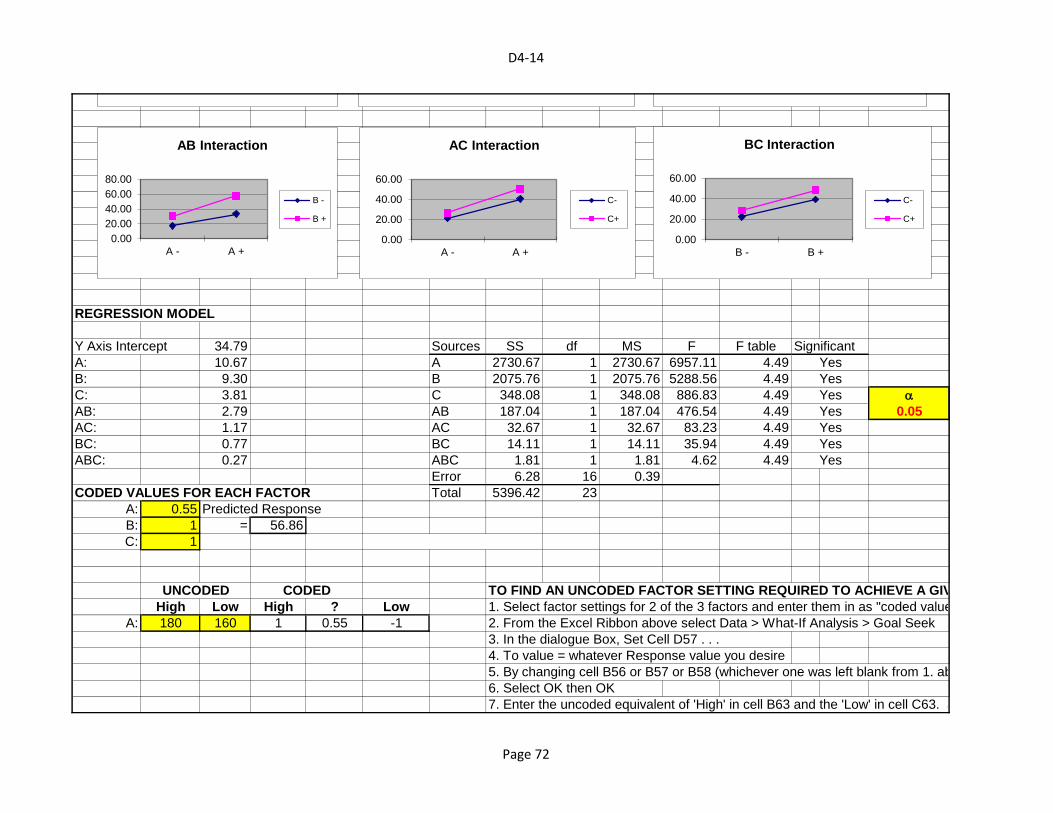
REGRESSION MODEL
Y Axis Intercept 34.79 Sources SS df MS F F table Significant
A: 10.67 A 2730.67 1 2730.67 6957.11 4.49
B: 9.30 B 2075.76 1 2075.76 5288.56 4.49
C: 3.81 C 348.08 1 348.08 886.83 4.49 a
AB: 2.79 AB 187.04 1 187.04 476.54 4.49 0.05
AC: 1.17 AC 32.67 1 32.67 83.23 4.49
BC: 0.77 BC 14.11 1 14.11 35.94 4.49
ABC: 0.27 ABC 1.81 1 1.81 4.62 4.49
Error 6.28 16 0.39
CODED VALUES FOR EACH FACTOR Total 5396.42 23
A: 0.55 Predicted Response
B: 1 = 56.86
C: 1
TO FIND AN UNCODED FACTOR SETTING REQUIRED TO ACHIEVE A GIVEN RESPONSE:
High Low High ? Low 1. Select factor settings for 2 of the 3 factors and enter them in as "coded values" (Cells B56, B57 and B58)
A: 180 160 1 0.55 -1 2. From the Excel Ribbon above select Data > What-If Analysis > Goal Seek
3. In the dialogue Box, Set Cell D57 . . .
4. To value = whatever Response value you desire
5. By changing cell B56 or B57 or B58 (whichever one was left blank from 1. above)
6. Select OK then OK
7. Enter the uncoded equivalent of 'High' in cell B63 and the 'Low' in cell C63. See answer in 8. below . . .
UNCODED CODED
Yes
Yes
Yes
Yes
Yes
Yes
Yes
0.00
20.00
40.00
60.00
80.00
A - A +
AB Interaction
B -
B +
0.00
20.00
40.00
60.00
A - A +
AC Interaction
C-
C+
0.00
20.00
40.00
60.00
B - B +
BC Interaction
C-
C+
Page 72

D4-14
8. So ... A = 1 coded and A = 175.5 uncoded
Page 73
D4-14
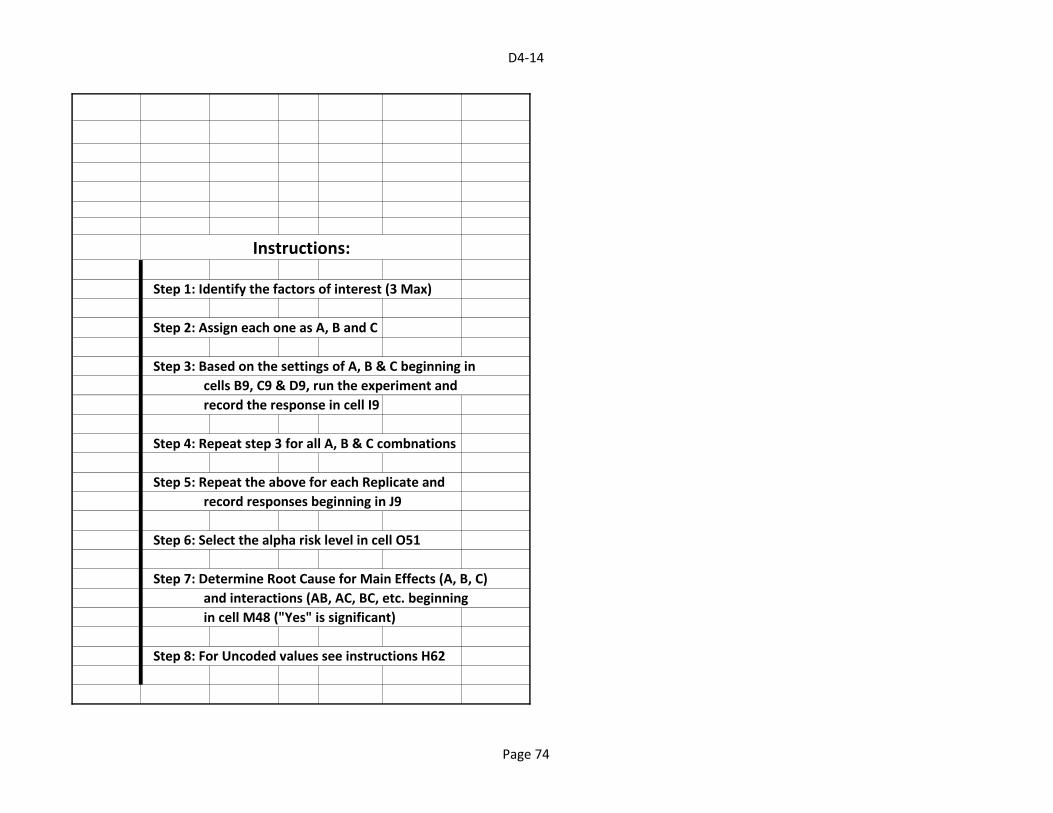
Step 1: Identify the factors of interest (3 Max)
Step 2: Assign each one as A, B and C
Step 3: Based on the settings of A, B & C beginning in
cells B9, C9 & D9, run the experiment and
record the response in cell I9
Step 4: Repeat step 3 for all A, B & C combnations
Step 5: Repeat the above for each Replicate and
record responses beginning in J9
Step 6: Select the alpha risk level in cell O51
Step 7: Determine Root Cause for Main Effects (A, B, C)
and interactions (AB, AC, BC, etc. beginning
in cell M48 ("Yes" is significant)
Step 8: For Uncoded values see instructions H62
D4 - 14 Design of Experiments23 Factorial Design with up to 5 Replicates
Instructions:
Page 74

D4-14
TO FIND AN UNCODED FACTOR SETTING REQUIRED TO ACHIEVE A GIVEN RESPONSE:
1. Select factor settings for 2 of the 3 factors and enter them in as "coded values" (Cells B56, B57 and B58)
5. By changing cell B56 or B57 or B58 (whichever one was left blank from 1. above)
7. Enter the uncoded equivalent of 'High' in cell B63 and the 'Low' in cell C63. See answer in 8. below . . .
Page 75
Root Cause List
8D Instructions
each response from Step 2 as the new problem and repeat Step 2 & 3
Step 5: Repeat the process until specific actions can be taken
Step 6: Identify Root Cause
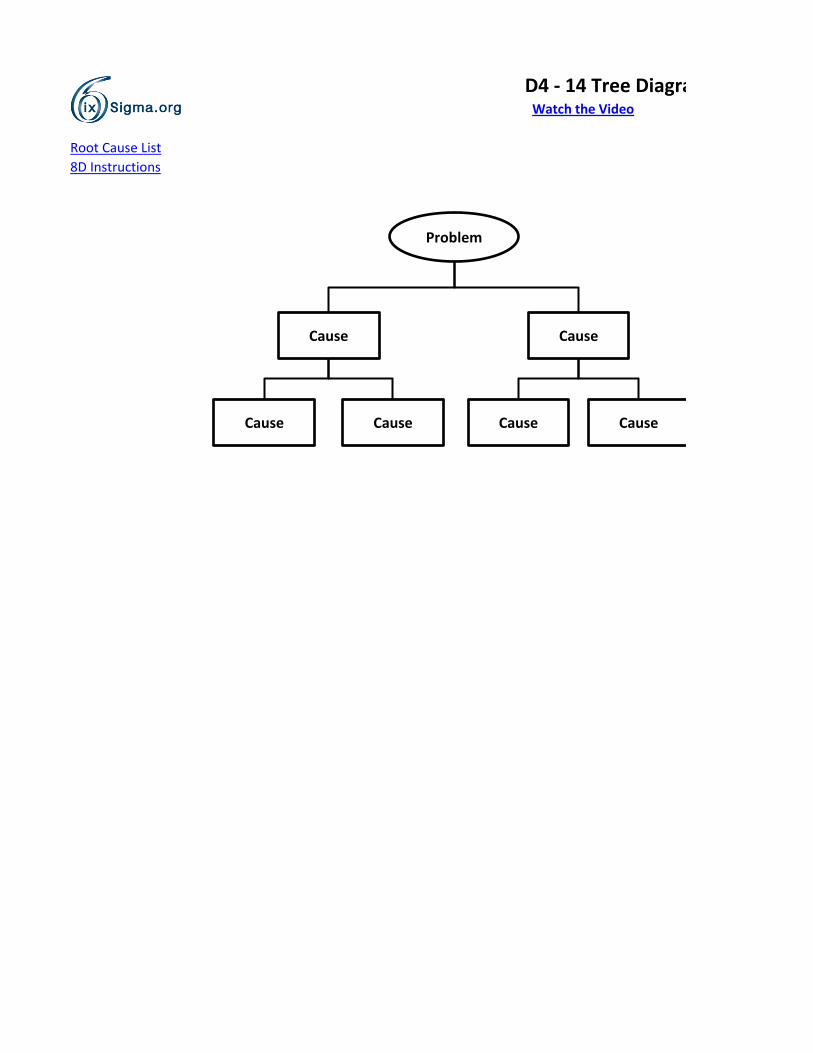
D4 - 14 Tree DiagramWatch the Video
Problem
Cause Cause
Cause Cause Cause Cause
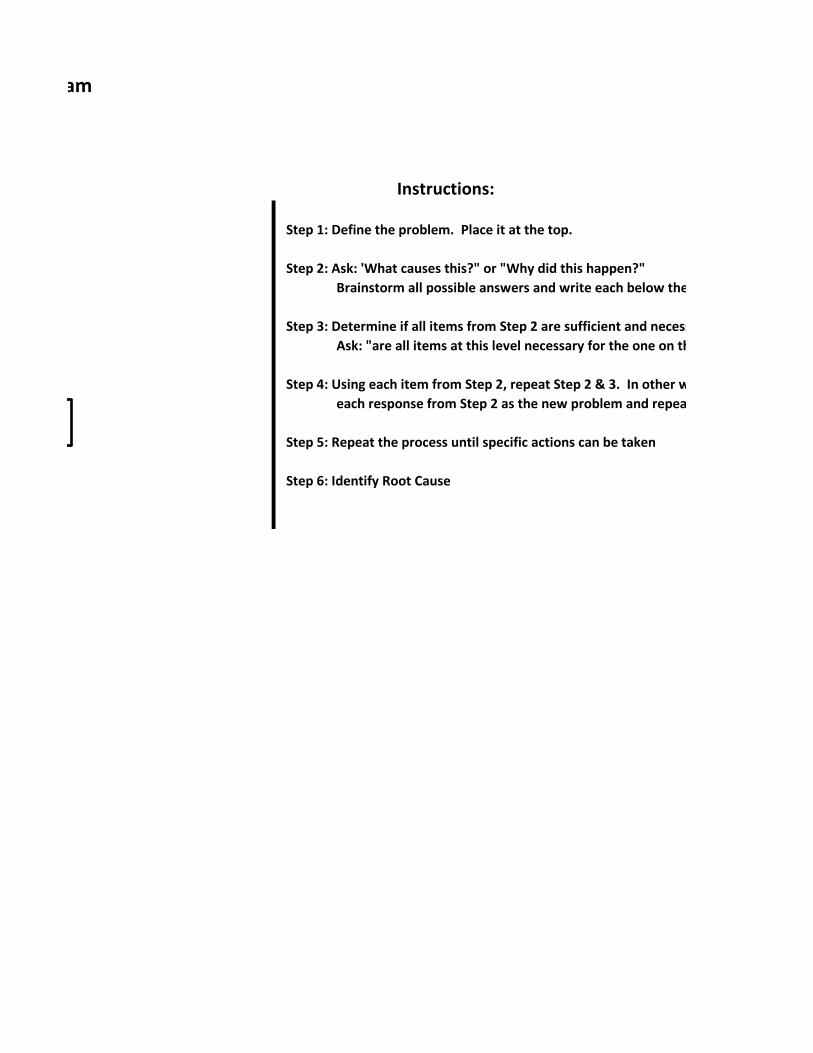
Step 1: Define the problem. Place it at the top.
Step 2: Ask: 'What causes this?" or "Why did this happen?"
Brainstorm all possible answers and write each below the problem
Step 3: Determine if all items from Step 2 are sufficient and necessary.
Ask: "are all items at this level necessary for the one on the level above?"
Step 4: Using each item from Step 2, repeat Step 2 & 3. In other words, treat
each response from Step 2 as the new problem and repeat Step 2 & 3
Step 5: Repeat the process until specific actions can be taken
Step 6: Identify Root Cause
D4 - 14 Tree Diagram
Instructions:

Brainstorm all possible answers and write each below the problem
Step 3: Determine if all items from Step 2 are sufficient and necessary.
Ask: "are all items at this level necessary for the one on the level above?"
Step 4: Using each item from Step 2, repeat Step 2 & 3. In other words, treat
each response from Step 2 as the new problem and repeat Step 2 & 3
Root Cause List
8D Instructions
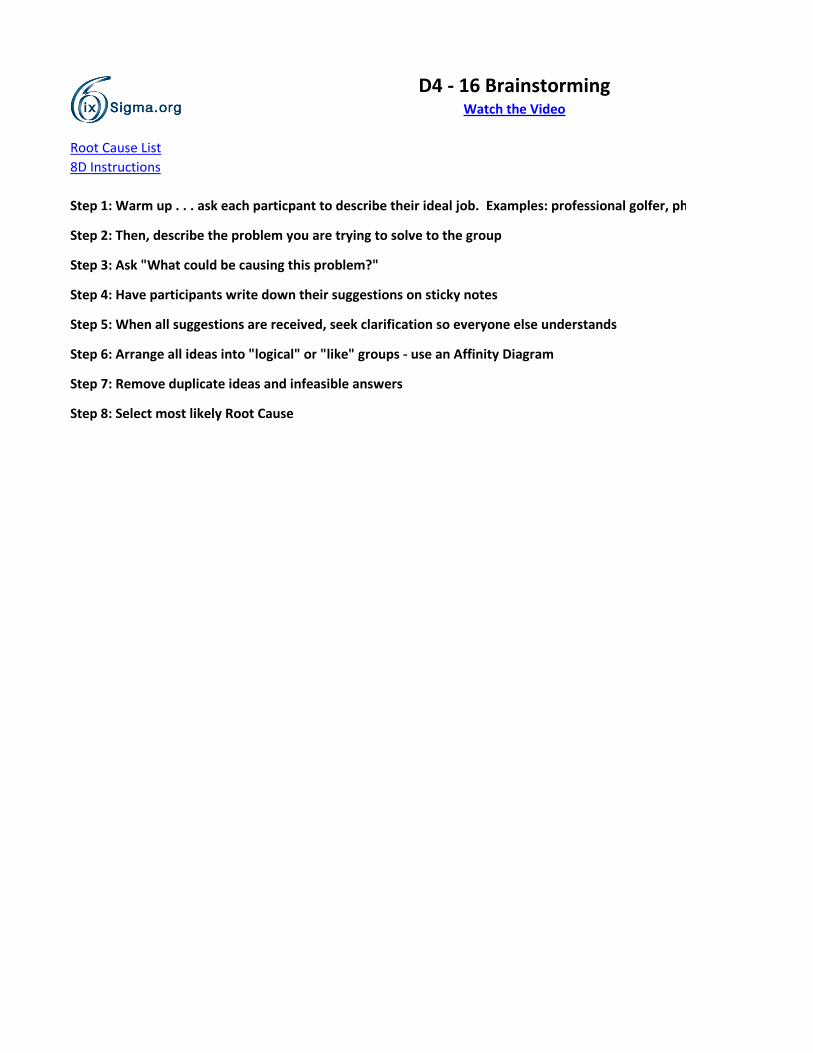
Step 1: Warm up . . . ask each particpant to describe their ideal job. Examples: professional golfer, photographer, travel consultant, etc.
Step 2: Then, describe the problem you are trying to solve to the group
Step 3: Ask "What could be causing this problem?"
Step 4: Have participants write down their suggestions on sticky notes
Step 5: When all suggestions are received, seek clarification so everyone else understands
Step 6: Arrange all ideas into "logical" or "like" groups - use an Affinity Diagram
Step 7: Remove duplicate ideas and infeasible answers
Step 8: Select most likely Root Cause
D4 - 16 BrainstormingWatch the Video

Step 1: Warm up . . . ask each particpant to describe their ideal job. Examples: professional golfer, photographer, travel consultant, etc.
D4 - 16 Brainstorming
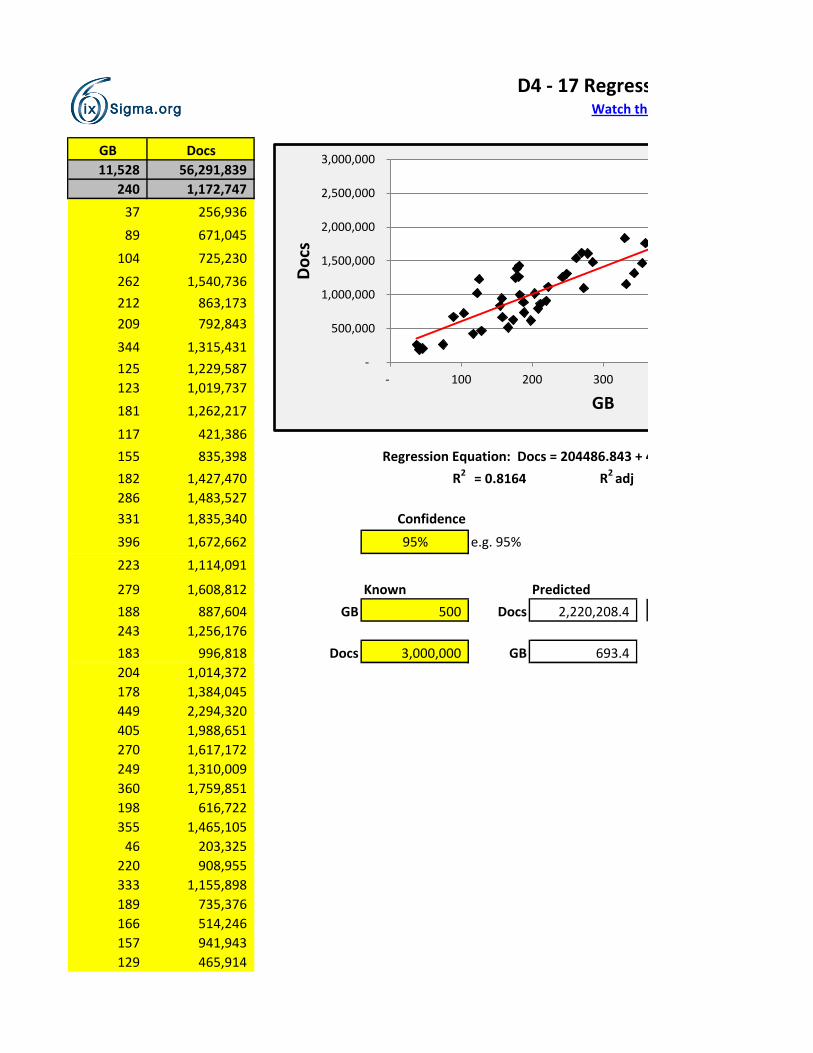
GB Docs
11,528 56,291,839
240 1,172,747
37 256,936
89 671,045
104 725,230
262 1,540,736
212 863,173
209 792,843
344 1,315,431
125 1,229,587
123 1,019,737
181 1,262,217
117 421,386
155 835,398
182 1,427,470 R2 = 0.8164 R2 adj
286 1,483,527
331 1,835,340 Confidence
396 1,672,662 95% e.g. 95%
223 1,114,091
279 1,608,812 Known Predicted
188 887,604 GB 500 Docs 2,220,208.4
243 1,256,176
183 996,818 Docs 3,000,000 GB 693.4
204 1,014,372
178 1,384,045
449 2,294,320
405 1,988,651
270 1,617,172
249 1,310,009
360 1,759,851
198 616,722
355 1,465,105
46 203,325
220 908,955
333 1,155,898
189 735,376
166 514,246
157 941,943
129 465,914
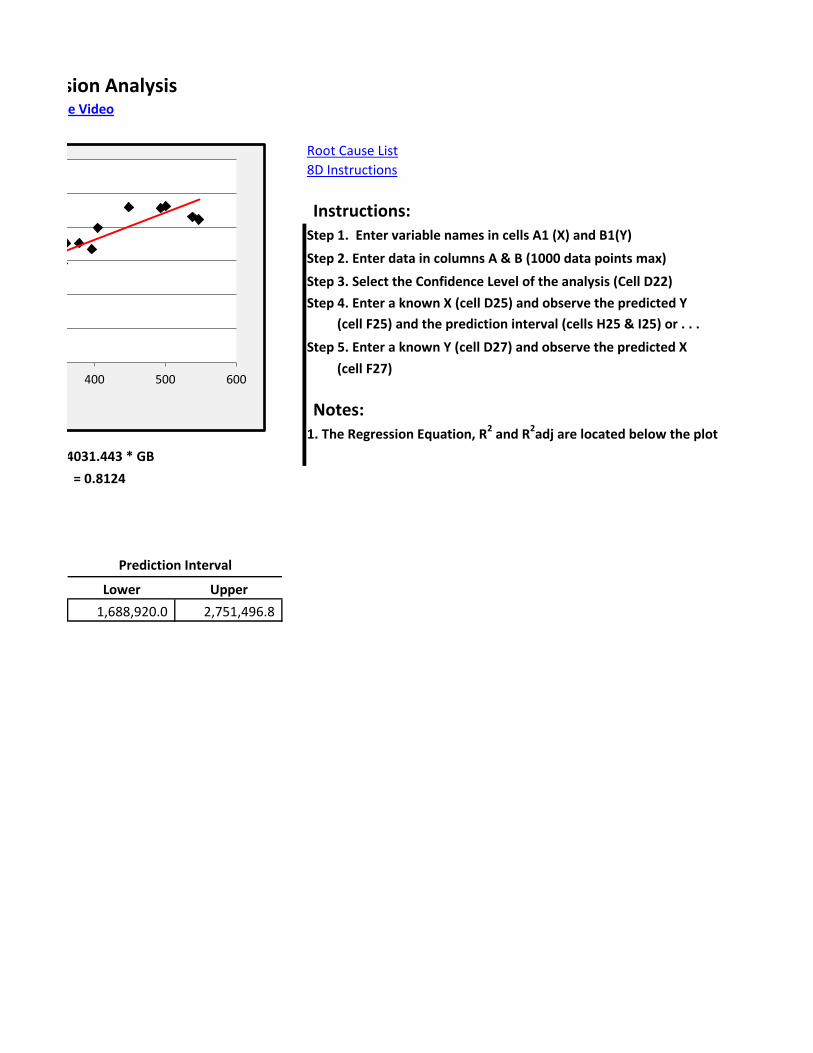
Regression Equation: Docs = 204486.843 + 4031.443 * GB
D4 - 17 Regression AnalysisWatch the Video
-
500,000
1,000,000
1,500,000
2,000,000
2,500,000
3,000,000
- 100 200 300
Do
cs
GB

273 1,099,136
158 666,556
501 2,307,524
174 626,189
378 1,762,608
547 2,109,892
41 182,682
74 262,055
177 1,248,915
538 2,152,805
494 2,281,354


Root Cause List
8D Instructions
Instructions:Step 1. Enter variable names in cells A1 (X) and B1(Y)
Step 2. Enter data in columns A & B (1000 data points max)
Step 3. Select the Confidence Level of the analysis (Cell D22)
Step 4. Enter a known X (cell D25) and observe the predicted Y
(cell F25) and the prediction interval (cells H25 & I25) or . . .
Step 5. Enter a known Y (cell D27) and observe the predicted X
(cell F27)
Notes:1. The Regression Equation, R2 and R2adj are located below the plot
= 0.8124
Lower Upper
1,688,920.0 2,751,496.8
Regression Equation: Docs = 204486.843 + 4031.443 * GB
Prediction Interval
D4 - 17 Regression AnalysisWatch the Video
400 500 600
8D Instructions
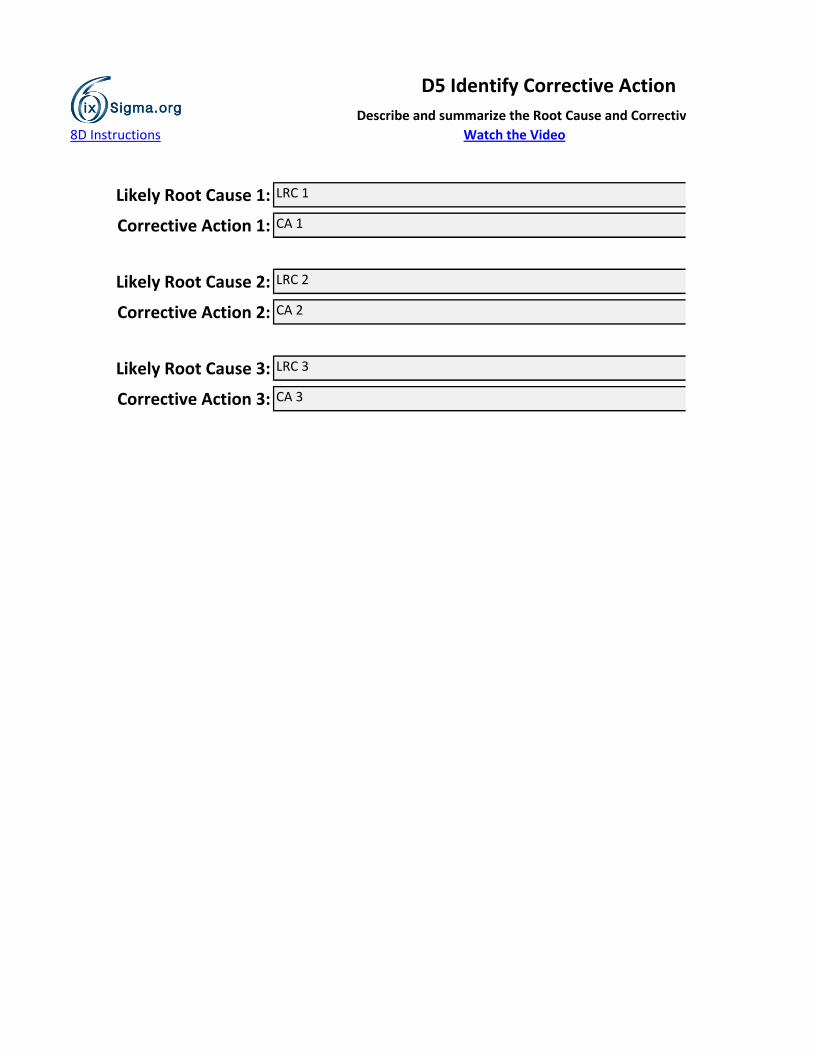
Likely Root Cause 1:
Corrective Action 1:
Likely Root Cause 2:
Corrective Action 2:
Likely Root Cause 3:
Corrective Action 3:
CA 2
LRC 3
CA 3
D5 Identify Corrective Action
Describe and summarize the Root Cause and Corrective Actiion
LRC 1
CA 1
LRC 2
Watch the Video
Next >>>
Next >>>
CA 2
LRC 3
CA 3
D5 Identify Corrective Action
Describe and summarize the Root Cause and Corrective Actiion
LRC 1
CA 1
LRC 2
8D Instructions
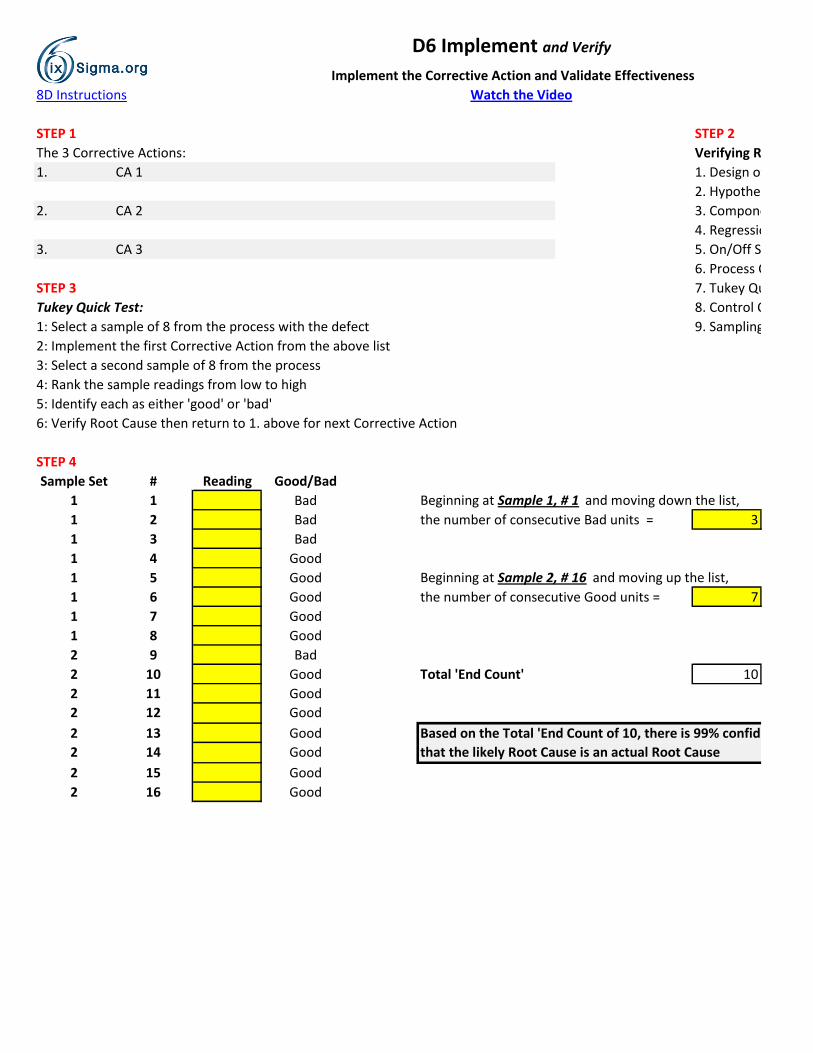
STEP 1 STEP 2
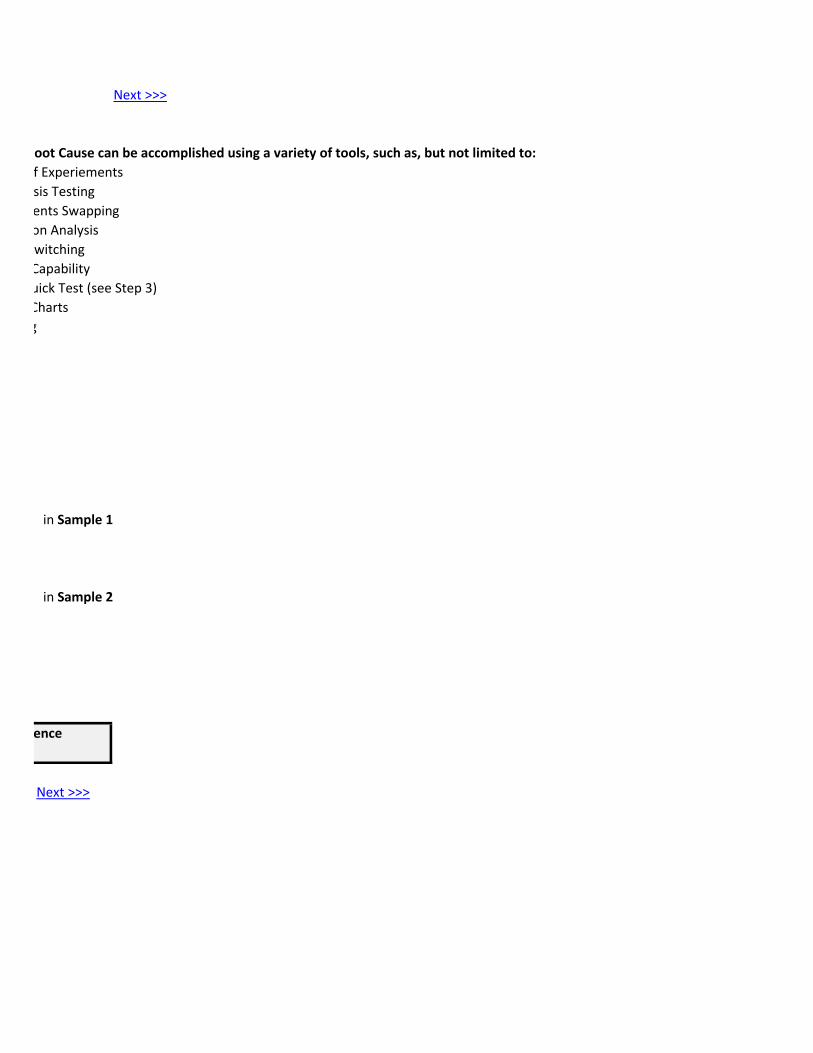
The 3 Corrective Actions: Verifying Root Cause can be accomplished using a variety of tools, such as, but not limited to:
1. CA 1 1. Design of Experiements
2. Hypothesis Testing
2. CA 2 3. Components Swapping
4. Regression Analysis
3. CA 3 5. On/Off Switching
6. Process Capability
STEP 3 7. Tukey Quick Test (see Step 3)
Tukey Quick Test: 8. Control Charts
1: Select a sample of 8 from the process with the defect 9. Sampling
2: Implement the first Corrective Action from the above list
3: Select a second sample of 8 from the process
4: Rank the sample readings from low to high
5: Identify each as either 'good' or 'bad'
6: Verify Root Cause then return to 1. above for next Corrective Action
STEP 4
Sample Set # Reading Good/Bad
1 1 Bad Beginning at Sample 1, # 1 and moving down the list,
1 2 Bad the number of consecutive Bad units = 3
1 3 Bad
1 4 Good
1 5 Good Beginning at Sample 2, # 16 and moving up the list,
1 6 Good the number of consecutive Good units = 7
1 7 Good
1 8 Good
2 9 Bad
2 10 Good Total 'End Count' 10
2 11 Good
2 12 Good
2 13 Good Based on the Total 'End Count of 10, there is 99% confidence
2 14 Good that the likely Root Cause is an actual Root Cause
2 15 Good
2 16 Good
D6 Implement and Verify
Implement the Corrective Action and Validate Effectiveness
Watch the Video
Next >>>
Verifying Root Cause can be accomplished using a variety of tools, such as, but not limited to:
1. Design of Experiements
2. Hypothesis Testing
3. Components Swapping
4. Regression Analysis
5. On/Off Switching
6. Process Capability
7. Tukey Quick Test (see Step 3)
8. Control Charts
9. Sampling
in Sample 1
in Sample 2
Based on the Total 'End Count of 10, there is 99% confidence
Next >>>
D6 Implement and Verify
Implement the Corrective Action and Validate Effectiveness
8D Instructions
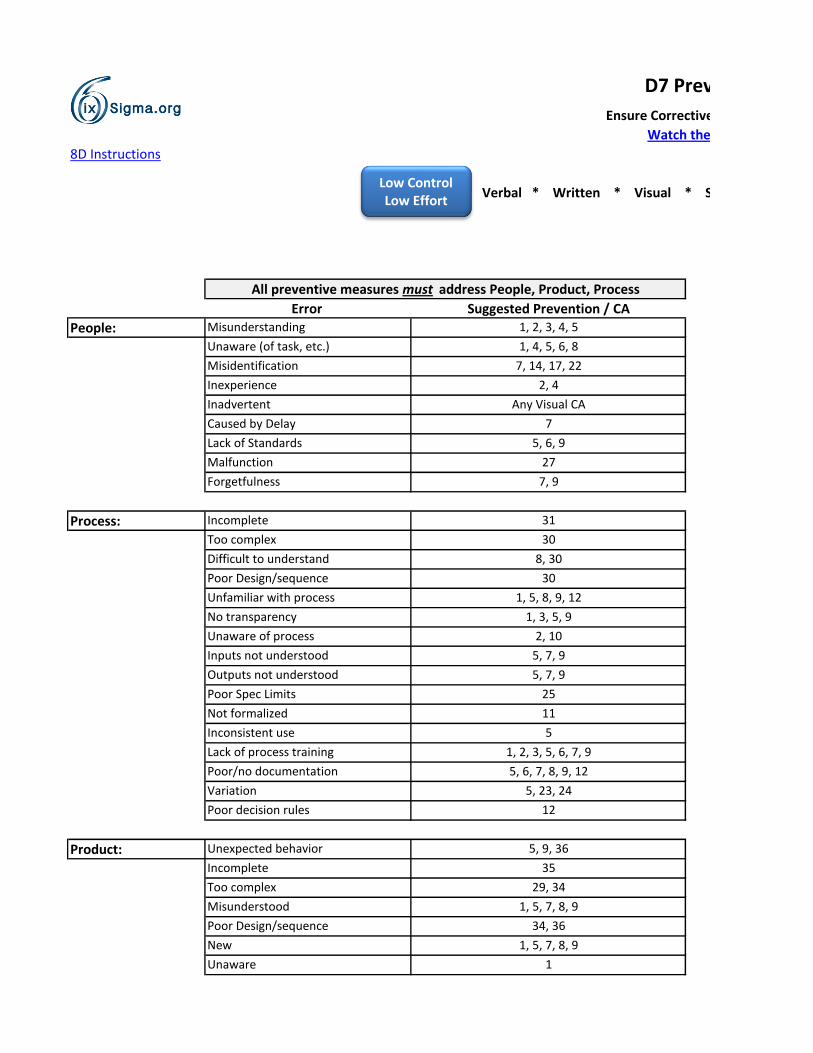
Verbal * Written * Visual * SPC * Mistake Proofing * New Design
Error
1, 2, 3, 5, 6, 7, 9
5, 6, 7, 8, 9, 12
5, 23, 24
1, 3, 5, 9
2, 10
5, 7, 9
5, 7, 9
25
Poor Design/sequence
Unfamiliar with process
No transparency
1, 2, 3, 4, 5
1, 4, 5, 6, 8
7, 14, 17, 22
2, 4
Any Visual CA
7
5, 6, 9
27
7, 9
31
30
8, 30
30
1, 5, 8, 9, 12
Misunderstanding
Unaware (of task, etc.)
Misidentification
Inexperience
Inadvertent
Caused by Delay
Lack of Standards
Malfunction
Forgetfulness
Incomplete
Too complex
Lack of process training
1, 5, 7, 8, 9
Unaware of process
34, 36
1, 5, 7, 8, 9
1
12
5, 9, 36
35
29, 34
11
5
Difficult to understand
All preventive measures must address People, Product, Process
New
Unaware
Unexpected behavior
Incomplete
Too complex
Misunderstood
Poor Design/sequence
Watch the Video
Product:
D7 Prevent Recurrence
Ensure Corrective Actions Prevent Recurrence
Suggested Prevention / CA
People:
Process:
Poor/no documentation
Variation
Poor decision rules
Inputs not understood
Outputs not understood
Poor Spec Limits
Not formalized
Inconsistent use
Low Control Low Effort
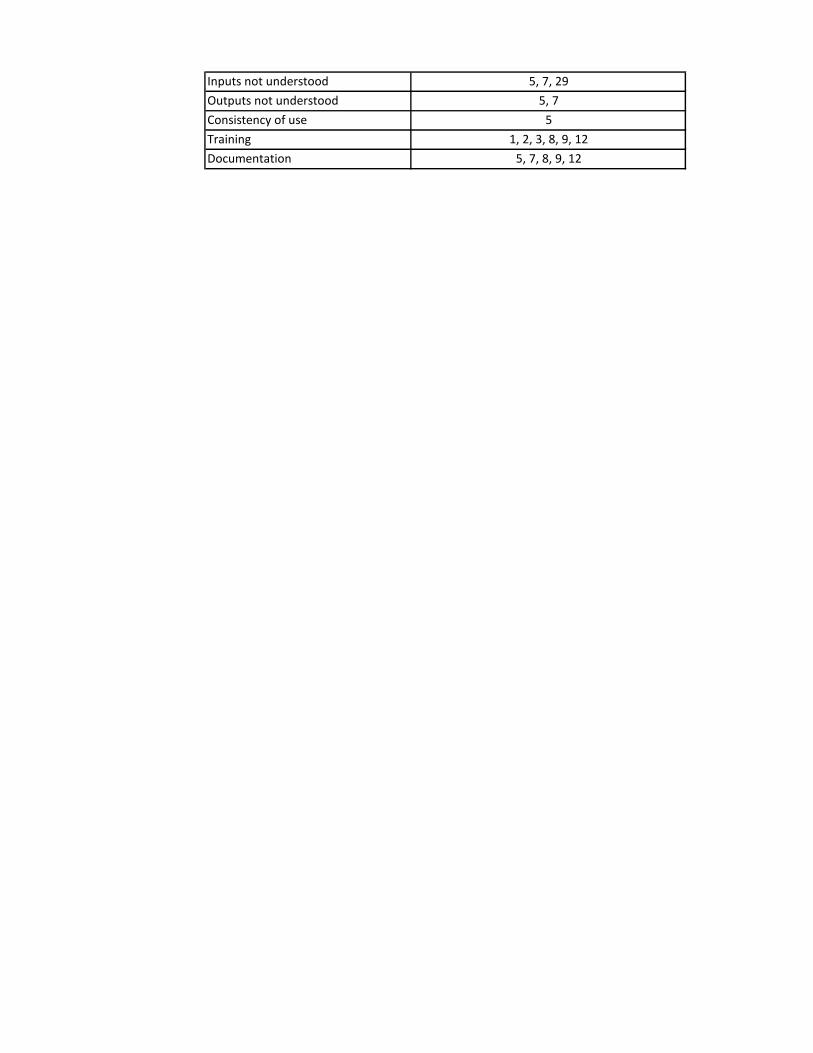
5
1, 2, 3, 8, 9, 12
5, 7, 8, 9, 12
5, 7
5, 7, 29
Training
Documentation
Inputs not understood
Outputs not understood
Consistency of use
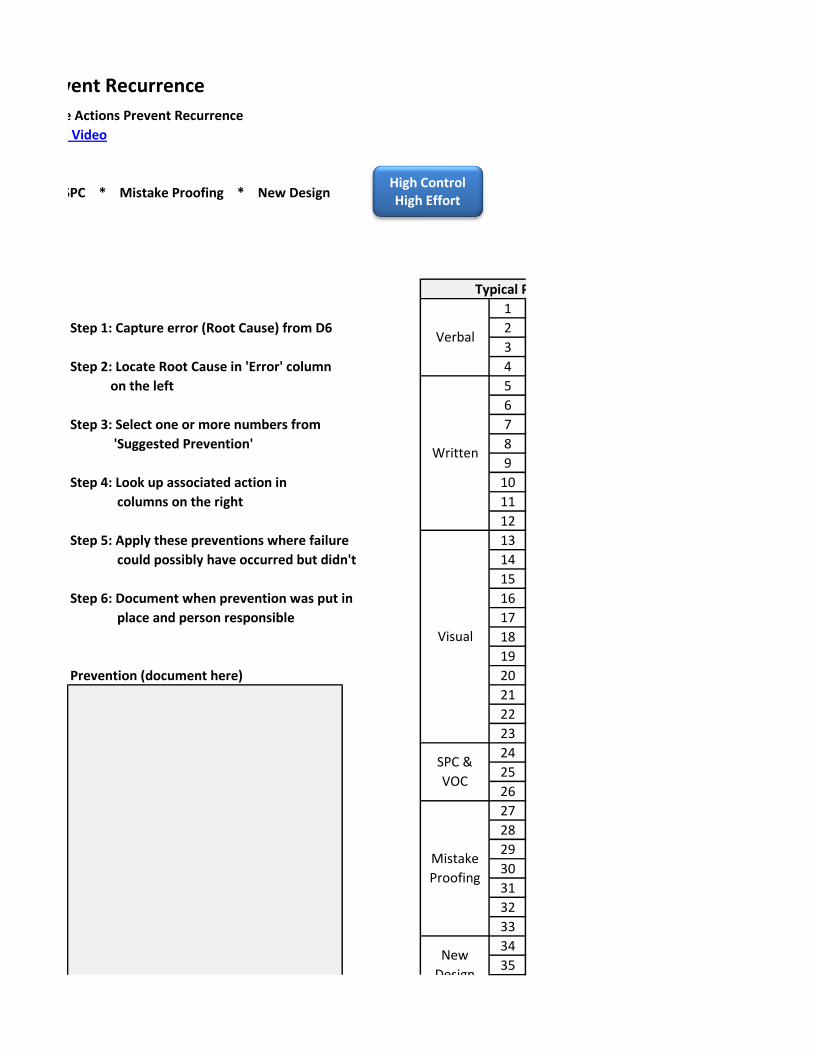
Verbal * Written * Visual * SPC * Mistake Proofing * New Design
1
Step 1: Capture error (Root Cause) from D6 2
3
Step 2: Locate Root Cause in 'Error' column 4
on the left 5
6
Step 3: Select one or more numbers from 7
'Suggested Prevention' 8
9
Step 4: Look up associated action in 10
columns on the right 11
12
Step 5: Apply these preventions where failure 13
could possibly have occurred but didn't 14
15
Step 6: Document when prevention was put in 16
place and person responsible 17
18
19
Prevention (document here) 20
21
22
23
24
25
26
27
28
29
30
31
32
33
34
35
Written
SPC &
VOC
Typical Prevention Corrective Action (CA)
Verbal
New
Design
Mistake
Proofing
Visual
Watch the Video
D7 Prevent Recurrence
Ensure Corrective Actions Prevent Recurrence
High Control High Effort

36
Next >>>
New
Design

Next >>>
Verbal instruction
Shadowing
Audio recording
Mentoring / Coaching
Standard Operating Procedure
Standard Work
Checklist
Technical manuals
Work Instructions
Announcement / Memo
Document Control
Playbook
Andon lights
Status indicators
Transparent containers & dispensers
Layout templates
Orientation
Illustrations
Color
Signage
Pictures/Placards
Observation
Early warning systems
Process Control
Pre-Control
Customer Specifications
Kitting
Go / No-Go
Position Locators
Lock-in's
Lock out's
Shadow Boards
Takt Time
Simplification
Additional features
Typical Prevention Corrective Action (CA)
D7 Prevent Recurrence
Ensure Corrective Actions Prevent Recurrence

White Sheet design
8D Instructions
Step 1: Team lead gathers team together
Step 2: Team lead and management summarize achievements
Step 3: Management congratulated team
Step 4: 8D report is signed
Describe Activities
Next >>>
D8 Congratulate TeamWatch the Video

D8 Congratulate Team
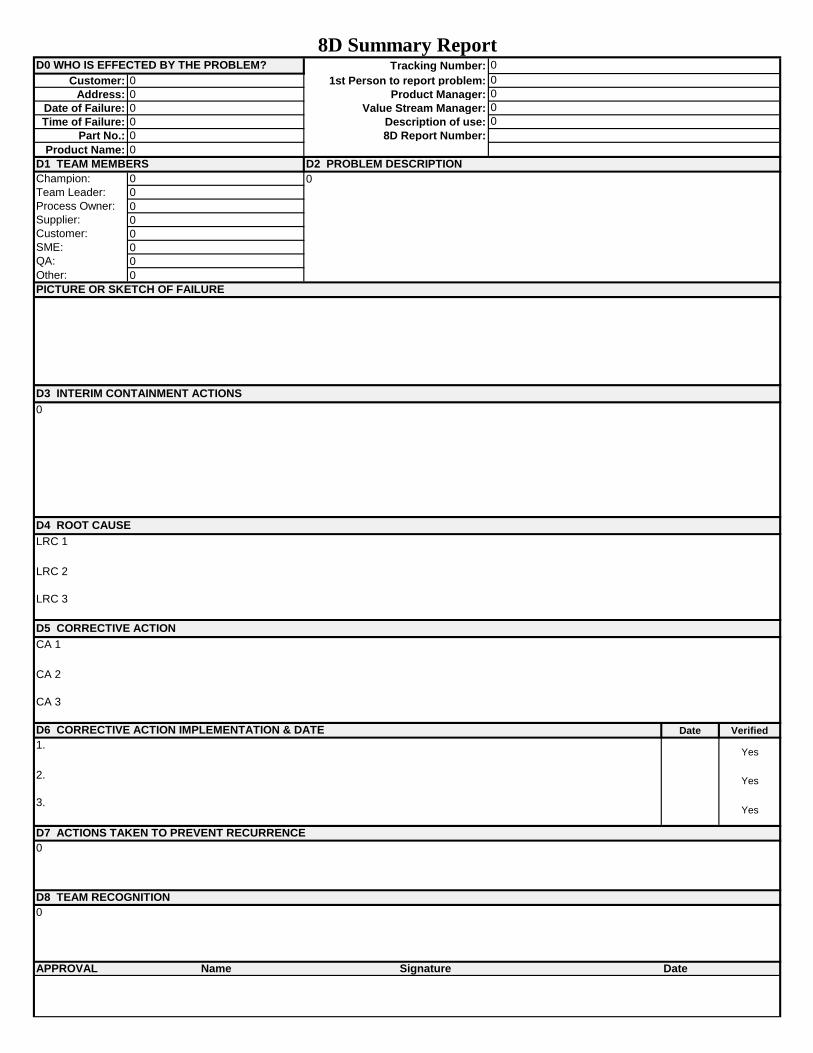
Tracking Number:
Customer: 0 1st Person to report problem:
Address: 0 Product Manager:
Date of Failure: 0 Value Stream Manager:
Time of Failure: 0 Description of use:
Part No.: 0 8D Report Number:
Product Name: 0
Champion: 0
Team Leader: 0
Process Owner: 0
Supplier: 0
Customer: 0
SME: 0
QA: 0
Other: 0
Date Verified
APPROVAL Name Date
PICTURE OR SKETCH OF FAILURE
Signature
Yes
Yes
D7 ACTIONS TAKEN TO PREVENT RECURRENCE
0
0
D8 TEAM RECOGNITION
3.
2.
D3 INTERIM CONTAINMENT ACTIONS
0
LRC 1
D1 TEAM MEMBERS D2 PROBLEM DESCRIPTION
0
8D Summary Report
0
0
0
D0 WHO IS EFFECTED BY THE PROBLEM?
0
0
LRC 2
LRC 3
D4 ROOT CAUSE
D5 CORRECTIVE ACTION
CA 1
CA 2
CA 3
Yes
D6 CORRECTIVE ACTION IMPLEMENTATION & DATE
1.