Vsm creation facilitators guide and sequence of work and instruction method
5
Material and Information Flow Guide Facilitators > A3 (Source “Learning to See” Shook and Rother) Created by Todd McCann Contents: >A3 Guide summaries from “Learning to See” A Quote from Taiichi Ohno “ Where there is NO Standard there can be NO KAIZEN” We Serve the GEMBA We Teach Leaders to “Learn to See” and “Serve the Gemba”
-
Upload
leansavant -
Category
Leadership & Management
-
view
94 -
download
0
Transcript of Vsm creation facilitators guide and sequence of work and instruction method
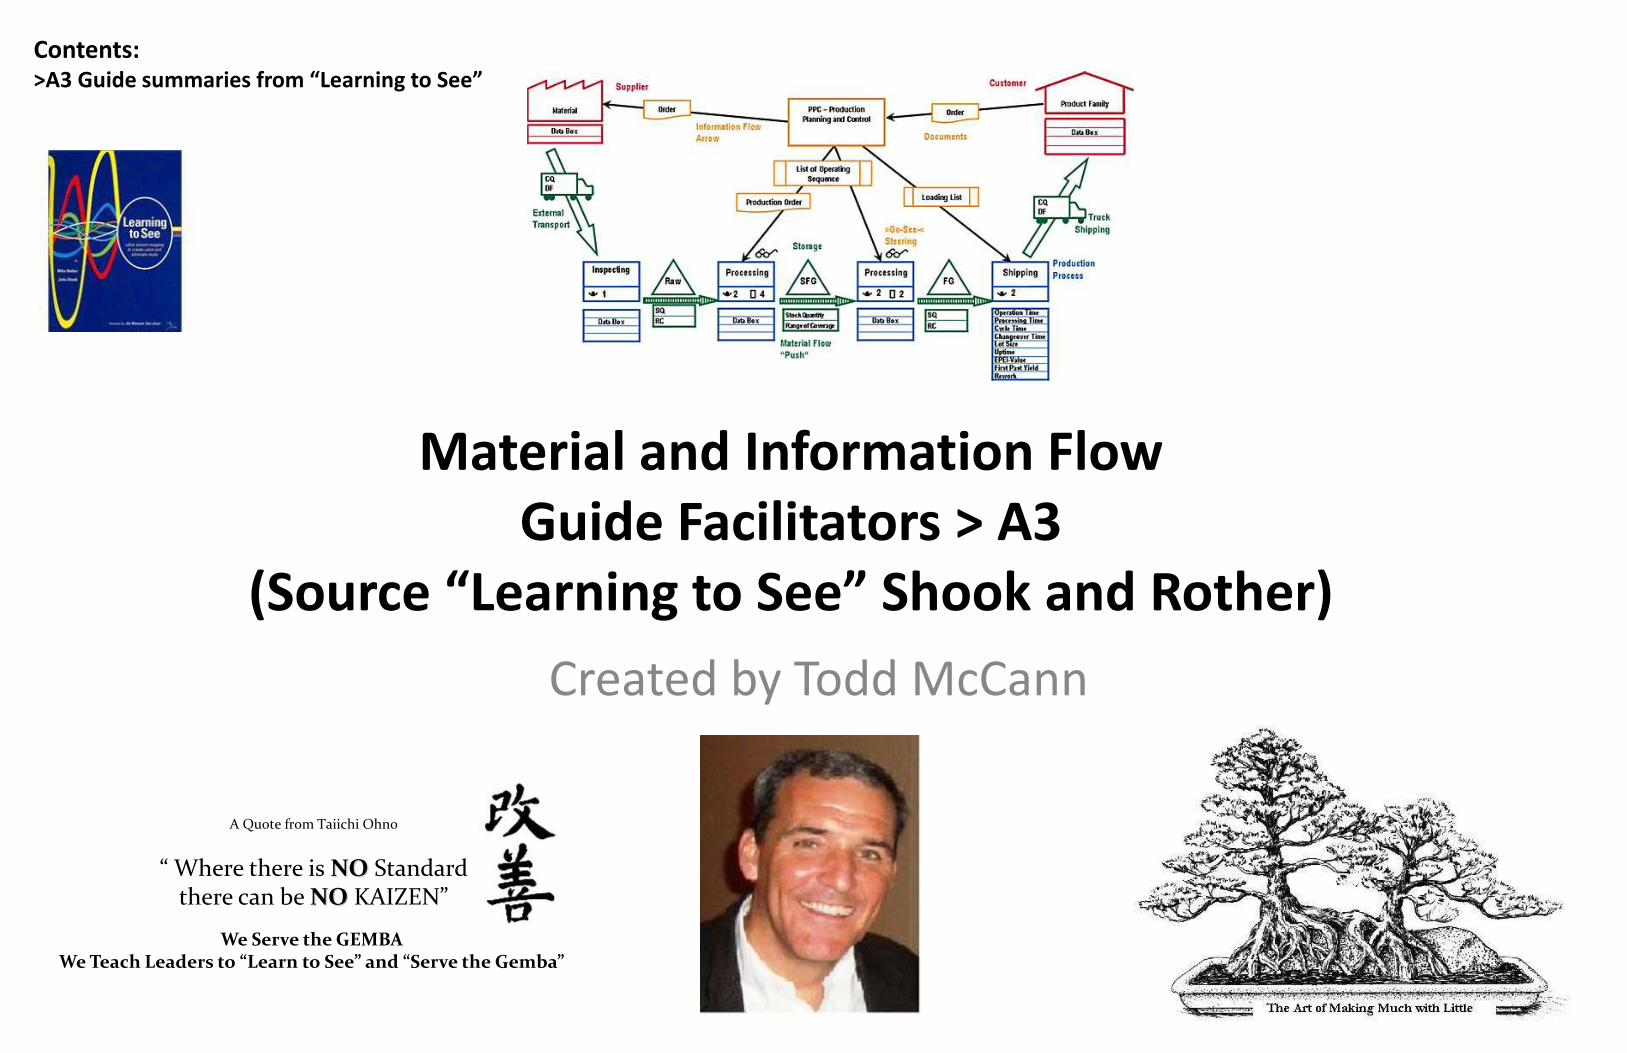
Material and Information FlowGuide Facilitators > A3
(Source “Learning to See” Shook and Rother)
Created by Todd McCann
Contents:>A3 Guide summaries from “Learning to See”
A Quote from Taiichi Ohno
“ Where there is NO Standardthere can be NO KAIZEN”
We Serve the GEMBA We Teach Leaders to “Learn to See” and “Serve the Gemba”
Theme: Facilitators Guide to Material and Information Flow (Value Stream Mapping) Subject: Material and Information FlowDate Created: Jan 2005Created by: T. McCann
VALUE STREAM - All required steps to produce and deliver a product or service
Value Stream – One Point Lesson
Value Stream Mapping is a technique that allows individuals to:
Visualize End to End system FLOW of inventory and information to create a product or deliver a service
Quantify VALUE added and NON VALUE added activities
Identify stagnant and slow moving INVENTORY
Identify process restraints/constraints slowing or prohibiting continuous FLOW
Determine areas of focus and aim requiring improvement to create continuous FLOW
Establish measurable Future State target conditions for improvements to FLOW and VALUE
Use as “The Blue Print” to for all improvements of the Value Stream
• Deliver exactly what the customer wants
• One at a Time
• On Demand
• Free of Defects
• Respond Immediately to Problems
• Increase Value to the customer
focus on elimination of waste
CURRENT State Condition IDEAL State Condition
Created by: Todd McCann
Coal Diamond
Definition of Lean Thinking: A continuous and systematic approach to the
identification and elimination of WASTE in the pursuit of perfection
5 Principles and 7 Wastes of LEAN Thinking – One Point Lesson
5 Principles of Lean:
VALUE - What the customer is willing
to pay for
VALUE STREAM - All the required
steps to produce and deliver a product
or service
FLOW - A product moving through the
value stream with no stoppages, scrap
or rework
PULL - producing and delivering only
when the downstream customer
signals a need
PERFECTION - completely eliminating
waste so that all activities create
value
Seven Original Wastes:
D efects / Corrections
T ransportation
O ver-processing
M otion
I nventory
O ver-production
W aiting
The Eighth Waste is:
Not using People’s Intellect
Unnecessary
Unnecessary
Unnecessary
Unnecessary
Unnecessary
Unnecessary
DEFINITION: What the Customer is willing to pay for….VA Value Added
VALUE – One Point Lesson
Contrasted with: What the Customer is NOT willing to pay for NVA Non Value Added
FACTS:
All processes contain WASTE. NVA activities
Not All processes contain VALUE. VA activities
Therefore: In any process there will be waste
Value-added vs. Non-Value Added example : Perform Maintenance Task
Value-Added stepsCustomers are willing to pay for it
It physically changes the product
It’s done right the first time - Quality
Value Added Percent
Non-Value Added Percent
22%
78%
Waste
DIRECTLY
IMPACTS
START
WO in Hand
Pre-Job Brief
Completed
WALK
to Tool
Room -
obtain
tools
WAIT
at Tool
Room -
obtain
tools
WALK
to Work
Location
ADD
VALUE
USE
TOOL’s
WALK
to Tool
Room –
return
Tools
WAIT
at Tool
Room –
return
tools
END
Work
240 min
4 hrs
0 hrs 8.3%
21 min21.6%
52 min
18.2%
43 min
22%
52 min
18.2%
43 min
11.8%
29 min
Non-Value added StepsNot essential to produce
product/service
Does not add value to product/service
Safety Cost Quality Delivery
VA / NVA – Analysis Summary
FLOW – One Point Lesson
“PROCESS FLOW” – “HIDDEN WASTE”
“PROCESS FLOW” “HIDDEN WASTE”
“PROCESS FLOW”
PRODUCT QUALITY > OVERALL LEAD TIME > UNEVEN / TURBULANT FLOW
WORK STOPPAGE/UNVEVEN > DEFECTS CAUSE REDUCED FLOW
NO
Flo
w
“99% DEFECT FREE” > Improved FLOW > “HIDDEN WASTE” remains
“99% DEFECT FREE” – “99% WASTE REMOVED”
RE
DU
CE
D
Flo
w
WA
ST
E F
RE
E
Flo
w
Eliminate
DEFECTS
DEFECT
Eliminate
PROCESS
WASTES
CountermeasureCONDITION PROCESS VIEWS
INNOVATE
PROCESS
FLOW - A product moving through the value stream with no stoppages, scrap or rework
PRODUCT QUALITY > OVERALL LEAD TIME > UNEVEN / TURBULANT FLOW
PRODUCT QUALITY > OVERALL LEAD TIME > SMOOTH and LEVEL FLOW
Materials
Brown Paper
Flip Chart
Masking Tape(The Kind that Will NOTTake Paint of Walls)
Markers
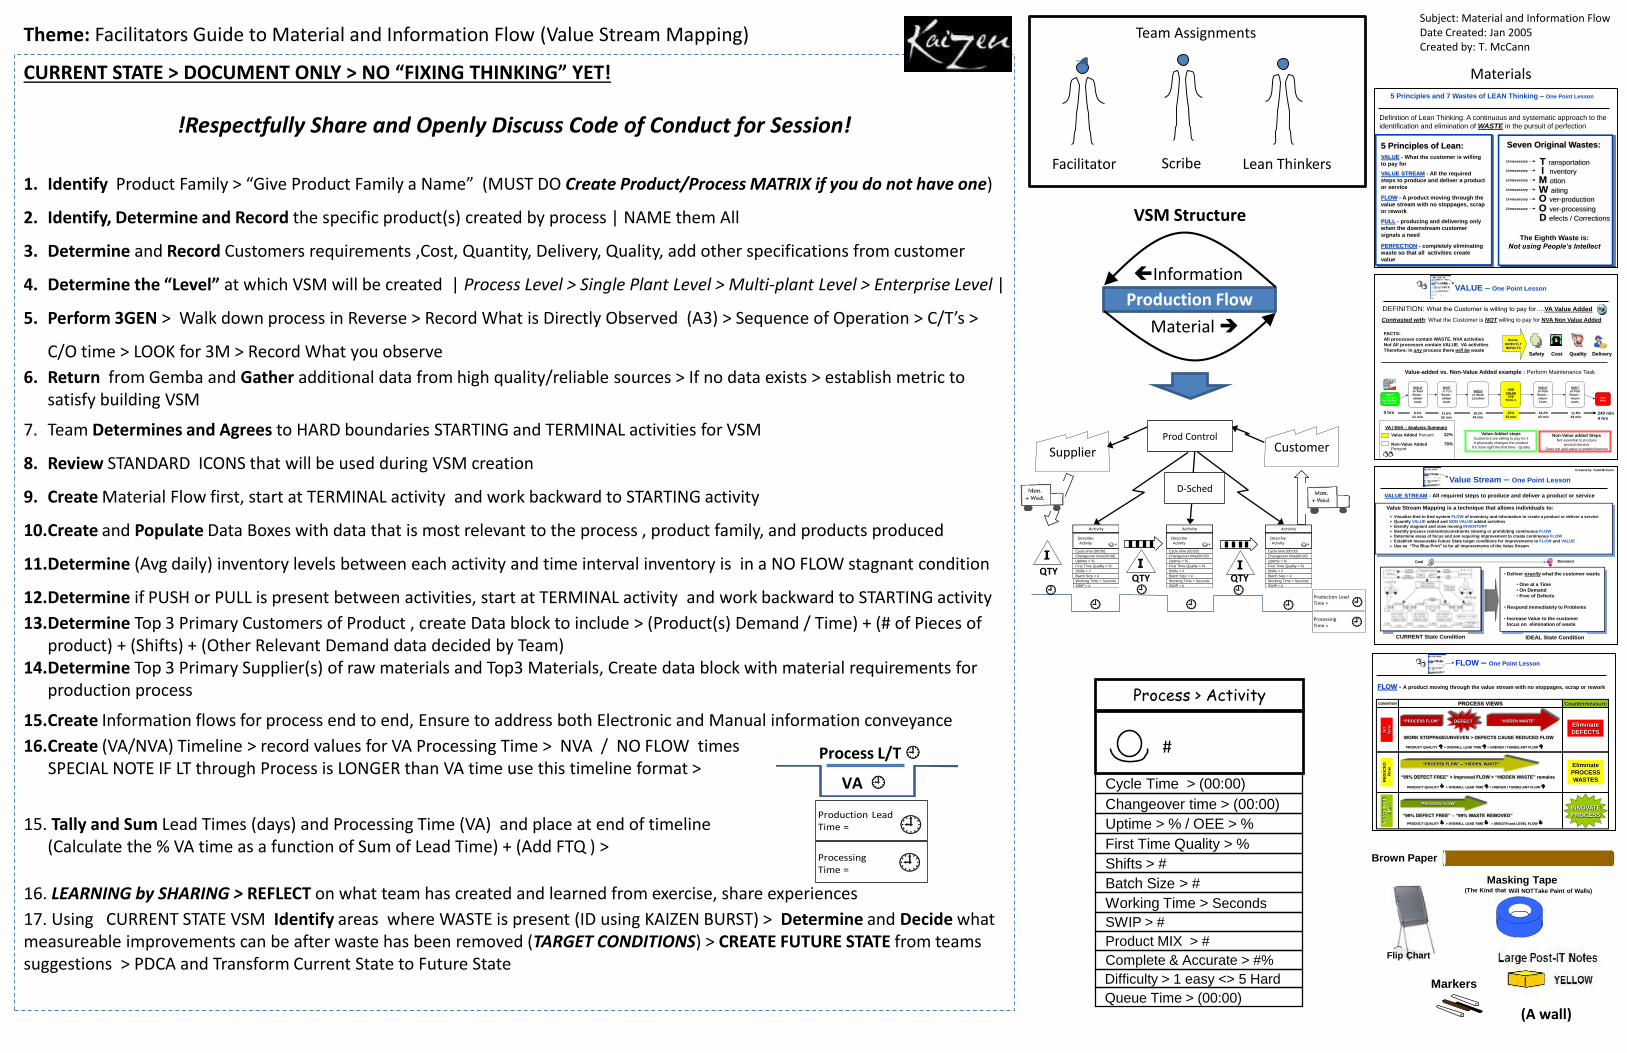
CURRENT STATE > DOCUMENT ONLY > NO “FIXING THINKING” YET!
!Respectfully Share and Openly Discuss Code of Conduct for Session!
1. Identify Product Family > “Give Product Family a Name” (MUST DO Create Product/Process MATRIX if you do not have one)
2. Identify, Determine and Record the specific product(s) created by process | NAME them All
3. Determine and Record Customers requirements ,Cost, Quantity, Delivery, Quality, add other specifications from customer
4. Determine the “Level” at which VSM will be created | Process Level > Single Plant Level > Multi-plant Level > Enterprise Level |
5. Perform 3GEN > Walk down process in Reverse > Record What is Directly Observed (A3) > Sequence of Operation > C/T’s >
C/O time > LOOK for 3M > Record What you observe
6. Return from Gemba and Gather additional data from high quality/reliable sources > If no data exists > establish metric to satisfy building VSM
7. Team Determines and Agrees to HARD boundaries STARTING and TERMINAL activities for VSM
8. Review STANDARD ICONS that will be used during VSM creation
9. Create Material Flow first, start at TERMINAL activity and work backward to STARTING activity
10.Create and Populate Data Boxes with data that is most relevant to the process , product family, and products produced
11.Determine (Avg daily) inventory levels between each activity and time interval inventory is in a NO FLOW stagnant condition
12.Determine if PUSH or PULL is present between activities, start at TERMINAL activity and work backward to STARTING activity
13.Determine Top 3 Primary Customers of Product , create Data block to include > (Product(s) Demand / Time) + (# of Pieces of product) + (Shifts) + (Other Relevant Demand data decided by Team)
14.Determine Top 3 Primary Supplier(s) of raw materials and Top3 Materials, Create data block with material requirements for production process
15.Create Information flows for process end to end, Ensure to address both Electronic and Manual information conveyance
16.Create (VA/NVA) Timeline > record values for VA Processing Time > NVA / NO FLOW times SPECIAL NOTE IF LT through Process is LONGER than VA time use this timeline format >
15. Tally and Sum Lead Times (days) and Processing Time (VA) and place at end of timeline(Calculate the % VA time as a function of Sum of Lead Time) + (Add FTQ ) >
16. LEARNING by SHARING > REFLECT on what team has created and learned from exercise, share experiences
17. Using CURRENT STATE VSM Identify areas where WASTE is present (ID using KAIZEN BURST) > Determine and Decide what measureable improvements can be after waste has been removed (TARGET CONDITIONS) > CREATE FUTURE STATE from teams suggestions > PDCA and Transform Current State to Future State
Process L/T
VA
(A wall)
Production LeadTime =
ProcessingTime =
VSM Structure
Prod Control
Production Flow
Information
Material
CustomerSupplier
Activity
Cycle time (00:00)
Changeover time(00:00)
Uptime > %
First Time Quality > %
Shifts > #
Batch Size > #
Describe
Activity #
Working Time > Seconds
SWIP > #
Activity
Cycle time (00:00)
Changeover time(00:00)
Uptime > %
First Time Quality > %
Shifts > #
Batch Size > #
Describe
Activity #
Working Time > Seconds
SWIP > #
Activity
Cycle time (00:00)
Changeover time(00:00)
Uptime > %
First Time Quality > %
Shifts > #
Batch Size > #
Describe
Activity #
Working Time > Seconds
SWIP > #
IQTY
IQTY
IQTY
Production LeadTime =
ProcessingTime =
D-Sched
Process > Activity
Cycle Time > (00:00)
Changeover time > (00:00)
Uptime > % / OEE > %
First Time Quality > %
Shifts > #
Batch Size > #
#
Working Time > Seconds
SWIP > #
Product MIX > #
Complete & Accurate > #%
Difficulty > 1 easy <> 5 Hard
Queue Time > (00:00)
Team Assignments
Facilitator Scribe Lean Thinkers
Theme: Facilitators Guide to Material and Information Flow (Value Stream Mapping) Subject: Material and Information FlowDate Created: Jan 2005Created by: T. McCann
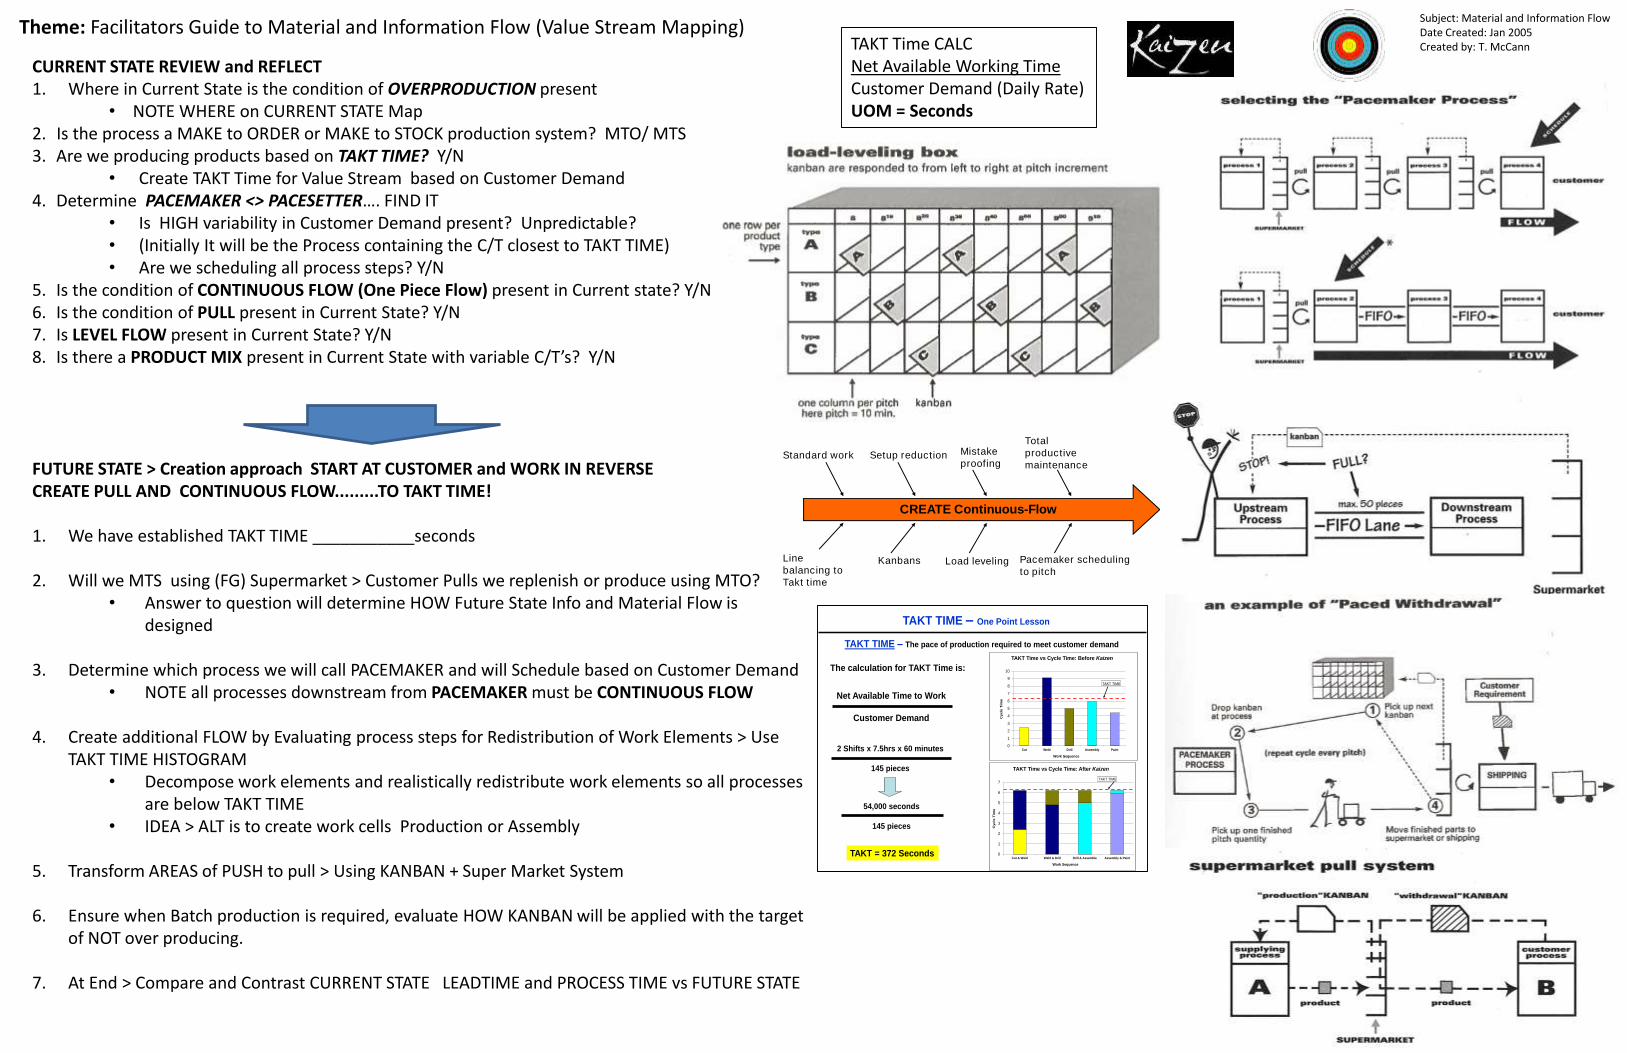
CURRENT STATE REVIEW and REFLECT1. Where in Current State is the condition of OVERPRODUCTION present
• NOTE WHERE on CURRENT STATE Map2. Is the process a MAKE to ORDER or MAKE to STOCK production system? MTO/ MTS3. Are we producing products based on TAKT TIME? Y/N
• Create TAKT Time for Value Stream based on Customer Demand4. Determine PACEMAKER <> PACESETTER…. FIND IT
• Is HIGH variability in Customer Demand present? Unpredictable?• (Initially It will be the Process containing the C/T closest to TAKT TIME)• Are we scheduling all process steps? Y/N
5. Is the condition of CONTINUOUS FLOW (One Piece Flow) present in Current state? Y/N6. Is the condition of PULL present in Current State? Y/N7. Is LEVEL FLOW present in Current State? Y/N8. Is there a PRODUCT MIX present in Current State with variable C/T’s? Y/N
FUTURE STATE > Creation approach START AT CUSTOMER and WORK IN REVERSECREATE PULL AND CONTINUOUS FLOW.........TO TAKT TIME!
1. We have established TAKT TIME ___________seconds
2. Will we MTS using (FG) Supermarket > Customer Pulls we replenish or produce using MTO?• Answer to question will determine HOW Future State Info and Material Flow is
designed
3. Determine which process we will call PACEMAKER and will Schedule based on Customer Demand• NOTE all processes downstream from PACEMAKER must be CONTINUOUS FLOW
4. Create additional FLOW by Evaluating process steps for Redistribution of Work Elements > Use TAKT TIME HISTOGRAM
• Decompose work elements and realistically redistribute work elements so all processes are below TAKT TIME
• IDEA > ALT is to create work cells Production or Assembly
5. Transform AREAS of PUSH to pull > Using KANBAN + Super Market System
6. Ensure when Batch production is required, evaluate HOW KANBAN will be applied with the target of NOT over producing.
7. At End > Compare and Contrast CURRENT STATE LEADTIME and PROCESS TIME vs FUTURE STATE
CREATE Continuous-Flow
Line
balancing to
Takt time
Kanbans Load leveling Pacemaker scheduling
to pitch
Standard work Setup reduction Mistake
proofing
Total
productive
maintenance
TAKT Time CALCNet Available Working TimeCustomer Demand (Daily Rate)UOM = Seconds
TAKT TIME – One Point Lesson
TAKT TIME – The pace of production required to meet customer demand
The calculation for TAKT Time is:
Net Available Time to Work
Customer Demand
2 Shifts x 7.5hrs x 60 minutes
145 pieces
54,000 seconds
145 pieces
TAKT = 372 Seconds
0
1
2
3
4
5
6
7
8
9
10
Cut Weld Drill Assembly Paint
Cyc
le T
ime
Work Sequence
TAKT Time vs Cycle Time: Before Kaizen
TAKT TIME
0
1
2
3
4
5
6
7
Cut & Weld Weld & Drill Drill & Assemble Assembly & Paint
Cycle
Tim
e
Work Sequence
TAKT Time vs Cycle Time: After Kaizen
TAKT TIME

Product/Process Family Matrix Template
Subject: Material and Information FlowDate Created: Jan 2005Created by: T. McCann
Pro
cess
1
Pro
cess
2
Pro
cess
3
Pro
cess
4
Pro
cess
5
Pro
cess
6
Pro
cess
7
Pro
cess
8
Pro
cess
9
Pro
cess
10
Product/Process
FamiliesA X X X X X X X X 1
B X X X X X 1
C X X X X X X X X X 2
D X X X X X X X X X 2
E X X X X X 3
F X X X X X 3
G X X X X X X 3
H X X X X 4
I X X X 4
PR
OD
UC
TS
STATEMENTS OF RESISTANCE:
“50 Reasons Why It Will Not Work”
1. We tried that before.
2. Our systems are different.
3. It will cost too much.
4. That’s beyond our responsibility.
5. That’s not my job.
6. We’re too busy to do that.
7. It’s too radical of a change.
8. There’s not enough help.
9. We’ve never done that before…
10. We don’t have the authority.
11. There’s not enough time.
12. Let’s get back to reality.
13. That’s not our problem.
14. Why change? It works OK now.
15. You’re right, but...
16. I don’t like that idea.
17. Your years ahead of the times.
18. It’s not in the budget.
19. We’re not ready for that.
20. Sounds OK, but it’s just impractical.
21. We need to give it more thought.
22. Management won’t go for that...
23. There’s nothing in it for me…
24. Nobody cares about that.
25. We’ve always done it this way...
26. It might not work.
27. Not that again!
28. Where did you dig that one up?
29. We did all right without it...
30. It’s never been tried before.
31. Let’s shelve it for the time being...
32. I don’t see the connection.
33. What you are really saying is...
34. Let’s not be the first...
35. Maybe in you area, but not in mine.
36. Supervisors will never go for it.
37. It can’t be done.
38. It’s too much trouble.
39. It’s impossible.
40. We’re not here to think.
41. We can’t do that.
42. Let me think about it and I’ll get back to you.
43. Hold on you don’t understand…..
44. Legislation says we can’t do that.
45. That’s just ludicrous…
46. That can’t be discussed right now.
47. That’s too serious of a subject.
48. No one is interested.
49. You do not know all of the situation.
50. It’s too late to start.

VSM Icons (Source: “Learning to See” M. Rother / J. Shook)
MATERIAL ICONS REPRESENTS NOTES:
Manufacturing Process/Activity
One Process box equals and area of FLOW. Also used for departments such as production Control
Outside Sources
Used to show customers, suppliers, and outside manufacturing processes
Data Box
Used to Record informationdescribing measureable conditions in a manufacturing process, department, customer, etc
Inventory
Count (pcs) and Time OH should be note
Truck Shipment
Note Frequency of shipments
Movement of Production Material by PUSH
Material that is produced and moved forward BEFORE the next process needs it; usually based on schedule
Movement of Finished Good to the Customer
Supermarket
A Controlled inventory of parts and is used to schedule production at an upstream process
WithdrawalPULL
Pull of Materials, usually from a Supermarket
Transfer of Controlled Quantities for Material Between Process in a First IN First Out Sequence
Indicates a device to Limit quantity and ensure FIFO flow of material between processesMaximum Quantity Should be Noted
INFORMATION ICONS REPRESENTS NOTES:
Manual InformationFlow
Examples: Production ScheduleShipping Schedule
ElectronicInformation Flow
Examples: Electronic Data Interchange, (ERP comms)
Information Describes type of informationflow
Production KANBAN
The “One-Per- Container” kanban. Card or device that tells a process how many of what can be produced and gives permission to do so
WithdrawalKANBAN
Card or device that instructs the material handler to get and transfer parts from one location to another (i.e. from a supermarket to the consuming process
Signal KANBAN
The “one-per-batch” KANBAN. Signals when a reorder point is reached and another batch needs to be produced. Used where supplying process must produce in batches because changeovers are required
KANBAN arriving in batches
Sequenced Pull-Ball
Gives Instruction to immediately produce a predetermined type & quantity, typically ONE unit. A Pull system for a subassembly process “without” using a supermarket
INFORMATION ICONS REPRESENTS NOTES:
KANBAN Post
A place where KANBAN are collected and held for conveyance
Level Loading
Tool to intercept Batches of KANBAN and level the volume and Mix of them over a period of time
GO SEEProductionScheduling
Adjusting schedules based on checking inventory levels
GENERAL ICONS REPRESENTS NOTES:
KAIZEN Burst Highlights improvement needs at specific processes that are critical to achieving the value stream vision. Can be used to plan KAIZEN activities for incremental improvement
Safety or Buffer Stock
Buffer or Safety Stock requirements MUST be noted
Operator An Overhead View of a person
Work Cell
Subject: Material and Information FlowDate Created: Jan 2005Created by: T. McCann