
VIA ELECTRONIC FILING - NERC Filings to... · 2012. 11. 14. · 116-390 Village Blvd. Princeton, NJ...
219
116-390 Village Blvd. Princeton, NJ 08540 609.452.8060 | www.nerc.com December 1, 2010 VIA ELECTRONIC FILING Re: North American Electric Reliability Corporation, 2010/2011 Winter Reliability Assessment, Docket No. RM06-16-000 Dear Secretary Bose: The North American Electric Reliability Corporation (NERC) submits solely as an informational filing the 2010/2011 Winter Reliability Assessment; a report prepared by NERC, released on November 30, 2010. NERC is not requesting the Federal Energy Regulatory Commission to take any action on this report. Please contact the undersigned if you have any questions. Respectfully submitted, /s/ Holly A. Hawkins Holly A. Hawkins Attorney for North American Electric Reliability Corporation
Transcript of VIA ELECTRONIC FILING - NERC Filings to... · 2012. 11. 14. · 116-390 Village Blvd. Princeton, NJ...

116-390 Village Blvd. Princeton, NJ 08540 609.452.8060 | www.nerc.com
December 1, 2010 VIA ELECTRONIC FILING Re: North American Electric Reliability Corporation, 2010/2011 Winter
Reliability Assessment, Docket No. RM06-16-000 Dear Secretary Bose: The North American Electric Reliability Corporation (NERC) submits solely as an informational filing the 2010/2011 Winter Reliability Assessment; a report prepared by NERC, released on November 30, 2010. NERC is not requesting the Federal Energy Regulatory Commission to take any action on this report. Please contact the undersigned if you have any questions.
Respectfully submitted,
/s/ Holly A. Hawkins
Holly A. Hawkins
Attorney for North American Electric Reliability Corporation

2010/2011 WinterReliability Assessment
116-390 Village Blvd., Princeton, NJ 08540609.452.8060 | 609.452.9550 fax
www.nerc.com
the reliability of theto ensure
bulk power system
November 2010
mouraj
Typewritten Text
mouraj
Typewritten Text
mouraj
Typewritten Text
mouraj
Typewritten Text
mouraj
Typewritten Text
mouraj
Typewritten Text
mouraj
Typewritten Text
mouraj
Typewritten Text
mouraj
Typewritten Text
mouraj
Typewritten Text
mouraj
Typewritten Text
mouraj
Typewritten Text
mouraj
Typewritten Text
mouraj
Typewritten Text
mouraj
Typewritten Text
mouraj
Typewritten Text
mouraj
Typewritten Text
mouraj
Typewritten Text

to ensure the reliability of the
bulk power system
NERC 2010/2011 Winter Reliability Assessment i
NNEERRCC’’ss MMiissssiioonn
The North American Electric Reliability Corporation (NERC) is an international regulatory authority established to evaluate reliability of the bulk power system in North America. NERC develops and enforces Reliability Standards; assesses adequacy annually via a ten‐year forecast and winter and summer forecasts; monitors the bulk power system; and educates, trains, and certifies industry personnel. NERC is the electric reliability organization for North America, subject to oversight by the U.S. Federal Energy Regulatory Commission (FERC) and governmental authorities in Canada.1
NERC assesses and reports on the reliability and adequacy of the North American bulk power system, which is divided into eight Regional areas, as shown on the map below and listed in Table A. The users, owners, and operators of the bulk power system within these areas account for virtually all the electricity supplied in the U.S., Canada, and a portion of Baja California Norte, México.
Note: The highlighted area between SPP RE and SERC denotes overlapping Regional area boundaries. For example, some load serving entities participate in one Region and their associated transmission owner/operators in another.
1 As of June 18, 2007, the U.S. Federal Energy Regulatory Commission (FERC) granted NERC the legal authority to enforce Reliability Standards with all U.S. users, owners, and operators of the bulk power system, and made compliance with those standards mandatory and enforceable. In Canada, NERC presently has memorandums of understanding in place with provincial authorities in Ontario, New Brunswick, Nova Scotia, Québec, and Saskatchewan, and with the Canadian National Energy Board. NERC standards are mandatory and enforceable in Ontario and New Brunswick as a matter of provincial law. NERC has an agreement with Manitoba Hydro making reliability standards mandatory for that entity, and Manitoba has recently adopted legislation setting out a framework for standards to become mandatory for users, owners, and operators in the province. In addition, NERC has been designated as the “electric reliability organization” under Alberta’s Transportation Regulation, and certain reliability standards have been approved in that jurisdiction; others are pending. NERC and NPCC have been recognized as standards‐setting bodies by the Régie de l’énergie of Québec, and Québec has the framework in place for reliability standards to become mandatory. Nova Scotia and British Columbia also have frameworks in place for reliability standards to become mandatory and enforceable. NERC is working with the other governmental authorities in Canada to achieve equivalent recognition.
Table A: NERC Regional Entities
FRCC Florida Reliability Coordinating Council
SERC SERC Reliability Corporation
MRO Midwest Reliability Organization
SPP RE Southwest Power Pool Regional Entity
NPCC Northeast Power Coordinating Council
TRE Texas Reliability Entity
RFC ReliabilityFirst Corporation
WECC Western Electricity Coordinating Council

Table of Contents
NERC 2010/2011 Winter Reliability Assessment ii
Table of Contents
NERC’s Mission ........................................................................................................................... i
Summary Reliability Assessment of North America ............................................................... 1
Winter Key Highlights ...................................................................................................................... 1 Reliability Assessment ..................................................................................................................... 2 Demand ............................................................................................................................................ 4 2010/2011 Winter Temperature and Precipitation Forecast .......................................................... 6 Generation ....................................................................................................................................... 9 Transmission .................................................................................................................................. 10
Estimated Demand, Resources, and Reserve Margins ......................................................... 14
Regional Reliability Assessment Highlights .......................................................................... 19
Regional Reliability Self-Assessments ................................................................................... 25
FRCC .......................................................................................................................................... 26
MRO ............................................................................................................................................ 32
NPCC .......................................................................................................................................... 42
NPCC‐Maritimes ............................................................................................................................. 47 NPCC‐New England ........................................................................................................................ 51 NPCC‐New York .............................................................................................................................. 63 NPCC‐Ontario ................................................................................................................................. 68 NPCC‐ Québec ............................................................................................................................... 74
RFC ............................................................................................................................................. 85
SERC .......................................................................................................................................... 94
SERC‐Central ................................................................................................................................ 102 SERC‐Delta.................................................................................................................................... 108 SERC‐Gateway .............................................................................................................................. 116 SERC‐Southeastern ...................................................................................................................... 123 SERC‐VACAR ................................................................................................................................. 131
SPP RE ..................................................................................................................................... 140
TRE ........................................................................................................................................... 147
Introduction ................................................................................................................................. 147 Demand ........................................................................................................................................ 147 Generation ................................................................................................................................... 149 Capacity Transactions on Peak .................................................................................................... 150 Transmission ................................................................................................................................ 150 Operational Issues ....................................................................................................................... 151 Region Description ....................................................................................................................... 153
WECC ....................................................................................................................................... 154
WECC‐Northwest Power Pool (NWPP) ........................................................................................ 159

Table of Contents
2 NERC 2010/2011 Winter Reliability Assessment
WECC—Rocky Mountain Reserve Group (RMRG) ....................................................................... 168 WECC—Southwest Reserve Sharing Group (SRSG) ..................................................................... 170 WECC—California/México (CA/MX) ............................................................................................ 172
Midwest ISO ............................................................................................................................. 177
PJM ........................................................................................................................................... 182
Appendix I: About This Report .............................................................................................. 187
Report Preparation ...................................................................................................................... 187 Enhancements to the 2010/2011 Winter Reliability Assessment ............................................... 188
Appendix II: Reliability Concepts Used in This Report ....................................................... 190
How NERC Defines Bulk Power System Reliability ....................................................................... 190 Demand Response Concepts and Categorization ........................................................................ 191
Appendix III: Terms Used in This Report .............................................................................. 192
Appendix IV: Abbreviations Used in This Report ................................................................ 203
Appendix V: Winter Assessment Climate Prediction .......................................................... 208
Reliability Assessment Subcommittee Roster ..................................................................... 209
NERC RAPA Staff Roster ....................................................................................................... 213

NERC 2010/2011 Winter Reliability Assessment
NERC 2010/2011 Winter Reliability Assessment 1
SSuummmmaarryy RReelliiaabbiilliittyy AAsssseessssmmeenntt ooff NNoorrtthh AAmmeerriiccaa
Winter Key Highlights Peak demand for the 2010/2011 winter season has risen 0.6 percent compared to last year’s winter forecast due to a projected slight economic recovery, with Planning Reserve Margins remaining adequate within the U.S., and Canada. From a subregional perspective, the NPCC‐Québec and WECC‐Northwest Power Pool are projected to be near the NERC Reference Margin Level. However, both of these subregions appear to have sufficient resources to maintain reliability this winter.
The 2010/2011 Winter temperature and precipitation forecast shows Regions and subregions, within the U.S., Canada, and México are expected to experience an average winter. During the winter season, the temperature and precipitation for February 2011 are forecast to experience higher than average precipitation and lower than average temperatures.
Overall, operational conditions, including variable resource operations (such as wind), are not expected to affect bulk power system reliability this winter. All Regions have operational strategies and procedures in place to mitigate potential reliability issues that may arise.
Long-Term Weather Forecast Predicts an Average 2010/2011 Winter Season
Operational Challenges are Manageable through the 2010/2011 Winter Season
Peak Demand Increases, Reserve Margins Remain Adequate

NER
C W
inter Reliability Assessm
ent
NERC 2010/2011 Winter Reliability Assessment
2 NERC 2010/2011 Winter Reliability Assessment
Reliability Assessment Compared to last year’s winter forecasts, lower monthly Anticipated Planning Reserve Margins are projected for the 2010/2011 winter season across a number of Regions. The difference between the projected Planning Reserve Margin from last winter predominately results from a projected slow economic recovery reflected in increased peak demand. In terms of resource adequacy, all Regions and subregions appear to have sufficient Planning Reserve Margins to meet winter peak demands. For a number of the summer‐peaking Regions within the U.S., lower Anticipated Planning Reserve Margins are expected this winter compared to the previous winter, with the exception of RFC and SPP RE (Figure 1). However, North America’s non‐coincident projected winter Anticipated Planning Reserve Margin2 is forecast to rise from 32.5 percent last year to 47.0 percent this year, with the primary driver of this increase being found the SPP Region.3,4
For winter‐peaking Regions and subregions in Canada, Anticipated Reserve Margins appear adequate and remain above the NERC Reference Margin Level (Figure 2).5 Anticipated Planning Reserve Margins for the Québec subregion of NPCC and the WECC‐Canada subregion (including the British Columbia and Alberta provinces) are 10.4 percent and 19.6 percent respectively, due to slight increases in projected peak demands. NPCC‐Québec will be operating close to the NERC Reference Margin Level of 9.3 percent, and there are adequate hydroelectric resources within the subregion to cover anticipated peak demand events.
2 See Terms Used in this Report for the Anticipated Reserve Margin definition. In 2009/2010 winter, this term was
“Deliverable,” rather than “Anticipated.” 3 For the U.S., the projected 2010/2011 Anticipated Reserve Margin is 50.8 percent; for Canada 21.6 percent. 4 This is a non‐coincident value for all eight NERC Regions. 5 See Terms Used in this Report for the NERC Reference Margin Level definition.
0.0%
10.0%
20.0%
30.0%
40.0%
50.0%
60.0%
70.0%
80.0%
90.0%
100.0%
FRCC MRO US NPCC US RFC SERC SPP TRE WECC US
Margin
Figure 1: U.S. Winter Peak Planning Reserve Margin Projections
2009/2010 Deliverable Reserve Margin 2010/2011 Anticipated Reserve Margin NERC Reference Margin Level

NER
C W
inter R
eliability A
ssessmen
tNERC 2010/2011 Winter Reliability Assessment
NERC 2010/2011 Winter Reliability Assessment 3
Resources appear adequate for the upcoming winter and capacity deficiencies are not expected. For subregions within the U.S., Anticipated Reserve Margins are above the NERC Reference Margin Level for the 2010/2011 winter season, although a few subregions are projected to be lower than last year (Figure 3).
SERC‐Central6 (19.4 percent forecast Anticipated Reserve Margin versus 15.0 percent NERC Reference Margin Level) and WECC‐NWPP (21.3 percent forecast Anticipated Reserve Margin versus 18.2 percent NERC Reference Margin Level) are the subregions with resources closest to the NERC Reference Margin Level.
6 SERC‐Central’s and SERC‐Delta’s noticeable decline in Anticipated Reserve Margin from 2009/2010 to 2010/2011 can be attributed to improvements from the 2009/2010 data submission. The values in this assessment more accurately reflect the amount of Anticipated Capacity Resources that are planned to be available on peak.
0.0%
10.0%
20.0%
30.0%
40.0%
50.0%
60.0%
MRO Can Maritimes Ontario Quebec WECC Can
Margin
Figure 2: Canada Winter Peak Planning Reserve Margin Projections
2009/2010 Deliverable Reserve Margin 2010/2011 Anticipated Reserve Margin NERC Reference Margin Level
0.0%
20.0%
40.0%
60.0%
80.0%
100.0%
120.0%
Margin
Figure 3: U.S. Subregion Winter Peak Planning Reserve Margin Projections
2009/2010 Deliverable Reserve Margin 2010/2011 Anticipated Reserve Margin NERC Reference Margin Level

NER
C W
inter Reliability Assessm
ent
NERC 2010/2011 Winter Reliability Assessment
4 NERC 2010/2011 Winter Reliability Assessment
The WECC‐NWPP subregion has significant hydroelectric and thermal resources, which should be adequate to meet winter peak demand. However, if lower than normal precipitation occurs in this subregion, WECC‐NWPP may have to reduce economic exports, while, at the same time, reducing reservoir withdrawals to meet reliability guidelines established by WECC and NERC. Continual management of water levels for competing purposes (e.g., water for human consumption, environmental protection, and hydroelectric production) is an on‐going operational challenge as many variables can affect the availability of resources in day‐ahead and real‐time operations. That said, based on the normal weather forecast demand, sufficient resources are expected to be available.
Demand Meeting the projected winter forecast7 peak Net Internal Demand across NERC Regions and subregions appear manageable for the upcoming winter season, with the majority of Regions showing slight increases in peak Net Internal Demand when compared to last year. For the system as a whole, the winter non‐coincident peak demand is projected to reach 736,568 MW, reduced by approximately 34,400 MW of Demand Response available on‐peak.8,9 Reduced Reserve Margins are driven mainly from the increase in the projected peak Total Internal Demand this winter, representing a 0.6 percent increase from last year’s projections, without the addition of offsetting resources. Total Internal Peak demand in winter‐peaking subregions this year (2010/2011) has risen only slightly (0.06 percent) compared to the 2009/2010 winter season (Figure 4). 10
When compared to the 2009/2010 winter, increases in forecast peak Total Internal Demand are more prominent in the summer‐peaking Regions and subregions this winter, with the highest increase (percentage based) occurring in TRE (Figure 5)11. Other notable increases are shown for FRCC, MRO‐US, ,
7 A 50/50 forecast is defined as a forecast adjusted to reflect normal weather, and is expected on a 50 percent probability basis,
i.e., a peak demand forecast level which has a 50 percent probability of being over or under the actual peak. 8 This is a non‐coincident value for all eight NERC Regions, generally occurring in the month of January 2011. 9 For this assessment, NERC allowed Regions to include demand response as either a supply‐side resource or a demand‐side
reduction. 10 Winter peaking subregions include NWPP‐US, MRO‐Canada, Maritimes, Québec, and WECC‐Canada. 11 “Actual” demand is not weather normalized.
0
10,000
20,000
30,000
40,000
50,000
NWPP US MRO CA Maritimes Quebec WECC CA
MW
Figure 4: 2010/2011 Winter Peak Demand Comparisons for Winter‐Peaking Subregions
2009/2010 Forecast 2009/2010 Actual 2010/2011 Forecast

NER
C W
inter R
eliability A
ssessmen
tNERC 2010/2011 Winter Reliability Assessment
NERC 2010/2011 Winter Reliability Assessment 5
SERC, and WECC‐RMPA, while RFC, NPCC‐US, and SPP RE show slight decreases. Peak demand growth in the 50/50 forecast can be attributed to a number of factors, with no one single reason as the primary driver. The actual demand experienced can significantly vary from this 50/50 forecast. As highlighted in the 2009/2010 Post‐Winter Reliability Assessment, during the early to mid‐part of January 2010, a period of prolonged and extreme cold weather was experienced in Texas and the south‐eastern part of the U.S.12 The cold‐weather snap primarily targeted the TRE and FRCC regions as well as the southern SERC subregions (Delta, Southeastern, and VACAR). In these areas, average temperatures were the coldest since 2000.13
Another factor affecting peak demand forecasts is the amount of New Energy Efficiency and Demand Response contributing to peak demand reduction. Economic factors and Regional, state, or provincial Demand Response initiatives can greatly increase or decrease the amount (i.e. capacity) of Demand Response available to system operators to manage peak demand. Demand Response programs for this winter total approximately 34,435 MW for all NERC Regions. While some Regions show continued growth in Demand Response (MRO, RFC, SERC, and TRE), other Regions have shown a reduction (FRCC, NPCC, and SPP RE) (Figure 6).
12 2009/2010 Post‐Winter Reliability Assessment: http://www.nerc.com/files/PWRA_091510_rev1.pdf 13 International Weather Trends: http://blog.compweather.com/2010/02/january‐2010‐retail‐business‐weather‐round‐up/
0
50,000
100,000
150,000
200,000
250,000
FRCC MRO US NPCC US
RFC SERC SPP TRE Desert SW
CA‐MX RMPA Ontario
MW
Figure 5: 2010/2011 Winter Peak Demand Comparisons for Summer‐Peaking Regions/Subregions
2009/2010 Forecast 2009/2010 Actual 2010/2011 Forecast

NER
C W
inter Reliability Assessm
ent
NERC 2010/2011 Winter Reliability Assessment
6 NERC 2010/2011 Winter Reliability Assessment
In Figure 6, RFC has demonstrated a noticeable rise from 2009 to 2010 in the Total Capacity Demand Response. RFC is primarily made up of two major ISO/RTOs: PJM and Midwest ISO. Last year in PJM, only the long‐term contractually set amounts of Demand Response were reported. In the 2010/2011 Winter Assessment, PJM included all Demand Response that cleared in its Reliability Pricing Model (RPM)14. In the Midwest ISO, more entities have designated Direct Load Control Management compared to last year, and for interruptible load, certain entities in the eastern half of the Midwest ISO have designated much less than what they did last year. This may be a timing issue for the entities in the east, as they may designate more Demand Response at the beginning of the winter season, while data are submitted to NERC in early fall. In the western half of Midwest ISO, certain entities have designated more Demand Response compared to last year’s winter, when those entities designated no demand response within their systems.
2010/2011 Winter Temperature and Precipitation Forecast15 The 2010/2011 Winter Temperature and Precipitation forecast as of October 1, 2010 suggests an average winter for both temperature and precipitation.16 The overall 2010/2011 Winter Forecast model predicts above average precipitation occurring at the end of the winter season. The temperature forecast is neutral, indicating that with any modeling error, temperatures would likely be colder than this forecast. The December 2010 temperature and precipitation forecasts (Figure 7) are below average in North and South Carolina of the SERC Region, through the Ohio Valley of the RFC Region, and then north into Ontario of the NPCC Region.
14 http://pjm.com/markets‐and‐operations/rpm.aspx 15 The 2010/2011 Winter Temperature and Precipitation Forecast was produced by: Dynamic Predictables LLC, Columbia, MO
65205‐1365, USA, http://www.dynapred.com 16 This forecast is NERC’s independent prediction of the 2010/2011 winter season. NERC’s climate and precipitation forecast
was not used to develop Regional and subregional climate, precipitation, or peak demand forecasts.
0
2,000
4,000
6,000
8,000
10,000
12,000
14,000
FRCC MRO NPCC RFC SERC SPP TRE WECC
MW
Figure 6: Total Dispatchable and Controllable Capacity Demand Response Comparison between 2009/2010 Winter and 2010/2011 Winter
2009 Total Capacity Demand Response 2010 Total Capacity Demand Response

NER
C W
inter R
eliability A
ssessmen
tNERC 2010/2011 Winter Reliability Assessment
NERC 2010/2011 Winter Reliability Assessment 7
In addition, precipitation for the December 2010 time period is forecast to be above historical averages in Canada, California, and the Southwest, plus a small portion of the Carolinas in the SERC Region. The January 2011 weather forecasts a return of average temperatures to a large portion of North America with numerous areas having warmer than average temperatures (Figure 8). However, the January 2011 precipitation forecast is higher in the Pacific Northwest, Texas, and the Ohio Valley. A large portion of the Southwest and Southeast are projected to receive lower than average precipitation.
The February 2011 temperature forecast predicts a return of cooler than average temperatures to a large portion of Canada, the Upper Midwest (MRO U.S.), and California (Figure 9). Numerous areas in the U.S. and Canada are forecast to receive higher than average amounts of precipitation in February
Source: Dynamic Predictables
Figure 7: December 2010 Temperature and Precipitation Forecast
December 2010 Temperature
December 2010 Precipitation
Cooler than average temperatures
Average temperatures
Warmer than average temperatures
Lower than average precipitation
Average precipitation
Higher than average precipitation
Figure 8: January 2011 Temperature and Precipitation Forecast
January 2011 Temperature
January 2011 Precipitation
Cooler than average temperatures
Average temperatures
Warmer than average temperatures
Lower than average precipitation
Average precipitation
Higher than average precipitation
Source: Dynamic Predictables

NER
C W
inter Reliability Assessm
ent
NERC 2010/2011 Winter Reliability Assessment
8 NERC 2010/2011 Winter Reliability Assessment
2011. In this weather projection, the Southwest, along with portions of Maritimes in the NPCC area, will continue to receive lower than average amounts of precipitation.
The drought forecast from the NOAA Drought Monitor for November 2010 through January 2011 indicates there will be improvement in drought conditions for the Northwest, upper Midwest, and Ohio Valley, with some improvement in the mid‐Atlantic, Tennessee Valley, and northern California (Figure 10). Drought conditions are likely to continue in the Southeast and Southwest, with this condition expected to develop and expand into much of the Southeast, along with parts of Texas, and portions of the Southwest. 17
October and November are historically low precipitation months in the Southeastern U.S., but with La Niña conditions prevailing in the Pacific Ocean, even lower rainfall is expected. The potential impact to bulk power system reliability with lower rainfall and ongoing drought conditions is that hydroelectric generation may not be able to be dispatched due to operating or environmental constraints. In addition, large generation plants that rely on water from
17 NOAA U.S. Seasonal Drought Outlook, November 18, 2010:
http://www.cpc.ncep.noaa.gov/products/expert_assessment/seasonal_drought.html
Source: Dynamic Predictables
Figure 9: February 2011 Temperature and Precipitation Forecast
February 2011 Temperature
February 2011 Precipitation
Cooler than average temperatures
Average temperatures
Warmer than average temperatures
Lower than average precipitation
Average precipitation
Higher than average precipitation
Figure 10: U.S. Seasonal Drought Outlook as of November 18, 201017

NER
C W
inter R
eliability A
ssessmen
tNERC 2010/2011 Winter Reliability Assessment
NERC 2010/2011 Winter Reliability Assessment 9
rivers for cooling may be affected by lower rainfall. This may affect generator availability as river water levels drop below plant cooling water intakes.18 This trend should be monitored, specifically in TRE and SERC, and adequate preventative measures should be in place so there is no impact to bulk power system reliability.
Generation The total NERC Existing‐Certain on‐peak capacity including Net Firm Transactions this winter is 1,027,419 MW, a net decrease of about 15,924 MW for the month of January 2011 when compared to January 2010 due to overall reduced capacity. In some subregions, capacity resources do increase, in particular those with increases in peak demand. However, this overall reduction is a result of decreased unit commitment for on‐peak capacity by a majority of the Regions due to the lower 2010/2011 demand forecast in those Regions and is not a result of significant unit retirements. While the 2010/2011 winter on‐peak fuel‐mix (Figure 11) remains relatively unchanged from last year, natural gas‐fired generation, along with coal, continue to be the primary fuels for on‐peak capacity, with growth of approximately 7,600 MW of natural gas generation since last year.
Based on data submitted to NERC in July 2010, this chart demonstrates that coal and natural gas are still the largest sources of on‐peak winter capacity. These, along with Dual Fuel units, hydroelectric, and nuclear capacity are the top five sources of on‐peak capacity for this winter season.
18 A similar issue was highlighted in the 2007/2008 Winter Reliability Assessment (pg11):
http://www.nerc.com/files/winter2007‐08.pdf
Biomass0.2%
Coal27.5%
Dual Fuel13.9%
Gas27.5%
Geothermal0.1%
Hydro13.2%
Nuclear10.6%
Oil1.9%
Other1.7%
Pumped Storage1.9% Wind
1.5%
Figure 11: 2010/2011 Expected Winter On‐Peak Capacity

NER
C W
inter Reliability Assessm
ent
NERC 2010/2011 Winter Reliability Assessment
10 NERC 2010/2011 Winter Reliability Assessment
Projected winter installed nameplate19 wind capacity increased by 8,897 MW since the 2009/2010 winter season, to 38,403 MW. The total expected on‐peak capacity from these installed resources is 7,058 MW (Table 1). On‐peak capacity from wind plants, as a percentage of total installed capacity, ranges from 7.2 percent in one NERC Region to 36.6 percent in another NERC Region during the 2010/2011 winter. On‐peak wind capacity values shown by Region in Table 1 are a non‐coincident consolidated sum of subregional values, which may vary widely. 20 For example, TRE and NPCC subregions use diverse policies and methods to calculate expected on‐peak capacity of wind generation (e.g., Effective Load Carrying Capability, historical wind data, or a flat percentage based on policy), with results ranging from 8.7 percent in TRE to 36.5 percent in NPCC (see Table 1). Consistent methods to determine on‐peak wind capacity are needed to ensure uniform measurement of its contribution to Reserve Margins. Currently, different methods are being used by Regions and subregions to determine expected on‐peak values of wind‐capacity. The NERC Integration of Variable Generation Task Force is currently studying and its progress and results can be monitored here: http://www.nerc.com/files/IVGTF_Report_041609.pdf .
Table 1: Winter 2010/2011 Existing Wind Resources Region Nameplate Capacity
(MW) On‐Peak Capacity
(MW) Percent (%) of
Nameplate Capacity vs. On‐Peak Capacity
FRCC 0 0 N/A MRO 9,321 1,552 19.9 NPCC 4,187 1,510 36.5 RFC 4,102 502 12.2 SERC 29 2 7.2 SPP RE 2,699 237 8.8 TRE 9,317 811 8.7 WECC 10,326 2,444 23.7
Additionally, some subregions have modified their own methods for determining on‐peak wind capacity for this winter. For example, in Québec, long‐term observations and overall increased installed wind capacity during the last year prompted the subregion to review derating factors for wind generation. Their simulations have determined that 20 to 30 percent of the installed nameplate capacity can be relied upon for meeting peak winter demand. As another example, MRO uses 20 percent of nameplate wind capacity for winter assessments and only eight percent of wind nameplate capacity for summer assessments.
Transmission Based on the self‐assessments provided by the Regions, transmission facilities across the NERC Regions appear adequate to support meeting on‐peak Net Internal Demand for the upcoming winter season. Delays in meeting target in‐service dates for transmission additions are not expected. While some Regions have identified transmission constraints, operating procedures are in place and no significant
19 From DOE‐EIA: Installed nameplate capacity “The maximum rated output of a generator under specific conditions designated
by the manufacturer. Generator nameplate capacity is usually indicated in units of kilovolt‐amperes (kVA) and in kilowatts (kW) on a nameplate physically attached to the generator.” http://www.eia.doe.gov/glossary_i.htm
20 There is no capacity from wind resources in the FRCC Region.

NER
C W
inter R
eliability A
ssessmen
tNERC 2010/2011 Winter Reliability Assessment
NERC 2010/2011 Winter Reliability Assessment 11
reliability impacts are expected. Additionally, pre‐planned line outages during the winter season are expected to have minimal impacts on the bulk power system. In some Regions, significant bulk transmission enhancements have been made to meet reliability needs since the previous winter:
In Midwest ISO, 30 miles of the new 345 kV Paddock‐Rockdale line in American Transmission Corp (ATC) was put in service in March 2010. There are an additional 26 miles scheduled to be completed and put into service from Baldwin to Rush Island in November 2010.
In SPP RE, two 345 kV projects are ongoing and scheduled to be put in service before February 2011: a 120‐mile line from Northwest to Woodward District EHV in Northern Oklahoma and a 50.5 mile line from Reno County to Summit in central Kansas.
In SERC, approximately 562 miles of 115 kV, 138 kV, 161 kV, 230 kV, 345 kV, and 500 kV transmission lines are scheduled for completion by the end of the 2010/2011 winter season.
In MRO, numerous transmission reinforcements will be completed by or during the upcoming winter season, including several rebuilt/reconductored transmission circuits and several new 115 kV, 138 kV and 161 kV circuits; four new 230 kV circuits; one new 345 kV circuit; one upgraded and six new bulk power auto‐transformers; one new substation; and various substation expansions and upgrades.
Operational Issues No operational conditions are expected to significantly affect bulk power system reliability this winter. All Regions have operational procedures and strategies to mitigate potential reliability issues that may arise during the winter season. In addition, no fuel supply or fuel deliverability issues are anticipated to occur that would result in bulk power system reliability issues. However, some issues must be continually monitored and addressed to maintain bulk power system reliability. These issues include coordinating generator and transmission outage schedules, managing flow across constrained flowgates and — specifically for winter seasons — ensuring adequate natural gas storage for gas‐fired units and reservoir water levels for hydroelectric generation. One notable and ongoing operational challenge identified in previous NERC assessments is the integration of variable generation into the bulk power system. Further, drought conditions in the Southeast will continue to be monitored, though operating procedures have been developed to address serious conditions, should they arise. Operating Reserves for Variable Generation Increasing variable generation, predominantly fueled by wind, can create operational challenges for system operators. Wind resources are less predictable than other forms of traditional generation and follow the availability of their fuel rather than demand. As a result, unexpected loading of the transmission infrastructure can occur. Further, some Regions report specific operational challenges in managing the variability and magnitude of wind resources and the need to provide additional ancillary services (such as operating reserves). Nevertheless, given these challenges, operation of wind resources appears to be manageable for the 2010/2011 winter season. On an operational basis, a rapid increase or decrease of wind generation, often referred to as “ramping”, can have a significant impact on the power flowing through the bulk power system. Wind

NER
C W
inter Reliability Assessm
ent
NERC 2010/2011 Winter Reliability Assessment
12 NERC 2010/2011 Winter Reliability Assessment
generation ramps can have an inverse correlation, or out‐of‐phase ramping, to daily demand profiles resulting in the need for additional operating reserves. Operators may need to closely monitor the system and introduce operational resources (i.e., operating reserves) that support the variability of the resources and provide the ancillary services needed to maintain reliability. Additionally, enhanced operational measures, in particular, re‐dispatch of conventional generation and dynamic curtailment/dispatch of wind resources in particular, can mitigate the impacts of ramping. Many Regions and industry groups, including NERC, are actively studying wind integration needs, such as: developing more accurate wind forecasting models, developing new wind integration standards, ensuring access to ancillary services, providing system operators with updated tools, and reviewing protection/control system schemes.21,22
New and updated tools are being deployed in the TRE Region and NPCC‐IESO subregion to improve the accuracy of wind resource forecasts. NERC continues to monitor the operational challenges of wind integration to ensure the reliability of the bulk power system. Low Ambient Temperature Limits for Wind Generation Operating wind generation in colder climates may also limit wind generation availability. The typical minimum operating temperature of a utility‐scale wind turbine generator without an optional cold‐weather package is ‐20 degrees Celsius (‐4 degrees Fahrenheit), with a standstill temperature of ‐30 degrees Celsius (‐22 degrees Fahrenheit). These weather‐related issues can largely be mitigated through the addition of cold‐weather packages, which include heaters, ice detection sensors, and low operating temperature lubricants. These measures can decrease the ambient temperature operating limits from ‐20 degrees Celsius to ‐30 degrees Celsius, and standstill temperatures from ‐30 degrees Celsius down to ‐40 degrees Celsius (‐40 degrees Fahrenheit). Cold climate Regions and subregions are investigating these upgrades to existing equipment. MRO and WECC‐NWPP have identified the potential need for additional operating reserves should extreme weather conditions occur. Operational Challenges Related to Fuel Most Regions and subregions have indicated that there are no fuel deliverability issues for the upcoming winter at this time. However, the increased reliance on natural gas as one of the leading fuels used for both intermediate and peaking capacity has prompted NERC to monitor reliability considerations associated with natural gas supply and delivery. The issue of natural gas deliverability is predominantly Region‐specific. The reliability assessment of the impacts, therefore, focuses on those areas with high reliance on gas‐fired generation. As of October 2010, natural gas production and delivery appears sufficient for the upcoming winter. Production of natural gas has reached levels not seen in more than 35 years and storage was 90 percent full with about three weeks left in the traditional storage injection period. 23
21 Accommodating High Levels of Variable Generation: http://www.nerc.com/files/winter2007‐08.pdf 22 Integration of Variable Generation Task Force Home Page: http://www.nerc.com/filez/ivgtf.html 23 2010/2011 FERC Energy Market Assessment http://www.ferc.gov/EventCalendar/Files/20101021100913‐A‐3v2.pdf

NER
C W
inter R
eliability A
ssessmen
tNERC 2010/2011 Winter Reliability Assessment
NERC 2010/2011 Winter Reliability Assessment 13
Figure 13: Natural Gas Storage on October 21, 201024
The abundance of domestic natural gas contributed to record demand for gas by power generators during the 2010 summer period, and during the prior 2009/2010 winter season. The U.S. Energy Information Administration (EIA) expects almost no reduction in total U.S. gas consumption during the 2010/2011 winter season, since slightly lower space‐heating needs are being offset by slightly higher consumption for manufacturing and power generation. Weather, as always, affects demand for natural gas. A milder than expected winter could even further moderate demand and storage of natural gas could reach all‐time peak levels. A colder than projected winter season would increase demand by consumers and power generators. Given the high amount of domestic production and large amount of natural gas within storage, extreme cold weather is not expected to affect bulk power system reliability. As highlighted in the 2009/2010 Post‐Winter Reliability Assessment, Regions with higher dependence on natural gas have additional operating procedures, which allow fuel‐switching capabilities.25 For example, prolonged extreme cold weather in January 2010 caused high electricity demands in Florida, which stressed the natural gas fuel supply. In response, generation operators switched to liquid fuel to ensure there was sufficient gas capacity to serve the peak load and meet usage requirements.
24 EIA Weekly Natural Gas Report, October 21, 2010: http://ir.eia.gov/ngs/ngs.html 25 2009/2010 Post‐Winter Reliability Assessment http://www.nerc.com/files/2009_2010_PostWinter.pdf

Estimated
Dem
and, R
esources, and Reserve M
argins
Estimated Demand, Resources, and Reserve Margins
14 NERC 2010/2011 Winter Reliability Assessment
Total Internal Demand (MW) — The sum of the metered (net) outputs of all generators within the system and the metered line flows into the system, less the metered line flows out of the system. Total Internal Demand includes adjustments for indirect Demand‐Side Management programs such as conservation programs, improvements in efficiency of electric energy use, and all non‐dispatchable Demand Response programs. Net Internal Demand (MW) — Total Internal Demand less Dispatchable, Controllable Capacity Demand Response used to reduce load.
Existing‐Certain and Net Firm Transactions (MW) — Existing‐Certain capacity resources plus Firm Imports, minus Firm Exports.
Anticipated Capacity Resources (MW) — Existing‐Certain and Net Firm Transactions plus Future, Planned Capacity Resources plus Expected Imports, minus Expected Exports.
Prospective Capacity Resources (MW) — Deliverable Capacity Resources plus Existing, Other Capacity Resources, minus all Existing, Other deratings (includes derates from variable resources, energy only resources, scheduled outages for maintenance, and transmission‐limited resources), plus Future‐Other capacity resources, minus all Future‐Other deratings.
Existing‐Certain and Net Firm Transactions (%) — Existing‐Certain, and Net Firm Transactions minus Net Internal Demand shown as a percent of Net Internal Demand.
Anticipated Reserve Margin (%) — Anticipated Capacity Resources minus Net Internal Demand shown as a percentage of Net Internal Demand.
Prospective Reserve Margin (%) — Prospective Capacity Resources minus Net Internal Demand shown as a percent of Net Internal Demand.
NERC Reference Reserve Margin Level (%) – Either the Target Capacity Margin provided by the Region/subregion or NERC assigned based on capacity mix (e.g., thermal/hydro).
EEssttiimmaatteedd DDeemmaanndd,, RReessoouurrcceess,, aanndd RReesseerrvvee MMaarrggiinnss To improve consistency and increase granularity and transparency, the NERC Planning Committee approved the following categories26 for capacity resources, purchases, and sales (see Table 2):27 1. Existing:
a. Existing‐Certain — Existing generation resources available to operate and deliver power within or into the Region during the period of analysis in the assessment.
b. Existing‐Other — Existing generation resources that may be available to operate and deliver power within or into the Region during the period of analysis in the assessment, but may be curtailed or interrupted at any time for various reasons.
c. Existing, but Inoperable — Existing portion of generation resources that is out‐of‐service and cannot be brought back into service to serve load during the period of analysis in the assessment.
2. Future:
a. Future‐Planned — Generation resources anticipated to be available to operate and deliver power within or into the Region during the period of analysis in the assessment.
b. Future‐Other — Future generating resources that do not qualify in Future‐Planned and are not included in the Conceptual category.
The monthly estimates of peak‐demand, resources and Reserve Margins for each Region during the 2010 winter season are in Table 3a‐3c.28
26 See the section entitled “Reliability Concepts Used in this Report” for definitions that are more detailed. 27 This year “Anticipated” replaced “Deliverable” used last year. 28 For the Region of ERCOT, and the subregions of NPCC and RFC, coincident peaks are provided.
Table 2: Demand, Capacity, and Margins

Estimated
Dem
and, R
esources, an
d Reserve M
argins
Estimated Demand, Resources, and Reserve Margins
NERC 2010/2011 Winter Reliability Assessment 15
Table 3a: Estimated December 2010 Demand, Resources, and Reserve Margins
Total Internal Demand
Net Internal Demand
Existing Certain & Net Firm Trans-actions
Anticipated Capacity
Resources
Prospective
Capacity Resources
Existing Certain & Net Firm Trans-actions
Anticipated Reserve Margin
Prospective
Reserve Margin
NERC Reference Reserve Margin Level
(MW) (MW) (MW) (MW) (MW) (%) (%) (%) (%)
U.S.
FRCC 37,091 33,921 57,358 57,916 57,916 69.1% 70.7% 70.7% 15.0%
MRO 36,045 33,862 47,919 47,693 47,737 41.5% 40.8% 41.0% 15.0%
NPCC 45,579 43,467 68,341 69,166 72,093 57.2% 59.1% 65.9% 18.0%
New England 21,290 21,290 32,012 32,012 34,939 50.4% 50.4% 64.1% 15.0%
New York 24,289 22,177 36,329 37,154 37,154 63.8% 67.5% 67.5% 18.0%
RFC 142,400 130,500 216,800 216,800 220,500 66.1% 66.1% 69.0% 15.0%
MISO 89,892 83,406 126,612 126,612 137,820 51.8% 51.8% 65.2% 15.4%
PJM 110,841 101,789 167,023 167,023 167,083 64.1% 64.1% 64.1% 15.5%
SERC 170,143 165,065 244,527 245,243 252,398 48.1% 48.6% 52.9% 15.0%
Central 39,465 38,512 50,656 51,196 51,196 31.5% 32.9% 32.9% 15.0%
Delta 23,051 22,384 38,373 38,373 41,257 71.4% 71.4% 84.3% 15.0%
Gateway 14,443 14,443 21,240 21,240 21,240 47.1% 47.1% 47.1% 11.9%
Southeastern 38,165 36,502 60,349 60,525 63,016 65.3% 65.8% 72.6% 15.0%
VACAR 55,019 53,224 73,910 73,910 75,690 38.9% 38.9% 42.2% 15.0%
SPP RE 31,082 30,865 54,526 55,875 56,953 76.7% 81.0% 84.5% 15.0%
TRE 40,046 38,653 75,658 75,716 75,716 95.7% 95.9% 95.9% 12.5%
WECC 104,424 101,984 157,290 159,282 159,282 54.2% 56.2% 56.2% 14.6%
Desert SW 17,228 16,739 31,743 31,840 31,840 89.6% 90.2% 90.2% 13.8%
CA-MX US 37,451 36,067 60,970 62,221 62,221 69.0% 72.5% 72.5% 11.6%
NWPP 41,363 41,030 49,559 49,788 49,788 20.8% 21.3% 21.3% 18.2%
RMPA 9,753 9,519 15,439 15,539 15,539 62.2% 63.2% 63.2% 13.9%
Total-U.S. 606,810 578,317 922,420 927,691 942,594 59.5% 60.4% 63.0% 15.0%
Canada
MRO 7,575 7,258 9,109 9,257 9,257 25.5% 27.5% 27.5% 15.0%
NPCC 60,891 58,922 75,871 75,899 76,974 28.8% 28.8% 30.6% 10.0%
Maritimes 5,157 4,788 6,338 6,338 7,065 32.4% 32.4% 47.6% 15.0%
Ontario 21,878 21,878 30,292 30,319 30,669 38.5% 38.6% 40.2% 18.9%
Quebec 33,856 32,256 39,242 39,242 39,240 21.7% 21.7% 21.7% 9.3%
WECC 21,000 21,000 23,998 25,125 25,125 14.3% 19.6% 19.6% 14.1%
Total-Canada 89,466 87,180 108,979 110,281 111,356 25.0% 26.5% 27.7% 10.0%
Mexico
WECC CA-MX Mex 1,425 1,425 2,655 2,655 2,655 86.3% 86.3% 86.3% 10.6%
Total-NERC 697,702 666,922 1,034,054 1,040,628 1,056,606 55.0% 56.0% 58.4% 15.0%

Estimated
Dem
and, R
esources, and Reserve M
argins
Estimated Demand, Resources, and Reserve Margins
16 NERC 2010/2011 Winter Reliability Assessment
Table 3b: Estimated January 2011 Demand, Resources, and Reserve Margins
Total Internal Demand
Net Internal Demand
Existing Certain & Net Firm Trans-actions
Anticipated Capacity
Resources
Prospective
Capacity Resources
Existing Certain & Net Firm Trans-actions
Anticipated Reserve Margin
Prospective
Reserve Margin
NERC Reference Reserve
Margin Level (MW) (MW) (MW) (MW) (MW) (%) (%) (%) (%)
U.S.
FRCC 46,235 42,716 57,358 57,952 57,951 34.3% 35.7% 35.7% 15.0%
MRO 36,240 34,033 48,075 47,932 47,976 41.3% 40.8% 41.0% 15.0%
NPCC 46,374 44,262 69,386 70,233 73,160 56.8% 58.7% 65.3% 15.0%
New England 22,085 22,085 32,012 32,012 34,939 44.9% 44.9% 58.2% 15.0%
New York 24,289 22,177 37,374 38,221 38,221 68.5% 72.3% 72.3% 18.0%
RFC 146,800 134,900 216,800 216,800 220,500 60.7% 60.7% 63.5% 15.0%
MISO 91,310 84,894 126,612 126,612 137,820 49.1% 49.1% 62.3% 15.0%
PJM 114,746 105,694 167,023 167,023 167,083 58.0% 58.0% 58.1% 16.0%
SERC 183,521 177,994 244,157 244,873 252,027 37.2% 37.6% 41.6% 15.0%
Central 44,144 42,820 50,566 51,106 51,106 18.1% 19.4% 19.4% 15.0%
Delta 22,903 22,199 38,173 38,173 41,057 72.0% 72.0% 84.9% 15.0%
Gateway 15,181 15,181 21,454 21,454 21,454 41.3% 41.3% 41.3% 12.0%
Southeastern 42,473 40,785 60,129 60,305 62,796 47.4% 47.9% 54.0% 15.0%
VACAR 58,820 57,009 73,835 73,835 75,615 29.5% 29.5% 32.6% 15.0%
SPP RE 31,201 30,984 54,526 55,875 56,953 76.0% 80.3% 83.8% 15.0%
TRE 47,824 46,431 72,881 72,939 72,939 57.0% 57.1% 57.1% 13.0%
WECC 100,431 97,367 153,707 155,919 155,919 57.9% 60.1% 60.1% 15.0%
Desert SW 16,748 16,091 33,096 33,583 33,583 105.7% 108.7% 108.7% 14.0%
CA-MX US 35,891 34,049 58,035 59,832 59,832 70.4% 75.7% 75.7% 12.0%
NWPP 40,474 40,170 53,759 54,559 54,559 33.8% 35.8% 35.8% 18.0%
RMPA 9,616 9,355 15,235 15,335 15,335 62.9% 63.9% 63.9% 14.0%
Total-U.S. 638,627 608,687 916,890 922,523 937,426 50.6% 51.6% 54.0% 15.0%
Canada
MRO 7,737 7,420 9,163 9,312 9,352 23.5% 25.5% 26.0% 10.0%
NPCC 65,035 63,066 76,528 76,827 77,935 21.3% 21.8% 23.6% 10.0%
Maritimes 5,616 5,247 6,298 6,483 7,250 20.0% 23.6% 38.2% 10.0%
Ontario 22,474 22,474 31,221 31,335 31,678 38.9% 39.4% 41.0% 19.0%
Quebec 36,945 35,345 39,009 39,009 39,007 10.4% 10.4% 10.4% 9.0%
WECC 20,667 20,667 23,744 25,050 25,050 14.9% 21.2% 21.2% 14.0%
Total-Canada 93,439 91,153 109,435 111,188 112,337 20.1% 22.0% 23.2% 10.0%
Mexico
WECC CA-MX Mex 1,347 1,347 2,062 2,062 2,062 53.1% 53.1% 53.1% 11.0%
Total-NERC 733,413 701,187 1,028,387 1,035,773 1,051,825 46.7% 47.7% 50.0% 15.0%

Estimated
Dem
and, R
esources, an
d Reserve M
argins
Estimated Demand, Resources, and Reserve Margins
NERC 2010/2011 Winter Reliability Assessment 17
Table 3c: Estimated February 2011 Demand, Resources, and Reserve Margins
Total Internal Demand
Net Internal Demand
Existing Certain & Net Firm Trans-actions
Anticipated Capacity
Resources
Prospective
Capacity Resources
Existing Certain & Net Firm
Trans-actions
Anticipated
Reserve Margin
Prospective
Reserve Margin
NERC Reference Reserve Margin Level
(MW) (MW) (MW) (MW) (MW) (%) (%) (%) (%)
U.S.
FRCC 39,533 36,064 57,358 57,952 57,951 59.0% 60.7% 60.7% 15.0%
MRO 35,067 32,868 48,011 47,975 48,021 46.1% 46.0% 46.1% 15.0%
NPCC 45,859 43,747 68,606 69,453 72,380 56.8% 58.8% 65.5% 15.0%
New England 21,570 21,570 31,212 31,212 34,139 44.7% 44.7% 58.3% 15.0%
New York 24,289 22,177 37,394 38,241 38,241 68.6% 72.4% 72.4% 18.0%
RFC 141,000 129,100 216,800 216,800 220,500 67.9% 67.9% 70.8% 15.0%
MISO 87,880 81,468 126,612 126,612 137,820 55.4% 55.4% 69.2% 15.0%
PJM 110,355 101,303 167,023 167,023 167,083 64.9% 64.9% 64.9% 16.0%
SERC 176,091 170,358 243,344 244,060 251,214 42.8% 43.3% 47.5% 15.0%
Central 42,272 40,850 50,558 51,098 51,098 23.8% 25.1% 25.1% 15.0%
Delta 23,005 22,189 38,172 38,172 41,056 72.0% 72.0% 85.0% 15.0%
Gateway 14,607 14,607 21,517 21,517 21,517 47.3% 47.3% 47.3% 12.0%
Southeastern 39,948 38,260 60,359 60,535 63,026 57.8% 58.2% 64.7% 15.0%
VACAR 56,259 54,451 72,739 72,739 74,519 33.6% 33.6% 36.9% 15.0%
SPP RE 31,377 31,160 54,526 55,875 56,953 75.0% 79.3% 82.8% 15.0%
TRE 46,385 44,990 71,440 71,498 71,498 58.8% 58.9% 58.9% 13.0%
WECC 98,299 95,218 153,141 155,819 155,819 60.8% 63.6% 63.6% 15.0%
Desert SW 16,530 15,871 30,248 30,872 30,872 90.6% 94.5% 94.5% 14.0%
CA-MX US 34,307 32,351 53,687 55,367 55,367 66.0% 71.1% 71.1% 12.0%
NWPP 38,608 38,403 55,591 55,894 55,894 44.8% 45.5% 45.5% 18.0%
RMPA 9,287 9,026 14,821 14,977 14,977 64.2% 65.9% 65.9% 14.0%
Total-U.S. 613,611 583,505 913,226 919,432 934,337 56.5% 57.6% 60.1% 15.0%
Canada
MRO 7,480 7,163 9,007 9,169 9,102 25.7% 28.0% 27.1% 10.0%
NPCC 62,484 60,515 76,291 76,605 77,729 26.1% 26.6% 28.4% 10.0%
Maritimes 5,409 5,040 6,298 6,483 7,250 25.0% 28.6% 43.8% 10.0%
Ontario 22,186 22,186 31,168 31,296 31,655 40.5% 41.1% 42.7% 19.0%
Quebec 34,889 33,289 38,826 38,826 38,824 16.6% 16.6% 16.6% 9.0%
WECC 20,285 20,285 23,278 24,643 24,643 14.8% 21.5% 21.5% 14.0%
Total-Canada 90,249 87,963 108,576 110,417 111,474 23.4% 25.5% 26.7% 10.0%
Mexico
WECC CA-MX Mex 1,338 1,338 2,306 2,306 2,306 72.4% 72.4% 72.4% 11.0%
Total-NERC 705,198 672,806 1,024,108 1,032,156 1,048,117 52.2% 53.4% 55.8% 15.0%

Estimated
Dem
and, R
esources, and Reserve M
argins
Estimated Demand, Resources, and Reserve Margins
18 NERC 2010/2011 Winter Reliability Assessment
Notes for Table 3a through 3c Note 1: Existing‐Certain resources and Net Firm Transactions are reported to be deliverable by the Regions. Note 2: The inoperable portion of Total Potential Resources may not be deliverable. Note 3: The WECC‐U.S. peak demands or resources do not necessarily equal the sums of the non‐coincident WECC‐U.S. subregional peak demands or resources because of subregional monthly peak demand diversity. Similarly, the Western Interconnection peak demands or resources do not necessarily equal the sums of the non‐coincident WECC‐U.S., Canada, and México peak demands or resources. In addition, the subregional resource numbers include use of seasonal demand diversity between the winter‐peaking northwest and the summer‐peaking portions of the Western Interconnection. Note 4: Demand‐Side Management resources are not necessarily sharable between the WECC subregions and are not necessarily sharable within subregions. Note 5: WECC CA‐MX represents only the northern portion of the Baja California Norte, México electric system interconnected with the U.S. Note 6: Midwest ISO and PJM information is for their RTO areas. RFC information is only for the demand and capacity within its Region and not the sum of the Midwest ISO and PJM values. Additionally, the RFC Region and the Midwest ISO and PJM RTO demand values are coincident. Note 7: These demand and supply forecasts were reported on September 30, 2010. Note 8: Each Region/subregion may have its own specific Target Reserve Margin level based on load, generation, and transmission characteristics as well as regulatory requirements. If provided in the data submittals, the Regional/subregional Target Reserve Margin level is adopted as the NERC Reference Reserve Margin Level. If not, NERC assigned a 15 percent Reserve Margin for predominately thermal systems and a ten‐percent Reserve Margin for predominately hydroelectric systems. Note 9: Based on Midwest ISO tariff requirements, individual LSE reserve levels in the SERC Gateway subregion are 12.7 percent. Accordingly, the NERC Reference Margin Reserve Level for SERC Gateway subregion is 12.7 percent.29 Note: 10: “Anticipated Capacity Resources” and “Anticipated Reserve Margin” replaced “Deliverable Capacity Resources” and “Deliverable Reserve Margin” respectively, used in the 2009 Reliability Assessment Reports. The definitions for these resource categories and margin calculations have not changed.
29 For more information, see the Midwest ISO 2009–2010 LOLE Study Report at: http://www.midwestmarket.org/publish/Document/62c6cd_120e7409639_‐7f2a0a48324a

Regio
nal R
eliability A
ssessmen
t High
lights
Regional Reliability Assessment Highlights
NERC 2010/2011 Winter Reliability Assessment 19
RReeggiioonnaall RReelliiaabbiilliittyy AAsssseessssmmeenntt HHiigghhlliigghhttss
FRCC The Florida Reliability Coordinating Council (FRCC) expects to have adequate generating reserves with transmission system deliverability throughout the 2010/2011 winter peak demand. In addition, Existing‐Other merchant plant capability of 1,328 MW is potentially available as future resources to FRCC members and others.
The transmission capability within the FRCC Region is expected to be adequate to supply firm customer demand and planned firm transmission service. Although operational issues can develop due to unplanned outages of generating units within the FRCC Region, those existing operational procedures, pre‐planning, and strategies are anticipated to adequately manage and mitigate these potential impacts to the bulk transmission system.
MRO The Midwest Reliability Organization’s (MRO) forecasted 2010‐2011 Non‐Coincident Winter Peak Total Internal Demand is 43,977 MW. This forecast is 3.5 percent above last winter’s forecasted Total Internal Demand of 42,481 MW. The Existing‐Certain resources for 2010‐2011 winter are 57,162 MW. This is 245 MW higher than the Existing‐Certain resources reported for the 2009‐2010 winter. Prior to or during the 2010/2011 winter
season, 433 MW of planned generation is expected to be placed in service prior to or during the 2010‐2011 winter season. The projected Anticipated Planning Reserve Margin is 38.1 percent, which is well above the various target reserve margins established by the RTOs and Planning Authorities within the MRO Region, which includes entities in the U.S. and Canada. Numerous transmission reinforcements will be completed by or during the upcoming winter season, including several rebuilt/reconductored transmission circuits and several new 115 kV, 138 kV and 161 kV circuits; four new 230 kV circuits; one new 345 kV circuit; one upgraded and six new bulk power auto‐transformers; one new substation; and various substation expansions and upgrades. The MRO will have about 9,320 MW of nameplate wind generation by December 1, 2010. The simultaneous output of wind generation within the MRO Region has historically reached 75 percent or more of nameplate rating for extended periods of time, though this may occur during off‐peak hours and minimum load periods. Up‐to‐now, ramp rates, output volatility, and the inverse nature of wind generation with respect to load levels have been manageable. However, the Reliability Coordinator and Operators in the MRO Region closely monitors the ramp‐down rate of wind generation during the morning load pickup period. Extensive analysis is being performed on wind generation, monitoring regulation, load following, ramp rates, managing minimum load periods, forecasting, and re‐dispatch.

Regional Reliability Assessm
ent Highlights
Regional Reliability Assessment Highlights
20 NERC 2010/2011 Winter Reliability Assessment
NPCC The 2010/2011 winter season shows that Reserve Margins have declined from 2009/2010 peak values in four of the five subregions that NPCC monitors (down: Maritimes, New England, New York, and Québec; up: Ontario). In addition, no significant capacity additions are planned for this winter in the Maritimes, New England, New York, or Québec. In Ontario, 292 MW of wind generation will be added as capacity during the
2010/2011 winter, and an additional 44 MW will be added as existing hydroelectric generation is upgraded from 25 Hz to 60 Hz. In New England during extremely cold winter days, there may be fuel supply restrictions on natural gas‐fired generating units, due to Regional gas pipelines invoking delivery prioritization amongst their entitlement holders. Such conditions routinely occur, resulting in temporary reductions in gas‐fired capacity ranging in aggregate, up to 2,000 MW. These temporary reductions to operable capacity are reflected within ISO‐NE’s forced outage assumptions.
RFC The Net Internal Demand peak of the RFC Region for the 2010/2011 winter season is 134,900 MW and is projected to occur during January 2011. The 2009/2010 forecast of 2010/2011 winter Net Internal Demand peak demand was 140,900 MW, making this year’s winter NID peak demand forecast 6,000 MW (4.3 percent) lower than last year. This is due primarily to the amount of Load as a Capacity Resource that is included in this year’s
assessment. The RFC Region has 214,900 MW of Existing‐Certain capacity for this winter. The calculated Reserve Margin for RFC is 81,900 MW, which is 60.7 percent based on Net Internal Demand and Net Capacity Resources. This compares to a 53.2 percent reserve margin in last winter’s assessment. The PJM projected (Existing and Prospective margins are the same) Reserve Margin for the 2010/2011 winter is 58.0 percent which is in excess of the required Reserve Margin of 15.5 percent. This is a 5.0 percent increase over the 2009 forecast reserve margin.
The Midwest ISO’s system Planning Reserve Margin target level for the 2010/2011 winter season is 15.4 percent, unchanged from the 2009/2010 winter season. The Reserve Margin based on Existing‐Certain and Net Firm Transactions is 49.1 percent, which is greater than the 15.4 percent target level and the 2010 NERC Reference Margin level of 15.0 percent.30 Over 295 miles of transmission line at 100 kV and above, along with 12 transformer installations, have been constructed or upgraded since last winter.
30 See http://www.midwestmarket.org/publish/Document/4dfde8_124a04ca493_‐7f5f0a48324a
Regio
nal R
eliability A
ssessmen
t High
lights
Regional Reliability Assessment Highlights
NERC 2010/2011 Winter Reliability Assessment 21
SERC Aggregated SERC registered entities 2010/2011 winter Total Internal Demand peak forecast is 183,521 MW; this is 2.2 percent higher than the forecast for the 2009/2010 winter Total Internal Demand of 179,659 MW. This increase in forecast demand, as compared to last winter is primarily due to predictions of moderate economic recovery. The SERC Region
expects to have 259,555 MW of resources, including 245,390 MW of Existing‐Certain resources, which is adequate generating capacity and reserves necessary to meet all customer demand during the 2010/2011 winter. An additional 925 MW have been added since the 2009/2010 winter. Future‐Planned resources projections are 988 MW, with no Future‐Other resources expected to be placed in service by January 1, 2011. There are no major capacity additions or retirements expected to occur within the Region. Interruptible demand and Demand‐Side Management (DSM) capabilities for 2010/2011 winter are 5,853 MW, which is 3.2 percent of the Total Internal Demand forecast for 2010/2011. As described in more detail within the subregional reports, many organizations within the SERC Region adhere to their respective state commissions’ regulations or internal business practices regarding maintaining adequate resources. Reserve margins are well above NERC’s Reference Margin Level of 15 percent this winter. To minimize reliability concerns within the Region, entities participate in a host of SERC study groups all of which are designed to perform various system reliability assessments and address industry issues that relate to system reliability.31 Entities within the Region individually evaluate their own studies to address reliability issues. The SERC Region also has extensive interconnections between its subregions and to other NERC Regions, including the FRCC, MRO, RFC, and SPP RE regions. These interconnections permit the exchange of firm and non‐firm power and allow systems to assist one another in the event of an emergency. The 2010 Annual Report of the SERC Reliability Review Subcommittee (RRS) to the SERC Engineering Committee (EC) summarizes the work of the various SERC subcommittees relative to the transmission and generation adequacy and provides the overview of the state of the systems within SERC.32 Approximately 562 miles of 115 kV, 138 kV, 161 kV, 230 kV, 345 kV, and 500 kV transmission lines are scheduled for completion by the 2010/2011 winter. There are no concerns with respect to the impact on reliability performance relating to the completion of these projects. Utilities within the SERC Region have adequate capacity to meet the load and are continuously planning for the system (annual) maintenance outages to keep generating resources reliable. While there is no single challenge for this winter assessment period, operational issues can develop due to unplanned outages of generating units and transmission facilities owned by the companies within the SERC Region. The bulk power system is continuously monitored and entities within the Region take appropriate actions to ensure and maintain reliability.
31 These SERC groups include: Near‐Term Study Group (NTSG), Long‐Term Study Group (LTSG), Dynamics Study Group (DSG)
and the Short Circuit Database Working Group (SCDWG), 32 The SERC RRS Annual Report to the Engineering Committee is available upon request through the SERC Web site at
www.serc1.org.

Regional Reliability Assessm
ent Highlights
Regional Reliability Assessment Highlights
22 NERC 2010/2011 Winter Reliability Assessment
SPP RE The Southwest Power Pool, Inc. Regional Entity’s (SPP RE) demand for the 2010/2011 winter is projected to be lower than the 2009/2010 actual winter demand. This is due in part to a return to historical average in temperatures for the 2010/2011 winter season. Existing capacity resources in the SPP RE footprint are expected to be 55,875 MW; of those, 54,526
MW are Existing‐Certain resources. There have been 682 MW of Existing‐Certain resources added since the 2009/2010 Winter Assessment in the SPP RE footprint. A total of 619 MW of Future, Planned resources are expected to be in service during the assessment timeframe. The SPP RE’s minimum required capacity margin requirement is 12 percent, which translates to a reserve margin of 13.6 percent33. For 2010/2011 winter, the projected reserve margin for the SPP RE Region, based on Existing‐ Certain, and Net Firm Transactions, is 75 percent. The projected winter 2010/2011 reserve margin is 79.3 percent based on Anticipated Capacity Resources. This is well above the SPP RE’s minimum required reserve margin. Overall, there are no known reliability concerns identified for winter 2010/2011. There were approximately 308 miles of 100–345 kV transmission line additions since the previous reporting year. Approximately 130 miles of 100–345 kV transmission line additions are expected to be in service through the assessment timeframe. There are no known transmission reliability concerns identified during the assessment timeframe. In anticipation of a surge in renewable resources on the western part of its grid, the SPP RTO published the SPP Wind Integration Task Force (WITF) Study in early 2010. This study reinforced the criticality of coordinating transmission expansion plans with plans for building infrastructure to accommodate wind energy. Study recommendations will allow SPP RE to prepare for continued growth in the Region’s renewable wind resources. The study recommended significant bulk EHV transmission additions (e.g., 230 kV, 345 kV and/or 765 kV) for a scenario in which 20 percent of energy produced is by wind. If the needed transmission upgrades were completed, there would be no significant technical barriers or reliability impacts to integrating wind energy levels up to 20 percent. For the near‐term, the study identified the need to develop a sophisticated process for determining what generating units are used throughout the Region, explicitly addressing the uncertainty associated with wind forecast errors. The implementation of a centralized wind energy forecasting system was also recommended.
33 SPP RE Criteria 2.1.9 http://www.SPP RE.org/publications/Criteria02042010‐withpercent20AppendicesCurrent.pdf

Regio
nal R
eliability A
ssessmen
t High
lights
Regional Reliability Assessment Highlights
NERC 2010/2011 Winter Reliability Assessment 23
TRE The 2010/2011 winter peak demand forecast is 48,066 MW, which is 11 percent higher than the 2009/2010 winter peak demand forecast of 43,463 MW. The increase is due primarily to the use of a new model that is more sensitive to winter weather. To meet this demand, the ERCOT Region expects 72,500 MW of Existing‐Certain generating capacity to be available at the winter peak, which includes the addition of 135 MW of generating
capacity since the last winter period. In addition, net firm imports of 381 MW and 58 MW of future capacity expected for the 2010/2011 winter period result in anticipated capacity resources of 72,939 MW. These inputs result in a Reserve Margin of 57.1 percent – well above the 12.5 percent minimum Reserve Margin target – indicating that the ERCOT Region is projected to have sufficient resources to serve the peak demand in the Region this winter. Since the winter 2009/2010 period, approximately 549 miles of new or upgraded 345 kV lines have been completed, or are projected to be completed, before the end of the 2010/2011 winter period. There are no known transmission constraints expected to significantly affect reliability across the ERCOT Region. The most important challenge facing the operation of the bulk power system in the ERCOT Region is the transition by ERCOT ISO to a new wholesale market system, planned for December 1, 2010.
WECC The Western Electricity Coordinating Council (WECC) 2010/2011 winter total internal coincidental demand is forecast to be 126,498 MW and is projected to occur in December 2010. The forecast is based on normal weather and reflects generally adverse economic conditions. The forecast is 1.5 percent lower than last winter’s actual peak demand of 128,461 MW that occurred under generally above normal temperatures in the Region.
For the peak winter month of December 2010, WECC expects Deliverable Capacity resources (Existing‐Certain resources plus Future‐Planned resources) totaling 182,845 MW which includes 6,200 MWs added during 2009. During the 2010/2011 winter study period WECC expects to add over 4,000 MW of additional new capacity including 2,011 MW of wind, 91 MW of solar, 50 MW of biomass, and 967 MW
of hydroelectric. WECC staff compares loads and resources against a building block guideline for Planning Reserve Margins. The building block has four elements: contingency reserves, regulating reserves, reserves for additional forced outages, and reserves for 1‐in‐10 weather events. The 1‐in‐10 weather event adder is used to convert from the requested 1‐in‐2 demand forecast to a demand that could be expected during an extreme temperature event. A more detailed explanation of the building block guideline is presented in the WECC Power Supply Assessment.34 The building block values were developed for each Balancing Authority (BA) and then aggregated by subregions, and the entire WECC region. The aggregated winter season building block guideline for the WECC Region is 14.5 percent.
34http://www.wecc.biz/committees/StandingCommittees/PCC/LRS/Shared%20Documents/Power%20Supply%20Assesment/20
09%20Power%20Supply%20Assessment.pdf

Regional Reliability Assessm
ent Highlights
Regional Reliability Assessment Highlights
24 NERC 2010/2011 Winter Reliability Assessment
The WECC wide reserve margin for the winter period, based on Existing‐Certain resources and Net Firm Transactions, is 44.9 percent. The WECC wide reserve margin, based on Deliverable Capacity, is 47.4 percent. Both of these margins are significantly higher than the building block guideline of 14.5 percent, which indicated that there are no significant reserve margin issues or reliability concerns for the WECC Region as a whole, nor for any of the individual subregions. Several transmission projects have been added or upgraded since the prior winter assessment including a 500 kV line that was added in southern California to deliver wind generation to load centers, and a 500 kV line that was added in the Phoenix area. No significant projects or upgrades are expected to be put in‐service during the winter assessment timeframe. WECC staff notes that no reliability concerns resulted from the assessment of the upcoming winter. WECC staff does not expect any major scheduled generating unit outages, transmission facility outages, or unusual operating conditions that would adversely affect reliable operations this winter. The integration of wind generation will continue to require modifications to the way system operators dispatch generation resources in order to provide sufficient operating flexibility. However, WECC staff does not anticipate any reliability issues related to the integration of wind generation during the timeframe of the winter assessment.
Regio
nal R
eliability Self‐A
ssessmen
ts Regional Reliability Self-Assessments
NERC 2010/2011 Winter Reliability Assessment 25
RReeggiioonnaall RReelliiaabbiilliittyy SSeellff--AAsssseessssmmeennttss
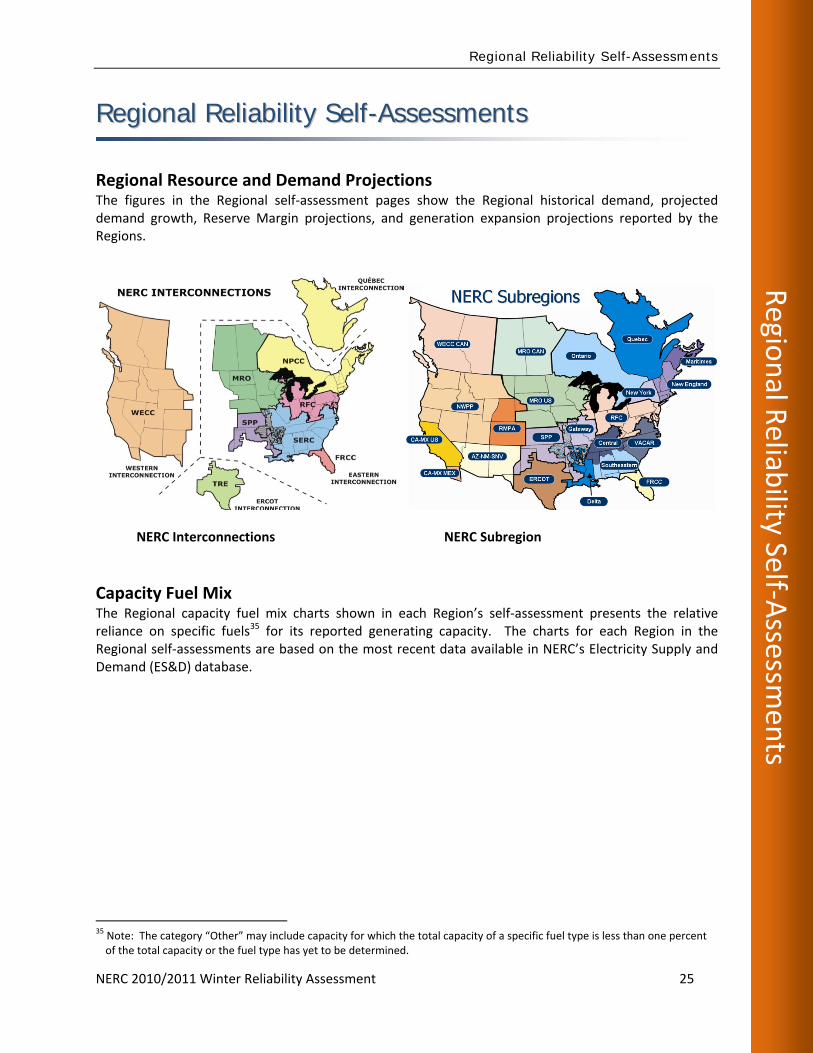
Regional Resource and Demand Projections The figures in the Regional self‐assessment pages show the Regional historical demand, projected demand growth, Reserve Margin projections, and generation expansion projections reported by the Regions.
NERC Interconnections NERC Subregion
Capacity Fuel Mix The Regional capacity fuel mix charts shown in each Region’s self‐assessment presents the relative reliance on specific fuels35 for its reported generating capacity. The charts for each Region in the Regional self‐assessments are based on the most recent data available in NERC’s Electricity Supply and Demand (ES&D) database.
35 Note: The category “Other” may include capacity for which the total capacity of a specific fuel type is less than one percent of the total capacity or the fuel type has yet to be determined.

Regional Reliability Self‐Assessm
ents
Regional Reliability Self-Assessments
26
FFRRCCCC
Introduction The FRCC Region is typically summer‐peaking and divided into 11 Balancing Authorities. As part of the transition to the ERO, FRCC has registered 74 entities (both members and non‐members) performing the functions identified in the NERC Reliability Functional Model and defined in the NERC Reliability Standards glossary. The Region contains a population of more than 16 million people, and has a geographic coverage of about 50,000 square miles over peninsular Florida. The purpose of this report is to assess the reliability of the FRCC Region for the 2010/2011 upcoming winter season. The FRCC assessment process is performed in accordance to the Florida Public Service Commission (FPSC) requirement that all Florida utilities file an annual Ten Year Site Plan that details how each utility will manage growth for the next decade. The data from the individual entity plans are aggregated and used in the assessment process to evaluate resource and transmission adequacy.
Demand FRCC is forecasted to reach its 2010/2011 winter peak demand of 46,235 MW in January 2011, which represents a projected demand decrease of 11.3 percent over the actual 2009/2010 winter demand of 52,368 MW.36 This projection is consistent with historical weather‐normalized FRCC demand growth and is 4.0 percent higher than last year’s winter (2009/2010) forecast of 44,446 MW. The increase in
36 The FRCC Region endured an unusually prolonged cold‐snap that lasted over a week and a half at the beginning of 2010
becoming the second coldest winter on record where Florida experienced 12 consecutive days of average low temperatures of 32 degree weather with the coldest day being on January 11.

Regio
nal R
eliability Self‐A
ssessmen
ts Regional Reliability Self-Assessments
NERC 2010/2011 Winter Reliability Assessment 27
the 2010/2011 winter peak demand forecast is mostly attributed to a model calibration to account for the highly unusual previous winter peak demand that occurred in the 2009/2010 Winter season because of a prolonged period of significantly colder than normal weather conditions (12 consecutive days37). Each individual Load Serving Entity (LSE) forecast takes into account historical temperatures to determine the normal temperature at the time of peak demand. The demand forecast for this winter takes into consideration the overall economy in Florida with emphasis on the price of electricity. Each individual LSE within the FRCC Region develops a forecast that accounts for its actual peak demand. The individual peak demand forecasts are then aggregated by summing these forecasts to develop the FRCC Region forecast. These individual peak demand forecasts are coincident for each LSE but there is some diversity at the Regional level. The entities within the FRCC Region plan their systems to meet the Reserve Margin criteria under both summer and winter peak demand conditions. There is a variety of energy efficiency programs implemented by entities throughout the FRCC Region. These programs can include commercial and residential audits (surveys) with incentives for duct testing and repair, high efficiency appliances (air conditioning, water heater, heat pumps, refrigeration, etc.) rebates, and high efficiency lighting rebates.38 The 2010/2011 net internal FRCC peak demand forecast includes the effects of new energy efficiency programs as well as 3,519 MW (7.6 percent of Total Internal Demand) of potential demand reductions from the use of direct control load management and interruptible load management programs composed of residential, commercial and industrial demand. Entities within the FRCC use different methods to test and verify Direct Load Management programs such as actual load response to periodic testing, use of a time and temperature matrix and the number of customers participating. There currently is no critical peak pricing with control incorporated into the FRCC projection. Each LSE within the FRCC treats every Demand Side Management load control program as “demand reduction” and not as a capacity resource. FRCC periodically assesses the peak demand uncertainty and variability by developing Regional bandwidths. The purpose of developing bandwidths on peak demand loads is to quantify uncertainties of demand at the Regional level. This would include weather and non‐weather load variability such as demographics, economics, and price of fuel and electricity. The influences of extreme winter conditions are not considered explicitly, but such conditions are implicitly examined within the bandwidth analyses to account for such extreme temperature deviations from weather‐normalized forecasts. Factors that restrained the growth outlook for this winter’s forecast include a weaker Florida economy and projected higher fuel prices.
Generation FRCC supply‐side resources considered for the winter assessment are categorized as Existing‐Certain, Existing‐Other, and Existing‐Inoperable. The total Existing‐Certain generation in the FRCC Region for this winter 58,696 MW of which 55,087 MW (473 MW of biomass, 44 MW of hydroelectric, one MW of solar, zero MW of wind) are Existing‐Certain, 2238 MW are Existing‐Inoperable, and 1,371 MW are Existing‐Other. The Region is expected to add 594 MW of Future Planned generation for the winter season. The FRCC Region has a negligible amount of Variable Generation.
37https://www.frcc.com/Planning/Shared%20Documents/Load%20and%20Resource%20Plans/FRCC%202010%20Load%20and
%20Resource%20Reliability%20Assessment%20Report.pdf 38 Additional details can be found in the 10‐Year Site Plan filing for each entity at the following link:
https://www.frcc.com/Planning/default.aspx?RootFolder=%2fPlanning%2fShared%20Documents%2fFRCC%20Presentations%20and%20Utility%2010%2dYear%20Site%20Plans%2f2010&FolderCTID=&View=%7bFBDE89E4%2dE66F%2d40EE%2d999D%2dCFF06CF2A726%7d

Regional Reliability Self‐Assessm
ents
Regional Reliability Self-Assessments
28 NERC 2010/2011 Winter Reliability Assessment
The FRCC Region does not rely on hydroelectric generation, therefore hydroelectric conditions and reservoir levels will not affect the ability to meet the peak demand and the daily energy demand. For the 2010/2011 winter period, no load serving concerns are anticipated due to fuel reliability vulnerabilities including the availability of supplies. For extreme weather conditions such as widespread extreme cold temperatures resulting in natural gas peak usage or impacts to natural gas pipeline infrastructure, the availability of alternate short‐term fuel capability continues to be adequate for the Region. There are no additional fuel availability or supply issues identified at this time and existing mitigation strategies continue to be refined. Based on recent studies, current fuel diversity, alternate fuel capability and fuel reliability analysis, the FRCC does not anticipate any fuel transportation issues affecting resource capability during peak periods and/or extreme weather conditions this winter. The FRCC Region has not identified any unit retirements or planned unit outages that could have a significant impact on reliability.
Capacity Transactions on Peak Currently, there are 2,271 MW of generation under Firm contract available to be imported into the Region on a firm basis from the Southeastern subregion of SERC. No portion of these contracts is from Liquidated Damages or “make whole” contracts. These purchases have firm transmission service to ensure deliverability into the FRCC Region; no imports with partial path reservations are included for Reserve Margin calculations. No Non‐Firm or Expected transactions are included in the assessment. The FRCC Region does not rely on external resources for emergency imports and reserve sharing. However, there are emergency power contracts (as available) in place between SERC and FRCC members. Presently, the FRCC Region has no Firm winter contract exports into the Southeastern subregion of SERC. The FRCC does not consider Non‐Firm or Expected sales to other Regions as capacity resource reductions.
Transmission Major additions to the FRCC bulk power system are mostly related to expansions needed in order to maintain the reliability of the transmission system and meet load growth. Most notable transmission addition to be placed in‐service for this winter is a rebuild of an existing 230kV transmission line in the Central Florida area. For the upcoming winter 2010/2011 there are no concerns in meeting targeted in‐service dates for any new transmission line additions or upgrades. No significant transformer or substation equipment (i.e., SVC, FACTS controllers, HVdc, etc.) additions are expected for the upcoming 2010/2011 winter season. Presently there are two 500 kV transmission lines expected to be out of service at different times and coordinated with expected weather conditions. Transmission constraints in the central Florida area may require remedial actions depending on system conditions creating increased west‐to‐east flow levels across the Central Florida metropolitan load areas. Permanent solutions such as the addition of new transmission lines and the rebuild of existing 230 kV transmission lines are planned and implementation of these solutions is underway. In the interim, remedial operating strategies have been developed to mitigate thermal loadings and will continue to be evaluated to ensure system reliability.

Regio
nal R
eliability Self‐A
ssessmen
ts Regional Reliability Self-Assessments
NERC 2010/2011 Winter Reliability Assessment 29
An interregional transfer study is performed annually to evaluate the total transfer capability between FRCC and the Southeastern subregion of SERC. Joint studies of the Florida/Southeastern transmission interface indicate a winter seasonal import capability of 3,800 MW into the Region, and an export capability of 1,900 MW. These joint studies take into account constraining facilities within the FRCC as well as within the Southeastern Subregion of SERC.
Operational Issues FRCC expects the bulk transmission system to perform adequately over various system operating conditions with the ability to deliver the resources to meet the load requirements at the time of the winter peak demand. The results of the 2010/2011 Winter Transmission Assessment, which evaluated the steady‐state winter peak load conditions under different operating scenarios, indicate that any concerns with thermal overloads or voltage conditions can be managed successfully by operator intervention. Such interventions may include generation re‐dispatch, system sectionalizing, reactive device control, and transformer tap adjustments. The operating scenarios analyzed included the unavailability of major generating units within the FRCC. Therefore, various dispatch scenarios were evaluated to ensure generating resources within the FRCC are deliverable by meeting NERC Reliability Standards under these operating scenarios. In addition, based on the lessons learned from the Post‐Winter Assessment, the FRCC Region has developed a cold‐weather preparation check list identifying items to review prior to and during cold weather periods. The check list will be reviewed during conference calls to help entities proactively address potential cold weather issues, such as: reviewing operation on liquid fuel, ensuring that appropriate permitting is in place, addressing potential de‐mineralized water constraints and any other cold weather induced environmental constraints which may impact dispatch, potential for initiating Energy Emergency Alerts (and associated procedures), review of Available Transfer Capability, and associated model ratings, etc. The amount of variable generation within the FRCC Region is negligible having no potential to cause over generation conditions. Therefore, no operational changes are needed due to the integration of small amounts of Variable Generation. Demand Side Management load control programs within the FRCC are treated as “demand reduction” and not as a capacity resource. The expected levels of demand reduction programs throughout the FRCC Region are not expected to cause any reliability concerns. Finally, there are no foreseen environmental restrictions identified at this time that could potentially affect reliability in the FRCC Region throughout the assessment period. The FRCC has a Reliability Coordinator (RC) agent that monitors real‐time system conditions and evaluates near‐term operating conditions of the electric grid. The Reliability Coordinator uses a Region‐wide state estimator and contingency analysis program to evaluate current system conditions. These programs are provided with input data from operating entities on a periodic basis. These tools enable the FRCC Reliability Coordinator to study and implement operational procedures such as generation re‐dispatch, sectionalizing, planned load shedding, reactive device control, and transformer tap adjustments to successfully mitigate line loading and voltage concerns that may occur in real‐time.
Reliability Assessment Analysis The FRCC assessment process is performed in accordance with the Florida Public Service Commission (FPSC) requirement that all Florida utilities file an annual Ten Year Site Plan that details how each utility

Regional Reliability Self‐Assessm
ents
Regional Reliability Self-Assessments
30 NERC 2010/2011 Winter Reliability Assessment
will manage growth for the next decade. The data from the individual plans are aggregated into the FRCC Load and Resource Plan39 that is produced each year and filed with the FPSC. The FRCC Region is required by the state of Florida to maintain a 15 percent Reserve Margin (20 percent for Investor Owned Utilities). Based on the expected load and generation capacity, the projected Existing Reserve Margin for the winter of 2010/2011 is 34.3 percent (Anticipated and Prospective Reserve Margins are both 35.7 percent). This year’s calculated Reserve Margin is only slightly lower than last year’s (2009/2010) Reserve Margin calculation of 40 percent. The expected Reserve Margin for this winter includes a total of 2,271 MW imports from the Southern’s subregion of SERC to the FRCC. The total import into the FRCC Region consists of 838 MW of generation residing in the Southeastern Subregion of SERC owned by FRCC entities and the remaining 1,433 MW as firm purchases. These imports account for 4.9 percent of the Total Internal Demand, and have firm transmission service to ensure deliverability into the FRCC Region. The FRCC has historically used the Loss‐Of‐Load‐Probability (LOLP) analysis to confirm the adequacy of reserve levels for peninsular Florida. The LOLP analysis incorporates system generating unit information (e.g., Availability Factors and Forced Outage Rates) to determine the probability that existing and planned resource additions will not be sufficient to serve forecasted loads. The objective of this study is to establish resource levels such that the specific resource adequacy criterion of a maximum LOLP of 0.1 day in a given year is not exceeded. The results of the most recent LOLP analysis conducted in 2009 indicated that for the “most likely” and extreme scenarios (e.g., extreme seasonal demands; no availability of Firm or Non‐firm imports into the Region; and the non‐availability of load control programs), the peninsular Florida electric system maintains a LOLP below the 0.1 day per year criterion. Under firm transactions, reactive power‐limited areas can be identified during transmission assessments performed by the FRCC. These reactive power‐limited areas are typically localized pockets that do not affect the bulk power system. The FRCC 2010/2011 Winter Transmission Assessment did not identify any reactive power‐limited areas that would affect the BES during the upcoming winter season. The FRCC Operating Committee has developed procedures including, FRCC Communications Protocols – Reliability Coordinator, Generator Operators, and Natural Gas Transportation Service Providers, to enhance the existing coordination between the FRCC Reliability Coordinator and the natural gas pipeline operators and in response to FERC Order 698.40 For capacity constraints due to inadequate fuel supply, the FRCC State Capacity Emergency Coordinator (SCEC) along with the Reliability Coordinator (RC) have been provided with an enhanced ability to assess Regional fuel supply status by initiating Fuel Data Status reporting by Regional utilities. This process relies on utilities to report their actual and projected fuel availability along with alternate fuel capabilities, to serve their projected system loads. This is typically provided by type of fuel and expressed in terms relative to forecast loads or generic terms of unit output, depending on the event initiating the reporting process. Data are aggregated at the FRCC and are provided, from a Regional perspective, to the RC, SCEC, and governing agencies as requested. Fuel Data Status reporting is typically
39 2010 FRCC Regional Load and Resource Plan:
https://www.frcc.com/Planning/Shared%20Documents/Load%20and%20Resource%20Plans/FRCC%202010%20Load%20and%20Resource%20Plan.pdf
40 https://www.frcc.com/handbook/Shared%20Documents/EOP%20‐%20Emergency%20Preparedness%20and%20Operations/FRCC%20Communications%20Protocols%20102207.pdf

Regio
nal R
eliability Self‐A
ssessmen
ts Regional Reliability Self-Assessments
NERC 2010/2011 Winter Reliability Assessment 31
performed when threats to Regional fuel availability have been identified and is quickly integrated into an enhanced Regional Daily Capacity Assessment Process along with various other coordination protocols to ensure accurate reliability assessments of the Region and also ensure optimal coordination to minimize impacts of Regional fuel supply issues and/or disruptions. Fuel reliability continues to be adequate for the Region and fuel supplies are expected to be sufficient including periods of extreme weather during peak load conditions. There are no identified fuel reliability issues at this time. Based on current fuel diversity, alternate fuel capability and fuel reliability analysis results, the FRCC does not anticipate any fuel reliability issues including fuel transportation issues affecting capability during peak periods and/or extreme weather conditions.
Other Region‐Specific Issues The FRCC is not anticipating any other reliability concerns during the upcoming winter season.
Region Description FRCC’s membership includes 29 Regional Entity Division members and 25 Member Services Division members, which are composed of investor‐owned utilities, cooperative systems, municipal utilities, power marketers, and independent power producers. The FRCC Region is typically summer‐peaking and divided into 11 Balancing Authorities. As part of the transition to the ERO, FRCC has registered 74 entities (both members and non‐members) performing the functions identified in the NERC Reliability Functional Model and defined in the NERC Reliability Standards glossary. The Region contains a population of more than 16 million people, and has a geographic coverage of about 50,000 square miles over peninsular Florida. Additional details are available on the FRCC Web site (https://www.frcc.com/default.aspx).

Regional Reliability Self‐Assessm
ents
Regional Reliability Self-Assessments
32 NERC 2010/2011 Winter Reliability Assessment
MMRROO

Regio
nal R
eliability Self‐A
ssessmen
ts Regional Reliability Self-Assessments
NERC 2010/2011 Winter Reliability Assessment 33
Introduction The MRO Region covers all or portions of Iowa, Illinois, Minnesota, Nebraska, North and South Dakota, Michigan, Montana, Wisconsin, and the provinces of Manitoba and Saskatchewan. The total geographic area is approximately 1,000,000 square miles with an approximate population of 20 million. The MRO has six Planning Authorities registered within the footprint: the Midwest ISO, MAPPCOR, American Transmission Company, Southwest Power Pool RTO, Manitoba Hydro, and SaskPower. The Midwest ISO also extends into the RFC and SERC Regions. The Southwest Power Pool RTO is the Planning Authority for the Nebraska utilities within the MRO. There are three Reliability Coordinators within the MRO footprint: the Midwest ISO, Southwest Power Pool RTO, and SaskPower. The Nebraska utilities fall under the Southwest Power Pool RTO Reliability Coordinator. The majority of registered entities within MRO are Midwest ISO tariff members and therefore participate in the Midwest ISO market operations. There are seven Balancing Authorities: Lincoln Electric System (LES), Manitoba Hydro (MH), Nebraska Public Power District (NPPD), Omaha Public Power District (OPPD), Saskatchewan Power Corporation (SPC), Western Area Power Administrator (WAPA) and Midwest ISO, which assumes all tariff members under Midwest ISO operate as one Balancing Authority. The MRO Region as a whole is a summer‐peaking Region. However, the Canadian portion of the MRO is winter‐peaking. The MRO presently has two NERC subregions: MRO‐US and MRO‐Canada. Manitoba Hydro has high capacity tie‐lines with the U.S. and typically exports to the U.S. during on‐peak hours.
Demand MRO forecasted 2010/2011 Winter Non‐Coincident Peak Total Internal Demand in the combined MRO US and MRO Canada is 43,977 MW, assuming normal weather conditions. This forecast is 3.5 percent

Regional Reliability Self‐Assessm
ents
Regional Reliability Self-Assessments
34 NERC 2010/2011 Winter Reliability Assessment
above last winter’s forecasted total demand of 42,481 MW and 7.4 percent higher than last year’s actual winter peak demand of 40,939 MW. Any interruptible demand or DSM implemented during last year’s peak load is unknown. The MRO 2010/2011 winter forecast Net Internal Demand is 41,453 MW, which is 2.9 percent higher than the 2009/2010 winter forecasted Net Internal Demand of 40,291 MW. Peak demand uncertainty and variability due to extreme weather, economic conditions, and other variables are accounted for within the determination of adequate generation reserve margin levels. Most of MRO Planning Authorities use a Load Forecast Uncertainty (LFU) factor that considers uncertainties attributable to weather and economic conditions. Saskatchewan develops energy and peak demand forecasts based on a provincial econometric model and forecasted industrial load data. Forecasts take into consideration the Saskatchewan economic forecast, historic energy sales, customer forecasts, normalized weather and historical data, and system losses.41 Each individual LSE within the MRO Region maintains reserves based on its monthly peak load forecasts. The LSEs report demand based solely on their own peak, which could occur at a different time than the system peak. The individual LSE's monthly peak load forecasts are then aggregated by summing these forecasts to develop the MRO Regional non‐coincident demand forecast. The regional non‐coincident demand forecast does not include any diversity factors. Each MRO member uses its own forecasting method, meaning some may use a 50/50 forecast and some may use a 90/10 forecast. In general, the peak demand forecast includes factors involving recent economic trends (industrial, commercial, agricultural, residential) and normal weather patterns. From a Regional perspective, there were no changes in this year’s forecast assumptions in comparison to last year. MRO staff distributed the NERC winter 2010/2011 data request spreadsheet to each LSE member within the MRO in the format it was received from NERC. The members populated these spreadsheets based on NERC and MRO instructions and submitted them back to the MRO for processing. Internally, MRO staff compiled the individual spreadsheet submissions into a set of regional spreadsheets representing the MRO Region as a whole as well as MRO US and MRO Canada. Interruptible Demand (1,543 MW, 3.5 percent) and Demand Side Management (DSM) (982 MW, 2.2 percent) programs, amounting to 5.7 percent of the MRO’s Projected Total Internal Peak Demand of 43,977 MW are used by a number of MRO members. A wide variety of programs, including direct load control (such as electric appliance cycling) and interruptible load, may be used to reduce peak demand during the winter season. Reductions in demand due to energy efficiency are not known at this time. Saskatchewan has energy efficiency programs designed to help customers save power, save money, and help the environment. These programs include energy‐efficiency, conservation, education, and load management programs. Residential programs focus on consumer education on energy efficiency and market transformation of lighting, appliances, and furnace motors including retailer/manufacturer partnerships and end‐user incentives. Commercial and industrial programs include energy performance contracting, energy audits, and information services along with the market transformation of lighting, geothermal and HVAC. Measurement and verification programs are based on industry standard protocols.
41 Saskatchewan 2010 Load Forecast Report

Regio
nal R
eliability Self‐A
ssessmen
ts Regional Reliability Self-Assessments
NERC 2010/2011 Winter Reliability Assessment 35
Saskatchewan develops annual energy and peak demand forecasts based on a provincial econometric model and forecasted industrial load data. The economic forecast provides information on population and household growth, and growth rates for commercial, farm, and oil field categories. The forecast for the industrial class is based on individual meetings with each customer to record their future load requirements. The provincial econometric model is coordinated with the provincial government to ensure consistency. Summary details are provided in Saskatchewan's annual Load Forecast Report. High and low forecasts are developed for Saskatchewan to cover possible ranges in economic variations and other uncertainties such as weather using a Monte Carlo simulation model to reflect those uncertainties. This model considers each variable to be independent from other variables and assumes the distribution curve of a probability of occurrence of a given result to be normal. The probability of the load falling within the bounds created by the high and low forecasts is expected to be 90 percent (confidence interval). Load forecasting methods have not changed due to the economic recession. Load forecast assumptions are routinely adjusted based, in part, on economic conditions and forecasts. In cases where economic performance is expected to decline, the impact would be to lower the actual load forecast due to expected decline in industrial load. Saskatchewan addresses weather uncertainty using a Monte Carlo simulation model that considers a range of weather conditions based on historical observations.
Generation The Existing‐Certain resources for the MRO US and Canada 2010/2011 winter total are 56,839 MW. The Existing‐Other and Inoperable resources for the MRO US and Canada 2010/2011 winter are 7,803 MW. The majority of this Existing‐Other generation is wind generation derated by 80 percent of its nameplate capacity. Future‐planned resources that are expected to be in service this winter are 433 MW. These values do not include Firm or Non‐firm purchases and sales. The nameplate capacity of the variable generation for the MRO is 9,320 MW. The variable resources for the MRO expected to be available at peak times is 1,856 MW, based on 20 percent of nameplate capacity. MRO uses 20 percent of nameplate capacity for winter assessments and eight percent of nameplate capacity for summer assessments. The biomass portion of resources for the MRO expected to be available at peak times is 286 MW. Reservoir water levels on the Missouri River have improved significantly since last year with the system at or near full capacity (except for the Fort Peck reservoir). Hydroelectric unit releases will be at or above normal levels into the early part of the winter to make room in the reservoir system for spring runoff. Some limitations will continue into the winter for endangered species requirements and maintenance outages of the hydroelectric units. The Manitoba water condition is above normal and normal Manitoba‐US transfers are expected. Manitoba Hydro manages its reservoir levels in preparation for the winter season such that there is adequate energy to meet daily energy demand throughout the winter. Saskatchewan reservoirs are at normal conditions and regular operating regimes are expected. Reservoir levels are sufficient to meet both peak demand and the daily energy demand throughout the upcoming system. Reservoirs are sufficiently large enough to meet daily requirements, and current hydrological conditions are expected to be normal during the upcoming season.

Regional Reliability Self‐Assessm
ents
Regional Reliability Self-Assessments
36 NERC 2010/2011 Winter Reliability Assessment
Capacity Transactions on Peak For the 2010/2011 winter season, the MRO is projecting total Firm imports of 1,674 MW. These imports are from sources external to the MRO Region. The MRO has approximately 1,275 MW of total projected exports to load outside of the MRO Region. The net import/export of the MRO Region can vary at peak load, depending on system conditions and market conditions. Transfer capability from MRO Canada (Saskatchewan and Manitoba) into the MRO US is limited to 2,415 MW due to the operating security limits of the two interfaces between these two provinces and the U.S.42 The forecasted firm transfers from Manitoba to the U.S. are 920 MW for the 2010/2011 winter. Saskatchewan has a firm import of 50 MW scheduled for the December 2010 to February 2011 reporting period. One hundred percent of the energy contract is Firm and has Firm transmission reserved. Throughout the MRO Region, Firm transmission service is required for all generation resources that are used to provide firm capacity; also meaning that these Firm generation resources are fully deliverable to the load. The MRO is forecast to meet the various reserve margin targets without needing to include energy‐only, uncertain, or transmission‐limited resources. The MRO is also able to meet the various reserve margin targets without having to rely on firm imports this winter. Different transmission providers within the MRO Region treat Liquidated Damage Contracts (LDC) according to their tariff policies. Most MRO members are within non‐retail access jurisdictions (except for Upper Michigan) and therefore liquidated damage products are not typically used. Transmission Reliability Margins (TRM) are calculated and reserved by the Transmission Providers within the MRO Region to assure that operating reserves can adequately be delivered.
Transmission The following reinforcements include projects that have expected in‐service dates prior to December 1, 2010 (or as noted). Several projects went in service prior to June 1, 2010, and were listed in NERC’s 2010 Summer Reliability Assessment:
6th Street to Beverly 161 kV line in Cedar Rapids (Iowa)
Salem 345/161 kV transformer (Iowa)
Downtown Industrial‐Beverly 161 kV line (Iowa)
Fernald‐Story Co‐Marshalltown‐West Main 161 kV line (Iowa)
Adams‐Barton 161 kV line (Iowa)
Adams‐Rochester 161 kV line (Iowa)
Beaver Creek‐Harmony 161 kV line (Iowa)
Harbine‐Steele City (Nebraska)‐Knob Hill (Kansas, SPP RE) 115 kV interconnection with Westar Energy, October 2010
Replace Canaday 230/115 kV 100 MVA Transformer with 336 MVA Transformer, November 2010. (Nebraska)
North Platte 230/115 kV transformer (Nebraska)
42 Manitoba Hydro - Saskatchewan Power Seasonal Operating Guideline on Manitoba-Saskatchewan Transfer Capability

Regio
nal R
eliability Self‐A
ssessmen
ts Regional Reliability Self-Assessments
NERC 2010/2011 Winter Reliability Assessment 37
Aspen‐Plains 138 kV line, in‐service in March 2010 (Wisconsin)
Second Paddock‐Rockdale 345 kV line, in‐service in March 2010 (Wisconsin)
Oakridge‐Verona 138 kV line, in‐service in June 2010 (Wisconsin)
Second 138 kV underground line Humboldt Terminal to Shorewood, November of 2010. (Wisconsin)
New Mandan Jct. 230/115 kV substation with a 200 MVA transformer, January 2011. (North Dakota)
Williston‐Tioga 230 kV line, December 2010, (North Dakota)
Williston 230/115 kV 200 MVA transformer, December 2010 (North Dakota)
Belfield‐Rhame 230 kV, April 2010 (North Dakota)
Bison‐Square Butte 230 kV (North Dakota)
Pleasant Valley 345/161 kV transformer (Minnesota)
Chisago‐Apple River 161 kV line (Minnesota)
Badoura‐Birch Lake 115 kV line (Minnesota)
Badoura‐Pine River‐Pequot Lakes 115 kV line (Minnesota)
Addition of a 100‐miles 230 kV transmission line in south‐central Saskatchewan in 2010
Addition of a 230/138 kV 350 MVA auto‐transformer in south‐central Saskatchewan Two 115 kV tie lines that connect LES to the NPPD Sheldon substation will be out of service at various times during the 2010/2011 winter season in order to complete construction of a new four‐terminal ring bus substation in southwest Lincoln. This project is expected to be completed by April 2011. Boswell‐Blackberry 230 kV circuit #2 had an extended outage during the fall of 2010 to rebuild sections of line to 100 degrees cCelcius specifications. This line will be out of service again during a portion of the winter for the rebuild to 100 degrees Celcius. Wind generation development near Fargo, North Dakota may result in constraints on the 230 kV network lines in the Fargo area, for which upgrades are still pending. These constraints are addressed by a Special Protection System and operating guides which specify conditions requiring generation curtailment.
Inter‐Regional Transfers The data in table MRO‐1 are based on the MRO/RFC/SPP RE/SERC‐W 2010/2011 Winter Inter‐regional TransmissionAssessment.43 Non‐simultaneous Total Import Capabilities into MRO from RFC‐W, SERC‐W, and SPP RE Regions are:
43 Eastern Interconnection Reliability Assessment Group (ERAG) 2010/2011 Winter Inter‐regional Transmission Assessment,
MRO‐RFC‐SERC West‐SPP RE (MRSWS) sub‐group study

Regional Reliability Self‐Assessm
ents
Regional Reliability Self-Assessments
38 NERC 2010/2011 Winter Reliability Assessment
Table MRO‐1: Transfer Direction
Transfer Direction TIC (MW)
RFC_W TO MRO 4,557
SERC_W TO MRO 3,657
SPP TO MRO 5,757
The Total Import Capability (TIC) is equal to the net import into MRO in the base case plus the First Contingency Incremental Transfer Capability (FCITC) obtained in the transfer analysis. These studies recognize constraints internal and external to the MRO.
Operational Issues A typical winter flow pattern characterized by a significant south to north system bias is expected to re‐occur this winter season. These power transfers from a south to north bias will likely cause some Transmission Load Relief (TLR)/Locational Marginal Prince (LMP) Binding activities, especially during scheduled outages. However, normal and reliable operation of the transmission systems in the MRO Region is expected during the winter 2010/2011 season. Although there are a number of scheduled transmission and generation outages that will take place during this winter season, operational studies have shown that these outages will not cause any serious operational problems. Temporary operating guides will be provided, reviewed, and approved for any scheduled outages that may cause a potential violation of system operating limits. Temporary operating guides will also be issued for any unforeseen operating conditions and/or winter storm related events that might bring the system close to its operating limits. The standing operating guides have been reviewed for the 2010/2011 winter. These standing operating guides contain a pre‐defined sequence of control actions and mitigating steps, which will be implemented in case market activities, loop flows, or scheduled power transfers cause operational issues during the winter season. Transmission operators, local balancing authorities, and the Midwest ISO‐West RC will be closely monitoring the flowgates and facilities, which have a history of TLR/LMP binding associated with winter season congestion. Midwest ISO LMP/binding procedures and NERC TLR will be used, in accordance with operating guides and regional congestion management procedures, to prevent violation of system operating limits on all transmission facilities. The Midwest ISO as an RC and Balancing Authority does not expect any reliability concerns resulting from variable resources during minimum demand and over generation conditions for the 2010/2011 winter assessment period. At the present levels of nameplate wind generation, the Midwest ISO is able to manage ramp rates without any reliability concerns. The Midwest ISO’s Emergency Procedure RTO‐EOP‐003 Supply Surplus Procedure the RC and Balancing Authority through necessary steps to continuously balance load and generation during minimum generation events, and this procedure includes variable resources as necessary. The maximum down‐ramp per hour experienced in the MRO Region has been approximately 1,400 MW thus far, and managed though Region‐wide forecasting that has proven to be routinely accurate to +10 percent out to 24 hours. The MRO Region has approximately 9,320 MW of nameplate wind generation. There is a potential ambient temperature restriction with wind turbines as some wind turbines can be restricted to

Regio
nal R
eliability Self‐A
ssessmen
ts Regional Reliability Self-Assessments
NERC 2010/2011 Winter Reliability Assessment 39
operating in ambient temperatures between ‐20 degrees Fahrenheit and +104 degrees Fahrenheit. Accurate forecasting will help to identify any near‐term concerns regarding ambient temperature limits. The sudden change in, or high output levels of, wind generation in Iowa, Minnesota, and the Dakotas can have a significant impact on the flows through the Wisconsin western and southern interfaces (MWEX and SOUTH TIE). American Transmission Corporation (ATC LLC), and the Midwest ISO are monitoring this operational issue closely. An operational study performed hourly by the Midwest ISO anticipates the impacts of the sudden change in wind generation on a number of selected flowgates. Operators will be alerted when the study results show that the loading of any monitored flowgate might come within 95 percent of its rating. ATC LLC also analyzes the data and trend related to this operational issue monthly to be better prepared for managing the potentially impacted flowgates, particularly the MWEX and SOUTH TIE interfaces. The MRO does not expect any reliability concerns resulting from high‐levels of demand response resources. There are no known environmental or regulatory restrictions that could impact reliability during the 2010/2011 winter season.
Reliability Assessment Analysis The MRO Operating Committee (newly formed in September 2010) is responsible for the seasonal assessments and post‐seasonal assessments. The MRO Transmission Assessment Subcommittee, MRO Resource Assessment Subcommittee, the MAPP Transmission Operations Subcommittee, the ATC LLC and Saskatchewan Power Corporation all contribute to this MRO seasonal reliability assessment. To prepare this MRO Regional assessment, MRO staff sent the NERC spreadsheets to the registered entities within the MRO and collected individual entity’s load forecast, generation, and demand‐side management data. The staff then combined the individual inputs from these spreadsheets to calculate the MRO Regional totals. The staff also sought responses to the questions included in the NERC seasonal request letter, from Planning Authorities within the MRO Region. Using the information gathered from this process, the MRO staff prepares the regional assessment for comments and review by the Resource Assessment Subcommittee, the Transmission Assessment Subcommittee, and the Operating Committee. The MRO Operating Committee, which is ultimately responsible for this assessment, reviewed and approved the final draft before it was submitted to NERC. The MRO’s projected 2010/2011 winter Reserve Margin is 38.1 percent. This is based on Existing‐Certain resources, Planned resources expected for this winter, net firm transactions, and Net Internal Demand. The projected MRO reserve margin of 38.1 percent for the 2010/2011 winter season is well in excess of the various Planning Authority target reserve margins. This winter’s projected reserve margin of 38.1 percent can be compared with last winter’s projected reserve margin of 41.3 percent. Each MRO Planning Authority has a distinct Reserve Margin target. Basin Electric Power Cooperative and Western Area Power Administration use a planning reserve margin identified in the Loss‐of‐Load‐Expectation (LOLE) study performed and completed by MAPP on December 30, 2009. The MAPP Region applies a minimum of 15 percent reserve margin for predominantly thermal systems, and a minimum of ten percent reserve margin for predominantly hydroelectric systems.44 The Midwest ISO has conducted a LOLE study establishing a minimum of 11.94 percent reserve margin requirement based on non‐
44 MAPP Loss‐of‐Load Expectation (LOLE) Study for the ten‐year Planning Horizon 2010‐2019 http://www.mapp.org/ReturnBinary.aspx?Params=584e5b5f405c567900000002cb

Regional Reliability Self‐Assessm
ents
Regional Reliability Self-Assessments
40 NERC 2010/2011 Winter Reliability Assessment
coincident load for all Midwest ISO Load Serving Entities.45 Both MAPP and the Midwest ISO members within the MRO Region use a Load Forecast Uncertainty (LFU) factor within the calculation for the LOLE and the percentage reserve margin necessary to obtain a LOLE of 0.1 day per year or 1 day in 10 years. A minimum planning reserve margin of 13.6 percent applies to Nebraska’s Balancing Areas as indentified in the LOLE study performed and completed by SPP RE on June 2009.46 The study estimates the reserve margin required to obtain a LOLE of 0.1 day per year or one day in ten years. Saskatchewan's reliability criterion is based on annual Expected Unserved Energy (EUE) analysis and equates to a minimum of a 13 percent reserve margin.47 The projected MRO’s Regional reserve margin of 38.1 percent for the 2010/2011 winter season is in excess of these target reserve margins. MRO staff attempts to include all Independent Power Producers’ (IPP) MWs as an internal resource, not as a purchase. Large IPPs that are registered as Generator Owners within the MRO were properly captured. However, there are smaller IPPs within the MRO that fall below registration criteria that have not been entirely captured. These additional IPPs would likely increase the existing capacity and projected reserve margins by a minimal amount. No specific analysis is performed to ensure external resources are available and deliverable. However, to be counted as firm capacity, the various transmission providers require external purchases to have a firm contract and firm transmission service. The MRO Region considers known and anticipated fuel supply or delivery issues in its assessment. Because the Region has a large diversity in fuel supply, inventory management, and delivery methods, the MRO does not have a specific mitigation procedure in place should fuel delivery problems occur. The MRO members do not foresee any significant fuel supply and/or fuel delivery issues for the upcoming 2010/2011 winter season. However, if problems do occur, they will be addressed on a case‐by‐case basis. Fuel‐supply coordination or interruption in Saskatchewan is generally not considered an issue due to system design and operating practices.
Coal resources have firm contracts, are mine‐to‐mouth, and stockpiles are maintained at each facility in the event that mine operations are unable to meet the required demand of the generating facility. Typically, there are 20 days of on‐site stockpile for each of the coal facilities, which in total represent approximately 47 percent of total provincial installed capacity. Strip coal reserves are also available and only need to be loaded and hauled from the mine. These reserves range from 30 to 65 days depending on the plant.
Natural gas resources have firm on‐peak transportation contracts with large natural gas storage facilities located within the province to back the contracts.
Hydroelectric facilities/reservoirs are fully controlled by SaskPower.
Typically, Saskatchewan does not rely on external generation resources.
45 Midwest ISO 2010 LOLE Report
http://www.midwestmarket.org/publish/Document/13b9ea_1265d1d192a_‐7b910a48324a
46 2008 SPP RE LOLE Study – 2009 Update 47 Saskatchewan 2010 Supply Development Plan

Regio
nal R
eliability Self‐A
ssessmen
ts Regional Reliability Self-Assessments
NERC 2010/2011 Winter Reliability Assessment 41
Transient, voltage, and small signal stability studies are performed as part of the near‐term/long‐term transmission assessments. Voltage stability is also evaluated in the Midwest ISO’s seasonal assessment. Reactive power resources are considered in on‐going operational planning studies. No transient, voltage, or small signal stability issues are expected that will impact reliability during the 2010/2011 winter season. Dynamic reactive margin is part of the ATC LLC Planning Criteria, which is determined using a reduction to the reported reactive capability of synchronous machines. A ten percent dynamic reactive margin is required in the intact system and a five percent dynamic reactive margin is required under NERC Category B contingencies. This criterion is applied in the ATC LLC planning ten‐year assessment studies.48
Other Region‐Specific Issues There are no other known reliability concerns anticipated within the MRO Region for 2010/2011 winter.
Region Description The MRO has 116 registered entities. There are seven Balancing Authorities: Lincoln Electric System (LES), Manitoba Hydro (MH), Nebraska Public Power District (NPPD), Omaha Public Power District (OPPD), Saskatchewan Power Corporation (SPC), Western Area Power Administrator (WAPA) and Midwest ISO, which assumes all tariff members under Midwest ISO operate as one Balancing Authority. The MRO Region as a whole is a summer‐peaking Region. The MRO Region covers all or portions of Iowa, Illinois, Minnesota, Nebraska, North and South Dakota, Michigan, Montana, Wisconsin, and the provinces of Manitoba and Saskatchewan. The total geographic area is approximately 1,000,000 square miles with an approximate population of 20 million. The MRO has six Planning Authorities registered within the footprint: the Midwest ISO, MAPPCOR, American Transmission Company, Southwest Power Pool RTO, Manitoba Hydro, and SaskPower. The Midwest ISO also expands into the RFC and SERC Regions. There are three Reliability Coordinators within the MRO footprint, the Midwest ISO, Southwest Power Pool RTO, and SaskPower. The majority of Registered Entities within MRO are Midwest ISO tariff members and therefore participate in the Midwest ISO market operations. The Nebraska utilities fall under the Southwest Power Pool RE.
48 2010 – ATC LLC Ten‐Year Transmission System Assessment Update, http://www.atc10yearplan.com

Regional Reliability Self‐Assessm
ents
Regional Reliability Self-Assessments
42 NERC 2010/2011 Winter Reliability Assessment
NNPPCCCC

Regio
nal R
eliability Self‐A
ssessmen
ts Regional Reliability Self-Assessments
NERC 2010/2011 Winter Reliability Assessment 43
Introduction The following Table NPCC‐1 compares the 2010/2011 winter projections, the 2009/2010 winter forecast and actual demands, and indicates reserve margin projections. The Maritimes and the Québec Areas are winter‐peaking systems; Ontario, New York, and New England are summer‐peaking systems. Peak demands last winter were lower than forecast in four of the NPCC Areas due to milder weather than forecast and economic slowdowns. Demand forecasts for 2010/2011 winter are lower than last winter’s forecasts for New England and New York and higher than last winter’s forecast for Québec, Ontario, and Maritimes.
Table NPCC‐1: Demands and Reserve Margins
NPCC Balancing Authority Area
2010/2011 Winter Forecast
Peak (MW)
2010/2011 Winter Forecast Reserve Margin (percent)
2009/2010 Winter Forecast Reserve Margin (percent)
2009/2010 Winter Forecast
Peak (MW)
2009/2010 Winter
Actual Peak (MW)
Maritimes 5,615 20.0 25.0 5,514 5,205
New l d
22,085 44.9 64.3 22,100 20,791
New York 24,289 67.5 57.3 24,998 24,074
Ontario 22,474 38.6 37.4 22,378 22,045
Québec 36,945 10.4 12.7 36,116 34,659
The New England, New York, and Ontario systems are summer‐peaking and have very high winter reserve margins. When compared with projections for the 2009/2010 winter, the Québec and Maritime subregions are projecting Reserve Margins that are lower for 2010/2011 than the Reserve Margins projected for the prior 2009/2010 winter. NPCC has in place a comprehensive resource assessment program directed through Appendix D, "Guidelines for Area Review of Resource Adequacy," of NPCC Regional Reliability Reference Directory 1, "Design and Operation of the Bulk Power System".49 This document charges the NPCC Task Force on Coordination of Planning (TFCP) to assess periodic reviews of resource adequacy for each of its five subregions. In assessing each review, the TFCP will ensure that the proposed resources of each subregion will comply with Section 5.2 of Directory 1:
"Each Area’s probability (or risk) of disconnecting any firm load due to resource deficiencies shall be, on average, not more than once in ten years. Compliance with this criterion shall be evaluated probabilistically, such that the loss of load expectation [LOLE] of disconnecting firm load due to resource deficiencies shall be, on average, no more than 0.1 day per year. This evaluation shall make due allowance for demand uncertainty, scheduled outages and deratings, forced outages and deratings, assistance over interconnections with neighboring Areas and Regions, transmission transfer capabilities, and capacity and/or load relief from available operating procedures."
49 http://www.npcc.org/documents/regStandards/Directories.aspx

Regional Reliability Self‐Assessm
ents
Regional Reliability Self-Assessments
44 NERC 2010/2011 Winter Reliability Assessment
These resource assessments are also complemented by the efforts of the Working Group on the Review of Resource and Transmission Adequacy (Working Group CP‐08), which assesses the interconnection benefits assumed by each NPCC Area in demonstrating compliance with the NPCC resource reliability. The Working Group conducts such studies at least triennially for a window of five years, and the Working Group judges if the outside assistance assumed by each Area is reasonable. The NPCC real‐time operating reserve requirements are indicated in the NPCC A‐6 “Operating Reserve Criteria” document50. Table NPCC‐2 shown below, indicates the Existing‐Certain and Projected Resources in the NPCC subregions for the 2010/2011 winter months.
Table NPCC‐2: Existing Certain and Projected Resources (MW) NPCC Balancing Authority Area
December January February
Maritimes 6,338 6,483 6,483
New England 36,076 36,076 36,076
New York 36,329 37,374 37,394
Ontario 30,319 31,335 31,296
Québec 42,327 42,327 42,327
Expected capacity additions and retirements include:
No significant capacity additions are anticipated during this winter in the Maritimes, New England, New York,or Québec subregions.
In Ontario, new wind projects totaling 292 MW are expected to come into service during the winter months. In addition, the Upper Mattagami hydroelectric generators (44 MW) are being converted from 25 Hz to 60 Hz.
Transmission The following Table NPCC‐3 indicates the major anticipated transmission system additions.
Table NPCC‐3: Transmission Additions for 2010/2011 Winter
NPCC Area Transmission Project Voltage (kV)
In Service
Maritimes None for this winter N/A N/A
New England Keene Road Substation 345 Winter period
New York Clarks Corners, connects to existing Oakdale‐Lafayette circuit #4‐36
345 Summer 2010
Ontario None for this winter N/A N/A
Québec None for this winter N/A N/A
50 http://www.npcc.org/documents/regStandards/Criteria.aspx

Regio
nal R
eliability Self‐A
ssessmen
ts Regional Reliability Self-Assessments
NERC 2010/2011 Winter Reliability Assessment 45
Significant recent transmission additions are noted and described below:
In New England, in eastern Massachusetts, reactive devices were recently installed to address voltage control and performance issues. A 115 kV 54 MVAr shunt capacitor was installed at West Framingham and a 345 kV 160 MVAr variable shunt reactor was installed at West Walpole.
The new Clarks Corners 345 kV substation is positioned in the vicinity of the existing NYSEG‐owned Lapeer Substation with the high side connecting to the NYSEG/ National Grid Oakdale to the Lafayette 345 kV #4‐36 line. The new substation consists of two 345/115 kV LTC transformers, a 345 kV ring bus, and a 115 kV ring bus.
In Québec during June 2010, a new double‐circuit 315 kV transmission line from Chénier to Outaouais was commissioned, which now permits full use of the new 1,250 MW interconnection’s capacity with Ontario’s Independent Electricity System Operator (IESO).
At Chénier a fourth 1,650 MVA, 735/315 kV transformer was commissioned in July. This, along with the line, as mentioned above, now permits full use of the new 1,250 MW interconnection’s capacity with IESO.
A third 345 MVAr capacitor bank has also been installed at Chénier Transformer Station, north of Montréal.
In Québec the Anne‐Hébert 315/25 kV Transformer Station near Québec City is just now in service. A new 15‐km (9‐mile) 315 kV line integrated to an existing circuit has been built to feed this station.
A 13‐km (8‐mile) double‐circuit 161 kV line has been built to feed the Romaine Complex building site in eastern Québec. This is a 1,550 MW four‐generating‐station complex to be commissioned by Hydro‐Québec Production between 2014 and 2020.
Significant anticipated additions are noted and described below:
In northern Maine, a new Keene Road Substation with one 345/115 kV autotransformer is expected to be in‐service for the upcoming winter period. The addition provides a second supply to this area, which is currently in a radial configuration.
Operations The following are highlights that should be noted with regard to operations within NPCC during the 2010/2011 winter period:
In New England during extremely cold winter days, there may be fuel supply restrictions on natural gas‐fired generating units, due to regional gas pipelines invoking delivery prioritization amongst their entitlement holders. Such conditions routinely occur, resulting in temporary reductions in gas‐fired capacity ranging in aggregate, up to 2,000 MW. These temporary reductions to operable capacity are reflected within ISO‐NE’s forced outage assumptions.
The Beck – Packard BP76, South Mahwah – Waldwick J3410 lines and the Watercure 345/230 kV transformer are expected to be out‐of‐service through the winter operating period.
The New York‐based outages requiring the removal of two of the Niagara interties (PA301 and PA302) are currently being planned for November and December 2010. These outages, which involve maintenance work at the NYPA Niagara Generating Plant, will reduce the transfer

Regional Reliability Self‐Assessm
ents
Regional Reliability Self-Assessments
46 NERC 2010/2011 Winter Reliability Assessment
capability of the Niagara interconnection and impact the Ontario to Michigan transfers. In order to help facilitate these outages, Hydro One is constructing a bypass facility around the failed R76 voltage regulator. This bypass facility will allow BP76 circuit to be returned to service during the Niagara interties outage.
Phase angle regulators (PARs) are installed on the Ontario‐Michigan interconnection at Lambton TS, representing two of the four interconnections with Michigan, but will not be operational until completion of agreements between the IESO, Midwest ISO, Hydro One and International Transmission Company (ITC). The agreement is expected to be executed by the end of 2010. The operation of these PARs along with the PAR on the Ontario‐Michigan interconnection near Windsor, will control flows to a limited extent, and assist in the management of transmission system congestion.
The Eel River (New Brunswick) T4 transformer is presently out of service. This causes import capability into Québec on the Eel River Interconnection to be reduced from 350 MW to zero. Import capability into Québec from New Brunswick is therefore limited to capacity at Madawaska (435 MW). Scheduled return‐to‐service of the T4 Transformer is December 30, 2010.

Regio
nal R
eliability Self‐A
ssessmen
ts Regional Reliability Self-Assessments
NERC 2010/2011 Winter Reliability Assessment 47
NPCC‐Maritimes
Introduction The Maritimes area is a winter‐peaking system. This area covers approximately 57,800 square miles serving a population of approximately 1.9 million. It includes New Brunswick, Nova Scotia, Prince Edward Island, and the area served by the Northern Maine Independent System Operator (parts of northern and eastern Maine). In the Maritimes Area, New Brunswick and Nova Scotia are Balancing Authorities. The New Brunswick System Operator is the RC for the Maritimes Area. For the coming winter period the Maritimes Area does not expect to experience any major reliability issues. In New Brunswick, the transmission system is robust, comprised of a 345 kV transmission ring with additional supporting 230 kV transmissions. In Nova Scotia, the system consists of a 345 kV and 230 kV backbone with underlying 138 kV transmission. No significant new generation or transmission is expected for the coming winter period. Note that the Point Lepreau nuclear generation station outage is continuing and it will be out of service during the entire winter assessment period. The projected reserve margins for this winter’s operating period range from 20 percent to 32 percent.
Demand The Maritimes Area is a winter‐peaking system. The Maritimes Area load forecast is the mathematical sum of the forecasted weekly peak loads of the sub‐areas (New Brunswick, Nova Scotia, Prince Edward Island, and the area served by the Northern Maine Independent System Operator). As such, it does not take the effect of load coincidence within the week into account. Economic assumptions are not made when determining the overall Maritimes load forecasts. Resource evaluations are based on winter conditions. Based on the Maritimes Area 2010/2011 demand forecast, a peak of 5,615 MW is predicted to occur for the winter period, December through February. The actual peak for winter 2009/2010 was 5,205 MW on February 3, 2010, which was 309 MW (5.6 percent) lower than last year’s forecast of 5,514 MW. The difference can be attributed to a milder than expected winter. For the New Brunswick System Operator (NBSO), the load forecast is based on an End‐use Model (sum of forecasted loads by use e.g., water heating, space heating, lighting, etc.) for residential loads and an econometric model for general service and industrial loads, correlating forecasted economic growth and historical loads. Each of these models is weather adjusted using a 30‐year historical average. For Nova Scotia, the load forecast is based on a ten‐year average measured at the major load center, along with analyses of sales history, economic indicators, customer surveys, technological, and demographic changes in the market, and the price and availability of other energy sources. For Prince Edward Island, the load forecast uses average long‐term weather for the peak period (typically December) and a time‐based regression model to determine the forecasted annual peak. The remaining months are prorated on the previous year.
The Northern Maine Independent System Administrator performs a trend analysis on historic data in order to develop an estimate of future loads.

Regional Reliability Self‐Assessm
ents
Regional Reliability Self-Assessments
48 NERC 2010/2011 Winter Reliability Assessment
Load Management is not included in the resource adequacy assessment for the Maritimes Area. In the Maritimes Area there is between 335 MW and 402 MW of interruptible demand available during the assessment period; there is 368 MW forecasted to be available at the time of the seasonal peak. This is six to seven percent of the projected peak demand. The Maritimes Area is broken up into sub‐areas and each area has its own energy efficiency programs. These programs are primarily aimed at the residential consumer to help reduce their heating costs. It is usually geared towards electric heating, as the Maritimes Area is a winter peaking‐system. For further information on the energy efficiency programs please review the following links:
www.maritimeelectric.com
www.nppower.com
www.mainepublicservice.com
www.emec.com
www.nspower.ca/energy_efficiency/programs/ The Maritimes Area does not address quantitative analyses to assessing the variability in projected demand due to weather, the economy, or other factors. In addition, the Maritimes Area does not develop an extreme (e.g., 90/10 percent demand forecast) winter forecast in its seasonal assessment. An assessment is done but it is not based on extreme weather, but by increasing the total Maritimes load by one percent.
Generation The Maritimes Area resources will vary between 7,436 MW and 7,621 MW of Existing capacity. The Maritimes Area does not count conceptual, future, or inoperable resources when doing its seasonal assessment. During this time period there will be 178 MW of existing wind with a nameplate rating of between 593MW and 728 MW. The difference between the nameplate ratings is that there are three wind farms scheduled to come on line during the winter reporting period. The host sub area derates wind farms by 100 percent, hence there is no increase from the 178 MW. Wind project capacity is derated to its demonstrated or projected average output for each winter or winter capability period. This deration of wind capacity in the Maritimes Area is based upon results from the September 21, 2005 NBSO report “Maritimes Wind Integration Study.”51 This wind study showed that the effective capacity from wind projects, and their contribution to LOLE was equal to or better than their seasonal capacity factors. Coincidence of high winter wind generation with the peak winter loads results in the Maritimes Area receiving a higher capacity benefit from wind projects versus a summer‐peaking area. The effective wind capacity calculation also assumes a good geographic dispersion of the wind projects in order to mitigate the occurrences of having zero wind production. Wind is the only variable resource currently considered in the Maritimes Area resource adequacy assessment. During this time period there is 130 MW of existing biomass with a nameplate rating of 133 MW.
51 http://www.nbso.ca/Public/_private/2005%20Maritime%20Wind%20Integration%20Study%20_Final_.pdf

Regio
nal R
eliability Self‐A
ssessmen
ts Regional Reliability Self-Assessments
NERC 2010/2011 Winter Reliability Assessment 49
The Maritimes Area is forecasting normal hydroelectric conditions for the 2010/2011 winter assessment period. The Maritime Area hydroelectric resources are run‐of‐the‐river facilities with limited reservoir storage facilities. These facilities are primarily used as peaking units for providing operating reserve. The Maritimes Area does not expect to experience any conditions that would cause any capacity reductions. The Point Lepreau generation station will be out of service during the entire winter assessment period. With firm purchases from outside the Maritimes Area in place, and all scheduled maintenance completed prior to the winter period, there are no anticipated shortfalls in capacity.
Capacity Transactions on Peak There are firm capacity agreements in place between New Brunswick and Hydro Québec:
Table NPCC‐4: Maritimes Capacity Transactions Firm Purchases December 2010 January 2011 February 2011 LD Energy 150 MW 250 MW 250 MW
There is a firm sale of 207 MW to Hydro‐Québec Production (HQP), which is tied to specific generators within New Brunswick. The purchases and sales have dedicated firm transmission paths. The purchases and sales are not considered in the Maritimes Area Reserve Margin. The Maritime Area does have agreements in place for the purchase of emergency energy with other sub regions as well as an agreement for shared activation of reserve within NPCC. However, the Maritimes Area does not rely on this assistance when doing its winter assessment.
Transmission There has been no significant new bulk power transmission addition since the last reporting winter period. Furthermore, all existing significant transmission lines and transformers (no significant outages at this time) are expected to be in service during the winter reporting period. There are no transmission constraints affecting reliability. The Maritime inter‐regional transfer capabilities are:
NB – MEPCO: 1,000 MW
MEPCO – NB: 550 MW (presently limited to 450 MW by ISO‐NE).
HQ – NB: HVDC + Radial Load = Between 985 MW and 1,017 MW. (The reason for the range is due to the varying radial load during the winter reporting period).
NB – HQ: 770 MW (435 MW with Eel River T4 out of service).
The latest studies are the IPL/NRI studies on the NB / ISO‐NE interface. The regions import capabilities are based on real time values, which are based on transmission and generation being in / out of service. NBSO has rules based on study results for simultaneous transfer capability with our interconnections. Transmission or generation constraints are recognized that are external to the Maritimes Area.

Regional Reliability Self‐Assessm
ents
Regional Reliability Self-Assessments
50 NERC 2010/2011 Winter Reliability Assessment
Operational Issues The Maritime Area assesses its seasonal resource adequacy in accordance with NPCC C‐13 Operational Planning Coordination procedure. As such, the assessment considers the Regional Operating Reserve criteria; 100‐percent of the largest single contingency and 50‐percent of the second largest contingency. When allowances for unplanned outages (based on a discrete MW value representing an historical assessment of the total forced outages in MW typically realized at the time of peak for the given operating season) are considered, the Maritime Area is projecting adequate surplus capacity margins above its operating reserve requirements for the 2010/2011 winter assessment period. Further, the amount of wind presently operating does not require any operational changes. The Maritimes Area is a winter is winter peaking system. Minimum demand and over generation will not be a concern. The only demand response considered in resource adequacy assessment for the Maritimes Area is interruptible load. The Maritimes Area uses a 20 percent reserve criterion for planning purposes, equal to 20 percent x (Forecast Peak Load MW – Interruptible Load MW). There are no environmental or regulatory restrictions, that could affect reliability in the Maritimes Area during the assessment period. There are no expected unusual operating conditions anticipated for the winter that will affect reliability in the Maritime Area.
Reliability Assessment Analysis When allowances for unplanned outages (based on a discrete MW value representing an historical assessment of the total forced outages in MW typically realized at the time of peak for the given operating season) are considered, the Maritime Area is projecting more than adequate surplus capacity margins above its operating reserve requirements for the 2010/2011 winter assessment period. The projected reserve margin for the 2010/2011 winter period ranges from 20.0 percent to 32.4 percent as compared to the projected reserve margin for the winter 2009/2010 of 25.0 percent to 36.2 percent. The projected weekly capacity margins provided in the NPCC CO‐12 Reliability Assessment for the winter 2010/2011 period is seven percent to 18 percent as compared to the projected capacity margin for the winter 2010/2009 of eight percent to 30 percent. These weekly capacity margins consider maintenance outage and unplanned outage projections. The Maritime Area does not consider potential fuel‐supply interruptions in the Regional assessment. The fuel supply in the Maritimes Area is very diverse and including natural gas, coal, oil (both light and residual), hydroelectric, tidal, municipal waste, wind and wood. The NB transmission system is robust, comprised of a 345 kV transmission ring with additional supporting 230 kV transmissions. For those areas that may suffer low voltage post contingency, there are specific “must run” procedures that require generation online to meet necessary reactive reserves for contingencies. This requirement is applied for generation assessments as well as the day ahead review to ensure that there are sufficient reactive reserves.
Other Issues The Maritimes Area is not anticipating any reliability concerns during the 2010/2011 winter. Therefore, no actions are required.

Regio
nal R
eliability Self‐A
ssessmen
ts Regional Reliability Self-Assessments
NERC 2010/2011 Winter Reliability Assessment 51
NPCC‐New England
Executive Summary ISO New England Inc. (ISO‐NE) is the Regional Transmission Organization (RTO) for the six‐state New England Region and is responsible for the reliable operation of the bulk power system, administration of the Region’s wholesale electricity markets, and management of its comprehensive planning process. ISO‐NE reports that due to the ongoing effects of the recession, this year’s forecast for winter peak demand, as well as energy, has been reduced from last year’s forecast levels. On June 1, 2010, implementation of a new Forward Capacity Market (FCM) brought a large influx of both Energy Efficiency (EE) and Demand Resources (DR) into the Regional supply mix, with its treatment as supply‐side capacity. These resources will account for approximately 5.4 percent of the Regional capacity contracted under FCM to serve the 2010/2011 winter demands. No new capacity resources are projected to be commercialized prior to the winter season and there are no projected capacity attritions. Although the Region has no specific or fixed reserve margin requirements per se, the reserve margin entitled “Existing‐Certain Capacity and Net Firm Transactions” reflects 9,927 MW (44.9 percent) for the reference case demand forecast and 9,247 MW (40.6 percent) for the extreme case demand
forecast.52 Primarily because ISO New England is now basing its capacity on FCM obligations rather than
Seasonal Claimed Capability these reserve margins are reduced by approximately 30 percent from those previously forecast to serve the 2009/2010 winter peak. This set of variables still produces a very positive forecast for ISO‐NE to reliably serve the 2010/2011 winter peak and energy demands. During the 2010/2011 winter, there are no projections of any significant transmission lines being out‐of‐service and no transmission constraints are anticipated that would significantly impact Regional reliability. The following new bulk power transmission facilities have been placed in‐service since the 2009/2010 winter period or are expected to be placed in‐service during the 2010/2011 winter period:
In eastern Massachusetts, reactive devices were recently installed to address voltage control and performance issues. A 115 kV 54 MVAr shunt capacitor was installed at West Framingham and a 345 kV 160 MVAr variable shunt reactor was installed at West Walpole.
In northern Maine, a new Keene Road Substation with one 345/115 kV autotransformer is expected to be in‐service for the upcoming winter period. The addition provides a second supply to this area, which is currently in a radial configuration.
As noted earlier, the New England Region is projecting positive reserve margins for the 2010/2011 winter period. There are no fuel supply concerns, environmental restrictions, transmission constraints, or other operational issues projected for this winter. The key points contributing to this positive forecast include the following:
A reduction in the peak demand due to energy efficiency and the ongoing recession for both the reference case (50/50) and the extreme case (90/10) forecasts.
52 This is because New England’s resource adequacy criterion is based on the one day in ten years Loss of Load Expectation (LOLE).

Regional Reliability Self‐Assessm
ents
Regional Reliability Self-Assessments
52 NERC 2010/2011 Winter Reliability Assessment
Additional access to natural gas supplies with the completion of the Neptune Deepwater Port LNG facility and expanding production within the Marcellus Shale.
Improvements to the regional natural gas pipeline system results in increased access to fuel supplies for gas‐fired generation, which comprises approximately 41 percent of the Regions installed capacity.
The additional amounts of demand‐side resources made available with the June 1, 2010 implementation of the new FCM.
Projections for the 2010/2011 winter season have put New England in very good shape with respect to system reliability. Therefore, no special studies or assessments have been performed by ISO‐NE.
Introduction ISO‐NE is the Regional Transmission Organization (RTO) serving the six‐state New England Region. New England is one of five subregions of NPCC.53 This 2010/2011 Winter Reliability Assessment is a deterministic self‐assessment developed by ISO‐NE for submittal to NERC for peer review by the Reliability Assessment Subcommittee (RAS).54 This assessment contains six basic areas of discussion to help gauge system reliability: 1) demand, 2) generation, 3) purchases and sales, 4) transmission, 5) operational issues, and 6) reliability assessment.
Demand Within the NPCC, ISO‐NE is the Balancing Authority for the New England subregion and it subsequently reports only one (1) subregional electrical peak demand value for the entire Balancing Area. The reference demand forecast is the 50/50 forecast (50 percent chance of being exceeded), corresponding to a dry bulb temperature of 7.0 degrees (degrees Fahrenheit (F)). The 7.0 degrees (F) is the 95th percentile of a weekly weather distribution and is consistent with the median of the dry‐bulb value at the time of the winter peak over the last 30 years. The reference demand forecast is also based on the reference economic forecast, which reflects the regional economic conditions that would “most likely” occur. Prior to weather normalization, ISO‐NE’s actual metered 2009/2010 winter peak demand occurred on
December 17, 2009 and was 20,791 MW.55 This peak demand occurred at hour ending 18:00 at a
temperature of 15 degrees (F) and a ‐3 degree (F) dew point. This actual 2009/2010 peak demand was 1.1 percent lower than the actual 2008/2009 winter peak demand of 21,022 MW, which occurred on December 8, 2008. The reference peak demand forecast for the 2009/2010 winter was 22,100 MW. The reference case 2010/2011 winter peak demand forecast is 22,085 MW, which is 15 MW (0.07
percent) lower than the 2009/2010 reference case forecast of 22,100 MW.56 The key factors driving this
53 The five NPCC subregions are comprised of New York, New England, Ontario, Québec, and the Maritimes (New Brunswick &
Nova Scotia). 54 The winter period includes the three months of December 2010, January 2011, and February 2011. 55 The reconstituted (for load reducing actions of Other Demand Resources) peak demand of 21,577 MW occurred on
December 17, 2009 at hour ending 18:00. 56 This value is the same for the Unrestricted Non‐Coincident Peak Demand (Line 1), the Total Internal Demand (Line 2), and the Net Internal Demand (Line 3) from the corresponding NERC 2010/2011 Winter Assessment Spreadsheet, January 2011 values.

Regio
nal R
eliability Self‐A
ssessmen
ts Regional Reliability Self-Assessments
NERC 2010/2011 Winter Reliability Assessment 53
somewhat constant forecast are the continued penetration of energy efficiency and the ongoing affects of the economic recession. ISO‐NE also projects the extreme 90/10 winter peak demand forecast based on the same economic forecast. The extreme case 2010/2011 winter peak demand forecast is 22,765 MW, which is 85 MW (0.4 percent) lower than the 2009/2010 extreme case forecast of 22,850 MW. ISO‐NE develops an independent load forecast for the balancing area. ISO‐NE uses historical hourly demand data from individual member utilities, which ares based upon revenue quality metering. These data are then used to develop historical demand data that the Regional peak demand and energy forecasts are based upon. From this, ISO‐NE develops a forecast of both state and monthly peak and energy demands. The peak demand forecast for the Region and the states can be considered a coincident peak demand forecast. ISO‐NE plans its system to meet the NPCC’s Resource Adequacy Reliability Criterion by using the 50/50
reference case demand forecast, which has a 50 percent chance of being exceeded.57 For the 2010/2011
winter, there are 1,721 MW of demand resources, which are considered capacity resources within the FCM. Within this total are 1,162 MW of active demand resources and 559 MW of passive demand resources (energy efficiency). The active demand resources are Real‐Time Demand Response and Real‐Time Emergency Generation, which can be activated with the implementation of ISO‐NE Operating Procedure No. 4 ‐ Action During a Capacity Deficiency (OP‐4).58 The total effects of Demand Response that can reduce peak demand, is approximately 7.8 percent of the projected Net Internal Demand. Some assets in the Real‐Time Demand Response programs are under direct load control by the Load Response Providers (LRP). The LRP implements direct load control of these assets upon dispatch instructions from ISO‐NE. This includes, but is not limited to, the interruption of central air conditioning systems during the summer season and lighting and heating loads during the winter season. A total of 559 MW of (passive) energy efficiency programs, projected to be in service by the 2010/2011 winter, are considered capacity resources within the FCM. Under the FCM, energy efficiency can be included in the category of on‐peak and seasonal‐peak demand resources.59 This includes installed measures (e.g., products, equipment, systems, services, practices, and/or strategies) on end‐use customer facilities that result in additional and verifiable reductions in the total amount of electrical energy used during on‐peak hours. An ISO‐NE approved Measurement and Verification (M&V) Plan is used for both Demand Response and Energy Efficiency performance evaluation. Commercial operation and seasonal audits are conducted, consistent with ISO‐NE Operating Manuals, to ensure that all FCM Demand Resources and Energy Efficiency projects are capable of delivering their contractual demand reductions. Not included in this assessment is some demand capacity within a voluntary economic program, that may be interrupted, based on the price of wholesale energy. As of October 1, 2010, there were approximately 62 MW enrolled in ISO‐NE’s Price Response Program. The actual value of the demand that responds is captured within the data collected for demand response; and at the time of the peak in the winter of 2009/2010, this amount was about 71 MW.
57 ISO‐NE bases its capacity requirements on a probabilistic loss‐of‐load‐expectation analysis that calculates the total amount of installed capacity needed to meet the NPCC’s once‐in‐ten‐year requirement for preventing the disconnection of firm load due to a capacity deficiency. This value is known as the Installed Capacity Requirement (ICR).
58 http://www.iso‐ne.com/rules_proceds/operating/isone/op4/index.html 59 The rules addressing the treatment of demand resources in the FCM may be found in Section III.13.1.4 of ISO New England’s Market Rule 1, Standard Market Design, located at: http://www.iso‐ne.com/regulatory/tariff/sect_3/_mr1_sect_13‐14.pdf

Regional Reliability Self‐Assessm
ents
Regional Reliability Self-Assessments
54 NERC 2010/2011 Winter Reliability Assessment
ISO‐NE addresses peak demand uncertainty in two ways:
Weather — Peak demand distribution forecasts are made based on 38 years of historical weather data which includes the reference case forecast (50 percent chance of being exceeded), and extreme case forecast (10 percent chance of being exceeded);
Economics — Alternative forecasts are made using high and low economic scenarios.
The latest, long‐range weather forecast for New England is for a normal winter, except for parts of southern New England (Connecticut, Massachusetts, and Rhode Island, as well as southern Vermont and New Hampshire), which may experience slightly above normal temperatures. The national and Regional recession embodied in the economic forecast used in developing the 2010 demand forecast (as published within ISO‐NE’s 2010 CELT Report) was more severe than previous year’s 2009 demand forecast (as published within ISO‐NE’s 2009 CELT Report), and subsequently, the 2010 demand forecast was adjusted lower than the previous 2009 demand forecast.60
Generation ISO‐NE’s Existing‐Certain generating capacity amounts to approximately 31,724 MW based on winter ratings. An additional 4,352 MW within the Existing‐Other category consists of other various categories of additional capacity. One category consists of the amount of capacity exceeding 1,200 MW, for those units/stations that exceed the 1,200 MW level as a “single loss‐of‐source contingency.” In real‐time operations, New England may be required to limit its largest, single loss‐of‐source contingency to 1,200 MW in order to respect operating agreements with PJM and NYISO. The amount of capacity identified within this first category is approximately 180 MW. Another category of capacity is the amount of nameplate capacity that exceeds the FCM Capacity Supply Obligation (CSO), which is approximately
3,333 MW.61 Another category of capacity is the Existing‐Other, Energy‐Only capacity, which is 404 MW,
of which 187 MW of that amount is not part of the FCM CSO. The Existing‐Inoperable category identifies zero (0) MW of capacity. There are no Future Capacity Additions projected for the winter peak demand period. This includes no Future, Planned or Future, Other capacity. Approximately 60 MW of the Existing‐Certain capacity is wind generation that is expected to be available at the time of peak demand. In addition, ISO‐NE has energy‐only wind facilities with a derated capacity of 89 MW. The combined wind capacity reflects a 124 MW derate on‐peak, from the total nameplate capability of 273 MW. Wind capacity under ISO‐NE’s FCM is rated seasonally. FCM wind capacity during the summer and winter seasons is equal to the average of a median calculation performed for each year over the previous five years. For the winter season, the median calculation is the median capacity (MW output) during the hours ending 18:00 through 19:00, each day of October through May and any winter hour
with a “shortage event.”62,63
60 CELT Report is the annual publication of the report entitled “Capacity, Energy, Loads, and Transmission,” which is located on the ISO‐NE Web site at: http://www.iso‐ne.com/trans/celt/report/index.html
61 The CSO is the FCM contracted capacity, which will receive payments for reliably serving the 2010 summer and 2010/2011 winter peak and energy demands.
62 For the summer season, the median calculation is the median capacity (MW output) during the hours ending 14:00 through 18:00, each day of June through September and any summer hour with a “shortage event.”
63 These are events under which ISO‐NE Operations is currently experiencing either an operating reserve or capacity deficiency.
Regio
nal R
eliability Self‐A
ssessmen
ts Regional Reliability Self-Assessments
NERC 2010/2011 Winter Reliability Assessment 55
Non‐FCM wind capability is seasonally rated from either the sustained maximum net output averaged over a four (4) consecutive hour period (measured for the winter and summer capability periods each year); or the unit’s nameplate rating adjusted for engineering data that projects a unit(s) output at the time of peak demand. There is no solar generation within the Existing‐Certain capacity category. Biomass capacity within the Existing‐Certain category totals 933 MW. This reflects a 45 MW derate on‐peak, from the total nameplate capability of 978 MW. The Existing‐Certain capacity also includes 1,631 MW of hydroelectric resources. This reflects a 252 MW derate on‐peak, from the total nameplate capability of 1,883 MW. Monthly ratings for hydroelectric resources with little or no storage capability are calculated based on the maximum capacity of the unit(s), adjusted for historical hydrological conditions and upstream storage. Those hydroelectric units with pondage and storage of at least ten times their seasonal claimed capability rating must annually demonstrate their summer and winter capacity. Hydrological conditions (precipitation) for New England during the 2010/2011 winter are projected to be normal for southern New England and above normal for northern New England. ISO‐NE is not projecting any disruptions to Regional fuel supply chains serving New England’s electric power sector. The future resources that ISO‐NE includes in its reliability analyses and reserve margin calculations are those that have either a signed Interconnection Agreement (IA), have received approval of their Proposed Plan Application (PPA), or those that have begun discussions with ISO‐NE Market Services indicating that the project is nearing completion and is preparing to become an ISO‐NE registered resource/asset. Approximately 600 MW of capacity is expected to be out‐of‐service for maintenance during the January 2011 winter peak demand period.
Capacity Transactions on Peak The 2010/2011 winter Capacity Imports are 388 MW. The 388 MW of Capacity Imports includes 226 MW from Québec and 162 MW from New York. Only Capacity Imports that have been qualified and contracted for delivery within the 2010/2011 FCM Capability Period are defined as Firm Capacity Imports.64 These Firm Capacity Import contracts rely on external resources to satisfy their FCM Capacity Supply Obligation (CSO), which in turn, contributes to meeting the Region’s overall Installed Capacity Requirement (ICR). While the entire 388 MW of Firm Capacity Imports are backed by FCM “qualified” contracts, there is no requirement for those Firm Capacity Imports to have firm transmission service. Under FCM rules, the deliverability of external capacity imports must meet the same delivery requirements as those of internal generators. The market participant is free to choose the type of transmission service it wishes to use for the delivery of energy associated with these Capacity Imports, but that market participant also bears the associated risks of FCM non‐delivery penalties if it chooses to use Non‐firm transmission. There are no Capacity Import contracts that can be characterized as “liquidated damage contracts” or “make‐whole” contracts as defined by FERC Order 890. The 2010/2011 winter Capacity Exports are 100
64 The 2010/2011 FCM Capability Period is from June 1, 2010 to May 31, 2011.

Regional Reliability Self‐Assessm
ents
Regional Reliability Self-Assessments
56 NERC 2010/2011 Winter Reliability Assessment
MW. The 100 MW of Capacity Export is to New York (Long Island) via the Cross‐Sound Cable. Only Capacity Exports that have been qualified and contracted for export within the 2010/2011 FCM Capability Period are defined as Firm Capacity Exports. Although Capacity Exports are backed by firm generation contracts, FCM rules dictate that this type of capacity and associated energy can only be recallable by ISO‐NE in an extreme emergency situation, i.e., just prior to implementation of internal load shedding actions. ISO‐NE bases its annual capacity requirement(s) on a probabilistic loss‐of‐load‐expectation analysis that calculates the total amount of ICR to meet NPCC’s once‐in‐ten‐year requirement for preventing the disconnection of firm load due to a capacity deficiency. Within ISO‐NE’s calculation of its ICR, emergency imports are characterized as “tie benefits.” The combined amount of tie benefits from the three external NPCC subregions is 1,860 MW, which are sub‐categorized as 1,400 MW from Québec, 100 MW from New York and 360 MW from the Maritimes.
Transmission Within the New England Balancing Authority area, the following new bulk power transmission facilities either have been placed in‐service since the 2009/2010 winter period or are expected to be placed in‐service during the 2010/2011 winter period:
In eastern Massachusetts, reactive devices were recently installed to address voltage control and performance issues. A 115 kV 54 MVAr shunt capacitor was installed at West Framingham and a 345 kV 160 MVAr variable shunt reactor was installed at West Walpole.
In northern Maine, a new Keene Road Substation with one 345/115 kV autotransformer is expected to be in‐service for the upcoming winter period. The addition provides a second supply to this area, which is currently in a radial configuration.
There are no reliability concerns in meeting the in‐service date for the aforementioned facilities and there are no transmission additions deemed necessary to meet the demand forecast for the 2010/2011 winter period. ISO‐NE does not expect any major transmission lines or facilities to be out‐of‐service during the 2010/2011 winter period. However, if major transmission outages were to occur, system reliability would be maintained through adherence to ISO‐NE Operating Procedure No. 19 ‐ Transmission Operations (OP‐19) criteria, during real‐time operations.65 During the 2010/2011 winter, no significant transmission constraints that would significantly affect Regional reliability are anticipated. However, under certain operating conditions, there are localized system requirements that are dependent upon the operation of local area generation. Operating procedures and guides are in place to address temporary outages of this type of “must‐run” generation. Where system upgrades are required for a long‐term solution, they are listed within the ISO‐NE Regional System Plan (RSP) projects list as referenced above.
65 ISO‐NE’s OP19 may be found on ISO New England’s Web site at: http://www.isone.com/rules_proceds/operating/isone/op19/index.html

Regio
nal R
eliability Self‐A
ssessmen
ts Regional Reliability Self-Assessments
NERC 2010/2011 Winter Reliability Assessment 57
Table NPCC‐5 summarizes the nominal interregional transmission transfer capabilities. These interregional transfer capabilities are also reviewed and (re)calculated on a day‐to‐day basis within real‐time. All of the studies recognize both transmission and generation constraints within New England and within power systems external to New England.
Table NPCC‐5: New England’s Interregional Transmission Capabilities (MW)
Transmission Interface Transfer Capability (MW)
Source of Transmission Interface
New Brunswick ‐ New England 1,000 Second New Brunswick Tie Study
Hydro‐Québec ‐ New England Phase II 1,40066 PJM and NYISO Loss of Source Studies
Hydro‐Québec – Highgate 200 Various Transmission Studies
New York ‐ New England 1,600 NYISO Operating Study, Winter 2009/2010
Cross‐Sound Cable 330–34667 Cross‐Sound Cable System Impact Study
Operational Issues There are no significant anticipated unit outages, environmental restrictions, variable resources, transmission constraints or temporary operating measures that would adversely impact system reliability during the 2010/2011 winter period. During extremely cold winter days, there may be fuel supply restrictions on natural gas‐fired generating units, due to Regional gas pipelines invoking delivery prioritization amongst their entitlement holders. Such conditions routinely occur, resulting in temporary reductions in gas‐fired capacity ranging in aggregate, up to 2,000 MW. These temporary reductions to operable capacity are reflected within ISO‐NE’s forced outage assumptions. ISO‐NE monitors these potential situations and anticipates that additional resources should be available to cover these temporary forced outages. Newly commercialized Regional LNG facilities and expanded/bi‐directional Regional pipelines should work to dampen these historical gas supply and delivery constraints. On a monthly basis, ISO‐NE uses a weekly operable capacity analysis to assess the reliability and adequacy of the Region.68 These analyses take into consideration the qualified capacity of FCM supply and demand‐side resources, the net of Firm Capacity Imports and Exports, the forecast peak demand (both 50/50 and 90/10 forecasts), operating reserve requirements, all known or planned outages, and the potential for the temporary unplanned outages of generation or transmission facilities. ISO‐NE applies the forecast for the peak winter demand to the three‐week period, following the first non‐
66 The Hydro‐Québec Phase II interconnection is a DC tie with equipment ratings of 2,000 MW. Due to the need to protect for the loss of this line at full import level in the PJM and NY Control Areas’ systems, ISO‐NE has assumed its transfer capability for capacity and reliability calculation purposes to be 1,400 MW. This assumption is based on the results of loss of source analyses conducted by PJM and NY.
67 The capability of the Cross Sound Cable is 346 MW. However, losses reduce the amount of capacity that is actually delivered across the cable. When 346 MW is injected into the cable, 330 MW is received at the point of withdrawal. Recent study work has confirmed that the transfer capability from New York (Long Island) to New England (Connecticut) is very dependent on the specific generation dispatch at New Haven and it could even be reduced to zero when the New Haven Harbor units are operating at fully rated capacity.
68 The operable capacity analyses, which are included with ISO‐NE’s Annual Maintenance Schedule, are posted at: http://www.iso‐ne.com/genrtion_resrcs/ann_mnt_sched/index.html

Regional Reliability Self‐Assessm
ents
Regional Reliability Self-Assessments
58 NERC 2010/2011 Winter Reliability Assessment
holiday, week within January.69 The operating reserve requirement is typically 1,800 MW and the total
aggregate unplanned outages are assumed to be 2,800 MW in January under the 50/50 demand forecast. These weekly operable capacity results are then used by ISO‐NE to identify the means to mitigate projected problems. To date, there are no special operating procedures that have resulted from the recent integration of variable or intermittent resources such as wind, solar, etc. Since ISO‐NE has just over one (1) MW of new solar capacity within its system, there is no current need to forecast the output of solar resources. There are no concerns resulting from a minimum demand/over generation scenario. ISO‐NE currently has market rules, manuals, and system operating procedures (SOPs) in place to mitigate this type of scenario during anytime of the year. 70,71,72 The implementation of the new FCM has enhanced the integration of demand resources into the operation of the system. Operating Procedures have been either developed or revised to dispatch the demand resources. In addition, enhancements to the study tools used by the System Operators to anticipate system impacts because of the demand reduction are also in place. There are no environmental or regulatory restrictions currently being discussed or forecast for the Region that may affect system reliability. There are no unusual operating issues or concerns anticipated that might affect the reliable operation of the New England transmission system for the coming winter period.
Reliability Assessment Analysis ISO‐NE bases its capacity requirements on a probabilistic loss‐of‐load‐expectation analysis that calculates the total amount of installed capacity needed to meet NPCC’s once‐in‐ten‐year requirement for preventing the disconnection of firm load due to a capacity deficiency. This value, ICR, was calculated to be 32,510 MW for the Third Annual FCM Reconfiguration Auction (ARA#3) for the 2010/2011 Capability Period.73 After subtracting the Hydro‐Québec Interconnection Capability Credits (HQICCs) of 1,400 MW, the net amount of capacity needed to meet the resource adequacy criterion is 31,110 MW. Table NPCC‐6 through Table NPCC‐9, shows the details of the capacity resources with Capacity Supply Obligations (CSOs), by Load Zone, for the winter 2010/2011, which includes:
1) 28,768 MW of Generating Capacity (Table NPCC‐6),
2) 1,202 MW of Intermittent Power Resources (Table NPCC‐7),
3) 807 MW of Import Capacity (Table NPCC‐8), and
4) 2,173 MW of Demand Resources (Table NPCC‐9).
69 For the winter of 2010/2011, this equates to a three‐week winter peak demand window, during the weeks beginning January
8, 15 and 22, 2011. 70 ISO‐NE Market Rule 1 – Section III.2.5(c). 71 ISO‐NE Manual 11, Market Operations, Section 2.5.12: Emergency Conditions in the Day‐Ahead Energy Market, Subsection
2.5.12.2: Minimum Generation Conditions, and, Section 2.5.13: Emergency Conditions in the Real‐Time Energy Market, Subsection 2.5.13.2: Minimum Generation Conditions.
72 ISO‐NE System Operating Procedure SOP‐RTMKTS.0120.0015 ‐ Implement Minimum Generation Emergency Remedial Action. 73 The 32,510 MW ICR value does not reflect a reduction in capacity requirements relating to HQICCs that are allocated to the Interconnection Rights Holders, as required by Market Rule 1. After deducting the HQICC value of 1,400 MW per month, the net ICR for use in the 2010/2011 Third Annual FCM Reconfiguration Auction is 31,110 MW.

Regio
nal R
eliability Self‐A
ssessmen
ts Regional Reliability Self-Assessments
NERC 2010/2011 Winter Reliability Assessment 59
Table NPCC‐6: New England Generating Capacity with CSO by Load Zone (MW)
Load Zone MW
Maine 2,853
New Hampshire 3,835
Vermont 879
Connecticut 6,694
Rhode Island 2,286
South East Massachusetts 5,653
West Central Massachusetts 3,506
North East Massachusetts and Boston 3,059
Total New England 28,765
Table NPCC‐7: New England Intermittent Power Resources with CSO by Load Zone (MW)
Load Zone Summer (MW) Winter (MW)
Maine 259 288
New Hampshire 122 146
Vermont 59 103
Connecticut 418 434
Rhode Island 4 8
Southeast Massachusetts 80 86
West Central Massachusetts 40 62
Northeast Massachusetts and Boston 67 70
Total New England 1,049 1,197
Table NPCC‐8: New England Import Capacity Resources with CSO (MW)
Load Zone Tie Location Load Zone NYPA – CMR NY AC Ties 68
NYPA – VT NY AC Ties 12
VJO – Highgate HQ Highgate 200
Erie Boulevard Hydropower – Import NY AC Ties 525
Total New England 805

Regional Reliability Self‐Assessm
ents
Regional Reliability Self-Assessments
60 NERC 2010/2011 Winter Reliability Assessment
Table NPCC‐9: New England Demand Resources with CSO by Load Zone (MW)
Load Zone MW Maine 228
New Hampshire 100
Vermont 85
Connecticut 732
Rhode Island 142
Southeast Massachusetts 202
West Central Massachusetts 278
Northeast Massachusetts and Boston 401
Total New England 2,168
ISO‐NE’s latest resource adequacy information for the 2010 summer and winter 2010/2011 is detailed in the December 15, 2009 FERC Filing entitled Filings of ISO New England Inc. and New England Power Pool Concerning the Installed Capacity Requirement and Related Values for the Final Reconfiguration Auction for the 2010/2011 Capability Year and Certain Market Rule Changes; Docket No. ER10‐438‐000. The model used for conducting the 2010/2011 system‐wide ICR calculations for New England accounts for all known external firm capacity imports and exports. In addition, 1,860 MW of emergency assistance from neighboring systems were included within the ICR modeling for the 2010 summer and 2010/2011 winter period.74 ISO‐NE assumes that it will be able to obtain 1,860 MW of emergency assistance, also referred to as tie benefits, from other neighboring subregions within the NPCC Region during possible capacity shortage conditions within New England. That assumed amount is based on the results of a 2009 probabilistic tie benefits study. In addition to the tie benefits study, ISO‐NE has analyzed projected system conditions within all of the neighboring Balancing Areas, and determined that the 1,860 MW of total tie benefits are reasonable and achievable.75 The areas assumed to be providing the tie benefits are the Maritimes, New York, and Québec. The tie benefits amount to about 50 percent of New England’s total import capability. The 2010/2011 reference case winter peak demand (Net Internal Demand) is 22,085 MW. The Existing‐ Certain Capacity andNet Firm Transactions as well as Deliverable Capacity Resources both total 32,012 MW. The projected Existing and Deliverable 2010/2011 winter reference case reserve margin is 9,927 MW, which equates to a 44.9 percent winter reference case reserve margin. The Prospective Capacity Resources totals 34,939 MW. The projected Prospective 2010/2011 winter reference case reserve margin is 12,854 MW, which equates to a 58.2 percent winter reference case reserve margin.
Because ISO‐NE bases its capacity requirements on a probabilistic loss‐of‐load‐expectation analysis that calculates the total amount of installed capacity needed to meet NPCC’s once‐in‐ten‐year requirement for preventing the disconnection of firm load due to a capacity deficiency, there is no fixed or
74 The 1,860 MW of tie benefits includes 1,400 MW from Québec, 360 MW from New Brunswick, and 100 MW from New York.
75 As reflected in the most recent NPCC Resource Adequacy Assessment (RAA).

Regio
nal R
eliability Self‐A
ssessmen
ts Regional Reliability Self-Assessments
NERC 2010/2011 Winter Reliability Assessment 61
predefined Regional, subregional, state, or provincial requirements, targets or guidelines for reserve margins. The 2010/2011 extreme case winter peak demand (Net Internal Demand) is 22,765 MW. The amount of winter capacity to serve that demand (Existing‐Certain Capacity and Net Firm Transactions as well as Deliverable Capacity Resources) is 32,012 MW. The projected Existing and Deliverable 2010/2011 winter extreme case reserve margin is 9,247 MW, which equates to a 40.6 percent winter extreme case reserve margin. The Prospective Capacity Resources totals 34,939 MW. The projected Prospective 2010/2011 winter extreme case reserve margin is 12,174 MW, which equates to a 53.5 percent winter extreme case reserve margin. Both 2010/2011 winter margins, reference and extreme case, are sufficient to cover the New England operating reserve requirement, which is approximately 1,800 MW; however, higher than expected unit outages and/or higher than anticipated demand could affect the forecast of reserve margins. The projected 2009/2010 and 2010/2011 winter reserve margins are summarized in Table NPCC‐10. For the previous year, the 2009/2010 winter peak demand period, the projected reserve margin under the reference case peak demand forecast was approximately 14,219 MW (64.3 percent), and the reserve margin under the extreme case peak demand forecast was approximately 13,469 MW (58.9 percent). The reference and extreme margins forecast for this winter are about 4,292 MW and 4,222 MW lower, respectively, than the reference and extreme reserve margins forecast for the prior winter.
Table NPCC‐10: New England 2009/2010 and 2010/2011 Winter Reserve Margins (MW)
Weather Forecast 2009/2010 Winter (MW & Percent)
2010/2011 Winter (MW & Percent)
Reference Case (50/50) 14,219 (64.3) 9,927 (44.9) Extreme Case (90/10) 13,469 (58.9) 9,247 (40.6)
In addition to discussing the winter outlook with Regional stakeholders, ISO‐NE has also attended several Regional fuel supply conferences and seminars, and no fuel supply or deliverability concerns for the 2010/2011 winter period have been identified.76 Historically, concerns over access to, and delivery of, natural gas to the Regional power generation sector has been an ongoing issue within New England during the winter months. ISO‐NE routinely gauges the impacts that fuel supply disruptions could have upon system or subregional reliability. Because natural gas is the predominant fuel used to produce electricity in New England, ISO‐NE continuously monitors the Regional natural gas pipeline systems, via their Electronic Bulletin Board (EBB) postings, to ensure that emerging gas supply or delivery issues can be incorporated into and mitigated within the daily or next‐day operating plans. Should natural gas issues arise, which may impact fuel deliveries to Regional power generators, ISO‐NE has predefined communication protocols in place with the Gas Control Centers of both Regional pipelines and local gas distribution companies (LDCs), in order to quickly understand the emerging situation and subsequently implement mitigation measures.
76 The Northeast Energy and Commerce Associations’ (NECA) 16th Annual Conference on Natural Gas and Fuel Issues held on September 28, 2010 as well as through the routine interaction with stakeholders on the Electric/Gas Operations Committee (EGOC).

Regional Reliability Self‐Assessm
ents
Regional Reliability Self-Assessments
62 NERC 2010/2011 Winter Reliability Assessment
ISO‐NE has two procedures that can be invoked to mitigate Regional fuel supply emergencies affecting the power generation sector:
1) ISO‐NE’s Operating Procedure No. 21 ‐ Action During an Energy Emergency (OP21) is designed to help mitigate the impacts on bulk power system reliability resulting from the loss of operable capacity due to Regional fuel supply deficiencies that can occur anytime during the year.77 Fuel supply deficiencies are the temporary or prolonged disruption to regional fuel supply chains for coal, natural gas, LNG, and heavy and light fuel oil.
2) ISO‐NE’s Market Rule No. 1 – Appendix H – Operations During Cold Weather Conditions is a procedure that is designed to help mitigate the impacts on bulk power system reliability resulting from the loss of operable capacity due to the combined effects from extreme cold winter weather and constraints on regional natural gas/LNG supplies or deliveries.78
Since no major transmission or operational constraints are anticipated during the 2010/2011 winter, because New England is a summer‐peaking system, and because transfer capability determinations already factor in dynamic and reactive/voltage performance, ISO‐NE has not performed any new dynamic or static reactive power studies specifically for the 2010/2011 winter period.
Other Region‐Specific Issues There are no other reliability concerns for the upcoming winter season, that the subregion needs to address.
New England Subregion Description ISO New England Inc. is a Regional Transmission Organization (RTO), serving Connecticut, Maine, Massachusetts, New Hampshire, Rhode Island, and Vermont. It is responsible for the reliable operation of New England’s bulk power generation and transmission system, administering the Region’s wholesale electricity markets, and managing the comprehensive planning of the Regional bulk power system. The New England electric power system serves 14 million people living in a 68,000 square‐mile area. New England is a summer‐peaking electrical system, which recorded its all‐time peak demand of 28,130 MW on August 2, 2006.
77 Operating Procedure No. 21 is located on the ISO’s Web site at: http://www.iso‐ne.com/rules_proceds/operating/isone/op21/index.html
78 Appendix H of Market Rule No. 1 is located at: http://www.iso‐ne.com/regulatory/tariff/sect_3/mr1_append‐h.pdf

Regio
nal R
eliability Self‐A
ssessmen
ts Regional Reliability Self-Assessments
NERC 2010/2011 Winter Reliability Assessment 63
NPCC‐New York
Executive Summary The New York Balancing Authority 2010 winter peak load forecast is 24,289 MW, which is 709 MW lower than the forecast of 24,998 MW peak for the 2009 winter and 215 MW higher than the actual winter peak in 2009 of 24,074 MW. This forecast load is 4.90 percent lower than the all‐time winter peak load of 25,541 MW that occurred on December 20, 2004. The 2010 forecast is lower due to the impact of the current economic recession on electric energy consumption. The Existing‐Certain Capacity in the New York Control Area (NYCA) for the upcoming winter operating period is 36,329 MW. 689 MW of Existing Certain Capacity has been added since 2009/2010 winter. There are 22 MW of capacity expected to be added during this period, which largely consists of a new wind farm. With the Existing‐ Certain Capacity of 36,329 MW and the expected peak of 24,289 MW, there is a capacity reserve margin of 49.6 percent for 2010/2011 winter. This exceeds the 18.0 percent annual reserve margin set by the New York State Reliability Council. A new station, Clarks Corners, has been added since the previous year, splitting the Oakdale–Lafayette 345kV circuit. The NYISO expects no outstanding challenge aside from the typical challenges in operating the bulk power system.
Introduction NYISO is the only Balancing Authority in the New York Control Area. The NYCA is over 48,000 square miles serving a total population of about 19.2 million people and peaks annually in the summer. This report addresses the reliability assessment for the NYCA for December 2010 through February 2011.
Demand The 2010 winter forecast assumes normal weather conditions for both energy usage and peak demand. The economic outlook is derived from the New York forecast provided to the NYISO by Moody's Economy.com. Econometric models are used to obtain energy forecasts for each of the eleven zones in New York. A winter load factor is used to derive the winter peak from the annual energy forecast. The New York Balancing Authority 2010 winter peak load forecast is 24,289 MW, which is 709 MW lower than the forecast of 24,998 MW for the 2009 winter and 215 MW higher than the actual winter peak in 2009 of 24,074 MW. This forecast load is 4.90 percent lower than the all‐time winter peak load of 25,541 MW that occurred on December 20, 2004. The 2010 forecast is lower due to the impact of the economic recession on electric energy consumption. The NYISO conducts a load forecast uncertainty analysis based on the combined effects of the weather and the economy. This analysis is conducted for annual energy, summer peak demand and winter peak demand. The results of this analysis are used to make projections of upper and lower bounds of each of these forecasts. The upper bounds are at the 90th percentile and the lower bounds at the tenth percentile. The forecast method incorporates the impact of the economy on load via the inclusion of macroeconomic variables in the econometric model. The forecast does not explicitly address extreme winter conditions. Peak load forecasts are provided by Consolidated Edison (Con Ed) for its service territory, and by the Long Island Power Authority for Long Island (LIPA). Con‐Ed's service territory includes New York City and

Regional Reliability Self‐Assessm
ents
Regional Reliability Self-Assessments
64 NERC 2010/2011 Winter Reliability Assessment
nearby Westchester, and is contained within the NYISO Zones H, I, and J. The LIPA service territory is contained within the NYISO Zone K. Con Ed and LIPA provide the NYISO with both coincident and non‐coincident peak demands. The NYISO aggregates the utility forecasts with the remaining Zones A through G that comprise the New York Control Area. The daily peak demand observed by New York during the winter operating period occurs in the late afternoon to early evening. For daily forecasting purposes, the NYISO uses a weather index that relates dry bulb air temperature and wind speed to the load response in the determination of the forecast. At the peak load conditions, a one‐degree decrease in this index will result in approximately 100 MW of additional load. The expected temperature at which the New York load could reach the forecast peak is 12.9 degrees F (‐11 degrees C). The NYISO has two Demand Response programs: the Emergency Demand Response Program (EDRP) and ICAP Special Case Resources (SCR) program. Both programs can be deployed in energy shortage situations to maintain the reliability of the bulk power grid. The EDRP and SCR programs are designed to reduce power usage through the voluntary shutting down of businesses and large power users. Companies, mostly industrial and commercial, sign up to take part in the EDRP or become SCRs. EDRP participants are paid by the NYISO for reducing energy consumption when called upon by the NYISO. SCRs must agree to curtail power use on demand and are paid in advance for their commitment. The NYISO's Day‐Ahead Demand Response Program (DADRP) allows energy users to bid their load reductions, into the day‐ahead energy market as generators do. Offers determined to be economic are paid at the market‐clearing price. DADRP allows flexible loads to effectively increase the amount of supply in the market and moderate prices. Estimated enrollment of SCR resources for the winter capability period is 2,112 MW and EDRP enrollment is estimated at 213 MW. Full deployment of the estimated resources may reduce the peak demand of 24,289 MW by up to 9.5 percent. All SCR and EDRP program participants submit hourly interval data to the NYISO so that actual performance indexes may be calculated. The NYISO files bi‐annual reports to FERC regarding the performance of these programs. The New York State Public Service Commission (NYSPSC) issued an order in June 2008 directing state organizations to implement its Energy Efficiency Portfolio Standard (EEPS). The goal of EEPS is to reduce the projected energy consumption in the year 2015 by 15 percent of forecasted demand levels (approximately 27,500 GWh). The estimated reduction in peak demand, if the full impact of these programs is achieved, would reduce summer peak demand by about 5,600 MW. For the total winter peak demand reduction is estimated to be about 2,800 MW. The NYSPSC made provisions for the funding of measurement and verification of the EEPS. The NYISO is a member of the Evaluation Advisory Group, which provides input to the Public Service Commission on methods and standards used to verify the level of savings the EEPS achieves in practice.

Regio
nal R
eliability Self‐A
ssessmen
ts Regional Reliability Self-Assessments
NERC 2010/2011 Winter Reliability Assessment 65
The New York State Energy Research and Development Agency (“NYSERDA”) also implements state‐funded energy efficiency programs as authorized by the Public Service Commission. NYSERDA publishes periodic reports on the measurement and verification of the programs it implements.
Generation For 2010, the New York Balancing Area expects 40,687 MW of existing capacity, with 36,329 MW of that classified as “Existing‐Certain”. Of the Existing‐Certain capacity, 393 MW is from wind generation and 355 MW is biomass generation. The derated wind capacity is 918MW and the future wind capacity is 22 MW. Based on historical performance, a 7.6 percent derate factor is applied for the majority of generators, including biomass. Wind generation is derated to 30 percent of rated capacity, a 70 percent derate factor, in the winter operating period. Hydroelectric conditions are anticipated to be sufficient to meet the expected demand this winter. The New York Control Area is not experiencing continued effects of a drought or any conditions that would create capacity reductions. Reservoir levels are expected to be normal for the upcoming winter. NYISO is not experiencing or expecting conditions that would reduce capacity. No significant generating units will be out‐of‐service or retired between December 2010 and February 2011.
Capacity Transactions on Peak The NYISO projects net imports into the New York Balancing Authority area of 825 MW during winter 2010/2011 peak conditions. Due to NYISO market rules the specific projected sales and purchases are considered confidential non‐public information and cannot be explicitly indicated in this report. Capacity purchases in New York are not required to have accompanying firm transmission reservations, but adequate transmission rights must be available to assure delivery to New York when scheduled. External capacity is also subject to external availability rights. Availability on the import interface is offered on a first‐come first‐served basis. The total capacity purchased for this winter operating period may increase since there remains both time and external rights availability. Due to NYISO market rules, information on specific import and export transactions is considered confidential. Capacity is traded in the NYISO market as a monthly product, and total imports and exports are not finalized until shortly before the month begins. NYISO does not rely on external resources for emergency assistance.
Transmission Assessment The new Clarks Corners 345 kV substation is positioned near the existing NYSEG‐owned Lapeer Substation with the high side connecting to the NYSEG/ National Grid Oakdale to Lafayette 345 kV #4‐36 line. The new substation consists of two 345/115 kV LTC transformers, a 345 kV ring bus and a 115 kV ring bus. The Lapeer Substation is now retired. The NYISO expects no delays in new transmission facilities coming on‐line that would affect reliability for the winter capability period. The Beck‐Packard BP76, South Mahwah‐Waldwick J3410 lines and the Watercure 345/230 kV transformer are expected to be out‐of‐service through the winter operating period. The NYISO does not have any transmission constraints that could significantly affect reliability. New York Balancing Authority

Regional Reliability Self‐Assessm
ents
Regional Reliability Self-Assessments
66 NERC 2010/2011 Winter Reliability Assessment
area import capability is summarized in the table below. These values are derived by joint studies with adjoining Regions, recognizing transmission and generation constraints.
Table NPCC‐11: New York Transfer Capability
Import Area Transfer Capability PJM 2,500 MW Linden VFT 300 MW Neptune Cable 660 MW Québec 1,500 MW Cedars‐Dennison 200 MW New England 2,100 MW Cross Sound Cable 340 MW 1385 Cable 100 MW Ontario 1,900 MW
Operational Issues The NYISO routinely conducts a winter operating study for the November 1 through April 30 winter capability period. There have been no significant special operating studies performed for the winter 2010/2011 period. NYISO does not have any reliability concerns resulting from minimum demand and over‐generation due to variable resources. Wind is integrated into the security‐constrained dispatch (SCD). As a result, wind can be curtailed to address transmission constraints based on their shift factors and economic offers. Wind resources receive base‐points from the NYISO and financial penalties will be assessed for non‐response. Because wind is managed through SCD, the need for special operating procedures is limited. The NYISO does not expect any reliability concerns resulting from its Demand Response Programs. The 2010 Reliability Need Assessment (RNA)79 is a ten‐year planning study conducted by the NYISO as part of its Comprehensive System Planning Process. The 2010 RNA identified no Reliability Needs, assuming that all modeled transmission and generation facilities, including Indian Point, remain in service during the next ten years from 2011 through 2020. The study of the Base Case indicated that the baseline system meets all applicable Reliability Criteria. However, pending regulatory initiatives, including proposed more restrictive environmental emission programs, may affect Base Case facilities and could result in unanticipated retirement of capacity in New York. The NYISO will continue to monitor these developments and will conduct appropriate reliability studies as necessary. There are no anticipated unusual operating conditions that could significantly affect reliability for the upcoming winter.
Reliability Assessment Analysis With the Existing‐Certain capacity of 36,329MW and the expected peak of 24,289 MW, there is a 2010/2011 winter reserve margin of 49.6percent. The reserve margin, based on the Existing‐Certain and net firm transactions, is 63.8 percent, while the prospective reserve margin is 67.5 percent. This exceeds the 18 percent annual reserve margin set by the New York State Reliability Council (“NYSRC”).
79 NYISO Report, “2010 Reliability Needs Assessment”, September 2010, available at
http://www.nyiso.com/public/webdocs/services/planning/reliability_assessments/2010_Reliability_Needs_Assessment_Final_09212010.pdf

Regio
nal R
eliability Self‐A
ssessmen
ts Regional Reliability Self-Assessments
NERC 2010/2011 Winter Reliability Assessment 67
NYISO complies with NPCC and NYSRC resource adequacy criteria of no more than one occurrence of loss of load per ten years due to a resource deficiency, as measured by 0.10 days/year LOLE. The assumptions take into account demand uncertainty, scheduled outages and deratings, forced outages and deratings, assistance over interconnections with neighboring control areas, NYS Transmission System emergency transfer capability, and capacity and/or load relief from available operating procedures. The NYSRC establishes the Installed Reserve Margin (IRM)80 based on a technical study conducted by the NYISO and the Installed Capacity Subcommittee (of the NYSRC). As indicated above the annual reserve margin is 18 percent. The 2010/2011 IRM Study found that the New York Control Area has the required amount of installed capacity needed to meet the 0.1 days/year LOLE criterion. Following this study, the NYISO conducts the Locational Installed Capacity Requirements (LCR) study.81 This study determines the amount of Unforced Capacity (UCAP) that load‐serving entities must procure to reliably meet demand in New York’s high load Areas. NYISO meets the UCAP requirements for 2010/2011 winter. NYISO has adopted the New York State Gas‐Electric Coordination Protocol as Appendix BB82 to its Open Access Transmission Tariff (OATT). This coordination protocol applies to circumstances in which the NYISO has determined (for the bulk power system) or a Transmission Owner has determined (for the local power system) that the loss of a Generator due to a Gas System Event would likely lead to the loss of firm electric load. This coordination protocol also applies to communications following the declaration of an Operational Flow Order or an Emergency Energy Alert. There are no anticipated fuel delivery problems for this winter operating period. The NYISO performs dynamic and static reactive power studies based on anticipation of issues. No reactive power issues are anticipated for this winter and no special studies were needed to address
reactive power issues.
Other Issues There are no anticipated reliability concerns.
New York Subregion Description NYISO is the only Balancing Authority in the New York Control Area (NYCA). The NYCA is covers over 48,000 square miles serving a total population of about 19.2 million people and peaks annually in the summer.
80 NYISO Report titled “LOCATIONAL MINIMUM INSTALLED CAPACITY REQUIREMENTS STUDY COVERING THE NEW YORK
CONTROL AREA,” For the 2010 – 2011 Capability, January 7, 2010. 81 New York State Gas‐Electric Coordination Protocol, Attachment BB to the NYISO Open Access Tariff (OATT), June 30, 2010.

Regional Reliability Self‐Assessm
ents
Regional Reliability Self-Assessments
68 NERC 2010/2011 Winter Reliability Assessment
NPCC‐Ontario
Introduction Independent Electric System Operator (IESO) is the Reliability Coordinator and Balancing Authority for the province of Ontario. The IESO manages the wholesale electricity market and oversees the reliable operation of the provincial electricity grid. The IESO publishes the 18‐Month Outlook on a quarterly basis. The purpose of the 18‐Month Outlook is to:
Advise market participants of the resource and transmission reliability of the Ontario electricity system;
Assess potentially adverse conditions that might be avoided through adjustment or coordination of maintenance plans for generation and transmission equipment; and
Report on initiatives being put in place to improve reliability within the 18‐month timeframe of the Outlook.
The input data for the 18‐Month Outlook is provided by market participants. This self‐assessment narrative is based on the results from the 18‐Month Outlook published on the IESO Web site.83
Demand The IESO is forecasting a winter peak demand of 22,474 MW for Ontario. This forecast is based on normal monthly normal weather and incorporates the impacts of: planned conservation, growth in embedded generation, time of use rates and slow economic recovery. The forecast peak for winter 2010/2011 is 1.9 percent higher than last winter’s actual peak of 22,045 MW, which occurred on January 4, 2010. The 2010/2011 winter peak forecast is 0.4 percent higher than last winter’s weather‐corrected peak demand of 22,378 MW. The current forecast’s slight increase is the result of competing factors – growth from economic and demographic drivers being partially mitigated by conservation initiatives, time of use rates and the growth in embedded generation. Since the forecast is at the system level, it represents the coincident peak of the zones that make up the IESO controlled grid. The peak conditions are generated using monthly normal weather. This provides a typical monthly peak for each of the winter months based on 31 years of weather data history. A number of loads within the province participate in demand response programs with a total capacity of 1,200 MW or five percent of forecasted peak demand. Of this total capacity 763 MW is included for seasonal capacity planning purposes and 420 MW is deemed to be interruptible. The IESO dispatches and settles the majority of the demand response capacity and the measurement and verification is done within the settlement process. The remaining capacity is verified and measured by the Ontario Power Authority (OPA) which has responsibility for those remaining programs.
83 www.ieso.ca/18‐month.outlook
Regio
nal R
eliability Self‐A
ssessmen
ts Regional Reliability Self-Assessments
NERC 2010/2011 Winter Reliability Assessment 69
The OPA, Ontario Energy Board (OEB) and distributors are responsible for promoting, developing and delivering conservation programs within Ontario. These programs encapsulate a number of different types of conservation measures with the distributors having a great deal of latitude in how they meet their conservation targets. In the past some of the programs included; collection and disposal of inefficient appliances, promoting efficient lighting, energy retrofits and higher efficiency standards. Validation and verification of these savings are the purview of the OPA and distributors. The IESO quantifies the uncertainty in peak demand due to weather variation with Load Forecast Uncertainty (LFU), which represents the impact on demand of one standard deviation in the underlying weather parameters. For the upcoming winter peak of 22,474 MW, the LFU is 1,033 MW. Economic factors do not have a significant impact on near‐term seasonal assessments. Because of the recent recession, the demand forecasting models have been modified to capture the lower demand coming from the manufacturing sector. This was achieved by splitting employment — a key economic driver in the IESO models — into two separate series, total employment and manufacturing employment. This modification has helped capture the demand impacts of the recession. As part of IESO’s analysis, IESO uses an Extreme weather scenario to analyze the system under duress. The Extreme weather scenario is generated by taking the most severe weather since 1970 on a week‐by‐week basis. This gives an “outer envelope” of the conditions that the system may face through the upcoming season.
Generation The total capacity of existing installed generation resources (34,463 MW) and loads as a capacity resource (763 MW) connected to the IESO controlled grid is 35,226 MW, of which the amount of Certain capacity is 30,292 MW for December 2010. The Other capacity is 4,906 MW for December 2010, which includes the on‐peak resource deratings, planned outages, and transmission‐limited resources. Inoperable capacity of 28 MW is identified for the study period. The ‘Certain’ capacities for January and February are 31,221 MW and 31,168 MW respectively. The Future Planned resources for December, January and February are 27 MW, 113 MW and 129 MW respectively and Future Other resources for the same months are seven MW, 174 MW, and 208 MW, respectively. New wind projects of 292 MW and the Upper Mattagami hydroelectric generators (44 MW) after being converted from 25 Hz to 60 Hz are expected to come into service during the winter months. To model wind resources in the seasonal assessments, the IESO uses an estimated wind capacity contribution during peak demand hours. This model captures wind output during the top 5‐contiguous daily peak demand hours for the winter and summer seasons, as well as monthly shoulder periods. Two sets of wind data are considered: simulated wind data over a fixed ten‐year history, and actual wind farm output data collected since March 2006. A conservative approach is employed, which selects the lesser value of the two data sets (simulated vs. actual) for each winter/summer season and shoulder period month. For the seasonal assessments, wind capacity contribution is represented deterministically, by selecting median values observed during the winter and summer seasons and shoulder period months.

Regional Reliability Self‐Assessm
ents
Regional Reliability Self-Assessments
70 NERC 2010/2011 Winter Reliability Assessment
Wind capacity contribution the for winter season, December to February, is estimated at 32 percent of the installed capacity. The ‘Certain’ capacity for wind is 347 MW and ‘Other’ capacity is 737 MW. No other variable resources (such as solar) are connected to the IESO controlled grid or are expected to be connected in the study period. For biomass, the Existing‐Certain capacity is 36 MW and Existing‐Other capacity is 86 MW. IESO resource adequacy assessments include hydroelectric generation capacity contributions based on median historical values of hydroelectric production plus operating reserve provided during weekday peak demand hours. The capacity assumptions are updated annually, in the second quarter of each year. Energy capability is provided by market participants’ forecasts. The amount of available hydroelectric generation is greatly influenced both by water‐flow conditions on the respective river systems and by the way in which water is used by the generation owner. Lower than normal precipitation in the spring/summer season resulted in lower hydroelectric output. The output from hydroelectric generators is monitored to see whether a short‐term (two to three months) adjustment is necessary. However, material deviations from median conditions are not anticipated at this time for the upcoming winter. In the operating timeframe, water resources are managed by market participants through market offers to meet the hourly demands of the day. Since most hydro storages are energy limited, hydroelectric operators identify weekly and daily limitations for near‐term planning in advance of real‐time operations. The IESO does not anticipate any weather or fuel related constraints for the province that would reduce generating capacity. No generators are expected to be retired during the upcoming winter season.
Capacity Transactions on Peak In its determination of resource adequacy, the IESO plans for Ontario to meet NPCC criteria without reliance on external resources to satisfy normal weather peak demands under planned supply conditions. No long‐term firm transactions are in place. For use during daily operation, the IESO has agreements in place with neighbouring jurisdictions in NPCC, RFC and MRO for emergency imports and reserve sharing. Day to day, external resources are normally procured on an economic basis through the IESO‐administered markets.
Transmission Since last winter, a new HVdc interconnection between Hawthorne transformer station (TS) in Ontario and Outaouais station in Québec entered commercial operation. Goreway, Churchill Meadows and Markham #4 transformer stations have also been added since last winter. There are no significant new transmission additions scheduled to come into service before the winter period. The New York‐based outages requiring the removal of two of the Niagara interties (PA301 and PA302) are currently being planned for November and December 2010. These outages involve maintenance work at the Niagara Generating Plant. The outages will reduce the transfer capability of the Niagara interconnection and affect the Ontario to Michigan transfers. In order to help facilitate these outages, Hydro One is constructing a bypass facility around the failed R76 voltage regulator. This bypass facility will allow BP76 circuit to be returned to service during the Niagara interties outage.

Regio
nal R
eliability Self‐A
ssessmen
ts Regional Reliability Self-Assessments
NERC 2010/2011 Winter Reliability Assessment 71
Phase angle regulators (PARs) are installed on the Ontario‐Michigan interconnection at Lambton TS, representing two of the four interconnections with Michigan, but will not be operational until completion of agreements between the IESO, Midwest ISO, Hydro One and International Transmission Company (ITC). The agreement is expected to be executed by the end of 2010. The operation of these PARs along with the PAR on the Ontario‐Michigan interconnection near Windsor will control flows to a limited extent, and assist in the management of system congestion. Regardless of these outages, Ontario meets all reliability criteria without dependence on any external resources. Ontario has operating limits and instructions that could limit transfers under specific conditions, but for the forecast conditions including design‐criteria contingencies, sufficient resources and bulk system transfer capability is expected to be available to manage potential congestion and supply forecast demand. The Area has no transmission constraint that would significantly affect reliability. In the winter, Ontario’s theoretical maximum capability for coincident exports could be up to 6,400 MW and coincident imports up to 6,800 MW. These values represent theoretical levels that could be achieved only with a substantial reduction in generation dispatch in the West and Niagara transmission zones. In practice, the generation dispatch required for transfer levels this high would rarely, if ever, materialize. Therefore, at best, due to internal constraints in the Ontario transmission network in conjunction with external scheduling limitations, Ontario has an expected coincident import capability of approximately 4,800 MW. The import capability does recognize the transmission constraints external to the Area.
Operational Issues IESO addresses winter extreme weather conditions by doing planning studies using the most severe weather experienced since 1970. Studies show that Ontario will have sufficient reserves over the entire winter period. Available operational and market measures and interconnection capability are evaluated to be sufficient to meet winter energy demands. IESO is planning a centralized wind forecasting service to improve the accuracy of wind generation forecasts. The service will assist with the management of wind variability and its influence on load‐generation balance. Until a centralized wind forecasting service is in place, the IESO uses a procedure to calculate the seasonal wind contribution factors from historical data. The seasonal values are updated twice a year upon completion of either of the shoulder seasons. Ontario is expecting to experience surplus base‐load generation (SBG) under minimum demand conditions. Such SBG conditions are prevalent over the spring, fall and winter months. Current operating procedures viz. curtailment of intermittent variable generators and imports, spilling of water from must‐run hydroelectric generating stations and dispatching down nuclear generators are adequate to deal with the SBG conditions. Demand measures currently comprise about two percent of total resources. At these levels, any failure to respond does not pose any significant concern to reliability. Demand measures are grouped into two categories, price sensitive and voluntary. IESO considers only price sensitive demand for adequacy assessment purposes and to be dispatched, they have to bid into the market, like other generation resources.

Regional Reliability Self‐Assessm
ents
Regional Reliability Self-Assessments
72 NERC 2010/2011 Winter Reliability Assessment
The move towards the elimination of coal‐fired generation by 2014 will continue as planned with the deregistration of four coal‐fired units on October 1, 2010. This represents the shutdown of approximately 2,000 MW of coal‐fired capacity. There are no unusual operating conditions, environmental, or regulatory restrictions that are expected to impact reliability for this winter.
Reliability Assessment Analysis The IESO uses a multi‐area resource adequacy model, in conjunction with power flow analyses, to determine the deliverability of resources to load. This process is described in the document, Methodology to Perform Long‐Term Assessments, posted on the IESO Web site.84 The projected reserve margins are on average:
from Existing resources = 38.6 percent
from Anticipated resources = 39.4 percent
from Prospective resources = 41.1 percent
The reserve margin target used for Ontario is 18.9 percent based on the NPCC criteria. Planning reserves, determined on the basis of the IESO’s requirements for Ontario self‐sufficiency, are above target levels for all weeks over this period for normal weather conditions. On average, the projected reserve margins for the upcoming winter are nine percent higher than the projected margin for the winter of 2009/2010. These temporary levels are expected as Ontario positions itself for coal shutdowns in later years. The IESO requires demonstrated reliable performance from replacement resources prior to approving the removal of the coal facilities. Reserve requirements are established in conformance with the NPCC Regional criteria. The latest study results are published in the 18‐Month Outlook. The link to the report can be found on the IESO Web site.85 The IESO works with the Ontario gas transportation industry to identify and address fuel supply issues. There are communication protocols in effect between the IESO and the gas pipelines to manage and share information under tight supply conditions in either sector (gas or electricity). The IESO regularly conducts transmission studies that include results of stability, voltage and thermal and short‐circuit analyses in conformance with NPCC criteria. The IESO’s transmission studies are conducted to comply with the NERC TPL standards, in addition to NPCC criteria. The IESO has market rules and connection requirements that establish minimum dynamic reactive requirements, and the requirement to operate in voltage control mode for all resources connected to the IESO‐controlled grid. In addition, the IESO’s transmission assessment criteria includes requirements for absolute voltage ranges, and permissible voltage changes, transient voltage‐dip criteria, steady‐state voltage stability and requirements for adequate margin demonstrated via pre and post‐contingency P‐V
84 http://www.ieso.ca/imoweb/monthsYears/monthsAhead.asp 85 http://www.ieso.ca/imoweb/pubs/marketReports/18MonthOutlook_2010aug.pdf

Regio
nal R
eliability Self‐A
ssessmen
ts Regional Reliability Self-Assessments
NERC 2010/2011 Winter Reliability Assessment 73
curve analysis. These requirements are applied in facility planning studies. Seasonal operating limit studies review and confirm the limiting phenomenon identified in planning studies.
Other Region‐Specific Issues There are no other issues to report.
Ontario Subregion Description The province of Ontario covers an area of 1,000,000 square kilometres (415,000 square miles) with a population of 13 million. The Independent Electricity System Operator (IESO) as the Reliability Coordinator and Balancing Authority for the Province of Ontario, directs the operations of the IESO‐controlled grid (ICG) and administers the electricity market. The ICG experiences its peak demand during the summer, although winter peaks still remain strong.

Regional Reliability Self‐Assessm
ents
Regional Reliability Self-Assessments
74 NERC 2010/2011 Winter Reliability Assessment
NPCC—Québec
Introduction Geographically, the Québec Balancing Authority area is a NERC subregion in the northeastern part of the NPCC Region. The population served is about seven 7 million. The Québec Area covers about 1,668,000 square kilometres (644,300 square miles) but most of the population is grouped along the St. Lawrence River basin and the largest load area is in the Southwest part of the province, mainly around the greater Montréal area, extending down to the Québec City area.
Moreover, the Québec Balancing Authority area is winter peaking. The all‐time internal peak demand was 37,230 MW set on January 16, 2009. The summer peak demands are in the order of 21,000 MW. The installed capacity for the 2010/2011 Winter Operating Period is 42,327 MW of which approximately 39,400 MW (93 percent) is hydroelectric capacity. From now to 2015, it is expected that a total of 3,500 MW of wind capacity will become available on the system.
Transmission voltages on the system are 735, 315, 230, 161 and 120 kV. Transmission line length totals 33,434 km (20,779 miles).
The Area is one of the four NERC Interconnections in North America. TransÉnergie, the Transmission Owner and Operator in Québec, has interconnections with Ontario, New York, New England and the Maritimes. They are its immediate neighbors and fellow NPCC members. Interconnections consist of either HVdc ties or radial generation or load to and from the neighboring systems.
This report will discuss, among other things:
Demand forecasting, including forecasting methods, demand response programs, energy efficiency programs, etc.;
Generation availability for the next winter season;
Capacity transactions (exports and imports at peak);
Transmission assessment;
Operational issues; and
Reliability assessment.
Demand Weather assumptions for demand forecasts are based on the average climatic conditions observed from 1971 to 2006 (36 years) adjusted for a global warming effect of 0.30 degrees C per decade starting in 1971. Climatic uncertainty is modeled by recreating each hour of this 36‐year period under current load forecast conditions. Moreover, each year of historical data is shifted up to ± 3 days to gain information on conditions that occurred during either a weekend or a week day. Such an exercise generates a set of 252 different demand scenarios. The base case scenario is the arithmetical average of those 252 scenarios. Given global uncertainty parameters and assuming a normal distribution for load uncertainty, the peak demand standard deviation is 1,560 MW for the 2010/2011 winter operating period. Economic, demographic and energy‐use assumptions used in this load forecast will be made public in the next Hydro‐Québec Distribution (HQD) 2011‐2020 Procurement Plan to be filed with the Régie de l’énergie du Québec (Québec Energy Board) in November 2010. The 2011‐2020 Procurement Plan will be available on the Québec Energy Board website in early November.
Regio
nal R
eliability Self‐A
ssessmen
ts Regional Reliability Self-Assessments
NERC 2010/2011 Winter Reliability Assessment 75
Last winter’s actual peak was 34,659 MW occurring on January 29, 2010 at 18h00 EST. Total system demand, including exports, was 38,068 MW at that time. The internal demand forecast for 2010/2011 winter is 36,945 MW. This forecast is 829 MW more than the last year’s winter forecast of 36,116 MW. (+2.3 percent). This is mainly due to the fact that the last load forecast was made in a context of economic recession while this load forecast is based on an economic recovery scenario. The most important growth comes from the residential sector. In fact, for the residential sector, most of new constructions have an electrical heating system and conversion to electricity from other energy sources is always important. Concerning internal peak demand aggregating, HQD is the only Load Serving Entity in the Québec Balancing Authority Area. Thus, there is no demand aggregating in the forecasts. The Québec Balancing Authority area is a winter peaking system and resource adequacy is evaluated based on winter peak conditions. There are two interruptible load programs in Québec, which total 1,350 MW. Each program addresses different industrial customers. Moreover, the Area can rely on 250 MW of direct control load management in the form of voltage reduction. Thus, for this winter operating period Québec relies on a total of 1,600 MW of Demand Response Programs. These programs represent 4.3 percent of the internal demand forecast. Interruptible load programs are planned and contracted with participating industrial customers including the amount of load to be interrupted, the number of times that load may be interrupted on a daily or seasonal basis, and any other relevant detail. All customers are regularly contacted before the peak period (generally during autumn) so that their commitment to provide their capacity when called during peak periods is ascertained. On an operations time‐base a number of operating instructions and procedures manage the various Demand Response Programs. Individual contact names are actually filed into the procedures along with a contact process. Response to calls for interrupting load is historically excellent. A follow‐up file of response to interrupting load calls is continually updated by the system controller for post‐mortem analysis. Another 250 MW available at peak through a voltage reduction scheme is also considered as Demand Response by HQD and is not expected to vary considerably in the near future. TransÉnergie regularly tests its voltage reduction scheme to ascertain its availability and the actual demand response characteristics. Hydro‐Québec Distribution presents – on a yearly basis – its Energy Efficiency Plan Update (Plan global en efficacité énergétique – PGEÉ) to the Québec Energy Board for the next and upcoming years. Capacity contributions of different programs implemented by Hydro‐Québec in the last few years are estimated to be about 1,270 MW at peak. Of this amount, the PGEÉ program contributes about 790 MW. PGEÉ focuses on energy conservation measures and includes programs tailored to residential customers, commercial and institutional markets, small and medium industrial customers, and large‐power customers. Programs and tools for promoting energy savings are the following:

Regional Reliability Self‐Assessm
ents
Regional Reliability Self-Assessments
76 NERC 2010/2011 Winter Reliability Assessment
For residential customers:
Energy Wise home diagnostic;
Recyc‐Frigo (old refrigerator recycling);
Electronic thermostats;
Energy Star qualified appliances;
Lighting;
Pool‐filter timers;
Energy Star windows and patio doors;
Rénoclimat renovating grant;
Geothermal energy; and
New home Novoclimat grant.
For business customers – small and medium power users:
Empower program for buildings optimization;
Empower program for industrial systems;
Efficient products program;
Traffic light optimization program;
Energy Wise diagnostic; and
Visilec.
For business customers – large power users:
Building initiatives program;
Industrial analysis and demonstration program;
Plant retrofit program; and
Industrial initiatives program.
The Energy Efficiency Program features can be found on Hydro‐Québec’s Web site:86 In addition to these energy saving programs, a “dual energy” program has been ongoing for some years in Québec. Recently, the number of participating customers has increased. Program subscribers are fitted with automatic devices that switch from electrical energy to fuel as a heating source when outdoor temperature is ‐12 degrees C or lower. According to the most recent program evaluations the peak load for next winter would be 870 MW higher without this program.
86 http://www.hydroquebec.com/energywise/index.html

Regio
nal R
eliability Self‐A
ssessmen
ts Regional Reliability Self-Assessments
NERC 2010/2011 Winter Reliability Assessment 77
For the coming winter, overall uncertainty (one standard deviation) represents ± 1,560 MW around the peak forecast. Climatic uncertainty accounts for 1,390 MW (one standard deviation) of this overall uncertainty. No changes have been made to the load forecast method due to the economic recession. In this assessment, the load forecast is based on an economic recovery scenario. This means that the load forecast has increased slightly to reflect positive signs of recovery in the economy. Due to its winter peaking characteristic the Québec Balancing Authority area obviously explicitly addresses winter conditions in assessing variability in projected demand. Extreme cold weather results in a large load pickup over the normal demand forecast. This situation is addressed at the planning stage through TransÉnergie’s Transmission Design Criteria. When designing the system, one particular criterion requires that both steady state and stability assessments be made with winter scenarios involving demands 4,000 MW higher than the normal weather peak demand forecast. This is equivalent to 110 percent of peak winter demand. This ensures that the system is designed to carry the resulting transfers while conforming to all design criteria. Resources needed to feed the load during such conditions must be planned and provided by HQD, the Load Serving Entity.
Generation To increase the visibility and transparency of supply‐side resource options being considered by Regions/subregions for this seasonal assessment, NERC requires additional information regarding projected resources. To increase the visibility and transparency of supply‐side resource options being considered in the Québec Balancing Authority area the following information concerning capacity resources is supplied in this assessment:
Existing‐Certain Resources: 39,514 MW
Existing‐Other Resources: 2,266 MW
Existing‐Inoperable Resources: 547 MW
The vast majority of capacity resources in the Québec Area are hydroelectric resources. Variable resources in the subregion are mostly wind generator resources. Wind generation sites are owned and operated by Independent Power Producers (IPPs). Nameplate capacity is presently 659 MW of which 212 MW is under contract with Hydro‐Québec Production (HQP) and is derated by 100 percent for this assessment. The rest (447 MW) is under contract with HQD and is derated by 70 percent for this assessment. Moreover, a small amount of the capacity in the Québec Area is generated by biomass. This is approximately 189 MW. Hydro conditions for this upcoming winter operating period are such that reservoir levels are sufficient to meet both peak demand and daily energy demand throughout winter. To assess its energy reliability

Regional Reliability Self‐Assessm
ents
Regional Reliability Self-Assessments
78 NERC 2010/2011 Winter Reliability Assessment
Hydro‐Québec has developed an energy criterion stating that sufficient resources should be available to go through sequences of two or four consecutive years of low water inflows totalling 64 TWh and 98 TWh respectively and having a two percent probability of occurrence. Reliability assessments based on this criterion are presented three times a year to the Québec Energy Board. The document can be found on the Régie de l’énergie’s (Québec Energy Board) Web site.87 Fuel supply and transportation is not an issue in Québec, as fossil fuel generation is used for peaking purpose only and adequate supplies are stored nearby. No other conditions that would create capacity reductions are expected for the 2010/2011 winter period. A 150 MW fossil fuel generation unit will be out‐of‐service this winter. In Addition, as was mentioned in previous assessments, the 547 MW natural gas unit operated by TransCanada Energy (TCE) at Bécancour has been mothballed for the last three years. On June 15, 2010, HQD and TCE again filed a contract modification with the Québec Energy Board to renew the temporary shutdown for 2011 with possible renewals for future years. Deliveries could resume on January 1, 2012, depending on the results of the 2011 demand forecast. These outages do not affect system reliability in any way, but if other outages were to occur, system reliability would be maintained using interconnections with neighboring NPCC areas, most of which are summer peaking. Interconnection transfer capability is shown in Table NPCC 12 below.
Capacity Transactions on Peak In this assessment, the Québec Balancing Authority area does not require external purchases to ensure resource adequacy for the 2010/2011 winter operating period. However, Hydro‐Québec Production (HQP) has secured a firm purchase of 200 MW from the Maritimes Area during this period. This 200 MW import from the Maritimes Area is backed by a firm contract for generation and by a firm reservation on the New Brunswick – TransÉnergie interconnection. (NB‐HQT path). This transaction adds 200 MW to the Québec reserve margin but does not affect the Regional (NPCC) reserve margin. Each year, the Load Serving Entity in Québec (HQD) proceeds to short‐term capacity purchases (UCAP) in order to meet its capacity requirements. These purchases may be supplied by resources located in Québec or in neighboring markets. All HQD capacity purchases are subject to damage payments in case of energy delivery failures. For January and February 2011 the Québec Area has secured firm contracts for total exports of 705 MW to New England (310 MW), Ontario (145 MW) and New Brunswick (250 MW). In December 2010, the New Brunswick sale is 150 MW for a total of 605 MW. Firm generation and transmission have been secured for all these transactions. The only capacity sale that can be characterized as a “Liquidated Damage Contract” is the capacity sale to New Brunswick. Finally, for the next Winter Operating Period, it is not expected that the Québec Balancing Authority area will have to rely on outside assistance or external resources for emergency imports.
87 http://www.regie‐energie.qc.ca/audiences/Suivis/Suivi_HQD_CriteresFiabilite_D‐2008‐133.html

Regio
nal R
eliability Self‐A
ssessmen
ts Regional Reliability Self-Assessments
NERC 2010/2011 Winter Reliability Assessment 79
Transmission Following are the significant new bulk power transmission facilities anticipated to be in‐service for this winter that were added since last winter. Lines: In June 2010, a new double‐circuit 315 kV transmission line from Chénier to Outaouais has been commissioned which now permits full use of the new 1,250 MW interconnection’s capacity with Ontario’s Independent Electricity System Operator (IESO). Another sizable 315 kV project just recently commissioned is the new Anne‐Hébert 315/25 kV transformer station near Québec City. A new nine‐mile (15 km) 315 kV line to be integrated into an existing circuit is also being built to feed this station. An 8.1‐mile (13 km) double‐circuit 161 kV line has been built to feed the Romaine Complex building site. This is a 1,550 MW four‐generating‐station complex to be commissioned by HQP between 2014 and 2020. It is situated on the lower north shore of the St. Lawrence River. The Romaine River discharges into the St. Lawrence River, near the town of Havre St‐Pierre. Construction began in 2009. Transformers: Following the 315 kV line commissioning previously mentioned, a fourth 1,650 MVA, 735/315 kV transformer at Chénier has been commissioned in July 2010. This, along with the line, as mentioned above, now permits full use of the new 1,250 MW interconnection’s capacity with IESO. A number of transformer stations will see distribution transformer additions during summer and fall in time for the coming winter peak load period. Significant substation equipment (SVC, FACTS controllers, HVdc, etc.): A third 345 MVAr capacitor bank has also been installed at Chénier Transformer Station, north of Montréal. There are no concerns in meeting target in‐service dates for TransÉnergie’s new transmission additions. As seen above, the Chénier – Outaouais project is already in service. All other in‐service dates concern mostly sub‐transmission levels and distribution station transformers. No delays are expected. No significant transmission lines are expected to be out‐of‐service during the upcoming winter season. As mentioned earlier, the Québec Balancing Authority area is winter peaking and as such, line and transformer maintenance is normally scheduled during the summer operating period ending on December 1st . Moreover, no internal transmission constraints that could significantly affect reliability are expected during this winter season. No maintenance is scheduled that will affect interconnection transfer capability to other subregions during peak periods. Synchronous Condenser CS23 at Duvernay substation in the Montréal area, which became unavailable in June 2008 due to a major transformer fault, will be back in service on November 30, in time for the 2010/11 Winter Operating Period. There are two other synchronous condensers at Duvernay.

Regional Reliability Self‐Assessm
ents
Regional Reliability Self-Assessments
80 NERC 2010/2011 Winter Reliability Assessment
No other major transmission equipment is expected to be out of service for this winter period. The following table indicates interregional transfer capabilities out of and into Québec with its neighboring systems for the 2010/2011 winter operating period.88 These limits represent Normal Transfer Capability (NTC) values for the winter operating period. Actual Feasible Transfer Capability (FTC) values during peak periods in Québec may be lower. For example, the limit into Québec from New England (Sandy Pond) at the Québec peak is zero because the interconnection is required for internal Québec transmission needs. Both NTC and FTC values are presented in NPCC Seasonal Reliability Assessments, with accompanying text explaining the rationale for any constraint, if needed.
Table NPCC‐12: Québec 2010/2011 Winter Interconnection Normal Transfer Capability in (MW)
Interconnection Limit out of Québec Limit into Québec
Ontario Ontario North (D4Z, H4Z) 85 85 Ontario Ottawa (X2Y, P33C, Q4C) 410 140 Ontario Brookfield (D5A, H9A) 250 110 Ontario Beauharnois (B5D, B31L) 800 470 Ontario Ottawa (Outaouais Interconnection) 1,250 1,250 New York New York (CD11, CD22) 325 100 New York (7040) 1,500 1,000 New England New England (Highgate) 220 170 New England (Stanstead‐Derby) 50 0 New England (Sandy Pond) 2,000 1,700 New Brunswick New Brunswick (Madawaska + Eel River) 1,080 43589
These limits recognize transmission or generation constraints in both Québec and its neighbors. They are reviewed periodically with neighboring systems and are posted in NPCC Reliability Assessments.
Operational Issues In its review of resource adequacy for the NPCC, HQD includes a high load forecast scenario. Economic, demographic and energy parameters used for the study are set higher relative to the base case scenario. Load uncertainty then becomes dependent on weather conditions only. If the criterion (0.1 day/year of Loss of Load Expectation) is not met, actions to restore reliability are identified and established (new calls for tenders, new interruptible load contracts or an in‐service date for new generation units sooner than expected). Moreover, TransÉnergie continually performs load flow and stability studies to assess system reliability and transfer capabilities on all its internal interfaces. A peak load study is performed annually
88 Limits obtained and updated from the NPCC Reliability Assessment for winter 2010/2011. 89 Eel River T4 Transformer is out of service. Capacity is 770 MW when the transformer is in‐service

Regio
nal R
eliability Self‐A
ssessmen
ts Regional Reliability Self-Assessments
NERC 2010/2011 Winter Reliability Assessment 81
integrating new generation, new transmission and the latest demand forecasts as well as any unusual operating conditions such as generation and transmission outages. Extreme cold weather conditions result in a large load pickup over the normal weather forecast and are included in TransÉnergie’s Transmission Design Criteria. When designing the system, both steady state and stability assessments are made with winter scenarios involving demands 4,000 MW higher than the normal weather peak demand forecast. This is equivalent to 110 percent of peak winter demand. The Québec Balancing Authority area also participates with neighboring Balancing Authority areas in seasonal CO‐12 and CP‐8 NPCC Working Group assessments of system reliability. As mentioned in previous assessments, a number of projects have been or are being implemented to cope with certain issues such as north to south transfer increases, voltage variations on the system and new point‐to‐point firm transmission services. Upgrades to the system for 2012 have also been presented in the last NPCC Comprehensive Review Assessment of the Québec Transmission System for 2012. The Eel River (New Brunswick) T4 transformer is presently out of service. This causes import capability into Québec on the Eel River Interconnection to be reduced to zero from 350 MW. Import capability into Québec from New Brunswick is therefore limited to Madawaska’s capacity (435 MW). Scheduled return into service of T4 Transformer is December 30, 2010. No other particular operational problems have been observed for the oncoming 2010/2011 winter operating period. Integration of wind resources is ongoing in Québec. It is expected that up to 3,700 MW will be integrated into the system through 2015; to date 659 MW of nameplate capacity is actually integrated into the system. This has not yet led to any special system operating procedures resulting from the integration of wind resources in Québec. Moreover, the Area does not anticipate any reliability concerns resulting from minimum demand and over generation resulting from variable resources for the 2010/2011 winter operating period. In Québec, minimum demand periods occur during the summer operating period. A certain amount of hydroelectric generation at run of the river installations must be generated along with wind generation being integrated on the system, which may be contributing if the right conditions occur, so that such conditions may occur with longer duration during the summer period. Most of the generation in the Area is hydroelectric with medium or large reservoirs and can be modulated to follow load variations. Minimum demand in summer also usually coincides with periods of higher transfers from Québec to neighboring Areas (with summer peaking characteristics) which alleviates this potential problem. No reliability concerns resulting from actual levels of Demand Response Resources are anticipated. In the Québec Balancing Authority Area, Demand Response Resources consist only of interruptible load programs totaling approximately 1,350 MW, which are used only during winter operating periods. Contracts with large high voltage industrial customers and smaller industrial loads permit precise use of Demand Response Resources according to system needs at specific times and intervals during the winter operating period. There are no known environmental and/or regulatory restrictions that could affect reliability in Québec for the 2010/2011 winter operating period. A number of peaking thermal units totaling 1,166 MW may

Regional Reliability Self‐Assessm
ents
Regional Reliability Self-Assessments
82 NERC 2010/2011 Winter Reliability Assessment
be used a few times during any winter operating period to provide capacity during peak periods but the energy content associated with this use is quite small. No other unusual operating conditions that could significantly affect reliability for the upcoming winter are anticipated in Québec.
Reliability Assessment Analysis The Québec Area Resource Adequacy criterion is the same as the NPCC Resource Adequacy Criterion. The assessment process is stated in NPCC Directory #1 – Design and Operation of the Bulk Power System. Existing, anticipated, and prospective reserve margins are all equal to 10.4 percent. Generally, the required reserve margin varies between nine and ten percent. The latest resource adequacy review for the upcoming winter was the 2009 Interim Review of resource adequacy. In this study, it was found that the required reserve margin for the 2010/2011 winter peak period is 10.8 percent over a one‐year horizon while the planned reserve margin is 14.9 percent. Total planned capacity was around 42,500 MW. On a less than one year horizon the required reserve is less than 10 percent. In this assessment, the 10.4 percent projected reserve is sufficient to cover the 10 percent target required reserve. The 2010 interim review of resource adequacy for 2011 to 2013 winter peak periods is now in progress. Preliminary results for 2010/2011 winter peak period indicate that the required reserve should be smaller than 10 percent (9.7 percent). Final results of the study will be filed with NPCC in late October within the framework of the 2010 Québec Interim Report on Resource Adequacy. The 2009 Québec Interim Review of Resource Adequacy can be found at the following Web site: http://www.npcc.org/documents/reviews/Resource.aspx. The 2010/2011 winter’s projected reserve margin of 10.4 percent is less than last winter’s projected reserve margin of 11.4 percent. This can be explained by a higher load forecast. The Québec Area fossil fuel generation stations are used for peaking purposes only. The energy contribution of these generating stations is minimal. All have adequate fuel reserves as part of their installations and all have their fuel storages filled for the beginning of the winter operating period. Fuel supply and transportation is not an issue in Québec, as fossil fuel generation is used for peaking purpose only and adequate supplies are stored nearby. No other conditions that would create capacity reductions are expected for the 2010/2011 winter period. Transient and voltage stability studies are performed continuously by TransÉnergie (Transmission Planner) to establish transfer limits on all interfaces. No particular problems are anticipated for this winter operating period. It has already been mentioned in previous NERC seasonal assessments that voltage support in the southern part of the system (load area) is a concern during winter operating periods especially during episodes of heavy load. Hydro‐Québec Production (the largest producer on the system) ensures that maintenance on generating units is finished by December 1, and that all possible generation is available. This, along with yearly testing of reactive capability of the generators, ensures maximum availability of both active and reactive power. The end of TransÉnergie maintenance on the high voltage transmission system is also targeted for December 1. In addition, TransÉnergie has a target for the availability of both high voltage and low voltage capacitor banks. No more than 200 MVAr

Regio
nal R
eliability Self‐A
ssessmen
ts Regional Reliability Self-Assessments
NERC 2010/2011 Winter Reliability Assessment 83
of high voltage banks on a total capacity of approximately 9,000 MVAr should be unavailable during winter operating periods. The target for the low voltage banks is 90 percent availability based on installed capacity in the load area of the system (about 5,500 MVAr). Voltage variations on the high voltage transmission system are also of some concern. These are normal variations due to changes in transmitted power from North to South during load pickup and interconnection ramping. Under peak load conditions, these variations may be large enough to trigger the Automatic Shunt Reactor Switching System and must be contained. In 2008, TransÉnergie had recommended and undertaken a number of actions to optimize shunt reactor switching, as mentioned in the previous NERC Winter Assessment. Moreover, TransÉnergie has recently enacted a new Transmission Design Criterion concerning voltage variations on the system. This criterion quantifies acceptable voltage variations due to load pickup and/or interconnection ramping. All planning and operating studies must now conform to this criterion.
Other Subregion‐Specific Issues There are no other subregion‐specific anticipated reliability concerns for the 2010/2011 winter operating period.
Québec Subregion Description Geographically, the Québec Balancing Authority area is a NERC subregion in the northeastern part of the NPCC Region. The population served is around seven million. The Québec Area covers about 1,668,000 square kilometres (644,300 square miles) but most of the population is grouped along the St. Lawrence River basin and the largest load area is in the southwest part of the province, mainly around the Greater Montréal area, extending down to the Québec City area.

Regional Reliability Self‐Assessm
ents
Regional Reliability Self-Assessments
84 NERC 2010/2011 Winter Reliability Assessment
NPCC Region Description The Northeast Power Coordinating Council, Inc. (NPCC Inc.) is the international Regional Reliability Organization (RRO) for Northeastern North America. Its purpose is to promote the reliable and efficient operation of the international, interconnected bulk power systems in northeastern North America through the establishment of regionally‐specific criteria, coordination of system planning, design and operations, assessment of reliability and monitoring and enforcement of compliance with such criteria, and other applicable criteria. In the development of reliability criteria, NPCC Inc., to the extent possible, facilitates attainment of fair, effective and efficient competitive electric markets. NPCC is a not‐for‐profit New York corporation. The geographic area covered includes New York, the six New England states, p;us Ontario, Québec, and Maritime provinces in Canada. The total population served is approximately 56 million over approximately one million square miles. NPCC was originally formed shortly after the 1965 northeast blackout to increase the reliability and efficiency of the interconnected power systems within its geographic area. NPCC restructured in response to U.S. energy legislation signed into law August, 2005, in preparation for the certification of an Electric Reliability Organization (ERO) and subsequent execution of a Regional Delegation Agreement and Memorandums of Understanding with appropriate Canadian provincial regulatory and governmental authorities. Membership interests were transferred to NPCC Inc., and a separate and independent, affiliated, not‐for‐profit corporation, NPCC: Cross‐Border Regional Entity, Inc. (NPCC CBRE). NPCC CBRE will perform functions delegated or contracted to it from the ERO, to be backstopped by the Federal Energy Regulatory Commission (FERC) and Canadian Provincial authorities. Additional information can be found on the NPCC Web site.90
90 http://www.npcc.org/

Regio
nal R
eliability Self‐A
ssessmen
ts Regional Reliability Self-Assessments
NERC 2010/2011 Winter Reliability Assessment 85
RRFFCC
Introduction All ReliabilityFirst Corporation (RFC) members are affiliated with either the Midwest ISO (Midwest ISO) or the PJM Interconnection (PJM) Regional Transmission Organization (RTO) for market operations and reliability coordination. Ohio Valley Electric Corporation (OVEC), a generation and transmission company located in Indiana, Kentucky and Ohio, is not a member of either RTO and is not affiliated with their markets; however, PJM performs OVEC’s Reliability Coordinator services. In addition, RFC does not have officially designated subregions. The Midwest ISO and PJM each operate as a single Balancing Authority Area. From the RTO perspective, approximately 60percent of the Midwest ISO load and 85percent of the PJM load is within RFC. The PJM RTO also expands into the SERC Region, and the Midwest ISO RTO extends into the MRO and SERC Regions. Since all RFC demand is in either Midwest ISO or PJM except for a small load (less than 100 MW) within the OVEC Balancing Authority area, the reliability of the PJM RTO and Midwest ISO are assessed and the results used to indicate the reliability of the RFC Region. This assessment provides information on the projected resource adequacy for the upcoming winter season across the RFC Region and relies on the reserve margin requirements determined for the PJM and Midwest ISO Areas. ReliabilityFirst’s Resource Assessment Subcommittee believes that it is reasonable to assess the overall resource adequacy of the ReliabilityFirst Regional area by assessing the resource adequacy of the RTOs that operate within the Regional area. This is possible since the determination of each of the RTO reserve margin targets has been performed in a manner consistent with the requirements contained in Regional NERC Reliability Standard BAL‐502‐RFC‐002. The Resource Assessment Subcommittee believes that when ReliabilityFirst has determined that each RTO is projected to have sufficient resources to
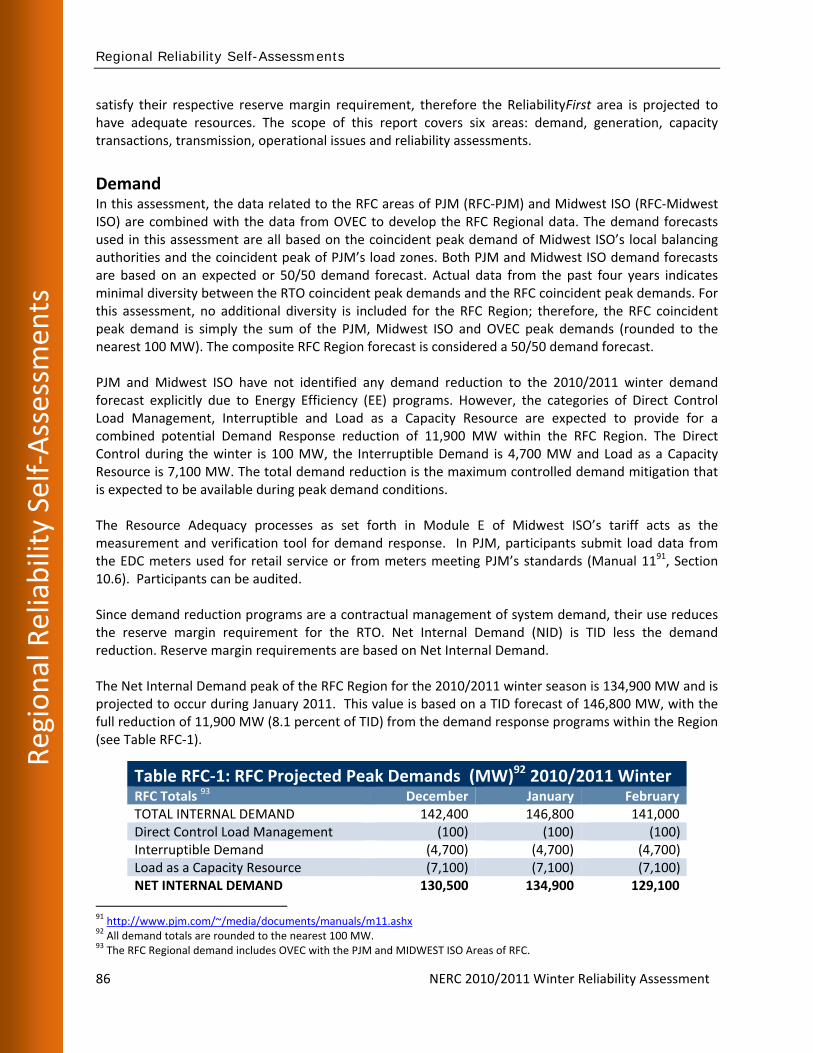
Regional Reliability Self‐Assessm
ents
Regional Reliability Self-Assessments
86 NERC 2010/2011 Winter Reliability Assessment
satisfy their respective reserve margin requirement, therefore the ReliabilityFirst area is projected to have adequate resources. The scope of this report covers six areas: demand, generation, capacity transactions, transmission, operational issues and reliability assessments.
Demand In this assessment, the data related to the RFC areas of PJM (RFC‐PJM) and Midwest ISO (RFC‐Midwest ISO) are combined with the data from OVEC to develop the RFC Regional data. The demand forecasts used in this assessment are all based on the coincident peak demand of Midwest ISO’s local balancing authorities and the coincident peak of PJM’s load zones. Both PJM and Midwest ISO demand forecasts are based on an expected or 50/50 demand forecast. Actual data from the past four years indicates minimal diversity between the RTO coincident peak demands and the RFC coincident peak demands. For this assessment, no additional diversity is included for the RFC Region; therefore, the RFC coincident peak demand is simply the sum of the PJM, Midwest ISO and OVEC peak demands (rounded to the nearest 100 MW). The composite RFC Region forecast is considered a 50/50 demand forecast. PJM and Midwest ISO have not identified any demand reduction to the 2010/2011 winter demand forecast explicitly due to Energy Efficiency (EE) programs. However, the categories of Direct Control Load Management, Interruptible and Load as a Capacity Resource are expected to provide for a combined potential Demand Response reduction of 11,900 MW within the RFC Region. The Direct Control during the winter is 100 MW, the Interruptible Demand is 4,700 MW and Load as a Capacity Resource is 7,100 MW. The total demand reduction is the maximum controlled demand mitigation that is expected to be available during peak demand conditions. The Resource Adequacy processes as set forth in Module E of Midwest ISO’s tariff acts as the measurement and verification tool for demand response. In PJM, participants submit load data from the EDC meters used for retail service or from meters meeting PJM’s standards (Manual 1191, Section 10.6). Participants can be audited. Since demand reduction programs are a contractual management of system demand, their use reduces the reserve margin requirement for the RTO. Net Internal Demand (NID) is TID less the demand reduction. Reserve margin requirements are based on Net Internal Demand. The Net Internal Demand peak of the RFC Region for the 2010/2011 winter season is 134,900 MW and is projected to occur during January 2011. This value is based on a TID forecast of 146,800 MW, with the full reduction of 11,900 MW (8.1 percent of TID) from the demand response programs within the Region (see Table RFC‐1).
Table RFC‐1: RFC Projected Peak Demands (MW)92 2010/2011 Winter RFC Totals 93 December January FebruaryTOTAL INTERNAL DEMAND 142,400 146,800 141,000Direct Control Load Management (100) (100) (100)Interruptible Demand (4,700) (4,700) (4,700)Load as a Capacity Resource (7,100) (7,100) (7,100)NET INTERNAL DEMAND 130,500 134,900 129,100
91 http://www.pjm.com/~/media/documents/manuals/m11.ashx 92 All demand totals are rounded to the nearest 100 MW. 93 The RFC Regional demand includes OVEC with the PJM and MIDWEST ISO Areas of RFC.
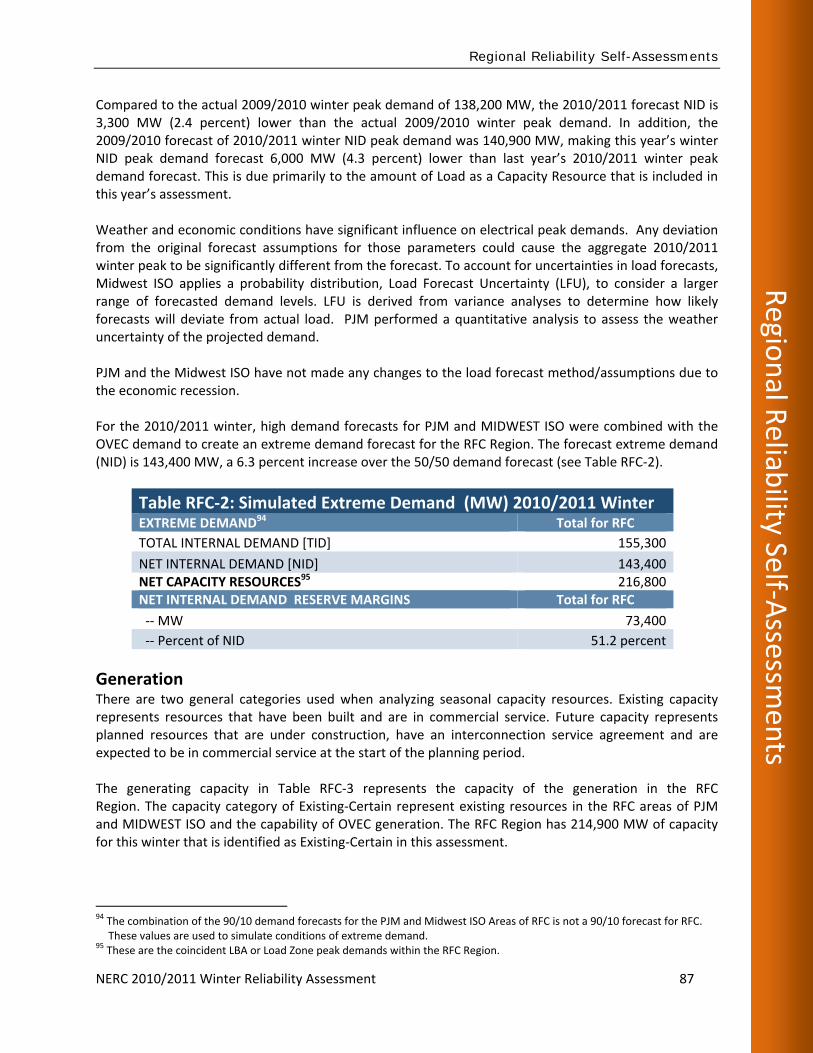
Regio
nal R
eliability Self‐A
ssessmen
ts Regional Reliability Self-Assessments
NERC 2010/2011 Winter Reliability Assessment 87
Compared to the actual 2009/2010 winter peak demand of 138,200 MW, the 2010/2011 forecast NID is 3,300 MW (2.4 percent) lower than the actual 2009/2010 winter peak demand. In addition, the 2009/2010 forecast of 2010/2011 winter NID peak demand was 140,900 MW, making this year’s winter NID peak demand forecast 6,000 MW (4.3 percent) lower than last year’s 2010/2011 winter peak demand forecast. This is due primarily to the amount of Load as a Capacity Resource that is included in this year’s assessment. Weather and economic conditions have significant influence on electrical peak demands. Any deviation from the original forecast assumptions for those parameters could cause the aggregate 2010/2011 winter peak to be significantly different from the forecast. To account for uncertainties in load forecasts, Midwest ISO applies a probability distribution, Load Forecast Uncertainty (LFU), to consider a larger range of forecasted demand levels. LFU is derived from variance analyses to determine how likely forecasts will deviate from actual load. PJM performed a quantitative analysis to assess the weather uncertainty of the projected demand. PJM and the Midwest ISO have not made any changes to the load forecast method/assumptions due to the economic recession. For the 2010/2011 winter, high demand forecasts for PJM and MIDWEST ISO were combined with the OVEC demand to create an extreme demand forecast for the RFC Region. The forecast extreme demand (NID) is 143,400 MW, a 6.3 percent increase over the 50/50 demand forecast (see Table RFC‐2).
Table RFC‐2: Simulated Extreme Demand (MW) 2010/2011 Winter EXTREME DEMAND94 Total for RFC
TOTAL INTERNAL DEMAND [TID] 155,300
NET INTERNAL DEMAND [NID] 143,400 NET CAPACITY RESOURCES95 216,800 NET INTERNAL DEMAND RESERVE MARGINS Total for RFC
‐‐ MW 73,400
‐‐ Percent of NID 51.2 percent
Generation There are two general categories used when analyzing seasonal capacity resources. Existing capacity represents resources that have been built and are in commercial service. Future capacity represents planned resources that are under construction, have an interconnection service agreement and are expected to be in commercial service at the start of the planning period. The generating capacity in Table RFC‐3 represents the capacity of the generation in the RFC Region. The capacity category of Existing‐Certain represent existing resources in the RFC areas of PJM and MIDWEST ISO and the capability of OVEC generation. The RFC Region has 214,900 MW of capacity for this winter that is identified as Existing‐Certain in this assessment.
94 The combination of the 90/10 demand forecasts for the PJM and Midwest ISO Areas of RFC is not a 90/10 forecast for RFC.
These values are used to simulate conditions of extreme demand. 95 These are the coincident LBA or Load Zone peak demands within the RFC Region.

Regional Reliability Self‐Assessm
ents
Regional Reliability Self-Assessments
88 NERC 2010/2011 Winter Reliability Assessment
Table RFC‐3: RFC Projected Capacity Resources (MW) 2010/2011 Winter
Capacity as of June 1, 2010 RFC Totals
Existing Capacity 223,500
Inoperable (Scheduled Maintenance) 0
Energy Only Resources (including variable gen) (3,600)
Uncommitted Resources (5,000)
Transmission Limited Resources 0
Existing‐Other Capacity (8,600)
Existing‐Certain Capacity 214,900
Capacity Transactions – Imports96 RFC Totals
Purchases 2,400
Owned Capability outside the RFC Region 100
Total Capacity Transactions Imports 2,500
Capacity Transactions– Exports79 RFC Totals
Sales (600)
Other Owner Capability transferred outside the RFC Region 0
Total Capacity Transactions Exports (600)
Net Interchange 1,900
Net Capacity Resources 216,800
The Existing‐Other category includes the existing resources that represent expected on‐peak wind/variable resource deratings, and other existing capacity resources within the RFC Region that are not part of the PJM or MIDWEST ISO markets. There is up to 8,600 MW of these types of capacity resources. Since these resources are not in the respective PJM and MIDWEST ISO markets, none of this capacity is included in the reserve margins. Only capacity additions that are in service prior to the planning year, which starts in June, are included in determining the winter reserve margins. The total nameplate amount of variable generation in RFC is about 4,100 MW. The amount of available on‐peak variable generation capability included in the reserve calculations is 500 MW. This is all wind power since the small amount of solar generation has not been committed to the markets. The difference between the nameplate rating and the on‐peak expected wind capability rating is accounted for in the Existing‐Other category.
96 Intra‐regional transfers reported by the RTOs (between RTOs and with OVEC) have been removed from the total
import/export values
Regio
nal R
eliability Self‐A
ssessmen
ts Regional Reliability Self-Assessments
NERC 2010/2011 Winter Reliability Assessment 89
There is also 700 MW of biomass (renewable) resources included in the RFC reserve margins. There are no known or expected conditions or situations regarding fuel supply or delivery, hydroelectric reservoirs, adverse weather, generator availability, environmental, regulatory, or capacity retirement that are anticipated to adversely impact system reliability during the 2010/2011 winter.
Capacity Transactions on Peak Expected and firm power imports into the RFC Regional area are forecast to be 2,500 MW. Firm power exports are forecast to be 600 MW. Therefore, net interchange is forecast to be a 1,900 MW power net import into the RFC. Firm transactions are backed by both transmission and generation. There are no transactions using Liquidated Damage Contracts (LDC) or make‐whole contracts.
Transmission The original ITCTransmission Bunce Creek (B3N) Phase Angle Regulating transformer that failed in March 2003 has been replaced by two (series) Phase Angle Regulating (PAR) transformers. Installation of the transformers was completed in December 2009. Energizing the transformers was dependent upon completion of protective system work in coordination with Hydro One, which was completed in July 2010. Until ITCTransmission and Hydro One are authorized to begin operating the B3N Phase Angle Regulating transformers to control flows, the PAR transformers on the L4D and L51D interconnections will be placed in the by‐pass mode. The PAR on the Ontario‐ Michigan J5D interconnection near Windsor will be operated to assist in the management of local system congestion and for the optimization of power transfers. The PAR transformers on the ITCTransmission – Hydro One interconnections will be used to control interconnection flows pending the receipt by ITCTransmission of an amended Presidential Permit from the U.S. Department of Energy and completion of various contractual and operational agreements between and among the respective Transmission Owners and Reliability Coordinators. The goal is to place the PARs in service prior to January 1, 2011 though depending on the regulatory and other readiness processes, this date may not be met. On May 5, 2010, the #5 500/345 kV transformer at Allegheny Power's Wylie Ridge substation failed. Then on August 15, 2010 the #8 500/345 kV transformer at Allegheny Power's Wylie Ridge substation failed. A spare transformer has been ordered and is expected to be on site and installed during the fall of 2011. Wylie Ridge substation is an interconnection point between the American Electric Power and FirstEnergy 345 kV systems and Allegheny Power's 500 kV system. Loss of the Wylie Ridge #5 and #8 transformers can potentially reduce the transfer capability from west to east through PJM. PJM and Midwest ISO have jointly managed congestion at the Wylie Ridge interface prior to the addition of the third and fourth 500/345 kV transformers in 2007, and since that time during planned maintenance outages of any of the transformers. Transmission congestion may increase during operation with only the two remaining transformers, but is not expected to impact reliability or the ability to meet demand in eastern ReliabilityFirst or northern SERC Regions. There are no significant transmission outages planned through the winter season. Thirty miles of the new 345 kV Paddock‐Rockdale line was placed in service in March 2010 by American Transmission Company, LLC. There are 26 miles of additional 345 kV lines planned to be in‐service from Baldwin to Rush Island in November 2010. There have been 12 transformer installation and upgrade projects completed, or are nearing completion, since the 2009/2010 winter. There are no concerns in meeting target in‐service dates for
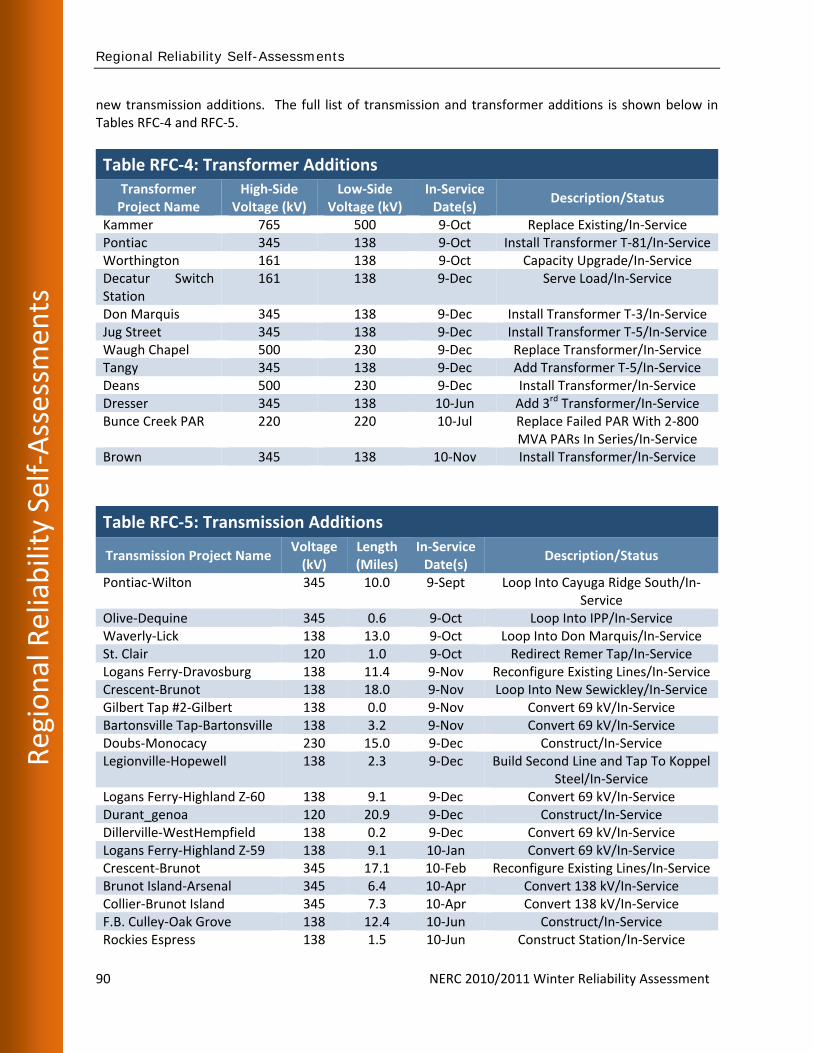
Regional Reliability Self‐Assessm
ents
Regional Reliability Self-Assessments
90 NERC 2010/2011 Winter Reliability Assessment
new transmission additions. The full list of transmission and transformer additions is shown below in Tables RFC‐4 and RFC‐5.
Table RFC‐4: Transformer Additions Transformer Project Name
High‐Side Voltage (kV)
Low‐Side Voltage (kV)
In‐Service Date(s)
Description/Status
Kammer 765 500 9‐Oct Replace Existing/In‐Service Pontiac 345 138 9‐Oct Install Transformer T‐81/In‐Service Worthington 161 138 9‐Oct Capacity Upgrade/In‐Service Decatur Switch Station
161 138 9‐Dec Serve Load/In‐Service
Don Marquis 345 138 9‐Dec Install Transformer T‐3/In‐Service Jug Street 345 138 9‐Dec Install Transformer T‐5/In‐Service Waugh Chapel 500 230 9‐Dec Replace Transformer/In‐Service Tangy 345 138 9‐Dec Add Transformer T‐5/In‐Service Deans 500 230 9‐Dec Install Transformer/In‐Service Dresser 345 138 10‐Jun Add 3rd Transformer/In‐Service Bunce Creek PAR 220 220 10‐Jul Replace Failed PAR With 2‐800
MVA PARs In Series/In‐Service Brown 345 138 10‐Nov Install Transformer/In‐Service
Table RFC‐5: Transmission Additions
Transmission Project Name Voltage (kV)
Length (Miles)
In‐Service Date(s)
Description/Status
Pontiac‐Wilton 345 10.0 9‐Sept Loop Into Cayuga Ridge South/In‐Service
Olive‐Dequine 345 0.6 9‐Oct Loop Into IPP/In‐Service Waverly‐Lick 138 13.0 9‐Oct Loop Into Don Marquis/In‐Service St. Clair 120 1.0 9‐Oct Redirect Remer Tap/In‐Service Logans Ferry‐Dravosburg 138 11.4 9‐Nov Reconfigure Existing Lines/In‐Service Crescent‐Brunot 138 18.0 9‐Nov Loop Into New Sewickley/In‐Service Gilbert Tap #2‐Gilbert 138 0.0 9‐Nov Convert 69 kV/In‐Service Bartonsville Tap‐Bartonsville 138 3.2 9‐Nov Convert 69 kV/In‐Service Doubs‐Monocacy 230 15.0 9‐Dec Construct/In‐Service Legionville‐Hopewell 138 2.3 9‐Dec Build Second Line and Tap To Koppel
Steel/In‐Service Logans Ferry‐Highland Z‐60 138 9.1 9‐Dec Convert 69 kV/In‐Service Durant_genoa 120 20.9 9‐Dec Construct/In‐Service Dillerville‐WestHempfield 138 0.2 9‐Dec Convert 69 kV/In‐Service Logans Ferry‐Highland Z‐59 138 9.1 10‐Jan Convert 69 kV/In‐Service Crescent‐Brunot 345 17.1 10‐Feb Reconfigure Existing Lines/In‐Service Brunot Island‐Arsenal 345 6.4 10‐Apr Convert 138 kV/In‐Service Collier‐Brunot Island 345 7.3 10‐Apr Convert 138 kV/In‐Service F.B. Culley‐Oak Grove 138 12.4 10‐Jun Construct/In‐Service Rockies Espress 138 1.5 10‐Jun Construct Station/In‐Service
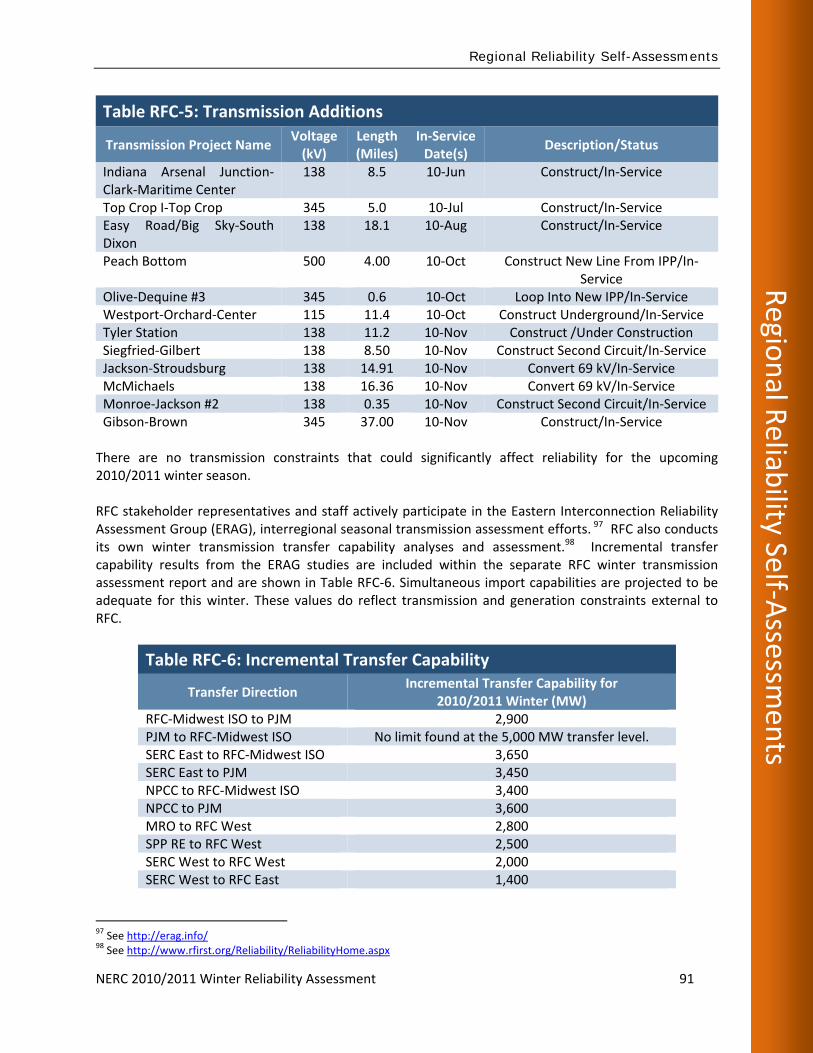
Regio
nal R
eliability Self‐A
ssessmen
ts Regional Reliability Self-Assessments
NERC 2010/2011 Winter Reliability Assessment 91
Table RFC‐5: Transmission Additions
Transmission Project Name Voltage (kV)
Length (Miles)
In‐Service Date(s)
Description/Status
Indiana Arsenal Junction‐Clark‐Maritime Center
138 8.5 10‐Jun Construct/In‐Service
Top Crop I‐Top Crop 345 5.0 10‐Jul Construct/In‐Service Easy Road/Big Sky‐South Dixon
138 18.1 10‐Aug Construct/In‐Service
Peach Bottom 500 4.00 10‐Oct Construct New Line From IPP/In‐Service
Olive‐Dequine #3 345 0.6 10‐Oct Loop Into New IPP/In‐Service Westport‐Orchard‐Center 115 11.4 10‐Oct Construct Underground/In‐Service Tyler Station 138 11.2 10‐Nov Construct /Under Construction Siegfried‐Gilbert 138 8.50 10‐Nov Construct Second Circuit/In‐Service Jackson‐Stroudsburg 138 14.91 10‐Nov Convert 69 kV/In‐Service McMichaels 138 16.36 10‐Nov Convert 69 kV/In‐Service Monroe‐Jackson #2 138 0.35 10‐Nov Construct Second Circuit/In‐Service Gibson‐Brown 345 37.00 10‐Nov Construct/In‐Service
There are no transmission constraints that could significantly affect reliability for the upcoming 2010/2011 winter season. RFC stakeholder representatives and staff actively participate in the Eastern Interconnection Reliability Assessment Group (ERAG), interregional seasonal transmission assessment efforts. 97 RFC also conducts its own winter transmission transfer capability analyses and assessment.98 Incremental transfer capability results from the ERAG studies are included within the separate RFC winter transmission assessment report and are shown in Table RFC‐6. Simultaneous import capabilities are projected to be adequate for this winter. These values do reflect transmission and generation constraints external to RFC.
Table RFC‐6: Incremental Transfer Capability
Transfer Direction Incremental Transfer Capability for
2010/2011 Winter (MW) RFC‐Midwest ISO to PJM 2,900 PJM to RFC‐Midwest ISO No limit found at the 5,000 MW transfer level. SERC East to RFC‐Midwest ISO 3,650 SERC East to PJM 3,450 NPCC to RFC‐Midwest ISO 3,400 NPCC to PJM 3,600 MRO to RFC West 2,800 SPP RE to RFC West 2,500 SERC West to RFC West 2,000 SERC West to RFC East 1,400
97 See http://erag.info/ 98 See http://www.rfirst.org/Reliability/ReliabilityHome.aspx

Regional Reliability Self‐Assessm
ents
Regional Reliability Self-Assessments
92 NERC 2010/2011 Winter Reliability Assessment
Operational Issues The Midwest ISO plans to use intermittent dispatchable technology for the integration of variable resources in the future.99 PJM performs both an Operations Assessment Task Force (self‐assessment) and interregional assessment(s) using expected peak winter conditions to determine system adequacy and to identify system problems. No unique issues were observed. PJM operates all resources in a consistent manner through cost effective re‐dispatch procedures. There is no anticipation of reliability concerns from minimum demand and over‐generation. The Midwest ISO has no concerns with the use of demand response resources to meet peak demands. The level of Direct Control Load Management is higher this year compared to last year and interruptible load is slightly lower than what was registered last year. In addition, even though the Midwest ISO reached an all‐time winter peak demand in December 2009, no load modifying resources were deployed in the 2009/2010 winter period. If peak demands are higher than expected, the Midwest ISO can call the Local Balancing Authorities to deploy Demand Response resources. The Local Balancing Authorities also have the option to independently deploy Demand Response resources that they may have. The Midwest ISO can also use emergency procedures if peak demands are higher than expected. PJM has used demand response this past summer with success and has no concerns for the upcoming winter. PJM requires Generation Owners to place resources into the "Maximum Emergency Category" if environmental restrictions limit run hours below pre‐determined levels. Maximum Emergency units are the last to be dispatched. There are currently no environmental or regulatory restrictions that potentially affect reliability and no other anticipated unusual operating conditions that could significantly affect reliability for the upcoming winter.
Reliability Assessment Analysis Analyses were conducted by the Midwest LOLE Working Group and PJM to satisfy the ReliabilityFirst requirement for Planning Coordinators to determine the reserve margin at which the Loss of Load Expectation (LOLE) is one day in ten years (0.1 day/year) on an annual basis for their planning area. These analyses include demand forecast uncertainty, outage schedules, determination of transmission transfer capability, internal deliverability, other external emergency sources, treatment of operating reserves and other relevant factors when determining the probability of firm demand exceeding the available generating capacity. The assessment of PJM resource adequacy was based on reserve requirements determined from the PJM analysis. Similarly, the assessment of MIDWEST ISO resource adequacy was based on reserve requirements determined from the MIDWEST ISO analysis. The PJM projected (existing and prospective margins are the same) reserve margin for the 2010/2011 winter is 58.0 percent which is in excess of the required reserve margin of 15.5 percent. This is a five percent increase over the 2009 forecast reserve margin. Therefore, the PJM RTO is projected to have adequate reserves for the 2010/2011 winter peak demand.
99 See http://www.narucmeetings.org/Presentations/midwestisonarucfebruary142010.pdf

Regio
nal R
eliability Self‐A
ssessmen
ts Regional Reliability Self-Assessments
NERC 2010/2011 Winter Reliability Assessment 93
The Midwest ISO’s system Planning Reserve Margin target level for the 2010/2011 winter season is 15.4 percent, unchanged from the 2009/2010 winter season. The Reserve Margin based on Existing‐Certain and Net Firm Transactions is 49.1 percent, which is greater than the 15.4 percent target level and the 2010 NERC Reference Margin level of 15.0 percent.100 In Table RFC‐7, the calculated reserve margin for RFC is 81,900 MW, which is 60.7 percent based on Net Internal Demand and Net Capacity Resources. This compares to a 53.2 percent reserve margin in last winter’s assessment. Since PJM and MIDWEST ISO are projected to have sufficient resources to satisfy their respective reserve margin requirements, the RFC Region is projected to have adequate resources for the 2010/2011 winter period.
Table RFC‐7: RFC Projected Reserve Margins for 2010/2011 Winter DECEMBER JANUARY FEBRUARY NET INTERNAL DEMAND (NID) (MW) 130,500 134,900 129,100 NET CAPACITY RESOURCES (MW) 216,800 216,800 216,800 NID RESERVE MARGINS ‐‐ MW 86,300 81,900 87,700 ‐‐ Percent of NID 66.1 60.7 67.9
Each generator operator is expected to coordinate with the fuel industry regarding fuel supplies and deliveries. Both PJM and MIDWEST ISO monitor fuel supply issues, and have market rules that encourage generator owners and operators to have adequate fuel supplies. RFC does not communicate directly with the fuel industry about supply adequacy or potential problems. However, RFC does periodically survey its generator owners and operators about relevant fuel issues. The last survey was in 2008.
Other Region‐Specific Issues ReliabilityFirst has no additional reliability concerns for this winter season.
Region Description ReliabilityFirst currently consists of 48 regular members, 22 associate members, and 4 adjunct members operating within three NERC Balancing Authorities (MIDWEST ISO, OVEC, and PJM), which includes over 350 owners, users, and operators of the bulk‐power system. They serve the electrical requirements of more than 72 million people in a 238,000 square‐mile area covering all of the states of Delaware, Indiana, Maryland, Ohio, Pennsylvania, New Jersey, and West Virginia, and the District of Columbia; and portions of Illinois, Kentucky, Michigan, Tennessee, Virginia, and Wisconsin. The ReliabilityFirst area demand is primarily summer peaking. Additional details are available on the ReliabilityFirst Web site.101
100 See http://www.midwestmarket.org/publish/Document/4dfde8_124a04ca493_‐7f5f0a48324a 101 See http://www.rfirst.org

Regional Reliability Self‐Assessm
ents
Regional Reliability Self-Assessments
94 NERC 2010/2011 Winter Reliability Assessment
SSEERRCC
Introduction The SERC Region is a summer‐peaking Region covering all or portions of 16 central and southeastern states102 serving a population of over 60 million. Users, owners and operators of the bulk power system in these states cover an area of approximately 560,000 square miles. SERC is the Regional Entity for the Region and is a nonprofit corporation responsible for promoting and improving the reliability, adequacy, and critical infrastructure of the bulk power system. SERC membership includes 63 member‐entities consisting of publicly‐owned (federal, municipal and cooperative), and investor‐owned operations. In the SERC Region there are 32 Balancing Authorities (five jointly registered with Midwest ISO) and over 200 Registered Entities under the NERC functional model. SERC Reliability Corporation serves as a Regional Entity with delegated authority from NERC for the purpose of proposing and enforcing reliability standards within the SERC Region, among other delegated services. The SERC Region is divided geographically into five subregions, which are identified as Central, Delta, Gateway, Southeastern, and VACAR. The SERC subregions do not align to the seven (7) Reliability Coordinator boundaries, as some Reliability Coordinators can be bifurcated or trifurcated. The intent of this report is to demonstrate a Regional reliability self‐assessment of SERC for the 2010/2011 winter. For purposes of reporting the sum of non‐coincident forecast data and assessing reliability, the utilities within the SERC Region are assigned to one of five subregions, which together supply power to more than 20 percent of the electric customers in the U.S.. Most electric utilities within SERC operate under some degree of traditional vertical integration with planning philosophies based on
102 Alabama, Arkansas, Florida, Georgia, Iowa, Illinois, Kentucky, Louisiana, Missouri, Mississippi, North Carolina, Oklahoma,
South Carolina, Tennessee, Texas, and Virginia

Regio
nal R
eliability Self‐A
ssessmen
ts Regional Reliability Self-Assessments
NERC 2010/2011 Winter Reliability Assessment 95
an obligation to serve ensuring that designated generation operates under optimal economic dispatch to serve local area customers. However, some utilities within the SERC Region have selected or have been ordered to adopt a non‐traditional operating structure whereby management of the operation of the transmission system is provided by a third party under an Independent Coordinator of Transmission (ICT) contract or a Regional Transmission Organization (RTO). These ICTs or RTOs manage transmission flows to customers over a broader Regional area through congestion‐based locational marginal pricing. Transmission systems within the SERC footprint are closely interconnected and the Region has operated with high degree of reliability for many years. The information contained in this report is organized by subregion and populated with the input of SERC registered entities for the assessment period. Data reported within the report provides a subregional view of forecasted demand, anticipated generation status, capacity transactions, anticipated transmission status, operational issues, and reliability projections for the 2010/2011 winter. Individual entity data or CEII data are not disclosed within this report.
Demand The total aggregate internal demand for the 2010/2011 winter is forecast to be 183,521 MW; this is 3,862 MW (2.2 percent) higher than the forecast 2009/2010 winter Total Internal Demand of 179,659 MW and 9,154 MW (4.8 percent) lower than the 2009/2010 actual winter peak of 192,675 MW a new all‐time SERC peak demand in January 2010. The actual winter peak demand does take into account energy efficiency, diversity stand‐by load, and additions for non‐member load but cannot be broken out, whereas the forecast internal peak demand values can be broken out by these factors. Traditionally, SERC is a summer‐peaking Region. Projections are based on average historical winter weather and are the sum of non‐coincident forecast data reported by utilities within the SERC Region. Some entities have increased their forecasts due to the adjustments in weather and moderate economic recovery. Because of the varied nature of energy‐efficiency programs, they are described separately within the subregion portions of this report. A number of utilities within the SERC Region have some form of efficiency program or Demand‐Side Management (DSM) efforts in place or under development. Entities measure and verify their programs in various ways. Some entities use measurement verification programs to measure energy savings and costs programs. Other entities use third‐party vendors to assess their programs and analyze results. These techniques have been useful to fine‐tune energy‐efficiency programs and to determine each program’s overall cost effectiveness. Traditional load management and interruptible programs such as residential programs focusing on consumer education on energy efficiency and large industrial interruptible services are common within the Region. Interruptible demand and DSM capabilities for the 2010/2011 winter are 5,853 MW as compared with the 5,237 MW reported for last winter. This year’s Demand Response is 3.2 percent of the Total Internal Demand forecast for 2010/2011. Traditional Demand Response programs include monetary incentives to reduce demand during peak periods. Some examples are real‐time pricing programs and voluntary curtailment riders. The programs are more fully described in each subregion section. There are no measurement verification programs implemented at the SERC Region level.

Regional Reliability Self‐Assessm
ents
Regional Reliability Self-Assessments
96 NERC 2010/2011 Winter Reliability Assessment
Table SERC ‐ 1: SERC Demand Response Programs MW
Program 2009/2010 Winter
(MW) 2010/2011 Winter
(MW) Direct Control Load Management 646 605 Contractually Interruptible (Curtailable) 4,180 4,355 Critical Peak‐Pricing (CPP) with Control 0 0 Load as a Capacity Resource 184 568 Energy‐Efficiency Programs 227 325
Ambient temperatures that are higher or lower than normal and the degree to which interruptible demand and DSM is used, result in actual peak demands that vary from the forecast. The utilities within the SERC Region perform detailed extreme weather and, or, load sensitivity analyses in their respective operational and planning studies. The use of sophisticated, industry‐accepted methods to evaluate load sensitivities in the development of load forecasts is common in the Region. While methods vary, there are many common attributes, which include:
• Use of econometric linear regression models;
• Relationship of historical annual peak demands to key variables such as weather, economic
conditions, and demographics;
• Variance of forecasts due to both high‐ and low‐economic scenarios and mild and severe
weather; and
• Development of a suite of forecasts to account for the variables mentioned above, and
associated studies using these forecasts.
Companies continue to study the impacts of all factors to perfect their processes in determining peak demand. In some entities forecasts, economic assumptions are based on economic modeling results that are generated annually. Some entities report that for the 2010/2011 forecasts, revisions were made based on May 2010 economics. In most cases, assumptions forecast for the upcoming winter show continued population growth to the Region even though the growth has slowed due to the economic recession. However, forecasts continue to reflect positive economic trends and customer growth in the long‐run but at slightly slower rates than last year’s projections. This decrease in expectations results in a lower forecast for winter peak demand and energy consumption. Studies may be performed internally or contracted to consultants to provide load data based on load trends and weather forecast.
Generation For the assessment period, utilities within the SERC Region expect to have 258,667 MW of aggregate capacity resources. These projections include 245,390 MW of Existing‐Certain resources, 11,115 MW of Existing‐Other resources, and 2,162 MW of inoperable resources. Approximately 988 MW of Future‐Planned and zero MW of Future‐Other capacity resources are expected during the assessment period. Utilities within SERC report 12,618 MW of Existing‐Certain variable generation and zero MW of Existing‐Other variable generation during the 2010/2011 winter. There are two MW of wind and 316 MW of biomass103 generation in the SERC Region. The expected on‐peak capacity resources of the utilities
103 Defined by EIA as: “organic non‐fossil material of biological origin constituting a renewable energy source”

Regio
nal R
eliability Self‐A
ssessmen
ts Regional Reliability Self-Assessments
NERC 2010/2011 Winter Reliability Assessment 97
within SERC include 4.8 percent hydro generation and 3.5 percent of pumped storage generation. Calculations for expected variable resources are performed through methods of published unit ratings, hourly megawatt values that are based on expected firm and non‐firm capacity, forecasted availability and contractual agreements. Throughout the Region, hydroelectric conditions are expected to be sufficient for the upcoming winter. Thermal and hydroelectric production is expected to have no significant reliability concerns for the 2010/2011 winter. Entities within the Region are currently not experiencing or expecting to experience any conditions that would negatively affect reliability. It is common amongst the entities to rely on a portfolio of firm‐fuel resources to ensure adequate fuel supplies to generating facilities during projected winter peak periods. Forecasts are based on normal weather conditions for winter peaks. In addition, entities within SERC are not expecting a significant amount of generation to be out of service during the winter, though a few large units are scheduled to be out of service for maintenance and refueling. Outages are routinely scheduled for some generating units during the winter. Outage plans are developed so that anticipated loads can be met with available resources. Few plants have also been proposed to be retired this winter. These retirements coupled with the planned outages are not expected to result in any reliability issues for the 2010/2011 winter. Planned outage schedules and retirements are coordinated ahead of time with transmission operators to preserve the reliability of the bulk power system.
Capacity Transactions on Peak These firm purchases have been included in the reserve margin calculations for the Region and are backed by firm contracts for both generation and transmission. No entities reported import or export assumptions that are based on partial path reservations. Utilities in the Region are not considered to be dependent on purchases or transfers outside the SERC Region to meet the demands of the load in the Region. Several entities within the Region reported use of contracts within their subregions that are Liquidated Damages Contracts (LDC). The majority of these contracts are considered to be make‐whole contracts. Specific subregional contracts details can be found in the subregional write‐up sections.
Table SERC‐ 2: SERC Region Purchases/Sales MW
Transaction Type Imports (MW) Exports (MW) Firm 8,735 10,298 Non‐Firm 354 0 Expected 0 272
Transmission New bulk power transmission facility projects and substation equipment are anticipated to be in‐service for the 2010/2011 winter. These have been added to the system since the 2009/2010 winter and are listed in detail within the SERC subregional sections of the report. There are no reported transmission project delays that would create concerns for reliability. Reported delays are expected to be mitigated appropriately to ensure they have no impacts on the system this winter. No significant transmission lines are planned to be out of service throughout the Region at this time. All significant, planned transmission facility outages are scheduled for the off‐peak seasons of spring and fall. Utilities commonly study and plan transmission facility outages based on forecasted system

Regional Reliability Self‐Assessm
ents
Regional Reliability Self-Assessments
98 NERC 2010/2011 Winter Reliability Assessment
conditions to minimize reliability impacts. In the event of forced or weather‐related outages (e.g., ice storms), some companies may activate individual transmission emergency operations centers to coordinate restoration of service to customers. Companies will maintain reliability by generator re‐dispatch and transmission re‐configuration when necessary. Transmission maintenance schedules are carefully reviewed and evaluated to insure reliability concerns are addressed prior to seasonal peak periods. There are no transmission constraints that could significantly affect reliability of the utilities within the SERC Region during the 2010/2011 winter. Discussions in subregional portions of the report indicate a few situations where certain utilities require increased monitoring. With load projected to be lower as compared to the prior year, the system has already been tested at greater seasonal load levels. Coordinated interregional transmission reliability and transfer capability104 studies for the 2010/2011 winter are currently proceeding among all the SERC subregions. Preliminary results of these studies indicate that entities within the SERC Region have no significant issues that will affect bulk power system reliability.
Operational Issues Operational planning studies are done by individual utilities within the SERC Region. Individual company studies were reported to be done daily, weekly, and monthly, taking into consideration demand, transmission and unit availability. These studies support addressing any inadequacies and mitigating potential risks. No generation or operational problems have been identified in recently completed planning studies. Entities within the Region participate in SERC study groups that assess the Region on a seasonal basis. An assessment is currently being conducted in the SERC NTSG 2010/2011 Winter Reliability Report. General weather forecast conditions have emerged showing a greater than average chance of warmer and drier conditions in parts of the southeast this winter. The southeast experienced severe drought conditions during 2007, but that improved substantially throughout 2008. In 2008, SERC performed a drought study that included an extreme hydrological scenario in excess of the forecast 2008 summer conditions. The study results showed that there should be no reliability concerns. The 2010/2011 winter Total Internal Demand forecast of 183,521 MW represents 90.3 percent of the 2008 summer forecasted Total Internal Demand of 203,320 MW. With the winter forecast peak below the summer levels studied, it can be inferred that no reliability concerns should be expected for the upcoming winter period. October and November are historically low precipitation months in the Southeast, however, La Niña conditions in the Pacific are indicative of persistent low yields. This trend should be monitored as the traditionally wet spring months may not be sufficient to return reservoir levels to full pool and continued dry conditions may lead to higher than normal average temperatures in the coming peak demand summer months. The SERC subregional sections of this report provide greater detail but on average, the subregions expect reservoir levels to be sufficient to support the generation needed to meet forecasted peak and
104 Transfer capabilities are a part of the 2010 RRS Annual Report to the Engineering Committee that is available only upon
request through the SERC web site located at www.serc1.org.

Regio
nal R
eliability Self‐A
ssessmen
ts Regional Reliability Self-Assessments
NERC 2010/2011 Winter Reliability Assessment 99
daily energy demands for the winter season. The current projections of the U.S. Drought Monitor for the Southeast105 forecast abnormally dry or moderate drought conditions for much of the southeast. No new special operating procedures are reported to be in place as a result of variable resource integration. Most of the SERC Region is in the lowest wind resource area of the country. One operational change to note is that for the utilities in the Gateway subregion who are members of the Midwest ISO (Independent Transmission System Operator), on January 6, 2009, the Midwest ISO began operation as a single balancing authority in conjunction with the commencement of the Midwest ISO Ancillary Services Market. The continuing addition of variable resources, including wind generation in the subregion and throughout the Midwest exacerbates the problem of operating and balancing excessive amounts of generation on the system during light load conditions. Some entities have reported that variable resources, particularly wind, have presented new operating challenges at minimum load levels, as Midwest ISO has issued several minimum generation alerts, warnings, and emergencies. As a result, some entities within the Gateway subregion have responded by taking generating units off‐line, curtailing wind generation and/or reducing output of online units to absolute minimum levels to comply with Midwest ISO orders. Midwest ISO reported to have studies and procedures in place to address reliability concerns. Other than what has just been discussed, no significant reliability concerns resulting from high‐levels of Demand Response resources or minimum demand and over‐generation scenarios have been identified or are anticipated for the upcoming season.
SERC Figure 1106: Southeastern Drought Conditions
Environmental and/or regulatory restrictions are not a reliability issue for the Region, even though some entities have reported minor issues resulting from hazardous air pollutant (HAP) regulatory restrictions, air permit emissions restrictions and Selective Catalytic Reduction (SCR) device limits and continued restoration of dams within the Central subregion. To mitigate these concerns, limits are studied by
105 http://www.drought.unl.edu/dm/DM_southeast.htm 106 http://www.drought.unl.edu/dm/DM_southeast.htm

Regional Reliability Self‐Assessm
ents
Regional Reliability Self-Assessments
100 NERC 2010/2011 Winter Reliability Assessment
individual companies and are taken into account during resource planning. Overall, these temporary limits are not a major concern affecting economic dispatch or system, reliability. Unusual operating conditions are not expected to impact reliability for the upcoming winter. Entities will rely on re‐dispatch plans, modest increases in imports, or implementation of predefined operating guidelines to help mitigate reliability concerns as needed.
Reliability Assessment Analysis The total aggregate internal demand for the 2010/2011 winter is forecast to be 183,521 MW; this is 9,154 MW (4.8 percent) lower than the 2009/2010 actual winter peak of 192,675 MW. Aggregate projected peak existing, anticipated and prospective reserve margins for utilities within the SERC Region are 37.0, 37.4, and 41.4 percent respectively compared to 41.9, 42.2, and 47.7 percent respectively last year. Projected margins are above the NERC Reference Margin Level of 15 percent, indicating that capacity resources are expected to be adequate to supply the projected firm winter demand. It should be noted that SERC does not implement a Regional or subregional reserve requirement. As described in more detail within the subregional reports, many utilities within the SERC Region adhere to their respective state commissions’ regulations or internal business practices regarding maintaining adequate resource capacity. The utilities within the SERC Region supply load and resource information that is aggregated at the subregional and Regional levels. The utility‐provided data are used to determine if the resources qualify to supporting the reserve margin calculations. Assessments show that an extreme peak for the 2010/2011 winter equates to 194,533 MW of peak demand for the Region, which is 1,858 MW (1.0 percent) higher than the actual 2009/2010 winter peak (January 2010) of 192,675 MW and 11,012 MW (6.0 percent) higher than the 2010/2011 forecasted peak (January 2011) of 183,521 MW. The reserve margin for this scenario is estimated to be 29.4 percent, which, although reduced from margins based on the 50/50 forecasts, is still an adequate level for these extreme conditions. Based on a recent review of resource adequacy assessment practices, many utilities within the SERC Region use a probabilistic generation and load model to assess and determine what adequate resources are available and deliverable to meet the load.
All utilities within the SERC Region project adequate fuel supplies for this winter. Communication between utilities and suppliers and transporters within the fuel industry is ongoing. This topic is covered in detail within each subregional section of this report. Although fuel deliverability problems are possible for limited periods of time due to weather extremes such as flooding, rail, pipeline and other transportation system disruptions, assessments indicate that this should not have a negative impact on reliability. The immediate impact will likely be economic as some energy production is shifted to other more expensive fuels. Secondary impacts could involve changes in air and water emission levels and increased deliveries from alternate fuel suppliers. The utilities within the SERC Region anticipate that fuel deliverability constraints would not reduce the availability of capacity resources due to strength of the utilities’ fuel procurement programs coupled with the economic recession, which has reduced pressure on rail service providers and gas pipelines. The projected 2010/2011 winter capacity mix reported by utilities within the SERC Region is well diversified at approximately 40.5 percent coal, 14.6 percent nuclear, 8.7 percent hydroelectric/pumped storage, 36.4 percent natural gas and/or oil, and ‐0.2 percent for purchases and other miscellaneous capacity. Generation based on coal, nuclear, and hydroelectric fuels continues to lead the Regional fuel mix accounting for roughly 60.2 percent of net operable capacity. Sufficient inventories (including access

Regio
nal R
eliability Self‐A
ssessmen
ts Regional Reliability Self-Assessments
NERC 2010/2011 Winter Reliability Assessment 101
to salt‐dome natural gas storage), fuel‐switching capabilities, alternate fuel suppliers and delivery routes and suppliers, and emergency fuel delivery contracts are some of the important measures used by the utilities within SERC to reduce the reliability risks due to fuel supply issues. Dual fuel units are tested to ensure their availability and that back‐up fuel supplies are adequately maintained and positioned for immediate availability. Some generating units have provisions to switch between two different natural‐gas pipeline systems, reducing the dependence on any single interstate pipeline system. Moreover, the diversity of generating resources further reduces fuel supply risk. Current projections indicate that the fuel supply infrastructure and fuel inventories for the winter are adequate even considering possible impacts due to weather extremes. SERC does not have Regional criteria for dynamic, voltage, or small signal stability; however, utilities within the Region maintain individual criteria to address any stability issues and these processes are discussed in the subregional reports. There are no issues in this area on a SERC‐wide basis. There is also no overarching summary that can be provided, except to assure that each utility involved in planning has clear criteria for voltage and transient performance. However, entities within SERC meet the requirements of NERC Transmission Planning Standards TPL‐001 through 004. Additional information on the performance and status of the SERC Region can be found in the Annual Report of the SERC Reliability Review Subcommittee (RRS) to the SERC Engineering Committee (EC). This document gives insight into the work of the SERC subcommittees relative to the transmission and generation adequacy and provides the overview of the state of the bulk power system within the SERC footprint. 107
107 The SERC RRS Annual Report to the Engineering Committee is available only upon request through the SERC Web site
located at www.serc1.org.

Regional Reliability Self‐Assessm
ents
Regional Reliability Self-Assessments
102 NERC 2010/2011 Winter Reliability Assessment
SERC‐Central The geographical coverage of the Central subregion includes most of Tennessee and Kentucky, northern Alabama, northeastern Mississippi, and small portions of Georgia, North Carolina, and Virginia. The generation facilities of the various IPPs are operated as merchant plant capacity within the subregion. The output of these plants may be purchased on the spot market or wheeled to an outside entity.
Demand The total aggregate internal demand for the 2010/2011 winter is forecast to be 44,144 MW; this is 914 MW (2.1 percent) higher than the forecast 2009/2010 winter Total Internal Demand of 43,230 MW and 2,210 MW (5.3 percent) higher than the 2009/2010 actual winter peak of 41,934 MW (January 2010). The actual winter peak demand does take into account energy efficiency, diversity stand‐by load, and additions for non‐member load but cannot be broken out, whereas the forecast internal peak demand values can be broken out by these factors. Increases in industrial demand and customer load growth are expected to occur and are included in the higher forecast demand for 2010/2011 winter assessment period. The 2010/2011 winter demand forecast is based on normalized weather conditions and economic data from population, income, expected demographics for the area, employment, energy exports, and gross Regional product increases and decreases. Economic data from the national level is also considered. To assess variability, members within the subregion use forecasts assuming normal weather and then develop models for milder and more historical peaks and demand models to predict variance. Optimistic and pessimistic economic growth scenarios, price, number of households, and commercial and industrial growth are also taken into account as variables in long‐term base case models. Some increases in industrial demand and customer load growth are expected to occur this winter. As with other subregions, strong emphasis is placed on energy efficiency and consideration of renewables. Programs such as voluntary curtailment tariffs for larger industrial customers, direct‐control load management programs and other interruptible demand programs that reduce peak demand are common around the subregion. Most voluntary curtailment programs are driven by economics. Current plans for additional Demand Response programs include third‐party aggregation efforts, which are expected to grow by the winter of 2010/2011. Future plans call for augmentation of these impacts through the addition of residential/commercial direct load control and conservation voltage regulation programs. Entities within this subregion reported three percent of Total Internal Demand as Demand Response that can reduce peak demand. Some entities measure the impact of the interruptible demand program by comparing the magnitude of the customer’s load before and during an interruption. This method of near real‐time metering of the individual sites under contract is used to track customer’s actual response to each event. Other companies report that a load must be interruptible with no more than 60 minutes notice to qualify as interruptible for planning purposes. During the 2010/2011 winter, approximately 929 MW of load is expected to be available for interruption. Although most of the programs mentioned above are used only during summer operation, these programs are reported to be active during winter and are a part of company supply portfolios for the use of peak demand reduction. As part of the subregion’s energy‐efficiency program implementation, energy audits, low‐income assistance, HVAC system improvements, lighting, and verification/measurement groups have been

Regio
nal R
eliability Self‐A
ssessmen
ts Regional Reliability Self-Assessments
NERC 2010/2011 Winter Reliability Assessment 103
implemented. Residential programs currently focus on building‐shell thermal efficiency, high‐efficiency heat pumps, new manufactured homes, and self‐administered paper and electronic online energy audits. Entities anticipate that these programs will demonstrate increased reductions in demand during the 2010/2011 winter. New programs and existing program results will be monitored and evaluated during the season in preparation for company portfolios in 2011. In general, variability in demand forecasts is assessed with normal weather assumptions, expected economic conditions, and demographics for the area. A range forecast is then developed for extreme/mild weather and for optimistic/pessimistic economic scenarios. Entities use historical data and probability methods to produce extreme winter predictions. Scenarios also account for current and long‐term economic conditions by taking into account the pricing, commercial and industrial growth and projections. No significant changes in demand forecast methods have been reported since the previous forecast for the season.
Generation Utilities in the Central subregion expect to have the following capacity in‐service through the assessment timeframe. This capacity is expected to meet on‐peak demand during this assessment period.
Table SERC‐3: Central Winter 2010/2011 Capacity Breakdown
Capacity Type 2010/2011 Winter (MW)
Existing‐Certain 48,785
Wind 2 Solar 0
Biomass 17 Hydroelectric 4,742 Existing‐Other 752
Wind 0 Solar 0
Biomass 0 Hydroelectric 0 Energy Only 555
Existing‐Inoperable 77 Future Planned 540
Wind 0 Solar 0
Biomass 0 Hydroelectric 0 Future Other 0
Wind 0 Solar 0
Biomass 0 Hydroelectric 0
Regional Reliability Self‐Assessm
ents
Regional Reliability Self-Assessments
104 NERC 2010/2011 Winter Reliability Assessment
To address variable capacity calculations, entities within the subregion either have no variable capacity or do not consider them towards satisfying peak capacity requirements. Capacity values obtained from these resources are based on applicable contract terms and the assumed contributions at the time of the winter peak. A general credit factor of 12 percent of wind generator nameplate ratings is the assumed contribution during this period. Hydroelectric conditions are currently anticipated to be normal in the Central subregion for the period. Sufficient reservoir levels are expected for the Dix Dam hydroelectric station, Laurel Dam, Greenup hydro, etc. Forecasts are based on flow conditions and analysis of previous operating practices. Marginal capacity needs have been addressed without dependence on hydroelectric capacity. Although hydroelectric generation is still limited at Wolf Creek Dam, short‐term purchases will be available as necessary to meet peak demand for the season. Entities report that they are not experiencing or anticipating challenging conditions with fuel supply, weather, or fuel transportation that would reduce plant capacity. Fuel supplies and transportation methods are diverse, such that entities have a wide variety of purchasing selections of high sulfur coal from northern and central Appalachian (West Virginia, East Kentucky), Ohio and the Illinois Basin (west Kentucky, Indiana, Illinois). Conditions are routinely monitored to detect foreseeable interruptions. Any identifiable interruptions are assessed with regard to current and desired inventory levels. Alternate delivery methods, short‐term capacity purchases and the acquisition of new suppliers are also considered as mitigation plans to maintain acceptable reserve margins. By purchasing from different Regions, coal is expected to move upstream and downstream to various plants. Some plants have the ability to re‐route deliveries between them. Some stations that have coal delivered by rail can also use trucks to supplement deliveries. Utilities have reported that they maintain targets greater than 30 days of on‐site coal inventory. Fuel supplies are adequate and readily available for the upcoming winter. Multiple contracts are in place for local coal from area mines. During the 2010/2011 winter, 77 MW is planned to be out of service due to the economic recession. Approximately 153 MW will be on planned maintenance at some point. These planned outages have been accounted for in generation planning with no impact on overall system reliability. Entities within the subregion use purchases from the short‐term markets, as necessary.
Capacity Transactions Central subregional utilities have reported the following imports and exports for the 2010/2011 winter. The majority of these imports and exports are backed by firm contracts, which include dedicated generation, transmission reservations and fuel transportation that count toward firm capacity. Only firm transactions are included in the subregion’s reserve margin calculations. There are no reports of imports or exports based on partial path reservations. Entities note that no import contracts are categorized as make‐whole LDCs.

Regio
nal R
eliability Self‐A
ssessmen
ts Regional Reliability Self-Assessments
NERC 2010/2011 Winter Reliability Assessment 105
Table SERC‐4: Central Subregional Imports/Exports
Transaction Type 2010/2011 Winter (MW) Firm Imports (Internal Subregion) 0 Firm Exports (Internal Subregion) 0 Non‐Firm Imports (Internal Subregion) 0 Non‐Firm Exports (Internal Subregion) 0 Expected Imports (Internal Subregion) 0 Expected Exports (Internal Subregion) 0 Firm Imports (External Subregion) 2,443 Firm Exports (External Subregion) 662 Non‐Firm Imports (External Subregion) 354 Non‐Firm Exports (External Subregion) 0 Expected Imports (External Subregion) 0 Expected Exports (External Subregion) 0
Several entities within this subregion are members of reserve sharing groups (TEE Contingency Reserve Sharing Group, Midwest Contingency Reserve Sharing Group, etc.) for emergency imports due to contingencies or other extreme conditions. The utilities within the subregion do not depend on outside purchases or transfers from other Regions or subregions to meet their demand requirements.
Transmission The following table shows bulk power system transmission categorized as under construction, planned, or conceptual that is expected to be in‐service for the 2010/2011 winter since the winter of 2009. Information on in‐service dates associated with various facilities (transformer, transmission lines, and new transmission equipment) that will be in‐service this winter is also listed in SERC‐5 Overall, subregional entities reported no new plans to install significant substation equipment. The deployment of “smart grid” and ION Meters is being evaluated for new installations for the upcoming season. The new meters are expected to be installed at specific interconnection points to monitor real‐time situations. The intent of implementing these new technologies will be to improve Bulk Power System reliability. There are no concerns at this time in meeting the target in‐service dates for new transmission additions planned for the 2010/2011 winter. However, the New Hardinsburg‐Paradise 161 kV line is scheduled to be out of service this winter. There are no reliability concerns identified through the study of this outage. In the event of forced or weather‐related outages (i.e., ice storms), companies will activate individual transmission emergency operations centers to coordinate restoration of service to customers. No major constraints have been identified that could significantly impact reliability for the 2010/2011 winter. Companies continuously evaluate the transmission system to identify any future constraints that could significantly affect reliability. These future constraints and proposed solutions are annually published in transmission expansion plans and other regional reliability studies for the winter.

Regional Reliability Self‐Assessm
ents
Regional Reliability Self-Assessments
106 NERC 2010/2011 Winter Reliability Assessment
Table SERC‐5: Central Expected Under‐construction, Planned, Conceptual or Transmission Transmission Project Name Transmission Type
(Under Construction, Planned, or Conceptual)
In‐Service Date(s)
Brown North‐West Garrard In‐service 04/2010 Maury‐Rutherford In‐service 04/2010 Higby Mill‐West Lexington In‐service 05/2010 Huntsville‐McCreary In‐service 05/2010 Johnsonville‐South Jackson In‐service 06/2010 Mayfield‐Golo In‐service 06/2010 Miller‐Holly Springs In‐service 06/2010 Wheeler‐Maury In‐service 06/2010 Middletown‐Collins In‐service 06/2010 Mill Creek‐Hardin County In‐service 06/2010 Rutherford‐Almaville In‐service 06/2010 Trinity‐Cullman In‐service 06/2010 Widows Creek‐Oglethorpe In‐service 06/2010 Widows Creek‐Oglethorpe In‐service 06/2010 Resaca‐Moss Lake Under construction 10/2010 Rutherford‐Christiana Under construction 10/2010 Transformer Project: Bull Run, Install a single phase 500‐161‐26.4‐13.2 kV to replace failed transformer
In‐service 05/2010
Transformer Project: Moss Lake, GA, Install four, single phase 500‐161 kV transformers
In‐service 06/2010
Although no major constraints have been reported for the upcoming winter, repairs at Wolf Creek Dam and the resulting lowered level of Lake Cumberland are expected to be an issue within southern Kentucky and will subsequently result in reduced availability of the Wolf Creek hydroelectric generating units. A subsequent outage of both Cooper units during peak load periods can result in unacceptably low voltages on the 161 kV transmission system in the area. Entities within this area are continuing to assess the situation with the development of operating guides for this specific scenario. Possible mitigation measures include use of the Laurel Dam hydroelectric generating unit for support (if possible), use of the Wolf Creek hydroelectric units for either real or reactive support, or both (if possible), and, or load shedding in the area.
Operational Issues Individual monthly, weekly, and daily operational planning efforts performed by various companies within the subregion take into consideration demand and unit availability. This helps to address any inadequacies as well as mitigate these risks. Based on recent entity planning studies that have been conducted, no generation or operational problems have been identified. Most entities have very small amounts of variable resources and therefore, they do not have special operating procedures with regard to variable resources. Approximately 400 MW of wind capacity contracts will be integrated onto the system during this timeframe. Entities do not anticipate having any operational changes or concerns with the integration of

Regio
nal R
eliability Self‐A
ssessmen
ts Regional Reliability Self-Assessments
NERC 2010/2011 Winter Reliability Assessment 107
these wind resources. In addition, there are no reliability concerns with the use of high levels of Demand Response resources or minimum demand and over‐generation scenarios for the upcoming season. In addition, no environmental/regulatory restrictions or unusual operating conditions are expected to affect the reliability of the Central subregion this winter.
Reliability Assessment The total aggregate internal demand for the 2010/2011 winter is forecast to be 44,144 MW for the Central subregion; this is 2,210 MW (5.3 percent) higher than the 2009/2010 actual winter peak of 41,934 MW (January 2010). The projected January 2011 winter peak existing, anticipated and prospective reserve margins for the utilities in the subregion are 18.1, 19.4, and 19.4 percent respectively compared to 28.0, 28.0, and 28.9 percent respectively last winter. The drop in reserve margins from last winter is due to data reporting changes that have improved the granularity and reliability of data received by the entities within the Central subregion. The reserve margins are consistent with those reported in the 2008/2009 winter assessment period. The subregion does not have a Regional or subregional marginal target for comparison purposes. Projected margins are above the NERC Reference Margin Level of 15 percent, indicating that capacity resources are expected to be adequate to supply the projected firm winter demand. The reserve margin analysis in company‐integrated resource plans incorporates sensitivities on demand and unit availability, production cost, purchase power availability, unserved energy cost, and varying reserve margin levels. Resource planning efforts also take into consideration demand, weather, economic growth, transmission capability, and other drivers through probabilistic assessments of reliability under uncertainty. Accounting for these parameters helps to address any inadequacies in achieving the desired reserve margins. Impacts of increased cost of additional reserves and reliability events to the customer are minimized. If resource inadequacies cause the reserves to be reduced below the desired levels, companies within the subregion can make use of purchases from the short‐term markets in the near‐term and various ownership options in the long‐term, as necessary. On average for the winter period, 49,935 MW of internal resources and 1,781 MW of capacity transactions, which account for internal resources of non‐reporting parties and for external resources were reported. These resources are considered to be able to meet the NERC Reference Margin Level for the 2010/2011 winter. Companies within the subregion maintain individual criteria to address any problems with stability issues. No stability issues have been identified that could affect system reliability during the 2010/2011 winter. Criteria for dynamic reactive requirements are addressed on an individual company basis. Utilities employ study methods designed to assess dynamic reactive margins. Programs such as Reactive Monitoring Systems give operators an indication of reactive reserves within defined zones on the system. Utilities within the Central subregion are not anticipating reliability concerns for the upcoming winter. Monthly, weekly, and daily resource planning efforts take into consideration demand and unit availability. This helps to address any inadequacies as well as mitigate risks.
Regional Reliability Self‐Assessm
ents
Regional Reliability Self-Assessments
108 NERC 2010/2011 Winter Reliability Assessment
SERC‐Delta The Delta subregion geographically covers portions of Louisiana, Arkansas, Missouri, northeastern Oklahoma, western Mississippi, southeastern Texas, and three counties of southeastern Iowa.
Demand The total aggregate internal demand for the 2010/2011 winter is forecast to be 23,005 MW. This forecast is 941 MW (4.3 percent) higher than the forecast 2009/2010 winter Total Internal Demand of 22,064 MW and 2,947 MW (11.4 percent) lower than the actual 2009/2010 winter peak of 25,952 MW. The 2009/2010 actual winter peak was 3,888 MW (17.6 percent) higher than the forecasted 2009/2010 winter total internal peak demand. Last year’s actual winter peak was higher due to an unusually cold winter. The Delta subregion set a new all‐time winter peak demand in January 2010. The actual winter peak demand does take into account energy efficiency, diversity stand‐by load, and additions for non‐member load but cannot be broken out, whereas the forecast internal peak demand values can be broken out by these factors. The 2010/2011 winter demand forecast is based on weather‐normalized studies that produce new econometrically based forecasts of commercial and industrial load, future economic/demographic conditions, and historical data. Distribution cooperative personnel assess the likelihood of these potential new loads and a probability‐adjusted load is incorporated into a cooperative load forecast. Forecasts for the upcoming winter were adjusted to reflect a milder winter and increased energy usage of electric heaters. However, predictions continue to take into account the impacts of increased energy efficiency and conservation, and an economic recession. Demand Side Monitoring (DSM) programs among the utilities within the subregion include traditional industrial and large commercial interruptible rate programs and a range of conservation and load management programs for all customer segments. The terms and conditions of these tariffs permit load curtailment at anytime of the year, including winter months. The amount of interruptible load can vary from year‐to‐year because of changes in customer operations, adding or removing customers from participation within interruptible rate programs, and increasing or decreasing the amount of interruptible load under contract. There have not been any significant changes in the amount and availability of load management and interruptible demand in recent years. Entities within this subregion reported 3.5 percent of Total Internal Demand (TID) as Demand Response that can reduce peak demand. Measurements and verification for interruptible Demand Response programs for larger customers are conducted on a customer‐by‐customer basis. This includes an annual review of customer information and firm load requirements. Compliance is determined by a review of customer load data as related to the terms and conditions of the electric rate schedule. Various energy‐efficiency programs are offered within the subregion. Examples of these voluntary programs are home energy audits, CFL lighting, and Energy Star‐rated washing machines, dishwashers, heat pumps, and air conditioners. In general, the programs are available for every customer class and provide incentives for improvements that go beyond established efficiency standards. Companies within the subregion adhere to the measurement and verification (M&V) protocol established by the regulating entity. Utilities plan to offer these types of programs as long as they are determined to be cost effective. M&V programs measure demand, energy savings and costs for each of the energy‐efficiency programs. M&V programs help to improve energy‐efficiency programs and determine the cost effectiveness of

Regio
nal R
eliability Self‐A
ssessmen
ts Regional Reliability Self-Assessments
NERC 2010/2011 Winter Reliability Assessment 109
each program. The current forecast includes energy‐efficiency programs that have received state regulatory approval and incorporated into the sales and load forecasts. Load scenarios for outage planning purposes are developed regularly to address variability issues in demand. These load scenarios include load forecasts based on 50/50 weather forecast, high and low load scenarios for energy sales, alternative capacity factors, historical temperature probabilities and economic conditions including the effects of the recovering economy. Load scenarios for load‐flow analyses in transmission planning are also developed and posted to OASIS. Some of these scenarios developed within the subregion were reported to be based on an assumption of extreme weather, which were more severe than the expected peaking conditions but less severe than the most severe conditions found in the historical records. Special analyses are performed to examine expected peak loads associated with cold fronts, ice storms, hurricanes, and heat waves. These analyses are performed on an ad‐hoc basis and may be conducted for various parts of the Delta subregion.
Generation Companies within the Delta subregion expect to have the following capacity available on‐peak. This capacity is expected to meet demand during this time period. Variable capacity is limited for the upcoming season and is not considered toward satisfying peak capacity requirements (SERC‐6). Anticipated hydroelectric conditions are near normal for the upcoming winter. Reservoirs are currently near 100 percent moving into the fall and winter period. Reservoir levels are sufficient to meet both peak demand and the daily energy demand throughout the winter. If river levels are inadequate to operate the hydroelectric facility at maximum capacity, agreements are in place to serve demand with other firm energy contracts and transmission. Utilities within the subregion are not currently experiencing or projecting to experience any conditions that would affect capacity. Fuel supplies are anticipated to be adequate. It is common amongst the entities to rely on a portfolio of firm‐fuel resources to ensure adequate fuel supplies to generating facilities during projected winter peak demand periods. Those resources include nuclear and coal‐fired generation that are relatively unaffected by winter weather events, fuel oil inventory located at the dual‐fuel generating plants, approximately 10 billion cubic feet (BCF) of natural gas in storage at a company‐owned natural gas storage facility, and short‐term purchases of firm natural gas generally supplied from other gas storage facilities and delivered using firm gas transportation contracts. Typically, natural gas supplies are limited only when there are hurricanes within the Gulf of México . There is access to local gas storage to offset typical gas curtailments. This mix of resources provides diversity of fuel supply and minimizes the likelihood and impact of weather, fuel supply, and fuel transportation conditions that might otherwise reduce capacity. Close business relationships are maintained with coalmines, natural gas producers and pipelines, gas producers, and railroads that serve its coal‐fired power plants. These business relationships have been beneficial to ensure adequate fuel supplies are on hand to meet load requirements.

Regional Reliability Self‐Assessm
ents
Regional Reliability Self-Assessments
110 NERC 2010/2011 Winter Reliability Assessment
Table SERC‐6: Delta Winter 2010/2011 Capacity Breakdown Capacity Type Winter 2010/2011 (MW) Existing‐Certain 39,400
Wind 0 Solar 0 Biomass 0 Hydroelectric 256
Existing‐Other 4,390 Wind 0 Solar 0 Biomass 0 Hydroelectric 0
Energy Only 1,507 Existing‐Inoperable 1,403 Future Planned 0 Wind 0 Solar 0 Biomass 0 Hydroelectric 0 Future Other 0 Wind 0 Solar 0 Biomass 0 Hydroelectric 0
No current scheduled outages are reported for this winter although routine scheduled maintenance outages are scheduled for some generating units during the winter period. Outage plans are developed and coordinated so that anticipated loads can be met with available resources. There are no other anticipated system conditions expected for the winter.
Capacity Transactions Delta subregional utilities expect the following imports and exports for the upcoming 2010/2011 winter. These have been accounted for in the reserve margin calculations for the subregion. Utilities within the subregion use certain emergency short‐term imports, transfers, or contracts in the form of reserve sharing to meet the demands of its load. All contracts for these imports and exports are considered to be backed by firm transmission, tied back to specified generators and are used in calculating Delta’s reserve margins. No imports are based on partial path reservations. The majority of the contracts are not LDCs, but the LDCs that are in the subregion all use make‐whole contracts. The utilities in the subregion do not depend on outside purchases or transfers from other regions or subregions to meet their demand requirements. Entities within the Delta subregion participate in reserve sharing groups for their external resources. These sharing groups allow entities to receive emergency short‐term imports from remote balancing authorities within SPP RE Region as well as from the Delta subregion.

Regio
nal R
eliability Self‐A
ssessmen
ts Regional Reliability Self-Assessments
NERC 2010/2011 Winter Reliability Assessment 111
Table SERC‐7: Delta Subregional Imports/Exports
Transaction Type Winter 2010/2011 (MW) Firm Imports (Internal Subregion) 0 Firm Exports (Internal Subregion) 0 Non‐Firm Imports (Internal Subregion) 0 Non‐Firm Exports (Internal Subregion) 0 Expected Imports (Internal Subregion) 0 Expected Exports (Internal Subregion) 0 Firm Imports (External Subregion) 2,760 Firm Exports (External Subregion) 3,988 Non‐Firm Imports (External Subregion) 0 Non‐Firm Exports (External Subregion) 0 Expected Imports (External Subregion) 0 Expected Exports (External Subregion) 0
Transmission The following table shows bulk power system transmission since the 2009 winter categorized as under construction, planned, or conceptual that is expected to be in‐service for the upcoming 2010/2011 winter. No new technologies have been put in service since the last winter, but entities are replacing obsolete exciter controls with highly developed systems. Utilities do not expect any delays in meeting in‐service dates for projects to be completed this winter. No unexpected significant transmission facility outages that would affect bulk power system reliability were reported for the 2010/2011 winter period. Any planned maintenance outages would be studied to identify impacts on system reliability. Several improvement projects are planned to be in‐service by the end of 2010 to enhance bulk system reliability. These include 115 kV through 161 kV projects to improve line loading and voltage conditions. Other projects that have been completed help alleviate constraints when importing into the south Louisiana area. A 115 kV series reactor was installed in North Louisiana to help reduce line loadings on the local 115 kV system. No transmission constraints are expected to significantly impact bulk system reliability for the upcoming winter. Several entities participate in the SERC NTSG 2010/2011 Winter Reliability Study. The preliminary results of this study indicate that transfer limits for Entergy imports are at or above 2,000 MW or the transfer test level for the 2010/2011 winter peak. Those Entergy imports limited to 2,000 MW are due to the McAdams 500/230 kV autotransformer for the loss of the McAdams ‐ Lakeover 500 kV flowgate. This flowgate, which is located near a 500 kV tie with TVA, can be constrained due to excess generation on the interface along with transactions across the interface. Any real‐time operating limits can be addressed using the appropriate NERC operating procedures. Additional fans were added to the McAdams autotransformer in July 2008 to increase its rating and further upgrades have also been identified by Entergy in the area with a projected completion date of 2011.

Regional Reliability Self‐Assessm
ents
Regional Reliability Self-Assessments
112 NERC 2010/2011 Winter Reliability Assessment
Table SERC‐8: Delta Transmission Additions
Transmission Project Name Transmission Type
(Under Construction, Planned, or Conceptual)
In‐Service Date(s)
Dell– Manilla – Monette 161 kV line upgrade In‐service 04/2010 Jonesboro – Jonesboro North – Paragould South 161 kV line upgrade
In‐service 01/2010
Beebe 115kV capacitor bank In‐service 04/2010 Melbourn – Sage 161 kV line reconductor In‐service 06/2010 Warren East 115 kV capacitor bank In‐service 07/2010 Parkin – Twist 161 kV line upgrade Planned 12/2010 ANO – Russelville North 161 kV line Upgrade In‐service 05/2010 Russelville East – Russelville South 161 kV line Upgrade
In‐service 08/2010
Harrison East – Everton Road 161 kV line Upgrade In‐service 08/2010 Addis – Cajun 230 kV line Upgrade Planned 12/2010 Snakefarm – Kenner 115 kV line Upgrade In‐service 03/2010 Bogalusa – Adams Creek 230 kV line Upgrade In‐service 01/2010 Indianola – Greenwood 115 kV line In‐service 06/2010 Delhi 115 kV substation 10 ohm series reactor In‐service 10/2009 Frostkraft to Rilla 115 kV line upgrade In‐service 06/2010 Grand Gulf to Baxter Wilson 500 kV line In‐service 04/2010 South Jackson – Florence 115 kV line In‐service 04/2010 Newton Bulk – Holly Springs line upgrade In‐service 12/2009 Temco – Shepard 138 kV line upgrade In‐service 09/2010 Dayton Bulk – Cheek – South Beaumont 138 kV line upgrade
Under construction 12/2010
Donaghey‐Conway South In‐service 4/2010 Park‐Talequah In‐service 3/2010 Troy‐Lincoln In‐service 5/2010 Camp Clark‐Lamar In‐service 6/2010 Hyder Hill‐Stockton (AEC) In‐service 6/2010 Marion Tap‐Spalding In‐service 6/2010 Camp Clark‐Hyder Hill In‐service 6/2010 Edmonson‐Gravois In‐service 6/2010 North Warsaw‐Edmonson In‐service 6/2010 Stockton‐Morgan In‐service 6/2010 Fredericktown‐Wedeken Tap Sec. 1 Planned 11/2010 Fredricktown‐Fredricktown (UE) Planned 11/2010
To address transfer capability studies, some entities currently use an Available Flowgate Capability (AFC) process to calculate available transfer capability and evaluate transmission service requests in the day one to month 18 timeframe. Because of the inherent granularity and update frequency provided by the AFC process, specific seasonal transfer capabilities are not calculated. Entities are also currently participating in the SERC NTSG 2010/2011 Winter Reliability Study. This study, which has not yet been finalized, tests transmission transfer capabilities between the Delta subregion and other SERC subregions. The analyses performed to calculate the transfer limits presented in the SERC NTSG

Regio
nal R
eliability Self‐A
ssessmen
ts Regional Reliability Self-Assessments
NERC 2010/2011 Winter Reliability Assessment 113
2010/2011 Winter Reliability Study consider all transmission elements identified by participating member companies within SERC.
Operational Issues No reliability concerns are anticipated for the upcoming winter. Resource availability, fuel availability and hydroelectric conditions are expected to be normal. Loss‐of‐Load studies are performed annually for the regulated utilities within the subregion for the current year based on updated load forecast and unit availability data. The long‐term test of resource adequacy is met by achieving an adequate planning reserve margin (approximately 16.85 percent for various utilities in the subregion). Entities within the subregion reported no special operating procedures resulting from the integration of variable resources. There are also no reliability concerns or operational impacts resulting from high levels of Demand Response resources, unusual operating conditions, local environmental or regulatory restrictions, or minimum demand and over generation from variable resources. If reliability issues do occur with minimum demand and over generation, some entities report that energy schedules may curtail the output of the wind farms. Because there is limited Demand Response within this subregion, there are no reliability concerns using Demand Response to meet peak demands. Because Level 3 Energy Emergency Alerts (EEA‐3s) were issued in the Acadiana area during this past summer, the SPP ICTE will continue to monitor this area closely as part of its Reliability Coordinator function. There is no expectation that alerts will be issued this winter. A joint project between three transmission owners in the Acadiana area is currently in progress to construct new 230 kV facilities in the Acadiana area to continue to provide long‐term reliability benefits to the area. These projects are being constructed in two phases and barring unforeseen circumstances, the project’s in‐service dates are on schedule. Phase 1, which is currently under construction and scheduled to be completed by 2011 summer includes the following major components:
Addition of a new 500‐230 kV transformer and 230 kV facilities at the existing Richard substation
Construction of a new 230 kV transmission line from the Richard substation to a new Sellers Road 230 kV switching station
Construction of a new 230 kV transmission line from the new Sellers Road 230 kV switching station to a new Segura 230‐138 kV substation including the addition of a new 230‐138 kV transformer
Construction of a new 230 kV transmission line from the new Sellers Road 230 kV switching station to the existing Meaux 138 kV substation including the addition of a new 230‐138 kV transformer
Construction of a new 138 kV transmission line from the new Segura substation to the existing Moril 138 kV substation
Phase 2, which is currently in progress and scheduled to be completed by 2012 summer includes the following major components:
Addition of a second 500‐230 kV transformer at the existing Wells substation

Regional Reliability Self‐Assessm
ents
Regional Reliability Self-Assessments
114 NERC 2010/2011 Winter Reliability Assessment
Construction of a new 230 kV line from the Wells substation to the existing Labbe 230 kV substation
Construction of a second 230 kV line from the existing Labbe 230 kV substation to the existing Bonin 230 kV substation
Construction of a new 230 kV line from the existing Labbe 230 kV substation to the new Sellers Road 230 kV substation
Reliability Assessment Analysis The total aggregate internal demand for the utilities in the Delta subregion for the 2010/2011 winter is forecast to be 23,005 MW and is 2,947 MW (11.4 percent) lower than the actual 2009/2010 winter peak of 25,952 MW. January 2010 peak set a new all‐time peak for the Delta subregion largely due to the extreme cold weather. The projected February 2011 winter peak existing, anticipated and prospective reserve margins for the utilities within the subregion are 72.0, 72.0, and 85.0 percent respectively compared to last year’s forecast (February 2010) reserve margins of 85.4, 85.9, and 86.7 percent, respectively. The decrease is largely due to more complete reporting utilizing NERC’s capacity definitions and the move to unit level data collection. Projected margins are above the NERC Reference Margin Level of 15 percent, indicating that capacity resources are expected to be adequate to supply the projected firm winter demand.
Loss‐of‐Load studies are performed annually for the regulated utilities for the current year based on updated load forecast and unit availability data. The long‐term resource adequacy studies are met by achieving approximately 16.85 percent planning reserve margin for summer peak conditions. During the winter, entities within this subregion are typically peaking at less than 80 percent of the summer peak. Therefore, winter peak reserve margins are generally well above those for the summer. There are no required state reserve margins for the subregion. Due to NERC’s new reporting requirements and capacity definitions, the 85.9 percent peak reserve margin is higher than previously reported as it includes both committed and uncommitted resources within the subregion. This revised calculation methodology does not reflect the deliverability of certain uncommitted resources. Discounting the impact of uncommitted resources, the subregion expects the upcoming winter peak reserve margin to be adequate. On average for the winter period, 45,146 MW of internal resources and 1,194 MW (net exports) of capacity transactions, which account for internal resources of non‐reporting parties and for external resources were reported during the time period. These resources are considered to be able to meet the NERC Reference Margin Level for the 2010/2011 winter. Various utility resource planning departments in the subregion conduct studies annually (either in‐house or through contract) to assess resource adequacy. Sophisticated modeling is used throughout the subregion in all phases of the studies. An example of this type of modeling is the Entergy Reliability Analysis with Interruptible Loads (ERAILS) model that is used to perform resource requirements analyses. The ERAILS model uses a Monte Carlo statistical technique to estimate each day’s “actual” peak load based on the forecast load and the load forecast variance. The total resources available to serve that load is based on available resources, forced outages, and the characteristics of each resource, and the probability of being able to meet the load, plus off‐system sales and operating reserves. The fundamental objective of the process is to identify the amount of incremental resources necessary to serve firm load at a reliability level of no more than one day/ten years loss‐of‐load expectation and to serve interruptible retail and limited‐firm wholesale loads with an average of ten or fewer days of

Regio
nal R
eliability Self‐A
ssessmen
ts Regional Reliability Self-Assessments
NERC 2010/2011 Winter Reliability Assessment 115
interruption during the year. Studies like these are used to ensure resources are available at the time of system peak. Some companies have reported that results are approved by the board of directors internally. Subregional transmission planning departments also conduct sophisticated studies to ensure transfer capability is adequate under various contingency conditions. The balancing authority has a full requirements contract to ensure studies are performed, upon request of the supplier, by the transmission provider. These studies will evaluate the availability of firm transmission from resources. All resources were considered to meet the criteria or target margin level for last winter and for the upcoming winter. As required by NERC Reliability Standards, companies throughout the subregion individually perform studies to assess transient dynamics, voltage and small‐signal stability issues for winter conditions in the near‐term planning horizons as required by NERC Reliability Standards. For example, Entergy’s annual compliance study for 2009 selected a 2010 light load. Using this case, a dynamic study was performed on Entergy’s transmission system under NERC Reliability Standards TPL‐001‐0 through TPL‐004‐0. A smart screening tool, the Fast Fault Screening (FFS) Module of Physical and Operational Margins – Transient Stability (POM‐TS) was used to rank the contingencies, and the worst contingencies were simulated for single line ground or three phase fault, with normal clearing or delayed clearing to verify if there were any instability problems. The results were compliant with NERC Reliability Standard TPL‐001‐0 through TPL‐004‐0, and found in the 2009 “Assessment of Entergy’s Transmission System.” As part of annual winter assessments, some companies model single and multiple contingencies across the system. In stability simulations, generator reactive power outputs were monitored and were found to stay within adequate limits. These studies confirm that the available reactive power resources (generators, capacitors, reactors, SVCs) are adequate for the 2010/2011 winter and no critical impacts to the bulk power system are expected. While there are no common subregion‐wide criteria to address transient dynamics, voltage and small‐signal stability issues, some utilities have noted they adhere to voltage schedules and voltage stability margins. There are no other anticipated reliability concerns for the 2010/2011 winter. Entities within the Delta subregion continue to update their Curtailment Process and Emergency Response Plans each year. These plans are periodically tested through drills where opportunities for process improvements are subsequently identified. As necessary, entities will implement transmission‐wide and local area procedures, including re‐dispatch and the implementation of operating guidelines, to maintain reliability for the 2010/2011 winter.

Regional Reliability Self‐Assessm
ents
Regional Reliability Self-Assessments
116 NERC 2010/2011 Winter Reliability Assessment
SERC‐Gateway The Gateway subregion geographically covers the southern two‐thirds of Illinois and much of eastern Missouri, plus a small load pocket in northwestern Missouri. The St. Louis metropolitan area is the largest load center in the subregion, which is comprised of the following entities: Ameren, including its utility operating companies of AmerenUE, AmerenCIPS, AmerenIP, and AmerenCILCO; IMEA (Illinois Municipal Electric Agency), Prairie Power, Inc. (formerly Soyland Power Cooperative), SIPC (Southern Illinois Power Cooperative), CWLP (City of Springfield, IL City Water, Light & Power), CWLD (City of Columbia, MO), and Electric Energy, Inc. Ameren’s operating companies make up the vast majority of the Gateway subregion service territories, transmission system, and load.
Demand The total aggregate internal demand for the utilities in the Gateway subregion for the 2010/2011 winter is forecast to be 15,181 MW based on the sum of forecasted loads. This demand is 459 MW (2.9 percent) lower than the 2009/2010 winter forecast Total Internal Demand of 15,640 MW and 7 MW (‐0.05 percent) less than the actual 2009/2010 winter peak of 15,188 MW. The modest decrease in the 2010/2011 forecast load compared to the 2009/2010 forecast load is the result of a return to full capacity by one large customer offset by expected declines in output from other members of the industrial class. Despite expectations of economic rebound in 2010/2011, current forecasts reflect lagging economic activity, most significantly in the industrial customer class. The normal forecast weather assumptions are based on ten to 30 years of historical data along with adjustments for observation practices, load growth and economic conditions. The actual winter peak demand does take into account energy efficiency, diversity stand‐by load, and additions for non‐member load but cannot be broken out, whereas the forecast internal peak demand values can be broken out by these factors. The Gateway forecast 2010/2011 winter peak load is approximately 79.4 percent of the forecast 2010 summer peak load. As the subregion is overwhelmingly summer peaking, the entities within the subregion reported no significant Demand Response, only four MW or 0.03 percent of Total Internal Demand, as Demand Response that can reduce peak demand in the winter. Demand Response programs currently in place are used to reduce summer peak load, such as direct‐load control of air conditioners, and have not been forecasted to make a material impact on the peak forecast for 2010/2011 winter. Many of the Demand Response programs consist of direct‐load control and interruptible load. The entities within the subregion report that Demand Response is a nominal 0.02 percent (four MW) of Total Internal Demand. For measurement and verification of various programs, some entities use third‐party auditing to conduct impact and process evaluations. These entities report that the evaluations are conducted annually with a comprehensive report due at the end of the program cycle. Several entities within this subregion have made significant investments in energy‐efficiency programs that are more focused on reducing summer peak demand. Programs that are available for customer use include energy‐efficient lighting rebates, commercial standard and customization products, commercial building assessments and new building design, residential appliance recycling, energy audits, and HVAC rebates. Future programs consist of residential HVAC installation and diagnostic programs. Verification and measurement in most programs is done by third‐party vendors. The vendors review the impact of the programs and evaluate efficiencies. Evaluations are conducted periodically and reviewed to identify any areas of improvement.

Regio
nal R
eliability Self‐A
ssessmen
ts Regional Reliability Self-Assessments
NERC 2010/2011 Winter Reliability Assessment 117
Most entities in the subregion participate in the Midwest ISO market, which has promulgated rules regarding assessment of the peak demand forecast under its Module E tariff. Per this tariff, entities evaluate the standard error of the forecast, which reflects the statistical uncertainty around the forecast, as well as the elasticity of the peak demand with respect to weather. Other entities use software programs that develop regression models using multiple variables (historical data, load growth, population data, weather, etc). Weather uncertainty may be addressed in the model using average and extreme weather variables. This provides a range within which the actual demand and energy should fall for the modeling scenario. All of these models are developed individually using different variables to establish the best standard statistical tests. DSM programs are not commonly modeled separately since their impact is reflected in the peak demand information used for forecasting purposes. Economic conditions and trends are continuously monitored by some entities with input provided by consultants and forecast services. All of these measurements provide information to assess potential variability around the forecasted peak. In most cases, load forecasts explicitly address extreme winter conditions based on the lowest temperature experienced on average over a period used to calculate normal weather. The weather elasticity mentioned above is developed with consideration of only the highest few points of the load forecast, and therefore is applicable specifically to temperatures in the bottom of the expected winter temperature range. Some companies perform sensitivity analyses for extreme weather conditions for long‐term planning purposes. For short‐term planning, entities may use the most recent historical demand data with slight modifications due to anticipated load growth. Econometric models are commonly used for the residential class data. Specific customer projections may be used for the commercial and industrial class data. Results of the econometric and end‐use forecast are checked for comparison with the trends from regression analysis of five and 15 years of history.
Generation Member companies within the Gateway subregion expect to have the following aggregate on‐peak capacity. This capacity is expected to help meet demand during this time period. The generation resources to serve the Gateway loads for this winter are predominantly located within the Gateway subregion. Entities report that the expected values for biomass are calculated by the landfill gas operator based on the methane gas produced or sustained output of the facility. Hydroelectric capacity of 817 MW, including 440 MW of pumped storage generation, is expected to be available on‐peak for the winter. Hydroelectric conditions are expected to be normal and reservoir levels are expected to be sufficient. Variable resources have not been reported for this winter by the Gateway members in their breakdown of capacity resources. Although not reported, a 100 MW wind farm is connected to the Ameren‐Illinois transmission system though its capacity is not included in the subregional totals. Another 150 MW wind farm is under development, but is not expected to be commercially available before this winter. If wind resources had been reported, Midwest ISO business practices would have only allowed members to include up to eight8 percent of the nameplate wind capability in their Module E capacity resource schedule.

Regional Reliability Self‐Assessm
ents
Regional Reliability Self-Assessments
118 NERC 2010/2011 Winter Reliability Assessment
Table SERC‐9: Gateway Winter 2010/2011 Capacity Breakdown
Capacity Type Winter 2010/2011 Existing‐Certain 23,167
Wind 0 Solar 0 Biomass 5 Hydroelectric 377 Pumped Storage 440
Existing‐Other 0 Wind 0 Solar 0 Biomass 0 Hydroelectric 0
Energy Only 0 Scheduled Outage 707 Existing‐Inoperable 575 Future Planned 0
Wind 0 Solar 0 Biomass 0 Hydroelectric 0
Future Other 0 Wind 0 Solar 0 Biomass 0
Hydroelectric 0 Entities do not expect weather to impact the utility generation in the subregion. Coal is sufficiently available to service coal‐fired plants. Firm gas transportation or oil back‐up for the generating units is expected to be adequate as well. Reported seasonal generation outages and inoperable units within the subregion include the Grand Tower plant (552 MW), Shelby County units 1–8 (352 MW), Wood River units 1–3 (119 MW), Havana units 1–5 (228 MW), Meredosia unit 4 (200 MW) and Venice 1 CTG (30 MW). Required approvals and coordination have been obtained from the Midwest ISO and transmission owners to maintain reliability. The Midwest ISO monitors generation availability throughout its footprint and has procedures in place if generation shortfalls would occur.
Capacity On‐Peak The Gateway subregion reported the following imports and exports for the 2010/2011 winter. These firm imports and exports have been accounted for in the reserve margin calculations for the subregion. For most members, capacity purchases and sales are on firm transmission within the Midwest ISO footprint and direct ties with neighbors. Day‐to‐day capacity and energy transactions are managed by the Midwest ISO with security‐constrained economic dispatch and LMP. Under the Midwest ISO resource adequacy structure, capacity transactions do not point directly to generating resources but to ‘planning reserve credits’ associated with specific generators. As firm exports exceed firm imports with

Regio
nal R
eliability Self‐A
ssessmen
ts Regional Reliability Self-Assessments
NERC 2010/2011 Winter Reliability Assessment 119
significant generation resources remaining, the subregion is not dependent on outside imports or transfers to meet the demands of its load.
Table SERC‐10: Gateway Subregional Imports/Exports
Transaction Type Winter 2010/2011 (MW) Firm Imports (Internal Subregion) 0 Firm Exports (Internal Subregion) 0 Non‐Firm Imports (Internal Subregion) 0 Non‐Firm Exports (Internal Subregion) 0 Expected Imports (Internal Subregion) 0 Expected Exports (Internal Subregion) 0 Firm Imports (External Subregion) 3,705 Firm Exports (External Subregion) 5,418 Non‐Firm Imports (External Subregion) 0 Non‐Firm Exports (External Subregion) 0 Expected Imports (External Subregion) 0 Expected Exports (External Subregion) 0
Several contracts within the subregion are LDCs and are considered to be all make‐whole. Some entities report that capacity contracts are confirmed with either an Edison Electric Institute (EEI) or International Swaps and Derivatives Association, Inc. (ISDA) version of a Midwest ISO ‘Planning Reserve Credit’ confirmation, or derivatives thereof. This standard confirmation includes language to address failure to deliver and/or receive. Most of the Gateway entities reported that they are a part of the Midwest ISO and count on the Midwest ISO to manage the generation supply during emergencies. Most Gateway members also participate in the Midwest Contingency Reserve Sharing Group.
Transmission The following table shows bulk power system transmission additions that have been completed since the 2009/2010 winter, or are planned to be completed prior to the 2010/2011 winter, categorized as under construction, planned, or conceptual for the Gateway subregion. The Baldwin‐Rush Island 345 kV line is scheduled for completion this fall, and is the final line addition associated with the Prairie State Energy Center project (two coal‐fired units, 825 MW each). The line addition completes another 345 kV connection across the Mississippi River south of St. Louis. The Prairie State generation is scheduled for completion in two stages. The first unit should be commercial by the 2011 summer with the second unit to follow in the 2012 summer. The Prairie State switchyard and line connections were completed in December 2009.

Regional Reliability Self‐Assessm
ents
Regional Reliability Self-Assessments
120 NERC 2010/2011 Winter Reliability Assessment
Table SERC‐11: Gateway Expected Under Construction, Planned, or Conceptual Transmission
Transmission Project Name Transmission Type
(Under Construction, Planned, or Conceptual)
In‐Service Date(s)
Baldwin‐Rush Island 345 kV Line Under construction 11/2010 Cahokia‐Ashley 138 kV Line In‐service 05/2010 Conway‐Orchard Gardens 138 kV Line In‐service 05/2010 Conway‐Orchard Gardens 138 kV Line In‐service 05/2010 Mt. Vernon‐Ashley 138 kV Line In‐service 04/2010 Turkey Hill‐South Belleville 138 kV Line In‐service 04/2010 Cape‐Wedekind Tap 161 kV Line Under construction 10/2010 Gray Summit Substation 2nd 345/138 kV transformer
Under construction 12/2010
The second Gray Summit 345/138 kV 560 MVA transformer is scheduled for completion prior to the 2010/2011 winter. The transformer addition and associated 345 kV ring bus will reinforce the supply to the winter peaking load in southwest St. Louis County and Northeast Franklin County, Missouri. Some Gateway members are planning the expanded installation of phasor measurement equipment at various plants and substations around the subregion, to enhance the collection of pre‐ and post‐disturbance generation and transmission data. The selection of these Phasor Measurement Unit (PMU) installations has been coordinated through discussions with the Midwest ISO, and these installations will be made over the next few years to include some of the larger power plants and substations where phasor measurement is presently sparse or nonexistent. These installations, in combination with other such phasor‐measuring equipment installed elsewhere on the interconnected system, may provide another tool to operations personnel in assessing immediate near‐term conditions on the interconnected system. The additional data would also be available to enhance the performance of post‐mortem disturbance analyses. Gateway utilities have not scheduled any significant transmission facilities to be out of service this winter. All significant, planned transmission facility outages are scheduled for spring and fall during off‐peak conditions and are coordinated and approved by the Midwest ISO. Based on prior history, few transmission constraints are anticipated within the subregion for the 2010/2011 winter. However, it is expected that transmission facilities on the Gateway‐Delta‐Central interface will continue to experience heavy north‐to‐south flows during off‐peak conditions. Curtailment of non‐firm transactions through Transmission Loading Relief procedures presently mitigates the loading concerns. Transmission additions to build a Baldwin‐Grand Tower‐NW Cape‐Lutesville 345 kV line have been proposed as a permanent mitigation.
Operational Issues No special subregional operating studies have been performed for the 2010/2011 winter, although some individual company studies have been performed in addition to the seasonal assessment performed by the Midwest ISO. Based on these studies and previous winter operating experience, reliability problems are not expected on the Gateway transmission system for this winter. Capacity and energy emergency plans are in place to respond to issues due to extreme cold weather conditions. The Midwest ISO also has procedures in place to address reliability concerns.
Regio
nal R
eliability Self‐A
ssessmen
ts Regional Reliability Self-Assessments
NERC 2010/2011 Winter Reliability Assessment 121
As no new variable resource plants have connected to the Gateway subregion since last winter, entities have not reported any new operating procedures to accommodate the integration of these plants for the 2010/2011 winter. Although there are limited variable resources connected to the Gateway transmission system, agreements are in place to purchase wind energy from remote locations. These resources are considered to be a part of the Midwest ISO energy market and can be curtailed, if necessary, in the event of supply surplus or transmission congestion. The Midwest ISO can generally manage transmission flows through security constrained economic dispatch and Locational Marginal Pricing. During light load or minimum load conditions, too much generation may be operated causing over‐generation in the system. The continuing addition of variable resources, including wind generation in the subregion and throughout the Midwest exacerbates the concern for over‐generation. Some entities have reported that variable resources, particularly wind, have presented new operating challenges at minimum load levels, and the Midwest ISO has issued several minimum generation alerts, warnings, and emergencies as responses to those conditions. To comply with these Midwest ISO orders, some entities within the subregion have responded by taking generating units off‐line and by reducing online generating units to absolute minimum levels. No significant reliability concerns have been experienced or are expected due to Demand Response, minimum demand levels, or over‐generation from the integration of variable resources. Environmental and regulatory restrictions are a concern for some entities within the subregion. Environmental limits have been placed on several entity‐owned peaking units; however, these limits, to date, have not prevented these units from being used when needed for reliability or economic dispatch situations. The impact of Hazardous Air Pollutant regulatory restrictions and Illinois air permit emissions restrictions continue to be reviewed and studied. Overall, Gateway entities do not expect unusual operating conditions, that could affect reliability for the upcoming winter season.
Reliability Assessment Analysis The total aggregate internal demand for the utilities in the Gateway subregion for the 2010/2011 winter is forecast to be 15,181 MW based on the sum of forecasted loads, and is seven MW (‐0.05 percent) less than the actual 2009/2010 winter peak of 15,188 MW. The projected January 2011 winter peak existing, anticipated, and prospective reserve margins for the utilities in the subregion are 41.3, 41.3, and 41.3 percent, respectively, compared to last year’s forecasted (January 2010) reserve margins at 39.8, 39.8, and 42.8 percent, respectively. The slight changes are largely due to the decrease (459 MW) in forecast Total Internal Demand. Projected margins are above the NERC Reference Margin Level of 15 percent, indicating that capacity resources are expected to be adequate to supply the projected firm winter demand. Some entities within the Gateway subregion perform individual studies to assess the reliability of their individual systems. Some entities within the subregion participate in various study groups to assess the reliability of the system on a near‐term and long‐term basis. Some utilities have filed integrated resource plans with their local commissions, but there are no required state reserve margins for the utilities in the subregion. Members of the Midwest ISO are required by Module E of the Midwest ISO tariff to maintain an 11.94 percent planning reserve margin. This reserve margin is based on the latest Midwest ISO loss‐of‐load expectation (LOLE) studies considering all hours of the year and including expected summer peak conditions, which is higher. Gateway subregion utilities expect to have more than an 11.94 percent planning reserve margin for the 2010/2011 winter. The capacity and reserves acquired for the 2010 summer will be more than adequate to cover the load for the 2010/2011 winter

Regional Reliability Self‐Assessm
ents
Regional Reliability Self-Assessments
122 NERC 2010/2011 Winter Reliability Assessment
as the expected winter peak load is approximately 3,900 MW (20.6 percent) less than the summer peak load. Midwest ISO resource adequacy and operational procedures are located within the Midwest ISO Resource Adequacy Business Practice Manual108. A 50/50 load uncertainty was used in their latest LOLE analysis. A 90/10 load forecast was not done; however, if it were done it would not be expected to increase the reserve requirements significantly due to the geographical size and load diversity within Midwest ISO. It is expected that the use of a 90/10 forecast would increase demand by about five (5) percent above the 50/50 forecast level for the Gateway subregion. Capacity resources in the Gateway subregion are expected to be adequate for the upcoming peak‐demand winter. On average for the winter, 24,440 MW of internal resources and 1,751 MW (net exports) of capacity transactions, which account for internal resources of non‐reporting parties and for external resources, were reported during the time period. These resources are considered to be able to meet the NERC Reserve Margin Level for the 2010/2011 winter. Fuel supply in the area is not expected to be a problem and policies considering fuel diversity and delivery have been put in place throughout the area to ensure that reliability is not impacted. Several entities have policies, that take into account, contracts with surrounding facilities, alternative transportation routes, and alternative fuels. These practices help to ensure balance and flexibility to serve anticipated generation needs. Some Gateway entities maintain communication with suppliers of coal, natural gas, and oil to ensure that adequate fuel supplies are available and potential supply problems are known by all parties as soon as possible.
Companies within the Gateway subregion individually perform dynamic and static reactive power studies as part of their annual assessments to comply with NERC Standards TPL‐001 through TPL‐004. Some generating entities have reported that the procedures of the static reactive power studies are performed specific to the NERC Standard MOD‐025 testing requirements. Because load power factors are generally higher during the winter than during the summer and the loads are generally lower, this reduces the reactive power requirements in the subregion during the winter. For these reasons, and also based on prior assessment studies, most entities reported that no specific tests were performed for the 2010/2011 winter.
108 Midwest ISO Resource Adequacy Business Practice Manual can be found at: http://www.Midwest
ISOstates.org/OMSModuleEadopted27NOV07FINAL percent20.pdf

Regio
nal R
eliability Self‐A
ssessmen
ts Regional Reliability Self-Assessments
NERC 2010/2011 Winter Reliability Assessment 123
SERC‐Southeastern The Southeastern subregion is geographically composed of portions of the following states: Georgia, Alabama, Mississippi, and Louisiana, plus the panhandle portion of Florida. The Southern Electric System comprises the majority of the Southeastern subregion territory and load.
Demand The total aggregate internal demand for the 2010/2011 winter is forecast to be 42,473 MW. This is 733 MW (1.8 percent) higher than the forecast 2009/2010 winter Total Internal Demand of 41,740 MW and 6,269 MW (12.9 percent) lower than the actual 2009/2010 winter peak of 48,742 MW. The 2009/2010 actual winter peak was 7,001 MW (16.8 percent) higher than the forecasted 2009/2010 peak. Last year’s actual peak was higher due to an unusually cold winter evidenced by a new all‐time peak for the Southeastern subregion set in January 2010. Forecasts for the upcoming winter do reflect a slightly improving economy. Please note that the actual winter peak demand does take into account energy efficiency, diversity stand‐by load, and additions for non‐member load but cannot be broken out, whereas the forecast internal peak demand values can be broken out by these factors. The winter forecasted projection is based on average historical winter weather and is the sum of non‐coincident forecast data reported by utilities within the SERC Region. Most forecast assumptions are based on median (50/50) weather conditions. One Southeastern entity reported that these particular weather conditions are determined by using hourly dry bulb temperatures for six weather stations that are strategically located within their service area. A single “weighted average” is calculated for each hour. The weighted averages are derived based on the amount of load served near the weather stations as well as taking into consideration the weather patterns that cross the company’s territory. Entities factor historical years of weather data into their modeling processes to determine a median “expected normal” winter peak demand. Other entities use projections of percentages from the previous summer’s demand, using econometric time‐series analysis under normal weather conditions. This year’s forecast was reported to be based on actual data; the peak demand models have been updated to better reflect current conditions. Forecasts are relatively unchanged from last year’s projections. Demand Response programs are typically not used to reduce peak demand during the winter. External adjustments are normally made to the load and energy forecast for demand‐side programs; however, the majority of demand adjustments are not applied during winter months as most programs are designed for application during summer months. Adjustments are based on the size of customer load and price response to certain demand‐side programs in the system. The subregion has a mix of various Demand Response programs including real‐time pricing programs, distribution voltage reduction programs, interruptible demand, customer curtailing programs (voluntary/involuntary), and direct load control (irrigation, A/C and water heater controls). Some of the objectives of the program are as follows:
Help reduce the need to build or purchase capacity;
Respond to volatile wholesale energy markets;
Improve the efficiency (load factor) as well as the use of generation, transmission, and distribution systems;
Provide low cost energy to customers; and
Increase off‐peak kWh sales.

Regional Reliability Self‐Assessm
ents
Regional Reliability Self-Assessments
124 NERC 2010/2011 Winter Reliability Assessment
Entities within this subregion reported 1,797 MW or 4.2 percent of Total Internal Demand (TID) as Demand Response that can reduce peak demand. To address M&V, some entities have reported that two‐way communication devices have been used as a functionality to allow customers to perform M&V at any desired level. An entity also reports small pilot tests scheduled for 2010 regarding HVAC cycling and direct load for pool pumps. Within the subregion, various utilities have residential energy‐efficiency programs that may include educational presentations, home energy audits, compact fluorescent light bulbs, electric water heater incentives, heat pump incentives, EPA‐approved ventilation and air‐conditioning technology, energy‐efficient new‐home programs, Energy Star appliance promotions, loans or financing options, weatherization, programmable thermostats, and ceiling insulation. Commercial programs may include energy audits, lighting programs, and plan review services. Other programs such as business assistance/audits, weatherization assistance for low‐income customers, residential energy audits and comfort advantage energy‐efficient home programs promote reduced energy consumption, supply information and develop energy‐efficiency presentations for various customers and organizations. Utilities are also beginning to work with the State Energy Division on energy‐efficiency planning efforts. Training seminars addressing energy efficiency, HVAC sizing, and energy related end‐use technologies are also offered to educate customers. To address measurement and verification of energy efficiency and DSM programs, entities may use third parties to conduct impact/process evaluations for commercial programs or entities may use load response statistical models to identify the difference between the actual consumption and the projected consumption absent the curtailment event. Response may also be tracked and verified by the readings of meters, as well as testing residential and commercial summer load‐control programs for verification of demand reduction through generation dispatch personnel. Evaluations may be conducted annually with a comprehensive report due at the end of a program cycle. Reports are expected to determine annual energy savings and portfolio cost‐effectiveness. The 2010/2011 winter demand forecast is based on normal weather conditions, using normal/median weather, normal load growth and conservative economic scenarios. To assess variability, some subregional entities develop forecasts using econometric analysis based on approximately 30 to 40 year weather (normal, extreme, and mild), economics and demographics. Others within the subregion use the analysis of historical peaks, reserve margins, and demand models to predict variance. One entity who used demand models reported that winter peaks are projected for each of these weather years and then the peaks are ranked from the mildest to the most extreme. The median peak is typically used in its forecasting process to best determine normal weather conditions. Extreme historical data are normally used to derive an extreme forecast. The median forecast has been used in past studies because the mean and midpoint forecast tend to be impacted by particular values obtained in the extreme weather years, primarily during the 1980s and the winter of 2003. Variables are compared to actual weather conditions and adjusted to determine a forecast that is normal or extreme for the service area. Reserves are built into the system to take into account factors such as weather volatility and load forecast error. Companies continue to study the impacts of all factors to perfect their processes in determining peak demand. In some entity forecasts, economic assumptions are based on economic modeling results generated annually. Some entities report that for the 2010/2011 forecasts, revisions were made based on May 2010 economics. Forecast assumptions for the upcoming winter show continued population growth in the Region even though the growth has slowed due to the recession. However, forecasts

Regio
nal R
eliability Self‐A
ssessmen
ts Regional Reliability Self-Assessments
NERC 2010/2011 Winter Reliability Assessment 125
continue to reflect positive economic trends and customer growth in the long‐run but at slightly slower rates than last year’s projections. This decrease in expectations results in a lower forecast for winter energies and winter peak demand. Studies may be performed internally or contracted to consultants to provide load data based on load trends and weather forecasts.
Generation Utilities within the Southeastern subregion expect to have the following aggregate capacity on‐peak to help meet demand during this time period.
Table SERC‐12: Southeastern Winter 2010/2011 Capacity Breakdown
Capacity Type Winter 2010/2011 (MW) Existing‐Certain 60,968
Wind 0 Solar 0 Biomass 17 Hydroelectric 3,300
Existing‐Other 2,806 Wind 0 Solar 0 Biomass 0 Hydroelectric 0
Energy Only 0 Existing‐Inoperable 0 Future Planned 448
Wind 0 Solar 0 Biomass 0 Hydroelectric 0
Future Other 0 Wind 0 Solar 0 Biomass 0 Hydroelectric 0
For planning purposes, Future‐Planned biomass generation is included in an entity Integrated Resource Plan at half the nameplate capacity for converted boilers and at nameplate capacity for units receiving new boilers. Landfill gas facilities are included at their nameplate ratings. Contracts with external parties for these resources generally require proof of capacity and allow for capacity payment penalties for excessive unavailability and derating events. Variable resources may be evaluated by analyzing historical or projected output profiles. The result is a determination of the comparative capacity value to that of a typical combustion turbine on the system. Currently no variable resources are planned for the upcoming season. Hydro conditions and reservoir levels are expected to be sufficient for the upcoming winter season. Based on current weather and operational forecasts, it appears that total hydro‐generation output will be normal to slightly below normal. Long‐range precipitation forecasts released in July indicate increased probability of below normal rainfall in the winter‐spring timeframe. If lower than normal

Regional Reliability Self‐Assessm
ents
Regional Reliability Self-Assessments
126 NERC 2010/2011 Winter Reliability Assessment
rainfall occurs, it is anticipated that reservoirs can be managed to meet the short‐duration peak demand that is typical of winter hydro‐peaking operations. Daily system load demands will be met by combining hydro‐generation with other generating resources. Utilities in the subregion are not experiencing or expecting conditions (e.g., weather, fuel supply, fuel transportation) that would reduce capacity for the 2010/2011 winter. Supplies are expected to be adequate and communications are in place to reduce any unanticipated impacts. The utilities anticipate only regular scheduled generation maintenance totaling 315 MW throughout the winter. Although multiple large units are planned to have overlapping outages during other months this winter, plans are already in place to minimize possible negative impacts on reliability. These outage plans are routinely monitored and revised if necessary to ensure availability of adequate reserves. No other units are planned to have outages this winter, and there are no expected unit retirements.
Capacity Transactions Southeastern utilities reported the following imports and exports for the 2010/2011 winter. The majority of these imports and exports are backed by firm contracts (none were reported to be based on partial path reservations), with approximately 4,659 MW of the reported capacity transactions covered by LDCs. Of this amount, 3,417 MW are make‐whole contracts, as defined by FERC in Order No. 890. These imports and exports are backed by firm contracts and have been included in the reserve margin calculations for the subregion. While some entities participate in reserve sharing groups and others have the ability to use Capacity Benefit Margin capability, if needed for reliability; overall, the subregion is not dependent on outside imports or transfers to meet the demands of its load.
Table SERC‐13: Southeastern Subregional Imports/Exports
Transaction Type Winter 2010/2011 (MW) Firm Imports (Internal Subregion) 0 Firm Exports (Internal Subregion) 0 Non‐Firm Imports (Internal Subregion) 0 Non‐Firm Exports (Internal Subregion) 0 Expected Imports (Internal Subregion) 0 Expected Exports (Internal Subregion) 0 Firm Imports (External Subregion) 3,852 Firm Exports (External Subregion) 4,691 Non‐Firm Imports (External Subregion) 0 Non‐Firm Exports (External Subregion) 0 Expected Imports (External Subregion) 0 Expected Exports (External Subregion) 272
Transmission The following table shows bulk power system transmission that either has entered or is expected to enter service between the 2009/2010 and 2010/2011 winters.

Regio
nal R
eliability Self‐A
ssessmen
ts Regional Reliability Self-Assessments
NERC 2010/2011 Winter Reliability Assessment 127
Table SERC‐14: Southeastern Transmission Expected In‐service Since 2009/2010 Winter
Transmission Project Name Transmission Type (Under Construction,
Planned, or Conceptual) In‐Service Date(s)
C.A.E.S.‐McIntosh In‐service 03/2010 Trickem Jct‐Trickem In‐service 03/2010 CAES Unit 4‐CAES Sw In‐service 04/2010 CAES Unit 5‐CAES Sw In‐service 04/2010 Brentwood‐Pine Forest In‐service 05/2010 Lay Dam‐Mitchell Lake In‐service 05/2010 Three Rivers Road‐Vestry Tap In‐service 05/2010 MS Chemical‐Chevron Cogen In‐service 05/2010 Swainsboro‐Altma Jct In‐service 05/2010 Belleville‐Castleberry Jct In‐service 06/2010 Belleville‐Repton In‐service 06/2010 Brundidge‐Brundidge City In‐service 06/2010 Brundidge City‐Clio In‐service 06/2010 Brundidge Ind‐Brundidge Sw In‐service 06/2010 C.A.E.S.‐McIntosh In‐service 06/2010 East Lake Road‐Jackson Creek In‐service 06/2010 East Lake Road‐Ola In‐service 06/2010 East Social Circle‐East Social Circle Junction In‐service 06/2010 Jim Moore Road‐Sharon Church In‐service 06/2010 McWilliams‐Evergreen In‐service 06/2010 McWilliams‐Victoria In‐service 06/2010 Providence‐West Grelot In‐service 06/2010 Sokol Park DS‐Carolls Creek Tp In‐service 06/2010 Bethabara‐Clarksboro In‐service 07/2010 Florida Gas Tap‐Florida Gas In‐service 08/2010 Coffee Springs Jct‐Coffee Springs In‐service 09/2010 Gaston‐Bessemer In‐service 10/2010 Transformer Project: Evans Primary ‐ replace 125 MVA, 230/230‐kV xfr W/ 300 MVA xfr
In‐service 06/2010
Transformer Project: Ola ‐ Expand existing 115 kV substation for 230 kV operations.
In‐service 06/2010
Transformer Project: Purvis Bulk Transformer Replacement ‐ upgrading tie transformer at Purvis bulk
In‐service 06/2010
Bethabara 230/115 kV substation/transformer In‐service 01/2010 Thomson – Warthen 500 kV line In‐service 06/2010 Bethabara – Clarksboro 230 kV line In‐service 07/2010 The Union Point ‐ Warrenton 115kV TL Reconductor
In‐service 07/2010
Cartersville 230/115/46/12kV Substation Breaker Replacements
In‐service 06/2010
N Americus ‐ N Tifton and N Tifton ‐ Talbot County In‐service 04/2010

Regional Reliability Self‐Assessm
ents
Regional Reliability Self-Assessments
128 NERC 2010/2011 Winter Reliability Assessment
Table SERC‐14: Southeastern Transmission Expected In‐service Since 2009/2010 Winter
Transmission Project Name Transmission Type (Under Construction,
Planned, or Conceptual) In‐Service Date(s)
#2 230kV TL Reactor Installations. Brundidge to Clio 115kV TL Upgraded In‐service 06/2010 White Oak 161kV switching station Under Construction 01/2011 Polkville 161/69kV substation Under Construction 01/2011 White Oak to Polkville 161kV line Under Construction 01/2011 New Pegamore – Huntsville 230 kV TL In‐service 06/2010 New Plant McDonough – Smyrna 230 kV In‐service 12/2009 New Dum Jon – Thomson 230 kV In‐service 01/2010 New Thomson 500/230 kV transformer In‐service 04/2010 New Brentwood 230/115 kV In‐service 04/2010 new New Logtown 230/115 kV transformer In‐service 10/2010
All of these projects are expected to improve reliability with no concerns with the in‐service dates. The utilities in the subregion have not identified any anticipated unusual transmission constraints that could significantly affect reliability. However, to further improve reliability, some entities within the subregion have reported efforts to install more remote controlled motor operated switches (RCMOS) on the transmission system and replace electromechanical protective relays with microprocessor relays. The deployment of these relays will provide for additional analysis of events and allow faster clearing times using communication‐assisted schemes. Entities coordinate maintenance outages around the subregion. All planned transmission facility outages are thoroughly studied based on forecasted system conditions and evaluated for potential reliability impacts. When required, procedures are developed to mitigate potential reliability impacts. No significant transmission line outages are scheduled for this winter except for the Liberty‐Defuniak Springs 115kV line that is scheduled to be out of service for the winter peak due to reconductoring for greater capacity. A detailed system impact study was done to identify and mitigate reliability concerns during this time.
Operational Issues Entities within the subregion reported to have performed routine system studies for the 2010/2011 winter that include the most up‐to‐date information regarding transmission status, generation status, and load forecasts. The studies are updated on a monthly basis to capture operating conditions for 13 months into the future. Where possible, outage schedules are adjusted to minimize the likelihood of reliability or capacity concerns. Any remaining transmission constraints can be mitigated through use of generation adjustments, system reconfigurations or system purchases. No unique operational problems are currently anticipated for the 2010/2011 winter. Special operating studies are not commonly performed unless dictated by changing system conditions. Most entities do not have any variable resources in their generation supply portfolios; therefore, they do not have special operating procedures with regard to variable resources. Southeastern entities have not identified any reliability concerns related to environmental or regulatory restrictions, Demand Response or minimum demand and over generation resulting from variable

Regio
nal R
eliability Self‐A
ssessmen
ts Regional Reliability Self-Assessments
NERC 2010/2011 Winter Reliability Assessment 129
resources. Unusual conditions are not expected to be a concern for the 2010/2011 winter. However, some parts of the subregion routinely experience significant loop flows due to transactions external to the service area. The availability of large amounts of excess generation within the southeast results in fairly volatile day‐to‐day scheduling patterns. The transmission flows are often more dependent on the weather patterns, fuel costs, or market conditions outside the service area, rather than by loading within the various control area. Significant changes in gas pricing dramatically impact dispatch patterns. All transmission constraints identified in current operational planning studies for the 2010/2011 winter can be mitigated through generation adjustments, system reconfiguration, or system purchases.
Reliability Assessment Analysis The total aggregate internal demand for the 2010/2011 winter is forecast to be 42,473 MW; this is 6,269 MW (12.9 percent) lower than the actual 2009/2010 winter peak of 48,742 MW. The projected peak existing, anticipated and prospective reserve margins in the Southeastern subregion are 47.4, 47.9, and 54.0 percent, respectively, compared to 45.9, 46.8, and 66.8 percent respectively last year. Projected margins are above the NERC Reference Margin Level of 15 percent, indicating that capacity resources are expected to be adequate to supply the projected firm winter demand. Entities within the subregion reported that reserve margins have been slightly affected by the economic recession and the corresponding impacts to the load forecast. Even though some entities have reported that long‐term margins established by state regulators are 15.0 percent, the Southeastern subregion as a whole does not have a single target margin or guideline. Individual company analyses account for planned generation additions, retirements, and deratings due to environmental control additions, load deviations, weather uncertainties, forced outages, and other factors. Resource adequacy is determined by extensive analysis of costs associated with expected unserved energy, market purchases and new capacity. These costs are balanced to identify a minimum cost point, which is the optimum reserve margin level. The latest resource adequacy studies show that the reserve margin for the 2010/2011 winter is expected to have a range between 15 percent and 72 percent for utilities within the subregion. It is not expected to drop below 15 percent for any single entity, due primarily to winter peaks within the subregion being less than the subregion’s summer peak. Even though utilities use purchases and reserve sharing agreements, they are not relying on resources from outside the Region or subregion to meet load. Additionally, post‐peak assessments are conducted on an as‐needed basis, to evaluate system capability resulting from an extreme‐peak season. Results indicate that existing and planned resources exceed the target reserve margin for the upcoming season; therefore, no significant changes in planned external resources to establish the margins during these periods are anticipated. On average for the winter, 61,121 MW of internal resources and 842 MW (net exports) of capacity transactions, which account for internal resources of non‐reporting parties and for external resources were reported. These resources are considered to be able to meet the NERC criteria or NERC target reserve margin level for 2010/2011 winter. The fuel supply infrastructure, fuel delivery system, and fuel reserves are all adequate to meet peak gas demand. As with other subregions within SERC, communications with suppliers and transportation agents are considered to be strong. Daily communications are also common between gas production companies and suppliers through which entities can be made aware of any potential problems.

Regional Reliability Self‐Assessm
ents
Regional Reliability Self-Assessments
130 NERC 2010/2011 Winter Reliability Assessment
Various companies within the subregion have firm transportation diversity, gas storage, firm pipeline capacity, and on‐site fuel, oil, and coal supplies to meet the peak demand. Many utilities reported that fuel vulnerability is not an expected reliability concern for the winter reporting period. The utilities have a highly diverse fuel mix to supply its demand, including nuclear, PRB coal, eastern coal, natural gas, and hydroelectric. Some utilities have implemented fuel storage, coal conservation programs, and various fuel policies to address this concern. Policies have been put in place to ensure that storages are filled well in advance of hurricane season (by June 1 of each year). These tactics help to ensure balance and flexibility to serve anticipated generation needs. Relationships with coalmines, coal suppliers, and daily communications with railroads for transportation updates, ongoing communications with the coal plants, and constant communication with utilities ensure that supplies are adequate and potential problems are communicated well in advance to allow adequate response time. Utilities maintain daily contact with suppliers, pipelines, and other utilities that may be able to assist in the event of an emergency. The Southeastern subregion does not have subregional criteria for dynamics, voltage, or small signal stability; however, various utilities within the subregion maintain individual criteria to address any stability issues. Appropriate entities will contract studies or perform annual transmission assessments to analyze system voltage and reactive performance under contingencies as required by the TPL Reliability Standards, including system stability studies to analyze the dynamic characteristics of the system. Current year studies show that reactive resources are adequate for the base case as well as contingency conditions and have not identified any deficiencies that would need to be addressed for the 2010/2011 winter. In order to minimize system reliability concerns this winter, entities within the subregion plan to perform preventative maintenance on units during the off‐peak period, continue to perform operating studies ahead of the season, and continue routine maintenance on transmission equipment. These steps should help to avoid negative impacts on the system and improve the performance of the system for upcoming seasons.

Regio
nal R
eliability Self‐A
ssessmen
ts Regional Reliability Self-Assessments
NERC 2010/2011 Winter Reliability Assessment 131
SERC‐VACAR The VACAR subregion of SERC is geographically located in all of North Carolina and South Carolina and portions of Virginia, There are 11 electric systems; one of these systems, SEPA, generates power solely for sales to other electric utilities and serves no retail customers directly. A second, APGI, serves only one industrial customer, Alcoa, Inc. The remaining nine systems in the VACAR subregion are: PEC (Progress Energy‐Carolinas), Duke (Duke Energy Carolinas), NCEMC (North Carolina Electric Membership Corporation), NCMPA1 (North Carolina Municipal Power Agency #1), NCEMPA (North Carolina Eastern Municipal Power Agency), FPWC (Public Works Commission of the City of Fayetteville), SCE&G (South Carolina Electric & Gas Company), SCPSA (South Carolina Public Service Authority), and Dominion Resource's VP (Virginia Power).
Demand The total aggregate internal demand for the 2010/2011 winter is forecast to be 58,820 MW; this is 1,610 MW (2.8 percent) higher than the forecast 2009/2010 winter Total Internal Demand of 57,210 MW and 2,039 MW (3.4 percent) lower than the 2009/2010 actual winter peak of 60,859 MW. The actual peak (January 2010) was a new all time peak for the VACAR subregion. The actual winter peak demand does take into account energy efficiency, diversity stand‐by load, and additions for non‐member load but cannot be broken out, whereas the forecast internal peak demand values can be broken out by these factors. A variety of reasons account for the increases in demand from last year’s reporting to this year. The primary differences between the actual and forecast winter peaks are colder than normal weather for the actual and assumed use of demand reduction capabilities in the forecast. Even though the effects of the economic recession, increase in load management, regressing demographics, and the slowdown in growth in residential and commercial sales are all still factors within the forecasts, a degree of recovery in sales growth is expected in 2010 and 2011. Projected demands have been adjusted to account for moderate growth in demand and normalizing weather conditions. As with other subregions within SERC, entities within VACAR use simulations employing multiple years of historical weather data to develop weather variables for forecasting peak demands, availability of generators, load projections and economic factors. One entity reported that it factors in the sum of heating degree hours on the winter peak day and the heating degree hours on the day before the winter peak day as two weather variables, to assess forecasted winter peak demands. Another factor that is commonly used around the subregion to assess forecast is economic projections. Economy.com is a widely used economic consulting firm for the development of SERC demand forecasts. The utilities in the subregion offer a variety of programs offered to their customers that support energy efficiency and Demand Response. Some of the programs are current energy‐efficiency and DSM that include interruptible capacity, load control curtailing, residential air conditioning direct load, energy product loans, standby generator control, residential time‐of‐use, Demand Response, Power Manager PowerShare conservation, residential Energy Star rates, Good Cents new and improved home, commercial Good Cents, thermal storage cooling, H20 Advantage water heater, general service and industrial time‐of‐use, and hourly pricing for incremental load interruptible, etc. These programs can be used to reduce the affects of winter peaks and are considered to be part of the utilities’ resource planning. Historically, load management is not needed or anticipated to be used in the winter, but entities are committed to the use of these programs as part of a long‐term, balanced energy strategy to meet future energy needs. Winter assessment reporting for the VACAR Region shows that 1,982 MW or 3.4 percent of Total Internal Demand as Demand Response can be used to reduce peak demand.

Regional Reliability Self‐Assessm
ents
Regional Reliability Self-Assessments
132 NERC 2010/2011 Winter Reliability Assessment
M&V analyses along with new product development and ongoing product management decisions are used to incorporate updated information into the resource plans. Some of the approaches of M&V are: monitoring parameters and variables, monitoring interval and period, measurement equipment specifications, measurement data collection and management, data validation, editing and estimating plan, accuracy of monitoring and verification method, savings uncertainty and confidence levels, and factors most uncertain or difficult to quantify. Some of the calculations and adjustments during this process account for verification of equations, calculations, the analysis of procedures for baseline and post‐installation demand and energy consumption, performance model development, population description, sample size calculations, methods of sampling, demand and energy savings calculations, and the method of adjustments to the data. Within various companies in the subregion, measurement and verification of DSM and energy‐efficiency programs are governed by various rules (example specified in PJM Manual 18B, North Carolina Utilities Commission (in Docket E‐100 Sub 124)). To demonstrate the value of an energy efficiency resource, resource providers must comply with the measurement and verification standards defined by establishing M&V plans, providing post‐installation M&V reports, and undergoing an M&V audit. To assess demand variability, some utilities within the subregion use a variety of assumptions to create forecasts. These assumptions are developed using econometric models, historical weather (normal and extreme) conditions, energy consumption, and demographics. Others assess variability of forecast demand by accounting for reserve margins through continuous evaluation of inputs used in forecasting processes, high and low forecasts, tracking of forecast versus actual, and multiple forecasts per year. These variables are assessed to evaluate various levels of uncertainty for forecast periods. A median peak load forecast value of 50/50 may be used within some entity models and 90/10 may be used for extreme peak forecast analysis. However, most entities in the subregion do not explicitly address extreme weather conditions
Generation Companies within the VACAR subregion expect to have the following aggregate capacity on peak. This capacity is expected to help meet demand during this time period. Variable resources are limited within the subregion for the 2010/2011 winter. However entities that do use these resources (landfill gas) calculate them through methods of published unit ratings that are commensurate with actual operating capabilities, hourly megawatt values that are based on expected firm and non‐firm capacity, and forecasted availability. Based on NOAA climate forecasts, hydroelectric conditions are expected to be near normal for early winter with drier conditions in early 2011. The National Weather Service projects a warning for potential drought conditions across the Piedmont watershed region of the Carolinas. However, coastal areas have received adequate rainfall throughout the summer. While reservoir levels are currently adequate, reduced inflows from the western watershed may affect hydroelectric operations in the fall and winter. Operations of run‐of‐river hydroelectric units may be limited at times due to low river flows and requirements to pass minimum flow. Coupled with other resources in the portfolio, projected hydroelectric generation and reservoir levels are expected to be adequate to meet both normal and emergency energy demands for the coming peak season.

Regio
nal R
eliability Self‐A
ssessmen
ts Regional Reliability Self-Assessments
NERC 2010/2011 Winter Reliability Assessment 133
Table SERC‐15: VACAR Winter 2010/2011 Capacity Breakdown Capacity Type Winter 2010/2011 (MW)
Existing‐Certain 73,070 Wind 0 Solar 0 Biomass 277 Hydroelectric 3,624
Existing‐Other 2,460 Wind 0 Solar 0 Biomass 0 Hydroelectric 0
Energy Only 0 Existing‐Inoperable 107 Future Planned 0
Wind 0 Solar 0 Biomass 0 Hydroelectric 0
Future Other 0 Wind 0 Solar 0 Biomass 0 Hydroelectric 0
Currently no entities are experiencing conditions that would reduce capacity. In the event of a major hurricane near the North and South Carolina coast, there is a possibility of disruption in generation. In addition, there exists the potential for a capacity reduction in nuclear. Through access to redundant and diversified fuel supplies, capacity‐owned resources and short‐term purchases, capacity margins are expected to be maintained throughout the season. Very few units are expected to be out of service over the winter peak. Units such as the Jocassee 1 and 2 will be off‐line during the season due to turbine upgrades on each unit. Minor impacts are expected due to these outages. Entities report that generator retirements are evaluated for reliability impacts as each retirement is proposed. Planned outage schedules and retirements are coordinated ahead of time with transmission operators to preserve the reliability of the bulk power system.
Capacity Transactions Utilities within the VACAR area reported the following imports and exports for the 2010/2011 winter. These sales and purchases; backed by firm contracts; are both external and internal to the Region and subregion and help to ensure resource adequacy for the utilities within the VACAR subregion.

Regional Reliability Self‐Assessm
ents
Regional Reliability Self-Assessments
134 NERC 2010/2011 Winter Reliability Assessment
Table SERC‐15: VACAR Subregional Imports/Exports
Transaction Type Winter 2010/2011 (MW) Firm Imports (Internal Subregion) 0 Firm Exports (Internal Subregion) 0 Non‐Firm Imports (Internal Subregion) 0 Non‐Firm Exports (Internal Subregion) 0 Expected Imports (Internal Subregion) 0 Expected Exports (Internal Subregion) 0 Firm Imports (External Subregion) 2,097 Firm Exports (External Subregion) 1,332 Non‐Firm Imports (External Subregion) 0 Non‐Firm Exports (External Subregion) 0 Expected Imports (External Subregion) 0 Expected Exports (External Subregion) 0
The majority of the contracts that were identified are backed by both firm generation and firm transmission commitment. None are reported to be based on partial path assumptions. Transactions backed by firm contracts are used in calculating the subregions reserve margin. VACAR entities reported that approximately 1,054 MW are associated with LDCs. The majority of the reported contracts are considered to be make‐whole. Outside imports or transfers of capacity from other Regions or subregions are not expected to be relied on to meet emergency imports and reserve sharing requirements for the 2010/2011 winter. However, generally VACAR companies are members of the VACAR Reserve Sharing Group and occasionally use their participation to meet emergency import and reserve requirements. This arrangement is based upon a collection of bilateral contracts between Reserve Sharing Group members within the VACAR subregion of SERC.
Transmission Several improvements to transmission facilities of utilities within VACAR have been completed or are planned to be completed by the 2010/2011 winter. The following table shows bulk power system transmission categorized as under construction, planned or conceptual that is expected to have been placed in service for the 2010/2011 winter since 2009.

Regio
nal R
eliability Self‐A
ssessmen
ts Regional Reliability Self-Assessments
NERC 2010/2011 Winter Reliability Assessment 135
Table SERC‐16: VACAR Expected Under Construction, Planned, or Conceptual Transmission
Transmission Project Name Transmission Type
(Under Construction, Planned, or Conceptual)
In‐Service Date(s)
Gallows‐Ox In‐service 05/2010 Aquia Harbor‐Garrisonville In‐service 05/2010 Bear Garden‐Bremo In‐service 06/2010 Chase City‐South Hill In‐service 06/2010 Club House‐South Hill In‐service 06/2010 Sadler Tie‐Glen Raven Mn In‐service 06/2010 Bremo‐Bear Garden In‐service 07/2010 Piercetown‐Plainview Ret In‐service 07/2010 Chickahominy‐Old Church Under construction 11/2010 Hamilton‐Pleasant View Under construction 11/2010 Transformer Project: Asheboro 230 kV Transformer Replacement ‐ transformer at Lanexa
In‐service 05/2010
Transformer Project: b0770 ‐ Trowbridge second transformer
In‐service 05/2010
Transformer Project: Enka 230/115 kV ‐ second Transformer at Elmont
Under construction 12/2010
Asheville‐Enka 115kV TL Upgrade Under construction 12/2010 Valley‐Harrisonburg #2 23kV TL In‐service 06/2010 Church Creek ‐ Savage Rd 115kV: Replace with double circuit
In‐service 05/27/10
Church Creek 230/115kV, Add 115kV terminal to Savage Rd
In‐service 05/27/10
Belvedere Switching station – Belvedere distribution, Replace with double circuit
In‐service 05/20/10
Belvedere Switching station, Add 115kV terminal to Steven Creek
In‐service 05/20/10
Pineland 230/115kV, Add 2nd 230/115kV autotransformer & 2nd 230kV bus tie breaker
In‐service 06/01/10
CIP – Kal Kan 115kV, Upgrade ampacity In‐service 05/28/10 Bayview – Charlotte Street 115kV, Replace with double circuit
Under construction 12/31/10
Ritter 230/115kV, Construct Under construction 12/31/10 Pepperhill – Deer Park 115kV, Rebuild Under construction 12/31/10 Charleston Airport – Robert Bosch 115kV, Construct Under construction 12/31/10 Santee 230/115kV, Install 115/46kV transformer Under construction 12/31/10 Urquhart – Kimberly Clark 115kV, Construct #2 circuit Under construction 12/31/10 Entities within the subregion are monitoring industry activities involving the installation and use of synchrophasors and have the capability to retrofit many existing relays to convert them to Phasor Measurement Units (PMU). Smart grid technology and additional SVCs are also being investigated for installation around the subregion.

Regional Reliability Self‐Assessm
ents
Regional Reliability Self-Assessments
136 NERC 2010/2011 Winter Reliability Assessment
Close coordination between construction management and operations planning ensures schedule requirements and completion requirements are well understood. Several other large‐scale construction projects are planned and implemented in phases around seasonal peak load periods to mitigate line clearances and non‐routine operating arrangements during higher seasonal load periods. There are no significant concerns with the projected in‐service dates with the reported improvement projects. Companies will maintain reliability by generation re‐dispatch, transmission re‐configuration, market‐to‐market re‐dispatch with Midwest ISO, and NERC TLR’s if necessary. Transmission maintenance schedules are carefully reviewed and evaluated to insure reliability concerns are addressed prior to peak winter periods. Regional studies are performed on a routine basis internally and externally. Coordinated single transfer capability studies with external utilities are performed quarterly through the SERC NTSG. Projected seasonal import and export capabilities are consistent with those identified in these assessments. Constraints that are external to the SERC subregion are evaluated as part of the SERC East RFC seasonal study‐group efforts.
Operational Issues To assess operating issues and studies, entities reported that they forecast typical and severe weather and secure additional firm capacity on a seasonal basis for typical/severe demand forecasts. Other short‐term firm purchases with firm transmission service are made on an as‐needed basis. Entities within this subregion participate in SERC study groups that assess the subregion on a seasonal basis. An assessment can be found in the SERC NTSG 2010/2011 Winter Reliability Report, which is submitted via FERC filings. For the projected 2010/2011 winter peak season, entities report that on the Regional level, operational problems exist due to west‐to‐east transfers and within the subregion operational problems are associated with high loadings on entity equipment. Other studies do not identify any unique operations problems that would affect reliability on the bulk transmission system. VACAR entities have not identified special operating problems from the integration of variable resources. Additionally, they do not anticipate any reliability problems resulting from minimum demand or over‐generation due to variable resources, Demand Response, or unusual operating conditions for the winter. There are no anticipated local environmental and/or regulatory restrictions that could potentially affect reliability. Generation Owners may be asked to place resources into the “Maximum Emergency Category” if environmental restrictions limit run hours below predetermined levels. Maximum Emergency units are the last to be dispatched and represent the highest cost megawatts on the system. A specific operating step is used to call Maximum Emergency units on‐line and is the last operating step during a capacity shortage before an actual emergency is called. Limited restrictions are expected to occur during the assessment period and only kick in after the units run for a period of time.
Reliability Assessment Analysis The total aggregate internal demand for the 2010/2011 winter is forecast to be 58,820 MW; this is 2,039 MW (3.4 percent) lower than the 2009/2010 actual winter peak of 60,859 MW. The projected January 2011 winter peak existing, anticipated and prospective reserve margins for the utilities in the subregion are 29.5, 29.5, and 32.6 percent, respectively, compared to 33.8, 33.9, and 36.3 percent, respectively last year. Projected margins are above the NERC Reference Margin Level of 15 percent, indicating that capacity resources are expected to be adequate to supply the projected firm winter demand. Differences are due to stronger demand predictions and weather adjustments for the winter.

Regio
nal R
eliability Self‐A
ssessmen
ts Regional Reliability Self-Assessments
NERC 2010/2011 Winter Reliability Assessment 137
Although some utilities within this subregion are subject to North Carolina Utility Commission regulations, VACAR entities individually use various methods to establish Regional/subregional reserve margin criterions. There currently is not a target reserve margin for the subregion. Companies have reported using techniques such as: LOLE studies (one day/ten year), generation resource plans (plant availability, plant forced outages, VACAR reserve sharing agreement, adverse weather impacts, loss‐of‐load probability, and the sizes of units), multiregional studies, and historical performances. There are a number of increased risks involved with these factors that need to be considered with regard to reserve margin targets. These risks include: 1) the increasing age of existing units on the system; 2) the inclusion of a significant amount of renewables (which are generally less available than traditional supply‐side resources) in the plan due to the enactment of the REPS in North Carolina; 3) uncertainty regarding the impacts associated with significant increases in company energy efficiency and DSM programs; 4) longer than expected lead times for building baseload capacity such as coal and nuclear; 5) increasing environmental pressures that may cause additional unit derates and/or unit retirements; and 6) increases in derates of units due to drought conditions. Each of these risks would negatively affect the resources available to provide reliable service to customers. Entities do not anticipate reliability problems for the winter and will continue to monitor these risks in the future and make any necessary adjustments to the reserve margin target in future plans. On average for the winter, 75,606 MW of internal resources and 739 MW of capacity transactions, which account for internal resources of non‐reporting parties and for external resources were reported. These resources are considered to be able to meet the NERC Reserve Margin Level for the 2010/2011 winter. Resource adequacy is assessed by forecasted normal/severe weather cases with additional firm capacity (existing, future, and outage models included) and forecasted demand plans on a seasonal basis. In addition, forecast of peak demand is made under a variety of both weather and economic conditions as required under RUS 1710 requirements. From this analysis, resources are planned accordingly. Entities report that this year’s studies are expected to be adequate based on the current forecast, generation, and demand‐side resources. Communication amongst entities and the fuel industry is considered to be strong. On an ongoing and regular basis supply adequacy, whether the fuel be oil based or gas based, is discussed and assessed in conjunction with suppliers, taking into account historical and projected demand. In those discussions, long and short‐term plans, and issues such as market trends, vendor performances, and associated potential resource constraints are framed to ensure potential interruptions can be mitigated and addressed in a timely manner. Utilities have reported that their generation facilities are expected to maintain enough diesel fuel to run the units for an order cycle of fuel. Fuel supply or delivery problems during the winter are not anticipated. Coal stockpiles are adequate to meet peak demand and to accommodate short‐term supply disruptions. Sites that have the capability to maintain redundant and diversified fuel supplies will do so in order to be prepared to respond to various emergency and/or economic scenarios. Furthermore, some entities report that they have purchased a backstop product from other entities that will provide additional firmness to existing nuclear capacity. In the event of extreme cold weather conditions during the season, entities will communicate closely with other Regional entities (ISO New England, New York ISO, etc) to coordinate actions to be taken to manage potential gas supply inadequacy situations. Overall, potential problems within the fuel industry and supplies are not factors for this winter.

Regional Reliability Self‐Assessm
ents
Regional Reliability Self-Assessments
138 NERC 2010/2011 Winter Reliability Assessment
Tests are also done to assess various stability‐study criterion as well as stressed system scenarios and contingencies. Studies of this type are routinely performed, both internally and through subregional and regional study group efforts. Stability assessments/criteria are performed and produced on an individual company basis within VACAR. Methods used involve the assessment of new generators for stability impacts on the system and full N‐1 A/C analysis. Some utilities follow practices such as using a reactive power supply operating strategy based on adopted generating station voltage schedules and electric system operating voltages managed through real‐time Reactive Area Control Error (RACE) calculations. Through this operating practice, primary support of generator switchyard bus voltage schedules using transmission system reactive resources, dynamic reactive capability of generators may be held in reserve to provide near‐instantaneous support in the event of a transmission system disturbance. Other utilities may develop reactive transfer interfaces to ensure sufficient dynamic MVAr reserve in load centers that rely on economic imports to serve load. Day‐ahead and real‐time Security Analysis ensure sufficient generation is scheduled/committed to control pre‐/post‐contingency voltages and voltage drop criteria within acceptable predetermined limits. Reactive transfer limits are calculated based on a predetermined back‐off margin from the last convergent case. System operators around the subregion also track the available static and dynamic reactive reserves in real time via the EMS system as a regular process. No stability issues have been identified as affecting reliability during the 2010/2011 winter. Although no reliability impacts are expected to occur this winter, certain entities have reported they are taking steps to prevent reliability concerns. The following techniques are expected to be used this winter to avoid situations that will compromise reliability on the system: minimizing forced outage durations, coordinating generation and transmission outages, using multiple fuel suppliers, maintaining adequate reserves, preparing and reviewing seasonal assessment studies of peak loading conditions, coordinating maintenance activities, prearranging construction schedules, and taking steps to mitigate risks.

Regio
nal R
eliability Self‐A
ssessmen
ts Regional Reliability Self-Assessments
NERC 2010/2011 Winter Reliability Assessment 139
Region Description The SERC Region is a summer‐peaking Region covering all or portions of 16 central and southeastern states serving a population of over 68 million. Owners, operators, and users of the bulk power system in these states cover an area of approximately 560,000 square miles. SERC is a nonprofit corporation responsible for promoting and improving the reliability, adequacy, and critical infrastructure of the bulk power system. SERC membership includes 71 member‐entities consisting of publicly‐owned (federal, municipal and cooperative), and investor‐owned operations. Within the SERC Region, there are 32 Balancing Authorities and over 200 Registered Entities under the NERC functional model. SERC Reliability Corporation serves as a Regional Entity with delegated authority from NERC for the purpose of proposing and enforcing reliability standards within the SERC Region. The SERC Region is divided geographically into five subregions which are identified as Central, Delta, Gateway, Southeastern, and VACAR. Additional information can be found on the SERC Web site.109
109 www.serc1.org

Regional Reliability Self‐Assessm
ents
Regional Reliability Self-Assessments
140 NERC 2010/2011 Winter Reliability Assessment
SSPPPP RREE
Introduction Southwest Power Pool, Inc. (SPP RE) operates and oversees the electric grid in the southwestern quadrant of the Eastern Interconnection. In addition to serving as a NERC Regional Entity, SPP RE is a FERC‐recognized Regional Transmission Organization (RTO). The SPP RTO footprint includes all or part of nine states: Arkansas, Kansas, Louisiana, Mississippi, Missouri, Nebraska, New Mexico, Oklahoma, and Texas.110 The Nebraska members belong to the Midwest Reliability Organization Regional Entity, which continues to perform their Reliability Assessments. This report gives a high‐level overview of the 2010/2011 winter reliability assessment for the SPP RE Region, specifically demand growth, capacity adequacy, and operational reliability. The winter assessment is used to identify any areas of concern regarding reliability for the SPP RE Region. This report is created with data and information submitted by SPP RE reporting members, which is validated and crosschecked to verify consistency. Once this process has been completed, SPP RTO staff aggregate the information into one data set for the entire SPP RE Region. SPP RTO staff use a peer review process to validate the data and develop the reliability assessments. The winter assessment assesses the forecasted demand, capacity resources, and future capacity additions for the upcoming winter timeframe. New bulk transmission (>100 kV) that has been installed
110 To read more about the differences between the SPP RE RE and SPP RE RTO footprints, open the Footprints document on
the www.SPP RE.org “Fast Facts” page.

Regio
nal R
eliability Self‐A
ssessmen
ts Regional Reliability Self-Assessments
NERC 2010/2011 Winter Reliability Assessment 141
since the last winter assessment, through the end of the current winter assessment, is reported. Projected operational and reliability concerns are also addressed for the upcoming winter timeframe.
Demand The projected non‐coincident Total Internal Demand forecast for the SPP RE 2010/2011 winter peak is 31,415 MW, which is nine percent lower than the 2009/2010 actual winter peak non‐coincident Total Internal Demand. The actual 2009/2010 winter demand of 34,317 MW was six percent higher than the forecasted projection of 32,309 MW. In 2009/2010, the SPP RE experienced an increase in demand from the normal forecast due to colder than average temperatures in the winter. Since the SPP RTO footprint was not significantly impacted by the recent economic downturn, the higher demand was mainly a result of much colder, than normal, 2009/2010 winter conditions. The 2010/2011 winter forecast is based on 2009/2010 actual demand adjusted for normal weather. Forecast data are collected from each reporting member111 as monthly non‐coincident values, then summed to produce the total forecast for the SPP RE footprint. The summer peak is the system condition on which the SPP RE Region bases its resource evaluations. The SPP RE’s reporting members review and adjust their forecasts based on the actual demand for the previous year. Although actual demand is very dependent on weather conditions and typically includes interruptible loads, forecasted Net Internal Demands are based on ten‐year average winter weather, or 50/50 weather. Some SPP RE members determine peak forecast based on a 50 percent confidence level as approved by their respective state commission(s). This means that the actual weather on the peak winter day is expected to have a 50 percent likelihood of being warmer and a 50 percent likelihood of being cooler than the weather assumed in deriving the load forecast. The SPP RTO does not develop load forecasts based on 90/10 weather scenario, but has a 13.6 percent reserve margin requirement. The SPP RTO’s bandwidth working group performed a study112 that included the 2010/2011 winter timeframe and determined the 13.6 percent reserve margin is adequate to cover any possible extreme load forecast for the SPP RE footprint. SPP RE reporting members provide data from their demand response programs and subtract those values from their load forecasts to report net load forecast. Based on these inputs, the SPP RE footprint currently reports 206 MW of interruptible demand and 11 MW of load management. The SPP RE does not have a way to measure or verify demand response programs due to their minimal amount of MWs. The percentage of demand response programs (which are voluntary by individual member company) that can reduce peak demand against the Total Internal Demand is 1.3 percent. At this time, the SPP RTO does not have a system‐wide demand response program. The SPP RTO does not address extreme winter conditions, as SPP RE is a summer‐peaking Region.
Generation The SPP RE expects to have 59,732 MW of total internal capacity for winter 2010/2011. This consists of Existing‐Certain capacity of 53,339 MW; Existing‐Other capacity of 4,779 MW; Existing‐ Inoperable capacity of 264 MW; and Future, Planned Capacity of 1,349 MW. The expected on‐peak capacity reported from variable generation plants (mostly wind) is 237 MW of the 3,485 MWs connected to the SPP RTO footprint. SPP RE has developed detailed criteria to establish the
111 Currently, SPP RE reporting members consist primarily of Balancing Areas and some Load Serving Entities 112 http://www.SPP RE.org/section.asp?group=320&pageID=27

Regional Reliability Self‐Assessm
ents
Regional Reliability Self-Assessments
142 NERC 2010/2011 Winter Reliability Assessment
net capability rating of the wind generation based on a five‐year history of peak load data. The reported biomass portion is five MW and consists of landfill gas. The SPP RE Region’s hydroelectric capacity represents a small fraction of the total resources (approximately three percent). SPP RE monitors potential fuel supply limitations for hydroelectric and gas resources by consulting with its generation owning/controlling members at the beginning of each year. Hydroelectric capacity is only a small fraction of the SPP RE’s resources; reservoir levels do not materially affect the SPP RE’s reserve margins. There are no anticipated issues concerning sufficient reservoir levels that would affect meeting the peak and daily energy demands during the winter 2010/2011 season. The SPP RE Region is experiencing normal rainfall and is not anticipating drought conditions for the winter season. The SPP RE Region is not experiencing any other conditions that would reduce capacity. No significant generating units are anticipated to be out of service or retired prior to or during the winter timeframe.
Capacity Transactions The SPP RE has 2,341 MW of projected imports; all 2,341 MW are backed by firm contracts. Approximately four MW are firm contract from WECC, administered under Xcel Energy’s Open Access Transmission Tariff. None of the purchase agreements are Liquidated Damages Contracts, and all firm power contracts are backed by transmission and generation. The SPP RE has 1,154 MW of projected exports external to the SPP RE Region. None of the sales agreements are a Liquidated Damages Contracts, and all firm power contracts are backed by transmission and generation. SPP RTO members, along with some members of the SERC Region, have formed a Reserve Sharing Group. The members of this group receive contingency reserve assistance from other SPP Reserve Sharing Group members. However, the group does not require support from generation resources outside the SPP Reserve Sharing Group. The SPP RE’s Operating Reliability Working Group sets the Minimum Daily Contingency Reserve Requirement for the SPP Reserve Sharing Group. The SPP Reserve Sharing Group maintains a minimum first Contingency Reserve equal to the generating capacity of the largest unit scheduled to be on‐line.
Transmission The SPP RTO has several projects that either are under construction, have been place in service since last winter, or are scheduled to be in service before the current assessment timeframe is over. These projects include two 345kV lines: a 120 mile line from Northwest to Woodward District EHV in northern Oklahoma and a 50.5 mile line from Reno County to Summit in Central Kansas. Several new transformers are scheduled to go in service. Project details are listed below in Table SPP‐1. The projects listed below are projected to be in‐service as planned. If there are any delays, the SPP RE Reliability Coordinator will coordinate with transmission owners to ensure a mitigation plan is in place to address any reliability issues. There are three 138kV projects listed in Table SPP‐1: 4Moril, Flanders, and Hopkins to Segura4 that are in service, and were built to relieve the congestion in the Acadiana load pocket. However, these projects will have no effect until a 230kV project, Richards‐Sellers‐Segura, is completed. This 230kV project is a three‐phase project, which is currently in the second phase, and is to be completed June 1st,

Regio
nal R
eliability Self‐A
ssessmen
ts Regional Reliability Self-Assessments
NERC 2010/2011 Winter Reliability Assessment 143
2011. The projects listed, along with some SERC projects, will address the reliability concerns in this area. No known significant transmission facilities are scheduled to be out of service during the winter timeframe. The SPP RTO is not aware of transmission constraints that have not been addressed by mitigation plans or with local operating guides for winter 2010/2011. However, SPP RE will continue to monitor the western part of the grid as described in the previous year’s assessment reports, as this area has experienced some reliability issues and challenges in the recent past. SPP RTO staff participates in one of the Eastern Interconnection Reliability Assessment Group’s interregional study efforts. This study is conducted to examine the potential constraints on the SPP RTO Region as a result of simulated imports and exports with neighboring Regions. Preliminary study results indicate that SPP RE imports are limited due to the 161 kV facilities across the Arkansas‐Oklahoma border. This has been a known issue for the last several years, and the SPP RTO is working with SERC members on mitigating this in the near future. In the meantime, the SPP RTO does not expect any reliability issues for winter 2010/2011, as it does not rely on the incremental transfer capability from the neighboring Regions to meet the projected demand.
Table SPP‐1: Transmission Additions
Transmission Project Name Voltage (kV)
Length (miles)
In‐Service Date
4Moril to Segura4 138 0.42 06/01/10 AEP Snyder to WFEC Snyder 138 4 12/31/2010 Atoka West to Lane (WFEC) 138 6.5 12/01/2010 Atoka East to Tupelo (WFEC) 138 6.5 12/01/2010 Ben Wheeler to Barton’s Chapel 138 10 12/31/2010 Crosstown to Boulevard 161 1.3 3/30/2010 Exxon Mobil Hawkins to Perdue 138 0.6 12/01/2010 Exxon Mobil Hawkins to Lake Hawkins 138 0.6 12/01/2010 Flanders to Segura4 138 17.7 06/01/2010 Hopkins to Segura4 138 2.7 06/01/2010 Knob Hill to Steele City 115 28 06/01/2010 Knoll to Vine Street 115 2.7 06/01/2010 Northwest to Woodward EHV 345 120 03/30/2010 Phillipsburg to Rhoades 115 35 06/01/2010 Reno County to Summit 345 50.55 09/30/2010 Sherman to Dallam County Interchange 115 35 12/31/2010 Sherman Tap to Hitchland 115 30 10/01/2010 Siloam Springs Tap to Siloam City 161 7 06/01/2010 Stranger Creek to Thornton 115 7 11/01/2010 Terrace to Boulevard 161 1 09/30/2010 Texas County Interchange to Hitchland 115 9 12/01/2010 Turk to Sugar Hill 138 24 12/31/2010 Wheeler Interchange to Howard 115 17 07/23/2010 Woodward EHV to Woodward 138 0.5 03/30/2010
No significant substation equipment was added since the previous winter timeframe.

Regional Reliability Self‐Assessm
ents
Regional Reliability Self-Assessments
144 NERC 2010/2011 Winter Reliability Assessment
Table SPP‐2: Transformer Additions
New Transformer Project Name Voltage (kV) In‐Service Date
East Manhattan 230/115 06/01/2010
Hitchland 230/115 12/01/2010
Hitchland 345/230 12/01/2010
Iatan 345/161 03/18/2010
Wheeler Interchange 230/115 07/23/2010
Woodward District EHV 345/138 03/30/2010
Operational Issues There are no known unusual operating conditions expected to affect the reliability of the Region for the winter 2010/2011 assessment timeframe. The SPP RTO completed the Wind Integration Task Force Study113 in January 2010, indicating that the SPP RTO would need significant transmission additions to accommodate ten percent or higher wind capacity. The SPP RE projects to have approximately four percent of installed wind capacity on the grid for winter 2010/2011; grid operators will continue to monitor any operating challenges for this assessment period. SPP RTO does not foresee any reliability concerns due to minimum demand and over generation. SPP RTO operations staff does not anticipate any environmental and/or regulatory restrictions that could potentially affect reliability. Flowgate assessment analysis does not indicate any unusual operating conditions expected for the winter months. There are no known reliability concerns resulting from high levels of demand response resources, as demand response programs in the SPP RE Region are minimal at this time. SPP RTO does not anticipate any other unusual operating conditions that could significantly affect the reliability of the Region.
Reliability Assessment Analysis An SPP RTO criterion requires that its members maintain a minimum capacity margin of 12 percent114
(13.6 percent Reserve Margin). SPP RTO members, by meeting this requirement, adequately cover a
90/10 weather scenario. The SPP RE reserve margin based on Existing‐Certain resources is expected to
be 75 percent for 2010/2011 winter, which is higher than the reserve margin requirement of 13.6
percent. The 75 percent reserve margin is based on projected data for February 2011 with Existing‐
Certain and Net Firm Transactions. On an Anticipated Capacity Resource basis, SPP RE is projected to
maintain approximately a 79.3 percent reserve margin, and the reserve margin based on Prospective
Capacity Resources is 82.8 percent.
The SPP RTO completed the Loss‐of‐Load Expectation (LOLE) and Expected Unserved Energy study for
the 2016 time period. Because of the studies, the SPP‐Southwestern Public Service (SPS) interface limit
was increased by 113 MW due to the construction of a 345 kV line from Woodward to Tuco. The studies
evaluated the need to adjust SPP RE’s 12 percent Regional capacity margin or 13.6 percent reserve
margin, and estimated the reserve margin required to achieve an LOLE of no more than one day in ten
years. Based on the LOLE study performed by SPP RTO staff in 2010 for summer 2016, the capacity or
113 Wind Integration final study: http://www.SPP RE.org/section.asp?group=1385&pageID=27 114 SPP RE Criteria Section 2.0: http://www.SPP RE.org/publications/SPP
REpercent20Criteriapercent20andpercent20Appendices07‐27‐10.pdf

Regio
nal R
eliability Self‐A
ssessmen
ts Regional Reliability Self-Assessments
NERC 2010/2011 Winter Reliability Assessment 145
reserve margin requirement for the SPP RTO remained unchanged. The 12 percent capacity margin and
13.6 percent reserve margin requirements are also checked annually in the EIA‐411 reporting, as well as
through supply adequacy audits of Regional members conducted every five years by the SPP RTO. The
last supply adequacy audit was conducted in 2007.
The 2010/2011winter projected reserve margin for Existing‐Certain and Net Firm Transactions is 75 percent, whereas the 2009/2010 winter projected reserve margin was 35.4 percent. The 2010/2011 winter projected reserve margin for Anticipated Capacity Resources is 79.3 percent, compared to the 2009/2010 winter projected reserve margin of 36 percent. The 2010/2011winter projected reserve margin for Prospective Capacity Resources is 82.8 percent, compared to the 2009/2010 winter reserve margin of 45.6 percent. The increase in the reserve margin is due to approximately 4,100 MW of capacity resources being reclassified from Existing‐Other to Existing‐Certain capacity resources. The reclassification of 4,100 MW of capacity resources was due to a reporting error that was discovered in the 2010 assessment timeframe.
Due to SPP RE’s diverse generation portfolio, there is no reliability concern of the fuel supply being
affected by the winter weather during peak conditions. If a fuel shortage is anticipated, it is
communicated to SPP RE operations staff in advance so they can respond appropriately. SPP RE would
assess if capacity or reserves would become insufficient due to the unavailable generation. If so, SPP RE
would declare either an Energy Emergency Alert or other extreme contingency, and post as needed on
the Reliability Load Coordinator Information System. SPP RE does not expect any immediate impact on
the reliability of the Region due to the current economic conditions. The SPP RTO conducted a 2009 SPP Stability Study for the 2010 seasonal light load model; the 2010 light load model represents the worst‐case scenario from a stability perspective. This assessment discusses potential events that could lead to instability within the SPP RTO footprint for NERC‐defined categories (A, B, C and D) of events submitted by SPP RTO members. Events in one category B, two category C, and three category D events were required to have mitigations plans before they were found to be stable. The SPP RTO also conducted a transient stability screening of the SPP RTO footprint on the previously mentioned case. These events were mitigated by applying the proper fault clearing times and/or system generation re‐dispatch to maintain system stability. The SPP RTO conducted a Power‐Voltage analysis study for the nine potential load pockets within the SPP RTO footprint based on a 2014 summer peak load condition. SPP RE staff will distribute this analysis to stakeholders through SPP RE’s Transmission Expansion Planning (STEP) processes (STEP and/or Integrated Transmission Plan), and coordinate a mitigation plan as necessary for SPS, SPS‐South, and Northeast Westar.
Other Region Specific Issues There are no known “other” reliability issues at this time in the SPP RE Region.

Regional Reliability Self‐Assessm
ents
Regional Reliability Self-Assessments
146 NERC 2010/2011 Winter Reliability Assessment
Region Description The Southwest Power Pool, Inc. Regional Transmission Organization (SPP RTO) Region covers a geographic area of 370,000 square miles and has members in nine115 states: Arkansas, Kansas, Louisiana, Missouri, Mississippi, Nebraska, New Mexico, Oklahoma, and Texas. SPP RE’s Reliability Coordinator footprint includes 29 balancing authorities, and the RTO has over 50,000 miles of transmission lines. SPP RE typically experiences peak demand in the summer months. SPP RE has 60 members that serve over 6.2 million households. SPP RE’s membership consists of 14 investor–owned utilities, 12 generation and transmission cooperatives, ten power marketers, nine municipal systems, seven independent power producers, four state authorities, and four independent transmission companies. SPP RE was a founding member of the North American Electric Reliability Corporation in 1968, and was designated by the Federal Energy Regulatory Commission as an RTO in 2004 and a Regional Entity (RE) in 2007. As an RTO, SPP RE ensures reliable supplies of power, adequate transmission infrastructure, and competitive wholesale prices of electricity. The SPP RE oversees compliance enforcement and reliability standards development. Additional information can be found at www.SPP.org.
115 The SPP RE RE footprint does not include Nebraska

Regio
nal R
eliability Self‐A
ssessmen
ts Regional Reliability Self-Assessments
NERC 2010/2011 Winter Reliability Assessment 147
TTRREE
Introduction The TRE Region represents 85 percent of the state’s electric load is operated as a single interconnection and Reliability Coordinator Area. The following is an assessment of the demand, generation, and transmission changes for the ERCOT system. In addition, this assessment covers operational and reliability issues as evaluated by operation and planning staff for the 2010/2011 winter period. Texas Reliability Entity (TRE) is the Regional Entity for the Texas Interconnection.
Demand The 2010/2011 winter peak demand forecast is 48,066 MW, which is approximately 11 percent higher than last year’s forecast of 43,463 MW for the 2009/2010 winter peak demand. The winter of 2009/2010 was significantly colder than normal, both overall and for a sustained period in January, which resulted in a record high winter peak demand of 55,878 MW. While this record demand occurred as a result of sustained, extreme temperatures, an analysis of actual versus forecasted winter demands and weather conditions led to a re‐specification of the load forecasting models to be more sensitive to winter weather patterns. The re‐specified models resulted in the increase in forecasted demand for the upcoming winter peak, relative to the forecast for the previous year’s winter peak demand. In addition, the forecast continues to reflect the impact of the slow economic recovery. The forecasted coincident peak demands are produced by ERCOT ISO for the TRE Region, which is a single Balancing Authority Area, based on the Region‐wide actual demands. The weather assumptions on which the forecasts are based are considered to represent an average weather profile, calculated for each of the eight weather zones in the TRE Region.

Regional Reliability Self‐Assessm
ents
Regional Reliability Self-Assessments
148 NERC 2010/2011 Winter Reliability Assessment
Alternative weather scenarios are used to develop extreme weather load forecasts. One scenario is the one‐in‐ten‐year occurrence of a weather event. This scenario is calculated using the 90th percentile of the temperatures in the database spanning the last 14 years available. These extreme temperatures are input into the load‐shape and energy models to obtain the forecasts. The extreme temperature assumptions consistently produce winter demand forecasts that are approximately ten percent higher than the forecasts based on the average weather profile. The economic factors that drive the long‐term hourly demand forecast include per capita income, population, gross domestic product (GDP), and various employment measures that include non‐farm employment and total employment. The forecasts of these economic indicators reflect the effects of the national recession on the Texas economy. The forecast was based on the low case economic scenario, as the low case scenario was deemed to be most reflective of the current state of the economy based on recent weather‐adjusted observations. Using the low case economic scenario instead of the base case economic scenario resulted in a reduction of approximately 1.5 percent in the forecast relative to the 2009 forecast. There are two categories of demand‐response resources that can be dispatched by the ERCOT ISO in all hours, and therefore are capable of reducing winter peak demand:
Loads Acting as a Resource116 (LaaR) providing Responsive Reserve Service (RRS); and
Emergency Interruptible Load Service117 (EILS).
LaaRs register with ERCOT ISO to provide ancillary services. There are approximately 165 registered and qualified LaaRs in the TRE Region, with approximately 2,300 MW of registered demand response capacity, of which 1,062 MW is included in the reserve margin calculation, based on historic provision as RRS. EILS resources are loads that provide capacity services and are subject to deployment by dispatch instructions that can be executed prior to firm load shedding. EILS resources are procured for four‐month contracts, and the capacity available to support the TRE Region is dependent on the details from accepted bids, which include time period, capacity, cost, location and performance. Additionally, entities in the TRE Region may participate in market‐based demand response activities through the competitive retail market, including direct load control, real‐time price response, and critical peak price response. However, such resources are not dispatched by the ERCOT ISO, and as this competitive market information is not available, there are no reliable estimates of the aggregate capacity of these programs. In general, energy efficiency savings, as verified by an independent contractor, have exceeded the goals set by the utilities.3 Unlike many demand response programs in other Regions, which are designed specifically to reduce peak demand, often as part of a long‐term planning process or procured through a forward‐capacity auction, demand response in the TRE Region is procured around the clock and is not specific to peak load reduction. Loads that participate in demand response are obligated to deploy at any time in
116 For information on LaaRs see: http://www.ercot.com/services/programs/load/laar/index 117 For additional information on EILS see: http://www.ercot.com/services/programs/load/eils/index 3 http://www.texasefficiency.com/report.html

Regio
nal R
eliability Self‐A
ssessmen
ts Regional Reliability Self-Assessments
NERC 2010/2011 Winter Reliability Assessment 149
response to an ERCOT ISO instruction, the triggers for which are tied to operational issues that are usually related in some way to recovering frequency. ERCOT ISO staff measures and verifies LaaR performance in the Ancillary Services markets using telemetry (updated every two to ten seconds), that provides real‐time visibility in the capability and performance of the Resources and is integrated into the operators’ performance monitoring tools. The real‐time data are stored using a database that records key data parameters that allows for more detailed analysis after the fact. ERCOT ISO’s analysis of this telemetry data are supported after‐the‐fact as necessary with 15‐minute interval meter data. Measurement and verification of EILS is accomplished entirely after‐the‐fact with 15‐minute interval data applied to multiple baseline types as assigned by ERCOT ISO specific to the individual load or aggregation. Formulas governing performance evaluation are embedded in the ERCOT protocols and approved by the ERCOT Board of Directors. Energy efficiency impacts are based on Transmission and/or Distribution Service Provider (TDSP) filings to the Public Utilities Commission of Texas. The assumption of (242) MW of energy efficiency is made over the next winter.
Generation The TRE Region has approximately 72,500 MW of Existing‐Certain generation, 11,633 MW of Existing‐Other generation, and 58 MW of Future, Planned generation capacity expected to be in service during the 2010/2011 winter period. The amount of Existing‐Other generation includes capacity that is undergoing maintenance or repair during the winter season, ranging from 348 MW during the first week of the reporting period to a high of 4,568 MW during the last week of the reporting period. These outages are not expected to adversely affect the ability to meet demand. In addition, the Region has 5,773 MW of installed generation that is mothballed and not readily available. Out of the 9,317 MW of installed wind capacity, only 8.7 percent, or 811 MW, is used as Existing‐Certain generation based on the ERCOT Reserve Margin Analysis Report118. The remaining 8,506 MW of the existing wind capacity is included in the Existing‐Other generation amount. Similarly, the planned new wind generation expected to be online by the winter period totals 150 MW, however only 8.7 percent, or 13 MW, is considered on‐peak. In addition, 87 MW of biomass is included in the Existing‐Certain generation amount and 45 MW in Future, Planned. There are eight MW of solar included in Existing‐Certain generation. No additional solar generation is assumed to be added prior to the winter period. ERCOT ISO has not performed a specific study of fuel supply vulnerability; generator owners and operators are responsible for assessing their fuel supply. The TRE Region is not generally reliant on single gas pipelines or import paths such that the long‐term outage of one of these types of lines or paths would lead to the loss of significant amounts of generating capacity. The TRE Region does not expect capacity reductions due to water levels. Less than one percent of the TRE generation capacity is hydroelectric. These facilities are typically operated as run‐of‐river or planned
118 See “ERCOT Reserve Margin Analysis Report” located on the following website:
http://www.ercot.com/calendar/2007/01/20070112‐GATF

Regional Reliability Self‐Assessm
ents
Regional Reliability Self-Assessments
150 NERC 2010/2011 Winter Reliability Assessment
release due to downstream needs, and not operated specifically to produce electricity. There are no other conditions expected within the TRE Region that are anticipated to create capacity reductions during the winter period.
Capacity Transactions on Peak The TRE Region is a separate interconnection with only asynchronous ties to Southwest Power Pool (SPP RE) and México’s Comisión Federal de Electricidad (CFE) and does not share reserves with other Regions. There are two asynchronous ties between the TRE Region and SPP RE with a total of 826 MW of transfer capability and three asynchronous ties between the TRE Region and México with a total of 280 MW of transfer capability. The TRE Region does not rely on external resources to meet demand under normal operating conditions; however, under emergency support agreements, it may request external resources for emergency services over the asynchronous ties or by transferring block loads. For the winter 2010/2011 period, the TRE Region has 461 MW of imports from SPP RE and 140 MW from CFE. Of the imports from SPP RE, 48 MW are tied to a long‐term contract for a purchase of firm power from specific generation. The remaining imports of 413 MW from SPP RE and 140 MW from CFE represent one‐half of the asynchronous tie transfer capability, included to reflect emergency support arrangements. Several SPP RE members own 220 MW of a power plant located in the TRE Region, resulting in a firm export of that amount from the TRE Region to SPP RE. There are no non‐Firm contracts signed or pending. There are also no known contracts under negotiation or under study.
Transmission Several significant transmission improvements have been made throughout the TRE Region to meet reliability needs119. Approximately 457 miles of new and 92 miles of upgraded 345 kV transmission lines have been completed since the 2009/2010 winter. Approximately 89 miles of new and 325 miles of upgraded 138 kV transmission lines were completed since the 2009/2010 winter. See table TRE‐1.
Table TRE‐1: Transmission Additions and Upgrades Voltage New Upgraded 345 kV 457 92 138 kV 89 325
One of the most significant improvements in south Texas is the completion of the 114‐mile 345 kV line from San Miguel to Lobo. This line will improve reliability and reduce congestion problems in the Laredo area, which was previously served only by long 138 kV lines. In north‐central Texas, a second 345 kV line was built to increase import capacity from wind generation in west Texas to the Dallas/Fort Worth area. This 88‐mile 345 kV circuit addition from Parker Switch to Everman will reduce congestion in this area. A new 74‐mile 345 kV line from Hutto Switch to Salado Switch was recently put into service. This long‐anticipated project completes the first phase of a new 345 kV double circuit to electrically parallel an existing 345 kV double circuit corridor from Salado Switch to Clear Springs. As part this project, a new
119 Additional details on transmission projects can be found in the “Transmission Constraints and Needs Report 2009” located
on the following website: http://www.ercot.com/news/presentations/

Regio
nal R
eliability Self‐A
ssessmen
ts Regional Reliability Self-Assessments
NERC 2010/2011 Winter Reliability Assessment 151
600 MVA autotransformer was added at Hutto Switch to provide import into the growing load centers of Hutto and Round Rock. In addition to transmission lines, approximately 5,596 MVA of autotransformer capacity has been added or is expected to be in service prior to the 2010/2011 winter period. Significant transformer additions include new autotransformers at Hutto Switch, Rothwood substation in the Houston area and at Lobo just outside Laredo to provide import capability from the new 345 kV line completed from San Miguel. Other significant substation equipment includes the completion of the addition of 300 MVAr Static VAR Compensator (SVC) reactive capacity inside the Dallas area. A second phase consisting of another 300 MVAr of SVC capacity is anticipated to be added during the 2010/2011 winter period. ERCOT ISO will continue to operate reliably by employing congestion management techniques, and developing mitigation plans if necessary, to maintain reliability. Hence, there are no anticipated reliability concerns with meeting target in‐service dates for new transmission additions at this time. There are no known transmission constraints or planned outages that are expected to significantly impact reliability across the TRE Region. The outage coordination process addresses many potential constraints. If transmission constraints are identified in the operations planning horizon, remedial action plans or mitigation plans are developed to provide for preemptive or planned response to maintain reliability of a localized area. Interregional transfer capabilities are not generally relied upon to resolve transmission reliability planning although emergency support arrangements are in place that provide for support over the asynchronous ties or through block load transfers.
Operational Issues For the 2010/2011 winter period, no unusual operating conditions that could affect reliability are anticipated, and no significant special operating studies have been performed for the TRE Region Also, there are no anticipated reliability concerns resulting from minimum demand and over generation for the upcoming winter. Since the last winter assessment, ERCOT ISO has implemented a wind ramp forecasting tool that provides a probabilistic assessment of the magnitude and likelihood of a significant change in aggregate wind output over upcoming operating periods. This tool provides ERCOT operators with situational awareness. In addition, ERCOT ISO will continue to use typical operational procedures and tools related to variable resources during the winter season. ERCOT ISO has a wind power forecasting system that allows ERCOT ISO system operators to identify and take appropriate action when wind resource schedules may not track expected changes in wind production. In addition, ERCOT ISO evaluates the impact of increased installed wind generation on ancillary services requirements on an ongoing basis. Currently, ERCOT ISO has no concerns over the use of demand response to meet either winter or summer peak demands. LaaRs providing Responsive Reserves have a demonstrated performance of responding as expected to emergency conditions on the TRE grid – both in terms of how quickly they respond when called or in terms of the total quantity provided. Testing of both LaaRs and EILS Resources indicates that these resources will provide at least the capacity called upon within timelines established by the ERCOT protocols.
Regional Reliability Self‐Assessm
ents
Regional Reliability Self-Assessments
152 NERC 2010/2011 Winter Reliability Assessment
The amount of available demand response reported is based on historical amounts that have been on‐line and available to be deployed. The only restriction on the number of deployments for demand response resources is for EILS resources, which may only be deployed by the grid operator a maximum of two times during any four‐month contract period. There are no known environmental or regulatory restrictions that could affect reliability. If periods of extreme cold are expected, ERCOT ISO will conduct a fuel survey to determine which units are have dual fuel capability, the amount of alternative fuel available, and the impacts of alternative fuel on unit capability.
Reliability Assessment The anticipated planning reserve margin for winter 2010/2011 is 57.1 percent, which is lower than the 2009/2010 margin of 73.4 percent. This change is caused by the increase in the expected demand, in addition to a net decrease in available generation due to scheduled maintenance and mothballed resources. However, the margin is well over the TRE Region minimum annual reserve margin of 12.5 percent. The TRE reserve margin is based on a loss‐of‐load expectation (LOLE) analysis of no more than one day in ten years loss of load. The LOLE study that was used to assess the adequacy of the 12.5 percent reserve margin criteria was completed in 2007.120 This reserve margin should be sufficient to cover, among other uncertainties, the potentially higher peak demand associated with the tenth percentile temperatures, as well as an unexpected repeat of last year’s very high peak demand. In the planning horizon, ERCOT ISO performs a security‐constrained unit commitment and economic dispatch analysis for the upcoming year. This analysis is performed on an hourly basis for a variety of conditions to ensure deliverability of sufficient resources to meet a load level that is approximately ten percent higher than the expected summer coincident system peak demand plus operating reserves. In the operations horizon, resource adequacy is maintained by ERCOT ISO through market‐based procurement processes121. Transmission operating limits are adhered to through market‐based generation re‐dispatch directed by ERCOT ISO as the Balancing Authority and Reliability Coordinator. In order to coordinate with the fuel industry, ERCOT ISO is a member of the Texas Energy Reliability Council (TERC), which is comprised of representatives from Texas natural gas industry and electric generation companies. TERC is facilitated by the Railroad Commission of Texas, the state regulator of natural gas, to help coordinate and, if necessary, allocate supplies of natural gas during periods of high demand and potential shortages. In addition, ERCOT ISO receives communication regarding fuel supply issues from all electric generators in the Region on a day‐ahead and intra‐day basis via resource plans and verbal notifications. They advise ERCOT ISO on any localized fuel supply issues communicated to them by their suppliers that might affect the availability of their generation resources. Many generators also have alternate fuel capability (oil) that they can switch to when gas is curtailed. By maintaining an appropriate voltage profile122 at generating units and coordinating voltage‐control equipment, it is possible to maintain transmission grid voltages at all points in the TRE Region within
120 See “ERCOT Reserve Margin Analysis Report” located on the following Web site:
http://www.ercot.com/calendar/2007/01/20070112‐GATF 121 See Sections 6 and 7 of the ERCOT Protocols found at http://www.ercot.com/mktrules/protocols/current 122 Voltage profiles can be found at: http://www.ercot.com/gridinfo/generation/voltprof

Regio
nal R
eliability Self‐A
ssessmen
ts Regional Reliability Self-Assessments
NERC 2010/2011 Winter Reliability Assessment 153
acceptable operating voltage limits. Steady state models for winter conditions are used to run a voltage profile study for the winter period. Specific dynamic reactive studies were not performed for the 2010/2011 winter network models.
Other Region Specific Issues The TRE Region is scheduled to implement a nodal market system and related market rules on December 1, 2010. This system is expected to improve operational efficiency in the TRE Region. Extensive testing is currently underway in order to resolve issues and mitigate risks associated with the transition. There are no additional reliability concerns anticipated for the 2010/2011 winter period.
Region Description The TRE Region is a separate electric interconnection located entirely in the state of Texas and operated as a single balancing authority. The TRE Region is a summer‐peaking Region with an all‐time peak demand of 65,715 MW set in August 2010. The TRE performs the Regional Entity functions described in the Energy Policy Act of 2005 for the ERCOT system within the Texas Interconnection. The Electric Reliability Council of Texas (ERCOT) manages the flow of electric power to 22 million Texas customers – representing 85 percent of the state’s electric load and 75 percent of the Texas land area (200,000 sq. mi.). As the independent system operator for the Region, ERCOT schedules power on an electric grid that connects 40,000 miles of transmission lines and more than 550 generation units. ERCOT also manages financial settlement for the competitive wholesale bulk‐power market and administers customer switching for 6.5 million Texans in competitive choice areas.

Regional Reliability Self‐Assessm
ents
Regional Reliability Self-Assessments
154 NERC 2010/2011 Winter Reliability Assessment
WWEECCCC

Regio
nal R
eliability Self‐A
ssessmen
ts
Regional Reliability Self-Assessments
NERC 2010/2011 Winter Reliability Assessment 155
Introduction WECC is one of eight electric reliability councils in North America, and is responsible for coordinating and promoting bulk electric system reliability in the Western Interconnection. WECC is geographically the largest and most diverse of the eight Regional Entities that have Delegation Agreements with the North American Electric Reliability Corporation (NERC). WECC’s service territory extends from Canada to México. It includes the provinces of Alberta and British Columbia in Canada, the northern portion of Baja California in México, and all or portions of the 14 Western states in between. For the 2010/2011 Winter Assessment, the WECC Region is divided into four subregions; Northwest Power Pool (NWPP), Rocky Mountain Reserve Group (RMRG), Southwest Reserve Sharing Group (SRSG), and California/México (CA/MX). These subregions are used for two reasons. First, the subregions are structured around Reserve Sharing Groups. These groups have similar demand patterns and have similar operating practices. Second, the Western Reliability Centers collect actual demand data from the Reserve Sharing groups. Creating the seasonal assessments using the same footprint allows for after‐the‐fact comparison between demand forecasts and actual demand. The purpose of the winter assessment is to highlight any reliability concerns associated with Resources, including Generation and Transmission, or System Operations under normal weather conditions. Abnormal weather conditions would result in different reserve margins. For the winter assessment, WECC requested information from its BA about any studies they have performed for the winter assessment period. WECC also requests BAs to update any applicable data (actual loads, forecasts, outages, future and existing resource status changes) that have been previously submitted to WECC. The submitted information and data are then reviewed and compiled into the resulting resource assessment for the WECC Region and subregions. provided by WECC’s BAs.

Regional Reliability Self‐Assessm
ents
Regional Reliability Self-Assessments
156 NERC 2010/2011 Winter Reliability Assessment
Demand WECC specifically directs its BAs to submit forecasts with a 50 percent probability of occurrence. These forecasts consider various factors such as population growth, economic conditions and normalized weather so that there is a 50 percent probability of exceeding the forecast. The internal peak demand forecasts presented here are coincident sums of shaped hourly demands adjusted by demand forecasts The actual peak demand for the winter of 2009/2010 of 128,461 MW was 1.5 percent higher than the 2010/2011 coincidental forecast of 126,498 MW. The actual peak of 2009/2010 was also more than 5,000 MW lower than the 2009/2010 non‐coincidental forecast of 133,864 MW. The 2010/2011 forecast is lower then the 2009/2010 forecast due to several factors. The forecast for the 2010/2011 winter period is a coincidental forecast while the 2009/2010 forecast was a non‐coincidental peak. In addition, the economic recession continues to suppress demand in the Region. Demand‐side management (DSM) programs offered by BAs or Load Serving Entities (LSE) vary widely. The 2010/2011 internal demand forecast includes 571 MW of direct control load management, 1,814 MW of interruptible demand capability, 25 MW of critical‐peak‐pricing with control, and 30 MW of load as a capacity resource. As a percent of Total Internal Demand, total demand response could reduce peak demand by two percent. Direct control load management programs largely focus on air conditioner cycling programs while interruptible demand programs are focused primarily on large water pumping operations and large industrial operations such as mining. Each LSE is responsible for verifying the accuracy of its DSM and energy efficiency programs. Methods for verification include direct end‐use metering, sample end‐use metering, and baseline comparisons of metered demand and usage. Energy efficiency programs vary by location and are generally offered by the LSE. Programs include: Energy Star builder incentive programs, business lighting rebate programs, retail compact fluorescent light bulb (CFL) programs, home efficiency assistance programs, and programs to identify and develop ways to streamline energy use in agriculture, manufacturing, water systems, etc. For purposes of verification, some LSE’s retain independent third parties to evaluate their programs. WECC did not perform any quantitative analyses, on a Regional or subregional basis, to assess the variability in demand associated with variations in weather or the economic recession. All margin results used demands associated with normal weather conditions, and no attempts were made to address extreme temperature changes.
Generation WECC modeled the Western Interconnection using Existing Capacity for the peak month of December 2010 totaling 179,774 MW, including 10,326 MW of wind (2,444 MW expected on peak), 527 MW of solar (zero MW expected on peak), and 1,152 MW of biomass (1,097 MW expected on peak). The Deliverable Capacity resources total 182,845 MW, including 12.337 MW of wind (2,825 MW expected on peak), 618 MW of solar (57 MW expected on peak), and 1,202 MW of biomass (1,147 MW expected on peak). The projected hydroelectric levels for the 2010/2011 winter season are expected to be near normal in the Northwest and California but below normal on the Colorado River. WECC expects hydroelectric conditions should be sufficient to meet both daily peak and daily energy demand throughout the study period and should not have any material impact on margins.

Regio
nal R
eliability Self‐A
ssessmen
ts
Regional Reliability Self-Assessments
NERC 2010/2011 Winter Reliability Assessment 157
The WECC Region is not currently experiencing, and does not expect to experience, any weather or fuel related issues that would reduce capacity. Additionally, generating units that are expected to be taken out‐of‐service during the winter period should not have any effect on reliability.
Capacity Transactions The WECC Region does not rely on imports from outside the Region when calculating peak demand reliability margins. Neither does the Region model exports to areas outside of WECC that could adversely affect reliability margins. The WECC Region does not rely on outside assistance or external resources for emergency imports for system reliability. WECC does not track subregional purchase/sale contracts or their associated transmission. Only transfers from remotely owned large thermal and hydroelectric units (resources located outside of the owners subregion) are allocated to the owner’s subregion. All other transfers are theoretical transfers that could happen, but are not actual contracts. This treatment ensures that resources are counted once and only once.
Some WECC entities rely heavily on short‐term power markets, generally using the Western System Power Pool (WSPP) contracts. The WSPP Agreement is a set of FERC‐approved standardized power sales contracts used by jurisdictional and non‐jurisdictional entities. The most commonly used WSPP contract is the Firm Capacity/Energy Sale or Exchange (Schedule C), which contains liquidated damage provisions (LDC) and is heavily relied on as the template for such transactions. These contracts do not reference specific generating units or a system of units, and liquidated damages are the only remedy for non‐delivery.
Transmission No significant new bulk power transmission facilities are anticipated to be added during the winter assessment therefore, there are no concerns that reliability could be impacted if the line is delayed. WECC does not anticipate any impact to reliability due to out‐of‐service transmission lines or due to transmission constraints.
Operational Issues WECC did not perform any special operating studies concerning extreme weather or drought conditions for the winter assessment. No new operating procedures have been implemented to integrate variable resources into the bulk power grid. WECC does not anticipate any reliability concerns due to minimum demand and therefore possible over generation within subregions or due to demand response resources. No environmental or regulatory restrictions have been reported that are expected to adversely affect reliability during the study period. WECC does not anticipate any other unusual operating conditions that could significantly affect reliability for the upcoming winter.
Reliability Assessment WECC compares loads and resources against a building block guideline for Planning Reserve Margins. The building block approach has four elements: contingency reserves, regulating reserves, reserves for additional forced outages, and reserves for one in ten weather events. The building block values were developed for each BA and then aggregated by subregions and the entire WECC. The aggregated winter season building block guideline for the WECC Region is 14.5 percent. The projected margin for the peak month of December 2010, using only existing resources is 44.9 percent, and the margin for Deliverable resources is 47.4 percent. Both margins are substantially higher

Regional Reliability Self‐Assessm
ents
Regional Reliability Self-Assessments
158 NERC 2010/2011 Winter Reliability Assessment
than the building block guideline for 2010/2011of 14.5 percent, and compare favorably with the 2009/2010 margins of 48.0 percent and 50.9 percent respectively. WECC does not analyze possible fuel supply adequacy or fuel supply interruption. Coal‐fired plants have been built at or near their fuel sources and generally have long‐term fuel contracts with the mine operators, or actually own the mines. The current coal supply for these plants is considered adequate. Gas‐fired plants are historically located near major load centers and rely on relatively abundant western gas supplies from the San Juan Basin in the Four Corners area, the Permian Basin in western Texas, the gas fields in the Rocky Mountains, and the Sedimentary Basin in western Canada. Access to multiple supply Regions reduces the concerns of fuel supply interruption. Extreme winter weather during peak load conditions is not expected to have a significant impact on the fuel supply and WECC does not expect to experience reliability issues relating to fuel supply. Transmission Providers use the method and criteria contained in the appropriate standards including WECC Standard TOP‐STD‐007‐0‐ Operating Transfer Capability123 and FAC‐012‐1‐Transfer Capability Methodology. Additionally, each of WECC’s transmission authorities or transmission planners performs reliability studies on its own system and compares the study results to NERC and/or WECC standards124. Operating studies are reviewed to ensure that simultaneous transfer limitations of critical transmission paths are identified and managed through nomograms and operating procedures. Four subregional study groups prepare seasonal transfer capability studies for all major paths in a coordinated subregional approach for submission to WECC’s Operating Transfer Capability Policy Committee. Based on these ongoing activities, transmission system reliability within the Western Interconnection is expected to meet NERC and WECC standards.
Other Region‐Specific Issues WECC does not anticipate any reliability concerns for the upcoming winter season.
123 http://www.wecc.biz/committees/BOD/OTCPC/Shared%20Documents/OTCPC%20HANDBOOK.pdf 124Most resent results:
http://www.wecc.biz/committees/BOD/OTCPC/Shared%20Documents/Forms/AllItems.aspx?RootFolder=%2fcommittees%2fBOD%2fOTCPC%2fShared%20Documents%2fWinter%202010%2d2011%20Subregional%20Study%20Group%20Reports&FolderCTID=&View=%7bEEDBD198%2d82B1%2d42F5%2d99E4%2d38F7EF2C39B0%7d

Regio
nal R
eliability Self‐A
ssessmen
ts
Regional Reliability Self-Assessments
NERC 2010/2011 Winter Reliability Assessment 159
WECC‐Northwest Power Pool (NWPP)
Introduction The Northwest Power Pool (NWPP) is one of the four subregions of WECC and is comprised of all or major portions of the states of Washington, Oregon, Idaho, Wyoming, Montana, Nevada, and Utah, a small portion of northern California, and the Canadian provinces of British Columbia and Alberta. The Northwest Power Pool in collaboration with it members (20 BAs125) has conducted an assessment of reliability in response to questions raised regarding the ability of the NWPP to meet the load requirements during the winter 2010/2011. Since the NWPP is a large and diverse area of the Western Interconnection, its members face unique issues in the day‐to‐day coordinated operations of the system. The NWPP in aggregate is a winter peaking subregion with a large amount of hydroelectric resources. Analyses indicate the NWPP will have adequate generation capacity and energy, required operating reserve (regulating reserve and contingency reserve), and available transmission to be able to meet the forecasted firm loads for the 2010‐2011 winter operations, assuming normal ambient temperature and normal weather conditions. This assessment is valid for the NWPP as a whole; however, these overall results do not necessarily apply to all sub‐areas (individual members, balancing authorities, states, and/or provinces) when assessed separately. In 2007, Sacramento Municipal Utility District (SMUD) and Turlock Irrigation District (TID) joined the NWPP. By late 2009, both SMUD and TID were fully integrated into the NWPP operating programs including the Northwest Power Pool Reserve Sharing Group; hence, for purposes of all operating assessment, SMUD and TID are included in the NWPP operating assessments.
Historic Demand and Energy The NWPP 2009/2010 coincidental winter peak of 65,648 MW occurred on December 8, 2009. The 2009/2010 coincidental winter peak was 106 percent of the forecast; however, the coincidental peak occurred during below normal temperature conditions. There is still a large component of electric space heating load within the NWPP. Normalizing for temperature variance (50 percent probability), the 2009/2010 coincidental peak would have been 62,650 MW or 101.0 percent of the forecast.
Forecasted Demand and Energy The economic recession that began in 2007 has had an impact on the NWPP power usage and future forecasts. There has been no noticeable recovery to date. The 2010/2011 winter peak forecast for the NWPP of 64,000 MW. Which is based on normal weather, reflects the prevailing economic climate (stagnant), and has a 50 percent probability of not being exceeded.
125 Alberta Electric System Operator, British Columbia Transmission Corporation, Avista Corporation, Bonneville Power
Administration – Transmission, Tacoma Power, NatuEner Glacier Wind Energy, Northwest Energy, PacifiCorp – West, Portland General Electric Company, PUD No. 1 of Chelan County, PUD No. 2 of Grant County, PUD No. 1 of Douglas County, Puget Sound Energy, Seattle Department of Lighting, Western Area Power Administration – Upper Great Plains West, Idaho Power Company, PacifiCorp – East, Sierra Pacific Power Company, Sacramento Municipal Utility District, Turlock Irrigation District

Regional Reliability Self‐Assessm
ents
Regional Reliability Self-Assessments
160 NERC 2010/2011 Winter Reliability Assessment
The NWPP has approximately 575 MW of interruptible demand capability and load management. In addition, the load forecast incorporates any benefit (load reduction) associated with demand‐side resources, and is not controlled by the individual utilities. Some of the entities within the NWPP have specific programs to manage peak issues during extreme conditions. Normally these programs are used to meet the entities’ operating reserve requirements and have no discernable impacts on the projected NWPP peak load. Under normal weather conditions, the NWPP does not anticipate dependence on imports from external areas during winter peak demand periods. However, if much lower than normal precipitation were to occur, it may be extremely advantageous to maximize the transfer capabilities from outside the NWPP to reduce reservoir drafts.
Resource Assessment Approximately 60 percent of the NWPP resource capability is from hydroelectric generation. The remaining generation is produced from conventional thermal plants and miscellaneous resources, such as non‐utility owned gas‐fired cogeneration or wind. Hydroelectric Capability – Northwest power planning is done by sub‐area. Idaho, Nevada, Wyoming, Utah, British Columbia and Alberta individually optimize their resources to their demand. The Coordinated System (Oregon, Washington and western Montana) coordinates the operation of its hydroelectric resources to serve its demand. The Coordinated System hydroelectric operation is based on critical water planning assumptions (currently the 1936‐1937 water year). Critical water in the Coordinated System equates to approximately 11,000 average megawatts of firm energy load carrying capability, when reservoirs start full. Under Average water year conditions, the additional non‐firm energy available is approximately 3,000 average megawatts.
The Coordinated System hydroelectric reservoirs refilled to approximately 80 percent of the Energy Content Curve by July 31, 2010. April through July – This period is the refill season when reservoirs store spring runoff. The water fueling associated with hydroelectric powered resources can be difficult to manage because there are several competing purposes including, but not limited to: current electric power generation, future (winter) electric power generation, flood control, and biological opinion requirements resulting from the Endangered Species Act, as well as, special river operations for recreation, irrigation, navigation, and the refilling of the reservoirs each year. Any time precipitation levels are below normal, balancing these interests becomes even more difficult. With the competition for the water, power operations for the 2011 may be difficult. The goal is to manage all the competing requirements while refilling the reservoirs to the highest level possible. Sustainable Hydroelectric Capability – Operators of the hydroelectric facilities maximize the hydrology throughout the year while assuring all the competing purposes are evaluated. Although available capacity margin at time of peak can be calculated to be greater than 20 percent, this can be misleading. Since hydroelectric can be limited due to conditions (either lack of water or imposed restrictions), the expected sustainable capacity must be determined before establishing a representative capacity margin. In other words, the firm energy load carrying capability (FELCC) is the amount of energy that the system may be called on to produce on a firm or guaranteed basis during actual operations. The FELCC is highly dependent upon the availability of water for hydroelectric generation.

Regio
nal R
eliability Self‐A
ssessmen
ts
Regional Reliability Self-Assessments
NERC 2010/2011 Winter Reliability Assessment 161
The NWPP has developed the expected sustainable capacity based on the aggregated information and estimates that the members have made with respect to their own hydroelectric generation. Sustainable capacity is for periods at least greater than two‐hours during daily peak periods assuming various conditions. This aggregated information yields a reduction for sustained capability of approximately 7,000 MW. This reduction is more relative to the Northwest in the winter; however, under summer extreme low water conditions, it affects summer conditions, too.
Thermal Generation – No thermal plant or fuel problems are anticipated. To the extent that existing thermal resources are not scheduled for maintenance, thermal and other resources should be available as needed during the winter peak. Thermal Generation and Hydroelectric Generation Integration – The diversity of the NWPP provides operational efficiencies. The northwest area of the NWPP peaks in the winter whereas the Rocky Mountain area peaks in the summer. In addition, the eastern area of the NWPP has the majority of the thermal generation whereas the western area of the NWPP has the majority of the hydroelectric generation. This allows the maximum integration of the resources to meet the NWPP coincidental peak for both the winter and the summer. In addition, this allows the twenty BAs to maximize the use of the transmission while meeting firm customer load. The thermal generation in the east integrated with the hydroelectric generation in the west, improves the total available firm energy and increases the NWPP’s system reliability. Having the flexibility to use hydroelectric generation to meet peak and based load thermal generation to meet the firm energy requirements is predicated on availability of transmission; refer to the transmission operating issues below. Wind Generation – Several states have enacted renewable portfolio standards, which will require some NWPP members within the next few years to satisfy at least 20 percent of their load with energy generated from renewable resources. This may result in a significant increase in variable generation within the NWPP, creating new operational challenges, which will have to be addressed soon and will require that appropriate systems be put into place. Some of the safety net programs such as balancing resources, contingency reserve, and under frequency load shedding will be re‐evaluated for effectiveness. The NWPP estimated installed wind generation capacity for 2010/2011 winter season is approximately 7,300 MW, contributing only approximately 1,500 MW on‐peak. With the increasing variable generation, conventional operation of the existing hydroelectric and thermal resources are being impacted. The wind generation manufactures’ standard operating temperature for wind turbines range from ‐10 degrees C to +4 degrees C (14 degrees F to 104 degrees F). During the winter peaking period, the temperature in the areas where the majority of the wind turbines are located can go below 14 degrees F, leaving no capability from the wind generation during those periods. In addition, there is a risk of over‐generation in the spring and fall. When both the wind and hydroelectric generation are both in high generation mode, and given the environmental constraints on dissolved gases in the river, there are times when generation may exceed load plus the ability to export.

Regional Reliability Self‐Assessm
ents
Regional Reliability Self-Assessments
162 NERC 2010/2011 Winter Reliability Assessment
Biomass Generation – The installed capacity of biomass generation within the NWPP is 670 MW with expected on‐peak amounts of 668 MW.
Other Generation – Within the NWPP there is an underground natural gas storage facility that is 100 percent full. This storage is located near many of the gas plants located in the NWPP, minimizing any effect that a regional gas problem might cause. In addition, one BA in the NWPP has an excess of 700 MW of generation that can be fired on diesel fuel.
External Resources – No resources external to the NWPP are assumed for the winter season. However, one BA located in the NWPP has an exchange agreement with an entity in the California region for excess energy up to 300 MW per hour delivered firm to the BA system. This exchange agreement is for the period November through February with a total potential delivery of 413,000 MWh.
Transmission Assessment Several BAs are constructing new transmission within the NWPP to address load service issues. The new transmission has low impact on the over‐all transfer of power from one zone to another. No significant transmission lines are scheduled to be out‐of‐service during the winter season. Constrained paths within the NWPP are known and operating studies modeling these constraints have been performed. Because of these studies, operating procedures have been developed to assure safe and reliable operations. System Operating Limits – The interregional transmission transfer capabilities based on System Operating Limits (SOLs) as determined by the Northwest Operational Planning Group (NOPSG) and approved by WECC’s Operating Transfer Capability Policy Committee (OTCPC) are listed below:
Table WECC‐1: NWPP Transmission
Path Name Path # Rating (MW) 2010‐11 Winter SOL
(OTC) (MW)
Alberta‐BC (E‐W) 1 1000 (E‐W) 450‐1000 (E‐W)
Alberta‐BC (W‐E) 1 1200 (W‐E) 600‐1200 (W‐E)
NW‐Canada (N‐S) 3 3150 (N‐S) 3150 (N‐S)
NW‐Canada (S‐N) 3 2000 (S‐N) 2000 (S‐N)
West of Cascades North (E‐W) 4 10,200 (E‐W) 10,200 (E‐W)
West of Cascades North (W‐E) 4 10,200 (W‐E) 10,200 (W‐E)
West Of Cascades South (E‐W) 5 7000 (E‐W) 7000 (E‐W)
West Of Cascades South (W‐E) 5 7000 (W‐E) 7000 (W‐E)
West of Hatwai (E‐W) 6 4277 (E‐W) 4250 (E‐W)
Montana to Northwest (E‐W) 8 2200 (E‐W) 2200 (E‐W)
Montana to Northwest (W‐E) 8 1350 (W‐E) 1321‐1350 (W‐E)
Idaho‐Northwest (W‐E) 14 1200 (W‐E) 1200 (W‐E)
Idaho‐Northwest (E‐W) 14 2400 (E‐W) 2400 (E‐W)

Regio
nal R
eliability Self‐A
ssessmen
ts
Regional Reliability Self-Assessments
NERC 2010/2011 Winter Reliability Assessment 163
Table WECC‐1: NWPP Transmission
Path Name Path # Rating (MW) 2010‐11 Winter SOL
(OTC) (MW)
Sierra‐Idaho (N‐S) 16 500 (N‐S) 500 (N‐S)
Sierra‐Idaho (S‐N) 16 360 (S‐N) 262 (S‐N)
Borah‐West (E‐W) 17 2557 (E‐W) 2557 (E‐W)
Idaho‐Montana (N‐S) 18 356 (N‐S) 356 (N‐S)
Idaho‐Montana (S‐N) 18 337 (S‐N) 256 (S‐N)
Bridger West (E‐W) 19 2200 (E‐W) 2200 (E‐W)
Path C (N‐S) 20 1600 (N‐S) 1600 (N‐S)
Path C (S‐N) 20 1250 (S‐N) 1250 (S‐N)
Sierra‐PG&E (E‐W) 24 160 (E‐W) 150 (E‐W)
Sierra‐PG&E (W‐E) 24 160 (W‐E) 70 (W‐E)
Sierra‐Utah (E‐W) 32 440 (E‐W) 370 (E‐W)
Sierra‐Utah (W‐E) 32 235 (W‐E) 235 (W‐E)
TOT 2C (N‐S) 35 300 (N‐S) 300 (N‐S)
TOT 2C (S‐N) 35 300 (S‐N) 300 (S‐N)
Brownlee East (W‐E) 55 1915 (W‐E) 1915 (W‐E)
PDCI (N‐S) 65 3100 (N‐S) 2890‐3100 (N‐S)
PDCI (S‐N) 65 3100 (S‐N) 2200 (S‐N)
COI + NW‐Sierra (N‐S) 66 4800 (N‐S) 4470‐4800 (N‐S)
COI + NW‐Sierra (S‐N) 66 3675 (S‐N) 3675 (S‐N)
Hemingway‐Summer Lake (E‐W) 75 1500 (E‐W) 1500 (E‐W)
Hemingway‐Summer Lake (W‐E) 75 550 (W‐E) 400 (W‐E)
NW‐Sierra (S‐N) 76 300 (S‐N) 300 (S‐N)
NW‐Sierra (N‐S) 76 300 (N‐S) 300 (N‐S)
TOT 2B1 (N‐S) 78 530 (N‐S) 530 (N‐S)
TOT 2B1 (S‐N) 78 600 (S‐N) 600 (S‐N)
TOT 2B2 (N‐S) 79 265 (N‐S) 256 (N‐S)
TOT 2B2 (S‐N) 79 300 (N‐S) 300 (N‐S)
NW‐Sierra (N‐S) 76 300 (N‐S) 300 (N‐S)

Regional Reliability Self‐Assessm
ents
Regional Reliability Self-Assessments
164 NERC 2010/2011 Winter Reliability Assessment
Transmission Operating Issues The vast area of the NWPP presents unique operating issues associated with transmission constraints. Recognizing these constraints may result in limitation of the NWPP operating programs. The critical transmission constraints are known and result in the following zones within the NWPP.
The BAs constantly monitor critical paths to assure availability of room on the transmission system for flow of contingency reserve from one zone to another. Seven critical paths allow the NWPP to enjoy maximum efficiency and reliability. These critical paths are Path 1 Alberta to British Columbia; Path 3 British Columbia to Oregon‐Washington‐Montana; Path 66 Oregon‐Washington‐Montana to Northern California; Path 14 and Path 55 Oregon‐Washington‐Montana to Idaho; Path 16 and Path 20 Idaho to Nevada‐Wyoming‐Utah. If any of these Paths become constraint, the ability to maximize efficiency and reliability is significantly reduced within the NWPP. Due to transmission additions, the Path 20 SOL has increased by more than 250 MW northbound and by over 700 MW southbound resulting in increased efficiency and reliability. Depending upon the constraint, the above zones may become isolated and therefore dependent upon the resources within the zones to meet the reliability requirements. Operational constraints are seldom a limiting factor. However, when they are limiting, the operating programs are designed to assure reliability is met all the time, even under transmission constraints. Outage Coordination – The NWPP coordinated outage (transmission) system (COS) was designed to assure that outages could be coordinated among all stakeholders (operators, maintenance personnel, transmission users, and operations planners) in an open process. This process had to assure that proper operating studies were accomplished and transmission affects and limits known, to fulfill a requirement from the 1996 west coast disturbances that the system be operated only under studied conditions. The

Regio
nal R
eliability Self‐A
ssessmen
ts
Regional Reliability Self-Assessments
NERC 2010/2011 Winter Reliability Assessment 165
WECC Reliability Coordinator is involved in the outage coordination process and has direct access to the outage database. Monthly Coordination – The process requires NWPP members to designate significant facilities that, if out of service by itself or in conjunction with another outage, will affect system capabilities. The significant facilities are defined and updated annually by the NWPP members. The scheduled outage of these critical facilities are posted on a common database. All utilities post proposed significant outages on WECC’s COS. Outages are to be submitted to the COS at least 45 days ahead of the month they are proposed to occur so they can be viewed by interested entities. The involved entities then facilitate the NWPP coordination of all these outages. Entities can comment on the preliminary impacts and schedules may be adjusted to maximize reliability and minimize market impacts. If coincidental outages cause too severe of an impact, the requesting utilities work together to adjust schedules accordingly. A final outage plan is posted with estimated path capabilities 30 days prior to the month in which the outages will occur. Detailed operational transfer capability studies are then performed and the limits for each affected path are posted at least 15 days prior to the outage. Emergency outages can be requested outside these schedule guidelines. Emergency outages are coordinated among adjacent utilities to minimize system exposure. Utilities can use the COS to assure system topology is correct for next day studies. As transmission operators increase the amount of short‐term outages in addition to the significant outages, the WECC Reliability Coordinator (RC) will be able to access the WECC COS database and use the final outage schedule in its real‐time system analysis. This coordinated outage process has been very effective. The outage information is used by NWPP member utilities to perform system studies to maximize system reliability. Semi‐annual planning ‐ Long‐Range Significant Outage Planning (LRSOP) – The NWPP staff facilitates outage meetings every six months with each utility’s outage coordinator to discuss proposed longer‐term outages. Utilities discuss anticipated outages needed for time critical construction and periods where transmission capacity may need to be maximized. The outages are posted on the WECC COS and on the individual companies’ OASIS sites. Specific responsibilities of LRSOP include:
Share outage information with all parties affected by outages of significant equipment (i.e., equipment that affects the transfer capability of rated paths). Information is shared two times each year for a minimum of a six‐month period. The first meeting each year coordinates outages for July through December. The second meeting coordinates outages for January through June.
Review the outage schedules to assure that needed outages can be reliably accomplished with minimal impact on critical transmission use.
Outage coordinators are to post the outages on the COS within the applicable timeframes.
Next Day Operating Studies – Additional path curtailments may be required depending upon current system conditions and outages. These curtailment studies are performed by the individual path operators based on the outage schedule developed through the COS process. According to the COS process, these studies are performed at least 15 days prior to the outage. Individual path operators and transmission owners may also perform updated next day studies to capture emergency outage requests and current system conditions such as generation dispatch to determine if the SOL studies and limits are still valid. Based on these studies, additional SOL curtailments may be made by the path operators. The modified SOL’s are posted on the individual transmission owner’s OASIS and the RC is notified.
Regional Reliability Self‐Assessm
ents
Regional Reliability Self-Assessments
166 NERC 2010/2011 Winter Reliability Assessment
The WECC RC also performs system studies to ensure interconnected system reliability. The WECC RC performs real‐time system thermal studies to evaluate current operating conditions across the entire Interconnection. The WECC RC is in the process of incorporating real‐time voltage tools to complement the thermal analysis currently being performed. Transient stability analysis capability is planned in the future. When the WECC RC observes real‐time reliability problems, they contact the path operator to discuss the issue and work on a solution. The WECC RC will make a directive for action if there is an imminent reliability threat and the BA does not eliminate the reliability issue within an appropriate timeframe. Voltage Stability – The WECC‐1‐CR System Performance Criteria, requirement WRS3 is used to plan adequate voltage stability margins in the NWPP as appropriate. Simulations are used to assure system performance is adequate and meets the required criteria.
Operating Issues The NWPP does not anticipate any operating issues for the 2010/2011 winter season.
Reliability Assessment Analysis The NWPP does not have one explicit method for determining an adequacy margin. Bonneville Power Administration uses the Northwest Power and Conservation Council’s resource adequacy standard, which establishes targets for both the energy and capacity adequacy metrics derived from a loss of load probability analysis. Others will use NERC’s reserve margin approach. Since no one method exists for the entire NWPP, we have elected to use the NERC’s reserve margin analysis for the winter assessment. The 2010/2011 NWPP generating capability is projected to be 87,000 MW, prior to adjusting for maintenance. Based on prior operating season, we have assumed 1,500 MW contributions from wind resources during peak conditions. In determining planning margins for the current winter season one must further adjust for the operating reserve requirement, which is approximately 4,200 MW. At this point, based on a load of 50 percent probability not to exceed, the planning margin is approximately 20 percent. A severe weather event for the entire NWPP would add approximately 6,000 MW of load while at the same time under extreme water restrictions the sustained hydroelectric generation would reduce the capability by 7,000 MW. In addition, under the severe weather conditions, wind generation is expected to be minimal. However, accounting for the severe weather event and the available generation, the NWPP will meet the peak load requirements with no additional margin. Contingency Reserve Sharing Procedure As permitted by NERC and WECC criteria and standards, the Operating Committee of the NWPP has instituted a Reserve Sharing Program for contingency reserve. Those who participate in a Reserve Sharing Group (RSG) are better positioned to meet the NERC disturbance control standard because they have access to a deeper and more diverse pool of shared reserve resources. In addition, an increase in efficiency is obtained since the shared reserve obligation for the group, as a whole, is less than the sum of each participant’s reserve obligation computed separately. By sharing contingency reserve, the participants are entitled to use not only their own “internal” reserve resources, but to call on other participants for assistance if internal reserve does not fully cover a contingency. The reserve sharing process for the NWPP has been automated. A manual backup process

Regio
nal R
eliability Self‐A
ssessmen
ts
Regional Reliability Self-Assessments
NERC 2010/2011 Winter Reliability Assessment 167
is also in place if communication links are down or the computer system for reserve sharing is not functioning correctly. The NWPP is designated as an RSG as provided under WECC Operating Reliability Criteria. Each member of the RSG submits its contingency reserve obligation (CRO) and most severe single contingency (MSSC) to a central computer. The combined member CRO must be larger than the RSG MSSC. If not, then each member’s CRO is proportionally increased until this requirement is met. When any RSG member loses generation they have the right to call upon reserves from the other RSG members as long as they have first committed their own CRO. A request for contingency reserve must be sent within four minutes after the generation loss and the received contingency reserve can only be held for 60 minutes. A request is sent via the member’s energy management system to the central computer. The central computer then distributes the request proportionally among members within the RSG. Each member may be called to provide reserve up to its CRO. Critical transmission paths are monitored in this process to ensure SOL limits are not exceeded. If a transmission path SOL is exceeded the automated program redistributes the request among RSG members that are delivering reserve along non‐congested paths. The WECC RC continuously monitors the adequacy of the RSG reserve obligation, MSSC, and the deployment of reserve. If a reserve request fails due to various reasons, backup procedures are in place to fully address the requirements. Reliability Coordinator The Reliability Coordinator is responsible for monitoring, advising, and directing action when necessary, in order to preserve the reliability of transmission service between and within the interconnected systems of all balancing authorities within the Western Interconnection.
Strategic Undertakings Adequacy Response Team – The NWPP has developed an Adequacy Response Process whereby a team addresses the area’s ability to avoid a power emergency by promoting Regional coordination and communications. Essential pieces of that effort include timely analyses of the power situation and communication of that information to all parties including but not limited to utility officials, elected officials and the general public.
Emergency Response Team (ERT) – In the fall of 2000, the area developed an Emergency Response Process to address immediate power emergencies. The ERT remains in place and would be used in the event of an immediate emergency. The ERT would work with all parties in pursuing options to resolve the emergency including but not limited to load curtailment and or imports of additional power from other areas outside of the NWPP.
Largest Risk The largest risk facing BAs within the NWPP is a significant weather event that would last over a five‐day period and have temperatures at 20 degrees F or more below normal. This type of an event would increase the overall NWPP load by 6,000 MW. Any additional contingency during such a weather event could cause loss of local load.
Conclusions In view of the present overall power conditions, including the forecasted water condition, the area represented by the NWPP is estimating that it will be able to meet firm loads including the required operating reserve. Should any resources be lost to the area beyond the contingency reserve requirement and/or loads are greater than expected because of extreme weather, the NWPP may have to look to alternatives, which may include emergency measures to meet obligations.

Regional Reliability Self‐Assessm
ents
Regional Reliability Self-Assessments
168 NERC 2010/2011 Winter Reliability Assessment
WECC—Rocky Mountain Reserve Group (RMRG)
Demand The RMRG subregion has two BAs126 and includes all or part of the states of Wyoming, South Dakota, Nebraska, and Colorado. This subregion’s peak demand may occur in either summer or winter. The 2010/2011 winter coincidental peak demand forecast of 9,753 MW, projected to occur in December 2010, is 5.0 percent less than last winter’s actual peak demand of 10,261 MW, which occurred in December 2009. The 2010/2011 winter coincidental peak forecast is 1.1 percent less than last winter’s non‐coincidental forecast peak demand of 9,859 MW, which was projected to occur in December 2009. The expected load growth decline for the 2010/2011 winter season is largely attributed to the economic decline that has affected the area, and the use of coincidental forecast. Last winter’s peak demand was 4.1 percent greater than the forecast peak demand. For the 2010/2011 winter period, direct control load management demand, contractually interruptible demand, critical peak‐pricing with control demand and load as a capacity resources demand total 234 MW. As a percent of Total Internal Demand, demand response could reduce peak demand by 2.4 percent. The projected reserve margin for the peak month is 63.2 percent, well above the building block guideline of 13.9 percent.
Generation WECC modeled the RMRG subregion using existing capacity for the peak month of December 2010, totaling 14,757 MW, including 1,215 MW of wind (379 MW expected on peak), and eight MW of solar (zero MW expected on peak). The Deliverable Capacity resources total 14,857 MW, including 1,215 MW of wind (379 MW expected on peak), and eight MW of solar (zero MW expected on peak). Hydroelectric conditions for the 2010/2011 winter period are expected to be below normal on the Colorado River system and normal to above normal on other river drainages but the reservoir releases should be similar to last year. The RMRG subregion is not currently experiencing, and does not expect to experience, any weather or fuel related issues that would reduce capacity during the winter study period. Additionally, generating units that are expected to be taken out‐of‐service should not have an effect on reliability.
Capacity Transactions WECC does not track subregional purchase/sale contracts or their associated transmission. Only transfers from remotely owned large thermal and hydroelectric units (resources located outside of the owners subregion) are allocated to the owner’s subregion. All other transfers are theoretical transfers that could happen, but are not actual contracts. This treatment ensures that resources are counted once and only once. The RMRG subregion is a net exporter of remotely owned generation.
Transmission No significant new bulk power transmission facilities are anticipated to be added during the winter assessment therefore, there are no concerns that reliability could be impacted if the line is delayed. WECC does not anticipate any impact to reliability due to out‐of‐service transmission lines or due to transmission constraints. However, the transmission path between southeastern Wyoming and Colorado often becomes heavily loaded, as do the transmission interconnections to Utah and New
126 Public Service Company of Colorado, Western Area Power Administration – Colorado‐Missouri Region

Regio
nal R
eliability Self‐A
ssessmen
ts
Regional Reliability Self-Assessments
NERC 2010/2011 Winter Reliability Assessment 169
Mexico. WECC’s Unscheduled Flow Mitigation Plan127 may be invoked to provide line‐loading relief for these paths, if needed.
Operational Issues WECC did not perform any special operating studies concerning extreme weather or drought conditions for the winter assessment. No new operating procedures have been implemented to integrate variable resources into the bulk power grid. WECC does not anticipate any reliability concerns due to minimum demand within subregions or due to demand response resources. No environmental or regulatory restrictions have been reported that are expected to adversely affect reliability during the study period. WECC does not anticipate any other unusual operating conditions that could significantly affect reliability for the upcoming winter.
Reliability Assessment WECC compares loads and resources against a building block guideline for Planning Reserve Margins. The building block approach has four elements: contingency reserves, regulating reserves, reserves for additional forced outages, and reserves for one in ten weather events. The building block values were developed for each BA and then aggregated by subregions and the entire WECC. The aggregated winter season building block guideline for the RMRG subregion is 13.9 percent. The projected margin for the peak month of December 2010, using Existing resources is 62.2 percent, and for deliverable resources is 63.2 percent. Both margins are substantially higher than the building block guideline for 2010/2011 of 13.9 percent, and are higher than the 2009/2010 margins of 26.4 percent and 31.9 percent respectively. The margins are higher in current assessment because resources were allocated to the RMRG that have been considered in the NWPP in prior assessments. WECC does not analyze possible fuel supply adequacy or fuel supply interruption. Coal‐fired plants have been built at or near their fuel source and generally have long‐term fuel contracts with the mine operators, or actually own the mines. The current coal supply for these plants is considered adequate. Gas‐fired plants are historically located near major load centers and rely on relatively abundant western gas supplies from the San Juan Basin in the Four Corners area, the Permian Basin in western Texas, the gas fields in the Rocky Mountains, and the Sedimentary Basin in western Canada. Access to multiple supply Regions reduces the concerns of fuel supply interruption. Extreme winter weather during peak load conditions is not expected to have a significant impact on the fuel supply and WECC does not expect to experience reliability issues relating to fuel supply. Dynamic and static reactive power studies were performed by BAs within the RMRG subregion for the 2010/2011 winter. These studies indicated that there are sufficient reactive supplies issues for the upcoming winter.
127 WECC Unscheduled Flow Mitigation Plan

Regional Reliability Self‐Assessm
ents
Regional Reliability Self-Assessments
170 NERC 2010/2011 Winter Reliability Assessment
WECC—Southwest Reserve Sharing Group (SRSG)
Demand The SRSG subregion has 12 BAs128 and includes all or part of the states of Nevada, California, Arizona, New Mexico, and Texas. The SRSG is a summer peaking subregion. The 2010/2011 winter coincidental peak demand forecast of 17,228 MW, projected to occur in December 2010, is 4.0 percent greater than last winter’s actual peak demand of 16,568 MW, which occurred in December 2009. The 2010/2011 winter coincidental peak forecast is 8.7 percent less than last winter’s non‐coincidental forecast peak demand of 18,880 MW, which was projected to occur in December 2009. For the 2010/2011 winter period, direct control load management demand, contractually interruptible demand, critical peak‐pricing with control demand and load as a capacity resources demand total 489 MW. As a percent of Total Internal Demand, demand response could reduce peak demand by 2.8 percent. The projected reserve margin for the peak month is 90.2 percent and excludes 25 MW of transmission‐limited resources, well above the building block guideline of 13.8 percent.
Generation WECC modeled the SRSG subregion using Existing Capacity for the peak month of December 2010 totaling 37,977 MW, including 392 MW of wind (25 MW expected on peak), 88 MW of solar (zero MW expected on peak), and 24 MW of biomass (all expected on peak). The Deliverable Capacity resources total 38,074 MW, including 392 MW of wind (25 MW expected on peak), 113 MW of solar (zero MW expected on peak), and 24 MW of biomass (all expected on peak). The SRSG subregion is not currently experiencing, and does not expect to experience, any weather or fuel related issues that would reduce capacity during the winter study period. Additionally, generating units that are expected to be taken out‐of‐service should not have an effect on reliability.
Capacity Transactions WECC does not track subregional purchase/sale contracts or their associated transmission. Only transfers from remotely owned large thermal and hydroelectric units (resources located outside of the owners subregion) are allocated to the owner’s subregion. All other transfers are theoretical transfers that could happen, but are not actual contracts. This treatment ensures that resources are counted once and only once. The SRSG subregion is a net exporter of remotely owned generation.
Transmission No significant new bulk power transmission facilities are anticipated to be added during the winter assessment therefore, there are no concerns that reliability could be impacted if the line is delayed. WECC does not anticipate any impact on reliability due to out‐of‐service transmission lines or due to transmission constraints. Based on inter‐ and intra‐area studies, the transmission system is considered adequate for projected firm transactions and a significant amount of economy electricity transfers. When necessary, phase‐shifting transformers in the southern Utah/Colorado/Nevada transmission system will be used to help control unscheduled flows. Reactive reserve margins have been studied and are expected to be adequate throughout the area.
128 Arizona Public Service Company, Arlington Valley, El Paso Electric Company, Gila River Maricopa Arizona, Griffith Energy,
Harquahala Generating Maricopa Arizona, Nevada Power Company, Public Service Company of New México , Salt River Project, Tucson Electric Power Company, Western Area Power Administration – Lower Colorado Region, Imperial Irrigation District

Regio
nal R
eliability Self‐A
ssessmen
ts
Regional Reliability Self-Assessments
NERC 2010/2011 Winter Reliability Assessment 171
Operational Issues WECC did not perform any special operating studies concerning extreme weather or drought conditions for the winter assessment. No new operating procedures have been implemented to integrate variable resources into the bulk power grid. WECC does not anticipate any reliability concerns due to minimum demand within subregions or due to demand response resources. No environmental or regulatory restrictions have been reported that are expected to adversely affect reliability during the study period. WECC does not anticipate any other unusual operating conditions that could significantly affect reliability for the upcoming winter.
Reliability Assessment WECC compares loads and resources against a building block guideline for Planning Reserve Margins. The building block approach has four elements: contingency reserves, regulating reserves, reserves for additional forced outages, and reserves for one in ten weather events. The building block values were developed for each BA and then aggregated by subregions and the entire WECC. The aggregated winter season building block guideline for the SRSG subregion is 13.8 percent. The projected margin for the peak month of December 2010 using existing resources is 89.6 percent, and for Deliverable resources is 90.2 percent. Both margins are substantially higher than the building block guideline for 2010/2011 of 13.8 percent, and are higher than the 2009/2010 margins of 51.6 percent and 52.5 percent respectively. The margins are higher in current assessment due to lower coincidental demand in the subregion. WECC does not analyze possible fuel supply adequacy or fuel supply interruption. Coal‐fired plants have been built at or near their fuel source and generally have long‐term fuel contracts with the mine operators, or actually own the mines. The current coal supply for these plants is considered adequate. Gas‐fired plants are historically located near major load centers and rely on relatively abundant western gas supplies from the San Juan Basin in the Four Corners area, the Permian Basin in western Texas, the gas fields in the Rocky Mountains, and the Sedimentary Basin in western Canada. Access to multiple supply Regions reduces the concerns of fuel supply interruption. Extreme winter weather during peak load conditions is not expected to have a significant impact on the fuel supply and WECC does not expect to experience reliability issues relating to fuel supply. The SRSG subregion is a summer peaking area. Therefore, although Dynamic and Static Reactive power studies were performed for the summer peaking season, no such studies were performed for the 2010/2011 winter timeframe.

Regional Reliability Self‐Assessm
ents
Regional Reliability Self-Assessments
172 NERC 2010/2011 Winter Reliability Assessment
WECC—California/México (CA/MX)
Demand The CA/MX subregion has three BAs129 and includes part of the state of California and part of Baja México, and is a summer‐peaking subregion. The 2010/2011 winter coincidental peak demand forecast of 38,836 MW, projected to occur in December 2010 is approximately equal to last winter’s actual December 2009 peak demand of 38,831 MW. The 2010/2011 winter coincidental peak forecast is 10.2 percent less than last winter’s non‐coincidental forecast peak demand of 43,226 MW, which was projected to occur in December 2009. The areas 2009/2010 winter peak demand occurred during a period of generally colder than normal temperatures and was 10.2 percent less than the forecast. For the 2010/2011 winter period, direct control load management demand, contractually interruptible demand, critical peak‐pricing with control demand and load as a capacity resources demand total 1,384 MW. As a percent of Total Internal Demand, demand response could reduce peak demand by 3.6 percent. The projected reserve margin for the peak month is 73.4 percent, well above the building block guideline of 11.5 percent.
Generation WECC modeled the CA/MX subregion using Existing Capacity for the peak month of December 2010 totaling 49,683 MW, including 2,154 MW of wind (225 MW expected on peak), 431 MW of solar (zero MW expected on peak), and 477 MW of biomass (418 MW expected on peak). The Deliverable Capacity resources total 51,100 MW, including 2,469 MW of wind (229 MW expected on peak), 493 MW of solar (57 MW expected on peak), and 477 MW of biomass (418 MW expected on peak). California is currently in a normal hydroelectric condition with adequate reservoir levels and it is expected that the area will have sufficient resources to meet its winter peak demand and energy resources. The CA/MX subregion is not currently experiencing, and does not expect to experience, any weather or fuel related issues that would reduce capacity during the winter study period. Additionally, generating units that are expected to be taken out‐of‐service should not have an effect on reliability.
Capacity Transactions WECC does not track subregional purchase/sale contracts or their associated transmission. Only transfers from remotely owned large thermal and hydroelectric units (resources located outside of the owners subregion) are allocated to the owner’s subregion. All other transfers are theoretical transfers that could happen, but are not actual contracts. This treatment ensures that resources are counted once and only once. The CA/MX subregion is a net importer of remotely owned generation.
Transmission No significant new bulk power transmission facilities are anticipated to be added during the winter assessment therefore, there are no concerns that reliability could be impacted if the line is delayed. Although several major constrained transmission paths have been upgraded in recent years, path constraints can still exist. Operating procedures are in place to manage any high loading conditions that may occur during the winter. Entities within the area have not reported any concerns with maintaining adequate reactive reserve margins.
129 California Independent System Operator, Los Angeles Department of Water and Power, Comisión Federal de Electricidad
Regio
nal R
eliability Self‐A
ssessmen
ts
Regional Reliability Self-Assessments
NERC 2010/2011 Winter Reliability Assessment 173
All power plants in California are required to operate in accordance with strict air quality environmental regulations. Some plant owners have upgraded emission control equipment to remain in compliance with increasing emission limitations while other owners have chosen to discontinue operating some plants. The effects of owners’ responses to environmental regulations have been accounted for in the area’s resource data and it is not expected that environmental issues will have additional adverse impacts on resource adequacy within the area during the upcoming winter season.
Operational Issues WECC did not perform any special operating studies concerning extreme weather or drought conditions for the winter assessment. No new operating procedures have been implemented to integrate variable resources into the bulk power grid. WECC does not anticipate any reliability concerns due to minimum demand within subregions or due to demand response resources. No environmental or regulatory restrictions have been reported that are expected to adversely affect reliability during the study period. WECC staff does not anticipate any other unusual operating conditions that could significantly affect reliability for the upcoming winter.
Reliability Assessment WECC compares loads and resources against a building block guideline for Planning Reserve Margins. The building block approach has four elements: contingency reserves, regulating reserves, reserves for additional forced outages, and reserves for one in ten weather events. The building block values were developed for each BA and then aggregated by subregions and the entire WECC. The aggregated winter season building block guideline for the CA/MX subregion is 11.5 percent. The projected margin for the peak month of December 2010 using Existing resources is 70.1 percent, and for Deliverable resources is 73.4 percent. Both margins are substantially higher than the building block guideline for 2010/2011 of 11.5 percent, and are higher than the 2009/2010 margins of 35.3 percent and 37.0 percent respectively. The margins are higher in current assessment due to lower coincidental demand in the subregion. WECC does not analyze possible fuel supply adequacy or fuel supply interruption. Coal‐fired plants have been built at or near their fuel source and generally have long‐term fuel contracts with the mine operators, or actually own the mines. The current coal supply for these plants is considered adequate. Gas‐fired plants are historically located near major load centers and rely on relatively abundant western gas supplies from the San Juan Basin in the Four Corners area, the Permian Basin in western Texas, the gas fields in the Rocky Mountains, and the Sedimentary Basin in western Canada. Access to multiple supply Regions reduces the concerns of fuel supply interruption. Extreme winter weather during peak load conditions is not expected to have a significant impact on the fuel supply and WECC does not expect to experience reliability issues relating to fuel supply. Southern California and México are summer peaking areas. Therefore, although Dynamic and Static Reactive power studies were performed for the summer peaking season, no such studies were performed for the 2010/2011 winter timeframe. No northern California entities reported any Dynamic and Static Reactive power studies for the 2010/2011 winter season.

Regional Reliability Self‐Assessm
ents
Regional Reliability Self-Assessments
174 NERC 2010/2011 Winter Reliability Assessment
Region Description The WECC Region is a summer peaking Region that is comprised of 37 balancing authorities. The WECC Region is nearly 1.8 million square miles, including the provinces of Alberta and British Columbia in Canada, the northern portion of Baja California in México, and all or portions of the 14 Western states in between. It is the largest and most diverse of the eight NERC Regional reliability organizations. Additional information regarding WECC can be found at www.wecc.biz.

Regio
nal R
eliability Self‐A
ssessmen
ts
Regional Reliability Self-Assessments
NERC 2010/2011 Winter Reliability Assessment 175
WECC Scheduled Transmission Facility Additions, Retirements, and Re‐ratings
Table WECC‐2: WECC Transmission System Additions and Upgrades (100 kV and Above) from April 2010 through February 2011
Transmission Project Name Voltage (kV)
Length (Miles)
In‐ Service Date
Description / Status
Northwest Power Pool
Malaspina‐East Toba 230 107 May 2010 In Service
Hemingway‐Bowmont 230 8 June 2010 In Service
Rapids‐South Nile 115 6 December 2010 Under Construction
Rocky Mountain
Cheyenne‐Ault 230 35 May 2010 In Service
Erie‐Hoyt 115 45.3 August 2010 In Service
Richard Lake‐Wellington 115 8 December 2010 Under Construction
Southwest
Morgan‐Pinnacle Peak 500 26 June 2010 In Service
Raceway‐Avery 230 9 June 2010 In Service
Newman‐Picante 115 14.5 December 2010 Under Construction
Picante‐Biggs 115 5.3 December 2010 Under Construction
Picante‐Global Reach 115 5.3 December 2010 Under Construction
California‐México
Birds Landing‐Contra Costa 230 18 May 2010 In Service
Tehachapi‐Saugus 500 82.7 June 2010 In Service
Buck Blvd ‐ Julian Hinds 230 66 June 2010 In Service
Lincoln‐Rio Oso 115 11 December 2010 Under Construction
Moss Landing‐Soledad 115 10.4 December 2010 Under Construction

Regional Reliability Self‐Assessm
ents
Regional Reliability Self-Assessments
176 NERC 2010/2011 Winter Reliability Assessment
Table WECC‐3: WECC Transformer System Additions and Upgrades (100 kV and Above) from April 2010 through February 2011
Transformer Project Name
High SideVoltage (kV)
Low Side Voltage (kV)
In‐ Service Date Description / Status
Northwest Power Pool
Bowmont Substation 230 138 June 2010 In Service
Rocky Mountain
Torrington Substation 115 34.5 June 2010 In Service
Kit Carson wind farm 230 34.5 November 2010 Under Construction
Southwest
Coronado Substation 500 345 March 2010 In Service
Raceway Substation 500 230 June 2010 In Service
Cimarron solar farm 115 34.5 July 2010 In Service
Topock Substation 230 69 July 2010 In Service
Picante Substation 345 115 October 2010 Under Construction
California‐México
Humboldt power plant 115 October 2010 Under Construction
Stone Substation 115 12 December 2010 Under Construction

Cross R
egional ISO
/RTO
Reliab
ility Assessm
ent
Cross Regional ISO/RTO Reliability Assessment
NERC 2010/2011 Winter Reliability Assessment 177
MMiiddwweesstt IISSOO
Executive Summary The demand projections in 2010 have changed since the 2009 reporting year due to load growth and the addition of Dairyland Power Cooperative as a transmission‐owning member in June 2010 and Big Rivers Electric Corporation’s new membership, which will become effective in December 2010. Last year’s unrestricted non‐coincident demand forecast of 89,708 MW is 4.6 percent lower than this year’s unrestricted non‐coincident demand forecast of 93,836 MW. This difference is due to load growth and new membership to the Midwest ISO. Existing‐Certain capacity of 123,513 MW is expected for this winter season. This increase over last year’s capacity is due to the generation of new Midwest ISO members, and the Oak Creek Plant expansion in Wisconsin that includes the construction of two 615‐megawatt coal‐fueled generating units. These units are targeted for completion by the end of the year. The Reserve Margins projected in this assessment also reflect the changes in the footprint and new membership. In order to maintain a reliability level based on LOLE requirements, the Midwest ISO has
established a system Planning Reserve Margin of 15.4 percent for the 2010/2011 planning year.130
The projected reserve margin for this winter season is 49.1 percent based on Existing‐Certain and Net Firm Transaction resources. The projected reserve margin exceeds the 15.4 percent system Planning Reserve Margin requirement mentioned. There are no significant findings of a subregion’s assessment in demand, capacity, and reserve margin projections. In addition, there are currently no reliability concerns identified in the Regional Assessment. Thirty miles of the new 345 kV Paddock‐Rockdale line were put in service in March 2010 by American Transmission Company, LLC. There are 26 miles of 345 kV lines planned to be in‐service from Baldwin (Illinois) to Rush Island (Missouri) in November 2010. There are currently no transmission reliability concerns identified in the coordinated seasonal assessment. With respect to operations, there are no important challenges with the operation of the bulk power systems within the Midwest ISO footprint to report at this time.
Introduction The Midwest ISO Region encompasses 13 states and one Canadian province, a with a total of 56,000 miles of transmission. The purpose or goal of this report is to communicate Midwest ISO’s assessment of the 2010/2011 winter season to other entities and stakeholders. Midwest ISO does not prepare its load forecasts. Instead, load projections are reported by Network Customers as required under the Resource Adequacy section (Module E) of Midwest ISO’s Tariff. The scope of this report covers six areas: 1) demand, 2) generation, 3) capacity transactions, 4) transmission, 5) operational issues, and 6) reliability assessments.
Demand The demands as reported by Network Customers are weather normalized, or 50/50, forecasts. A 50/50 forecast is the mean value in a normal probability distribution, meaning there is a 50 percent chance the
130 http://www.midwestmarket.org/publish/Document/4dfde8_124a04ca493_‐7f5f0a48324a

Cross Regional ISO/RTO
Reliability Assessm
ent
Cross Regional ISO/RTO Reliability Assessment
178 NERC 2010/2011 Winter Reliability Assessment
actual load will be higher and a 50 percent chance the actual load will be lower than the forecast. Historically, reported load forecasts have been accurate as each member has expert knowledge of their individual loads with respect to weather and economic assumptions. During last year’s winter season, Midwest ISO reached an all‐time instantaneous peak demand for the winter season of 87,546 MW on December 10th, 2009 at the hour ending 1900 based on settled load data. An unrestricted non‐coincident peak demand is created on a Regional basis by summing the coincident monthly forecasts for the individual Load Serving Entities (LSE) in the larger Regional area of interest. Using historic market data, a load diversity factor was calculated by observing the individual peaks of each Local Balancing Authority and comparing them against the system peak. By taking the product of the diversity factor and the unrestricted non‐coincident peak demand, the Midwest ISO is able to estimate a coincident Total Internal Demand (TID). Last year’s unrestricted non‐coincident demand forecast of 89,708 MW is 4.6 percent lower than this year’s unrestricted non‐coincident demand forecast of 93,836 MW. This difference is due to load growth and new membership in the Midwest ISO. The coincident TID winter peak forecast is 91,310 MW. Midwest ISO bases its resource evaluation on the actual market peak. Midwest ISO currently separates Demand Resources into two separate categories, Interruptible Load and Direct Controlled Load Management (DCLM). Interruptible load of 2,405 MW (2.6 percent of TID) for this assessment is the magnitude of customer demand (usually industrial) that, in accordance with contractual arrangements, can be interrupted at the time of peak by direct control of the system operator (remote tripping) or by action of the customer at the direct request of the system operator. DCLM of 221 MW (0.2 percent of TID) for this assessment is the magnitude of customer service (usually residential) that can be interrupted at the time of peak by direct control of the applicable system operator. DCLM is typically used for “peak shaving.” The Resource Adequacy processes as set forth in Module E of Midwest ISO’s tariff acts as the measurement and verification tool for demand response. The Midwest ISO also reduces the TID by 3,791 MW to account for the demand expected to be supplied from behind the meter resources. The combination of Interruptible Load, DCLM and behind the meter resources is 6,417 MW and results in a Net Internal Demand (NID) forecast of 84,894 MW. The Midwest ISO does not currently track Energy Efficiency programs, however, the capability to track such programs is being discussed with regard to implementation in the future. To account for uncertainties in load forecasts, Midwest ISO applies a probability distribution, Load Forecast Uncertainty (LFU), to consider a larger range of forecasted demand levels. LFU is derived from variance analyses to determine how likely it is that forecasts will deviate from actual load. There have not been any changes made due to the economic recession in either the load forecast method/assumptions or the impact to the actual forecast. Midwest ISO does explicitly address extreme winter conditions before the winter season but has assumed a five percent increase in demand as an approximation of extreme weather during the winter season.

Cross R
egional ISO
/RTO
Reliab
ility Assessm
ent
Cross Regional ISO/RTO Reliability Assessment
NERC 2010/2011 Winter Reliability Assessment 179
Generation The Midwest ISO projects an Existing (Certain, Other, and Inoperable) of 144,960 MW and a Future (Planned and Other) of 981 MW. Of the Existing and Future capacity, it is difficult to predict the wind capacity available on peak due to the intermittent nature of wind. However, the Midwest ISO determined maximum wind capacity credits using an Equivalent Load Carrying Capacity (ELCC), a metric commonly used by the National Renewable Energy Laboratory (NREL). The Midwest ISO used the ELCC for wind generation and Loss of Load Expectation analyses for the summer seasonal assessment. Wind shows an Existing‐Certain capacity of 217 MW on peak over the assessment timeframe using an eight percent capacity credit for those resources committed as capacity to the Midwest ISO. The Existing‐Other capacity for wind is 8,451 MW on peak over the assessment timeframe. Of the Existing and Future capacity, biomass shows 171 MW on peak throughout the assessment timeframe. Hydroelectric conditions for the winter appear normal and there are no reports of reservoir levels showing insufficiencies to meet both peak demand the daily energy demand throughout the winter. Midwest ISO has no reports experiencing or expecting conditions (e.g. weather, fuel supply, fuel transportation) that would reduce capacity. Midwest ISO does not anticipate any existing significant generating units being out‐of‐service or retired during the winter season.
Capacity Transactions on Peak The Midwest ISO only reports power imports (not exports) to the Midwest ISO market or reported interchange transactions into the Midwest ISO market. The Midwest ISO does not currently have a process to track such exports, however, this capability is being discussed for implementation in the future. The forecast reflects 3,099 MW of power imports during the winter. All these imports are firm and fully backed by firm transmission and firm generation. No import assumptions are based on partial path reservations. There are no transactions with Liquidated Damages Contract (LDC) clauses or “make‐whole” contracts included as firm capacity. The Midwest ISO does not have any reliability issues to report for this winter season regarding reliance on outside assistance or external resources for emergency imports
Transmission Thirty miles of the new 345 kV Paddock‐Rockdale line were put in service in March 2010 by American Transmission Company LLC. There are 26 miles of 345 kV lines planned to be placed in‐service from Baldwin to Rush Island in November 2010. There have been no significant transformers or substation equipment added since the last winter season. There are no concerns in meeting target in‐service dates of transmission identified. Midwest ISO does not anticipate any existing, significant transmission lines or transformers being out of service through the winter season. Midwest ISO does not have any transmission constraints that could significantly affect reliability. Interregional transmission transfer capabilities are assessed through a list of all approved transmission, including those approved in
MTEP09, which can be found on the Midwest ISO website.131
Transfer capabilities do not reflect any significant reliability concerns.
Operational Issues Midwest ISO does not have any special operating studies performed by Regional entity’s participants to
report for this winter. The Midwest ISO plans to use intermittent dispatchable technology132
for the integration of variable resources in the future. There is no anticipation for reliability concerns from minimum demand and over generation.
131 http://www.midwestmarket.org/publish/Folder/193f68_1118e81057f_‐7f8e0a48324a? 132 http://www.narucmeetings.org/Presentations/midwestisonarucfebruary142010.pdf

Cross Regional ISO/RTO
Reliability Assessm
ent
Cross Regional ISO/RTO Reliability Assessment
180 NERC 2010/2011 Winter Reliability Assessment
There are no concerns with the use of demand response resources to meet peak demands. The level of Direct Control Load Management is higher this year compared to last year and interruptible load is slightly lower than what was registered last year. In addition, even though the Midwest ISO reached an all‐time winter peak demand in December 2009, no load modifying resources were deployed in 2009/2010 winter period. If peak demands are higher than expected, the Midwest ISO can call the Local Balancing Authorities to deploy Demand Response resources. The Local Balancing Authorities also have the option to independently deploy any Demand Response resources that they may have. The Midwest ISO can also use emergency procedures if peak demands are higher than expected. There are currently no environmental or regulatory restrictions that could potentially affect reliability and there are no other anticipated unusual operating conditions that could significantly impact reliability for the upcoming winter.
Reliability Assessment Analysis The Midwest ISO’s system Planning Reserve Margin for the 2010/2011 planning year is 15.4 percent, unchanged from the 2009/2010 planning year. The Reserve Margin based on Existing‐Certain and Net Firm Transactions is 49.1 percent, which is greater than 15.4 percent and the 2010 NERC Reference
Margin level of 15.0 percent133
. The Reserve Margins based on anticipated and prospective resources are 49.1 percent and 62.3 percent, respectively. The overall system Planning Reserve Margin was unchanged from 2009/2010 assuming that LSEs maintain capacity resources for the following: 1) Resource Adequacy Requirements, 2) LSE requirements to reliably serve load, and 3) to meet LOLE expectations. Midwest ISO conducted the 2010/2011 Loss of Load Study and introduced an unforced capacity reserve margin of 4.50 percent through using GE Multi‐Area Reliability Simulation (MARS)
software for Loss of Load analysis. This study can be found on the Midwest ISO website.134
This winter’s projected reserve margin of 49.1 percent is lower than the projected reserve margin last year of 49.7 percent. For inclusion in seasonal assessments, the Midwest ISO uses Energy Information Administration fuel forecasts to identify any system wide fuel shortages and there were none projected for this winter period. In addition to the seasonal assessments, the Midwest ISO’s Independent Market Monitor submits a monthly report, which covers fuel availability and security issues, to the Midwest ISO’s Board of Directors, which covers fuel availability and security issues. During the operating horizon, the Midwest ISO relies on market participants to anticipate reliability concerns related to the fuel supply or fuel delivery. Since there are no requirements to verify the operability of backup fuel systems or inventories, supply adequacy and potential problems must be communicated appropriately by the market participants to enable adequate response time. If performed, Midwest ISO will report any dynamic and static reactive power‐limited areas on the bulk power system and the plans to mitigate
them.135
Other Region Specific Issues There are no other actions taken to minimize any other anticipated reliability concerns during the next ten years.
133 http://www.midwestmarket.org/publish/Document/4dfde8_124a04ca493_‐7f5f0a48324a 134 http://www.midwestiso.org/publish/Document/13b9ea_1265d1d192a_‐
7b910a48324a/2010%20LOLE%20Study%20Report.pdf?action=download&_property=Attachment 135 http://www.midwestmarket.org/publish/Document/2c2ca5_12511ba6cdc_‐7fab0a48324a

Cross R
egional ISO
/RTO
Reliab
ility Assessm
ent
Cross Regional ISO/RTO Reliability Assessment
NERC 2010/2011 Winter Reliability Assessment 181
Region Description The Midwest ISO has four Balancing Authorities including the Midwest ISO Balancing Authority and 28 Local Balancing Authorities. Midwest ISO covers 13 states and one Canadian province with 55,090 miles
of transmission. Midwest ISO’s market has 347 market participants who serve over 40 million people136
136 http://www.midwestmarket.org/publish/Document/3e2d0_106c60936d4_‐7ba50a48324a/FactSheet_0510f%20(2).pdf

Cross Regional ISO/RTO
Reliability Assessm
ent
Cross Regional ISO/RTO Reliability Assessment
182 NERC 2010/2011 Winter Reliability Assessment
PPJJMM
Executive Summary The projection for the 2010/2011 PJM RTO winter peak is 114,746 MW, an increase of 5,564 MW, or 5.1 percent above the 2009/2010 winter peak. The winter 2010/2011 forecast is 1,996 MW higher than the 112,750 MW forecast projected for the 2009/2010 winter peak. The winter 2010/2011 forecast reflects some economic recovery. The total PJM Existing‐Certain resources expected to be in service during the 2010/2011 winter peak period is approximately 166,600 MW. No resources are expected to be added during the winter. Will County Coal units 1 and 2 totaling 299 MW are being retired. The PJM projected reserve margin for winter 2010/2011 is 58.0 percent. With a relatively small increase in total forecast demand, an increase of demand‐side management, a slight increase in net imports and new generation resources, the PJM Reserve Margin has increased by five percent over last year's forecast reserve margin. This level is well in excess of the required annual reserve margin of 15.5 percent. The PJM projected (existing and prospective margins are the same as the projected) reserve margin for winter 2010/2011 is 58.0 percent. The PJM projected reserve margin for winter 2010/2011 is based on Deliverable Capacity. This level is well in excess of the required annual reserve margin of 15.5 percent. There are no subregions in PJM. There are no reliability concerns resulting from the Reliability Assessment. A 300 MVAr SVC was added at the Elmhurst 138 kV ”Red” bus and a second 300 MVAr SVC was added at the Elmhurst 138 kV "Blue" bus in ComEd. A second 230/115 kV transformer was added at Lanexa and a second 230 kV circuit between Valley and Harrisonburg in Dominion. No significant transmission additions are expected to go into service during the assessment period. There are no reliability concerns resulting from the Reliability Assessment. PJM Operations has been previously challenged by the need to schedule planned outages on bulk electric system transmission to accommodate planned transmission upgrades. These challenges are expected to exist through the 2010/2011 winter peak period.
Introduction PJM Interconnection is a Regional Transmission Organization (RTO) that coordinates the movement of wholesale electricity in all or parts of Delaware, Illinois, Indiana, Kentucky, Maryland, Michigan, New Jersey, North Carolina, Ohio, Pennsylvania, Tennessee, Virginia, West Virginia and the District of Columbia. PJM’s long‐term Regional planning process provides a broad, interstate perspective that identifies the most effective and cost‐efficient improvements to the grid to ensure reliability and economic benefits on a system wide basis. The goal of this report is to assess the reliability of the PJM RTO for the upcoming winter season (2010/2011). This report was prepared by PJM staff using data sources within PJM, reviews of PJM reports, reviews of interregional reports and discussions with PJM Operations and Planning personnel. This report assesses the entire PJM footprint, which is contained within the RFC and SERC Regions. Regional boundaries internal to PJM (between RFC and SERC) are ignored for this assessment.
Demand The demand forecast represents the median forecast of a Monte Carlo simulation employing actual weather observations from over 30 years of history. Economic assumptions are based on projected growth in Gross Metropolitan Product for 36 metropolitan areas across the PJM RTO, produced by

Cross R
egional ISO
/RTO
Reliab
ility Assessm
ent
Cross Regional ISO/RTO Reliability Assessment
NERC 2010/2011 Winter Reliability Assessment 183
Moody's Economy.com as of November 2009. The PJM RTO winter peak for 2009/2010 was 109,163 MW on January 4, 2010 at hour ending 19:00. The Total Internal Demand projection for the 2009/2010 PJM RTO winter peak was 112,750 MW while the Total Internal Demand projection for the 2010/2011 PJM RTO winter peak is 114,746 MW which is an increase of 1,996 MW from the 2009/2010 winter peak forecast. The growth reflects the expected impact of a slight economic rebound. PJM models both the non‐coincident and coincident loads of all members. The peak condition on which PJM’s resource evaluations are conducted are the coincident loads. PJM is a summer peaking Region. The typical winter peak is about 84 percent of the summer peak. PJM has contractually interruptible demand side management of 9,052 MW available to the PJM operators through May 31, 2011. The resources are registered in PJM’s Load Management program. The total effects of demand response can reduce PJM's 2010/2011 winter Total Internal Demand by 7.9 percent. Participants submit load data from the EDC meters used for retail service or from meters meeting PJM's standards (Manual 11137, Section 10.6). Participants can be audited. Projected energy efficiency programs are not reflected in the submitted load forecast for winter 2010/2011. Quantitative analysis was done to assess the weather uncertainty of the projected demand. Using a Monte Carlo simulation employing actual weather observations from over 30 years of history it is estimated that the 90/10 load for winter 2010/2011 is 7,156 MW (or 6.2 percent) above the Total Internal Demand expected load. No changes were made to load forecast method due to the recent economic recession. Assumptions regarding economic growth were updated to be consistent with Moody's Economy.com forecast release of November 2009. That forecast assumes that the economic recession ended in mid‐2009. Extreme weather is part of the analysis used to determine our required Reserve Margin.
Generation The total PJM Existing‐Certain resources expected to be in service during the 2010/2011 winter peak period is approximately 166,600 MW. Wind‐Nameplate resources amount to 3,340 MW presently. Wind‐Existing‐on‐Peak is presently 516 MW. Wind‐Energy‐Only‐Nameplate is currently 278 MW. There are currently no solar Existing‐Certain resources in PJM. Variable resources are only counted partially for PJM resource adequacy studies. Initially, both wind and solar initially use class average capacity factors which are 13 percent for wind and 38 percent for solar. Performance over the peak period is tracked and the class average capacity factor is supplanted with historic information. After three years of operation only historic performance over the peak period is used to determine the individual unit's capacity factor. There is 927 MW of biomass in PJM, which is counted fully in our capacity assessment. Anticipated hydroelectric conditions for the winter are normal. Reservoir levels are sufficient to meet both peak demand and the daily energy demand throughout the winter peak period. PJM is not experiencing or expecting conditions that would reduce capacity. We do not anticipate any existing significant generating units to affect reliability by being out of service or retired during the winter season.
137 http://www.pjm.com/~/media/documents/manuals/m11.ashx

Cross Regional ISO/RTO
Reliability Assessm
ent
Cross Regional ISO/RTO Reliability Assessment
184 NERC 2010/2011 Winter Reliability Assessment
Capacity Transactions Existing‐Firm imports are 3,229 MW with no Future imports planned. No non‐firm imports are considered in this reliability analysis. There are no expected or provisional transactions counted towards meeting the reserve margin requirements. All transactions are firm for both generation and transmission. No imports are based on partial path reservations. There are no transactions with LDC clauses or “make‐whole” contracts. Existing‐Firm exports are 2,806 MW with no Future exports planned. No non‐firm exports are considered in this reliability analysis. There are no expected or provisional transactions in place. All transactions are firm for both generation and transmission. No imports are based on partial path reservations. There are no transactions with LDC clauses or “make‐whole” contracts. PJM does not rely on any external emergency assistance for meeting its reserve requirement.
Transmission Interregional transfer capabilities are adequate and include coordination with our neighbors to include any limiting elements on their system. Tables PJM‐1, 2, and 3 below demonstrate additions to the transmission system in the PJM footprint for the 2010/2011 winter season.
Table PJM‐1: Transmission Line AdditionsName Operator In Service Date Build a second 230 kV circuit between Valley and Harrisonburg Dominion In Service Reconductor the North Wales‐Whitpain 230 kV 220‐16 line PECO In Service Upgrade Burtonsville‐Sandy Springs 230 kV circuit PEPCO 10/31/2010
Table PJM‐2: Transformer AdditionsName Operator In Service Date
Replace Doubs 500/230 kV #4 transformer Allegheny Power
12/31/2010
Add a second 230/115 kV transformer at Lanexa Dominion In Service
Table PJM‐3: Substation Equipment AdditionsName Operator In Service Date
Build new 502 Junction 500 kV substation Allegheny Power
In Service
Add new capacitor banks at Smith 138 kV, Manifold 138 kV, and Sutton 138 kV buses
Allegheny Power
In Service
Install a 115.2 MVAr capacitor at 9 Joliet 138 kV bus ComEd In Service Add a 300 MVAr SVC at Elmhurst 138 kV ‘Red’ bus ComEd In Service Add a 300 MVAr SVC at Elmhurst 138 kV ‘Blue’ bus ComEd In Service Brunot Island 345 kV substation reconfiguration involves 4 345 kV circuits
Duquesne Light
In Service
Create a four‐breaker 138 kV ring bus at Wye Mills Delmarva 10/31/2010 Install 200 MVAr of 230 kV capacitors at Bells Mill Pepco In Service There are no concerns in meeting target in‐service dates for new transmission additions. The Conemaugh‐Juniata 500 kV line and Keystone‐Juniata 500 kV line outages listed above will also have an impact on reactive transfer limits. The coordination with generation outages will minimize this impact.

Cross R
egional ISO
/RTO
Reliab
ility Assessm
ent
Cross Regional ISO/RTO Reliability Assessment
NERC 2010/2011 Winter Reliability Assessment 185
Operational Issues PJM performs both an OATF (self‐assessment) and interregional assessment(s) using expected peak winter conditions to determine system adequacy and to identify system problems. No unique issues were observed. PJM operates all resources in a consistent manner through cost‐effective re‐dispatch procedures. PJM has established procedures to mitigate the impact of minimum demand conditions. No reliability concerns are anticipated. There are no concerns with the use of demand response resources. PJM has used demand response this past summer with success. Demand Response is a useful tool for the PJM operators but amounts to less than ten percent of the PJM total demand and is not expected to be called during the winter. PJM assumes that Demand Response is expected to be fully available and participate fully. If Demand Response is not fully responsive, the Demand Response provider is exposed to severe economic penalties. Demand Response can only be called ten times a year No environmental or regulatory restrictions are expected to impact reliability. No other unusual operating conditions that could significantly affect reliability are expected for the upcoming winter.
Reliability Assessment PJM evaluates its resources (generation, interchange and demand‐side management) and demand to determine if the Reserve Margin requirements are met. Contingency analysis performed as part of the OATF internal studies and the interregional studies with our neighbors ensures operations within secure transfer limits. PJM has adopted a Loss of Load Expectation (LOLE) standard of one occurrence in ten years. PJM performs an annual LOLE study to determine the reserve margin required to satisfy this criterion. The study recognizes, among other factors, load forecast uncertainty due to economics and weather, generator unavailability, deliverability of resources to load, and the benefit of interconnection with neighboring systems. The methods and modeling assumptions used in this study are available in PJM Manual 20. 138 The latest resource adequacy study was completed in November 2009. This study139 examined the period 2009‐2019. The required reserve margins to satisfy an LOLE of one occurrence in ten years are summarized in Table I‐2 on page 6. With a relatively small increase in total forecast demand, an increase of demand‐side management, a slight increase in net imports and new generation resources, the PJM Reserve Margin has increased by 5 percentage points over last year's margin. The PJM projected (existing and prospective margins are the same) reserve margin for winter 2010/2011 is 58.0 percent. This level is well in excess of the required reserve margin 140of 15.5 percent. PJM has established rules/procedures to ensure fuel is conserved to maintain an adequate level on‐site fuel supplies under forecasted peak load conditions. PJM coordinates with neighboring entities and gas pipelines to quickly address fuel issues.
138 http://www.pjm.com/documents/~/media/documents/manuals/m20.ashx 139 http://www.pjm.com/planning/resource‐adequacy‐planning/~/media/documents/reports/2009‐pjm‐reserve‐requirement‐
study.ashx 140 http://www.pjm.com/planning/resource‐adequacy‐planning/~/media/planning/res‐adeq/res‐reports/20100120‐forecasted‐
reserve‐margin.ashx

Cross Regional ISO/RTO
Reliability Assessm
ent
Cross Regional ISO/RTO Reliability Assessment
186 NERC 2010/2011 Winter Reliability Assessment
PJM has developed Reactive Transfer Interfaces to ensure sufficient dynamic MVAr reserve in load centers that rely on economic imports to serve load. PJM day‐ahead and real‐time Security Analysis ensure sufficient generation is scheduled/committed to control pre‐/post‐contingency voltages and voltage drop criteria within acceptable predetermined limits as outlined in M‐3.141 section 3.
Other Regional Specific Issues No other reliability concerns are anticipated.
Region Description PJM has 648 members within 168,500 square miles of service territory. PJM has 1,325 generators with a diverse fuel mix. PJM is a single Balancing Authority and is summer peaking. PJM is in two NERC Regional Entities (RFC and SERC). PJM serves 51 million people in 13 states and the District of Columbia (DE, IL, IN, KY, MD, MI, NC, NJ, OH, PA, TN, VA, WV)
141 http://www.pjm.com/~/media/documents/manuals/m03.ashx

Appen
dix I: A
bout Th
is Rep
ort
Appendix I: About This Report
NERC 2010/2011 Winter Reliability Assessment 187
AAppppeennddiixx II:: AAbboouutt TThhiiss RReeppoorrtt The 2010/2011 Winter Reliability Assessment represents NERC’s independent judgment of the reliability of the bulk power system in North America for the 2010/2011 winter season (Table A).142 The report specifically provides a high‐level reliability assessment of 2010/2011 winter resource adequacy and operating reliability, an overview of projected electricity demand growth, Regional highlights, and Regional self‐assessments. NERC’s primary objective in providing this assessment is to identify areas of concern regarding the reliability of the North American bulk power system and to make recommendations for their remedy as needed. The assessment process enables bulk power system users, owners, and operators to systematically document their operational preparations for the coming season and exchange vital system reliability information. This assessment is prepared by NERC in its capacity as the Electric Reliability Organization.143 NERC cannot order construction of generation or transmission or adopt enforceable standards having that effect, as that authority is explicitly withheld by Section 215 of the U.S. Federal Power Act by similar restrictions in Canada.144 In addition, NERC does not make any projections or draw any conclusions regarding expected electricity prices or the efficiency of electricity markets.
Report Preparation NERC prepared the 2010/2011 Winter Reliability Assessment with support from the Reliability Assessment Subcommittee (RAS), which is under the direction of the NERC Planning Committee (PC). The report is based on data and information submitted by each of the eight Regional Entities as of September 2010 and updated, as required, throughout the drafting process. Any other data sources consulted by NERC staff in the preparation of this document are identified in the report. NERC’s staff performed detailed data checking on the reference information received by the Regions, as well as review of all self‐assessments to form its independent view and assessment of the reliability for the 2010/2011 winter season. NERC also uses an active peer review process in developing reliability assessments. The peer review process takes full advantage of industry subject matter expertise from many sectors of the industry. This process also provides an essential check and balance for ensuring the validity of the information provided by the Regional entities.
142 Bulk power system reliability, as defined in the How NERC Defines Bulk Power System Reliability section of this report, does not include the reliability of the lower voltage distribution systems, which systems account for 80 percent of all electricity supply interruptions to end‐use customers.
143 Section 39.11(b) of the U.S. FERC’s regulations provide that: “The Electric Reliability Organization shall conduct assessments of the adequacy of the Bulk‐Power System in North America and report its findings to the Commission, the Secretary of Energy, each Regional Entity, and each Regional Advisory Body annually or more frequently if so ordered by the Commission.”
144 http://frwebgate.access.gpo.gov/cgi‐bin/getdoc.cgi?dbname=109_cong_bills&docid=f:h6enr.txt.pdf
Table A: NERC’s Annual Assessments
Assessment Outlook Published
Summer Assessment
Upcoming season May
Long‐Term Assessment
10 year October
Winter Assessment Upcoming season November

Appen
dix I: About This Rep
ort
Appendix I: About This Report
188 NERC 2010/2011 Winter Reliability Assessment
Each Region prepares a self‐assessment, which is assigned to three or four RAS members, including NERC Operating Committee (OC) liaisons, from other Regions for an in‐depth and comprehensive review. Reviewer comments are discussed with the Regional Entity’s representative, then refinements and adjustments are made as necessary. The Regional self‐assessments are then subjected to scrutiny and review by the entire subcommittee. This review ensures that members of the subcommittee are fully convinced that each Regional self‐assessment is accurate, thorough, and complete. The PC endorses the report for NERC’s Board of Trustee (BOT) approval, considering comments from the OC. The entire document, including the Regional self‐assessments, is then reviewed in detail by the Member Representatives Committee (MRC) and NERC management before being submitted to NERC’s BOT for final approval. In the 2010/2011 Winter Reliability Assessment, the baseline information on future electricity supply and demand is based on several assumptions:145
Supply and demand projections are based on industry forecasts submitted in September 2010. Any subsequent demand forecast or resource plan changes may not be fully captured or represented.
Peak demand and Reserve Margins are based on average weather conditions and assumed forecast economic activity at the time of submittal. Weather variability is discussed in each Region’s self‐assessment.
Generating and transmission equipment will perform at historical availability levels.
Future generation and transmission facilities are commissioned and in‐service as planned; planned outages take place as scheduled.
Demand reductions expected from Demand Response programs will yield the forecast results, if they are called upon.
Other peak Demand‐Side Management programs are reflected in the forecasts of Net Internal Demand.
Enhancements to the 2010/2011 Winter Reliability Assessment In light of the guidance in FERC’s Order 672 and comments received from other authorities and industry representatives, NERC’s Planning Committee (PC) concluded that the Seasonal and Long‐Term Reliability Assessment processes required improvement. To achieve this goal, the PC formed a task force, the Reliability Assessment Improvement Task Force, and directed it to develop recommendations and a plan for improvement.
A number of the task force’s recommendations146 were incorporated into the 2010/2011 Winter Reliability Assessment, including:
145 Forecasts cannot precisely predict the future. Instead, many forecasts report probabilities with a range of possible outcomes. For example, each Regional demand projection is assumed to represent the expected midpoint of possible future outcomes. This means that a future year’s actual demand may deviate from the projection due to the inherent variability of the key factors that drive electrical use, such as weather. In the case of the NERC Regional projections, there is a 50 percent probability that actual demand will be higher than the forecast midpoint and a 50 percent probability that it will be lower (50/50 forecast).
146 See http://www.nerc.com/files/Reliability%20Improvement%20Report%20RAITF%20100208.pdf

Appen
dix I: A
bout Th
is Rep
ort
Appendix I: About This Report
NERC 2010/2011 Winter Reliability Assessment 189
1. The Reliability Assessment Guidebook Task Force released its Reliability Assessment Guidebook (Version 1.2),147 to provide increased transparency on the reliability assessments process, resource reporting, load forecasting, and general assumptions made in NERC’s assessments. Regions referenced the guidebook to enhance their contributions to this report.
2. In order to improve data accuracy, NERC has implemented improved data checking methods. A brief summary of these data checking methods are summarized in the Data Checking Methods Applied Section.
3. In order to broaden stakeholder input, OC involvement was incorporated to support the assessment development and approval process.
4. Supply categories have been enhanced to better assess capacity. Notably, this assessment uses the following supply categories: “Existing‐Certain,” “Existing‐Other” and “Existing, but Inoperable.” A brief summary of these terms are provided in the Resources, Demand and Reserve Margins Section.
5. The term “Reserve Margin” replaced “Capacity Margin” used within the 2009/2010 Winter Assessment to be consistent with industry practices and reduce confusion. An explanation for this change is provided in the Capacity Margin to Reserve Margin Changes Section.
Report Content Responsibility The following NERC industry groups have collaborated efforts to produce NERC’s 2010/2011 Winter Reliability Assessment:
147 For the Reliability Assessment Guidebook, Version 1.2, see http://www.nerc.com/docs/pc/ragtf/Reliability_Assessment_%20Guidebook%20v1.2%20031909.pdf
NERC Group Relationship Contribution
Planning Committee (PC) Reports to NERC’s Board of Trustees
Review Assessment and Endorse for BOT Approval
Operating Committee (OC) Reports to NERC’s
Board of Trustees Review Assessment and provide
comments to PC Reliability Assessment Subcommittee (RAS)
Reports to the PC Provide Regional Self‐Assessments
Peer Reviews
Review Report Data Coordination Working Group (DCWG)
Reports to the RAS Develop data and Regional reliability narrative requests
Board of Trustees NERC’s Independent Board
Review Assessment
Approve for publication

Appen
dix II: R
eliability Concepts Used in
This Rep
ort
Appendix II: Reliability Concepts Used in This Report
190 NERC 2010/2011 Winter Reliability Assessment
AAppppeennddiixx IIII:: RReelliiaabbiilliittyy CCoonncceeppttss UUsseedd iinn TThhiiss RReeppoorrtt
How NERC Defines Bulk Power System Reliability NERC defines the reliability of the interconnected BPS in terms of two basic and functional aspects:148
Adequacy — is the ability of the electric system to supply the aggregate electric power and energy requirements of the electricity consumers at all times, taking into account scheduled and reasonably expected unscheduled outages of system components; and
Operating Reliability — is the ability of the electric system to withstand sudden disturbances such as electric short circuits or unanticipated loss of system components.
Regarding adequacy, system operators can and should take “controlled” actions or procedures to maintain a continual balance between supply and demand within a balancing area (formerly control area). These actions include:
Public appeals.
Interruptible demand — demand that the end‐use customer makes available to its LSE via contract or agreement for curtailment.149
Voltage reductions (sometimes referred to as “brownouts” because incandescent lights will dim as voltage is lowered, sometimes as much as five percent); and
Rotating blackouts — the term “rotating” is used because each set of distribution feeders is interrupted for a limited time, typically 20–30 minutes, and then those feeders are put back in service and another set is interrupted, and so on, rotating the outages among individual feeders.
Under the heading of Operating Reliability, are all other system disturbances that result in the unplanned and/or uncontrolled interruption of customer demand, regardless of cause. When these interruptions are contained within a localized area, they are considered unplanned interruptions or disturbances. When they spread over a wide area of the grid, they are referred to as “cascading blackouts” — the uncontrolled successive loss of system elements triggered by an incident at any location.
148See http://www.nerc.com/docs/pc/Definition‐of‐ALR‐approved‐at‐Dec‐07‐OC‐PC‐mtgs.pdf more information about the
Adequate Level of Reliability (ALR).
149 Interruptible Demand (or Interruptible Load) is a term used in NERC Reliability Standards. See Glossary of Terms Used in Reliability Standards, February 12, 2008, at http://www.nerc.com/files/Glossary_12Feb08.pdf.

Appen
dix II: R
eliability C
oncep
ts Used
in Th
is Rep
ort
Appendix II: Reliability Concepts Used in This Report
NERC 2010/2011 Winter Reliability Assessment 191
Demand Response Concepts and Categorization As the industry’s use of Demand Side Management (DSM) evolves, NERC’s data collection and reliability assessment need to change highlighting programs and demand‐side service offerings that have an impact on bulk system reliability.
NERC’s seasonal and long‐term reliability assessments currently assume projected Energy Efficiency EE programs are included in the Total Internal Demand forecasts, including adjustments for utility indirect Demand Response programs such as conservation programs, improvements in efficiency of electric energy use, rate incentives, and rebates. DSM involves all activities or programs undertaken to influence the amount and timing of electricity use (See Figure Demand 1).
Note that the context of these activities and programs is DSM, rather than bulk power systems and, therefore, they are not meant to mirror those used in the system context. The Demand Response categories defined in Terms Used in this Report support Figure Demand 1
Figure Demand 1: Demand-Side Management and NERC’s Data Collection
Demand Side Management (DSM)
Demand Response (DR) New Energy Efficiency
Dispatchable Non-Dispatchable
Controllable Economic
Energy-PriceCapacity Ancillary Energy-Voluntary
Direct Load
Control Interruptible
Demand Critical Peak
Pricing w/Control Load as a Capacity Resource
Spinning Reserves Non-Spin Reserves
Regulation
Emergency Demand Bidding and
Buyback
Time-Sensitive Pricing
Time-of-Use
Critical Peak Pricing
Real Time Pricing
System Peak Response Transmission Tariff
FFuuttuurree AArreeaass ooff IInntteerreesstt
NNEERRCC IInnaauugguurraatteedd PPrroojjeecctteedd DDRR DDaattaa CCoolllleeccttiioonn iinn 22000088

Appen
dix III: Terms Used in
This Rep
ort
Appendix III: Terms Used in This Report
192 NERC 2010/2011 Winter Reliability Assessment
AAppppeennddiixx IIIIII:: TTeerrmmss UUsseedd iinn TThhiiss RReeppoorrtt Ancillary (Controllable Demand Response) — Demand‐side resource displaces generation deployed as operating reserves and/or regulation; penalties are assessed for nonperformance.
Anticipated Capacity Resources – Existing‐Certain and Net Firm Transactions plus Future, Planned capacity resources plus Expected Imports, minus Expected Exports. (MW)
Anticipated Reserve Margin (%) –Deliverable Capacity Resources minus Net Internal Demand shown as a percent of Net Internal Demand.
Capacity (Controllable Demand Response) — Demand‐side resource displaces or augments generation for planning and/or operating resource adequacy; penalties are assessed for nonperformance.
Capacity Categories — See Existing Generation Resources, Future Generation Resources, and Conceptual Generation Resources.
Capacity Margin (%) — See Deliverable Capacity Margin (%) and Prospective Capacity Margin (%). Roughly, Capacity minus Demand, divided by Capacity or (Capacity‐Demand)/Capacity. Replaced in 2009 with Reserve Margin(s) (%) for NERC Assessments.
Conceptual Generation Resources — This category includes generation resources that are not included in Existing Generation Resources or Future Generation Resources, but have been identified and/or announced on a resource planning basis through one or more of the following sources:
1. Corporate announcement
2. Entered into or is in the early stages of an approval process
3. Is in a generator interconnection (or other) queue for study
4. Is “place‐holder” generation for use in modeling, such as generator modeling needed to support NERC Standard TPL analysis, as well as, integrated resource planning resource studies.
Resources included in this category may be adjusted using a confidence factor (%) to reflect uncertainties associated with siting, project development or queue position.
Conservation – See Energy Conservation
Contractually Interruptible (Curtailable) (Controllable Capacity Demand Response) — Dispatchable, Controllable, Demand‐side management achieved by a customer reducing its load upon notification from a control center. The interruption must be mandatory at times of system emergency. Curtailment options are integrated into retail tariffs that provide a rate discount or bill credit for agreeing to reduce load during system contingencies. It is the magnitude of customer demand that, in accordance with contractual arrangements, can be interrupted at the time of the Regional Entity’s seasonal peak. In some instances, the demand reduction may be effected by action of the System Operator (remote tripping) after notice to the customer in accordance with contractual provisions.
Controllable (Demand Response) — Dispatchable Demand Response, demand‐side resources used to supplement generation resources resolving system and/or local capacity constraints.
Critical Peak Pricing (CPP) (Non‐dispatchable Time‐Sensitive Pricing Demand Response) — Rate and/or price structure designed to encourage reduced consumption during periods of high wholesale market prices or system contingencies by imposing a pre‐specified high rate for a limited number of days or hours.

Appen
dix III: Term
s Used
in Th
is Rep
ort
Appendix III: Terms Used in This Report
NERC 2010/2011 Winter Reliability Assessment 193
Critical Peak Pricing (CPP) with Control (Controllable Capacity Demand Response) — Dispatchable, Controllable, Demand‐side management that combines direct remote control with a pre‐specified high price for use during designated critical peak periods, triggered by system contingencies or high wholesale market prices.
Curtailable — See Contractually Interruptible
Demand – See Net Internal Demand, Total Internal Demand
Demand Bidding and Buyback (Controllable Energy‐Price Demand Response) — Demand‐side resource that enable large consumers to offer specific bid or posted prices for specified load reductions. Customers stay at fixed rates, but receive higher payments for load reductions when the wholesale prices are high.
Demand Response — Changes in electric use by demand‐side resources from their normal consumption patterns in response to changes in the price of electricity, or to incentive payments designed to induce lower electricity use at times of high wholesale market prices or when system reliability is jeopardized.
Derate (Capacity) — The amount of capacity that is expected to be unavailable on seasonal peak.
Direct Control Load Management (DCLM) or Direct Load Control (DLC) (Controllable Capacity Demand Response) — Demand‐Side Management that is under the direct control of the system operator. DCLM may control the electric supply to individual appliances or equipment on customer premises. DCLM as defined here does not include Interruptible Demand.150
Dispatchable (Demand Response) — Demand‐side resource curtails according to instruction from a control center.
Disturbance Classification Scale — See NERC’s Bulk Power System Disturbance Classification Scale
Disturbance Event – See NERC’s Bulk Power System Disturbance Classification Scale
Economic (Controllable Demand Response) — Demand‐side resource that is dispatched based on an economic decision.
Emergency (Controllable Energy‐Voluntary Demand Response) — Demand‐side resource curtails during system and/or local capacity constraints.
Energy Conservation — The practice of decreasing the quantity of energy used.
Energy Efficiency (EE)— Permanent changes to electricity use through replacement with more efficient end‐use devices or more effective operation of existing devices. Generally, it results in reduced consumption across all hours rather than event‐driven targeted load reductions.
Energy Emergency Alert Levels — The categories for capacity and emergency events based on Reliability Standard EOP—002‐0:
Level 1 — All available resources in use.
Balancing Authority, Reserve Sharing Group, or Load Serving Entity foresees or is experiencing conditions where all available resources are committed to meet firm load, firm transactions, and reserve commitments, and is concerned about sustaining its required Operating Reserves, and Non‐firm wholesale energy sales (other than those that are recallable to meet reserve requirements) have been curtailed.
Level 2 — Load management procedures in effect.
150 DCLM is a term defined in NERC Reliability Standards. See Glossary of Terms Used in Reliability Standards, Updated April 20,
2009 http://www.nerc.com/files/Glossary_2009April20.pdf

Appen
dix III: Terms Used in
This Rep
ort
Appendix III: Terms Used in This Report
194 NERC 2010/2011 Winter Reliability Assessment
Balancing Authority, Reserve Sharing Group, or Load Serving Entity is no longer able to provide its customers’ expected energy requirements, and is designated an Energy Deficient Entity.
Energy Deficient Entity foresees or has implemented procedures up to, but excluding, interruption of firm load commitments. When time permits, these procedures may include, but are not limited to: public appeals to reduce demand, voltage reduction, interruption of non‐firm end use loads in accordance with applicable contracts, demand‐side management, and utility load conservation measures.
Level 3 — Firm load interruption imminent or in progress.
Balancing Authority or Load Serving Entity foresees or has implemented firm load obligation interruption. The available energy to the Energy Deficient Entity, as determined from Level (Alert) 2, is only accessible with actions taken to increase transmission transfer capabilities.
Energy Only (Capacity) — Energy Only Resources are generally generating resources that are designated as energy‐only resources or have elected to be classified as energy‐only resources and may include generating capacity that can be delivered within the area but may be recallable to another area.
Energy‐Price (Controllable Economic Demand Response) — Demand‐side resource that reduces energy for incentives.
Energy‐Voluntary (Controllable Demand Response) — Demand‐side resource curtails voluntarily when offered the opportunity to do so for compensation, but nonperformance is not penalized.
Existing‐Certain (Existing Generation Resources) — Existing generation resources available to operate and deliver power within or into the Region during the period of analysis in the assessment. Resources included in this category may be reported as a portion of the full capability of the resource, plant, or unit. This category includes, but is not limited to the following:
1. Contracted (or firm) or other similar resource confirmed able to serve load during the period of analysis in the assessment.
2. Where organized markets exist, designated market resource151 that is eligible to bid into a market or has been designated as a firm network resource.
3. Network Resource152, as that term is used for FERC pro forma or other regulatory approved tariffs.
4. Energy‐only resources153 confirmed able to serve load during the period of analysis in the assessment and will not be curtailed.154
5. Capacity resources that cannot be sold elsewhere.
6. Other resources not included in the above categories that have been confirmed able to serve load and not to be curtailed155 during the period of analysis in the assessment.
151 Curtailable demand or load that is designated as a network resource or bid into a market is not included in this category, but
rather must be subtracted from the appropriate category in the demand section. 152 Curtailable demand or load that is designated as a network resource or bid into a market is not included in this category, but
rather must be subtracted from the appropriate category in the demand section. 153 Energy Only Resources are generally generating resources that are designated as energy‐only resources or have elected to
be classified as energy‐only resources and may include generating capacity that can be delivered within the area but may be recallable to another area (Source: 2008 EIA 411 document OMB No. 1905‐0129).” Note: Other than wind and solar energy, WECC does not have energy‐only resources that are counted towards capacity.
154 Energy only resources with transmission service constraints are to be considered in category Existing‐Other.

Appen
dix III: Term
s Used
in Th
is Rep
ort
Appendix III: Terms Used in This Report
NERC 2010/2011 Winter Reliability Assessment 195
Existing‐Certain and Net Firm Transactions – Existing‐Certain capacity resources plus Firm Imports, minus Firm Exports. (MW)
Existing‐Certain and Net Firm Transactions (%) (Margin Category) – Existing‐Certain & Net Firm Transactions minus Net Internal Demand shown as a percent of Net Internal Demand.
Existing Generation Resources — See Existing‐Certain, Existing‐Other, and Existing, but Inoperable.
Existing‐Inoperable (Existing Generation Resources) — This category contains the existing portion of generation resources that are out‐of‐service and cannot be brought back into service to serve load during the period of analysis in the assessment. However, this category can include inoperable resources that could return to service at some point in the future. This value may vary for future seasons and can be reported as zero. This includes all existing generation not included in categories Existing‐Certain or Existing‐Other, but is not limited to, the following:
1. Mothballed generation (that cannot be returned to service for the period of the assessment).
2. Other existing but out‐of‐service generation (that cannot be returned to service for the period of the assessment).
3. This category does not include behind‐the‐meter generation or non‐connected emergency generators that normally do not run.
4. This category does not include partially dismantled units that are not forecasted to return to service.
Existing‐Other (Existing Generation Resources) — Existing generation resources that may be available to operate and deliver power within or into the Region during the period of analysis in the assessment, but may be curtailed or interrupted at any time for various reasons. This category also includes portions of intermittent generation not included in Existing‐Certain. This category includes, but is not limited to the following:
1. A resource with non‐firm or other similar transmission arrangements.
2. Energy‐only resources that have been confirmed able to serve load for any reason during the
period of analysis in the assessment, but may be curtailed for any reason.
3. Mothballed generation (that may be returned to service for the period of the assessment).
4. Portions of variable generation not counted in the Existing‐Certain category (e.g., wind, solar,
etc. that may not be available or derated during the assessment period).
5. Hydro generation not counted as Existing‐Certain or derated.
6. Generation resources constrained for other reasons.
Expected (Transaction Category) — A category of Purchases/Imports and Sales/Exports contract including:
1. Expected implies that a contract has not been executed, but in negotiation, projected or other. These Purchases or Sales are expected to be firm.
2. Expected Purchases and Sales should be considered in the reliability assessments.
Firm (Transaction Category) — A category of Purchases/Imports and Sales/Exports contract including:
1. Firm implies a contract has been signed and may be recallable.
155 Energy only resources with transmission service constraints are to be considered in category Existing‐Other.

Appen
dix III: Terms Used in
This Rep
ort
Appendix III: Terms Used in This Report
196 NERC 2010/2011 Winter Reliability Assessment
2. Firm Purchases and Sales should be reported in the reliability assessments. The purchasing entity should count such capacity in margin calculations. Care should be taken by both entities to appropriate report the generating capacity that is subject to such Firm contract.
Future Generation Resources (See also Future, Planned and Future, Other) — This category includes generation resources the reporting entity has a reasonable expectation of coming online during the period of the assessment. As such, to qualify in either of the Future categories, the resource must have achieved one or more of these milestones:
1. Construction has started.
2. Regulatory permits being approved, any one of the following:
a. Site permit
b. Construction permit
c. Environmental permit
3. Regulatory approval has been received to be in the rate base.
4. Approved power purchase agreement.
5. Approved and/or designated as a resource by a market operator.
Future, Other (Future Generation Resources) — This category includes future generating resources that do not qualify in Future, Planned and are not included in the Conceptual category. This category includes, but is not limited to, generation resources during the period of analysis in the assessment that may:
1. Be curtailed or interrupted at any time for any reason.
2. Energy‐only resources that may not be able to serve load during the period of analysis in the assessment.
3. Variable generation not counted in the Future, Planned category or may not be available or is derated during the assessment period.
4. Hydro generation not counted in category Future, Planned or derated.
5. Resources included in this category may be adjusted using a confidence factor to reflect uncertainties associated with siting, project development or queue position.
Future, Planned (Future Generation Resources) — Generation resources anticipated to be available to operate and deliver power within or into the Region during the period of analysis in the assessment. This category includes, but is not limited to, the following:
1. Contracted (or firm) or other similar resource.
2. Where organized markets exist, designated market resource156 that is eligible to bid into a market or has been designated as a firm network resource.
3. Network Resource157, as that term is used for FERC pro forma or other regulatory approved tariffs.
156 Curtailable demand or load that is designated as a network resource or bid into a market is not included in this
category, but rather must be subtracted from the appropriate category in the demand section. 157 Curtailable demand or load that is designated as a network resource or bid into a market is not included in this
category, but rather must be subtracted from the appropriate category in the demand section.

Appen
dix III: Term
s Used
in Th
is Rep
ort
Appendix III: Terms Used in This Report
NERC 2010/2011 Winter Reliability Assessment 197
4. Energy‐only resources confirmed able to serve load during the period of analysis in the assessment and will not be curtailed.158
5. Where applicable, included in an integrated resource plan under a regulatory environment that mandates resource adequacy requirements and the obligation to serve.
Load as a Capacity Resource (Controllable Capacity Demand Response) — Demand‐side resources that commit to pre‐specified load reductions when system contingencies arise.159
NERC’s Bulk Power System Disturbance Classification Scale160 — The NERC Event Analysis program breaks events into two general classifications: Operating Security Events and Resource Adequacy Events. Each event is categorized during the triage process to help NERC and Regional Event Analysis staff to determine an appropriate level of analysis or review. Similar to scales used to rank large weather systems and storms, NERC’s bulk power system Event Classification Scale is designed to classify bulk power system disturbances by severity, size, and impact to the general public.
Operating Security Events — Operating reliability events are those that significantly affect the integrity of interconnected system operations. They are divided into five categories to take into account their different system impact.
Category 1: An event that results in any or is a combination of the following actions:
a. The loss of a bulk power transmission component beyond recognized criteria, i.e., single‐phase line‐to‐ground fault with delayed clearing, line tripping due to growing trees, etc.
b. Frequency below the Low Frequency Trigger Limit (FTL) more than 5 minutes.
c. Frequency above the High FTL more than 5 minutes.
d. Partial loss of dc converter station (mono‐polar operation).
e. “Clear‐Sky” Inter‐area oscillations.
f. Intended and controlled system separation by proper Special Protection Schemes / Remedial Action Schemes (SPS/RAS) action of Alberta from the Western Interconnection, New Brunswick from New England, or Florida from the Eastern Interconnection.
g. Unintended system separation resulting in an island of a combination of load and generation of 20 MW to 300 MW.
h. Proper SPS/RAS actuation resulting in load loss of 100 MW to 500 MW.
Category 2: An event that results in any or is a combination of the following actions:
a. Complete loss of dc converter station.
b. The loss of multiple bulk power transmission components.
c. The loss of an entire switching station (all lines, 100 kV or above).
d. The loss of an entire generation station of 5 or more generators (aggregate stations of 75 MW or higher).
158 Energy only resources with transmission service constraints are to be considered in category Future, Other. 159 These resources are not limited to being dispatched during system contingencies. They may be subject to economic dispatch
from wholesale balancing authorities or through a retail tariff and bilateral arrangements with a third‐party curtailments service provider. Additionally, this capacity may be used to meet resource adequacy obligations when determining panning Reserve Margins.
160 http://www.nerc.com/page.php?cid=5%7C252
Appen
dix III: Terms Used in
This Rep
ort
Appendix III: Terms Used in This Report
198 NERC 2010/2011 Winter Reliability Assessment
e. Loss of off‐site power (LOOP) to a nuclear generating station.
f. The loss of load of 300 MW to 500 MW (excluding SPS/RAS, UFLS, or UVLS actuation).
g. Proper SPS/RAS, UFLS, or UVLS actuation that results in loss of load of 500 MW or greater.
h. The loss of generation (between 1,000 and 2,000 MW in the Eastern Interconnection or
Western Interconnection and between 500 MW and 1,000 MW in the Texas or Québec
Interconnections).
i. The planned automatic rejection of generation through special protection schemes (SPS) or remedial action schemes (RAS) of less than 3,000 MW in the Western Interconnection, or less than 1,500 MW in the Eastern, Texas, and Québec Interconnections.
j. Unintended system separation resulting in an island of a combination of load and generation of 301 MW to 5,000 MW.
k. SPS/RAS Midwest ISO Operation.
Category 3: An event results in any or combination of the following actions:
a. The loss of load from 500 MW to 1,000 MW (excluding SPS/RAS, UFLS, or UVLS actuation).
b. The unplanned loss of generation (excluding automatic rejection of generation through SPS/RAS) of 2,000 MW or more in the Eastern Interconnection or Western Interconnection, and 1,000 MW or more in the Texas or Québec Interconnections.
c. Unintended system separation resulting in an island of a combination of load and generation of 5,001 MW to 10,000 MW.
Category 4: An event results in any or combination of the following actions:
a. The loss of load from 1,000 MW to 9,999 MW (excluding SPS/RAS, UFLS, or UVLS actuation).
b. Unintended system separation resulting in an island of a combination of load and generation of more than 10,000 MW.
Category 5: An event results in any or combination of the following actions:
a. The loss of load of 10,000 MW or more.
b. The loss of generation of 10,000 MW or more.
Resource Adequacy Events — Adequacy events are divided into three categories based on Standard EOP—002‐0 (Capacity and Energy Emergencies).
Category A1: No disturbance events and all available resources in use.
a. Required Operating Reserves cannot be sustained.
b. Non‐firm wholesale energy sales have been curtailed.
Category A2: Load management procedures in effect.
a. Public appeals to reduce demand.
b. Voltage reduction.

Appen
dix III: Term
s Used
in Th
is Rep
ort
Appendix III: Terms Used in This Report
NERC 2010/2011 Winter Reliability Assessment 199
c. Interruption of non‐firm end per contracts.
d. Demand‐side management.
e. Utility load conservation measures.
Category A3: Firm load interruption imminent or in progress.
NERC Reference Reserve Margin Level (%) — Either the Target Reserve Margin provided by the Region/subregion or NERC assigned based on capacity mix (e.g., thermal/hydro). Each Region/subregion may have their own specific margin level based on load, generation, and transmission characteristics as well as regulatory requirements. If provided in the data submittals, the Regional/subregional Target Reserve Margin level is adopted as the NERC Reference Reserve Margin Level. If not, NERC assigned 15 percent Reserve Margin for predominately thermal systems and for predominately hydro systems, ten percent.
Net Internal Demand: Equals the Total Internal Demand reduced by the total Dispatchable, Controllable, Capacity Demand Response equaling the sum of Direct Control Load Management, Contractually Interruptible (Curtailable), Critical Peak Pricing (CPP) with Control, and Load as a Capacity Resource.
Non‐dispatchable (Demand Response) — Demand‐side resource curtails according to tariff structure, not instruction from a control center.
Non‐Firm (Transaction Category) — A category of Purchases/Imports and Sales/Exports contract including:
1. Non‐Firm implies a non‐firm contract has been signed.
2. Non‐Firm Purchases and Sales should not be considered in the reliability assessments.
Non‐Spin Reserves (Controllable Ancillary Demand Response) — Demand‐side resource not connected to the system but capable of serving demand within a specified time.
On‐Peak (Capacity) — The amount of capacity that is expected to be available on seasonal peak.
Operating Reliability Events Categories – See NERC’s Bulk Power System Disturbance Classification Scale
Prospective Capacity Margin (%) — Prospective Capacity Resources minus Net Internal Demand shown as a percent of Prospective Capacity Resources. Replaced in 2009 with Prospective Capacity Reserve Margin (%) for NERC Assessments.
Prospective Capacity Reserve Margin (%) – Prospective Capacity Resources minus Net Internal Demand shown as a percent of Net Internal Demand.
Prospective Capacity Resources – Deliverable Capacity Resources plus Existing‐Other capacity resources, minus all Existing‐Other deratings (Includes derates from variable resources, energy only resources, scheduled outages for maintenance, and transmission‐limited resources), plus Future, Other capacity resources, minus all Future, Other deratings. (MW)
Provisional (Transaction Category) — A category of Purchases/Imports and Sales/Exports contract including:
1. Provisional implies that the transactions are under study, but negotiations have not
begun. These Purchases and Sales are expected to be provisionally firm.
2. Provisional Purchases and Sales should be considered in the reliability assessments.
Purchases/Imports Contracts – See Transaction Categories

Appen
dix III: Terms Used in
This Rep
ort
Appendix III: Terms Used in This Report
200 NERC 2010/2011 Winter Reliability Assessment
Real Time Pricing (RTP) (Non‐dispatchable Time‐Sensitive Pricing Demand Response) — Rate and price structure in which the price for electricity typically fluctuates to reflect changes in the wholesale price of electricity on either a day‐ahead or hour‐ahead basis.
Reference Reserve Margin Level – See NERC Reference Reserve Margin Level
Regulation (Controllable Ancillary Demand Response) — Demand‐side resources responsive to Automatic Generation Control (AGC) to provide normal regulating margin.
Renewable Energy — The U.S. Department of Energy, Energy Efficiency & Renewable Energy glossary defines “Renewable Energy” as “energy derived from resources that are regenerative or for all practical purposes cannot be depleted. Types of renewable energy resources include moving water (hydro, tidal and wave power), thermal gradients in ocean water, biomass, geothermal energy, solar energy, and wind energy. Municipal solid waste (MSW) is also considered to be a renewable energy resource.”161 The government of Canada has a similar definition.162 Variable generation is a subset of Renewable Energy—See Variable Generation.
Renewables — See Renewable Energy
Reserve Margin (%) — See Deliverable Capacity Reserve Margin (%) and Prospective Capacity Reserve Margin (%). Roughly, Capacity minus Demand, divided by Demand or (Capacity‐Demand)/Demand. Replaced Capacity Margin(s) (%) for NERC Assessments in 2009.
Resource Adequacy Events — See NERC’s Bulk Power System Disturbance Classification Scale
Sales/Exports Contracts – See Transaction Categories
Spinning/Responsive Reserves (Controllable Ancillary Demand Response) — Demand‐side resources that are synchronized and ready to provide solutions for energy supply and demand imbalance within the first few minutes of an electric grid event.
System Peak Response Transmission Tariff (Non‐dispatchable Time‐Sensitive Pricing Demand Response) ‐ Rate and/or price structure in which interval metered customers reduce load during coincident peaks as a way of reducing transmission charges.
Target Reserve Margin (%) — Established target for Reserve Margin by the Region or subregion. Not all Regions report a Target Reserve Margin. The NERC Reference Reserve Margin Level is used in those cases where a Target Reserve Margin is not provided.
Total Internal Demand (TID): The sum of the metered (net) outputs of all generators within the system and the metered line flows into the system, less the metered line flows out of the system. The demands for station service or auxiliary needs (such as fan motors, pump motors, and other equipment essential to the operation of the generating units) are not included. Internal Demand includes adjustments for indirect Demand‐Side Management programs such as conservation programs, improvements in efficiency of electric energy use, all non‐dispatchable Demand Response programs (such as Time‐of‐Use, Critical Peak Pricing, Real Time Pricing and System Peak Response Transmission Tariffs) and some dispatchable Demand Response (such as Demand Bidding and Buy‐Back). Adjustments for controllable Demand Response should not be incorporated in this value.
Time‐of‐Use (TOU) (Non‐dispatchable Time‐Sensitive Pricing Demand Response) — Rate and/or price structures with different unit prices for use during different blocks of time.
161 http://www1.eere.energy.gov/site_administration/ glossary.html#R 162 http://www.cleanenergy.gc.ca/faq/ index_e.asp#whatiscleanenergy

Appen
dix III: Term
s Used
in Th
is Rep
ort
Appendix III: Terms Used in This Report
NERC 2010/2011 Winter Reliability Assessment 201
Time‐Sensitive Pricing (Non‐dispatchable Demand Response) — Retail rates and/or price structures designed to reflect time‐varying differences in wholesale electricity costs, and thus provide consumers with an incentive to modify consumption behavior during high‐cost and/or peak periods.
Transaction Categories (See also Firm, Non‐Firm, Expected and Provisional) — Contracts for Capacity are defined as an agreement between two or more parties for the purchase and sale of generating capacity. Purchase contracts refer to imported capacity that is transmitted from an outside Region or subregion to the reporting Region or subregion. Sales contracts refer to exported capacity that is transmitted from the reporting Region or subregion to an outside Region or subregion. For example, if a resource subject to a contract is located in one Region and sold to another Region, the Region in which the resource is located reports the capacity of the resource and reports the sale of such capacity that is being sold to the outside Region. The purchasing Region reports such capacity as a purchase, but does not report the capacity of such resource. Transmission must be available for all reported Purchases and Sales.
Transmission‐Limited Resources — The amount of transmission‐limited generation resources that have known physical deliverability limitations to serve load within the Region.
Example: If capacity is limited by both studied transmission limitations and generator derates, the generator derates take precedence. For example, a 100 MW wind farm with a wind capacity variation reduction of 50 MW and a transmission limitation of 60 MW would take the 50 MW wind variation reduction first and list 10 MW in the transmission limitation.
Transmission Loading Relief (TLR) Levels — Various levels of the TLR Procedure from Reliability Standard IRO—006‐4 — Reliability Coordination — Transmission Loading Relief:
TLR Level 1 — Notify Reliability Coordinators of potential SOL or IROL Violations
TLR Level 2 — Hold transfers at present level to prevent SOL or IROL Violations
TLR Level 3a — Reallocate transmission service by curtailing Interchange Transactions using
Non‐firm Point‐to‐Point Transmission Service to allow Interchange Transactions using higher
priority Transmission Service
TLR Level 3b — Curtail Interchange Transactions using Non‐Firm Transmission Service
Arrangements to mitigate a SOL or IROL Violation
TLR Level 4 — Reconfigure Transmission
TLR Level 5a — Reallocation of Transmission Service by curtailing Interchange Transactions using
Firm Point‐to‐Point Transmission Service on a pro rata basis to allow additional Interchange
Transactions using Firm Point‐to‐Point Transmission Service
TLR Level 5b — Curtail Interchange Transactions using Firm Point‐to‐Point Transmission Service
to mitigate an SOL or IROL violation
TLR Level 6 — Emergency Procedures
TLR Level 0 — TLR concluded
Transmission Status Categories — Transmission additions were categorized using the following criteria:
Under Construction
Construction of the line has begun

Appen
dix III: Terms Used in
This Rep
ort
Appendix III: Terms Used in This Report
202 NERC 2010/2011 Winter Reliability Assessment
Planned (any of the following)
Permits have been approved to proceed
Design is complete
Needed in order to meet a regulatory requirement
Conceptual (any of the following)
A line projected in the transmission plan
A line that is required to meet a NERC TPL Standard or included in a powerflow model
and cannot be categorized as “Under Construction” or “Planned”
Projected transmission lines that are not “Under Construction” or “Planned”
Variable Generation — Variable generation technologies generally refer to generating technologies whose primary energy source varies over time and cannot reasonably be stored to address such variation.163 Variable generation sources which include wind, solar, ocean and some hydro generation resources are all renewable based. Variable generation in this report refers only to wind and solar resources. There are two major attributes of a variable generator that distinguish it from conventional forms of generation and may impact the bulk power system planning and operations: variability and uncertainty.
Variability: The output of variable generation changes according to the availability of the
primary fuel (wind, sunlight and moving water) resulting in fluctuations in the plant output on all
time scales.
Uncertainty: The magnitude and timing of variable generation output is less predictable than for
conventional generation.
163 http://www.nerc.com/files/IVGTF_Report_041609.pdf
Appen
dix IV
: Abbreviatio
ns U
sed in
This R
eport
Appendix IV: Abbreviations Used in This Report
NERC 2010/2011 Winter Reliability Assessment 203
AAppppeennddiixx IIVV:: AAbbbbrreevviiaattiioonnss UUsseedd iinn TThhiiss RReeppoorrtt A/C Air Conditioning
AEP American Electric Power
AFC Available Flowgate Capability
ASM Ancillary Services Market
ATCLLC American Transmission Company, LLC
ATR Area Transmission Review (of NYISO)
AWEA American Wind Energy Association
BA Balancing Authorities
BASN Basin (subregion of WECC)
BCF Billion cubic feet
BCFD Billion cubic feet per day
CALN California‐North (subregion of WECC)
CAMX California‐México (subregion of WECC)
CALS California‐South (subregion of WECC)
CANW WECC‐Canada (subregion of WECC)
CFL Compact Fluorescent Light
CMPA California‐México Power Area
COI California‐Oregon Intertie
COS Coordinated Outage (transmission) System
CPUC California Public Utilities Commission
CRO Contingency Reserve Obligation
CRPP Comprehensive Reliability Planning Process (of NYISO)
DADRP Day‐Ahead Demand Response Program
dc Direct Current
DCLM Direct Controlled Load Management
DFW Dallas/Fort Worth
DLC Direct Load Control
DOE U.S. Department of Energy
DSG Dynamics Study Group
DSI Direct‐served Industry
DSM Demand‐Side Management
DSW Desert Southwest (subregion of WECC)
DVAR D‐VAR® reactive power compensation system
EDRP Emergency Demand Response Program
EE Energy Efficiency
EEA Energy Emergency Alert
EECP Emergency Electric Curtailment Plan
EIA Energy Information Agency (of DOE)
EILS Emergency Interruptible Load Service (of ERCOT)
EISA Energy Independence and Security Act of 2007 (USA)
ELCC Effective Load‐carrying Capability
EMTP Electromagnetic Transient Program
ENS Energy Not Served
Appen
dix IV
: Abbreviations Used in
This Rep
ort
Appendix IV: Abbreviations Used in This Report
204 NERC 2010/2011 Winter Reliability Assessment
EOP Emergency Operating Procedure
ERAG Eastern Interconnection Reliability Assessment Group
ERCOT Electric Reliability Council of Texas
ERO Electric Reliability Organization
FCITC First Contingency Incremental Transfer Capability
FCM Forward Capacity Market
FERC U.S. Federal Energy Regulatory Commission
FPSC Florida Public Services Commission
FP Future‐Planned
FO Future‐Other
FRCC Florida Reliability Coordinating Council
GADS Generating Availability Data System
GDP Gross Domestic Product
GGSS Gerald Gentleman Station Stability
GHG Greenhouse Gas
GRSP Generation Reserve Sharing Pool (of MAPP)
GTA Greater Toronto Area
GWh Gigawatt hours
HDD Heating Degree Days
HVAC Heating, Ventilating, and Air Conditioning
IA Interchange Authority
ICAP Installed Capacity
ICR Installed Capacity Requirement
IESO Independent Electric System Operator (in Ontario)
IOU Investor Owned Utility
IPL/NRI International Power Line/Northeast Reliability Interconnect Project
IPSI Integrated Power System Plan
IRM Installed Reserve Margin
IROL Interconnection Reliability Operating Limit
IRP Integrated Resource Plan
ISO Independent System Operator
ISO‐NE New England Independent System Operator
kV Kilovolts (one thousand volts)
LaaRs Loads acting as a Resource
LCR Locational Installed Capacity Requirements
LDC Load Duration Curve
LFU Load Forecast Uncertainty
LNG Liquefied Natural Gas
LOLE Loss of Load Expectation
LOLP Loss of Load Probability
LOOP Loss of off‐site power
LRP Long Range Plan
LSE Load‐serving Entities
LTRA Long‐Term Reliability Assessment
LTSG Long‐term Study Group
MAAC Mid‐Atlantic Area Council

Appen
dix IV
: Abbreviatio
ns U
sed in
This R
eport
Appendix IV: Abbreviations Used in This Report
NERC 2010/2011 Winter Reliability Assessment 205
Maf Million acre‐feet
MAIN Mid‐America Interconnected Network, Inc.
MAPP Mid‐Continent Area Power Pool
MCRSG Midwest Contingency Reserve Sharing Group
MEXW WECC‐México (subregion of WECC)
MISO Midwest Independent Transmission System Operator
MPRP Maine Power Reliability Program
MRO Midwest Reliability Organization
MVA Megavolt amperes
MVAr Mega‐VArs
MW Megawatts (millions of watts)
MWEX Minnesota Wisconsin Export
NB New Brunswick
NBSO New Brunswick System Operator
NDEX North Dakota Export Stability Interface
NEEWS New England East West Solution
NERC North American Electric Reliability Corporation
NIETC National Interest Electric Transmission Corridor
NOPSG Northwest Operation and Planning Study Group
NORW Northwest (subregion of WECC)
NPCC Northeast Power Coordinating Council
NPDES National Polluant Discharge Elimination System
NPPD Nebraska Public Power District
NSPI Nova Scotia Power Inc.
NTSG Near‐term Study Group
NWPP Northwest Power Pool Area (subregion of WECC)
NYISO New York Independent System Operator
NYPA New York Planning Authority
NYRSC New York State Reliability Council, LLC
NYSERDA New York State Energy and Research Development Agency
OASIS Open Access Same Time Information Service
OATT Open Access Transmission Tariff
OP Operating Procedure
OPA Ontario Power Authority
OPPD Omaha Public Power District
ORWG Operating Reliability Working Group
OTC Operating Transfer Capability
OVEC Ohio Valley Electric Corporation
PA Planning Authority
PACE PacifiCorp East
PAR Phase Angle Regulators
PC NERC Planning Committee
PCAP Pre‐Contingency Action Plans
PCC Planning Coordination Committee (of WECC)
PJM PJM Interconnection
PRB Powder River Basin

Appen
dix IV
: Abbreviations Used in
This Rep
ort
Appendix IV: Abbreviations Used in This Report
206 NERC 2010/2011 Winter Reliability Assessment
PRC Public Regulation Commission
PRSG Planned Reserve Sharing Group
PSA Power Supply Assessment
PUCN Public Utilities Commission of Nevada
QSE Qualified Scheduling Entities
RA Resource Adequacy
RAP Remedial Action Plan
RAR Resource Adequacy Requirement
RAS Reliability Assessment Subcommittee of NERC Planning Committee
RC Reliability Coordinator
RCC Reliability Coordinating Committee
RFC ReliabilityFirst Corporation
RFP Request For Proposal
RGGI Regional Greenhouse Gas Initiative
RIS Resource Issues Subcommittee of NERC Planning Committee
RMR Reliability Must Run
RMRG Rocky Mountain Reserve Group
ROCK Rockies (subregion of WECC)
RP Reliability Planner
RPM Reliability Pricing Model
RRS Reliability Review Subcommittee
RSG Reserve Sharing Group
RTEP Regional Transmission Expansion Plan (for PJM)
RTO Regional Transmission Organization
RTP Real Time Pricing
RTWG Renewable Technologies Working Group
SA Security Analysis
SasKPower Saskatchewan Power Corp.
SCADA Supervisory Control and Data Acquisition
SCC Seasonal Claimed Capability
SCD Security Constrained Dispatch
SCDWG Short Circuit Database Working Group
SCEC State Capacity Emergency Coordinator (of FRCC)
SCR Special Case Resources
SEMA Southeastern Massachusetts
SEPA State Environmental Protection Administration
SERC SERC Reliability Corporation
SMUD Sacramento Municipal Utility District
SOL System Operating Limits
SPP RE Southwest Power Pool
SPS Special Protection System
SPS/RAS Special Protection Schemes / Remedial Action Schemes
SRIS System Reliability Impact Studies
SRWG System Review Working Group
STATCOM Static Synchronous Compensator
STEP SPP Transmission Expansion Plan

Appen
dix IV
: Abbreviatio
ns U
sed in
This R
eport
Appendix IV: Abbreviations Used in This Report
NERC 2010/2011 Winter Reliability Assessment 207
SVC Static VAr Compensation
TCF Trillion Cubic Feet
TFCP Task Force on Coordination of Planning
THI Temperature Humidity Index
TIC Total Import Capability
TID Total Internal Demand
TLR Transmission Loading Relief
TOP Transmission Operator
TPL Transmission Planning
TRE Texas Reliability Entity
TRM Transmission Reliability Margins
TS Transformer Station
TSP Transmission Service Provider
TSS Technical Studies Subcommittee
TVA Tennessee Valley Authority
USBRLC U.S. Bureau of Reclamation Lower Colorado Region
UFLS Under Frequency Load Shedding Schemes
UVLS Under Voltage Load‐Shedding
VAr Voltampere reactive
VACAR Virginia and Carolinas (subregion of SERC)
VSAT Voltage Stability Assessment Tool
WALC Western Area Lower Colorado
WECC Western Electricity Coordinating Council
WTHI Weighted Temperature‐Humidity Index
WUMS Wisconsin‐Upper Michigan Systems

Appen
dix V: W
inter Assessm
ent Clim
ate Prediction
Appendix V: Winter Assessment Climate Prediction
208 NERC 2010/2011 Winter Reliability Assessment
AAppppeennddiixx VV:: WWiinntteerr AAsssseessssmmeenntt CClliimmaattee PPrreeddiiccttiioonn Dynamic Predictables specializes in predicting climate on site specific and regional basis at monthly time step for multiple years in advance. DynaPred predictions are distinguished by extensive area coverage with high spatial and temporal resolution while achieving accuracy at extrema with reliability. Prediction Title: Atlas First Level Prediction Type: dynamic climate Data vintage: through September 2010 Predictions of Monthly Mean Temperature and Monthly Total Precipitation are provided in three classifications (Above, Near, Below Average) for the 22 NERC Regions and subregions. Data unit basis is the US/DoC/NOAA/NCDC climate division system with 344 Climate Divisions for the continental US.164 The NERC Winter Assessment prediction represents grouping that of the 344 Climate Divisions into NERC subregions. Canada climate data is based on individual weather stations with no single‐station to aggregation parallel to the US NCDC‐cirs. Individual weather station data is available online through Environment Canada’s Climate Services office.165 NERC Regions and subregions cover large areas. Observations and DynaPred temperature and precipitation predictions with them often differ significantly within regions. Regional aggregate predictions and observed thereby may not reflect the DynaPred resolvable and resolved component predictions that would better reflect individual load areas. The predictions are completed on "monthly mean temperature", defined as the average of the daily 31 daily midpoints for a given month. The three classifiers of AVERAGE, ABOVE AVERAGE, and BELOW AVERAGE then map the middle 1/3, upper 1/3, and lower 1/3 of temperatures. The monthly mean temperature is the most commonly used climate variable‐and the mean temperature concept is at the core of Heating Degree Day and Cooling Degree Day definitions. The basic data gathering time step is daily; however, and such daily data underpins other such as weekly, monthly, annual time‐steps. The usual frame of reference for temperature is an average over some time period. The most often used average is for the same time period (month) over 30 years. For precipitation, the monthly cumulative precipitation is used and called "monthly precipitation" for short. Comparisons to an average are often done in ratios or percentiles for precipitation. For Monthly Mean Temperature (or MMT), an embedded reference point such as a 30 year monthly average is subtracted from a given month's Observed or Prediction. This departure from average is often called an "Anomalous Temperature" or "Temperature Anomaly" for short. It helps then compare month to month temperatures for January or June without having numbers skewed by the strong Annual temperature cycles. Dynamic Predictables LLC Columbia, MO 65205‐1365 http://www.dynapred.com
164 ftp://ftp.ncdc.noaa.gov/pub/data/cirs/ 165 http://www.climate.weatheroffice.gc.ca/Welcome_e.html

Reliab
ility Assessm
ent Su
bcommittee R
oster
Reliability Assessment Subcommittee Roster
NERC 2010/2011 Winter Reliability Assessment 209
RReelliiaabbiilliittyy AAsssseessssmmeenntt SSuubbccoommmmiitttteeee RRoosstteerr
Chairman Mark J Kuras Senior Engineer
PJM Interconnection, L.L.C. 955 Jefferson Ave Valley Forge Corporate Center Norristown, Pennsylvania 19403
(610) 666‐8924 (610) 666‐4779 Fx [email protected]
Regional Entity Representatives – Members of the Electric Reliability Organization: Reliability Assessment and Performance Analysis Group (ERO‐RAPA Group)
Vice Chairman
Vince Ordax Manager of Planning
Florida Reliability Coordinating Council1408 N. Westshore Blvd Tampa, Florida 33607
(813) 207‐7988(813) 289‐5646 Fx [email protected]
Secretary NERC
Eric Rollison Engineer of Reliability Assessments
North American Electric Reliability Corporation 116‐390 Village Boulevard Princeton, New Jersey 08540‐5721
(609) 452‐8060(609) 452‐9550 Fx eric.rollison@ nerc.net
MRO Hoa V. Nguyen Resource Planning Coordinator
Montana‐Dakota Utilities Co. 400 North 4th Street Bismarck, North Dakota 58501
(701) 222‐7656(701) 222‐7872 Fx hoa.nguyen@ mdu.com
NPCC John G. Mosier, Jr. Assistant Vice President ‐ System Operations
Northeast Power Coordinating Council, Inc.1040 Avenue of the Americas, 10th Floor New York, New York 10018‐3703
(212) 840‐4907(212) 302‐2782 Fx [email protected]
RFC Jeffrey Mitchell Director ‐ Engineering
ReliabilityFirst Corporation320 Springside Dr. Suite 300 Akron, Ohio 44333
(330) 247‐3043(330) 456‐3648 Fx jeff.mitchell@ rfirst.org
SERC Kevin Berent Manager of Reliability Assessment
SERC Reliability Corporation2815 Coliseum Centre Drive Suite 500 Charlotte, North Carolina 28217
(704) 940‐8237 kberent@ serc1.org
SERC Hubert C. Young Manager of Transmission Planning
South Carolina Electric & Gas Co.220 Operations Way MC J37 Cayce, South Carolina 29033
(803) 217‐2030(803) 933‐7264 Fx cyoung@ southernco.com
SPP RE David Kelley Manager, Engineering Administration
Southwest Power Pool, Inc. 415 N. McKinley Street, Suite 140 Little Rock, Arkansas 72205‐3020
(501) 688‐1671(501) 821‐3245 Fx [email protected]
TRE
Curtis Crews Regional Planning Assessment Engineer, Sr.
Texas Regional Entity 2700 Via Fortuna, Suite 225 Austin, Texas 78746
(512) 583‐4989(512) 583‐4903 Fx curtis.crews@ texasre.org

Reliability Assessm
ent Subcommittee Roster
Reliability Assessment Subcommittee Roster
210 NERC 2010/2011 Winter Reliability Assessment
WECC
David J. Godfrey Director, Standards Development and Planning Services
Western Electricity Coordinating Council 155 North 400 West, Suite 200 Salt Lake City , Utah 84103
(801) 883‐6863 (801) 647‐5088 Fx dgodfrey@ wecc.biz
SERC/IOU DCWG Chair
K. R. Chakravarthi Manager, Interconnection and Special Studies
Southern Company Services, Inc. Southern Company Services, Birmingham, Alabama 35203
(205) 257‐6125 krchakra@ southernco.com
ISO/RTO
John Lawhorn, P.E. Director, Regulatory and Economic Standards Transmission Asset Management
Midwest ISO, Inc. 1125 Energy Park Drive St. Paul, Minnesota 55108
(651) 632‐8479 (651) 632‐8417 Fx jlawhorn@ midwestiso.org
ISO/RTO Peter Wong Manager, Resource Adequacy
ISO New England, Inc.One Sullivan Road Holyoke, Massachusetts 01040‐2841
(413) 535‐4172(413) 540‐4203 Fx pwong@iso‐ne.com
ERCOT ISO/RTO
Dan M Woodfin Director, System Planning
Electric Reliability Council of Texas, Inc. 2705 West Lake Dr. Taylor, Texas 76574
(512) 248‐3115(512) 248‐4235 Fx dwoodfin@ ercot.com
WECC State/Municipal
James Leigh‐Kendall Manager, Reliability Compliance and Coordination
Sacramento Municipal Utility District 6002 S Street, B303 Sacramento, California 95852
(916) 732‐5357 (916) 732‐7527 Fx [email protected]
Canada‐At‐Large
Dan Rochester, P. Eng. Manager ‐ Reliability Standards and Assessment
Independent Electricity System Operator Station A, Box 4474 Toronto, Ontario M5W 4E5
(905) 855‐6363(905) 403‐6932 Fx dan.rochester@ ieso.ca
RFC LFWG Chair
Bob Mariotti Supervisor ‐ Short Term Forecasting
DTE Energy2000 Second Avenue 787WCB Detroit, Michigan 48226‐1279
(313) 235‐6057(313) 235‐9583 Fx mariottir@ dteenergy.com
OC Liaison
Jerry Rust President
Northwest Power Pool Corporation7505 NE Ambassador Place, Suite R Portland, Oregon 97035
503‐445‐1074503‐445‐1070 Fx [email protected]
MISO Jameson Smith Manager, Regulatory Studies
Midwest ISO, Inc.1125 Energy Park Dr. St. Paul, Minnesota 55108
(651) 632‐8411 jtsmith@ midwestiso.org
OC Liaison
James Useldinger Manager, T&D System Operations
Kansas City Power & Light Co. PO Box 418679 Kansas City, Missouri 64141
(816) 654‐1212(816) 654‐1189 Fx jim.useldinger@ kcpl.com
Reliab
ility Assessm
ent Su
bcommittee R
oster
Reliability Assessment Subcommittee Roster
NERC 2010/2011 Winter Reliability Assessment 211
FRCC Alternate
John Odom, Jr. Vice President of Planning and Operations
Florida Reliability Coordinating Council1408 N. Westshore Blvd., Suite 1002 Tampa, Florida 33607‐4512
813‐207‐7985(813) 289‐5646 Fx [email protected]
MRO Alternate
Salva R. Andiappan Manager ‐ Reliability Assessment and Performance Analysis
Midwest Reliability Organization 2774 Cleveland Avenue N. Roseville, Minnesota 55113
(651) 855‐1719(651) 855‐1712 Fx sr.andiappan@ midwestreliability.org
MRO Alternate
John Seidel Principal Engineer
Midwest Reliability Organization 1970 Oakcrest Avenue Roseville, Minnesota 55113
(212) 840‐4907(212) 302‐2782 Fx ja.seidel@ midwestreliability.org
RFC Alternate
Paul D. Kure Senior Consultant, Resources
ReliabilityFirst Corporation320 Springside Drive Suite 300 Akron, Ohio 44333
(330) 247‐3057(330) 456‐3648 Fx paul.kure@ rfirst.org
SPP RE Alternate
Alan C Wahlstrom Lead Engineer, Compliance
Southwest Power Pool16101 La Grande Dr. Suite 103 Littlerock, Arkansas 72223
(501) 688‐1624(501) 664‐6923 Fx awahlstrom@ spp.org
WECC Alternate
Bradley M. Nickell Renewable Integration and Planning Director
Western Electricity Coordinating Council 155 North 400 West, Suite 200 Salt Lake City, Utah 84103
(801) 455‐7946(720) 635‐3817 Fx bnickell@ wecc.biz
RFC/IOU Esam A.F. Khadr Director – Electric Delivery Planning
Public Service Electric and Gas Co. 80 Park PlazaT‐14A Newark, New Jersey 07102
(973) 430‐6731(973) 622‐1986 Fx Esam.Khadr@ pseg.com
Observer DOE
Peter Balash Senior Economist
U.S. Department of Energy626 Cochrans Mill Road P.O. Box 10940 Pittsburgh, Pennsylvania 15236‐0940
(412) 386‐5753(412) 386‐5917 Fx balash@ netl.doe.gov
Observer C. Richard Bozek Director, Environmental Policy
Edison Electric Institute701 Pennsylvania Avenue, NW Washington, D.C. 20004
(202) 508‐5641 [email protected]
Observer FERC
Sedina Eric Electrical Engineer
Federal Energy Regulatory Commission 888 First Street, NE, 92‐77 Washington, D.C. 20426
(202) 502‐6441(202) 219‐1274 Fx sedina.eric@ ferc.gov
Observer DOE
Maria A. Hanley Program Analyst
Department of Energy626 Cochrans Mill Road MS922‐342C P.O. Box 10940 Pittsburgh, Pennsylvania 15236
(412) 386‐5373 (412) 386‐5917 Fx maria.hanley@ netl.doe.gov

Reliability Assessm
ent Subcommittee Roster
Reliability Assessment Subcommittee Roster
212 NERC 2010/2011 Winter Reliability Assessment
Observer Erick Hasegawa Engineer
Midwest ISO, Inc.Carmel Office PO Box 4202 Carmel, Indiana 46082
317‐910‐8626 ehasegawa@ midwestiso.org
Observer DOE
Patricia Hoffman Acting Director Research and Development
Department of Energy1000 Independence Avenue SW 6e‐069 Washington, D.C. 20045
(202) 586‐1411 patricia.hoffman@ hq.doe.gov
Observer DOE
Erik Paul Shuster Engineer
U.S. Department of Energy626 Cochrans Mill Road P.O. Box 10940 Pittsburgh, Pennsylvania 15236
(412) 386‐4104 erik.shuster@ netl.doe.gov

NER
C Reliab
ility Assessm
ent an
d Perfo
rmance A
nalysis Staff
NERC Reliability Assessment and Performance Analysis Staff
NERC 2010/2011 Winter Reliability Assessment 213
NNEERRCC RRAAPPAA SSttaaffff RRoosstteerr
North American Electric Reliability Corporation166
116‐390 Village Boulevard Princeton, NJ 08540‐5721 Telephone: (609) 452‐8060 Fax: (609) 452‐9550
Reliability Assessment and Performance Analysis (RAPA) Group
Mark G. Lauby Director of Reliability Assessment and Performance Analysis
Jessica Bian Manager of Benchmarking [email protected]
John Moura Technical Analyst, Reliability Assessment
Eric Rollison Engineer of Reliability Assessments
Rhaiza Villafranca Technical Analyst, Benchmarking
Matt Turpen Intern, Reliability Assessment and Performance Analysis
166 See www.nerc.com

the reliability of theto ensure
bulk power systemthe
bulk power systemthe reliability
bulk power systemreliability of the
bulk power system of the