Via E-Filing Michigan Public Service Commission 7109 W ...
114
October 28, 2019 Ms. Lisa Felice Via E-Filing Michigan Public Service Commission 7109 W. Saginaw Hwy. P. O. Box 30221 Lansing, MI 48909 RE: MPSC Case No. U-20373 Dear Ms. Felice: The following is attached for paperless electronic filing: Direct Testimony of Chris Neme on behalf of the Natural Resources Defense Council Exhibits NRD-1 through NRD-11 Proof of Service Sincerely, Lydia Barbash-Riley [email protected] xc: Parties to Case No. U-20373
Transcript of Via E-Filing Michigan Public Service Commission 7109 W ...

October 28, 2019 Ms. Lisa Felice Via E-Filing Michigan Public Service Commission 7109 W. Saginaw Hwy. P. O. Box 30221 Lansing, MI 48909 RE: MPSC Case No. U-20373 Dear Ms. Felice: The following is attached for paperless electronic filing: Direct Testimony of Chris Neme on behalf of the Natural Resources Defense Council Exhibits NRD-1 through NRD-11 Proof of Service Sincerely, Lydia Barbash-Riley [email protected] xc: Parties to Case No. U-20373

STATE OF MICHIGAN
BEFORE THE MICHIGAN PUBLIC SERVICE COMMISSION
In the matter, on the Commission’s own motion, regarding the regulatory reviews, revisions, determinations, and/or approvals necessary for DTE ELECTRIC COMPANY to fully comply with Public Act 295 of 2008, as amended by Public Act 342 of 2016
U-20373
ALJ Sharon Feldman
______________________________________________________________________
DIRECT TESTIMONY OF CHRIS NEME
ON BEHALF OF NATURAL RESOURCES DEFENSE COUNCIL
October 28, 2019

TABLE OF CONTENTS
I. INTRODUCTIONS AND QUALIFICATIONS.................................................................. 2
II. TESTIMONY OVERVIEW ................................................................................................. 7
III. DTE SHOULD INCREASE FOCUS ON ELECTRICALLY-HEATED LOW INCOMECUSTOMERS .................................................................................................................... 12
IV. DTE’S PROPOSED PERFORMANCE METRICS SHOULD BE MODIFIED .............. 19
A. DTE's Proposal .............................................................................................................19
B. An Appropriate Average Measure Life for Lifetime Savings Metric...........................23
C. An Alternative to DTE's Proposed Low Income Spending Metric ..............................27
V. DTE SHOULD USE MARGINAL LINE LOSSES WHEN ASSESSING EFFICIENCYCOST-EFFECTIVENESS................................................................................................ 322
VI. DTE SHOULD INCREASE FIRST YEAR SAVINGS TO 2.00% OF SALES ............... 38
A. Overview ......................................................................................................................38
B. DSMore Analyses Suggest Economically Optimal Savings is at Least 2.00% ...........40
C. IRP Suggests 2.00% EWR Savings is Least Cost if End Effects Problem Fixed ........43
i

2
I. INTRODUCTIONS AND QUALIFICATIONS 1
Q: Please state your name, employer and business address. 2
A: My name is Chris Neme. I am a co-founder and Principal of Energy Futures Group, a 3
consulting firm that provides specialized expertise on energy efficiency, demand response, 4
renewable energy and other clean energy markets, programs and policies. My business 5
address is P.O. Box 587, Hinesburg, VT 05461. 6
Q: Please describe your educational background. 7
A: I received a Master of Public Policy degree from the University of Michigan (Ann Arbor) in 8
1986. That is a two-year, multi-disciplinary degree focused on applied economics, statistics 9
and policy development. I also received a Bachelor’s degree in Political Science from the 10
University of Michigan (Ann Arbor) in 1985. My first year of graduate school counted 11
towards both my Masters’ and Bachelor’s degrees. 12
Q: Please summarize your business and professional experience. 13
A: I have worked in the energy industry for more than twenty-five years for clients in more than 14
30 different states, half a dozen Canadian provinces and several European countries. Much 15
of my work has focused on energy efficiency markets, programs and policies. That includes 16
work to develop or review energy efficiency potential studies; develop or review Technical 17
Reference Manuals (“TRM”) of deemed savings assumptions (including the Michigan, Ohio, 18
Illinois and Ontario TRMs); support utility-stakeholder “collaboratives” (including those in 19
Michigan, Illinois and Ohio); negotiate or support development of efficiency program 20
performance incentive mechanisms (including the current Michigan and Ontario 21

3
mechanisms, as well as the mechanism included in Illinois’ Future Energy Jobs Act passed 1
in late 2016); review or develop efficiency programs; and/or review or develop utility load 2
forecasts. I have also worked on demand response issues, distribution system planning 3
issues, non-wires alternatives, the bidding of energy efficiency resources into capacity 4
markets, and forecasts and analyses of the impacts of strategic electrification. In addition, I 5
have led training sessions on efficiency program design, cost-effectiveness analysis of 6
distributed energy resources and other clean energy issues; published widely on a range of 7
topics; and served on numerous national and regional efficiency committees, working groups 8
and forums. 9
I co-founded Energy Futures Group in 2010. Since then I have played lead roles in a variety 10
of energy efficiency consulting projects. Recent examples include: 11
• Representing NRDC in both informal consultations and contested regulatory12
proceedings in Michigan, Illinois and Ohio on energy efficiency and demand response13
program designs, cost-effectiveness analyses, evaluation, and shareholder incentive14
structures; distribution system planning and non-wires alternatives; and integrated15
resource planning;16
• Helping the National Association of Regulatory Utility Commissioners and the17
Michigan Public Service Commission assess the relative merits of alternative18
approaches to defining savings goals for utility efficiency programs (focusing on19
lifetime savings);20
• Serving as an appointed expert representative on the Ontario Energy Board’s21
Evaluation and Audit Committee for gas demand-side management;22

4
• Serving on the Management Committee and leading strategic planning and program1
design for a team of firms, led by Applied Energy Group, that was hired by the New2
Jersey Board of Public Utilities to deliver the electric and gas utility-funded New Jersey3
Clean Energy Programs;4
• Co-authoring the National Standard Practice Manual for Assessing Cost-Effectiveness5
of Energy Efficiency cost-effectiveness screening of energy efficiency measures,6
programs and portfolios, which was published in May 2017, as well as a new Manual,7
scheduled to be published next year (2020), that will address cost-effectiveness8
frameworks for all distributed energy resources;9
• Leading a project for the Northeast Energy Efficiency Partnerships (“NEEP”) to10
document lessons learned from utility and other efforts across the United States over11
the past 25 years to use geographically targeted efficiency programs (sometimes in12
concert with other distributed resources) to cost-effectively defer capital investment in13
transmission and/or distribution system infrastructure; and14
• Drafting policy reports for the Regulatory Assistance Project on a variety of energy15
efficiency and related regulatory policy issues, such as whether 30% electric savings is16
achievable in ten years, the history of efforts across the United States to use17
geographically targeted efficiency programs to cost-effectively defer transmission and18
distribution system investments, and the history of bidding of efficiency resources into19
the PJM and New England capacity markets.20

5
Prior to co-founding Energy Futures Group in 2010, I worked for 17 years for the Vermont 1
Energy Investment Corporation (“VEIC”), the last 10 as Director of its Consulting Division 2
managing a group of 30 professionals with offices in three states. 3
A copy of my curriculum vitae is attached as Exhibit NRD-1. 4
Q: Have you previously filed expert witness testimony in other proceedings before the 5
Commission? 6
A: Yes. I filed testimony in the following Michigan Public Service Commission Dockets: 7
• U-20471, regarding DTE’s assessment of energy efficiency resources in its Integrated 8
Resource Plan; 9
• U-20164, regarding Consumers Energy’s proposed new shareholder incentive 10
mechanism for demand response programs; 11
• U-18419, regarding DTE’s assessment of efficiency potential as part of its IRP put 12
forward by the Company in support of a proposed new gas-fired power plant; 13
• U-18268, regarding DTE’s proposed 2018-2019 gas energy efficiency programs 14
(Energy Waste Reduction) plan; 15
• U-18262, regarding DTE’s proposed 2018-2019 electric energy efficiency programs 16
(Energy Waste Reduction) plan; 17
• U-18261, regarding Consumers Energy Company’s proposed 2018-2021 energy 18
efficiency programs (Energy Waste Reduction) plan; 19

6
• U-17771, regarding Consumers Energy Company’s proposed amendment to its 2017 1
energy efficiency programs (Energy Waste Reduction) plan; 2
• U-17762, regarding DTE’s proposed amendment to its 2017 energy efficiency 3
programs (Energy Waste Reduction) plan; 4
• U-17429, regarding Consumers Energy’s estimates of energy efficiency potential in its 5
assessment of alternatives to its proposal to construct a new 700 MW gas-fired power 6
plant (Thetford); 7
• U-17138, regarding Consumers Energy’s proposed modifications to its 2013-2015 8
Energy Optimization plans; 9
• U-17049, regarding DTE’s proposed modifications to its 2013-2015 Energy 10
Optimization plan; 11
• U-16670, regarding Consumers Energy’s biennial review and Amended Energy 12
Optimization plan; and 13
• U-16671, regarding DTE’s biennial review and Amended Energy Optimization plan. 14
Q: Have you been an expert witness on energy efficiency matters before other regulatory 15
commissions? 16
A: Yes, I have filed expert witness testimony on more than 40 occasions before similar 17
regulatory bodies in eleven other states and provinces, including the neighboring 18
jurisdictions of Ohio, Illinois and Ontario. 19

7
Q: Are you sponsoring any exhibits? 1
A: Yes, I am sponsoring the following exhibits: 2
NRD-1: 3
NRD-2: 4
NRD-3: 5 6 7
NRD-4: 8
NRD-5: 9
NRD-6: 10 11 12
NRD-7: 13 14
NRD-8: 15 16
NRD-9: 17
NRD-10: 18 19
NRD-11: 20
Christopher Neme CV
DTE Electric’s Response to NRDCDE-1.25a
DTE Electric’s Response to NRDCDE-1.5 with Attachment NRDCDE-1.5-01 2016 DTE Appliance Saturation Survey – Question 12 and Question 14
Table CE3.3 of the 2015 Residential Energy Consumption Survey
DTE Electric’s Response to NRDCDE-1.25di through 1.25diii
DTE Electric’s Response to NRDCDE-1.1ai with Attachment NRDCDE-1.1ai-01 DSMore 2018 Batch Tool -2020-2021 EWR Plan – Res Utility Input and C&I Utility Input tabs
NRDCDE-1.1aix1, aix3b, and aix4 with Attachment NRDCDE-1.1aix4-01 Line Loss Study 1999
Valuing the Contribution of Energy Efficiency to Avoided Marginal Line Losses
U-20471 DTE Electric’s Response to MECNRDCSCDE-4.24eii4
U-20471 WP LKM-650 2018 Rev Req Working Model – Rev Requirement Summary Tab
U-20471 WP KLB-26 EWR DSMore Aggregation 1.50%_Tiered Costs –Test Results Tab21
II. TESTIMONY OVERVIEW22
Q: What is the purpose of your testimony? 23
A: My testimony addresses the reasonableness of DTE’s proposed electric Energy Waste 24
Reduction (“EWR”) plan for 2020 and 2021. 25

8
Q: What are your summary findings? 1
A: DTE’s EWR plan has a number of good attributes. For example, it has a broad and fairly 2
comprehensive set of efficiency program offerings. That said, I have several concerns with 3
the plan. They are as follows: 4
• DTE is not adequately addressing opportunities to retrofit electrically-heated low 5
income housing, both single family and multi-family. 19% of DTE customers with 6
annual incomes below $20,000, and 12% of DTE customers with annual incomes 7
between $20,000 and $60,000, reside in homes whose primary heating fuel is 8
electricity. However, very few of those electrically heated customers have participated 9
in DTE’s low income efficiency programs – only about 0.5% of the 17,000 participants 10
in its 2018 programs and only about 0.2% of the more than 11,000 participants in the 11
first eight months of 2019. Electrically heated homes typically offer substantial 12
opportunities for low income electricity savings. Indeed, to the extent that low income 13
homes use electric resistance heat – and it appears that many do – retrofitting cold 14
climate heat pumps, coupled with sealing air leaks and upgrading insulation where 15
feasible and appropriate, is likely to reduce customers’ heating bills by 40-50% or 16
more.1 That would have both much greater immediate impact and much greater longer-17
term impact on low income energy affordability than just installing efficient lighting 18
and other low-cost measures. 19
1 Note that most electrically heated homes also have electric water heaters. Thus, there is often also an opportunity for acquiring significant additional electric savings in such buildings by replacing existing in efficient electric water heaters with very efficient heat pump water heaters.

9
• DTE’s proposed low income performance metric – dollars of low income program 1
spending – is not appropriate. DTE has proposed that 25% of its maximum 2
shareholder incentive be tied to the amount of money it spends on its low income 3
efficiency programs.2 However, money can be spent well or poorly; it can produce 4
large benefits for program participants or more modest benefits. Thus, the utility 5
should not be rewarded for simply spending money – without regard to how effectively 6
it was spent. Instead, performance should ideally be measured in outcomes that truly 7
make a difference for low income customers, such as lifetime energy savings produced 8
and/or other indicators of the depth of savings achieved in participating low income 9
buildings (deep savings is typically necessary to have a meaningful impact on reducing 10
energy burdens and improving the comfort and well-being of low-income customers). 11
Given limited data available on how much lifetime savings DTE could acquire by more 12
comprehensively addressing low income efficiency opportunities, including 13
opportunities from electrically-heated homes, it may be reasonable for this two-year 14
plan cycle to base part of DTE’s low income performance metric on spending. 15
However, the maximum incentive for spending should be tied to spending levels 16
necessary to begin to treat significant numbers of electrically heated single family and 17
multi-family homes. And the weight assigned to the spending metric should be only 18
10% rather than the 25% proposed by the Company. In addition, to ensure that the 19
Company begins to effectively address those electric space heat opportunities, I 20
recommend that there also be a low income performance metric tied to the number of 21
heat pumps retrofitted into low income homes to displace inefficient electric resistance 22
2 DTE Exhibit A-8.

10
heat, with the maximum incentive tied to installing 500 heat pumps in 2020 and 1000 1
heat pumps in 2021. I recommend that this metric be assigned the other 15% of weight 2
for low income metrics. 3
• DTE’s lifetime savings metric is based on too low of an average measure life. The 4
Company has estimated that it will achieve 1.625% first year savings with an average 5
measure life of 12.11 years in 2020 and 1.75% first year savings with an average 6
measure life of 12.29 years in 2021.3 However, it proposes that it be able to earn its 7
maximum shareholder incentive if it achieves 1.50% savings with an average measure 8
life of 11 years. In other words, it is proposing that it earn its maximum shareholder 9
incentive at lifetime savings that are 16% below its forecast savings in 2020 and 23% 10
below its forecast savings in 2021. That is not reasonable. While the Company is 11
permitted by statute to maximize its shareholder incentive at first year savings equal to 12
1.50% of sales, there is no reason that the lifetime savings target should not be equal to 13
1.50% first year savings multiplied by the average measure life the company is 14
proposing (i.e., 12.11 years in 2020 and 12.29 years in 2021). That would still be 7% 15
and 14% below the lifetime savings it is planning to achieve in 2020 and 2021, 16
respectively. 17
• DTE continues to use average loss rates rather than marginal loss rates when 18
assessing the generation-level impacts and cost-effectiveness of efficiency 19
programs. Marginal loss rates are typically about 150% of average loss rates. And 20
marginal loss rates during peak hours are typically 300% of average annual loss rates. 21
3 DTE Application, page 4; DTE Exhibit A-4.
11
Thus, by continuing to use average loss rates, DTE continues to understate the impacts 1
and cost-effectiveness of its efficiency programs. The Company should be required to 2
begin using marginal loss rates, using the multipliers I just referenced until it has 3
completed a new line loss study which provides better values for DTE’s service 4
territory. 5
• DTE’s proposed savings target – ramping up to 1.75% of sales – is lower than the 6
economically optimal level of savings. As I discuss in my testimony in DTE’s IRP 7
case (U-20471), the Company’s own analyses using DSMore – the analytical tool it 8
uses to assess the cost-effectiveness of its EWR portfolios – show that 2.00% savings 9
per year produces greater net benefits for its customers than 1.75% savings per year. 10
While the Company’s IRP modeling suggested that 1.75% per year was economically 11
preferable to a 2.00% savings level, that was largely because the Company’s IRP 12
analysis included virtually all of the increase in costs associated with increasing savings 13
from 1.75% to 2.00%, but only about 85% of the increase in benefits (a problem which 14
does not exist in its DSMore analyses). When that bias is corrected, the Company’s 15
IRP model also suggests that 2.00% savings per year is the economically optimal level 16
of efficiency savings. 17
Also, though I do not comprehensively address potential concerns with DTE’s approach to 18
design and delivery of its low income multi-family program, I am familiar with and support 19
the testimony of National Housing Trust witness Annika Brink on that issue. 20

12
III. DTE SHOULD INCREASE FOCUS ON ELECTRICALLY-HEATED LOW 1 INCOME CUSTOMERS2
Q: Do DTE’s low income programs serve electrically heated customers? 3
A: Electrically-heated customers are eligible to participate in DTE’s low income programs. 4
However, the participation of electrically heated customers in those programs is extremely 5
low. Indeed, as Table 1 shows, only two of the more than 10,000 multi-family housing units 6
treated through its low income program between January 2018 and August 2019 (i.e., less 7
than 0.02%) were electrically heated. Similarly, only three of the more than 7,000 Home 8
Energy Consultation participants between January 2018 and August 2019 (less than 0.04%) 9
were electrically heated. And only 108 of the nearly 10,000 customers treated through the 10
Energy Efficiency Assistance program between January 2018 and August 2019 (about 1.1%) 11
were electrically heated. 12
Table 1: Electrically-Heated Customers in DTE 2018/2019 Low Income Programs4 13
14
Q: Are those numbers concerning? 15
A: Yes, because they mean that DTE is not addressing the opportunity to generate very large 16
electric bill savings for a significant portion of its low income customers. 17
4 Exhibit NRD-2, Response to NRDCDE-1.25a.
20182019 thru
August 20182019 thru
August 20182019 thru
August 20182019 thru
AugustLow Income 6146 4353 4644 3081 5956 3655 16,746 11,089 Low Income Elec Heat 2 0 1 2 88 20 91 22 % Elec Heat Customers 0.03% 0.00% 0.02% 0.06% 1.48% 0.55% 0.54% 0.20%
Multi-FamilyHome Energy Consultation
Energy Efficiency Assistance Total

13
Q: What portion of DTE low income customers heat primarily with electricity? 1
A: DTE’s 2016 appliance saturation survey suggests that about 11% of all its residential 2
customers use electricity as their primary heating fuel,5 with the numbers skewed towards 3
lower income customers. Indeed, nearly 19% of all residential households with incomes less 4
than $20,000 per year and 12% of all households with incomes between $20,000 and $59,000 5
per year used electricity as their primary heating fuel.6 In other words, the fraction of DTE 6
low income customers with electric heat is on the order of 10 to 20 times greater than the 7
fraction of electrically heated customers treated through DTE’s Energy Efficiency Assistance 8
program and nearly a thousand times greater than the fraction of electrically heated 9
customers treated through DTE’s Low Income Multi-Family program. 10
Q: Why is it important that DTE’s low income programs serve electrically-heated low 11
income customers in numbers more representative of the electrically-heated low 12
income population? 13
A: In a climate like Michigan’s, nearly 60% of all residential energy consumption is associated 14
with space heating.7 Thus, if the Company is not reaching low income customers with 15
electric heat, those low income customers do not have the opportunity to improve efficiency 16
of by far the largest portion of their energy consumption. That is particularly important when 17
5 This is a little more than the statewide average of 9% according to U.S. Census data (see: https://factfinder.census.gov/faces/tableservices/jsf/pages/productview.xhtml?pid=ACS_17_5YR_B25040&prodType=table) 6 Exhibit NRD-3, Attachment to Response to NRDCDE-1.5, U-20373 NRDCDE-1.5-01 2016 DTE Appliance Saturation Survey, Questions 12-13, page 2 (Response to Question 12). 7 Exhibit NRD-4, U.S. Energy Information Administration’s 2015 Residential Energy Consumption Survey Table CE3.3 (Annual Household Site End-Use Consumption in the Midwest – Totals and Averages, 2015), data for the East North Central region, which is comprised of the states of Michigan, Wisconsin, Ohio, Indiana and Illinois is available at https://www.eia.gov/consumption/residential/data/2015/index.php?view=consumption#by%20end%20uses.

14
one considers that electricity prices are currently considerably higher than natural gas prices 1
in Michigan.8 As a result, all other things being equal, the energy burden of electrically 2
heated low income customers will be much greater than the energy burden of gas heated low 3
income customers. Again, this should put a premium on efforts to enroll electrically heated 4
customers into the Company’s efficiency programs. 5
Q: How could DTE’s low income efficiency programs produce very large bill savings for 6
those electrically-heated low income customers? 7
A: Broadly speaking, there are two ways to reduce electric space heating consumption in 8
electrically heated homes. First, one can improve the efficiency of the building through air 9
leakage reduction and insulation upgrades so that less heat is needed. Second, one can 10
displace inefficient electric heating technology with more efficient technology such as cold 11
climate heat pumps. lt is worth noting that of those DTE low income customers heating 12
primarily with electricity, about half appear to heat with very inefficient electric resistance 13
heat.9 Cold climate heat pumps typically consume 50-70% less electricity per unit of heat 14
8 For example, the residential winter gas price used in the Company’s DSMore analyses is about $0.70/CCF (“Res Utility Input” tab to NRDCDE-1.1ai-01 DSMore 2018 Batch Tool – 2020-2021 EWR Plan.xlsx). That translates to about $7 per MMBtu of site energy used. In contrast, the residential winter electric rate used in the Company’s DSMore analyses is 14.4 cents/kWh, which translates to about $42 per MMBtu of site energy provided – or roughly six times the gas price. A little of that difference would be offset by the difference in efficiency between electric resistance heat (100%) and gas heating equipment (80% to 95%). Also, the Company has a variety of electric rate options, some of which may lead to somewhat lower electricity costs for electric space heat (see: https://www.newlook.dteenergy.com/wps/wcm/connect/23195474-a4d1-4d38-aa30-a4426fd3336b/WholeHouseRateOptions.pdf?MOD=AJPERES&CACHEID=23195474-a4d1-4d38-aa30-a4426fd3336b). However, none of the electric rate options would be low enough to come close to fully offsetting the difference in cost between electric resistance space heat and cost of gas space heat. 9 Exhibit NRD-3, Attachment to Response to NRDCDE-1.5, U-20373 NRDCDE-1.5-01 2016 DTE Appliance Saturation Survey, Questions 12-13, page 3 (Response to Question 13).

15
delivered to a home than inefficient electric resistance heat.10 Thus, a heat pump retrofit that 1
fully displaced electric resistance heat could lower the variable component of a customers’ 2
annual electric bill by 30-40%; a heat pump that displaced only half of the electric resistance 3
heat would lower the variable component of a customer’s annual electric bill by 15-20%.11 4
Q: What explanation has DTE offered for why its low income programs have addressed 5
such a small number of electrically-heated customers? 6
A: DTE states that its multi-family low income program “has and will continue to market to 7
electrically heated customers”, but that that the historically very low participation of 8
electrically heated customers suggests “this is a limited market.”12 9
The Company states that its Home Energy Consultation and Energy Efficiency Assistance 10
programs “plan to market to electrically heated customers in 2020 and 2021.” This response 11
would seem to imply that those two programs did not market to electrically heated customers 12
in 2018 and 2019. 13
Q: Is DTE’s conclusion that electrically-heated, low income multi-family buildings are a 14
“limited market” reasonable? 15
A: No. As I have already explained, the fraction of DTE low income customers heating 16
primarily with electricity is orders of magnitude greater than the participation rates of 17
10 For example, see Faesy, Richard et al., Ductless Heat Pump Meta Study, published by Northeast Energy Efficiency Partnerships, November 13, 2014 (https://neep.org/sites/default/files/products/NEEP-Ductless-Heat-Pump-Meta-Study-Report_11-13-14.pdf) which estimated average season COPs of between 2.4 and 3.0. 11 These estimates are rough approximations designed to illustrate the significance of the energy savings that can be provided by heat pumps. They were derived by simply multiplying 50-70% space heating savings by the average of 60% of energy consumed for space heating. 12 Exhibit NRD-5, Responses to NRDCDE-1.25di-iii, page 1 (Response to NRDCDE-1.25di).

16
electrically heated customers in DTE’s low income programs. While DTE data on the 1
breakdown of electric heat between single family and multi-family buildings is not available, 2
in my experience in northern climates electric heat tends to be more prevalent in multi-family 3
buildings than in single family buildings.13 This suggests that the extremely low levels of 4
electrically heated homes historically participating in the Company’s low income multi-5
family program is a function of program marketing and/or program design rather than a 6
function of size of the market. 7
Q: Is there any evidence to suggest that DTE is planning to ramp up participation by 8
electrically-heated low income customers? 9
A: DTE has indicated that it plans to offer new (i.e., for the first time) incentives for heat pumps 10
in its low income Audit and Weatherization and Energy Assistance programs. That is a 11
positive development.14 And the Company has indicated that it will continue to offer 12
prescriptive rebates for packaged terminal heat pumps and custom incentives for ductless 13
mini-split heat pumps through its low income multi-family program, which is also a positive. 14
13 For example, Commonwealth Edison, the utility serving the Chicago area, estimates that about 10% of all its customers use electricity as their primary heating fuel, but that masks significant differences between its multi-family customers – 24% of which are electrically-heated – and its single family customers – only 4% of which are electrically-heated (Opinion Dynamics, ComEd Residential Saturation/End-Use, Market Penetration & Behavioral Study, April 2013, filed by ComEd as Exhibit 1.0, Appendix E in Illinois Commerce Commission Docket 13-0495, available at https://www.icc.illinois.gov/docket/files.aspx?no=13-0495&docId=202448). Though I am unaware of comparable data for DTE regarding the difference between multi-family and single family saturations of primary electric heat, Census data suggest that the percent of renter-occupied Michigan homes using electricity as their primary heating fuel (19%) is almost four times greater than the percent of owner-occupied homes using electricity as their primary heating fuel (5%). (see:https://factfinder.census.gov/faces/tableservices/jsf/pages/productview.xhtml?pid=ACS_17_5YR_B25117&prodType=table). While not all renters live in multi-family buildings, I would expect them to be disproportionately living in multi-family buildings. Indeed, Census data also show that there are more than ten times as many renters in multi-family buildings as in single family buildings in Michigan (https://factfinder.census.gov/faces/tableservices/jsf/pages/productview.xhtml?pid=ACS_17_1YR_B25033&prodType=table). 14 Exhibit NRD-5, page 2 (Response to NRDCDE-1.25dii).

17
However, DTE has provided no evidence to suggest it is making special or concerted efforts 1
to target market its low income programs to electrically-heated customers.15 Moreover, 2
when I reviewed the list of measures comprising the Company’s build-up of its savings 3
estimates for its 2020 and 2021 low income efficiency programs,16 I found no evidence to 4
suggest the Company is expecting to produce any savings through those programs from heat 5
pump measures. Indeed, the Company appears to be forecasting savings from only one space 6
heating heat pump measure in its entire program portfolio – SEER 21 mini-split heat pumps 7
in its (non-low income) Residential HVAC program. And that measure has only 25 forecast 8
participants in 2020. Though the Company did assume some savings from air leakage 9
reduction and insulation measures in its Energy Efficiency Assistance program, the assumed 10
savings per measure are quite modest, suggesting that the measures are only forecast to be 11
installed in gas heated homes in which they would provide some cooling and/or furnace fan 12
savings (rather than the much more substantial savings that would be realized if they were 13
installed in electrically-heated homes). And there are no HVAC or building envelop 14
measures assumed to provide savings in the Company’s Multi-Family Low Income program. 15
In fact, only five efficiency measures are assumed to provide any electric savings in that 16
program – four different kinds of light bulbs and an efficient refrigerator/freezer measure. 17
That limited measure list is not going to provide the depth of electric savings necessary to 18
significantly affect the energy burdens of low income multi-family customers. It is also 19
15 For example, there is no suggestion of target marketing electrically heated customers in the descriptions of the Energy Efficiency Assistance or Low Income Multifamily program descriptions in DTE Exhibit A-9 (pages 43-50). 16 Attachment to Response to NRDCDE-1.1ai, NRDCDE-1.1ai-01 DSMore 2018 Batch Tool - 2020-2021 EWR Plan.xlsb.

18
inconsistent with the concept of comprehensive treatment of efficiency opportunities that is 1
discussed in greater detail in the testimony of National Housing Trust witness Annika Brink. 2
Q: Given DTE’s new heat pump incentive offerings, is it possible that the Company will 3
acquire substantial savings from electrically heated low income homes, but has 4
conservatively not accounted for those savings in its program forecasts? 5
A: It is possible that the Company’s filed plan understates the savings it will acquire from 6
electrically heated low income customers. However, to the extent that is the case, the 7
Company has also likely understated spending on those low income programs because heat 8
pump retrofits are expensive. And that could create a perverse incentive for the Company to 9
not aggressively pursue opportunities for such retrofits in order to manage its budget. 10
Further, the Company is changing nothing about its heat pump incentives for electrically-11
heated multi-family buildings. Since the Company has had virtually no electrically heated 12
multi-family participants in its programs in recent years, it is clear that either its rebate 13
offerings are inadequate and/or its efforts to recruit participation from electrically heated 14
buildings would need to be changed in order to gain significant traction in that market. 15
Nothing about what the Company has put forward in its filing suggest any such changes are 16
planned. 17
Q: How do you recommend that DTE’s plan be changed to ensure that the Company more 18
effectively addresses substantial savings opportunities from electrically heated low 19
income customers? 20
A: First, I recommend that the Company add $2.5 million to its 2020 low income program 21
budgets and $5.0 million to its 2021 low income program budgets. That should enable the 22

19
Company to pay for the full cost of approximately 500 heat pumps in 2020 and 1000 heat 1
pumps in 2021.17 The heat pumps should be installed in both single family homes and multi-2
family apartments with electric resistance heat (either electric furnaces or electric baseboard 3
heating systems). The heat pumps should be cold climate models whenever feasible and 4
economic, as they are able to efficiently address heating needs during much more of the 5
Michigan winter than standard air source heat pump products. 6
Second, I recommend that the Company initiate an aggressive effort to identify and recruit 7
low electrically heated low income customers to its programs. Analysis of its own billing 8
data, and historical usage patterns by season, should enable target marketing. 9
Finally, as I discuss in the next section of my testimony, DTE’s shareholder incentive 10
mechanism should have a performance metric related to the number of low income heat 11
pump installations achieved through its programs. 12
IV. DTE’S PROPOSED PERFORMANCE METRICS SHOULD BE MODIFIED13
A. DTE’s Proposal14
Q: Please summarize DTE proposed shareholder incentive mechanism? 15
A: As shown in Exhibit A-8 to Jason Kupser’s direct testimony, DTE has proposed a 16
performance incentive mechanism that would enable its shareholders to earn between 15% 17
17 DTE estimates that a SEER 18 Ductless Mini-Split costs about $3000 and a centrally ducted SEER 16 costs about $5700. See Exhibit NRD-5, page 3 (Response to NRDCDE-1.25diii). The budget increase I have proposed should be enough to cover a reasonable mix of those two systems, including some additional marketing costs to recruit electrically-heated participants.

20
and 20% of efficiency program spending based on the performance of its efficiency programs 1
relative to three metrics: 2
• First year MWh savings (as a percent of annual sales) from its entire program3
portfolio;4
• Lifetime MWh savings from its entire efficiency program portfolio; and5
• Low income program spending.6
The Company would not earn any performance incentives just for meeting first year savings 7
targets. Rather, the Company’s performance on first year MWh savings establishes the 8
“ceiling” on what it can earn. That ceiling starts at 15% of program spending for achieving 9
1.00% first year savings and increases linearly to 20% of spending for achieving 1.50% first 10
year savings. 11
The actual shareholder incentive earned would then be a function of how well DTE 12
performed relative to the other two metrics. The Company would earn 12% of efficiency 13
program portfolio spending for reaching its “100% target” for lifetime savings and 16% of 14
spending for reaching 150% of its lifetime savings target. It would earn 3% of efficiency 15
program portfolio spending as an incentive for its “100% target” for low income spending 16
and 5% of spending as an incentive for spending 150% of that amount. Put another way, the 17
Company has assigned an 80% weight to the portfolio lifetime MWh savings metric and a 18
25% weight to the low income spending metric. The fact that those weights add up to more 19
than 100% means that the Company does not have to maximize performance on both metrics 20
in order to earn the maximum 20% of spending permitted. 21

21
Q: How did DTE establish its proposed “100% targets” for the lifetime MWh savings and 1
low income spending metrics? 2
A: The 100% target for the lifetime MWh savings target is equal to the first year savings target 3
expressed in MWh multiplied by an average annual savings life of 11 years.18 However, 4
DTE is also proposing that the lifetime savings target be reduced in the event that there are 5
changes to the assumed measure life for LED light bulbs, with the reduction being equal to 6
the reduction in lifetime savings per light bulb multiplied by the number of LED light bulbs 7
the Company is currently planning to installed through its residential programs. 8
The 100% target for low income spending is equal to two-thirds of the Company’s planned 9
low income spending, such that the Company would earn its maximum low income incentive 10
for simply spending the amount it is budgeting for its low income programs. 11
Q: How does DTE’s proposed shareholder incentive mechanism compare to the 12
mechanism approved for its previous EWR plan? 13
A: DTE’s proposed shareholder incentive mechanism differs from the mechanism approved for 14
its previous EWR plan in a couple of important ways, one structural and another contextual. 15
The structural difference is that the mechanism approved for its previous EWR plan had two 16
different low income metrics – one (with 15% weight) based on low income spending and 17
another (with 10% weight) based on the percentage of multi-family buildings that received 18
comprehensive energy assessments (an indicator of comprehensiveness in addressing 19
18 Direct Testimony of Jason Kupser, page 39.

22
efficiency opportunities) – rather than just the one spending metric DTE is currently 1
proposing for 2020 and 2021.19 2
The contextual difference is that the EWR plan DTE has proposed in this proceeding is 3
designed – and budgeted – to achieve greater lifetime savings than the Company’s last EWR 4
plan. 5
Q: Do you consider DTE’s proposed shareholder incentive mechanism for 2020 and 2021 6
to be reasonable? 7
A: There are a number of elements of DTE’s proposal that are reasonable given the objectives 8
of its EWR plan. For example, I strongly support DTE’s proposal to use first year savings 9
solely to establish the ceiling for shareholder incentives, as first year savings are not the best 10
indicator of the value of energy savings. I also strongly support DTE’s proposal to place 11
80% weight on the portfolio lifetime savings metric because lifetime savings are a much 12
better indicator of the value of efficiency investments. I also strongly support the Company’s 13
proposal to include a low income performance metric. Because low income programs 14
generally produce savings at a much higher cost than non-low income programs, a 15
shareholder incentive mechanism that only rewarded total savings would create a 16
disincentive to invest in low income programs. Having counter-balancing performance 17
metrics for low income programs ensures that the Company will devote attention and 18
resources to such programs, which is important to ensuring that the customers who are likely 19
most in need and who would benefit most from efficiency investments have the opportunity 20
to do so. Finally, I support the Company’s proposal to have the sum of the weights for the 21
19 Case No. U-18262, April 12, 2018, Order Approving Settlement Agreement, Attachment D.

23
different performance metrics to add up to a little more than 100%, as I think it is reasonable 1
to allow a utility to earn its maximum incentive without having to have achieved the highest 2
possible performance on every metric (as long as it has to perform at least very well on every 3
metric).20 4
That said, there are a couple of elements of DTE’s proposal that I consider to be problematic. 5
Specifically, I think it is unreasonable to base the Company’s portfolio lifetime savings goals 6
on an average measure life of 11 years when its forecast average is over 12 years. Second, I 7
think it is unreasonable to measure and reward low income performance based solely upon 8
how much money is spent rather than on the results of that spending (i.e., the benefits that 9
low income customers realize from that spending). I discuss each of these concerns below. 10
B. An Appropriate Average Measure Life for Lifetime Savings Metrics11
Q: Please summarize the nature of your concern about DTE’s proposal to base its portfolio 12
lifetime savings metric on an average measure life of 11 years? 13
A: The Company has estimated that the average life of the savings it will achieve in 2020 is 14
greater than 11 years. For 2020, the Company estimates an average life of 12.11 years; for 15
2021, it estimates an average life of 12.29 years.21 Thus, the Company is proposing that its 16
portfolio lifetime savings metrics be based on an average measure life that is about 10% less 17
than it plans to achieve. 18
20 For example, under DTE’s proposal, if the Company achieved 150% of its portfolio lifetime savings metric, it would still have to achieve 125% of its low income metric to earn its maximum incentive; alternatively, if it achieved 150% of its low income metric, it would still have to achieve 137.5% of its portfolio lifetime savings metric to earn its maximum incentive. 21 Direct Testimony of Jason Kupser, page 37; DTE Exhibit A-4.

24
Furthermore, as I noted above, DTE is planning – and budgeting – to achieve first year 1
savings of 1.625% in 2020 and 1.75% in 2021. That is 8% to 17% more than the first year 2
savings levels upon which its maximum shareholder incentive proposal is based. 3
As Table 2 shows, the combined effects of these two factors is that DTE is proposing that it 4
earn its maximum shareholder incentive – or at least the portion of the maximum incentive 5
tied to portfolio lifetime savings – if it achieved only 84% of its planned savings in 2020 and 6
only 77% of its planned savings in 2021. That level of savings achievement, relative to 7
planned savings, would be far from exemplary and should not merit a maximum shareholder 8
incentive. 9
Table 2: 2020-2021 Planned Savings vs. Proposed Max Shareholder Incentive 10
11
Q: Wasn’t the DTE portfolio lifetime savings metric adopted for 2018 and 2019 in DTE’s 12
last EWR plan case developed using the same assumptions DTE has proposed in this 13
case – i.e., 1.50% first year savings multiplied by an average measure life of 11 years? 14
2020 2021
Statutory First Year Savings Target (% of sales) 1.00% 1.00%Statutory First Year Savings Target (GWh) 468 465 Max Incentive Assumed Average Measure Life 11.00 11.00Tier 1 Incentive (GWh) 5,144 5,117 Max Incentive First Year Savings % of Sales 1.50% 1.50%Max Incentive Lifetime Savings (GWh) 7,717 7,676
DTE First year Savings (% of sales) 1.63% 1.75%DTE First Year Savings (MWh) 760 814 DTE Avg Measure Life (years) 12.11 12.29DTE Lifetime Savings (MWh) 9,201 10,004 DTE Max Incentive Lifetime Savings as % of Planned Lifetime Savings
84% 77%
DTE Proposed Max Incentive for Lifetime Savings
DTE Planned Lifetime Savings

25
A: It was. However, as I noted above there is an important contextual difference between that 1
proceeding and this one. Specifically, DTE is planning on achieving greater lifetime savings 2
in in 2020 and 2021 than it planned for 2018 and 2019. 3
Most notably, for 2020 and 2021 DTE is planning to achieve 1.625% and 1.75% first year 4
savings (as percent of sales) rather than the 1.50% first year savings it was planning to 5
achieve in 2018 and 2019. And DTE is seeking approval of a higher budget in order to 6
achieve that higher level of savings. In other words, it has significant additional resources 7
with which to work to achieve a higher savings target. In addition, the average measure life 8
implicit in DTE’s 2018 and 2019 plan – 11.92 years in both cases22 – is a little lower than 9
the 12.11 and 12.29 it is planning to achieve in 2020 and 2021. 10
As a result, as Table 3 shows, for 2018 and 2019 the portion of DTE’s maximum shareholder 11
incentive tied to portfolio lifetime savings could only be earned if the Company achieved 12
92% of its planned lifetime savings. That is a much higher percentage than the 84% and 13
77% implicit in its proposed lifetime savings metric for 2020 and 2021. 14
22 Computed from Attachment to Case No. U-18262Response to NRDCE 3.4, NRDC -3.4 Portfolio Measure Life.xlsx. Note that this value is lower than DTE reported in Case No. U-18262 Exhibit A-4. However, DTE improperly calculated average measure life in that proceeding – using a different (and inaccurate) formula than the correct one it has used in this proceeding.

26
Table 3: 2018-2019 Planned Lifetime Savings vs. Approved Max Shareholder Incentive 1
2
Q: How do you propose that the Company’s portfolio lifetime savings metric be modified? 3
A: I propose that the metric remained tied to the 1.50% first year savings level, solely to 4
maintain symmetry with the statute regarding the savings level at which maximum 5
shareholder incentives are earned. However, I propose that value be multiplied by DTE’s 6
forecast average savings life of 12.11 years for 2020 and 12.29 years for 2021. As Table 4 7
shows, DTE would still be rewarded with a maximum shareholder incentive at lifetime 8
savings levels below what it is planning to achieve. In other words, it would still have a non-9
trivial amount of “headroom” as a cushion against uncertainty in its planned performance. 10
The 2020 max incentive as a percent of planned savings – 93% – would be very similar to 11
the 92% values approved for 2018 and 2019 rather than the 84% proposed by DTE; the 2021 12
max incentive as a percent of planned savings – 86% – would be lower than the ratios 13
approved for 2018 and 2019, but at least much closer than the 77% ratio implicit in DTE’s 14
proposal. 15
2018 2019
Statutory First Year Savings Target (% of sales) 1.00% 1.00%Statutory First Year Savings Target (MWh) 471 468 Max Incentive Assumed Average Measure Life 11.00 11.00Tier 1 Incentive (MWh) 5,181 5,153 Max Incentive First Year Savings % of Sales 1.50% 1.50%Max Incentive Lifetime Savings (MWh) 7,772 7,729
DTE First year Savings (% of sales) 1.50% 1.50%DTE First Year Savings (MWh) 707 703 DTE Avg Measure Life (years) 11.92 11.92DTE Lifetime Savings (MWh) 8,422 8,376 DTE Max Incentive Lifetime Savings as % of Planned Lifetime Savings
92% 92%
DTE Proposed Max Incentive for Lifetime Savings
DTE Planned Lifetime Savings

27
Table 4: 2020-2021 DTE Planned Savings vs. NRDC Proposed Max Shareholder Incentive 1
2
C. An Alternative to DTE’s Proposed Low Income Spending Metric3
Q: Please summarize the nature of your concern about DTE’s proposal to base its low 4
income performance metric on the amount of money it spends on low income 5
programs? 6
A: Performance metrics based on spending are not ideal because they do not measure outcomes 7
that matter, such as total lifetime savings, comprehensiveness of treatment of savings 8
opportunities, bill savings, etc. At best, they are uncertain proxies for those outcomes. At 9
worst, they can create perverse incentives to spend money in sub-optimal ways. Thus, in the 10
context of shareholder incentive mechanisms, spending benchmarks are better suited as 11
“minimum requirements” for earning incentives rather than as the measure of performance 12
upon which the amount of incentive earned is based. 13
2020 2021
Statutory First Year Savings Target (% of sales) 1.00% 1.00%Statutory First Year Savings Target (MWh) 471 468 Max Incentive Assumed Average Measure Life 12.11 12.29Tier 1 Incentive (MWh) 5,704 5,757 Max Incentive First Year Savings % of Sales 1.50% 1.50%Max Incentive Lifetime Savings (MWh) 8,556 8,636
DTE First year Savings (% of sales) 1.63% 1.75%DTE First Year Savings (MWh) 760 814 DTE Avg Measure Life (years) 12.11 12.29DTE Lifetime Savings (MWh) 9,201 10,004 NRDC Max Incentive Lifetime Savings as % of DTE Planned Lifetime Savings
93% 86%
NRDC Proposed Max Incentive for Lifetime Savings
DTE Planned Lifetime Savings

28
Q: Wasn’t DTE’s 2018 and 2019 shareholder incentive mechanism based, in part, on low 1
income spending? 2
A: For 2018 and 2019 DTE had two low income performance metrics: one based on low income 3
spending, to which 15% weight was assigned, and one which was an indicator of progress in 4
more comprehensively treating multi-family building efficiency to which 10% weight was 5
assigned. While not ideal, because 60% of the low income performance weight (15% out of 6
a total of 25%) was assigned to low income spending, it was at least not all based on spending 7
as the Company’s current proposal is. It is also worth noting that though Consumers 8
Energy’s approved 2018-2021 plan also had 25% weight assigned to low income 9
performance metrics, none of that weight was associated with low income spending; it was 10
all assigned to either lifetime low income savings or a measure of comprehensiveness of 11
treatment of multi-family buildings.23 12
Q: What would you propose as preferable alternatives to DTE’s 2020 and 2021 low income 13
performance metrics? 14
A: Ideally, low income performance metrics should be tied entirely to ultimate outcomes of the 15
Company’s programs, like the lifetime savings achieved and/or indicators of comprehensive 16
treatment of buildings and deep savings. However, DTE has little historical experience or 17
data regarding what it could achieve with a much more concerted effort to comprehensively 18
address low income electric savings opportunities, particularly in electrically-heated low 19
income homes in general and in low income multi-family buildings in particular. In that 20
context, it may be reasonable – for just the next two years covered by its filed plan – to 21
23 Case No. U-18261, January 23, 2018, Order Approving Settlement Agreement, Attachment C.

29
include both a spending metric and a metric that is an indicator of progress in more 1
comprehensively and deeply addressing electric savings opportunities. Thus, I propose the 2
following two metrics: 3
• Number of heat pumps retrofitted into electric-resistance heated low income4
homes. This metric should have 15% of the performance incentive mechanism weight.5
I would propose that the maximum incentive for 2020 be set at 500 units installed, with6
the lower end of the Tier 1 incentive set at 333 installations. For 2021, the maximum7
incentive should be earned at 1000 installations, with the lower end of Tier 1 set at 6678
units. These values are consistent with the program recommendations (and budget9
increases) I provided in the previous section of my testimony. Furthermore, to both10
ensure that the Company gains experience with this technology in both single family11
and multi-family buildings, at least one-third of the heat pumps installed should be in12
multi-family buildings. That should be a minimum requirement for any shareholder13
incentive.14
• Total low income spending. This metric should be assigned only 10% of the weight15
for the shareholder incentive mechanism. The maximum shareholder incentive16
achievable for this metric should be earned for spending at levels equal to the17
Company’s proposed total low income program budget (i.e., $14.7 million in 2020 and18
$15.5 million in 2021), plus the increase in spending I have proposed to cover the cost19
of heat pump installations (i.e., $2.5 million more for 2020 and $5.0 million more for20
2021), plus any additional increases necessary to achieve the low income multi-family21
spending levels put forward by NHT witness Annika Brink. The lower end of the Tier22
1 incentive level for this metric should be earned at spending levels equal to two-thirds23

30
of maximum incentive level. Given the Company’s historically limited focus on 1
comprehensive treatment of multi-family buildings, the ratio of actual spending on 2
DTE’s low income multi-family program to actual spending on all low income 3
programs should be at least equal to the ratio of the approved budget for the low income 4
multi-family program to the approved budget for all low income programs.24 That 5
should be a minimum requirement for earning any incentive for this metric.25 6
Q: Why is your proposed structure for low income performance metrics better than DTE’s 7
proposed structure? 8
A: I place less emphasis on spending and most of the emphasis on a measure – numbers of heat 9
pump installations – that is both a more direct indicator of benefits for low income customers 10
in 2020 and 2021, as well as an indicator of critically important “foundation-building” for 11
the future. By “foundation building” I mean that a performance metric tied to significant 12
numbers of heat pump installations will strongly encourage the Company to develop 13
relationships with cold climate heat pump contractors that should enable more effective 14
program delivery in the future, as well as to test and fine-tune approaches to retrofitting heat 15
pumps in significant volumes in different types of buildings. It may also help create 16
economies of scale necessary to bring down the cost of a technology that is probably not sold 17
in very large quantities today in DTE’s service territory. 18
24 For the purpose of calculating the budget ratio, I would propose that half of my proposed low income budget increase to pay for heat pump retrofits be allocated to the low income multi-family program. 25 An exception to this rule would be if actual low income multi-family spending is greater than budgeted low income multi-family program spending (i.e., the ratio of multi-family to total low income spending can be lower than the ratio of approved budgets, if the total multi-family approved budget has been spent).

31
After the 2021 (i.e., in the Company’s next plan), when we have much more data available 1
regarding the opportunities to more comprehensively treat low income customers with 2
electric heat as well as multi-family buildings, it will likely be best to eliminate spending 3
metrics and focus entirely on outcome metrics. Additional outcome metrics that may merit 4
consideration at that time include total lifetime MWh savings, average savings as a percent 5
of annual consumption of homes treated, and possibly other metrics of depth of savings (e.g., 6
number of major measures installed – including, but not limited to heat pumps). 7
To that end, I would also strongly suggest that DTE be required to direct its evaluators to 8
conduct process and impact evaluations of both their single family and multi-family low 9
income programs. Such evaluations should include efforts to 10
• better characterize the low income housing markets the programs are targeting;11
• understand ways the programs could be more effective in recruiting electrically-heated12
low income customers (leveraging experience from other jurisdictions);13
• quantify the fraction of multi-family building owners who follow through on major14
measure recommendations;15
• document the reasons why building owners do not follow through;16
• document and understand the time lags between when assessments are completed and17
when major measures get installed;18
• document the reduction in energy burden associated with participating in the programs,19
both for electrically-heated and non-electrically heated participants;20

32
• assess non-energy benefits both low income customers and multi-family building1
owners, and the extent to which they could be better leveraged when promoting the2
programs to low income customers and building owners; and3
• better understand how the programs’ future design and/or delivery could be improved.
V. DTE SHOULD USE MARGINAL LINE LOSSES WHEN ASSESSING EFFICIENCY4 COST-EFFECTIVENESS 5
Q: What are T&D loss rates? 6
A: When electricity is generated, it must be sent through the utility’s transmission and/or 7
distribution (T&D) system infrastructure to residential and business customers. Some of the 8
electricity is “lost” in the process. Thus, the amount of electricity that needs to be generated 9
is greater than the amount of electricity that is ultimately consumed by residential and 10
business customers. The amount by which it is greater is the T&D loss rate. 11
Q: Why are loss rate assumptions important in the context of analyses of efficiency 12
program savings? 13
A: DTE and other utilities typically measure efficiency program savings at their customers’ 14
homes or businesses. Indeed, that is the way their savings goals are articulated. Thus, when 15
assessing the cost-effectiveness of efficiency programs, the utility must make assumptions 16
about loss rates because they need to understand the impacts that saving electricity at their 17
customers’ meters will have on generation requirements. 18

33
Q: What is DTE’s loss rate assumption? 1
A: DTE converts both estimated customer energy savings and estimated customer peak demand 2
savings to generation savings using a 6.8% T&D loss rate assumption.26 3
Q: Is that 6.8% assumption an average loss rate or a marginal loss rate? 4
A: The 6.8% is an average annual loss rate.”27 5
Q: Is that a reasonable assumption for an average loss rate for DTE? 6
A: I have no opinion whether it is a reasonable assumption for an average annual loss rate for 7
DTE, but it is not an appropriate rate for estimating the effects of efficiency programs on 8
generation requirements. To the contrary, if it is a reasonably precise estimate of average 9
annual T&D losses for DTE, then it will significantly understate the reduction in losses 10
caused by efficiency programs. 11
Q: Please explain. 12
A: Line losses grow (largely) exponentially with load.28 That means that the T&D loss 13
associated with adding one more kWh of demand to the system in any given hour of the year 14
26 Exhibit NRD-6, Attachment U-20373 NRDCDE-1.1ai-01 DSMore 2018 Batch Tool - 2020-2021 EWR Plan, “Res Utility Input” and “C&I Utility Input” tabs. Cell A3 in both the “Res Utility Input” and “C&I Utility Input” tabs of NRDCDE-1.1ai-01 DSMore 2018 Batch Tool – 2020-2021 EWR Plan.xlsx shows that the 6.8% is used for annual electric losses. Cell A2 in the same tabs enables users of DSMore to insert a multiplier to generate a higher peak or T&D loss rate. However, the DTE input is 100% (i.e., peak loss rate is assumed to be the same as annual energy loss rate). 27 Exhibit NRD-7, Responses to NRDCDE-1.1aix1, aix3b, and aix4 and Attachment, page 1 (Response to NRDCDE-1.1aix1). 28 Exhibit NRD-8, Lazar, Jim and Xavier Baldwin, Valuing the Contribution of Energy Efficiency to Avoided Marginal Line Losses and Reserve Requirements, Regulatory Assistance Project, August 26, 2011, available at https://www.raponline.org/knowledge-center/valuing-the-contribution-of-energy-efficiency-to-avoided-marginal-line-losses-and-reserve-requirements/?sf_data=results&_sf_s=lazar+line+loss.

34
will be higher than the average T&D loss for all kWh of demand at that hour. Simply put, 1
marginal loss rates are higher than average loss rates. 2
Q: How is that relevant to analyzing the effects of efficiency programs? 3
A: By definition, efficiency programs savings occur “on the margin”. Thus, their impacts on 4
T&D losses should be valued using marginal loss rates. This is clearly explained in the 5
National Standard Practice Manual for Assessing Cost-Effectiveness of Energy Efficiency 6
Resources (commonly referred to as the NSPM): 7
“When estimating the magnitude of avoided line losses, it is important to 8 recognize that line losses grow exponentially with load. As a result, the 9 marginal loss rate associated with the last increment of load added to – or 10 removed from – the T&D system (i.e. incremental losses divided by 11 incremental load) is greater than the average loss rate for all load (i.e. total 12 losses divided by total load). Thus, the magnitude of line loss reductions 13 associated with efficiency savings should be based on estimates of marginal 14 – not average – line loss rates.”29 15
Q: How should loss rates be used to convert annual customer peak demand savings to 16
generation capacity savings? 17
A: Because loss rates grow largely exponentially with load, loss rates used to convert customer 18
peak demand savings to peak demand savings at generation should be higher than loss rates 19
used to convert annual customer energy savings to annual energy savings at generation. This 20
is clearly explained in the NSPM: 21
“…there should be separate average marginal line loss rates for energy 22 savings and peak demand savings. By definition, marginal line loss rates at 23
29 Woolf, Tim, et al., National Standard Practice Manual for Assessing Cost-Effectiveness of Efficiency Resources, Edition 1, Spring 2017, page 51, available at https://nationalefficiencyscreening.org/wp-content/uploads/2017/05/NSPM_May-2017_final.pdf.

35
the time of system peak will be considerably higher than the weighted average 1 of marginal line loss rates across all hours of the year when energy is saved.”30 2
Q: Does DTE agree marginal loss rates are more accurate reflections of the impacts of 3
efficiency on energy and capacity savings? 4
A: No. However, the Company has provided no explanation for that position in this 5
proceeding.31 6
Q: Is there evidence from DTE’s service territory to support the conclusion that marginal 7
losses are greater than average losses? 8
A: Yes. Data from DTE’s 1999 line loss study32 – apparently the most recent such study 9
conducted by the Company – supports the notion that line losses grow as load grows. That 10
is the fundamental principle underlying the concept that marginal loss rates are larger than 11
average loss rates. 12
To be clear, the 1999 DTE study did not estimate marginal line loss rates; nor did it provide 13
loss rates at the time of system peak. What it did provide are average monthly loss rates. As 14
Figure 1shows, the months with lowest average demands had the lowest average line loss 15
rates; the months with highest average demands (all summer months) had the highest average 16
line loss rates. To be clear, I am not suggesting that loss rates from a 1999 study are 17
necessarily reflective of loss rates on DTE’s system today, twenty years later. However, the 18
30 Id. 31 Exhibit NRD-7, page 2 (Response to NRDCDE-1.1aix3b). 32 Exhibit NRD-7, pages 3-16 (Response to NRDCDE-1.1aix4 and attachment U-20373 NRDCDE-1.1aix4-01 Line Loss Study 1999).

36
pattern reflected in the study results – of increasing loss rates as demand grows – is consistent 1
with both engineering expectations and the results of other studies. 2
Figure 1: Average DTE Monthly Demand and Loss Rates in 1999 3
4
Q: What are the implications of DTE’s decision to use an average loss rate rather than a 5
marginal loss rate – both for energy and capacity? 6
A: Using average loss rates will understate the value of avoided energy costs. Similarly, using 7
the same average annual loss rate to estimate peak demand impacts will understate the value 8
of avoided capacity and avoided T&D benefits. 9
Q: By how much will the use of average loss rates understate the benefits of efficiency? 10
A: For energy savings, it is reasonable to assume that average marginal loss rates are 11
approximately 1.5 times average annual loss rates. In other words, if DTE’s average annual 12

37
loss rate is 6.8%, its average marginal loss rate could be reasonably estimated to be on the 1
order of 10.2%. Put another way, DTE has likely understated the avoided energy benefits of 2
its efficiency programs by about 3%. 3
For peak demand savings, it is reasonable to assume that the marginal loss rate at the time of 4
system peak is on the order of 2.0 times the average annual marginal loss rate – or about 5
20.4% for DTE. Put another way, DTE has likely understated the avoided capacity and 6
avoided T&D benefits of its efficiency programs by about 13%. 7
These multipliers are consistent with research published several years ago by the Regulatory 8
Assistance Project33 and an internal study conducted by Commonwealth Edison, the utility 9
serving the Chicago area.34 10
Q: What are the implications of such understatements of the benefits of DTE’s efficiency 11
programs? 12
A: The result is an understatement of the cost-effectiveness of DTE’s programs. That could 13
lead DTE to inappropriately screen out or lower emphasis on some efficiency measures or 14
programs. In addition, to the extent that the Company continues to inappropriately use 15
average line loss rates in studies to assess cost-effective efficiency potential, in IRPs and in 16
other planning processes, it will bias such analyses and plans in favor of lower levels of 17
energy efficiency. 18
33 Exhibit NRD-8, Lazar, Jim and Xavier Baldwin, Valuing the Contribution of Energy Efficiency to Avoided Marginal Line Losses and Reserve Requirements, Regulatory Assistance Project. 34 See Commonwealth Edison, 2018-2021 Energy Efficiency and Demand Response Plan, Exhibit A, filed June 30, 2017, Illinois Commerce Commission Docket 17-0312, available at https://www.icc.illinois.gov/docket/files.aspx?no=17-0312&docId=254601.

38
Q: What could be done to address the resulting underestimate of the benefits and cost-1
effectiveness of DTE’s efficiency programs? 2
A: First, the Commission could instruct DTE to begin using average annual marginal loss rates 3
to assess the value of avoided energy benefits and marginal loss rates during peak hours to 4
assess the value of avoided capacity and avoided T&D benefits. 5
Second, DTE should conduct a new study of line loss rates to inform the marginal line loss 6
assumptions it uses in the future. That study should (1) quantify the difference between 7
average annual marginal loss rates and average annual loss rates; (2) quantify the difference 8
between average peak hour loss rates and average annual loss rates; and (3) quantify the 9
difference between marginal loss rates during peak hours and average loss rates during peak 10
hours. 11
Finally, until such a new line loss study is completed, the Company should use the proxy 12
multipliers I discuss above: (1) assuming average annual marginal loss rates are 150% of 13
average annual loss rates; and (2) assuming marginal peak loss rates are 200% of average 14
annual marginal loss rates (i.e., 300% of average annual loss rates). 15
VI. DTE SHOULD INCREASE FIRST YEAR SAVINGS TO 2.00% OF SALES16
A. Overview17
Q: What is DTE’s rationale for its proposal to ramp up to just 1.75% savings? 18
A: DTE’s proposed ramp up to 1.75% is based on the EWR savings levels that it proposed in its 19
Integrated Resource Plan (IRP) filing in Case No. U-20471.35 20
35 Direct Testimony of Jason Kupser, pages 20-21.

39
Q: Has the Company presented any other evidence in this proceeding to suggest that 1
1.75% is the economically optimal level of EWR savings to pursue? 2
A: No. 3
Q: Has the Commission approved DTE’s IRP or otherwise approved that level of savings? 4
A: No. As of the date on which I am filing this testimony, DTE’s IRP case is being contested 5
and has not reached a conclusion. 6
Q: Is 1.75% EWR savings the economically optimal level of efficiency savings for DTE? 7
A: No. It is clear that 1.75% savings is less than the economically optimal level of energy 8
savings for DTE, particularly in the near term. 9
Q: What is the basis for that conclusion? 10
A: I discuss this issue at length in testimony I filed in the DTE IRP case. Essentially, there are 11
two sets of analyses which demonstrate that savings of at least 2.00% provide greater net 12
economic benefits to DTE customers than savings at 1.75%: 13
1. DTE’s own energy efficiency cost-effectiveness analyses, using the same EWR cost-14
effectiveness tool that it uses to estimate the cost-effectiveness of its program portfolio15
in this proceeding (DSMore), suggest that 2.00% EWR produces greater net economic16
benefits than 1.75% savings; and17
2. When correcting for just one fundamental flaw in DTE’s IRP modeling of energy18
efficiency – its inclusion of all EWR costs through 2040 but exclusion of all post-204019
benefits that flow from those costs (commonly known as an “end effects” problem) –20

40
the Company’s IRP modeling also shows 2.00% EWR to be the most cost-effective 1
savings level. 2
As I explain in my testimony in the IRP case, there are a variety of other conservatisms or 3
biases in DTE’s IRP analyses of energy efficiency.36 They include a failure to use marginal 4
line loss rates instead of average line loss rates (a problem that persists in DTE’s analysis of 5
the cost-effectiveness of efficiency in this EWR plan proceeding), an assumption that 6
evaluation and other portfolio overhead costs would need to increase linearly with other 7
program spending and the Company’s failure to optimize incentive levels and the efficiency 8
measures selected for analysis in its different EWR savings scenarios. Correcting for any of 9
these problems would only enhance the economic advantage of a 2.00% EWR savings level 10
relative to a 1.75% level. 11
B. DSMore Analyses Suggest Economically Optimal Savings is at Least 2.00%12
Q: Please describe the DSMore cost-effectiveness analyses that DTE performed for its IRP. 13
A: DTE analyzed the cost-effectiveness of multiple different levels of energy efficiency savings 14
every year through 2040.37 That included analyses of 1.50%, 1.75%, 2.00%, 2.25% and 15
2.50% savings per year. The Company analyzed the cost-effectiveness of those different 16
levels of energy savings under three different set of EWR cost assumptions: 17
• “tiered costs”, in which the costs of per unit of savings as savings levels increased based18
on an assumption that efficiency measure incentives would be equal to 35% of the cost19
36 Case No. U-20471, Direct Testimony of Christopher Neme, 7 TR 2664-2673. 37 Though there was an assumed ramp up period to achieve savings levels higher than 1.50%.

41
efficiency measures at a 1.50% savings level and 50% of the cost of efficiency 1
measures at a 2.00% savings level (and therefore increase faster than linearly as savings 2
levels increased); 3
• “flat low costs”, in which the costs per unit of savings were the same per kWh, based4
on an assumption that efficiency measure incentives would be equal to 35% of the cost5
of efficiency measures at all savings levels (but therefore increase linearly in absolute6
terms as the level of savings increased); and7
• “flat high costs”, in which the costs per unit of savings were the same per kWh, based8
on an assumption that efficiency measure incentives would be equal to 50% of the cost9
of efficiency measures at all savings levels (but therefore still increase linearly in10
absolute terms as the levels of savings increased).11
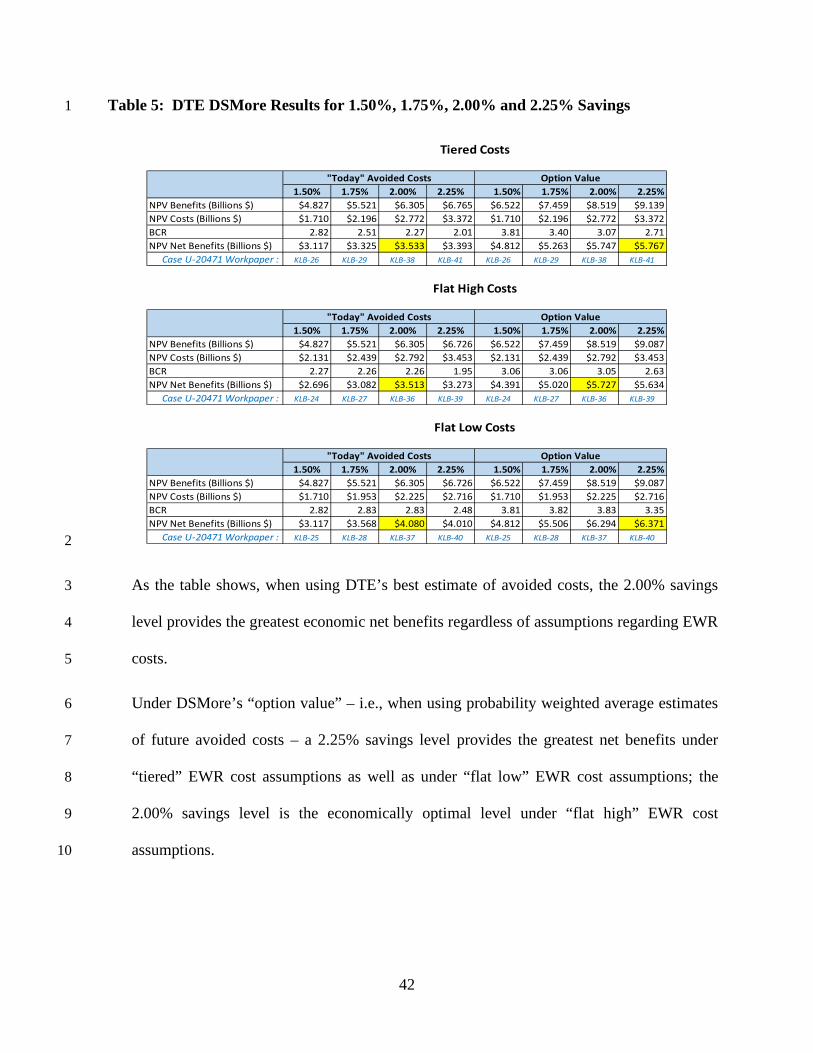
Q: What were the results of these DSMore analyses? 12
A: Table 5 below (and also in Table 9 of my testimony in the DTE IRP case) presents the results 13
of DTE’s DSMore analyses for each level of energy efficiency from 1.50% to 2.25%. The 14
results are presented for each of the three different set of efficiency cost assumptions 15
analyzed by the Company, as well as for two different estimates of avoided costs (what 16
DSMore calls “today” avoided costs, which are avoided costs DTE believes most closely 17
reflect prices in its current forecast, as well as what DSMore calls an “option value” analysis). 18
The “sources” shown in the bottom row of each part of the table are different workpapers 19
developed by DTE Witness Kevin Bilyeu in the IRP case. 20
42
Table 5: DTE DSMore Results for 1.50%, 1.75%, 2.00% and 2.25% Savings 1
2
As the table shows, when using DTE’s best estimate of avoided costs, the 2.00% savings 3
level provides the greatest economic net benefits regardless of assumptions regarding EWR 4
costs. 5
Under DSMore’s “option value” – i.e., when using probability weighted average estimates 6
of future avoided costs – a 2.25% savings level provides the greatest net benefits under 7
“tiered” EWR cost assumptions as well as under “flat low” EWR cost assumptions; the 8
2.00% savings level is the economically optimal level under “flat high” EWR cost 9
assumptions. 10
1.50% 1.75% 2.00% 2.25% 1.50% 1.75% 2.00% 2.25%NPV Benefits (Billions $) $4.827 $5.521 $6.305 $6.765 $6.522 $7.459 $8.519 $9.139NPV Costs (Billions $) $1.710 $2.196 $2.772 $3.372 $1.710 $2.196 $2.772 $3.372BCR 2.82 2.51 2.27 2.01 3.81 3.40 3.07 2.71NPV Net Benefits (Billions $) $3.117 $3.325 $3.533 $3.393 $4.812 $5.263 $5.747 $5.767
Case U-20471 Workpaper : KLB-26 KLB-29 KLB-38 KLB-41 KLB-26 KLB-29 KLB-38 KLB-41
1.50% 1.75% 2.00% 2.25% 1.50% 1.75% 2.00% 2.25%NPV Benefits (Billions $) $4.827 $5.521 $6.305 $6.726 $6.522 $7.459 $8.519 $9.087NPV Costs (Billions $) $2.131 $2.439 $2.792 $3.453 $2.131 $2.439 $2.792 $3.453BCR 2.27 2.26 2.26 1.95 3.06 3.06 3.05 2.63NPV Net Benefits (Billions $) $2.696 $3.082 $3.513 $3.273 $4.391 $5.020 $5.727 $5.634
Case U-20471 Workpaper : KLB-24 KLB-27 KLB-36 KLB-39 KLB-24 KLB-27 KLB-36 KLB-39
1.50% 1.75% 2.00% 2.25% 1.50% 1.75% 2.00% 2.25%NPV Benefits (Billions $) $4.827 $5.521 $6.305 $6.726 $6.522 $7.459 $8.519 $9.087NPV Costs (Billions $) $1.710 $1.953 $2.225 $2.716 $1.710 $1.953 $2.225 $2.716BCR 2.82 2.83 2.83 2.48 3.81 3.82 3.83 3.35NPV Net Benefits (Billions $) $3.117 $3.568 $4.080 $4.010 $4.812 $5.506 $6.294 $6.371
Case U-20471 Workpaper : KLB-25 KLB-28 KLB-37 KLB-40 KLB-25 KLB-28 KLB-37 KLB-40
"Today" Avoided Costs Option Value
Flat High Costs
"Today" Avoided Costs Option Value
Tiered Costs
Flat Low Costs
"Today" Avoided Costs Option Value

43
Q: Why are DSMore’s “option value” scenario results of interest? 1
A: As noted above, the “today” avoided costs are akin to a current “best estimate” of what future 2
avoided costs would be. However, there is uncertainty associated with any best estimate. 3
Avoided costs could be higher or lower than current best estimates. And there may be a 4
different probability of them being lower than of them being higher. Further, the amount by 5
which they could be higher than current best estimates may be greater than the amount by 6
which they could be lower than current best estimates. Thus, rather than using a “best 7
estimate” of avoided costs, the “option value” analysis uses a weighted average of potential 8
future avoided costs given assumptions about the probability of different future levels of 9
avoided costs.38 This is a way of assessing the cost-effectiveness of efficiency in a manner 10
that accounts for the risk associated with the uncertainty of future energy prices. As the 11
result show, when one accounts for that uncertainty higher levels of efficiency – even higher 12
than 2.00% - become more economically attractive. 13
C. IRP Suggests 2.00% EWR Savings is Least Cost if End Effects Problem Fixed14
Q: What are “end effects”? 15
A: End effects are an analytical problem that occurs when an economic analysis includes the 16
full cost of a resource but not the full life-cycle benefits of that resource. This typically 17
occurs when costs are incurred entirely or mostly within the timeframe of an analysis and a 18
portion of the benefits associated with those costs would be realized outside of that 19
timeframe. 20
38 Exhibit NRD-9, Case No. U-20471 DTE Electric’s Response to MECNRDCSC-4.24eii4.

44
Q: Are there end effects problems with the way DTE analyzed energy efficiency in its IRP? 1
A: Yes. DTE’s IRP analyses extend through the year 2040. In analyzing efficiency, DTE 2
assumes that efficiency programs will be run in each year from 2019 through 2040. Most of 3
those costs are assumed to be expensed – i.e., recovered in the year in which they are 4
incurred. And the small portion that are capitalized are recovered over a relatively short five-5
year period. As a result, when computing the net present value (NPV) of efficiency costs 6
over the 2019 to 2040 period for its IRP analysis, DTE captures more than 99% of forecast 7
energy efficiency program spending during that period.39 In contrast, because many 8
efficiency program measures provide savings for at least a decade – and some for twenty 9
years or more – DTE’s IRP analyses captures only about 85% of the benefits of that 10
spending.40 Even though DTE’s IRP Case No. U-20471 is still ongoing, DTE Witness Laura 11
K. Mikulan recognized the impacts of the end effects issue on EWR analysis in that case. On12
cross examination in that case, Ms. Mikulan stated “EWR is the only resources evaluated in 13
the IRP that has cost impacts effectively front-loaded while the benefits of such resource 14
occur over an extended period of time[,]” and agreed that including all the costs of EWR but 15
not all other resources in the model would bias the analysis against EWR.41 16
39 See Exhibit NRD-10, Case No. U-20471 DTE Workpaper LKM-650. For example, the NPV of Revenue Requirements over the 2019 to 2040 period for the 2.00% EWR level using Tiered Costs is $2.580 billion (Revenue Requirement Summary Tab, cell C11), which is 99.2% of the $2.601 billion NPV when including all post-2040 costs (Revenue Requirement Summary Tab, cell AV23). 40 For example, per Exhibit NRD-11, Case No. U-20471 DTE Workpaper KLB-26, DTE’s analysis of the cost-effectiveness of a 1.50% EWR savings level using the DSMore tool suggests that the NPV of total benefits is $4.827 billion (Test Results tab, cell D22). In contrast, the NPV of benefits of just the first 22 years of savings is $4.109 billion (NPV calculation, using a 6.63% discount rate, of the stream of benefits in cells F129 through F150 in the Financial Reports Tab). Id. 41 Case No. U-20471, Cross Examination, October 3, 2019, 3 TR 662, lines 6-9, 12-17.
45
Q: What are the implications of this end effects problem with respect to conclusions 1
regarding different levels of energy efficiency savings? 2
A: DTE’s IRP analysis captures virtually all of the difference in costs between different levels 3
of efficiency (i.e., the difference in costs between 1.50%, 1.75%, 2.00%, etc.) but does not 4
capture all of the difference in benefits associated with different levels of efficiency. That 5
biases its IRP analyses of efficiency in favor of lower levels of efficiency. 6
Q: Have you quantified the magnitude of that bias? 7
A: Yes. I was able to estimate the magnitude of missing benefits by using the results of DTE’s 8
DSMore analyses. DSMore provides both year-by-year estimates of benefits for the first 25 9
years of an analysis period as well as the full net present value (“NPV”) of lifecycle benefits 10
(going as far into the future as necessary). Thus, I was able to compute the NPV of the first 11
22 years of benefits and compare that to the full lifecycle benefits.42 I added to that 12
calculation an estimate of post-2040 avoided T&D costs missing from DTE’s analysis.43 The 13
difference between the fully lifecycle benefits and the NPV of just the first 22 years of 14
benefits is quite large. Indeed, the value of the post-2040 benefits excluded by DTE from its 15
IRP analyses were on the order of $700 million to $1 billion, or many times larger than the 16
42 Case No. U-20471 Workpapers KLB-24 through KLB-44. The NPV of lifecycle benefits can be found on the “test results” tab, cell D22 for “market-based today” – the version of avoided costs that DTE references because “it most closely reflects the prices in its current forecast.” (Case No. U-20471 Exhibit MEC-46, Response to MECNRDCSCDE-8.21). Estimates of annual benefits for the first 22 years can be found in the “financial reports” tab, cells F129 through F150. I used the Company’s 6.63% nominal discount rate to compute the NPV of those 22 years of benefits. 43 Consistent with the estimate of energy and capacity costs in DSMore, post-2040 T&D benefits are assumed to be 15% of the lifecycle T&D benefits. T&D benefits are about 2% of the total missing benefits shown in the table (i.e., $13 million out of $732 million for the 1.50% EWR level, increasing to $19 million out of $974 million for the 2.25% EWR level).

46
post-2040 costs omitted from DTE’s IRP analysis (e.g., the $21 million of costs omitted from 1
the 2.00% EWR analysis that I reference in footnote 39 above). 2
Q: Are those changes enough, by themselves, to change conclusions from DTE’s IRP model 3
regarding which EWR savings level is the economically optimal one? 4
A: Yes, as the first row in Table 6 shows, DTE concludes that the 1.50% EWR savings level 5
has the lowest net present value of revenue requirements (“NPVRR”) – about $18 million 6
less than the 1.75% EWR savings level and about $93 million less than the 2.00% EWR 7
savings level – when using its “tiered cost” assumptions for different EWR savings levels. 8
When avoided T&D benefits are included, those gaps narrow: the 1.50% EWR savings level 9
is now only $5 million less than the 1.75% EWR level and $64 million less than the 2.00% 10
EWR level. As the third and fourth rows show, just correcting for end effects – without 11
addressing any of the other changes or adjustments I suggest in my testimony – the 2.00% 12
savings level becomes the economically optimal level of efficiency: more than $40 million 13
less expensive than the 1.75% EWR level. 14
DTE already concluded that the 2.00% EWR savings level was the economically optimal 15
savings level when using “flat high cost” assumptions for efficiency savings. The 2.00% 16
EWR savings level remains the economically optimal savings level after correcting for end 17
effects in the flat high cost sensitivity, but much more solidly so. 18
Table 6: DTE IRP NPVRR After Correcting End Effects Problems 19
20
1.50% 1.75% 2.00% 2.25% 1.50% 1.75% 2.00% 2.25%$13,278 $13,296 $13,371 $13,637 $13,634 $13,502 $13,389 $13,729$13,206 $13,211 $13,270 $13,532 $13,562 $13,417 $13,288 $13,624$12,573 $12,523 $12,498 $12,710 $12,932 $12,731 $12,516 $12,802$12,488 $12,423 $12,379 $12,586 $12,847 $12,631 $12,397 $12,678
DTE Analysis (excl avoided T&D)
Correct End Effects (incl Avoided T&D)
DTE Analysis (incl avoided T&D)Correct End Effects (excl Avoided T&D)
Tiered Costs Flat High Costs

47
Q: Has DTE offered any explanation for its approach to potential end effects problems 1
with its modeling of energy efficiency? 2
A: The Company states that “no costs or savings from any other energy and/or capacity resource 3
option beyond the year 2040 was included” in its analysis and that, as a result, “the treatment 4
of all options, whether demand side or supply side in the optimization, is equivalent.”44 5
However, the Company’s explanation does not address the bias inherent in just comparing 6
different levels of EWR savings to each other when they include more than 99% of the 7
difference in costs between EWR savings levels but only 85% of the difference in benefits. 8
In response to follow up discovery on this issue, the Company also stated that “[i]t is not 9
necessary to include all benefits or costs from beyond 2040 to properly assess the cost-10
effectiveness of programs that are installed in the early years of the analysis” and that “[t]o 11
include costs or benefits that extend that far into the future does not change the decisions 12
made for programs installed in the early 2020s.”45 However, that too is an unsatisfactory 13
answer. First, the failure to address end effects undermines the validity of any DTE 14
conclusions regarding longer-term direction suggested by the Company’s IRP. Second, the 15
Company’s statement that ignoring end effects “does not change the decisions made for 16
programs installed in the early 2020s” is inaccurate because the very analysis that the 17
Company is using to conclude which level of EWR in early 2020s is economically optimal 18
includes program costs that go out to 2040 – and more importantly, cost differences between 19
EWR savings levels out to 2040 – without including all of the benefits – and more 20
importantly, the benefits differences between EWR investment levels that are associated with 21
44 Case No. U-20471 Exhibit MEC-48, page 3 (Response to MECNRDCSCDE-4.23c). 45 Case No. U-20471 Exhibit MEC-47, page 1 (Response to MECNRDCSCDE-7.69a).

48
programs costs incurred through 2040. The bottom line is that if the Company is going to 1
base its economic analysis of the relative cost-effectiveness of different levels of efficiency 2
spending extended out to 2040, it is inappropriate to exclude some of the benefits associated 3
with that stream of costs.46 Alternatively, the Company could have analyzed the trade-offs 4
of just ramping up to different levels of efficiency through the mid-2020s, holding efficiency 5
levels the same in all cases after that, to determine which level of efficiency was 6
economically optimal in the next five to seven years. However, Company did not perform 7
that analysis. 8
Q: Have you performed that analysis? 9
A: Yes. I developed a set of efficiency savings and cost inputs for ramping up to 1.75%, 2.00% 10
and 2.25% EWR only through the year 2025 and then reducing the savings in all three cases 11
to the 1.50% EWR level for the years 2026 through 2040. Those inputs were based entirely 12
on DTE’s assumptions using Tiered Costs for efficiency and were applied to DTE’s 13
Reference Scenario. As Table 7 shows, when NRDC witness Mr. Evans ran those scenarios 14
through Strategist the result was that the economically optimal efficiency level through 2025 15
was 2.00%.47 16
Table 7: NPVRR of Higher Savings Levels Just Through 2025 17
18
46 For further discussion of this concept, see Chapter 11 of Woolf, Tim, et al., National Standard Practice Manual for Assessing Cost-Effectiveness of Efficiency Resources, Edition 1, Spring 2017, available at https://nationalefficiencyscreening.org/wp-content/uploads/2017/05/NSPM_May-2017_final.pdf. 47 Case No. U-20471, Direct Testimony of Christopher Neme, 7 TR 2682.
1.50% 1.75% 2.00% 2.25% 1.50% 1.75% 2.00% 2.25%Revert to 1.50% Savings after 2025 (excluding T&D) $13,278 $13,268 $13,264 $13,324 $0 ($10) ($14) $46 Revert to 1.50% Savings after 2025 (including T&D) $13,206 $13,183 $13,163 $13,219 $0 ($23) ($43) $13
Total Incremental to 1.50%Adjustment

49
I should emphasize that this result excludes adjustments for any of the other concerns I have 1
raised with respect to DTE’s analysis of efficiency – all of which would should further 2
improve the standing of 2.00% EWR relative to 1.50% and 1.75% savings levels. 3
I should also add that Commission Staff shared my view in the IRP case that the 2.00% EWR 4
savings level was the preferred savings level for the Company.48 5
Finally, it should be noted that Consumers Energy’s recently file EWR plan proposes a ramp 6
up in savings to 1.90% in 2020 and 2.18% in 202149 – in other words, to savings levels that 7
are beyond the 1.75% for 2020 and 2.00% for 2021 that I am suggesting would be appropriate 8
for DTE. 9
Q: Does that conclude your testimony? 10
A: Yes, it does. 11
48 Case No. U-20471, Direct Testimony of David Walker, 7 TR 3325. 49 Case No. U-20372, Consumers Energy Exhibit A-2 (TAY 2), page 7 of 257.
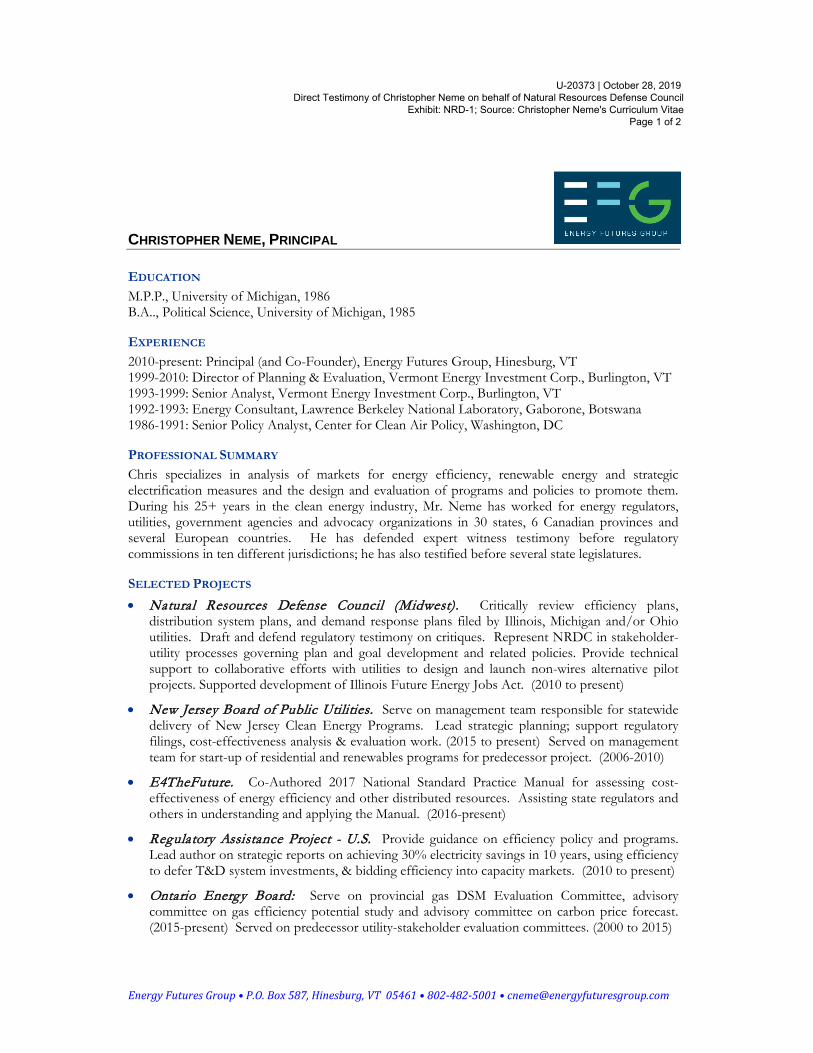
CHRISTOPHER NEME, PRINCIPAL
Energy Futures Group • P.O. Box 587, Hinesburg, VT 05461 • 802-482-5001 • [email protected]
EDUCATION M.P.P., University of Michigan, 1986B.A.., Political Science, University of Michigan, 1985
EXPERIENCE 2010-present: Principal (and Co-Founder), Energy Futures Group, Hinesburg, VT 1999-2010: Director of Planning & Evaluation, Vermont Energy Investment Corp., Burlington, VT 1993-1999: Senior Analyst, Vermont Energy Investment Corp., Burlington, VT 1992-1993: Energy Consultant, Lawrence Berkeley National Laboratory, Gaborone, Botswana 1986-1991: Senior Policy Analyst, Center for Clean Air Policy, Washington, DC
PROFESSIONAL SUMMARY Chris specializes in analysis of markets for energy efficiency, renewable energy and strategic electrification measures and the design and evaluation of programs and policies to promote them. During his 25+ years in the clean energy industry, Mr. Neme has worked for energy regulators, utilities, government agencies and advocacy organizations in 30 states, 6 Canadian provinces and several European countries. He has defended expert witness testimony before regulatory commissions in ten different jurisdictions; he has also testified before several state legislatures.
SELECTED PROJECTS
• Natural Resources Defense Council (Midwest). Critically review efficiency plans,distribution system plans, and demand response plans filed by Illinois, Michigan and/or Ohioutilities. Draft and defend regulatory testimony on critiques. Represent NRDC in stakeholder-utility processes governing plan and goal development and related policies. Provide technicalsupport to collaborative efforts with utilities to design and launch non-wires alternative pilotprojects. Supported development of Illinois Future Energy Jobs Act. (2010 to present)
• New Jersey Board of Public Utilities. Serve on management team responsible for statewidedelivery of New Jersey Clean Energy Programs. Lead strategic planning; support regulatoryfilings, cost-effectiveness analysis & evaluation work. (2015 to present) Served on managementteam for start-up of residential and renewables programs for predecessor project. (2006-2010)
• E4TheFuture. Co-Authored 2017 National Standard Practice Manual for assessing cost-effectiveness of energy efficiency and other distributed resources. Assisting state regulators andothers in understanding and applying the Manual. (2016-present)
• Regulatory Assistance Project - U.S. Provide guidance on efficiency policy and programs.Lead author on strategic reports on achieving 30% electricity savings in 10 years, using efficiencyto defer T&D system investments, & bidding efficiency into capacity markets. (2010 to present)
• Ontario Energy Board: Serve on provincial gas DSM Evaluation Committee, advisorycommittee on gas efficiency potential study and advisory committee on carbon price forecast.(2015-present) Served on predecessor utility-stakeholder evaluation committees. (2000 to 2015)
U-20373 | October 28, 2019Direct Testimony of Christopher Neme on behalf of Natural Resources Defense Council
Exhibit: NRD-1; Source: Christopher Neme's Curriculum VitaePage 1 of 2

CHRISTOPHER NEME, PRINCIPAL
Energy Futures Group • P.O. Box 587, Hinesburg, VT 05461 • 802-482-5001 • [email protected]
• Green Energy Coalition (Ontario). Represent coalition of environmental groups in regulatoryproceedings, utility negotiations and stakeholder meetings on DSM policies (including integratedresource planning on pipeline expansions) and utility proposed DSM Plans. (1993 to present)
• New Hampshire Consumer Advocate. Filed expert witness testimony on the merits ofincluding a non-wires alternative pilot project in the state’s efficiency program plans. (2018)
• Southern Environmental Law Center. Critically reviewed and filed expert witness testimonyon Duke Energy efficiency program plans and past year savings claims. (2018)
• Green Mountain Power (Vermont). Support development and implementation of GMP’scompliance plan for Vermont RPS Tier 3 requirement to reduce customers’ direct consumptionof fossil fuels, with significant emphasis on strategic electrification strategies. Also leddevelopment of forecast of strategic electrification potential. (2016 to 2018)
• Toronto Atmospheric Fund. Helped draft an assessment of efficiency potential fromretrofitting of heat pumps into electrically heated multi-family buildings (2017).
• Regulatory Assistance Project - Europe. Provide on-going support on efficiency policies andprograms in the United Kingdom, Germany, and other countries. Reviewed draft EuropeanUnion policies on Energy Savings Obligations, EM&V protocols, and related issues. Draftedpolicy brief on efficiency feed-in-tariffs and roadmap for residential retrofits. (2009 to 2017)
• Northeast Energy Efficiency Partnerships. Helped manage Regional EM&V forum projectestimating savings for emerging technologies, including field study of cold climate heat pumps.Led assessment of best practices on use of efficiency to defer T&D investment. (2009 to 2015)
• Ontario Power Authority. Managed jurisdictional scans on leveraging building efficiencylabeling/disclosure requirements and non-energy benefits in cost-effectiveness screening.Supported staff workshop on the role efficiency can play in deferring T&D investments.Presented on efficiency trends for Advisory Council on Energy Efficiency. (2012-2015)
• New Hampshire Electric Co-op. Led assessment of the co-op’s whole building efficiencyretrofit, cold climate heat pump and renewable energy programs. (2014)
• National Association of Regulatory Utility Commissioners (NARUC) and MichiganPublic Service Commission. Assessed alternatives to first year savings goals to eliminatedisincentives to invest in longer-lived measures and programs. (2013)
• New York State Energy Research and Development Authority (NYSERDA). Ledresidential & renewables portions of several statewide efficiency potential studies. (2001 to 2010)
• Ohio Public Utilities Commission. Senior Advisor developing a new TRM. (2009 to 2010)
• Vermont Electric Power Company. Led residential portion of efficiency potential study toassess alternatives to new transmission line. Testified before Public Service Board. (2001-2003)
• Efficiency Vermont. Served on Sr. Management team. Supported initial project start-up.Oversaw residential planning, input to regulators on evaluation, input to regional EM&V forum,development of M&V plan and other aspects of bidding efficiency into New England’s ForwardCapacity Market (FCM), and development and updating of nation’s first TRM. (2000 to 2010)
U-20373 | October 28, 2019Direct Testimony of Christopher Neme on behalf of Natural Resources Defense Council
Exhibit: NRD-1; Source: Christopher Neme's Curriculum VitaePage 2 of 2

MPSC Case No.: Requestor:
Question No.: Respondent:
Page:
U-20373NRDC NRDCDE-1.25a J. C. LeBrun1 of 5
Question: Regarding the Company’s Multi-Family, Home Energy Consultation, Audit and Weatherization, Low Income Energy Efficiency Assistance and Low Income Multi- Family programs:
a. What portion of the Company’s 2018 participants and 2019 participantsthrough August in each of the programs were (1) electrically heated(regardless of income); (2) low income (regardless of heating fuel); and(3) both electrically heated and low income? Please provide informationseparately for each program for each year.
Answer: The values for 2019 are subject to the reconciliation of the 2019 EWR program and may be updated accordingly. The below values provided for (1), (2), and (3) are in terms of number of participants.
(1) electrically heated (regardless of income)
Multifamily
Number of Multifamily total electrically heated regardless of income units in 2018 – 11 units or 0.1% of total electric units served (9,745 electric total units).
Number of Multifamily total electrically heated regardless of income units in 2019 – 0 units or 0% (6,552 electric total units)
Multifamily Low Income
Number of Multifamily total electrically heated regardless of income units in 2018 – 11 units or 0.1% of total electric units served (9,745 electric total units).
Number of Multifamily total electrically heated regardless of income units in 2019 – 0 units or 0% (6,552 electric total units)
U-20373 | October 28, 2019 Direct Testimony of Christopher Neme on behalf of Natural Resources Defense Council
Exhibit: NRD-2; Source: DTE Electric's Response to NRDCDE-1.25a Page 1 of 5

MPSC Case No.: Requestor:
Question No.: Respondent:
Page:
U-20373 NRDC NRDCDE-1.25a J. C. LeBrun 2 of 5
Home Energy Consultation (HEC)
Number of HEC total electrically heated regardless of income units in 2018 – 4 units or 0.02% of total electric units served (16,611 electric total units)
Number of HEC total electrically heated regardless of income units in 2019 – 2 units or 0.02% of total electric units served (10,993 electric total units)
Audit and Weatherization
Number of Audit and Weatherization total electrically heated regardless of income units in 2018 – 246 or 8.82% of total electric units served (2,788 electric total units).
Number of Audit and Weatherization total electrically heated regardless of income units in 2019 – 179 or 8.97% of total electric units served (1,996 total electric units units).
Energy Efficiency Assistance (EEA)
Number of EEA total electrically heated regardless of income units in 2018 – 88 or 1.95% of total electric units served (4,506 total electric units).
Number of EEA total electrically heated regardless of income units in 2019 – 20 or 0.76% of total electric units served (2,632 total electric units).
(2) low income (regardless of heating fuel)
Multifamily
U-20373 | October 28, 2019 Direct Testimony of Christopher Neme on behalf of Natural Resources Defense Council
Exhibit: NRD-2; Source: DTE Electric's Response to NRDCDE-1.25a Page 2 of 5

MPSC Case No.: Requestor:
Question No.: Respondent:
Page:
U-20373 NRDC NRDCDE-1.25a J. C. LeBrun 3 of 5
Number of Multifamily low income regardless of heating fuel 2018 – 0 units Number of Multifamily low income regardless of heating fuel 2019 – 0 units
Multifamily Low Income
Number of Multifamily low income regardless of heating fuel 2018 – 6,146 units or 63% of total electric units served.
Number of Multifamily low income regardless of heating fuel 2019 – 4,353 units or 66% of electric units served.
Home Energy Consultation (HEC)
Number of HEC low income regardless of heating fuel 2018 – 4,644 units or 27% of total electric units served.
Number of HEC low income regardless of heating fuel 2019 – 3,081 units or 28% of total electric units served.
Audit and Weatherization
Number of Audit and Weatherization low income regardless of heating fuel in 2018 – 0 units or 0% of total units.
Number of Audit and Weatherization low income regardless of heating fuel in 2019 – 0 units or 0% of total units.
U-20373 | October 28, 2019 Direct Testimony of Christopher Neme on behalf of Natural Resources Defense Council
Exhibit: NRD-2; Source: DTE Electric's Response to NRDCDE-1.25a Page 3 of 5

MPSC Case No.: Requestor:
Question No.: Respondent:
Page:
U-20373 NRDC NRDCDE-1.25a J. C. LeBrun 4 of 5
Energy Efficiency Assistance (EEA)
Number of EEA low income regardless of heating fuel in 2018 – 5,956 units or 100% of total units.
Number of EEA low income regardless of heating fuel in 2019 – 3,655 units or 100% of total units.
(3) both electrically heated and low income
Multifamily
Both electrically heated and low income 2018 – 0 units
Both electrically heated and low income 2019 – 0 units
Multifamily Low Income
Both electrically heated and low income 2018 – 2 units or .03% of low income electric units served.
Both electrically heated and low income 2019 – 0 units or 0 % of low income electric units served.
Home Energy Consultation (HEC)
Both electrically heated and low income HEC 2018 – 1 unit or .02% of low income electric units served.
Both electrically heated and low income HEC 2019 – 2 units or .06% of low income electric units served.
U-20373 | October 28, 2019 Direct Testimony of Christopher Neme on behalf of Natural Resources Defense Council
Exhibit: NRD-2; Source: DTE Electric's Response to NRDCDE-1.25a Page 4 of 5

MPSC Case No.: Requestor:
Question No.: Respondent:
Page:
U-20373 NRDC NRDCDE-1.25a J. C. LeBrun 5 of 5
Audit and Weatherization
Number of Audit and Weatherization both electrically heated and low income in 2018 – 0 units or 0% of total electric units.
Number of Audit and Weatherization both electrically heated and low income in 2019 – 0 units or 0% of total electric units.
Energy Efficiency Assistance (EEA)
Number of EEA both electrically heated and low income in 2018 – 88 or 1.48% of total 5,956 units.
Number of EEA both electrically heated and low income in 2019 – 20 or 0.55% of total 3,655 units.
Attachments: N/A
U-20373 | October 28, 2019 Direct Testimony of Christopher Neme on behalf of Natural Resources Defense Council
Exhibit: NRD-2; Source: DTE Electric's Response to NRDCDE-1.25a Page 5 of 5

MPSC Case No.: Requestor:
Question No.: Respondent:
Page:
U-20373 NRDC NRDCDE-1.5 J. R. Kupser 1 of 1
Question: Please provide a copy of the Company’s most recent appliance saturation
survey report. Answer: Please refer to the attached document for the Company’s most recent
appliance saturation survey. Attachments: U-20373 NRDCDE-1.5-01 2016 DTE Appliance Saturation Survey
U-20373 | October 28, 2019 Direct Testimony of Christopher Neme on behalf of Natural Resources Defense Council
Exhibit: NRD-3; Source: DTE Electric's Response to NRDCDE-1.5-01 2016 DTE Appliance Saturation Survey - Question 12 & 13 Page 1 of 3

HEATING AND COOLING...Q12. What is the principal fuel used for heating your home?
Region Income Persons in Household Year Residence was Built
Total North- North- $20K- $60K- 1960- 1980- 2000- Sample Detroit West west east < $20K $59K $99K $100K+ 1-2 3-4 5+ < 1960 1979 1999 present A B C D E F G H I J K L M N O P
SAMPLE SIZE 6266 1019 2320 1672 1229 732 2144 1482 1382 4174 1582 418 1986 1603 1210 783 100.0% 100.0% 100.0% 100.0% 100.0% 100.0% 100.0% 100.0% 100.0% 100.0% 100.0% 100.0% 100.0% 100.0% 100.0% 100.0%
DON'T KNOW/NO ANSWER 73 25 17 18 13 21 25 5 4 51 11 4 20 6 11 7 1.3% 2.6% 0.9% 1.1% 1.3% 3.5% 1.1% 0.4% 0.3% 1.3% 0.7% 1.7% 1.1% 0.3% 1.1% 0.9%
TOTAL ANSWER 6193 994 2303 1654 1216 711 2119 1477 1378 4123 1571 414 1966 1597 1199 776
100.0% 100.0% 100.0% 100.0% 100.0% 100.0% 100.0% 100.0% 100.0% 100.0% 100.0% 100.0% 100.0% 100.0% 100.0% 100.0%
ÍÍÍÍÍÍÍÍÍÍÍÍÍÍÍÍÍÍÍÍÍÍÍÍÍÍÍÍÍÍÍÍÍÍÍÍÍÍÍÍÍÍÍÍÍÍÍÍÍÍÍÍÍÍÍÍÍÍÍÍÍÍÍÍÍÍÍÍÍÍÍÍÍÍÍÍÍÍÍÍÍÍÍÍÍÍÍÍÍÍÍÍÍÍÍÍÍÍÍÍÍÍÍÍÍÍÍÍÍÍÍÍÍÍÍÍÍÍÍÍÍÍÍÍÍÍÍÍÍÍÍÍÍÍÍÍÍÍÍÍÍÍÍÍÍÍÍÍÍÍÍÍÍÍÍÍÍÍÍÍÍÍÍÍÍÍÍÍÍÍ
Electricity 571 116 206 129 114 123 217 111 84 375 142 43 113 131 102 85 11.1% 13.1% 11.4% 9.7% 10.6% 18.6% 12.0% 9.9% 7.3% 11.0% 11.0% 12.9% 6.5% 9.3% 11.0% 13.0%
Gas 5457 854 2050 1500 1035 556 1829 1337 1274 3628 1397 363 1815 1417 1068 682 86.3% 83.9% 86.6% 88.8% 84.2% 76.5% 84.9% 88.3% 91.2% 86.1% 87.1% 85.4% 91.6% 87.7% 87.0% 86.1%
Other 165 24 47 25 67 32 73 29 20 120 32 8 38 49 29 9 2.6% 3.0% 2.0% 1.5% 5.2% 4.9% 3.1% 1.8% 1.5% 2.9% 1.9% 1.7% 1.9% 3.0% 2.0% 0.9%
NOTE: Data is weighted by kilowatt hour usage and age.
NOTE: / represents percent less than .05
- 14 -
Source: 2016 Residential Customer Appliance Saturation Study
U-20373 | October 28, 2019 Direct Testimony of Christopher Neme on behalf of Natural Resources Defense Council
Exhibit: NRD-3; Source: DTE Electric's Response to NRDCDE-1.5-01 2016 DTE Appliance Saturation Survey - Question 12 & 13 Page 2 of 3

HEATING AND COOLING...Q13. What type of heating system is principally used to heat this residence?
Region Income Persons in Household Year Residence was Built
Total North- North- $20K- $60K- 1960- 1980- 2000- Sample Detroit West west east < $20K $59K $99K $100K+ 1-2 3-4 5+ < 1960 1979 1999 present A B C D E F G H I J K L M N O P
SAMPLE SIZE 6266 1019 2320 1672 1229 732 2144 1482 1382 4174 1582 418 1986 1603 1210 783 100.0% 100.0% 100.0% 100.0% 100.0% 100.0% 100.0% 100.0% 100.0% 100.0% 100.0% 100.0% 100.0% 100.0% 100.0% 100.0%
DON'T KNOW/NO ANSWER 215 61 66 49 38 84 59 21 12 141 37 17 48 41 25 22 3.5% 6.4% 2.7% 3.0% 2.9% 11.7% 2.5% 1.2% 0.9% 3.4% 2.3% 5.0% 2.5% 2.4% 2.3% 3.0%
TOTAL ANSWER 6051 958 2254 1623 1191 648 2085 1461 1370 4033 1545 401 1938 1562 1185 761
100.0% 100.0% 100.0% 100.0% 100.0% 100.0% 100.0% 100.0% 100.0% 100.0% 100.0% 100.0% 100.0% 100.0% 100.0% 100.0%
ÍÍÍÍÍÍÍÍÍÍÍÍÍÍÍÍÍÍÍÍÍÍÍÍÍÍÍÍÍÍÍÍÍÍÍÍÍÍÍÍÍÍÍÍÍÍÍÍÍÍÍÍÍÍÍÍÍÍÍÍÍÍÍÍÍÍÍÍÍÍÍÍÍÍÍÍÍÍÍÍÍÍÍÍÍÍÍÍÍÍÍÍÍÍÍÍÍÍÍÍÍÍÍÍÍÍÍÍÍÍÍÍÍÍÍÍÍÍÍÍÍÍÍÍÍÍÍÍÍÍÍÍÍÍÍÍÍÍÍÍÍÍÍÍÍÍÍÍÍÍÍÍÍÍÍÍÍÍÍÍÍÍÍÍÍÍÍÍÍÍ
Forced air (warm air 5101 734 1940 1416 991 464 1698 1277 1238 3388 1311 344 1636 1338 1058 695 with blower) 81.6% 72.6% 83.1% 84.9% 81.7% 68.3% 78.8% 84.8% 89.5% 81.1% 82.5% 84.2% 83.5% 84.7% 86.4% 89.4%
Gravity warm air 40 18 8 10 4 14 14 6 3 28 12 - 23 1 3 1 0.8% 2.3% 0.4% 0.6% 0.4% 2.7% 0.7% 0.6% 0.0% 0.8% 1.0% 0.0% 1.2% / 0.2% 0.3%
Steam or hot water 255 62 89 43 60 35 95 55 44 185 52 14 137 64 26 5 4.2% 7.3% 3.8% 2.6% 4.6% 5.6% 4.5% 3.4% 3.2% 4.6% 3.3% 3.1% 7.0% 3.8% 2.1% 0.6%
Baseboard, ceiling or 313 49 103 93 66 57 147 53 35 231 69 10 76 93 34 11 radiant 6.5% 6.7% 6.0% 6.9% 6.7% 10.3% 8.7% 4.6% 2.8% 7.3% 4.8% 3.9% 4.2% 6.8% 4.2% 2.0%
Individual room heaters 52 20 14 5 11 17 24 7 3 34 15 1 19 10 5 5 1.0% 2.2% 0.9% 0.3% 1.2% 2.8% 1.3% 0.6% 0.3% 1.0% 1.1% 0.2% 0.9% 0.6% 0.8% 1.1%
Heat pump (with gas, oil, 170 51 60 32 27 42 68 35 22 97 52 20 30 36 29 19 or L.P. furnace) 3.5% 5.7% 3.5% 2.7% 2.6% 7.3% 3.8% 3.3% 1.8% 3.0% 4.7% 5.6% 2.0% 2.7% 3.0% 3.1%
Heat pump (all electric) 81 21 25 22 13 17 31 16 9 50 21 6 12 14 12 17 1.7% 2.7% 1.6% 1.8% 1.3% 2.5% 1.8% 1.9% 1.0% 1.7% 1.7% 1.4% 0.8% 1.0% 1.5% 2.8%
Heat pump (ground water 39 3 15 2 19 2 8 12 16 20 13 6 5 6 18 8 source) 0.7% 0.5% 0.7% 0.2% 1.5% 0.5% 0.4% 0.8% 1.4% 0.5% 0.9% 1.6% 0.4% 0.4% 1.8% 0.7%
NOTE: Data is weighted by kilowatt hour usage and age. NOTE: / represents percent less than .05 - 15 -
Source: 2016 Residential Customer Appliance Saturation Study
U-20373 | October 28, 2019 Direct Testimony of Christopher Neme on behalf of Natural Resources Defense Council
Exhibit: NRD-3; Source: DTE Electric's Response to NRDCDE-1.5-01 2016 DTE Appliance Saturation Survey - Question 12 & 13 Page 3 of 3

Release date: May 2018
Number of housing units (million)
Total Mid‐west2 Total
Space heating3
Water heating
Air condi‐tioning
Refrig‐erators Other4 Total
Space heating3
Water heating
Air condi‐tioning
Refrig‐erators Other4
All homes 26.4 2,486 1,378 419 97 68 524 94.3 52.7 15.9 4.0 2.6 19.9
Census division East North Central 18.1 1,755 999 294 62 46 354 97.0 55.4 16.3 3.7 2.6 19.6 West North Central 8.3 731 379 125 35 22 169 88.3 46.8 15.1 4.6 2.7 20.4
Census urban/rural classification5 Urban 20.7 1,946 1,102 328 73 51 392 93.8 53.2 15.8 3.8 2.5 18.9 Urbanized area 17.2 1,631 938 270 60 42 321 94.9 54.7 15.7 3.8 2.4 18.7 Urban cluster 3.5 314 163 57 13 10 71 88.5 46.3 16.1 4.1 2.7 19.9
Rural 5.6 540 277 91 24 17 132 96.1 50.9 16.3 4.5 3.0 23.4
Metropolitan or micropolitan statistical area In metropolitan statistical area 21.3 2,034 1,144 341 76 54 418 95.6 54.0 16.0 3.9 2.5 19.7 In micropolitan statistical area 3.3 297 154 53 12 9 69 88.8 47.6 15.9 3.7 2.8 20.7 Not in metropolitan or micropolitan statistical area 1.8 155 80 25 9 5 36 88.2 46.7 14.3 5.5 2.8 20.4
Climate region6 Very cold/Cold 21.2 2,019 1,152 341 61 53 411 95.2 54.7 16.1 3.2 2.5 19.4 Mixed‐humid 5.2 467 226 78 36 15 112 90.4 44.7 15.1 7.2 2.9 21.7 Mixed‐dry/Hot‐dry N N N N N N N N N N N N N Hot‐humid N N N N N N N N N N N N N Marine N N N N N N N N N N N N N
Table CE3.3 Annual household site end‐use consumption in the Midwest—totals and averages, 2015
Total site energy consumption1
(trillion Btu)Average site energy consumption1
(million Btu per household using the end use)
U.S. Energy Information Administration2015 Residential Energy Consumption Survey: Energy Consumption and Expenditures Tables
U-20373 | October 28, 2019 Direct Testimony of Christopher Neme on behalf of Natural Resources Defense Council
Exhibit: NRD-4; Source: 2015 Residential Energy Consumption Survey Page 1 of 5

Number of housing units (million)
Total Mid‐west2 Total
Space heating3
Water heating
Air condi‐tioning
Refrig‐erators Other4 Total
Space heating3
Water heating
Air condi‐tioning
Refrig‐erators Other4
All homes 26.4 2,486 1,378 419 97 68 524 94.3 52.7 15.9 4.0 2.6 19.9
Table CE3.3 Annual household site end‐use consumption in the Midwest—totals and averages, 2015
Total site energy consumption1
(trillion Btu)Average site energy consumption1
(million Btu per household using the end use)
Housing unit type Single‐family detached 18.2 2,048 1,170 318 84 53 423 112.8 64.8 17.5 4.9 2.9 23.3 Single‐family attached 1.3 110 62 16 3 3 25 85.8 48.4 12.9 2.7 2.6 19.6 Apartments in buildings with 2–4 units 2.0 110 54 26 3 4 23 55.9 27.6 13.2 2.0 1.9 11.6 Apartments in buildings with 5 or more units 4.0 147 54 45 4 7 38 36.8 13.6 11.2 1.1 1.7 9.4 Mobile homes 1.0 72 38 14 3 2 15 73.4 43.7 14.5 2.9 2.0 15.1
Ownership of housing unit Owned 17.8 1,944 1,101 298 80 52 412 109.5 62.6 16.8 4.7 2.9 23.2 Single‐family 16.4 1,852 1,053 281 77 49 393 112.7 64.5 17.1 4.9 3.0 23.9 Apartments 0.6 35 16 8 1 1 9 61.7 27.7 14.0 2.0 2.3 15.8 Mobile homes 0.8 56 32 9 2 2 11 74.5 46.2 12.4 2.6 2.1 14.5
Rented7 8.6 542 277 121 17 16 111 62.9 32.4 14.0 2.3 1.9 12.9 Single‐family 3.0 305 179 53 10 7 56 101.5 59.5 17.7 4.0 2.3 18.6 Apartments 5.4 221 92 63 6 9 51 41.1 17.2 11.6 1.3 1.7 9.5 Mobile homes Q Q Q Q Q Q Q Q Q Q Q Q Q
U.S. Energy Information Administration2015 Residential Energy Consumption Survey: Energy Consumption and Expenditures Tables
U-20373 | October 28, 2019 Direct Testimony of Christopher Neme on behalf of Natural Resources Defense Council
Exhibit: NRD-4; Source: 2015 Residential Energy Consumption Survey Page 2 of 5

Number of housing units (million)
Total Mid‐west2 Total
Space heating3
Water heating
Air condi‐tioning
Refrig‐erators Other4 Total
Space heating3
Water heating
Air condi‐tioning
Refrig‐erators Other4
All homes 26.4 2,486 1,378 419 97 68 524 94.3 52.7 15.9 4.0 2.6 19.9
Table CE3.3 Annual household site end‐use consumption in the Midwest—totals and averages, 2015
Total site energy consumption1
(trillion Btu)Average site energy consumption1
(million Btu per household using the end use)
Year of construction Before 1950 6.2 653 390 101 26 14 122 104.9 63.2 16.3 4.8 2.3 19.6 1950 to 1959 3.3 326 192 54 13 8 59 99.7 58.7 16.5 4.6 2.5 17.9 1960 to 1969 3.0 257 145 44 11 7 51 86.2 49.5 14.7 4.0 2.3 16.9 1970 to 1979 4.0 353 197 60 13 10 74 89.2 50.4 15.1 3.5 2.4 18.6 1980 to 1989 2.7 229 120 39 10 7 53 85.1 45.5 14.4 3.9 2.6 19.7 1990 to 1999 3.5 332 170 60 12 11 80 95.2 49.3 17.1 3.5 3.1 23.0 2000 to 2009 3.1 287 141 53 11 10 72 91.8 45.3 16.8 3.5 3.2 23.2 2010 to 2015 0.6 48 23 9 1 2 14 77.1 36.3 14.2 2.3 2.8 21.5
Total square footage8 Fewer than 1,000 5.1 239 110 60 7 9 54 46.5 21.5 11.7 1.5 1.7 10.5 1,000 to 1,499 4.0 273 140 54 10 9 60 67.4 35.2 13.4 2.6 2.1 14.8 1,500 to 1,999 3.4 338 188 58 12 9 71 98.4 54.6 16.8 3.8 2.8 20.5 2,000 to 2,499 3.7 397 230 62 15 10 80 107.6 62.3 16.7 4.3 2.8 21.7 2,500 to 2,999 3.1 340 195 51 15 9 70 109.2 63.7 16.4 4.9 2.9 22.4 3,000 or greater 6.9 899 516 134 38 22 189 129.5 75.0 19.3 5.8 3.2 27.2
Number of household members 1 member 6.9 485 314 56 17 14 84 70.8 46.0 8.1 2.8 2.1 12.3 2 members 9.7 912 517 135 38 26 196 93.9 53.7 13.9 4.2 2.7 20.2 3 members 3.9 415 221 77 15 11 91 105.3 56.4 19.5 4.1 2.7 23.1 4 members 3.4 382 192 82 15 10 84 111.9 56.2 24.0 4.6 2.9 24.6 5 members 1.5 174 82 39 8 5 41 116.2 57.7 25.9 5.8 3.1 27.4 6 or more members 1.0 118 54 30 4 2 28 123.8 56.6 31.7 4.4 2.5 28.9
U.S. Energy Information Administration2015 Residential Energy Consumption Survey: Energy Consumption and Expenditures Tables
U-20373 | October 28, 2019 Direct Testimony of Christopher Neme on behalf of Natural Resources Defense Council
Exhibit: NRD-4; Source: 2015 Residential Energy Consumption Survey Page 3 of 5

Number of housing units (million)
Total Mid‐west2 Total
Space heating3
Water heating
Air condi‐tioning
Refrig‐erators Other4 Total
Space heating3
Water heating
Air condi‐tioning
Refrig‐erators Other4
All homes 26.4 2,486 1,378 419 97 68 524 94.3 52.7 15.9 4.0 2.6 19.9
Table CE3.3 Annual household site end‐use consumption in the Midwest—totals and averages, 2015
Total site energy consumption1
(trillion Btu)Average site energy consumption1
(million Btu per household using the end use)
2015 annual household income Less than $20,000 4.6 307 166 59 9 9 64 67.2 37.2 12.9 2.5 2.0 13.9 $20,000 to $39,999 6.6 558 325 91 21 16 106 84.7 49.5 13.8 3.5 2.4 16.1 $40,000 to $59,999 4.2 374 209 63 15 10 77 88.7 50.5 14.8 3.8 2.4 18.2 $60,000 to $79,999 3.9 390 212 66 16 10 86 99.3 54.4 16.8 4.2 2.6 22.0 $80,000 to $99,999 2.3 247 136 42 10 7 52 105.4 58.2 17.8 4.5 2.9 22.2 $100,000 to $119,999 1.6 182 95 32 7 5 43 113.9 59.9 19.8 4.7 3.1 26.9 $120,000 to $139,999 1.2 156 84 25 7 4 35 124.8 67.2 20.3 5.9 3.5 28.1 $140,000 or more 1.9 273 151 42 11 7 61 143.8 79.7 22.1 6.1 3.8 32.1
Payment method for energy bills All paid by household 24.0 2,364 1,319 387 94 64 500 98.6 55.5 16.2 4.2 2.7 20.8 Some paid by household, some included in rent or condo fee 1.5 70 34 18 2 2 13 47.2 23.5 12.3 1.4 1.6 8.9 All included in rent or condo fee 0.7 40 19 11 1 1 8 55.1 25.4 15.7 1.2 1.8 11.2 Some other method Q Q Q Q Q Q Q Q Q Q Q Q Q
Main heating fuel Natural gas 18.7 2,020 1,180 326 75 49 389 108.0 63.1 17.5 4.3 2.6 20.8 Electricity 5.4 261 105 54 11 12 78 48.1 19.4 10.0 2.3 2.2 14.4 Fuel oil/kerosene Q Q Q Q Q Q Q Q Q Q Q Q Q Propane 1.5 157 80 25 8 5 39 102.6 52.2 16.3 5.3 3.3 25.7
U.S. Energy Information Administration2015 Residential Energy Consumption Survey: Energy Consumption and Expenditures Tables
U-20373 | October 28, 2019 Direct Testimony of Christopher Neme on behalf of Natural Resources Defense Council
Exhibit: NRD-4; Source: 2015 Residential Energy Consumption Survey Page 4 of 5

Number of housing units (million)
Total Mid‐west2 Total
Space heating3
Water heating
Air condi‐tioning
Refrig‐erators Other4 Total
Space heating3
Water heating
Air condi‐tioning
Refrig‐erators Other4
All homes 26.4 2,486 1,378 419 97 68 524 94.3 52.7 15.9 4.0 2.6 19.9
Table CE3.3 Annual household site end‐use consumption in the Midwest—totals and averages, 2015
Total site energy consumption1
(trillion Btu)Average site energy consumption1
(million Btu per household using the end use)
1Consumption and expenditures for biomass (wood), coal, district steam, and solar thermal are excluded. Electricity consumption from on‐site solar photovoltaic generation (i.e., solar panels) is included. 2Total Midwest includes all primary occupied housing units in the Midwest Census Region. Vacant housing units, seasonal units, second homes, military houses, and group quarters are excluded. 3Includes main (primary) and secondary space heating. 4Includes end uses not shown in this table. A more detailed breakout of end uses is shown in the Series 5 tables. 5Housing units are classified using criteria created by the U.S. Census Bureau based on 2010 Census data. Urbanized areas are densely settled groupings of blocks or tracts with 50,000 or more people. Urban clusters have at least 2,500 but less than 50,000 people. All other areas are rural. 6These climate regions were created by the Building America program, sponsored by the U.S. Department of Energy’s Office of Energy Efficiency and Renewable Energy (EERE). 7Rented includes households that occupy their primary housing units without paying rent. 8Total square footage includes all basements, finished or conditioned (heated or cooled) areas of attics, and conditioned garage space that is attached to the home. Unconditioned and unfinished areas in attics and attached garages are excluded. The square footage for some housing units was calculated based on measurements taken by the interviewer. For households responding without the presence of an interviewer, square footage was imputed based on characteristics of the housing unit. See 2015 RECS Square Footage Methodology for full details about data collection and processing. Q = Data withheld because either the Relative Standard Error (RSE) was greater than 50% or fewer than 10 cases responded. N = No cases responded. Notes: Because of rounding, data may not sum to totals. See RECS Terminology for definition of terms used in these tables. Source: U.S. Energy Information Administration, Office of Energy Consumption and Efficiency Statistics, Forms EIA‐457A, C, D, E, F, G of the 2015 Residential Energy Consumption Survey.
U.S. Energy Information Administration2015 Residential Energy Consumption Survey: Energy Consumption and Expenditures Tables
U-20373 | October 28, 2019 Direct Testimony of Christopher Neme on behalf of Natural Resources Defense Council
Exhibit: NRD-4; Source: 2015 Residential Energy Consumption Survey Page 5 of 5

MPSC Case No.: Requestor:
Question No.: Respondent:
Page:
U-20373NRDC NRDCDE-1.25di J. C. LeBrun1 of 1
Question: Regarding the Company’s Multi-Family, Home Energy Consultation, Audit and Weatherization, Low Income Energy Efficiency Assistance and Low Income Multi- Family programs:
d. For the 2020 and 2021 versions of these programs:
i. Is DTE target marketing electrically heated customers? If not, whynot?
Answer: The Multifamily program has and will continue to market to electrically heated customers. As evidenced by the extremely low number of electric heated units served, referenced in response NRDCDE-1.25ci, this is a limited market. Most Multifamily customers have natural gas heating in the DTE Service Territory.
The Multifamily Low Income program has and will continue to market to electrically heated customers. As evidenced by the extremely low number of electric heated units served, referenced in response NRDCDE-1.25ci, this is a limited market. Most Multifamily Low Income customers have natural gas heating in the DTE Service Territory.
The Home Energy Consultation program does market to electrically heated customers but does not offer HVAC retrofits.
The Audit and Weatherization Program plans to market to electrically heated customers in 2020 and 2021.
The Energy Efficiency Assistance program plans to market to electrically heated customers in 2020 and 2021.
Attachments: N/A
U-20373 | October 28, 2019 Direct Testimony of Christopher Neme on behalf of Natural Resources Defense Council
Exhibit: NRD-5; Source: DTE Electric's Response to NRDCDE-1.25di-diii Page 1 of 4

MPSC Case No.: Requestor:
Question No.: Respondent:
Page:
U-20373NRDC NRDCDE-1.25dii J. C. LeBrun1 of 1
Question: Regarding the Company’s Multi-Family, Home Energy Consultation, Audit and Weatherization, Low Income Energy Efficiency Assistance and Low Income Multi- Family programs:
d. For the 2020 and 2021 versions of these programs:
ii. What heat pump technology options will be offered? Please specifyif both ducted and ductless mini-splits and both traditional and coldclimate models were offered.
Answer: The Multifamily program will continue to offer a packaged terminal heat pump rebate in the prescriptive measures and a ductless mini split system through the custom offering.
The Multifamily Low Income program will continue to offer a packaged terminal heat pump and a ductless mini split system.
The Home Energy Consultation program does not offer HVAC retrofits.
The Audit and Weatherization Program plans to offer financial incentives for ground source air source, ducted, ductless, and both traditional and cold climate heat pump models.
For the Energy Efficiency Assistance program, ducted and ductless mini-splits for both traditional and cold climate models will be part of the program for 2020 and 2021.
Attachments: N/A
U-20373 | October 28, 2019 Direct Testimony of Christopher Neme on behalf of Natural Resources Defense Council
Exhibit: NRD-5; Source: DTE Electric's Response to NRDCDE-1.25di-diii Page 2 of 4

MPSC Case No.: Requestor:
Question No.: Respondent:
Page:
U-20373NRDC NRDCDE-1.25diii J. C. LeBrun1 of 2
Question: Regarding the Company’s Multi-Family, Home Energy Consultation, Audit and Weatherization, Low Income Energy Efficiency Assistance and Low Income Multi- Family programs:
d. For the 2020 and 2021 versions of these programs:
iii. Please provide in both absolute dollars and as a percent of the fullcost of a new heat pump installation the magnitude of the financialincentive that will be offered.
Answer: For the Multifamily program, a package terminal heat pump the incentive is 4% to 6% of cost ($50 rebate).
For the Multifamily Low Income program, a package terminal heat pump, the incentive is 80% to 100% of cost ($850 rebate).
The Home Energy Consultation program will not offer any HVAC incentives.
For Audit and Weatherization:
Equipment Type
Equipment Cost
Incentive Amount
Incentive Percentage
16+ SEER ASHP
~$5,700 $300 ~5%
17+ EER GSHP
~$7,800 $300 ~3%
18+ SEER Ductless Mini-Split
~$3,000 $300 ~10%
Heat Pump Water Heater UEF =>2.0
~$2,000-$3,000
$100-$250 ~5-8%
U-20373 | October 28, 2019 Direct Testimony of Christopher Neme on behalf of Natural Resources Defense Council
Exhibit: NRD-5; Source: DTE Electric's Response to NRDCDE-1.25di-diii Page 3 of 4

MPSC Case No.:
Requestor: Question No.: Respondent:
Page:
U-20373 NRDC NRDCDE-1.25diii J. C. LeBrun 2 of 2
For Energy Efficiency Assistance Program: Equipment Type
Equipment Cost
Incentive Amount
Incentive Percentage
16+ SEER ASHP
~$5,700 $2,000 ~35%
17+ EER GSHP
~$7,800 $2,000 ~25%
18+ SEER Ductless Mini-Split
~$3,000 $2,400-$3,000 ~80-100%
Heat Pump Water Heater UEF =>2.0
~$2,000-$3,000
$2,000 ~66-100%
Attachments: N/A
U-20373 | October 28, 2019 Direct Testimony of Christopher Neme on behalf of Natural Resources Defense Council
Exhibit: NRD-5; Source: DTE Electric's Response to NRDCDE-1.25di-diii Page 4 of 4

MPSC Case No.: Requestor:
Question No.: Respondent:
Page:
U-20373NRDC NRDCDE-1.1ai J. R. Kupser 1 of 1
Question: Regarding DTE’s cost-effectiveness analysis of its proposed 2020-2023 efficiency programs, as summarized in Exhibit A-7 to Mr. Kupser’s testimony:
a. Please provide an Excel file organized by year and with formulae intactwith all of DTE’s avoided cost assumptions used to estimate the benefitsof efficiency. Please provide them for as far into the future as they havebeen forecast. Such assumptions should include, but not necessarily belimited to:
i. Avoided energy costs;
Answer: Please refer to attachment, “U-20373 NRDCDE-1.1ai-01 DSMore 2018 Batch Tool - 2020-2021 EWR Plan”.
Attachments: U-20373 NRDCDE-1.1ai-01 DSMore 2018 Batch Tool - 2020-2021 EWR Plan
U-20373 | October 28, 2019Direct Testimony of Christopher Neme on behalf of Natural Resources Defense Council
Exhibit: NRD-6; Source: DTE Electric's Response to NRDCDE-1.1ai with Att. 1.1ai-01 DSMore Batch Tool - 2020-2021 EWR Plan, Res Utility Input and C&I Utility Input tabs
Page 1 of 9

Losses and T&D Adjustment Avoided Costs - Price Scenarios & Avoided Electric Capacity100.0% Electric Peak T&D Adjustment Factor (%) Market-Based Scenarios6.80% Electric Losses (%) DTE_2017 Electric Price Folder (Market Index / Hub)3.76% Gas Losses (%) 1 Today's Avoided Electric Costs Scenario
2 Alternate Avoided Electric Costs ScenarioElectric Rates All Years 2003-2012 Gas Price Folder
$8.43 Flat Charge ($) 1 Today's Avoided Gas Costs Scenario$0.00 Fuel Adjustment Rider ($ / kWh) 2 Alternate Avoided Gas Costs Scenario
$0.000000 DSM Rider, Other Riders ($ / kWh) Cost-Based Scenario & Avoided Capacity4.00% Tax (% of Bill) 1 Cost-Based Avoided Electric Costs Scenario
1 Include Taxes in Lost Revenues? (1=Yes, 0=No) 100.0% Coincident Peak kW Savings Adjustment (%)6 First Month of Summer (1-12) 1 (Summer) 2 (Winter) 1 Include avoided capacity in market-based results? (1, 0)8 Last Month of Summer (1-12) $51.49 $0.00 Avoided Capacity ($ / kW Annualized)
Energy Blocks ( $ / kWh ) 7 0 Coincident Month (1-12, 0)kWh / kW Steps Cumulative 17 0 Coincident Hour (1-24, 0)
First 0 0
Second 0 0 Avoided Costs - Electric T&D, Electric Adders, & GasThird More Electric
kWh / kW - 1 Winter Summer kWh Steps Cumulative $0.00 Avoided Electric T&D ($ / kW)First 0.000000 0.000000 0 0 Coincident Savings to Use for Avoided T&D (Coincident, Non-Coincident)
Second 0.000000 0.000000 0 0 Summer Season to Use for Avoided T&D (Summer, Winter)Third 0.000000 0.000000 0 0 Peak Off-Peak Electric Adders Below Apply To Market-Based Only
Fourth 0.000000 0.000000 47.6% 52.4% Peak vs. Off-Peak Hours (%)kWh / kW - 2 Winter Summer kWh Steps Cumulative 15.00% 15.00% Ask Adder above Wholesale + Basis Charge Adder (%)
First 0.000000 0.000000 0 0 15.00% 15.00% Supply, Load Following, and Risk Management Fee Adder (%)Second 0.000000 0.000000 0 0 0.00% 0.00% Credits & Uncollectibles Adder (%)
Third 0.000000 0.000000 0 0 10.00% 10.00% Avoided Operating Retail Costs Adder (%)Fourth 0.000000 0.000000 5.35% 5.35% Supplemental Reserve Margin Adder (%)
kWh / kW - 3 Winter Summer kWh Steps Cumulative GasFirst 0.144041 0.144041 0 0 $0.00 Distribution ($ / CCF)
Second 0.144041 0.144041 0 0 $0.00 Transmission Capacity ($ / CCF)Third 0.144041 0.144041 0 0 1 Include Gas Commodity in Avoided Costs? (1=Yes, 0=No)
Fourth 0.144041 0.144041 Short-Term Firm (STF) ($ / CCF) Peaking ($ / CCF)Demand Charges ( $ / kW ) Reserve Charge Days / Month Reserve Charge Premium Days / Month
Winter Summer kW Steps Jan $0.0000 31 $0.0000 $0.0000 15First $0.000000 $0.000000 0 Feb $0.0000 28 $0.0000 $0.0000 0
Second $0.000000 $0.000000 Mar $0.0000 31 $0.0000 $0.0000 0Demand Ratchet Electric Fuel Costs Apr $0.0000 30 $0.0000 $0.0000 0
0 Use Ratchet? (1=Yes, 0=No) Fuel costs ($ / kWh) used for Net May $0.0000 31 $0.0000 $0.0000 00% Ratchet (%) Fuel Lost Revenue calculations. Jun $0.0000 30 $0.0000 $0.0000 0
Jan $0.00 Jan Jul $0.0000 31 $0.0000 $0.0000 0 Feb $0.00 Feb Aug $0.0000 31 $0.0000 $0.0000 0 Mar $0.00 Mar Sep $0.0000 30 $0.0000 $0.0000 0 Apr $0.00 Apr Oct $0.0000 31 $0.0000 $0.0000 0 May $0.00 May Nov $0.0000 30 $0.0000 $0.0000 0 Jun $0.00 Jun Dec $0.0000 31 $0.0000 $0.0000 0 Jul $0.00 Jul Aug $0.00 Aug Avoided Costs - Avoided Ancillary Charges Sep $0.00 Sep $0.00045076 OATT - All Months ($ / kW) $0.00000000 ISO - All Months ($ / kWh) Oct $0.00 Oct $0.00045076 OATT - Peak Months ($ / kW) $0.00000000 ISO - Peak Months ($ / kWh) Nov $0.00 Nov $0.00045076 OATT - Off-Peak Months ($ / kW) $0.00000000 ISO - Off-Peak Months ($ / kWh) Dec $0.00 Dec Peak Months for Ancillary Charges
1 JanGas Rates 1 Feb
$11.76 Flat Charge ($) 1 Mar$0.3308 Base CCF Charge ($ / CCF) 1 Apr0.00% Gas Delivery Adder (%) 1 May
$0.0199 DSM Rider, Other Riders ($ / CCF) 1 Jun4.00% Tax (% of Bill) 1 Jul
Actual Gas Cost Recovery ($ / CCF) 1 Aug2 1=Use for Bills/Avoided Costs, 2=Use for Bills Only, 0=Use Price Files 1 Sep
$0.3450 Jan 1 Oct$0.3450 Feb 1 Nov$0.3240 Mar 1 Dec$0.3170 Apr$0.3170 May Other Benefits$0.3170 Jun Environmental (Societal Test)$0.3170 Jul $ / kWh $ / CCF Include in TRC? (1=Yes, 0=No)$0.3170 Aug $0.0000 $0.0000 SO2 0$0.3170 Sep $0.0000 $0.0000 NOx 0$0.3170 Oct $0.0000 $0.0000 CO2 0$0.3170 Nov $0.0000 $0.0000 CO 0$0.3170 Dec $0.0000 $0.0000 CH4 0
$0.0000 $0.0000 PM 0$0.0000 $0.0000 Total
Miscellaneous$0.0000 Reduced Ratepayer Arrearage ($ / Unit) (Applied to All Tests Except Participant Test)$0.0000 Other Societal Benefits ($ / Unit) 0 Include in TRC? (1=Yes, 0=No)
U-20373 | October 28, 2019Direct Testimony of Christopher Neme on behalf of Natural Resources Defense Council
Exhibit: NRD-6; Source: DTE Electric's Response to NRDCDE-1.1ai with Att. 1.1ai-01 DSMore Batch Tool - 2020-2021 EWR Plan, Res Utility Input and C&I Utility Input tabs
Page 2 of 9

Discount Rate Matrix (By Test and Cost/Benefit)Utility (PAC) TRC RIM Societal Participant
0.00% 0.00% 0.00% 2.51% Avoided/Increased Supply Costs - Electric0.00% 0.00% 0.00% 2.51% Avoided/Increased Supply Costs - Gas0.00% 0.00% 0.00% 2.51% Program Administrator Costs0.00% 0.00% 16.28% Incentives
0.00% Revenue Losses/Gains - Electric0.00% Revenue Losses/Gains - Gas
0.00% 2.51% 16.28% Participant or Unit Costs0.00% 16.28% Participant or Unit Tax Credits
16.28% Participant or Unit Bill Reductions/Increases - Electric16.28% Participant or Unit Bill Reductions/Increases - Gas
0.00% 0.00% 0.00% 2.51% Reduced Arrearage0.00% 2.51% External Benefits
Revised TRC Test1 Treat free rider incentives as administration costs? (1 = Yes)
Levelized Discount Rate2.51% Used to Discount Energy and Demand in Cost of Conserved Results (%)
Negative Electric Loads0 Allow electric loads to go negative for net-metering purposes? (1 = Yes)
Electric Discoun 6.63%Gas Discount R 7.40%
U-20373 | October 28, 2019Direct Testimony of Christopher Neme on behalf of Natural Resources Defense Council
Exhibit: NRD-6; Source: DTE Electric's Response to NRDCDE-1.1ai with Att. 1.1ai-01 DSMore Batch Tool - 2020-2021 EWR Plan, Res Utility Input and C&I Utility Input tabs
Page 3 of 9

Escalators2020 2021 2022 2023 2024 2025 2026 2027 2028 2029 2030 2031 2032 2033
Electric Bills & Lost Revenues 1.000 1.033 1.101 1.174 1.229 1.271 1.322 1.365 1.393 1.439 1.479 1.452 1.488 1.524Gas Bills & Lost Revenues 1.000 1.066 1.103 1.156 1.223 1.281 1.339 1.398 1.458 1.517 1.577 1.638 1.699 1.760
Avoided Electric Generation 1.000 1.067 1.219 1.158 1.191 1.317 1.323 1.290 1.286 1.273 1.306 1.324 1.355 1.372Avoided Electric T&D 1.000 1.023 1.047 1.073 1.098 1.123 1.148 1.174 1.201 1.228 1.255 1.284 1.313 1.342
Avoided Electric Ancillary Market 1.000 0.936 1.132 0.932 0.895 0.860 0.826 0.792 0.760 0.729 0.697 0.666 0.637 0.608Avoided Electric Capacity 1.000 1.010 1.034 1.108 0.671 0.034 0.140 0.307 0.350 0.422 0.572 0.750 0.842 0.888
Avoided Gas Supply / Commodity 0.949 0.983 0.969 0.983 1.020 1.044 1.067 1.090 1.115 1.140 1.166 1.192 1.219 1.247Avoided Gas Capacity 1.000 1.023 1.047 1.073 1.098 1.123 1.148 1.174 1.201 1.228 1.255 1.284 1.313 1.342
Electric Fuel (for Net Fuel) 1.000 1.025 1.050 1.120 1.147 1.195 1.196 1.229 1.238 1.234 1.099 1.087 1.092 1.155Environmental 1.000 1.000 1.000 1.000 1.000 1.000 1.000 1.000 1.000 1.000 1.000 1.000 1.000 1.000
Avoided Market Costs & Scenario ProbabilitiesLog-Logistic Distribution Parameters for Option Values Log-Logistic Parameter Helper
Electric Gas Logistic Drivers InputsDSMore DSMore DSMore 18.8520 1.2289 Gamma = approximate minimum Electric GasReturned Returned Returned 16.7515 0.8506 Beta = shift parameter 18.8520 1.2289 Expected Minimum
Scenario $ / MWh $ / kWh $ / MCF Electric Gas 2.3194 2.3194 Alpha = squeeze parameter 78.4711 4.2562 Expected Maximum1 Outputs2 Electric Gas3 This distribution creates the 18.8520 1.2289 Gamma4 probabilities used in calculating 16.7515 0.8506 Beta5 the option values in DSMore. 2.3194 2.3194 Alpha6 See (E95:F115)
789 Cumulative
10 Probabilities
1112131415161718192021
Probability of EachScenario Occurring
U-20373 | October 28, 2019Direct Testimony of Christopher Neme on behalf of Natural Resources Defense Council
Exhibit: NRD-6; Source: DTE Electric's Response to NRDCDE-1.1ai with Att. 1.1ai-01 DSMore Batch Tool - 2020-2021 EWR Plan, Res Utility Input and C&I Utility Input tabs
Page 4 of 9

Growth Factor2034 2035 2036 2037 2038 2039 2040 2041 2042 2043 2044 2045+
1.550 1.587 1.619 1.652 1.686 1.721 1.756 1.792 1.829 1.866 1.905 1.0001.822 1.884 1.947 2.010 2.073 2.137 2.202 2.267 2.332 2.398 2.465 1.0001.396 1.421 1.435 1.464 1.494 1.525 1.556 1.588 1.620 1.654 1.687 1.0001.372 1.403 1.435 1.467 1.501 1.534 1.569 1.604 1.641 1.678 1.715 1.0000.582 0.555 0.529 0.505 0.482 0.461 0.440 0.421 0.404 0.386 0.370 1.0000.981 1.068 1.142 1.183 1.224 1.278 1.359 0.821 0.838 0.855 0.873 1.0001.275 1.304 1.333 1.363 1.394 1.425 1.457 1.490 1.524 1.558 1.593 1.0001.372 1.403 1.435 1.467 1.501 1.534 1.569 1.604 1.641 1.678 1.715 1.0001.165 1.223 1.226 1.286 1.280 1.337 1.541 1.572 1.605 1.638 1.671 1.0001.000 1.000 1.000 1.000 1.000 1.000 1.000 1.000 1.000 1.000 1.000 1.000
U-20373 | October 28, 2019Direct Testimony of Christopher Neme on behalf of Natural Resources Defense Council
Exhibit: NRD-6; Source: DTE Electric's Response to NRDCDE-1.1ai with Att. 1.1ai-01 DSMore Batch Tool - 2020-2021 EWR Plan, Res Utility Input and C&I Utility Input tabs
Page 5 of 9

Losses and T&D Adjustment Avoided Costs - Price Scenarios & Avoided Electric Capacity100.0% Electric Peak T&D Adjustment Factor (%) Market-Based Scenarios6.80% Electric Losses (%) DTE_2017 Electric Price Folder (Market Index / Hub)3.76% Gas Losses (%) 1 Today's Avoided Electric Costs Scenario
2 Alternate Avoided Electric Costs ScenarioElectric Rates All Years 2003-2012 Gas Price Folder
$203.58 Flat Charge ($) 1 Today's Avoided Gas Costs Scenario$0.00 Fuel Adjustment Rider ($ / kWh) 2 Alternate Avoided Gas Costs Scenario
$0.000000 DSM Rider, Other Riders ($ / kWh) Cost-Based Scenario & Avoided Capacity6.00% Tax (% of Bill) 1 Cost-Based Avoided Electric Costs Scenario
1 Include Taxes in Lost Revenues? (1=Yes, 0=No) 100.0% Coincident Peak kW Savings Adjustment (%)6 First Month of Summer (1-12) 1 (Summer) 2 (Winter) 1 Include avoided capacity in market-based results? (1, 0)8 Last Month of Summer (1-12) $51.49 $0.00 Avoided Capacity ($ / kW Annualized)
Energy Blocks ( $ / kWh ) 7 0 Coincident Month (1-12, 0)kWh / kW Steps Cumulative 17 0 Coincident Hour (1-24, 0)
First 0 0
Second 0 0 Avoided Costs - Electric T&D, Electric Adders, & GasThird More Electric
kWh / kW - 1 Winter Summer kWh Steps Cumulative $0.00 Avoided Electric T&D ($ / kW)First 0.000000 0.000000 0 0 Coincident Savings to Use for Avoided T&D (Coincident, Non-Coincident)
Second 0.000000 0.000000 0 0 Summer Season to Use for Avoided T&D (Summer, Winter)Third 0.000000 0.000000 0 0 Peak Off-Peak Electric Adders Below Apply To Market-Based Only
Fourth 0.000000 0.000000 47.6% 52.4% Peak vs. Off-Peak Hours (%)kWh / kW - 2 Winter Summer kWh Steps Cumulative 15.00% 15.00% Ask Adder above Wholesale + Basis Charge Adder (%)
First 0.000000 0.000000 0 0 15.00% 15.00% Supply, Load Following, and Risk Management Fee Adder (%)Second 0.000000 0.000000 0 0 0.00% 0.00% Credits & Uncollectibles Adder (%)
Third 0.000000 0.000000 0 0 10.00% 10.00% Avoided Operating Retail Costs Adder (%)Fourth 0.000000 0.000000 5.35% 5.35% Supplemental Reserve Margin Adder (%)
kWh / kW - 3 Winter Summer kWh Steps Cumulative GasFirst 0.063155 0.063155 0 0 $0.00 Distribution ($ / CCF)
Second 0.063155 0.063155 0 0 $0.00 Transmission Capacity ($ / CCF)Third 0.063155 0.063155 0 0 1 Include Gas Commodity in Avoided Costs? (1=Yes, 0=No)
Fourth 0.063155 0.063155 Short-Term Firm (STF) ($ / CCF) Peaking ($ / CCF)Demand Charges ( $ / kW ) Reserve Charge Days / Month Reserve Charge Premium Days / Month
Winter Summer kW Steps Jan $0.0000 31 $0.0000 $0.0000 15First $13.477119 $13.477119 0 Feb $0.0000 28 $0.0000 $0.0000 0
Second $13.477119 $13.477119 Mar $0.0000 31 $0.0000 $0.0000 0Demand Ratchet Electric Fuel Costs Apr $0.0000 30 $0.0000 $0.0000 0
0 Use Ratchet? (1=Yes, 0=No) Fuel costs ($ / kWh) used for Net May $0.0000 31 $0.0000 $0.0000 00% Ratchet (%) Fuel Lost Revenue calculations. Jun $0.0000 30 $0.0000 $0.0000 0
Jan $0.00 Jan Jul $0.0000 31 $0.0000 $0.0000 0 Feb $0.00 Feb Aug $0.0000 31 $0.0000 $0.0000 0 Mar $0.00 Mar Sep $0.0000 30 $0.0000 $0.0000 0 Apr $0.00 Apr Oct $0.0000 31 $0.0000 $0.0000 0 May $0.00 May Nov $0.0000 30 $0.0000 $0.0000 0 Jun $0.00 Jun Dec $0.0000 31 $0.0000 $0.0000 0 Jul $0.00 Jul Aug $0.00 Aug Avoided Costs - Avoided Ancillary Charges Sep $0.00 Sep $0.00045076 OATT - All Months ($ / kW) $0.00000000 ISO - All Months ($ / kWh) Oct $0.00 Oct $0.00045076 OATT - Peak Months ($ / kW) $0.00000000 ISO - Peak Months ($ / kWh) Nov $0.00 Nov $0.00045076 OATT - Off-Peak Months ($ / kW) $0.00000000 ISO - Off-Peak Months ($ / kWh) Dec $0.00 Dec Peak Months for Ancillary Charges
1 JanGas Rates 1 Feb
$291.83 Flat Charge ($) 1 Mar$0.5650 Base CCF Charge ($ / CCF) 1 Apr0.00% Gas Delivery Adder (%) 1 May
$0.0006 DSM Rider, Other Riders ($ / CCF) 1 Jun6.00% Tax (% of Bill) 1 Jul
Actual Gas Cost Recovery ($ / CCF) 1 Aug2 1=Use for Bills/Avoided Costs, 2=Use for Bills Only, 0=Use Price Files 1 Sep
$0.3450 Jan 1 Oct$0.3450 Feb 1 Nov$0.3240 Mar 1 Dec$0.3170 Apr$0.3170 May Other Benefits$0.3170 Jun Environmental (Societal Test)$0.3170 Jul $ / kWh $ / CCF Include in TRC? (1=Yes, 0=No)$0.3170 Aug $0.0000 $0.0000 SO2 0$0.3170 Sep $0.0000 $0.0000 NOx 0$0.3170 Oct $0.0000 $0.0000 CO2 0$0.3170 Nov $0.0000 $0.0000 CO 0$0.3170 Dec $0.0000 $0.0000 CH4 0
$0.0000 $0.0000 PM 0$0.0000 $0.0000 Total
Miscellaneous$0.0000 Reduced Ratepayer Arrearage ($ / Unit) (Applied to All Tests Except Participant Test)$0.0000 Other Societal Benefits ($ / Unit) 0 Include in TRC? (1=Yes, 0=No)
U-20373 | October 28, 2019Direct Testimony of Christopher Neme on behalf of Natural Resources Defense Council
Exhibit: NRD-6; Source: DTE Electric's Response to NRDCDE-1.1ai with Att. 1.1ai-01 DSMore Batch Tool - 2020-2021 EWR Plan, Res Utility Input and C&I Utility Input tabs
Page 6 of 9

Discount Rate Matrix (By Test and Cost/Benefit)Utility (PAC) TRC RIM Societal Participant
0.00% 0.00% 0.00% 2.51% Avoided/Increased Supply Costs - Electric0.00% 0.00% 0.00% 2.51% Avoided/Increased Supply Costs - Gas0.00% 0.00% 0.00% 2.51% Program Administrator Costs0.00% 0.00% 16.28% Incentives
0.00% Revenue Losses/Gains - Electric0.00% Revenue Losses/Gains - Gas
0.00% 2.51% 16.28% Participant or Unit Costs0.00% 16.28% Participant or Unit Tax Credits
16.28% Participant or Unit Bill Reductions/Increases - Electric16.28% Participant or Unit Bill Reductions/Increases - Gas
0.00% 0.00% 0.00% 2.51% Reduced Arrearage0.00% 2.51% External Benefits
Revised TRC Test1 Treat free rider incentives as administration costs? (1 = Yes)
Levelized Discount Rate2.51% Used to Discount Energy and Demand in Cost of Conserved Results (%)
Negative Electric Loads0 Allow electric loads to go negative for net-metering purposes? (1 = Yes)
Electric Discoun 6.63%Gas Discount R 7.40%
U-20373 | October 28, 2019Direct Testimony of Christopher Neme on behalf of Natural Resources Defense Council
Exhibit: NRD-6; Source: DTE Electric's Response to NRDCDE-1.1ai with Att. 1.1ai-01 DSMore Batch Tool - 2020-2021 EWR Plan, Res Utility Input and C&I Utility Input tabs
Page 7 of 9

Escalators2020 2021 2022 2023 2024 2025 2026 2027 2028 2029 2030 2031 2032 2033
Electric Bills & Lost Revenues 1.000 1.020 1.079 1.145 1.187 1.211 1.264 1.306 1.331 1.376 1.414 1.476 1.506 1.536Gas Bills & Lost Revenues 1.000 1.033 1.026 1.041 1.077 1.101 1.124 1.149 1.174 1.200 1.226 1.253 1.280 1.308
Avoided Electric Generation 1.000 1.067 1.219 1.158 1.191 1.317 1.323 1.290 1.286 1.273 1.306 1.324 1.355 1.372Avoided Electric T&D 1.000 1.023 1.047 1.073 1.098 1.123 1.148 1.174 1.201 1.228 1.255 1.284 1.313 1.342
Avoided Electric Ancillary Market 1.000 0.936 1.132 0.932 0.895 0.860 0.826 0.792 0.760 0.729 0.697 0.666 0.637 0.608Avoided Electric Capacity 1.000 1.010 1.034 1.108 0.671 0.034 0.140 0.307 0.350 0.422 0.572 0.750 0.842 0.888
Avoided Gas Supply / Commodity 0.949 0.983 0.969 0.983 1.020 1.044 1.067 1.090 1.115 1.140 1.166 1.192 1.219 1.247Avoided Gas Capacity 1.000 1.023 1.047 1.073 1.098 1.123 1.148 1.174 1.201 1.228 1.255 1.284 1.313 1.342
Electric Fuel (for Net Fuel) 1.000 1.025 1.050 1.120 1.147 1.195 1.196 1.229 1.238 1.234 1.099 1.087 1.092 1.155Environmental 1.000 1.000 1.000 1.000 1.000 1.000 1.000 1.000 1.000 1.000 1.000 1.000 1.000 1.000
Avoided Market Costs & Scenario ProbabilitiesLog-Logistic Distribution Parameters for Option Values Log-Logistic Parameter Helper
Electric Gas Logistic Drivers InputsDSMore DSMore DSMore 18.8520 1.2289 Gamma = approximate minimum Electric GasReturned Returned Returned 16.7515 0.8506 Beta = shift parameter 18.8520 1.2289 Expected Minimum
Scenario $ / MWh $ / kWh $ / MCF Electric Gas 2.3194 2.3194 Alpha = squeeze parameter 78.4711 4.2562 Expected Maximum1 Outputs2 Electric Gas3 This distribution creates the 18.8520 1.2289 Gamma4 probabilities used in calculating 16.7515 0.8506 Beta5 the option values in DSMore. 2.3194 2.3194 Alpha6 See (E95:F115)
789 Cumulative
10 Probabilities
1112131415161718192021
Probability of EachScenario Occurring
U-20373 | October 28, 2019Direct Testimony of Christopher Neme on behalf of Natural Resources Defense Council
Exhibit: NRD-6; Source: DTE Electric's Response to NRDCDE-1.1ai with Att. 1.1ai-01 DSMore Batch Tool - 2020-2021 EWR Plan, Res Utility Input and C&I Utility Input tabs
Page 8 of 9

Growth Factor2034 2035 2036 2037 2038 2039 2040 2041 2042 2043 2044 2045+
1.550 1.581 1.614 1.647 1.681 1.715 1.750 1.786 1.823 1.860 1.898 1.0001.337 1.366 1.396 1.427 1.459 1.491 1.524 1.557 1.591 1.627 1.662 1.0001.396 1.421 1.435 1.464 1.494 1.525 1.556 1.588 1.620 1.654 1.687 1.0001.372 1.403 1.435 1.467 1.501 1.534 1.569 1.604 1.641 1.678 1.715 1.0000.582 0.555 0.529 0.505 0.482 0.461 0.440 0.421 0.404 0.386 0.370 1.0000.981 1.068 1.142 1.183 1.224 1.278 1.359 0.821 0.838 0.855 0.873 1.0001.275 1.304 1.333 1.363 1.394 1.425 1.457 1.490 1.524 1.558 1.593 1.0001.372 1.403 1.435 1.467 1.501 1.534 1.569 1.604 1.641 1.678 1.715 1.0001.165 1.223 1.226 1.286 1.280 1.337 1.541 1.572 1.605 1.638 1.671 1.0001.000 1.000 1.000 1.000 1.000 1.000 1.000 1.000 1.000 1.000 1.000 1.000
U-20373 | October 28, 2019Direct Testimony of Christopher Neme on behalf of Natural Resources Defense Council
Exhibit: NRD-6; Source: DTE Electric's Response to NRDCDE-1.1ai with Att. 1.1ai-01 DSMore Batch Tool - 2020-2021 EWR Plan, Res Utility Input and C&I Utility Input tabs
Page 9 of 9

MPSC Case No.: Requestor:
Question No.: Respondent:
Page:
U-20373NRDC NRDCDE-1.1aix1 J. R. Kupser 1 of 1
Question: Regarding DTE’s cost-effectiveness analysis of its proposed 2020-2023 efficiency programs, as summarized in Exhibit A-7 to Mr. Kupser’s testimony:
a. Please provide an Excel file organized by year and with formulae intactwith all of DTE’s avoided cost assumptions used to estimate the benefitsof efficiency. Please provide them for as far into the future as they havebeen forecast. Such assumptions should include, but not necessarily belimited to:
ix. For the Company’s line loss assumptions:
1. Please specify if they are based on average or marginal line lossrates;
Answer: Average line loss rates.
Attachments: N/A
U-20373 | October 28, 2019 Direct Testimony of Christopher Neme on behalf of Natural Resources Defense Council
Exhibit: NRD-7; Source: DTE Electric's Response to NRDCDE-1.1aix1, aix3b, aix4 with Att. 1.1aix4-01 Line Loss Study 1999 Page 1 of 16

MPSC Case No.: Requestor:
Question No.: Respondent:
Page:
U-20373 NRDC NRDCDE-1.1aix3b J. R. Kupser 1 of 1
Question: Regarding DTE’s cost-effectiveness analysis of its proposed 2020-2023
efficiency programs, as summarized in Exhibit A-7 to Mr. Kupser’s testimony:
a. Please provide an Excel file organized by year and with formulae intact
with all of DTE’s avoided cost assumptions used to estimate the benefits of efficiency. Please provide them for as far into the future as they have been forecast. Such assumptions should include, but not necessarily be limited to:
ix. For the Company’s line loss assumptions:
3. If the Company is using average loss rates, but believes that marginal loss rates would more accurately reflect impacts at generation, please explain why it is using average loss rates.
b. If the answer to subpart ix.3.a of this questions is no and the
Company is using average loss rates, but believes that marginal loss rates would more accurately reflect impacts at generation, is the use of average loss rates a function of not having studied marginal loss rates?
Answer: No. The Company does not believe marginal line losses more accurately
reflect impacts of EWR at generation. Attachments: N/A
U-20373 | October 28, 2019 Direct Testimony of Christopher Neme on behalf of Natural Resources Defense Council
Exhibit: NRD-7; Source: DTE Electric's Response to NRDCDE-1.1aix1, aix3b, aix4 with Att. 1.1aix4-01 Line Loss Study 1999 Page 2 of 16

MPSC Case No.: Requestor:
Question No.: Respondent:
Page:
U-20373 NRDC NRDCDE-1.1aix4 J. R. Kupser 1 of 1
Question: Regarding DTE’s cost-effectiveness analysis of its proposed 2020-2023
efficiency programs, as summarized in Exhibit A-7 to Mr. Kupser’s testimony:
a. Please provide an Excel file organized by year and with formulae intact
with all of DTE’s avoided cost assumptions used to estimate the benefits of efficiency. Please provide them for as far into the future as they have been forecast. Such assumptions should include, but not necessarily be limited to:
ix. For the Company’s line loss assumptions:
4. Please provide the Company’s most recent line loss study and supporting documents.
Answer: Please refer to the attached document for the Company’s most recent line
loss study. Attachments: U-20373 NRDCDE-1.1aix4-01 Line Loss Study 1999
U-20373 | October 28, 2019 Direct Testimony of Christopher Neme on behalf of Natural Resources Defense Council
Exhibit: NRD-7; Source: DTE Electric's Response to NRDCDE-1.1aix1, aix3b, aix4 with Att. 1.1aix4-01 Line Loss Study 1999 Page 3 of 16

U-20373 | October 28, 2019 Direct Testimony of Christopher Neme on behalf of Natural Resources Defense Council
Exhibit: NRD-7; Source: DTE Electric's Response to NRDCDE-1.1aix1, aix3b, aix4 with Att. 1.1aix4-01 Line Loss Study 1999 Page 4 of 16

U-20373 | October 28, 2019 Direct Testimony of Christopher Neme on behalf of Natural Resources Defense Council
Exhibit: NRD-7; Source: DTE Electric's Response to NRDCDE-1.1aix1, aix3b, aix4 with Att. 1.1aix4-01 Line Loss Study 1999 Page 5 of 16

U-20373 | October 28, 2019 Direct Testimony of Christopher Neme on behalf of Natural Resources Defense Council
Exhibit: NRD-7; Source: DTE Electric's Response to NRDCDE-1.1aix1, aix3b, aix4 with Att. 1.1aix4-01 Line Loss Study 1999 Page 6 of 16

U-20373 | October 28, 2019 Direct Testimony of Christopher Neme on behalf of Natural Resources Defense Council
Exhibit: NRD-7; Source: DTE Electric's Response to NRDCDE-1.1aix1, aix3b, aix4 with Att. 1.1aix4-01 Line Loss Study 1999 Page 7 of 16

U-20373 | October 28, 2019 Direct Testimony of Christopher Neme on behalf of Natural Resources Defense Council
Exhibit: NRD-7; Source: DTE Electric's Response to NRDCDE-1.1aix1, aix3b, aix4 with Att. 1.1aix4-01 Line Loss Study 1999 Page 8 of 16

U-20373 | October 28, 2019 Direct Testimony of Christopher Neme on behalf of Natural Resources Defense Council
Exhibit: NRD-7; Source: DTE Electric's Response to NRDCDE-1.1aix1, aix3b, aix4 with Att. 1.1aix4-01 Line Loss Study 1999 Page 9 of 16

U-20373 | October 28, 2019 Direct Testimony of Christopher Neme on behalf of Natural Resources Defense Council
Exhibit: NRD-7; Source: DTE Electric's Response to NRDCDE-1.1aix1, aix3b, aix4 with Att. 1.1aix4-01 Line Loss Study 1999 Page 10 of 16

U-20373 | October 28, 2019 Direct Testimony of Christopher Neme on behalf of Natural Resources Defense Council
Exhibit: NRD-7; Source: DTE Electric's Response to NRDCDE-1.1aix1, aix3b, aix4 with Att. 1.1aix4-01 Line Loss Study 1999 Page 11 of 16
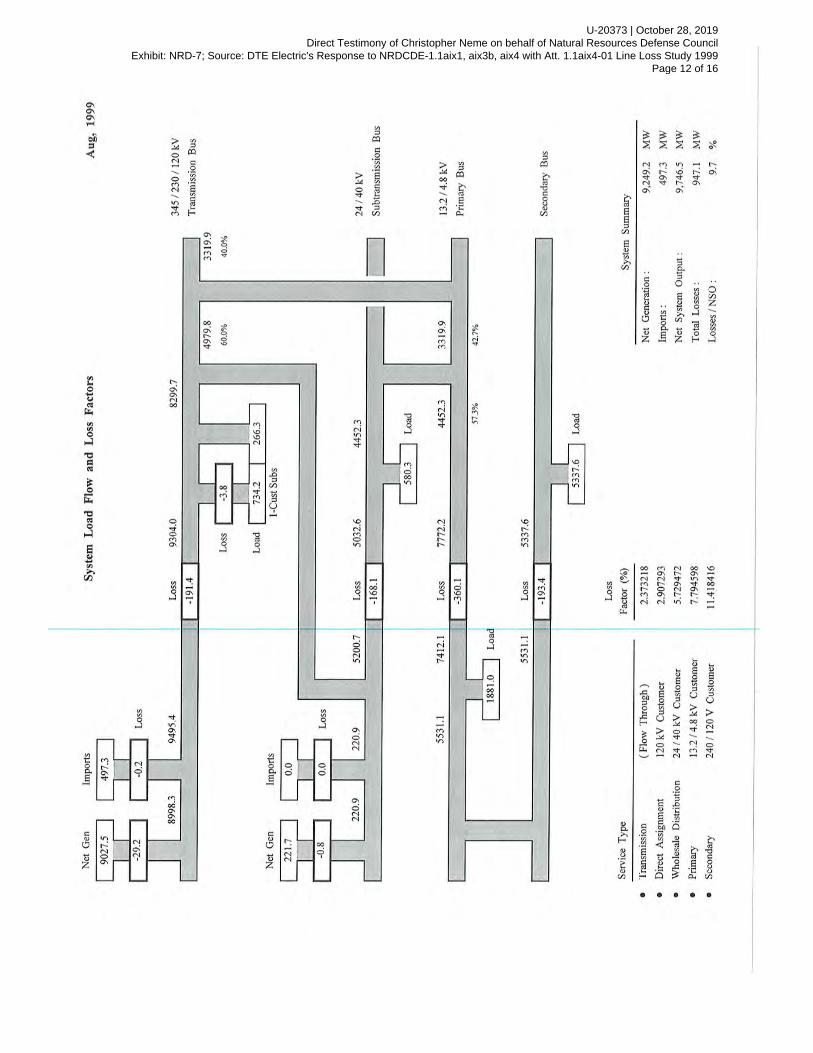
U-20373 | October 28, 2019 Direct Testimony of Christopher Neme on behalf of Natural Resources Defense Council
Exhibit: NRD-7; Source: DTE Electric's Response to NRDCDE-1.1aix1, aix3b, aix4 with Att. 1.1aix4-01 Line Loss Study 1999 Page 12 of 16

U-20373 | October 28, 2019 Direct Testimony of Christopher Neme on behalf of Natural Resources Defense Council
Exhibit: NRD-7; Source: DTE Electric's Response to NRDCDE-1.1aix1, aix3b, aix4 with Att. 1.1aix4-01 Line Loss Study 1999 Page 13 of 16

U-20373 | October 28, 2019 Direct Testimony of Christopher Neme on behalf of Natural Resources Defense Council
Exhibit: NRD-7; Source: DTE Electric's Response to NRDCDE-1.1aix1, aix3b, aix4 with Att. 1.1aix4-01 Line Loss Study 1999 Page 14 of 16

U-20373 | October 28, 2019 Direct Testimony of Christopher Neme on behalf of Natural Resources Defense Council
Exhibit: NRD-7; Source: DTE Electric's Response to NRDCDE-1.1aix1, aix3b, aix4 with Att. 1.1aix4-01 Line Loss Study 1999 Page 15 of 16

U-20373 | October 28, 2019 Direct Testimony of Christopher Neme on behalf of Natural Resources Defense Council
Exhibit: NRD-7; Source: DTE Electric's Response to NRDCDE-1.1aix1, aix3b, aix4 with Att. 1.1aix4-01 Line Loss Study 1999 Page 16 of 16

Valuing the Contribution of Energy Efficiency to
Avoided Marginal Line Losses and Reserve Requirements
Principal authors
Jim Lazar and Xavier Baldwin
August 2011
U-20373 | October 28, 2019 Direct Testimony of Christopher Neme on behalf of Natural Resources Defense Council
Exhibit: NRD-8; Source: The Regulatory Assistance Project (RAP) Page 1 of 12

Electronic copies of this paper and other RAP publications can be found on our website at www.raponline.org.
To be added to our distribution list, please send relevant contact information to
U-20373 | October 28, 2019 Direct Testimony of Christopher Neme on behalf of Natural Resources Defense Council
Exhibit: NRD-8; Source: The Regulatory Assistance Project (RAP) Page 2 of 12

1
Valuing the Contribution of Energy Efficiency to Avoided Marginal Line Losses and Reserve Requirements
Valuing the Contribution of Energy Efficiency to
Avoided Marginal Line Losses and Reserve Requirements
by Jim Lazar, RAP Senior AdvisorXavier Baldwin, P.E., Principal Electrical Engineer, Burbank Water and Power1
Introduction
Utilities and their regulators have become familiar, comfortable, and sometimes enthusiastic about the energy savings that energy efficiency measures provide. These
savings reduce fuel usage, reduce air pollution, and reduce consumer bills.
Energy efficiency measures also provide very valuable peak capacity benefits in the form of marginal reductions to line losses that are often overlooked in the program design and measure screening. On-peak energy efficiency can produce twice as much ratepayer value as the average value of the energy savings alone, once the generation, transmission, and distribution capacity, line loss, and reserves benefits are accounted for. Geographically or seasonally targeted measures can further increase value.
This paper is one of two that the Regulatory Assistance Project (RAP) is publishing on this topic; the second looks in a more detailed fashion at the transmission and distribution system benefits of energy efficiency.2
Principal Conclusions
The line losses avoided by energy efficiency measures are generally underestimated. Most analysts who consider line losses at all use the system-average line losses, not the marginal line losses that are actually avoided when energy efficiency measures are installed. Generally this is because average line losses are a measured and published figure, while determining marginal line losses requires more information and more detailed calculations.
Because losses grow exponentially with load, the marginal losses avoided are much greater than the average losses on a utility distribution system. As calculated in Figure 4, marginal line losses at the time of the system peak of 20% are entirely consistent with average line losses of 7% on a utility distribution system.
Because energy efficiency measures reduce loads at the customer premises, they also avoid the associated marginal line losses. As a result, the utility avoids the need for as much as 120% of the generating capacity needed to serve the avoided load.
1 This paper builds on work originally presented to the Northwest Power and Conservation Council’s Regional Technical Forum (RTF); it has benefited greatly from the contribution of Charlie Grist of the Council staff and Adam Hadley, P.E., a consultant to the RTF. See: http://www.nwcouncil.org/energy/rtf/meetings/2008/09/Marginal%20Distribution%20System%20Losses%203.ppt http://www.nwcouncil.org/energy/rtf/meetings/2008/09/Marginal%20Distribution%20System%20Losses%20Illustration%20v.xls
2 US Experience with Efficiency as a Transmission and Distribution System Resource, Chris Neme, Regulatory Assistance Project, November 2011. http://www.raponline.org/docs/
U-20373 | October 28, 2019 Direct Testimony of Christopher Neme on behalf of Natural Resources Defense Council
Exhibit: NRD-8; Source: The Regulatory Assistance Project (RAP) Page 3 of 12

2
Valuing the Contribution of Energy Efficiency to Avoided Marginal Line Losses and Reserve Requirements
about the same load shape as the loads themselves – rising at peak hours and declining at night. Therefore, efficiency measures generally contribute more to the reduction of peak demands than they do on average. They have a better “load shape” than baseload power plants, and the savings are consequently more valuable.
This load shape is not uniform from measure to measure. Some types of efficiency, such as Energy Star air conditioners, provide very large peak demand savings relative to the energy savings. Others, like more efficient street lights, may only reduce demand during shoulder or off-peak hours.
Analysis is required to determine the peak demand of various efficiency measures. This is measured by the typical load factor of the individual measure (ratio of average to peak demand reduction) and the coincidence factor of the measure (the portion of the demand reduction of the individual measure that will occur at the time of the system peak demand). Measures that provide most of their savings during the high-load hours are said to have a favorable load shape. All three of these measures are important to valuing the energy savings from efficiency measures.
The peaking capacity value of different measures varies by region of the country, depending both on climate and on whether the local utility system is summer-peaking or winter-peaking. A summer-peaking region, like Texas or Florida, will value the capacity benefits of air conditioning savings, but will derive much less capacity value from electric space-heating savings. Winter-peaking regions will have the opposite perspective. Utilities with dual peaks will generally assign a greater value to measures other than space conditioning (i.e., that reduce peak demand in both seasons) compared to regions with a strong peak demand in one season or the other.
Figure 2 shows the relative on-peak summer and winter savings of some typical energy efficiency measures as evaluated in the Pacific Northwest, a winter-peaking region.
Daily Load Shape of Example Utility3500
3000
2500
2000
1500
1000
500
0Midnight 6 Noon 6 Midnight
Dem
and
(M
W)
Utilities maintain generating reserves so that when one generating unit goes out of service, customers continue to receive service. Because energy efficiency reliably reduces energy loads and avoids marginal line losses, thus achieving reliable reductions in loads to be served at the generation level, the utility avoids the need for expensive reserves to assure reliable service. When compounded with the avoided marginal line losses, energy efficiency measures can save about 1.4 times as much capacity at the generation level as is measured at the customer’s meter. While the energy benefit of line loss avoidance by investment in energy efficiency is relatively well-understood, the capacity benefit is a separate and additional benefit that is seldom quantified by efficiency analysts.
Efficiency Has a Favorable Daily and Seasonal Resource Shape
Most electric utilities have loads that rise during the day and decline at night. They also have seasonal increases in the summer, winter, or both, compared with the spring and autumn seasons. This variation is caused by people waking up and turning on appliances, going to work and turning on lights and office equipment, and using air conditioners following the heat of the afternoon.
A typical utility will have an on-peak demand during the peak season that is twice as high as the average demand over the year. The ratio of average demand to peak demand is called the system load factor, and in this example, would be 50%. Figure 1 shows a typical utility daily load shape.
Because investments in energy efficiency reduce the very loads that cause the overall system load, they generally have
Figure 1:
U-20373 | October 28, 2019 Direct Testimony of Christopher Neme on behalf of Natural Resources Defense Council
Exhibit: NRD-8; Source: The Regulatory Assistance Project (RAP) Page 4 of 12

3
Valuing the Contribution of Energy Efficiency to Avoided Marginal Line Losses and Reserve Requirements
Figure 2
Ratio of Coincident Peak Savings to Average Annual Energy Savings 3
step-up transformers to get the power onto the transmission system, long transmission lines, transmission substations, step-down transformers to distribution voltages, distribution lines, and distribution line transformers.
Losses occur at each of these steps of the transmission and distribution system. Typical utility-wide average annual losses from generating plants to meters ranges from 6% to 11%, depending on the transmission distances, system density, distribution voltages, and the characteristics of transmission and distribution system components.5
Energy efficiency is often credited with avoiding these average losses when regulators and utilities value efficiency investments and set the program cost-effectiveness thresholds based on avoided cost. However, the losses on utility transmission and distribution systems are not uniform through the day and the year, and the peak capacity savings from energy efficiency are typically much greater than the average savings.
Line Losses on a Distribution System
Many utility conservation programs credit efficiency measures with line loss reduction, but most of these calculations are based on the average losses, not the marginal losses avoided by efficiency measures.
There are two types of losses on the transmission and distribution system. The first are no-load losses, or the losses that are incurred just to energize the system – to create a voltage available to serve a load. Nearly all of these occur in step-up and step-down transformers. The second are resistive losses, which are caused by friction released as heat as electrons move on increasingly crowded lines and transformers. Typically, about 25% of the average
3 Northwest Power and Conservation Council Regional Technical Forum, 2001; see: http://www.nwcouncil.org/energy/rtf/measures/support/procost/MC_AND_LOADSHAPE_6P.XLS
4 Water heat usage is concentrated in the early morning and early evening hours, when households are beginning and ending their day. System peaks typically occur when residential and commercial loads overlap – in the morning around 8 a.m. and the evening around 5 p.m.; therefore electric water heat usage is highly peak-coincident at least for a winter-peaking system. By contrast, while gas water heat usage occurs in the same hours, water heat is a very high load factor usage on gas systems, because in the natural gas industry, peak demand is measured on a daily basis, not an hourly (or sub-hourly) basis as is the standard for the electricity sector. Prior to the 1960s, timers were common on electric water heaters to keep them from contributing to peak demand; with the advent of smart grid resources, electric water heaters are now being looked to for demand response and to complement intermittent generation from wind.
5 Page 401a of the FERC Form 1 shows system losses and system retail sales, and generally fall in this range for vertically integrated utili-ties. Line losses attributable to wholesale sales and wholesale purchases are typically reported in part by the seller and in part by the buyer – and therefore the losses reported in the Form 1 may not reflect all losses attributable to retail sales by the reporting utility.
Measure Summer Peak Winter Peak
Residential Lighting 0.90 1.37
Residential Water Heat 0.94 2.63
Residential Space Heat 0.28 4.00
Residential Air Conditioning 1.72 0.08
Residential Refrigerators 1.11 0.87
Commercial Lighting 2.17 2.00
Commercial Air Conditioning 2.86 0.08
As is evident in a winter-peaking region like the Pacific Northwest, investments in space heating conservation (floor, ceiling, and wall insulation) will provide very large peak demand benefits, whereas in summer-peaking regions, it is natural that air conditioning measures are most valuable. One of the more interesting findings of this particular analysis, however, was the relatively high winter-peak coincidence factor of residential water heating consumption.4 This might be very different on a summer-peaking system.
Energy Efficiency Provides Significant Distribution and Transmission Loss Savings at the Time of Critical System Peak Demands
Because energy efficiency reduces loads at the customer premises, the utility does not have to supply these avoided demands with generating facilities. Generating facilities are often located at great distances from customers and require
U-20373 | October 28, 2019 Direct Testimony of Christopher Neme on behalf of Natural Resources Defense Council
Exhibit: NRD-8; Source: The Regulatory Assistance Project (RAP) Page 5 of 12

4
Valuing the Contribution of Energy Efficiency to Avoided Marginal Line Losses and Reserve Requirements
annual losses are no-load or core losses, and about 75% are resistive losses. Utility loss studies generally separate the core losses from the resistive losses.6
Losses increase significantly during peak periods. The mathematical formula for the resistive losses is I2R, where “I” is the amperage (current) on any particular transformer or distribution line, and “R” is the resistance of the wires through which that current flows. While the “R” is generally constant through the year, since utilities use the same wires and transformers all year long, the “I” is directly a function of the demand that customers place on the utility. Thus, resistive losses increase with the square of the current, meaning losses increase as load increases.
Let’s start with a very simple calculation: the load (current times voltage) of a utility during the highest on-peak hours is two times the average load for the year, a system load factor of 50%. Because the voltage is constant, losses are a function of the square of the load, and that load is two times as high on-peak as the average, the total resistive losses are four times as great during the summer afternoon peak as they average over the year. It’s a bit more complicated than that, but this example gives a general idea.
Depending on the load shape of the utility (how sharp the “needle peak” is), the percentage of generation that is “lost” before it reaches loads are typically at least twice as high as the average annual losses on the system. During the highest critical peak hours (perhaps 5-25 hours per year) when the system is under stress, the losses may be four to six times as high as the average.
There are many tools available to utilities for line loss reduc-tion, including voltage upgrades, reconductoring, and improved transformers. While these are valuable and may often be cost-effective, the focus of this paper is on the avoidable marginal losses
as a result of load reductions from implementation of energy efficiency measures.
Marginal Losses Are Greater Than Average Losses
Important to valuing any investment is how much the incremental cost of the measure is, and what the incremental savings are.7 Because the average losses increase with the square of the load, the marginal line losses at any point are significantly higher than the average losses at that same point on the load curve. It turns out that the incremental system losses during the peak hours are much greater than the average losses during these hours. As noted above, this is due to the total losses growing with the square (I2R) of the load in response to linear growth in the loads, and the incremental losses (the change in losses with respect to the change in loads) are therefore more than exponential.
The graph below shows the average losses at various load levels for a hypothetical small utility with an average annual resistive loss of 7% on its system. It also shows the incremental losses sustained as load increased from the minimum level of about 100 megawatts to the system record peak demand of nearly 300 megawatts for this utility.
This utility’s average resistive losses on their distribution system are only about 7% over the course of the year. At their system extreme peak, the estimated total losses
Average and Marginal Line LossesAssumes 7% average losses; 25% No-load, 75% I2R
Figure 3
Los
ses
as p
erce
nta
ge o
f lo
ad (
incr
emen
tal
load
) 25%
20%
15%
10%
5%
0% 33% 42% 50% 58% 67% 75% 83% 92% 100%
Percent of Maximum System Load
Average Losses
Marginal Losses
6 In preparing this paper, the authors reviewed line loss studies for several utilities; they indicated no-load losses ranging from 18.5% to 30% of total annual losses. A mean figure of 25% is used for simplicity in illustrating the principle of marginal line loss calculation.
7` The most comprehensive and most commonly accepted cost-effectiveness test is the Total Resource Cost (TRC) test, which, when properly applied, measures both energy and non-energy benefits; but the principles in this analysis apply equally to the Program Administrator Cost (PAC) test used by some utilities and regulators to value energy efficiency investments.
U-20373 | October 28, 2019 Direct Testimony of Christopher Neme on behalf of Natural Resources Defense Council
Exhibit: NRD-8; Source: The Regulatory Assistance Project (RAP) Page 6 of 12

5
Valuing the Contribution of Energy Efficiency to Avoided Marginal Line Losses and Reserve Requirements
losses are no-load losses, meaning that about 75% are resis-tive losses. Therefore this paper uses a rule of thumb that marginal losses are about 1.5 times average losses (it’s actu-ally a bit lower at low loads, and a bit higher at high loads where the no-load losses are a smaller part of total losses.)
This means that a conservation measure that saved 1 kilowatt at the time of the system peak measured at the customer’s meter would save about 1.25 kilowatts measured at the generation level.8 The critical peak-period marginal line-loss savings of energy efficiency therefore adds another 25% to the value of the load reduction itself, in determining the amount of generating capacity required to meet critical peak period demand. If the utility has 1.25 kW of generating capacity, and loses at the margin 20% of this capacity during the highest peak hours, it has 1 kW available to serve the load.
The hypothetical analysis may not be universally applicable, but the principles are universal: losses increase with the square of the demand, and incremental losses during the critical peak period are much larger than the average losses over the year.
Avoidable Transmission and Distribution Capacity Costs Are Significant
In addition to the avoided losses and the reduced need for generating capacity that can be achieved through
reached about 11%, one and one-half times the average losses for the year. At that extreme peak, however, the marginal resistive losses – those that would be avoided if load had been a little bit lower if an efficiency measure were installed – were 20%.
The graphic in Figure 3 is derived from the calculations above in Figure 4.
Few utilities or regulators have studied the marginal losses that can be avoided with incremental investment in efficiency measures that provide savings at the time of extreme peak demands. This type of analysis suggests a very significant benefit from measures that reduce peak demand, including energy efficiency, demand response, and use of emergency generators located at customer premises.
Mathematically, the formula I2R reduces the marginal resistive loses to a calculation. At any point on the load duration curve, marginal resistive loses are two-times the average resistive losses at that same point on the load duration curve. During off-peak hours, when average resistive losses may be only 3%, the marginal losses are 6%. During the highest peak hours, when average resistive losses may be 10%, the marginal losses are 20%.
However, because part of the overall losses at every hour are (no-load) losses, the marginal losses are not two times the total losses – only two times the resistive losses. The no-load losses are not reduced by energy efficiency measures. A variety of utility loss studies indicate that 20%-30% of total
Load Level
100
125
150
175
200
225
250
275
300
No-Load Losses MW
2.625
2.625
2.625
2.625
2.625
2.625
2.625
2.625
2.625
Resistive Losses MW
3.5
5.5
7.9
10.7
14.0
17.7
21.9
26.5
31.5
Square of
Load
10,000
15,625
22,500
30,625
40,000
50,625
62,500
75,625
90,000
Loss %
6.1%
6.5%
7.0%
7.6%
8.3%
9.0%
9.8%
10.6%
11.4%
Total Loss MW
6.1
8.1
10.5
13.3
16.6
20.3
24.5
29.1
34.1
Incremental Load
25
25
25
25
25
25
25
25
Incremental Loss
2.0
2.4
2.8
3.3
3.7
4.2
4.6
5.0
Marginal Loss %
8%
10%
11%
13%
15%
17%
18%
20%
Figure 4:
Calculation of Average and Marginal Line Losses
8 [1.25 – (.20 x 1.25) = 1.0]; If the utility must serve a 1 kW incremental load on-peak, it needs 1.25 kW of additional generating capacity to feed the transmission and distribution system.
U-20373 | October 28, 2019 Direct Testimony of Christopher Neme on behalf of Natural Resources Defense Council
Exhibit: NRD-8; Source: The Regulatory Assistance Project (RAP) Page 7 of 12

6
Valuing the Contribution of Energy Efficiency to Avoided Marginal Line Losses and Reserve Requirements
energy efficiency investment at the distribution level, the peak load reduction from energy efficiency investment also reduces transmission and distribution capacity costs. Recognizing this value may be especially important for those jurisdictions that actually review T& D investments against targeted energy efficiency program opportunities.9
Transmission and distribution systems must be designed to carry extreme peak demands. The costs of oversizing systems for these demands are quite significant. In states where marginal cost of service studies are used to set rates, utilities regularly examine the cost of adding capacity to their transmission and distribution grids. The results of these studies vary widely, in part due to regional conditions and in part due to a lack of standardized methodologies.
The capital cost of augmenting transmission capacity is typically estimated at $200 to $1,000 per kilowatt, and the cost of augmenting distribution capacity ranges between $100 and $500 per kilowatt.10 Annualized values (the average rate of return multiplied by the investment over the life of the investment) are about 10% of these figures, or $20 to $100 per kilowatt-year for transmission and $10 to $50 per kilowatt-year for distribution. There are also marginal operations and maintenance costs for transmission and distribution capacity, but these are modest in comparison to the capital costs.
In valuing energy efficiency investments, it is important to consider the avoided energy and capacity not only at the generation level, but also at the transmission and distribution levels. Inclusion of these values, particularly considering the marginal capacity benefits from incremental efficiency investments, can greatly increase the value of these measures, and therefore the level of financial assistance or incentives that utilities may offer to encourage implementation.
Another important benefit of increased energy efficiency at the distribution/customer level is the significant
extension in useful life of distribution system components and the resulting deferral of capital expenditures for upgrade or replacement of electrical equipment, including conductors, transformers, etc. In effect, energy efficiency allows the system to absorb additional load growth without the need to upgrade system components as soon. This capital deferral translates more or less directly into avoided distribution-capital investment costs for capacity expansion. A prudent assumption is that the avoided capacity benefits are at least one-half of the utility’s estimated marginal transmission and distribution capacity costs, based on their most recent cost-of-service analysis.11
Another benefit of reducing marginal losses is lower loss of service life due to a reduction in winding and insulation temperatures in distribution transformers, which are normally operated at up to 200% of their nameplate rating during peak load periods, a condition that causes accelerated aging of these components.
Efficiency Reduces System Generating Reserve Requirements
Utilities must provide reserves of generating facilities in order to ensure that service is not interrupted if (and when) generating units fail to operate as planned. Generating reserve requirements in the United States range from as low as 7% on hydro-rich utilities to as much as 25% for isolated small utilities in Alaska and Hawaii. Ten to fifteen percent is typical for large thermal-based systems.12
Efficiency investments reduce loads at the customer’s me-ter, and, as we have seen, provide even larger reductions at the generation level during system peak periods when losses skyrocket and capacity/reserve requirements are greatest.
Since the reserve requirement is tied to the amount of generation required to serve load, efficiency reduces the reserve requirement not only by a percentage of the
9 Id footnote 2.
10 These wide ranges reflect the wide possible range of outcomes for distance, topography, real estate costs, and construction costs that may be incurred.
11 The capacity benefit may not be monetized immediately, due to temporary excess capacity; but over the life of a distribution circuit, eventually components will need to be replaced due to age or upsized due to growth. Using one-half of marginal cost implies that, on average, the capacity benefits will be realized within a half-lifetime of the circuit components.
12 The level of required reserves is a function of the size of the total system, the size of the largest single generating units, and the reliability of the various generating units. Because hydro units are generally relatively small and extremely reliable, utilities that rely on hydro for reserves have the lowest reserve requirements. Small island systems, like those in Hawaii, with a few relatively large generating units typically have the highest reserve requirements.
U-20373 | October 28, 2019 Direct Testimony of Christopher Neme on behalf of Natural Resources Defense Council
Exhibit: NRD-8; Source: The Regulatory Assistance Project (RAP) Page 8 of 12

7
Valuing the Contribution of Energy Efficiency to Avoided Marginal Line Losses and Reserve Requirements
thousands of small, distributed units, each of which saves anywhere from a few watts (e.g., a compact fluorescent lamp) to a few kilowatts (e.g., a high-efficiency commercial air conditioning unit).
It has long been recognized that a utility network made up of a large number of small generating units provides a more reliable system simply because they will not all fail simultaneously. The same principle applies to energy efficiency investments, which are a large number of small energy-saving devices. But these go beyond this mathematical advantage in at least two ways:
First, the individual units (efficient light bulbs, refrigerators, and air conditioners) are, as a population, extremely reliable, far more so than any type of generating plant.13 Energy Star windows, attic insulation, or variable speed drive in a commercial HVAC system are almost certainly not going to “fail” during a heat wave. Conversely, generating plants, transmission lines, and even distribution transformers are most susceptible to failure when under stress. Even the most reliable type of generating units (hydro turbines) have higher “forced outage rates” than energy savings devices.
Second, if one energy efficient unit does fail, such a “failure” often actually reduces electric demand (i.e., when a high-efficiency air conditioner breaks, the customer may be entirely without air conditioning – uncomfortable, but using less energy). The utility loses an “efficient” load, but nonetheless, the load goes down when the unit fails, generally reducing the load-related stress and threats to reliability on the system. When a generating plant or transmission line fails, it leaves the utility with the same
load, and less ability to serve that load and with increased risk of a system outage affecting hundreds, thousands, or even millions of consumers.
savings that customers enjoy, but also by a percentage of the incremental peak losses on the transmission and distribution system that reduce the utility’s generation requirements. The reserve requirement is measured against the amount of generation needed – including that needed to cover line losses. Therefore, the avoided reserves resulting from efficiency investments are increased in value by the avoided marginal line losses.
The table below looks at the capacity savings during an off-peak period and an on-peak period for two hypothetical resources, one with a low coincidence factor relative to the system peak (efficient lighting), and one with a high coincidence factor, efficient air conditioning. The table shows that after considering the coincidence of different loads to the system peak, the marginal line losses, and the avoided reserve requirement, the capacity benefit of energy efficiency measures increases significantly from that measured at the customer’s meter.
As is evident, the total capacity benefit of each of these measures is 1.44 times the capacity savings at the customer’s meter, because of the value of the marginal line losses and avoided reserves during peak periods (line 8 divided by line 3). Thus the generation capital cost savings are significantly higher than if only average line losses were used and if the reserves benefits were not included.
Efficiency Is The Most Reliable Resource
Energy efficiency is the most reliable resource in which a utility can invest. Unlike any type of generating unit, efficiency investments are composed of hundreds or
Air Line Lighting Conditioning
1 kW Savings at Customer Meter 10 10
2 Coincidence Factor 0.25 0.75
3 kW Savings at Customer Meter at Peak (1 X 2) 2.5 7.5
4 Marginal Line Losses At Peak @ 20% (3 / (1 - 20%) -3) 0.625 1.875
5 kW Savings at Busbar (3 + 4) 3.125 9.375
6 Reserve Margin Requirement 15% 15%
7 Avoided Reserve Capacity (@ 15%) 0.47 1.41
8 kW Savings At Generation Level (5 + 7) 3.59 10.78
Figure 5:
Peak Capacity Savings from Energy Efficiency Investments
13 The most reliable peaking units have on-peak availability of about 95%, and forced outage rates of about 5%.
U-20373 | October 28, 2019 Direct Testimony of Christopher Neme on behalf of Natural Resources Defense Council
Exhibit: NRD-8; Source: The Regulatory Assistance Project (RAP) Page 9 of 12

8
Valuing the Contribution of Energy Efficiency to Avoided Marginal Line Losses and Reserve Requirements
How the Smart Grid Can Enhance the Application of Energy Efficiency Measures
At the time of the system peak demand, line losses are highest and marginal line losses may be 20% or higher. For this reason, actions that reduce load at the time of the system peak are extremely valuable. As utilities invest in smart grid assets and learn to deploy them, avoidance of expensive peak load related costs becomes more feasible. The application of smart grid technology will enhance the application of energy efficiency measures by:
• Accuratelymeasuringconditionsonthedistribution system before and after the applicationof load management tools, so that the value can beaccurately known.For the first time utilities will be able to accuratelymeasure voltage, load, and reactive power at thedistribution level down to individual customers.Data will be available to determine the level of lossesoccurring on a circuit and what control actions areneeded. For example, the data will show when andhow to optimally adjust circuit voltage level to reducedemand or save energy.
• Providingtheabilitytocontrolorshiftdemandatpeak timesCustomer load can be reduced or shifted by applicationof smart thermostats, pool pump controls, water heatercontrols, appliance controls, etc. This is most valuableduring peak load events when the combination of energysavings and peak capacity savings is at its highest.
• Providingtheabilitytoutilize/controldistributedgeneration (i.e. fuel cells, batteries, solar arrays,PHEV’s etc.) as needed.Customers may invest in distributed resources andenergy storage to reduce their peak demand as measuredby their electric meters, which typically measure non-coincident peak demand. With smart grid tools, theenergy control center can interface with distributedgeneration to provide additional capacity at the utility’speak time or store renewable energy during off-peakperiods, both of which benefit the system, but might notbe apparent to the individual customer.
These types of control may enable the utility to avoidload during the needle peak hours – when marginal line
losses may exceed 20%, and when generation reserves are stretched thin at a much lower cost than building additional generation, transmission, and distribution capacity. This will have a small effect on the value of energy conservation measures, such as those described here, which provide savings for thousands of hours per year. However, it may provide significant cost relief to the utility and its consumers in avoiding the cost of seldom-used capacity, thereby adding great value to the types of measures that provide savings concentrated at the time of the system peak demand.
The measures mentioned above are part of the emerging demand response capability of smart grid, which promises to provide a verifiable virtual reserve of reliable capacity directly equivalent to a spinning reserve but at a much lower cost.
Summary: The Avoided Line Losses and Avoided Reserves Benefits of Energy Efficiency Are Very Important
This paper has attempted to highlight two often-overlooked attributes of energy efficiency investments.
First, energy efficiency measures typically provide significant savings at the time of the system peak demand, and that time occurs when the line losses are highest. The avoided line losses can add as much as 20% to the capacity value measured at the customer meter.
Second, because they are reducing loads, including marginal line losses, energy efficiency measures also reduce the level of required generating reserves.
Each of these benefits increases the economic savings provided by energy efficiency investments. The compounding of a 20% marginal line loss savings and a 15% reserves savings can produce a 44% total generating capacity benefit, over and above the peak load reduction measured at the customer’s meter.
For peak-oriented loads like air conditioning, the annual capacity cost of generation, transmission, and distribution capacity needed to assure reliable service can equal or exceed the cost of the energy used during the year.
Add it all together, and the total capacity value of energy efficiency investments in peak-oriented loads like space conditioning can be as valuable as the energy savings are.
Marginal line loss calculations and avoided reserve requirements should be an integral part of any evaluation of the benefits of energy efficiency measures.
U-20373 | October 28, 2019 Direct Testimony of Christopher Neme on behalf of Natural Resources Defense Council
Exhibit: NRD-8; Source: The Regulatory Assistance Project (RAP) Page 10 of 12

The Regulatory Assistance Project (RAP) is a global, non-profit team of experts focused on the long-term economic and environmental sustainability of the power and natural gas sectors. We provide technical and policy assistance on regulatory and market policies that promote economic efficiency, environmental protection, system reliability and the fair allocation of system benefits among consumers. We have worked extensively in the US since 1992 and in China since 1999. We added programs and offices in the European Union in 2009 and plan to offer similar services in India in the near future.Visit our website at www.raponline.org to learn more about our work.
U-20373 | October 28, 2019 Direct Testimony of Christopher Neme on behalf of Natural Resources Defense Council
Exhibit: NRD-8; Source: The Regulatory Assistance Project (RAP) Page 11 of 12

Home office
50 State Street, Suite 3Montpelier, Vermont 05602802-223-8199www.raponline.org
U-20373 | October 28, 2019 Direct Testimony of Christopher Neme on behalf of Natural Resources Defense Council
Exhibit: NRD-8; Source: The Regulatory Assistance Project (RAP) Page 12 of 12

MPSC Case No.: Requestor:
Question No.: Respondent:
Page:
U-20471MECNRDCSC MECNRDCSCDE-4.24eii4 K. L. Bilyeu1 of 1
Question: Mr. Bilyeu provided a number of Excel workpapers that appear to provide DSMore cost- effectiveness analysis results for the various EWR efficiency level and cost assumption combinations assessed by DTE.
e. DSMore reports cost-effectiveness six different ways, one of which iscalled “cost- based” and the other five are different variations of “market-based” (see cells A11 through G29).
ii. Please explain what each of the following represent and, for the onesthat DTE does not use, please explain why:
4. “market-based option”
Answer: DSMore was developed to show the distribution of potential cost benefit scores based on various hourly prices, weather, and load scenarios. It provides multiple scores that show the distribution of results from the minimum prices with the mildest weather, to the highest prices under the most extreme weather. The market-based “option” value is a weighted average price as calculated by the model with given weighting factors for the probability for each price occurring.
Attachments: N/A
U-20373 | October 28, 2019 Direct Testimony of Christopher Neme on behalf of Natural Resources Defense Council
Exhibit: NRD-9; Source: U-20471 DTE Electric's Response to MECNRDCSCDE-4.24eii4 Page 1 of 1

DTE Electric CompanyNRD‐10 WP LKM‐650 2018 Rev Req Working ModelRevenue Requirement Summary
Case No.: U‐20471Witness: L.K. Mikulan
Page: 1 of 2
Present Value of Revenue Requirements Summary ($ MM)Negative represents customer benefit increase; positive represents customer benefit decrease
Mid Year Adjustment Factor 1.000
Case 1 Case 2 Case 3 Case 4 Case 5 Case 6 Case 7 Case 8 Case 9 Case 10 Case 1 Case 2 Case 3 Case 4 Case 5 Case 6 Case 7 Case 8 Case 9 Case 102019-2023 878.45 - 2019-2023 - (878.45) 2019-2028 1,648.40 - 2019-2028 - (1,648.40) 2019-2032 2,105.36 - 2019-2032 - (2,105.36) 2019-2037 2,543.93 - 2019-2037 - (2,543.93) 2019-2040 2,579.66 - 2019-2040 - (2,579.66) 2019-2060 2,773.66 - 2019-2060 - (2,773.66)
- - - - -
2018 2019 2020 2021 2022 2023 2024 2025 2026 2027 2028 2029 2030 2031 2032 2033 2034 2035 2036 2037 2038 2039 2040Case 1Capital Investment 0 3 9 17 26 35 40 43 43 42 41 40 40 40 40 41 41 42 42 42 42 42 42O&M 0 116 151 224 233 205 204 207 195 188 195 194 197 200 204 208 202 201 198 203 206 207 208Fuel & Emissions 0 0 0 0 0 0 0 0 0 0 0 0 0 0 0 0 0 0 0 0 0 0 0Energy Purchase 0 0 0 0 0 0 0 0 0 0 0 0 0 0 0 0 0 0 0 0 0 0 0Capacity Purchase 0 0 0 0 0 0 0 0 0 0 0 0 0 0 0 0 0 0 0 0 0 0 0Property Tax, Insurance 0 0 0 0 0 0 0 0 0 0 0 0 0 0 0 0 0 0 0 0 0 0 0Total Revenue Requirements 0 118 159 240 259 240 245 250 239 230 236 234 237 240 244 249 243 243 240 245 247 248 250
- - - - - - - - - - - - - - - - - - - - - - -
Case 2Capital Investment 0 0 0 0 0 0 0 0 0 0 0 0 0 0 0 0 0 0 0 0 0 0 0O&M 0 0 0 0 0 0 0 0 0 0 0 0 0 0 0 0 0 0 0 0 0 0 0Fuel & Emissions 0 0 0 0 0 0 0 0 0 0 0 0 0 0 0 0 0 0 0 0 0 0 0Energy Purchase 0 0 0 0 0 0 0 0 0 0 0 0 0 0 0 0 0 0 0 0 0 0 0Capacity Purchase 0 0 0 0 0 0 0 0 0 0 0 0 0 0 0 0 0 0 0 0 0 0 0Property Tax, Insurance 0 0 0 0 0 0 0 0 0 0 0 0 0 0 0 0 0 0 0 0 0 0 0Total Revenue Requirements 0 0 0 0 0 0 0 0 0 0 0 0 0 0 0 0 0 0 0 0 0 0 0
- - - - - - - - - - - - - - - - - - - - - - -
Case 2 vs. Case 1
Case 2 vs. Case 1 ($ MM)2018 2019 2020 2021 2022 2023 2024 2025 2026 2027 2028 2029 2030 2031 2032 2033 2034 2035 2036 2037 2038 2039 2040
Capital Investment 0 (3) (9) (17) (26) (35) (40) (43) (43) (42) (41) (40) (40) (40) (40) (41) (41) (42) (42) (42) (42) (42) (42)O&M 0 (116) (151) (224) (233) (205) (204) (207) (195) (188) (195) (194) (197) (200) (204) (208) (202) (201) (198) (203) (206) (207) (208)Fuel & Emissions 0 0 0 0 0 0 0 0 0 0 0 0 0 0 0 0 0 0 0 0 0 0 0Energy Purchase 0 0 0 0 0 0 0 0 0 0 0 0 0 0 0 0 0 0 0 0 0 0 0Capacity Purchase 0 0 0 0 0 0 0 0 0 0 0 0 0 0 0 0 0 0 0 0 0 0 0Property Tax, Insurance 0 0 0 0 0 0 0 0 0 0 0 0 0 0 0 0 0 0 0 0 0 0 0Total Revenue Requirements 0 (118) (159.30) (240.26) (259.15) (240.13) (244.82) (249.76) (238.89) (229.74) (236.19) (234.23) (236.76) (239.69) (243.94) (248.56) (243.44) (242.52) (239.65) (244.98) (247.10) (248.46) (250)Cumulative 0 $111 $251 $449 $650 $824 $990 $1,150 $1,293 $1,422 $1,546 $1,662 $1,771 $1,875 $1,974 $2,069 $2,157 $2,238 $2,313 $2,386 $2,454 $2,519 $2,580Annual $111 $140 $198 $200 $174 $167 $159 $143 $129 $124 $116 $110 $104 $99 $95 $87 $81 $75 $72 $68 $65 $61
LTP Base Average Rates (cents/kWh)2016 2017 2018 2019 2020 2021 2022 2023 2024 2025 2026 2027 2028 2029 2030 Average CAGR
2x1 (Base) 0 0 0 0 0 0 0 0 0 0 0 0 0 0 0 0 #DIV/0!
3x1 0.00 0.00 0.00 0.00 0.00 0.00 0.00 0.00 0.00 0.00 0.00 0.00 0.00 0.00 0.00 0.00 0.00 #DIV/0!#REF! #REF! #REF! #REF! #REF! #REF! #REF! #REF! #REF! #REF! #REF! #REF! #REF! #REF! #REF! #REF! #REF! #REF!
0.00 0.00 0.00 0.00 0.00 0.00 0.00 0.00 0.00 0.00 0.00 0.00 0.00 0.00 0.00 0.00 0.00 #DIV/0!
Revenue Requirements Delta Revenue Requirements to Case 1
NOTE: Select a level of Energy Waste Reduction (EWR) or Demand Response (DR) from the Case 1 ‐Modeling inputs tab. The NPV Revenue Requirement of the varying levels of EWR or DR will be calculated in Cell C11 of this
U-20373 | October 28, 2019Direct Testimony of Christopher Neme on behalf of Natural Resources Defense Council
Exhibit: NRD-10; Source: U-20471 WP LKM-650 Revenue Requirement Summary Tab with Energy Efficiency - Tiered Incentive Costs - 2.0% selected in Case 1 - Modeling Inputs Tab Page 1 of 2

DTE Electric CompanyNRD‐10 WP LKM‐650 2018 Rev Req Working ModelRevenue Requirement Summary
Case No.: U‐20471Witness: L.K. Mikulan
Page: 2 of 2
2016-2040 2016-20602041 2042 2043 2044 2045 2046 2047 2048 2049 2050 2051 2052 2053 2054 2055 2056 2057 2058 2059 2060 2061 2062 NPV NPV
38 29 20 12 4 (0) (0) (0) (0) (0) (0) (0) (0) (0) (0) (0) (0) (0) (0) (0) (0) (0) $385 $3920 0 0 0 0 0 0 0 0 0 0 0 0 0 0 0 0 0 0 0 0 0 $2,209 $2,2090 0 0 0 0 0 0 0 0 0 0 0 0 0 0 0 0 0 0 0 0 0 $0 $00 0 0 0 0 0 0 0 0 0 0 0 0 0 0 0 0 0 0 0 0 0 $0 $00 0 0 0 0 0 0 0 0 0 0 0 0 0 0 0 0 0 0 0 0 0 $0 $00 0 0 0 0 0 0 0 0 0 0 0 0 0 0 0 0 0 0 0 0 0 $0 $038 29 20 12 4 (0) (0) (0) (0) (0) (0) (0) (0) (0) (0) (0) (0) (0) (0) (0) (0) (0) $2,594 $2,601
- - - - - - - - - - - - - - - - - - - - - -
2016-2040 2016-2060NPV NPV
0 0 0 0 0 0 0 0 0 0 0 0 0 0 0 0 0 0 0 0 0 0 $0 $00 0 0 0 0 0 0 0 0 0 0 0 0 0 0 0 0 0 0 0 0 0 $0 $00 0 0 0 0 0 0 0 0 0 0 0 0 0 0 0 0 0 0 0 0 0 $0 $00 0 0 0 0 0 0 0 0 0 0 0 0 0 0 0 0 0 0 0 0 0 $0 $00 0 0 0 0 0 0 0 0 0 0 0 0 0 0 0 0 0 0 0 0 0 $0 $00 0 0 0 0 0 0 0 0 0 0 0 0 0 0 0 0 0 0 0 0 0 $0 $00 0 0 0 0 0 0 0 0 0 0 0 0 0 0 0 0 0 0 0 0 0 $0 $0
- - - - - - - - - - - - - - - - - - - - - -
2016-2040 2016-2060 2019-2028NPV NPV NPV
2041 2042 2043 2044 2045 2046 2047 2048 2049 2050 2051 2052 2053 2054 2055 2056 2057 2058 2059 2060 2061 2062 NPV NPV(38) (29) (20) (12) (4) 0 0 0 0 0 0 0 0 0 0 0 0 0 0 0 0 0 ($385) ($392) ($208)0 0 0 0 0 0 0 0 0 0 0 0 0 0 0 0 0 0 0 0 0 0 ($2,209) ($2,209) ($1,440)0 0 0 0 0 0 0 0 0 0 0 0 0 0 0 0 0 0 0 0 0 0 $0 $0 $00 0 0 0 0 0 0 0 0 0 0 0 0 0 0 0 0 0 0 0 0 0 $0 $0 $00 0 0 0 0 0 0 0 0 0 0 0 0 0 0 0 0 0 0 0 0 0 $0 $0 $00 0 0 0 0 0 0 0 0 0 0 0 0 0 0 0 0 0 0 0 0 0 $0 $0 $0
(38) (29) (20) (12) (4) 0 0 0 0 0 0 0 0 0 0 0 0 0 0 0 0 0 (2,594) (2,601) (1,648)$2,588 $2,594 $2,598 $2,601 $2,601 $2,601 $2,601 $2,601 $2,601 $2,601 $2,601 $2,601 $2,601 $2,601 $2,601 $2,601 $2,601 $2,601 $2,601 $2,601 $2,601 $2,601 - -
$9 $6 $4 $2 $1 $0 $0 $0 $0 $0 $0 $0 $0 $0 $0 $0 $0 $0 $0 $0 $0 $0 - -
2016-2040 2016-2060
U-20373 | October 28, 2019Direct Testimony of Christopher Neme on behalf of Natural Resources Defense Council
Exhibit: NRD-10; Source: U-20471 WP LKM-650 Revenue Requirement Summary Tab with Energy Efficiency - Tiered Incentive Costs - 2.0% selected in Case 1 - Modeling Inputs Tab Page 2 of 2

DTE Electric Company WP KLB-26 EWR DSMore Aggregation 1.50% _Tiered Costs - NEW COLUMN WIDTHS: Test Results Case No: U-20471Workpaper: KLB-26
Page: 1 of 3Witness: K. L. Bilyeu
Cost / Benefit Tests For Normal Weather Cost of Conserved kWh, kW, and CCFCost 100% Allocation Nominal Levelized % Allocation
Based Minimum Today Alternate Option Maximum Total Costs / kW Savings $79.9551 $111.7006 100.00%Utility (PAC/UCT) Test 2.29 2.46 2.82 3.17 3.81 11.23 Total Cost / kWh Savings $0.0124 $0.0172 100.00%
TRC Test 2.29 2.46 2.82 3.17 3.81 11.23 Total Costs / CCF Savings $0.0000 $0.0000 100.00%RIM Test 0.42 0.46 0.52 0.58 0.70 2.02 Allocated By Cost-Based Avoided Costs
RIM (Net Fuel) 0.42 0.46 0.52 0.58 0.70 2.02 Allocated Costs / kW Savings $12.0625 $16.8518 15.09%Societal Test 2.88 3.10 3.56 4.00 4.81 14.17 Allocated Costs / kWh Savings $0.0105 $0.0146 84.91%
Participant Test 0.00 0.00 0.00 0.00 0.00 0.00 Allocated Costs / CCF Savings $0.0000 $0.0000 0.00%
Present Values (PVs) of Costs and Benefits Per TestCost Cost
Based Minimum Today Alternate Option Maximum Based Minimum Today Alternate Option MaximumUtility (PAC/UCT) Test Utility (PAC/UTC) Test
Avoided Electric Production $3,321,129,395.29 $2,892,979,489.30 $3,321,129,395.29 $3,729,602,863.12 $4,487,112,561.66 $13,206,380,450.33 Net Benefits $2,201,409,751.37 $2,495,133,682.39 $3,117,477,713.77 $3,711,193,899.25 $4,812,234,246.08 $17,485,705,954.83Avoided Electric Production Adders $0.00 $1,311,966,198.40 $1,506,132,180.77 $1,691,374,898.42 $2,034,905,546.71 $5,989,093,534.22 Levelized Cost (kW) $111.7006 $111.7006 $111.7006 $111.7006 $111.7006 $111.7006
Avoided Electric Capacity $590,064,218.37 $0.00 $0.00 $0.00 $0.00 $0.00 Levelized Cost (kWh) $0.0172 $0.0173 $0.0172 $0.0172 $0.0172 $0.0171Avoided Electric T&D $0.00 $0.00 $0.00 $0.00 $0.00 $0.00 Levelized Cost (CCF) $0.0000 $0.0000 $0.0000 $0.0000 $0.0000 $0.0000
Avoided Electric Ancillary $186,839.43 $158,696.41 $186,839.43 $186,839.43 $186,839.43 $202,672.00Avoided Gas Production $0.00 $0.00 $0.00 $0.00 $0.00 $0.00
Avoided Gas Capacity $0.00 $0.00 $0.00 $0.00 $0.00 $0.00Total $3,911,380,453.09 $4,205,104,384.11 $4,827,448,415.49 $5,421,164,600.97 $6,522,204,947.79 $19,195,676,656.55
Administration Costs $0.00 $0.00 $0.00 $0.00 $0.00 $0.00Implementation / Participation Costs $1,709,970,701.72 $1,709,970,701.72 $1,709,970,701.72 $1,709,970,701.72 $1,709,970,701.72 $1,709,970,701.72
Other / Miscellaneous Costs $0.00 $0.00 $0.00 $0.00 $0.00 $0.00Incentives $0.00 $0.00 $0.00 $0.00 $0.00 $0.00
Total $1,709,970,701.72 $1,709,970,701.72 $1,709,970,701.72 $1,709,970,701.72 $1,709,970,701.72 $1,709,970,701.72Reduced Arrears $0.00 $0.00 $0.00 $0.00 $0.00 $0.00
Test Results 2.29 2.46 2.82 3.17 3.81 11.23TRC Test TRC Test
Avoided Electric Production $3,321,129,395.29 $2,892,979,489.30 $3,321,129,395.29 $3,729,602,863.12 $4,487,112,561.66 $13,206,380,450.33 Net Benefits $2,201,409,751.37 $2,495,133,682.39 $3,117,477,713.77 $3,711,193,899.25 $4,812,234,246.08 $17,485,705,954.83Avoided Electric Production Adders $0.00 $1,311,966,198.40 $1,506,132,180.77 $1,691,374,898.42 $2,034,905,546.71 $5,989,093,534.22 Levelized Cost (kW) $111.7006 $111.7006 $111.7006 $111.7006 $111.7006 $111.7006
Avoided Electric Capacity $590,064,218.37 $0.00 $0.00 $0.00 $0.00 $0.00 Levelized Cost (kWh) $0.0172 $0.0173 $0.0172 $0.0172 $0.0172 $0.0171Avoided Electric T&D $0.00 $0.00 $0.00 $0.00 $0.00 $0.00 Levelized Cost (CCF) $0.0000 $0.0000 $0.0000 $0.0000 $0.0000 $0.0000
Avoided Electric Ancillary $186,839.43 $158,696.41 $186,839.43 $186,839.43 $186,839.43 $202,672.00Avoided Gas Production $0.00 $0.00 $0.00 $0.00 $0.00 $0.00
Avoided Gas Capacity $0.00 $0.00 $0.00 $0.00 $0.00 $0.00Total $3,911,380,453.09 $4,205,104,384.11 $4,827,448,415.49 $5,421,164,600.97 $6,522,204,947.79 $19,195,676,656.55
Administration Costs $0.00 $0.00 $0.00 $0.00 $0.00 $0.00Implementation / Participation Costs $1,709,970,701.72 $1,709,970,701.72 $1,709,970,701.72 $1,709,970,701.72 $1,709,970,701.72 $1,709,970,701.72
Other / Miscellaneous Costs $0.00 $0.00 $0.00 $0.00 $0.00 $0.00Total $1,709,970,701.72 $1,709,970,701.72 $1,709,970,701.72 $1,709,970,701.72 $1,709,970,701.72 $1,709,970,701.72
Reduced Arrears $0.00 $0.00 $0.00 $0.00 $0.00 $0.00Participant or Unit Costs (Net) $0.00 $0.00 $0.00 $0.00 $0.00 $0.00
Participant or Unit Tax Credits (Net) $0.00 $0.00 $0.00 $0.00 $0.00 $0.00Environmental Benefits $0.00 $0.00 $0.00 $0.00 $0.00 $0.00
Other Benefits $0.00 $0.00 $0.00 $0.00 $0.00 $0.00Total $0.00 $0.00 $0.00 $0.00 $0.00 $0.00
Test Results 2.287396181 2.46 2.82 3.17 3.81 11.23RIM Test RIM Test
Avoided Electric Production $3,321,129,395.29 $2,892,979,489.30 $3,321,129,395.29 $3,729,602,863.12 $4,487,112,561.66 $13,206,380,450.33 Net Benefits -$5,450,444,302.37 -$4,949,600,554.74 -$4,534,376,339.97 -$3,940,660,154.49 -$2,839,619,807.67 $9,715,127,200.38Avoided Electric Production Adders $0.00 $1,311,966,198.40 $1,506,132,180.77 $1,691,374,898.42 $2,034,905,546.71 $5,989,093,534.22 Net Benefits (Net Fuel) -$5,450,444,302.37 -$4,949,600,554.74 -$4,534,376,339.97 -$3,940,660,154.49 -$2,839,619,807.67 $9,715,127,200.38
Avoided Electric Capacity $590,064,218.37 $0.00 $0.00 $0.00 $0.00 $0.00Avoided Electric T&D $0.00 $0.00 $0.00 $0.00 $0.00 $0.00
Avoided Electric Ancillary $186,839.43 $158,696.41 $186,839.43 $186,839.43 $186,839.43 $202,672.00Avoided Gas Production $0.00 $0.00 $0.00 $0.00 $0.00 $0.00
Avoided Gas Capacity $0.00 $0.00 $0.00 $0.00 $0.00 $0.00Total $3,911,380,453.09 $4,205,104,384.11 $4,827,448,415.49 $5,421,164,600.97 $6,522,204,947.79 $19,195,676,656.55
Administration Costs $0.00 $0.00 $0.00 $0.00 $0.00 $0.00Implementation / Participation Costs $1,709,970,701.72 $1,709,970,701.72 $1,709,970,701.72 $1,709,970,701.72 $1,709,970,701.72 $1,709,970,701.72
Other / Miscellaneous Costs $0.00 $0.00 $0.00 $0.00 $0.00 $0.00Incentives $0.00 $0.00 $0.00 $0.00 $0.00 $0.00
Total $1,709,970,701.72 $1,709,970,701.72 $1,709,970,701.72 $1,709,970,701.72 $1,709,970,701.72 $1,709,970,701.72Reduced Arrears $0.00 $0.00 $0.00 $0.00 $0.00 $0.00
Electric Lost Revenue $7,651,854,053.74 $7,444,734,237.13 $7,651,854,053.74 $7,651,854,053.74 $7,651,854,053.74 $7,770,578,754.45Gas Lost Revenue $0.00 $0.00 $0.00 $0.00 $0.00 $0.00
Total $7,651,854,053.74 $7,444,734,237.13 $7,651,854,053.74 $7,651,854,053.74 $7,651,854,053.74 $7,770,578,754.45Electric Lost Revenue (Net Fuel) $7,651,854,053.74 $7,444,734,237.13 $7,651,854,053.74 $7,651,854,053.74 $7,651,854,053.74 $7,770,578,754.45
Gas Lost Revenue (Net Fuel) $0.00 $0.00 $0.00 $0.00 $0.00 $0.00Total $7,651,854,053.74 $7,444,734,237.13 $7,651,854,053.74 $7,651,854,053.74 $7,651,854,053.74 $7,770,578,754.45
Test Results 0.42 0.46 0.52 0.58 0.70 2.02Societal Test 0.42 0.46 0.52 0.58 0.70 2.02 Societal Test
Avoided Electric Production $6,112,440,878.61 $5,324,402,404.83 $6,112,440,878.61 $6,864,128,475.60 $8,258,677,870.95 $24,303,348,285.26 Net Benefits $4,693,331,679.84 $5,245,769,172.65 $6,391,234,446.29 $7,483,812,368.52 $9,510,789,914.66 $32,831,747,188.24Avoided Electric Production Adders $0.00 $2,414,616,490.59 $2,771,991,938.45 $3,112,882,263.68 $3,745,310,414.48 $11,021,568,447.37 Levelized Cost (kW) $162.8854 $162.8854 $162.8854 $162.8854 $162.8854 $162.8854
Avoided Electric Capacity $1,074,089,172.00 $0.00 $0.00 $0.00 $0.00 $0.00 Levelized Cost (kWh) $0.0250 $0.0252 $0.0250 $0.0250 $0.0250 $0.0249Avoided Electric T&D $0.00 $0.00 $0.00 $0.00 $0.00 $0.00 Levelized Cost (CCF) $0.0000 $0.0000 $0.0000 $0.0000 $0.0000 $0.0000
Avoided Electric Ancillary $334,226.39 $282,874.38 $334,226.39 $334,226.39 $334,226.39 $363,052.77Avoided Gas Production $0.00 $0.00 $0.00 $0.00 $0.00 $0.00
Avoided Gas Capacity $0.00 $0.00 $0.00 $0.00 $0.00 $0.00Total $7,186,864,276.99 $7,739,301,769.81 $8,884,767,043.44 $9,977,344,965.67 $12,004,322,511.82 $35,325,279,785.40
Administration Costs $0.00 $0.00 $0.00 $0.00 $0.00 $0.00Implementation / Participation Costs $2,493,532,597.15 $2,493,532,597.15 $2,493,532,597.15 $2,493,532,597.15 $2,493,532,597.15 $2,493,532,597.15
Other / Miscellaneous Costs $0.00 $0.00 $0.00 $0.00 $0.00 $0.00Total $2,493,532,597.15 $2,493,532,597.15 $2,493,532,597.15 $2,493,532,597.15 $2,493,532,597.15 $2,493,532,597.15
Reduced Arrears $0.00 $0.00 $0.00 $0.00 $0.00 $0.00Participant or Unit Costs (Net) $0.00 $0.00 $0.00 $0.00 $0.00 $0.00
Environmental Benefits $0.00 $0.00 $0.00 $0.00 $0.00 $0.00Other Benefits $0.00 $0.00 $0.00 $0.00 $0.00 $0.00
Total $0.00 $0.00 $0.00 $0.00 $0.00 $0.00Test Results 2.88 3.10 3.56 4.00 4.81 14.17
Participant Test Participant TestIncentives $0.00 $0.00 $0.00 $0.00 $0.00 $0.00 Net Benefits $3,021,338,687.62 $2,943,553,977.21 $3,021,338,687.62 $3,021,338,687.62 $3,021,338,687.62 $3,065,796,845.75
Participant or Unit Costs (Gross) $0.00 $0.00 $0.00 $0.00 $0.00 $0.00Participant or Unit Tax Credits (Gross) $0.00 $0.00 $0.00 $0.00 $0.00 $0.00
Electric Bill Savings (Gross) $3,021,338,687.62 $2,943,553,977.21 $3,021,338,687.62 $3,021,338,687.62 $3,021,338,687.62 $3,065,796,845.75Gas Bill Savings (Gross) $0.00 $0.00 $0.00 $0.00 $0.00 $0.00
Total $3,021,338,687.62 $2,943,553,977.21 $3,021,338,687.62 $3,021,338,687.62 $3,021,338,687.62 $3,065,796,845.75Test Results #DIV/0! #DIV/0! #DIV/0! #DIV/0! #DIV/0! #DIV/0!
Present Values (PVs) of Impacts
Market-Based
Market-Based Market-Based
U-20373 | October 28, 2019 Direct Testimony of Christopher Neme on behalf of Natural Resources Defense Council
Exhibit: NRD-11; Source: U-20471 WP KLB-26 EWR DSMore Aggregation 1.50%_Tiered Costs Page 1 of 3

DTE Electric Company WP KLB-26 EWR DSMore Aggregation 1.50% _Tiered Costs - NEW COLUMN WIDTHS: Test Results Case No: U-20471Workpaper: KLB-26
Page: 2 of 3Witness: K. L. Bilyeu
CostBased Minimum Today Alternate Option Maximum
kW (Discounted) 15308511.9781 15308511.9781 15308511.9781 15308511.9781 15308511.9781 15308511.9781kWh (Discounted) 99611374221.9300 99039045000.9580 99611374221.9300 99611374221.9300 99611374221.9300 100210542948.0380CCF (Discounted) 0.0000 0.0000 0.0000 0.0000 0.0000 0.0000
kW (Undiscounted) 21386626.0635 21386626.0635 21386626.0635 21386626.0635 21386626.0635 21386626.0635kWh (Undiscounted) 138219814676.0590 137410733597.3780 138219814676.0590 138219814676.0590 138219814676.0590 139062624792.7220CCF (Undiscounted) 0.0000 0.0000 0.0000 0.0000 0.0000 0.0000
Market-Based
U-20373 | October 28, 2019 Direct Testimony of Christopher Neme on behalf of Natural Resources Defense Council
Exhibit: NRD-11; Source: U-20471 WP KLB-26 EWR DSMore Aggregation 1.50%_Tiered Costs Page 2 of 3

DTE Electric Company WP KLB-26 EWR DSMore Aggregation 1.50% _Tiered Costs - NEW COLUMN WIDTHS: Financial Reports Case No: U-20471Workpaper: KLB-26
Page: 3 of 3Witness: K. L. Bilyeu
Participation and Total Participant Costs
Cumulative CumulativeNew New Cumulative Cumulative Participants Participants One-Time Annual Total One-Time Annual Total
Year Participants Free Riders Participants Free Riders (net free riders) (net free/drop-out) Investment Investment Costs Investment Investment Costs1 706094484 0 706094484 0 706094484 706094484 $0.00 $0.00 $0.00 $0.00 $0.00 $0.002 703727407 0 1355398074 0 1355398074 1355398074 $0.00 $0.00 $0.00 $0.00 $0.00 $0.003 703884877 0 2026293895 0 2026293895 2026293895 $0.00 $0.00 $0.00 $0.00 $0.00 $0.004 704892640 0 2706218819 0 2706218819 2706218819 $0.00 $0.00 $0.00 $0.00 $0.00 $0.005 704217845 0 3267454973 0 3267454973 3267454973 $0.00 $0.00 $0.00 $0.00 $0.00 $0.006 703820552 0 3799901580 0 3799901580 3799901580 $0.00 $0.00 $0.00 $0.00 $0.00 $0.007 702959873 0 4335456303 0 4335456303 4335456303 $0.00 $0.00 $0.00 $0.00 $0.00 $0.008 702559764 0 4846252068 0 4846252068 4846252068 $0.00 $0.00 $0.00 $0.00 $0.00 $0.009 702362541 0 5146349595 0 5146349595 5146349595 $0.00 $0.00 $0.00 $0.00 $0.00 $0.0010 702007711 0 5366979026 0 5366979026 5366979026 $0.00 $0.00 $0.00 $0.00 $0.00 $0.0011 702076979 0 5665374463 0 5665374463 5665374463 $0.00 $0.00 $0.00 $0.00 $0.00 $0.0012 702105795 0 5825334451 0 5825334451 5825334451 $0.00 $0.00 $0.00 $0.00 $0.00 $0.0013 701993811 0 5881704100 0 5881704100 5881704100 $0.00 $0.00 $0.00 $0.00 $0.00 $0.0014 701847217 0 5749464132 0 5749464132 5749464132 $0.00 $0.00 $0.00 $0.00 $0.00 $0.0015 701774464 0 5596852072 0 5596852072 5596852072 $0.00 $0.00 $0.00 $0.00 $0.00 $0.0016 701997792 0 5600625066 0 5600625066 5600625066 $0.00 $0.00 $0.00 $0.00 $0.00 $0.0017 701898792 0 5515813480 0 5515813480 5515813480 $0.00 $0.00 $0.00 $0.00 $0.00 $0.0018 701834423 0 5643023033 0 5643023033 5643023033 $0.00 $0.00 $0.00 $0.00 $0.00 $0.0019 701499136 0 5701158614 0 5701158614 5701158614 $0.00 $0.00 $0.00 $0.00 $0.00 $0.0020 701456320 0 5680819026 0 5680819026 5680819026 $0.00 $0.00 $0.00 $0.00 $0.00 $0.0021 701375084 0 5846301640 0 5846301640 5846301640 $0.00 $0.00 $0.00 $0.00 $0.00 $0.0022 701318087 0 6017047563 0 6017047563 6017047563 $0.00 $0.00 $0.00 $0.00 $0.00 $0.0023 0 0 5364814478 0 5364814478 5364814478 $0.00 $0.00 $0.00 $0.00 $0.00 $0.0024 0 0 4753402555 0 4753402555 4753402555 $0.00 $0.00 $0.00 $0.00 $0.00 $0.0025 0 0 3912279763 0 3912279763 3912279763 $0.00 $0.00 $0.00 $0.00 $0.00 $0.00
Totals 15,457,705,594 0 116,310,413,253 0 116,310,413,253 116,310,413,253 $0 $0 $0 $0 $0 $0
Impacts and Savings (Losses Included) Impacts and Savings (No Losses) Incremental Participant or Unit Impacts and Savings (Losses Included) Incremental Participant or Unit Impacts and Savings (No Losses)
Year kW kW (net) Summer Coin kW Summer Coin (net) Winter Coin kW Winter Coin (net) kWh kWh (net) kW kW (net) Summer Coin kW Summer Coin (net)Winter Coin kWWinter Coin (net kWh kWh (net) kW kW (net)Summer Coin kWSummer Coin (netWinter Coin kWWinter Coin (net kWh kWh (net) CCF CCF (net)CCFCCF (net)CCFCCF (net) Year kW kW (net)Summer Coin kWSummer Coin (netWinter Coin kWWinter Coin (net kWh kWh (net) kW kW (net) Summer Coin kWSummer Coin (netWinter Coin kWWinter Coin (net kWh kWh (net) kW kW (net)Summer Coin kWSummer Coin (netWinter Coin kWWinter Coin (net kWh kWh (net) CCF CCF (net)CCFCCF (net)CCFCCF (net) Year kW kW (net)Summer Coin kWSummer Coin (netWinter Coin kWWinter Coin (net kWh kWh (net) CCFCCF (net) Year kW kW (net)Summer Coin kWSummer Coin (netWinter Coin kWWinter Coin (net kWh kWh (net) CCFCCF (net)1 0.000 0.000 0.000 0.000 0.000 0.000 1.06 1.06 143,319 143,319 101,439 101,439 0 0 750,644,868 750,644,868 143,319 143,319 101,439 101,439 0 0 750,644,868 750,644,868 0.00 0.00 0 0 0 0 1 0.000 0.000 0.000 0.000 0.000 0.000 1.00 1.00 134,194 134,194 94,981 94,981 0 0 702,851,000 702,851,000 134,194 134,194 94,981 94,981 0 0 702,851,000 702,851,000 0.00 0.00 0 0 0 0 1 143,319 143,319 101,439 101,439 0 0 750,644,868 750,644,868 0 0 1 134,194 134,194 94,981 94,981 0 0 702,851,000 702,851,000 0 02 0.000 0.000 0.000 0.000 0.000 0.000 1.06 1.06 273,029 273,029 198,253 198,253 0 0 1,441,163,979 1,441,163,979 137,046 137,046 103,149 103,149 0 0 748,528,947 748,528,947 0.00 0.00 0 0 0 0 2 0.000 0.000 0.000 0.000 0.000 0.000 1.00 1.00 255,645 255,645 185,630 185,630 0 0 1,349,404,475 1,349,404,475 128,321 128,321 96,581 96,581 0 0 700,869,800 700,869,800 0.00 0.00 0 0 0 0 2 137,046 137,046 103,149 103,149 0 0 748,528,947 748,528,947 0 0 2 128,321 128,321 96,581 96,581 0 0 700,869,800 700,869,800 0 03 0.000 0.000 0.000 0.000 0.000 0.000 1.06 1.06 397,830 397,830 301,273 301,273 0 0 2,154,836,094 2,154,836,094 129,247 129,247 106,861 106,861 0 0 748,834,841 748,834,841 0.00 0.00 0 0 0 0 3 0.000 0.000 0.000 0.000 0.000 0.000 1.00 1.00 372,500 372,500 282,091 282,091 0 0 2,017,636,792 2,017,636,792 121,018 121,018 100,057 100,057 0 0 701,156,218 701,156,218 0.00 0.00 0 0 0 0 3 129,247 129,247 106,861 106,861 0 0 748,834,841 748,834,841 0 0 3 121,018 121,018 100,057 100,057 0 0 701,156,218 701,156,218 0 04 0.000 0.000 0.000 0.000 0.000 0.000 1.06 1.06 516,448 516,448 408,753 408,753 0 0 2,878,250,469 2,878,250,469 121,984 121,984 110,386 110,386 0 0 750,027,230 750,027,230 0.00 0.00 0 0 0 0 4 0.000 0.000 0.000 0.000 0.000 0.000 1.00 1.00 483,566 483,566 382,728 382,728 0 0 2,694,991,076 2,694,991,076 114,217 114,217 103,358 103,358 0 0 702,272,687 702,272,687 0.00 0.00 0 0 0 0 4 121,984 121,984 110,386 110,386 0 0 750,027,230 750,027,230 0 0 4 114,217 114,217 103,358 103,358 0 0 702,272,687 702,272,687 0 05 0.000 0.000 0.000 0.000 0.000 0.000 1.06 1.06 616,407 616,407 498,077 498,077 0 0 3,475,649,918 3,475,649,918 121,893 121,893 109,943 109,943 0 0 748,825,298 748,825,298 0.00 0.00 0 0 0 0 5 0.000 0.000 0.000 0.000 0.000 0.000 1.00 1.00 577,160 577,160 466,364 466,364 0 0 3,254,353,856 3,254,353,856 114,132 114,132 102,943 102,943 0 0 701,147,283 701,147,283 0.00 0.00 0 0 0 0 5 121,893 121,893 109,943 109,943 0 0 748,825,298 748,825,298 0 0 5 114,132 114,132 102,943 102,943 0 0 701,147,283 701,147,283 0 06 0.000 0.000 0.000 0.000 0.000 0.000 1.06 1.06 714,030 714,030 584,919 584,919 0 0 4,041,949,302 4,041,949,302 124,285 124,285 111,440 111,440 0 0 748,048,936 748,048,936 0.00 0.00 0 0 0 0 6 0.000 0.000 0.000 0.000 0.000 0.000 1.00 1.00 668,568 668,568 547,677 547,677 0 0 3,784,596,725 3,784,596,725 116,372 116,372 104,345 104,345 0 0 700,420,352 700,420,352 0.00 0.00 0 0 0 0 6 124,285 124,285 111,440 111,440 0 0 748,048,936 748,048,936 0 0 6 116,372 116,372 104,345 104,345 0 0 700,420,352 700,420,352 0 07 0.000 0.000 0.000 0.000 0.000 0.000 1.06 1.06 813,921 813,921 673,218 673,218 0 0 4,611,644,859 4,611,644,859 125,771 125,771 112,250 112,250 0 0 747,198,137 747,198,137 0.00 0.00 0 0 0 0 7 0.000 0.000 0.000 0.000 0.000 0.000 1.00 1.00 762,099 762,099 630,354 630,354 0 0 4,318,019,531 4,318,019,531 117,763 117,763 105,103 105,103 0 0 699,623,724 699,623,724 0.00 0.00 0 0 0 0 7 125,771 125,771 112,250 112,250 0 0 747,198,137 747,198,137 0 0 7 117,763 117,763 105,103 105,103 0 0 699,623,724 699,623,724 0 08 0.000 0.000 0.000 0.000 0.000 0.000 1.06 1.06 907,738 907,738 755,682 755,682 0 0 5,154,909,070 5,154,909,070 123,671 123,671 109,768 109,768 0 0 746,777,287 746,777,287 0.00 0.00 0 0 0 0 8 0.000 0.000 0.000 0.000 0.000 0.000 1.00 1.00 849,942 849,942 707,567 707,567 0 0 4,826,693,886 4,826,693,886 115,797 115,797 102,779 102,779 0 0 699,229,670 699,229,670 0.00 0.00 0 0 0 0 8 123,671 123,671 109,768 109,768 0 0 746,777,287 746,777,287 0 0 8 115,797 115,797 102,779 102,779 0 0 699,229,670 699,229,670 0 09 0.000 0.000 0.000 0.000 0.000 0.000 1.06 1.06 971,555 971,555 812,270 812,270 0 0 5,473,277,401 5,473,277,401 123,773 123,773 110,287 110,287 0 0 746,555,481 746,555,481 0.00 0.00 0 0 0 0 9 0.000 0.000 0.000 0.000 0.000 0.000 1.00 1.00 909,695 909,695 760,552 760,552 0 0 5,124,791,574 5,124,791,574 115,892 115,892 103,265 103,265 0 0 699,021,986 699,021,986 0.00 0.00 0 0 0 0 9 123,773 123,773 110,287 110,287 0 0 746,555,481 746,555,481 0 0 9 115,892 115,892 103,265 103,265 0 0 699,021,986 699,021,986 0 010 0.000 0.000 0.000 0.000 0.000 0.000 1.06 1.06 1,020,175 1,020,175 856,870 856,870 0 0 5,706,662,806 5,706,662,806 121,593 121,593 110,910 110,910 0 0 746,374,617 746,374,617 0.00 0.00 0 0 0 0 10 0.000 0.000 0.000 0.000 0.000 0.000 1.00 1.00 955,220 955,220 802,313 802,313 0 0 5,343,317,234 5,343,317,234 113,851 113,851 103,848 103,848 0 0 698,852,638 698,852,638 0.00 0.00 0 0 0 0 10 121,593 121,593 110,910 110,910 0 0 746,374,617 746,374,617 0 0 10 113,851 113,851 103,848 103,848 0 0 698,852,638 698,852,638 0 011 0.000 0.000 0.000 0.000 0.000 0.000 1.06 1.06 1,080,055 1,080,055 911,364 911,364 0 0 6,022,798,884 6,022,798,884 121,690 121,690 111,318 111,318 0 0 746,245,366 746,245,366 0.00 0.00 0 0 0 0 11 0.000 0.000 0.000 0.000 0.000 0.000 1.00 1.00 1,011,287 1,011,287 853,337 853,337 0 0 5,639,324,797 5,639,324,797 113,942 113,942 104,230 104,230 0 0 698,731,616 698,731,616 0.00 0.00 0 0 0 0 11 121,690 121,690 111,318 111,318 0 0 746,245,366 746,245,366 0 0 11 113,942 113,942 104,230 104,230 0 0 698,731,616 698,731,616 0 012 0.000 0.000 0.000 0.000 0.000 0.000 1.06 1.06 1,119,407 1,119,407 947,541 947,541 0 0 6,190,420,258 6,190,420,258 121,689 121,689 111,556 111,556 0 0 746,163,836 746,163,836 0.00 0.00 0 0 0 0 12 0.000 0.000 0.000 0.000 0.000 0.000 1.00 1.00 1,048,134 1,048,134 887,211 887,211 0 0 5,796,273,650 5,796,273,650 113,941 113,941 104,453 104,453 0 0 698,655,277 698,655,277 0.00 0.00 0 0 0 0 12 121,689 121,689 111,556 111,556 0 0 746,163,836 746,163,836 0 0 12 113,941 113,941 104,453 104,453 0 0 698,655,277 698,655,277 0 013 0.000 0.000 0.000 0.000 0.000 0.000 1.06 1.06 1,132,832 1,132,832 960,903 960,903 0 0 6,248,943,029 6,248,943,029 102,272 102,272 93,851 93,851 0 0 686,104,700 686,104,700 0.00 0.00 0 0 0 0 13 0.000 0.000 0.000 0.000 0.000 0.000 0.99 0.99 1,060,704 1,060,704 899,722 899,722 0 0 5,851,070,252 5,851,070,252 95,760 95,760 87,875 87,875 0 0 642,420,131 642,420,131 0.00 0.00 0 0 0 0 13 118,807 118,807 110,057 110,057 0 0 746,156,289 746,156,289 0 0 13 111,243 111,243 103,049 103,049 0 0 698,648,211 698,648,211 0 014 0.000 0.000 0.000 0.000 0.000 0.000 1.06 1.06 1,120,709 1,120,709 943,854 943,854 0 0 6,110,524,171 6,110,524,171 102,221 102,221 93,735 93,735 0 0 686,173,216 686,173,216 0.00 0.00 0 0 0 0 14 0.000 0.000 0.000 0.000 0.000 0.000 1.00 1.00 1,049,353 1,049,353 883,759 883,759 0 0 5,721,464,580 5,721,464,580 95,712 95,712 87,767 87,767 0 0 642,484,284 642,484,284 0.00 0.00 0 0 0 0 14 118,709 118,709 109,895 109,895 0 0 746,055,532 746,055,532 0 0 14 111,151 111,151 102,898 102,898 0 0 698,553,869 698,553,869 0 015 0.000 0.000 0.000 0.000 0.000 0.000 1.06 1.06 1,074,586 1,074,586 932,275 932,275 0 0 5,947,998,612 5,947,998,612 102,061 102,061 93,719 93,719 0 0 686,079,072 686,079,072 0.00 0.00 0 0 0 0 15 0.000 0.000 0.000 0.000 0.000 0.000 1.00 1.00 1,006,166 1,006,166 872,917 872,917 0 0 5,569,287,090 5,569,287,090 95,563 95,563 87,752 87,752 0 0 642,396,135 642,396,135 0.00 0.00 0 0 0 0 15 118,557 118,557 109,886 109,886 0 0 745,985,859 745,985,859 0 0 15 111,008 111,008 102,889 102,889 0 0 698,488,632 698,488,632 0 016 0.000 0.000 0.000 0.000 0.000 0.000 1.06 1.06 1,059,565 1,059,565 941,253 941,253 0 0 5,951,594,770 5,951,594,770 103,337 103,337 92,431 92,431 0 0 685,874,168 685,874,168 0.00 0.00 0 0 0 0 16 0.000 0.000 0.000 0.000 0.000 0.000 1.00 1.00 992,102 992,102 881,323 881,323 0 0 5,572,654,279 5,572,654,279 96,757 96,757 86,546 86,546 0 0 642,204,277 642,204,277 0.00 0.00 0 0 0 0 16 119,858 119,858 108,624 108,624 0 0 745,876,347 745,876,347 0 0 16 112,227 112,227 101,708 101,708 0 0 698,386,092 698,386,092 0 017 0.000 0.000 0.000 0.000 0.000 0.000 1.06 1.06 1,036,336 1,036,336 932,716 932,716 0 0 5,860,662,596 5,860,662,596 103,243 103,243 92,451 92,451 0 0 685,787,357 685,787,357 0.00 0.00 0 0 0 0 17 0.000 0.000 0.000 0.000 0.000 0.000 0.99 0.99 970,352 970,352 873,330 873,330 0 0 5,487,511,794 5,487,511,794 96,669 96,669 86,564 86,564 0 0 642,122,994 642,122,994 0.00 0.00 0 0 0 0 17 119,738 119,738 108,617 108,617 0 0 745,693,381 745,693,381 0 0 17 112,114 112,114 101,702 101,702 0 0 698,214,776 698,214,776 0 018 0.000 0.000 0.000 0.000 0.000 0.000 1.06 1.06 1,054,246 1,054,246 950,834 950,834 0 0 5,994,675,116 5,994,675,116 103,803 103,803 92,848 92,848 0 0 685,704,665 685,704,665 0.00 0.00 0 0 0 0 18 0.000 0.000 0.000 0.000 0.000 0.000 0.99 0.99 987,122 987,122 890,294 890,294 0 0 5,612,991,682 5,612,991,682 97,194 97,194 86,936 86,936 0 0 642,045,567 642,045,567 0.00 0.00 0 0 0 0 18 120,281 120,281 108,998 108,998 0 0 745,548,580 745,548,580 0 0 18 112,623 112,623 102,058 102,058 0 0 698,079,195 698,079,195 0 019 0.000 0.000 0.000 0.000 0.000 0.000 1.06 1.06 1,062,364 1,062,364 960,626 960,626 0 0 6,055,661,032 6,055,661,032 103,983 103,983 92,964 92,964 0 0 685,574,708 685,574,708 0.00 0.00 0 0 0 0 19 0.000 0.000 0.000 0.000 0.000 0.000 0.99 0.99 994,723 994,723 899,463 899,463 0 0 5,670,094,600 5,670,094,600 97,362 97,362 87,045 87,045 0 0 641,923,884 641,923,884 0.00 0.00 0 0 0 0 19 120,443 120,443 109,096 109,096 0 0 745,350,559 745,350,559 0 0 19 112,774 112,774 102,150 102,150 0 0 697,893,782 697,893,782 0 020 0.000 0.000 0.000 0.000 0.000 0.000 1.06 1.06 1,058,755 1,058,755 957,483 957,483 0 0 6,034,492,994 6,034,492,994 103,750 103,750 92,964 92,964 0 0 685,468,114 685,468,114 0.00 0.00 0 0 0 0 20 0.000 0.000 0.000 0.000 0.000 0.000 0.99 0.99 991,344 991,344 896,520 896,520 0 0 5,650,274,339 5,650,274,339 97,144 97,144 87,045 87,045 0 0 641,824,077 641,824,077 0.00 0.00 0 0 0 0 20 120,200 120,200 109,087 109,087 0 0 745,210,297 745,210,297 0 0 20 112,547 112,547 102,141 102,141 0 0 697,762,451 697,762,451 0 021 0.000 0.000 0.000 0.000 0.000 0.000 1.06 1.06 1,078,017 1,078,017 978,260 978,260 0 0 6,209,090,013 6,209,090,013 103,741 103,741 92,956 92,956 0 0 685,399,639 685,399,639 0.00 0.00 0 0 0 0 21 0.000 0.000 0.000 0.000 0.000 0.000 0.99 0.99 1,009,379 1,009,379 915,974 915,974 0 0 5,813,754,693 5,813,754,693 97,135 97,135 87,037 87,037 0 0 641,759,961 641,759,961 0.00 0.00 0 0 0 0 21 120,186 120,186 109,074 109,074 0 0 745,124,077 745,124,077 0 0 21 112,534 112,534 102,129 102,129 0 0 697,681,720 697,681,720 0 022 0.000 0.000 0.000 0.000 0.000 0.000 1.06 1.06 1,100,254 1,100,254 1,003,115 1,003,115 0 0 6,389,516,565 6,389,516,565 103,735 103,735 92,951 92,951 0 0 685,353,614 685,353,614 0.00 0.00 0 0 0 0 22 0.000 0.000 0.000 0.000 0.000 0.000 0.99 0.99 1,030,201 1,030,201 939,246 939,246 0 0 5,982,693,412 5,982,693,412 97,130 97,130 87,032 87,032 0 0 641,716,867 641,716,867 0.00 0.00 0 0 0 0 22 120,176 120,176 109,064 109,064 0 0 745,063,583 745,063,583 0 0 22 112,524 112,524 102,120 102,120 0 0 697,625,078 697,625,078 0 023 0.000 0.000 0.000 0.000 0.000 0.000 1.06 1.06 985,371 985,371 902,054 902,054 0 0 5,696,228,093 5,696,228,093 (16,438) (16,438) (16,111) (16,111) 0 0 (59,699,629) (59,699,629) 0.00 0.00 0 0 0 0 23 0.000 0.000 0.000 0.000 0.000 0.000 0.99 0.99 922,632 922,632 844,620 844,620 0 0 5,333,546,903 5,333,546,903 (15,392) (15,392) (15,085) (15,085) 0 0 (55,898,529) (55,898,529) 0.00 0.00 0 0 0 0 23 0 0 0 0 0 0 0 0 0 0 23 0 0 0 0 0 0 0 0 0 024 0.000 0.000 0.000 0.000 0.000 0.000 1.06 1.06 876,386 876,386 798,848 798,848 0 0 5,047,301,731 5,047,301,731 (16,437) (16,437) (16,109) (16,109) 0 0 (59,693,107) (59,693,107) 0.00 0.00 0 0 0 0 24 0.000 0.000 0.000 0.000 0.000 0.000 0.99 0.99 820,587 820,587 747,985 747,985 0 0 4,725,937,950 4,725,937,950 (15,390) (15,390) (15,084) (15,084) 0 0 (55,892,422) (55,892,422) 0.00 0.00 0 0 0 0 24 0 0 0 0 0 0 0 0 0 0 24 0 0 0 0 0 0 0 0 0 025 0.000 0.000 0.000 0.000 0.000 0.000 1.06 1.06 732,929 732,929 664,640 664,640 0 0 4,153,913,227 4,153,913,227 (16,437) (16,437) (16,109) (16,109) 0 0 (59,692,503) (59,692,503) 0.00 0.00 0 0 0 0 25 0.000 0.000 0.000 0.000 0.000 0.000 0.99 0.99 686,263 686,263 622,322 622,322 0 0 3,889,431,861 3,889,431,861 (15,390) (15,390) (15,083) (15,083) 0 0 (55,891,857) (55,891,857) 0.00 0.00 0 0 0 0 25 0 0 0 0 0 0 0 0 0 0 25 0 0 0 0 0 0 0 0 0 0
Totals 27 27 123,602,809,858 123,602,809,858 15,652,658,859 15,652,658,859 0 0 0 0 0 0 Totals 25 25 115,732,968,032 115,732,968,032 14,656,047,621 14,656,047,621 0 0 0 0 0 0 Totals Totals
Lost Revenue Dollars
Net Fuel Net Fuel Net FuelNet Free/Drop-Out Net Free/Drop-Out Net Free/Drop-Out Net Free/Drop-Out Net Free/Drop-Ou Net Free/Drop-Out
Year Electric Gas Total Electric Gas Total Electric Gas Total1 $0.11 $0.00 $0.11 $78,465,802.05 $0.00 $78,465,802.05 $78,465,802.05 $0.00 $78,465,802.052 $0.11 $0.00 $0.11 $150,240,684.20 $0.00 $150,240,684.20 $150,240,684.20 $0.00 $150,240,684.203 $0.11 $0.00 $0.11 $227,581,720.09 $0.00 $227,581,720.09 $227,581,720.09 $0.00 $227,581,720.094 $0.11 $0.00 $0.11 $309,174,456.58 $0.00 $309,174,456.58 $309,174,456.58 $0.00 $309,174,456.585 $0.12 $0.00 $0.12 $382,258,604.91 $0.00 $382,258,604.91 $382,258,604.91 $0.00 $382,258,604.916 $0.12 $0.00 $0.12 $455,047,606.65 $0.00 $455,047,606.65 $455,047,606.65 $0.00 $455,047,606.657 $0.12 $0.00 $0.12 $532,189,740.21 $0.00 $532,189,740.21 $532,189,740.21 $0.00 $532,189,740.218 $0.13 $0.00 $0.13 $608,140,293.62 $0.00 $608,140,293.62 $608,140,293.62 $0.00 $608,140,293.629 $0.13 $0.00 $0.13 $663,607,483.87 $0.00 $663,607,483.87 $663,607,483.87 $0.00 $663,607,483.8710 $0.13 $0.00 $0.13 $710,759,901.26 $0.00 $710,759,901.26 $710,759,901.26 $0.00 $710,759,901.2611 $0.14 $0.00 $0.14 $768,498,902.95 $0.00 $768,498,902.95 $768,498,902.95 $0.00 $768,498,902.9512 $0.14 $0.00 $0.14 $809,856,271.99 $0.00 $809,856,271.99 $809,856,271.99 $0.00 $809,856,271.9913 $0.14 $0.00 $0.14 $833,707,179.28 $0.00 $833,707,179.28 $833,707,179.28 $0.00 $833,707,179.2814 $0.15 $0.00 $0.15 $836,113,513.22 $0.00 $836,113,513.22 $836,113,513.22 $0.00 $836,113,513.2215 $0.15 $0.00 $0.15 $825,367,430.37 $0.00 $825,367,430.37 $825,367,430.37 $0.00 $825,367,430.3716 $0.15 $0.00 $0.15 $839,612,450.80 $0.00 $839,612,450.80 $839,612,450.80 $0.00 $839,612,450.8017 $0.15 $0.00 $0.15 $830,284,829.75 $0.00 $830,284,829.75 $830,284,829.75 $0.00 $830,284,829.7518 $0.15 $0.00 $0.15 $859,850,104.24 $0.00 $859,850,104.24 $859,850,104.24 $0.00 $859,850,104.2419 $0.15 $0.00 $0.15 $882,060,176.18 $0.00 $882,060,176.18 $882,060,176.18 $0.00 $882,060,176.1820 $0.16 $0.00 $0.16 $896,522,962.72 $0.00 $896,522,962.72 $896,522,962.72 $0.00 $896,522,962.7221 $0.16 $0.00 $0.16 $936,448,094.97 $0.00 $936,448,094.97 $936,448,094.97 $0.00 $936,448,094.9722 $0.16 $0.00 $0.16 $977,310,929.23 $0.00 $977,310,929.23 $977,310,929.23 $0.00 $977,310,929.2323 $0.16 $0.00 $0.16 $882,972,712.34 $0.00 $882,972,712.34 $882,972,712.34 $0.00 $882,972,712.3424 $0.17 $0.00 $0.17 $803,667,651.55 $0.00 $803,667,651.55 $803,667,651.55 $0.00 $803,667,651.5525 $0.17 $0.00 $0.17 $671,632,091.99 $0.00 $671,632,091.99 $671,632,091.99 $0.00 $671,632,091.99
Totals $3.50 $0.00 $3.50 $16,771,371,595.05 $0.00 $16,771,371,595.05 $16,771,371,595.05 $0.00 $16,771,371,595.05
Utility Program Costs
Year Administration Implementation Incentives Other Total $/kW $/kW (net) $/kWh $/kWh (net) $/CCF $/CCF (net)1 $0.00 $135,998,068.32 $0.00 $0.00 $135,998,068.32 $1,340.68 $1,340.68 $0.18 $0.18 $0.00 $0.002 $0.00 $132,970,641.38 $0.00 $0.00 $132,970,641.38 $670.71 $670.71 $0.09 $0.09 $0.00 $0.003 $0.00 $137,133,788.75 $0.00 $0.00 $137,133,788.75 $455.18 $455.18 $0.06 $0.06 $0.00 $0.004 $0.00 $142,409,738.33 $0.00 $0.00 $142,409,738.33 $348.40 $348.40 $0.05 $0.05 $0.00 $0.005 $0.00 $138,626,165.60 $0.00 $0.00 $138,626,165.60 $278.32 $278.32 $0.04 $0.04 $0.00 $0.006 $0.00 $132,731,524.42 $0.00 $0.00 $132,731,524.42 $226.92 $226.92 $0.03 $0.03 $0.00 $0.007 $0.00 $134,385,911.09 $0.00 $0.00 $134,385,911.09 $199.62 $199.62 $0.03 $0.03 $0.00 $0.008 $0.00 $133,350,491.18 $0.00 $0.00 $133,350,491.18 $176.46 $176.46 $0.03 $0.03 $0.00 $0.009 $0.00 $133,132,512.22 $0.00 $0.00 $133,132,512.22 $163.90 $163.90 $0.02 $0.02 $0.00 $0.0010 $0.00 $137,897,370.87 $0.00 $0.00 $137,897,370.87 $160.93 $160.93 $0.02 $0.02 $0.00 $0.0011 $0.00 $136,460,174.20 $0.00 $0.00 $136,460,174.20 $149.73 $149.73 $0.02 $0.02 $0.00 $0.0012 $0.00 $136,024,170.18 $0.00 $0.00 $136,024,170.18 $143.55 $143.55 $0.02 $0.02 $0.00 $0.0013 $0.00 $146,892,112.95 $0.00 $0.00 $146,892,112.95 $152.87 $152.87 $0.02 $0.02 $0.00 $0.0014 $0.00 $149,635,421.88 $0.00 $0.00 $149,635,421.88 $158.54 $158.54 $0.02 $0.02 $0.00 $0.0015 $0.00 $151,055,193.96 $0.00 $0.00 $151,055,193.96 $162.03 $162.03 $0.03 $0.03 $0.00 $0.0016 $0.00 $152,096,197.03 $0.00 $0.00 $152,096,197.03 $161.59 $161.59 $0.03 $0.03 $0.00 $0.0017 $0.00 $152,367,674.73 $0.00 $0.00 $152,367,674.73 $163.36 $163.36 $0.03 $0.03 $0.00 $0.0018 $0.00 $149,163,865.54 $0.00 $0.00 $149,163,865.54 $156.88 $156.88 $0.02 $0.02 $0.00 $0.0019 $0.00 $155,844,116.21 $0.00 $0.00 $155,844,116.21 $162.23 $162.23 $0.03 $0.03 $0.00 $0.0020 $0.00 $153,744,825.41 $0.00 $0.00 $153,744,825.41 $160.57 $160.57 $0.03 $0.03 $0.00 $0.0021 $0.00 $155,040,545.52 $0.00 $0.00 $155,040,545.52 $158.49 $158.49 $0.02 $0.02 $0.00 $0.0022 $0.00 $156,357,278.03 $0.00 $0.00 $156,357,278.03 $155.87 $155.87 $0.02 $0.02 $0.00 $0.0023 $0.00 $0.00 $0.00 $0.00 $0.00 $0.00 $0.00 $0.00 $0.00 $0.00 $0.0024 $0.00 $0.00 $0.00 $0.00 $0.00 $0.00 $0.00 $0.00 $0.00 $0.00 $0.0025 $0.00 $0.00 $0.00 $0.00 $0.00 $0.00 $0.00 $0.00 $0.00 $0.00 $0.00
Totals $0.00 $3,153,317,787.78 $0.00 $0.00 $3,153,317,787.78 $5,906.84 $5,906.84 $0.86 $0.86 $0.00 $0.00
Market-Based Avoided Costs (Net Free Riders/Drop-Out, Losses Included) for Today Scenario Market-Based Avoided Costs (Net Free Riders/Drop-Out, Losses Included) for Option Value
Year Energy Adders/Capacity T&D Ancillary Total Production Capacity Total Year Energy Adders/Capacity T&D Ancillary Total Production Capacity Total1 $23,160,263.76 $10,503,179.61 $0.00 $1,815.91 $33,665,259.28 $0.00 $0.00 $0.00 1 $31,295,315.89 $14,192,425.75 $0.00 $1,815.91 $45,489,557.55 $0.00 $0.00 $0.002 $46,729,923.05 $21,192,020.10 $0.00 $3,297.66 $67,925,240.81 $0.00 $0.00 $0.00 2 $63,140,652.91 $28,634,286.09 $0.00 $3,297.66 $91,778,236.66 $0.00 $0.00 $0.003 $74,758,684.27 $33,903,063.32 $0.00 $4,885.22 $108,666,632.81 $0.00 $0.00 $0.00 3 $100,998,538.56 $45,802,837.24 $0.00 $4,885.22 $146,806,261.03 $0.00 $0.00 $0.004 $102,364,026.28 $46,422,085.92 $0.00 $7,363.59 $148,793,475.79 $0.00 $0.00 $0.00 4 $138,275,406.64 $62,707,896.91 $0.00 $7,363.59 $200,990,667.14 $0.00 $0.00 $0.005 $133,368,276.81 $60,482,513.54 $0.00 $9,089.42 $193,859,879.77 $0.00 $0.00 $0.00 5 $180,148,782.63 $81,697,472.92 $0.00 $9,089.42 $261,855,344.98 $0.00 $0.00 $0.006 $162,572,410.51 $73,726,588.17 $0.00 $10,835.33 $236,309,834.01 $0.00 $0.00 $0.00 6 $219,597,671.26 $99,587,543.92 $0.00 $10,835.33 $319,196,050.52 $0.00 $0.00 $0.007 $191,134,807.87 $86,679,635.37 $0.00 $12,673.76 $277,827,117.00 $0.00 $0.00 $0.00 7 $258,181,542.18 $117,085,329.38 $0.00 $12,673.76 $375,279,545.32 $0.00 $0.00 $0.008 $219,313,832.73 $99,458,823.14 $0.00 $14,508.68 $318,787,164.55 $0.00 $0.00 $0.00 8 $296,248,351.09 $134,348,627.22 $0.00 $14,508.68 $430,611,486.98 $0.00 $0.00 $0.009 $272,872,458.32 $123,747,659.85 $0.00 $15,843.60 $396,635,961.77 $0.00 $0.00 $0.00 9 $368,615,525.20 $167,167,140.68 $0.00 $15,843.60 $535,798,509.48 $0.00 $0.00 $0.0010 $295,693,042.99 $134,096,795.00 $0.00 $16,975.97 $429,806,813.96 $0.00 $0.00 $0.00 10 $399,473,856.40 $181,161,393.88 $0.00 $16,975.97 $580,652,226.25 $0.00 $0.00 $0.0011 $322,645,748.85 $146,319,847.10 $0.00 $18,386.99 $468,983,982.94 $0.00 $0.00 $0.00 11 $435,908,328.89 $197,684,427.15 $0.00 $18,386.99 $633,611,143.04 $0.00 $0.00 $0.0012 $349,175,250.70 $158,350,976.19 $0.00 $19,437.12 $507,545,664.01 $0.00 $0.00 $0.00 12 $471,799,702.69 $213,961,165.17 $0.00 $19,437.12 $685,780,304.98 $0.00 $0.00 $0.0013 $363,401,548.28 $164,802,602.14 $0.00 $20,088.17 $528,224,238.59 $0.00 $0.00 $0.00 13 $491,036,658.78 $222,685,124.76 $0.00 $20,088.17 $713,741,871.71 $0.00 $0.00 $0.0014 $367,549,867.59 $166,683,864.95 $0.00 $20,193.98 $534,253,926.53 $0.00 $0.00 $0.00 14 $496,662,151.03 $225,236,285.49 $0.00 $20,193.98 $721,918,630.51 $0.00 $0.00 $0.0015 $371,274,043.93 $168,372,778.92 $0.00 $20,079.72 $539,666,902.58 $0.00 $0.00 $0.00 15 $501,675,926.92 $227,510,032.86 $0.00 $20,079.72 $729,206,039.50 $0.00 $0.00 $0.0016 $387,270,555.32 $175,627,196.84 $0.00 $20,496.89 $562,918,249.05 $0.00 $0.00 $0.00 16 $523,255,237.54 $237,296,250.22 $0.00 $20,496.89 $760,571,984.66 $0.00 $0.00 $0.0017 $394,975,264.98 $179,121,282.67 $0.00 $20,610.20 $574,117,157.86 $0.00 $0.00 $0.00 17 $533,666,297.71 $242,017,666.01 $0.00 $20,610.20 $775,704,573.92 $0.00 $0.00 $0.0018 $421,696,830.33 $191,239,512.55 $0.00 $21,527.56 $612,957,870.44 $0.00 $0.00 $0.00 18 $569,762,086.56 $258,387,106.26 $0.00 $21,527.56 $828,170,720.38 $0.00 $0.00 $0.0019 $439,751,608.91 $199,427,354.64 $0.00 $22,233.49 $639,201,197.04 $0.00 $0.00 $0.00 19 $594,149,421.61 $269,446,762.70 $0.00 $22,233.49 $863,618,417.80 $0.00 $0.00 $0.0020 $457,521,266.30 $207,485,894.27 $0.00 $22,699.21 $665,029,859.78 $0.00 $0.00 $0.00 20 $618,147,223.08 $280,329,765.67 $0.00 $22,699.21 $898,499,687.96 $0.00 $0.00 $0.0021 $480,139,001.78 $217,743,037.31 $0.00 $23,812.81 $697,905,851.90 $0.00 $0.00 $0.00 21 $648,682,916.10 $294,177,702.45 $0.00 $23,812.81 $942,884,431.37 $0.00 $0.00 $0.0022 $503,931,003.17 $228,532,709.94 $0.00 $25,001.12 $732,488,714.22 $0.00 $0.00 $0.00 22 $680,798,492.35 $308,742,116.28 $0.00 $25,001.12 $989,565,609.76 $0.00 $0.00 $0.0023 $458,647,931.75 $207,996,837.05 $0.00 $22,877.86 $666,667,646.65 $0.00 $0.00 $0.00 23 $619,639,412.97 $281,006,473.78 $0.00 $22,877.86 $900,668,764.62 $0.00 $0.00 $0.0024 $414,828,827.44 $188,124,873.24 $0.00 $20,794.16 $602,974,494.85 $0.00 $0.00 $0.00 24 $560,447,398.90 $254,162,895.40 $0.00 $20,794.16 $814,631,088.46 $0.00 $0.00 $0.0025 $348,796,406.48 $158,179,170.34 $0.00 $17,602.66 $506,993,179.48 $0.00 $0.00 $0.00 25 $471,294,888.65 $213,732,232.00 $0.00 $17,602.66 $685,044,723.31 $0.00 $0.00 $0.00
Totals $7,603,572,882.39 $3,448,220,302.16 $0.00 $413,131.10 $11,052,206,315.65 $0.00 $0.00 $0.00 Totals $10,272,901,786.55 $4,658,760,960.20 $0.00 $413,131.10 $14,932,075,877.85 $0.00 $0.00 $0.00
Cost-Based Avoided Costs (Net Free Riders/Drop-Out, Losses Included)
Year Energy Capacity T&D Ancillary Total Production Capacity Total1 $23,160,263.76 $2,410,499.55 $0.00 $1,815.91 $25,572,579.21 $0.00 $0.00 $0.002 $46,729,923.05 $4,775,718.61 $0.00 $3,297.66 $51,508,939.32 $0.00 $0.00 $0.003 $74,758,684.27 $8,590,055.77 $0.00 $4,885.22 $83,353,625.27 $0.00 $0.00 $0.004 $102,364,026.28 $9,922,502.56 $0.00 $7,363.59 $112,293,892.44 $0.00 $0.00 $0.005 $133,368,276.81 $33,813,233.86 $0.00 $9,089.42 $167,190,600.09 $0.00 $0.00 $0.006 $162,572,410.51 $30,728,930.58 $0.00 $10,835.33 $193,312,176.42 $0.00 $0.00 $0.007 $191,134,807.87 $42,968,001.68 $0.00 $12,673.76 $234,115,483.31 $0.00 $0.00 $0.008 $219,313,832.73 $51,953,263.86 $0.00 $14,508.68 $271,281,605.26 $0.00 $0.00 $0.009 $272,872,458.32 $55,649,127.96 $0.00 $15,843.60 $328,537,429.88 $0.00 $0.00 $0.0010 $295,693,042.99 $50,376,652.84 $0.00 $16,975.97 $346,086,671.80 $0.00 $0.00 $0.0011 $322,645,748.85 $55,388,926.19 $0.00 $18,386.99 $378,053,062.03 $0.00 $0.00 $0.0012 $349,175,250.70 $68,806,338.74 $0.00 $19,437.12 $418,001,026.56 $0.00 $0.00 $0.0013 $363,401,548.28 $71,325,255.03 $0.00 $20,088.17 $434,746,891.47 $0.00 $0.00 $0.0014 $367,549,867.59 $67,662,864.35 $0.00 $20,193.98 $435,232,925.93 $0.00 $0.00 $0.0015 $371,274,043.93 $61,389,936.37 $0.00 $20,079.72 $432,684,060.02 $0.00 $0.00 $0.0016 $387,270,555.32 $66,023,988.87 $0.00 $20,496.89 $453,315,041.09 $0.00 $0.00 $0.0017 $394,975,264.98 $67,232,139.65 $0.00 $20,610.20 $462,228,014.83 $0.00 $0.00 $0.0018 $421,696,830.33 $70,176,365.37 $0.00 $21,527.56 $491,894,723.26 $0.00 $0.00 $0.0019 $439,751,608.91 $74,796,151.24 $0.00 $22,233.49 $514,569,993.63 $0.00 $0.00 $0.0020 $457,521,266.30 $75,437,759.35 $0.00 $22,699.21 $532,981,724.86 $0.00 $0.00 $0.0021 $480,139,001.78 $78,654,760.03 $0.00 $23,812.81 $558,817,574.63 $0.00 $0.00 $0.0022 $503,931,003.17 $82,306,491.51 $0.00 $25,001.12 $586,262,495.80 $0.00 $0.00 $0.0023 $458,647,931.75 $75,531,679.86 $0.00 $22,877.86 $534,202,489.47 $0.00 $0.00 $0.0024 $414,828,827.44 $68,261,197.43 $0.00 $20,794.16 $483,110,819.03 $0.00 $0.00 $0.0025 $348,796,406.48 $57,957,440.49 $0.00 $17,602.66 $406,771,449.63 $0.00 $0.00 $0.00
Totals $7,603,572,882.39 $1,332,139,281.75 $0.00 $413,131.10 $8,936,125,295.24 $0.00 $0.00 $0.00
Electric Impacts/Savings Impacts/SavElectric Impacts/Savings Impacts/Sav
Cumulative Gas
Electric Impacts/Savings Gas Impacts/SavingsPer Participant Cumulative Yearly Incremental (Per Participant * Incremental Participants) Per ParticipanCumulativearly Incremen
Gas Impacts/Savingsarly IncremenPer Participant Cumulative Yearly Incremental (Per Participant * Incremental Participants) Per ParticipanCumulative
Participation Total Participant Costs
Cumulative Gas
Lost Revenue per Participant Cumulative Lost Revenue Cumulative Lost Revenue (Net Fuel)
Overall Costs Total Costs per kW , kW h, and CCF Saved (Losses Included)
Electric Impacts/Savings
Cumulative Electric
Cumulative Electric Cumulative Gas
Total Participant CostsGross Net Free Riders / Drop-Out
Cumulative Electric
U-20373 | October 28, 2019 Direct Testimony of Christopher Neme on behalf of Natural Resources Defense Council
Exhibit: NRD-11; Source: U-20471 WP KLB-26 EWR DSMore Aggregation 1.50%_Tiered Costs Page 3 of 3

STATE OF MICHIGAN
BEFORE THE MICHIGAN PUBLIC SERVICE COMMISSION
In the matter, on the Commission’s own motion, regarding the regulatory reviews, revisions, determinations, and/or approvals necessary for DTE ELECTRIC COMPANY to fully comply with Public Act 295 of 2008, as amended by Public Act 342 of 2016
U-20373
ALJ Sharon Feldman
______________________________________________________________________ PROOF OF SERVICE
On the date below, an electronic copy of the Direct Testimony of Chris Neme on behalf of the Natural Resources Defense Council and Exhibits NRD-1 through NRD-11 was served on the following:
Name/Party E-mail Address
Administrative Law Judge Sharon Feldman [email protected] Counsel for DTE Electric Co. David S. Maquera Megan E. Irving
[email protected] [email protected] [email protected]
Counsel for MPSC Staff Amit T. Singh Benjamin J. Holwerda Spencer Sattler
[email protected] [email protected] [email protected]
Counsel for Ecoworks and Soulardarity Nicholas Schroeck [email protected] Counsel for Sierra Club Cassandra McCrae Chinyere Osuala
[email protected] [email protected]
The statements above are true to the best of my knowledge, information and belief.
OLSON, BZDOK & HOWARD, P.C. Counsel for the NRDC
Date: October 28, 2019 By: ________________________________________
Kimberly Flynn, Legal Assistant Karla Gerds, Legal Assistant Breanna Thomas, Legal Assistant 420 E. Front St. Traverse City, MI 49686 Phone: 231/946-0044 Email: [email protected] [email protected] and [email protected]