VIA ELECTRONIC FILING - Federal Communications … - Ex Parte...VIA ELECTRONIC FILING Ms. Marlene H....
97
601 Pennsylvania Ave., NW Suite 800 Washington, DC 20004 202-654-5900 October 13, 2017 VIA ELECTRONIC FILING Ms. Marlene H. Dortch, Secretary Federal Communications Commission 445 12th Street, S.W. Washington, D.C. 20554 Re: Ex Parte Notification GN Docket No. 17-258, Promoting Investment in the 3550-3700 MHz Band; RM-11788, RM-11789, Petitions for Rulemaking Regarding the Citizens Broadband Radio Service; GN Docket No. 12-354, Amendment of the Commission’s Rules with Regard to Commercial Operations in the 3550-3650 MHz Band; GN Docket No. 17-183, Expanding Flexible Use in Mid-Band Spectrum Between 3.7 and 24 GHz; GN Docket No. 14-177, Use of Spectrum Bands Above 24 GHz for Mobile Radio Services; ULS File Nos. 0007652635; 0007652637, AT&T Mobility Spectrum LLC and FiberTower Corporation Seek FCC Consent to the Transfer of Control of 24 GHz and 39 GHz Licenses. Dear Ms. Dortch: On October 11, 2017, John Hunter of T-Mobile, Russell Fox of Mintz Levin, and I conducted separate meetings with each of the following members of the Commission’s staff: Rachael Bender, Legal Advisor to Chairman Pai Louis Peraertz, Senior Legal Advisor to Commissioner Clyburn Kevin Holmes, Acting Legal Advisor to Commissioner Carr Travis Litman, Chief of Staff and Senior Legal Advisor to Commissioner Rosenworcel Wireless Telecommunications Bureau (Donald Stockdale, Dana Shaffer, Nese Guendelsberger, 1 Charles Mathias, Matthew Pearl, Blaise Scinto, Paul Powell, Jessica Greffenius, Aalok Mehta) 2 1/ By telephone. 2/ Tom Peters of Hogan Lovells also participated in the meeting with the Wireless Telecommunications Bureau.
Transcript of VIA ELECTRONIC FILING - Federal Communications … - Ex Parte...VIA ELECTRONIC FILING Ms. Marlene H....

601 Pennsylvania Ave., NW
Suite 800
Washington, DC 20004
202-654-5900
October 13, 2017
VIA ELECTRONIC FILING
Ms. Marlene H. Dortch, Secretary
Federal Communications Commission
445 12th Street, S.W.
Washington, D.C. 20554
Re: Ex Parte Notification
GN Docket No. 17-258, Promoting Investment in the 3550-3700 MHz Band;
RM-11788, RM-11789, Petitions for Rulemaking Regarding the Citizens Broadband
Radio Service;
GN Docket No. 12-354, Amendment of the Commission’s Rules with Regard to
Commercial Operations in the 3550-3650 MHz Band;
GN Docket No. 17-183, Expanding Flexible Use in Mid-Band Spectrum Between 3.7 and
24 GHz;
GN Docket No. 14-177, Use of Spectrum Bands Above 24 GHz for Mobile Radio
Services;
ULS File Nos. 0007652635; 0007652637, AT&T Mobility Spectrum LLC and
FiberTower Corporation Seek FCC Consent to the Transfer of Control of 24 GHz and 39
GHz Licenses.
Dear Ms. Dortch:
On October 11, 2017, John Hunter of T-Mobile, Russell Fox of Mintz Levin, and I conducted
separate meetings with each of the following members of the Commission’s staff:
Rachael Bender, Legal Advisor to Chairman Pai
Louis Peraertz, Senior Legal Advisor to Commissioner Clyburn
Kevin Holmes, Acting Legal Advisor to Commissioner Carr
Travis Litman, Chief of Staff and Senior Legal Advisor to Commissioner Rosenworcel
Wireless Telecommunications Bureau (Donald Stockdale, Dana Shaffer, Nese
Guendelsberger,1 Charles Mathias, Matthew Pearl, Blaise Scinto, Paul Powell, Jessica
Greffenius, Aalok Mehta)2
1/ By telephone.
2/ Tom Peters of Hogan Lovells also participated in the meeting with the Wireless
Telecommunications Bureau.
2
I separately spoke by telephone with Holly Saurer, Acting Legal Advisor to Commissioner
Rosenworcel. In each of the meetings, we discussed the following topics, except as noted.
3.5 GHz Draft NPRM and Order
In each meeting, we discussed the 3550-3700 MHz band (“3.5 GHz band”)/Citizens Broadband
Radio Service (“CBRS”) and the draft Notice of Proposed Rulemaking and Order Terminating
Petitions3 released on October 3, 2017. We stated that we were generally pleased with the Draft
NPRM and Order, which was responsive in most instances to the Petition for Rulemaking
submitted by T-Mobile and will significantly improve the viability of the band for fifth
generation wireless broadband (“5G”) services and provide a more certain licensing environment
that will help drive investment.4 We expressed disappointment, however, with the Draft NPRM
and Order’s treatment of two issues raised in the Petition – the potential use of Priority Access
Licenses (“PALs”) throughout the 150 megahertz of spectrum in the 3.5 GHz band and the
change in effective isotropic radiated power (“EIRP”) limits for Citizens Broadband Radio
Service Devices (“CBSDs”). We stated that adopting an Order rejecting the two
recommendations – rather than seeking comment on them – is unnecessary and contrary to
Commission precedent, and would prevent development of a complete record on the issues
raised.5
While the Commission may not yet be prepared to propose the rule changes proposed by T-
Mobile, adopting an Order dismissing them – without further opportunity for public comment –
is the wrong approach. In other Notices of Proposed Rulemaking (“NPRMs”), the Commission
has routinely stated tentative conclusions not to take a particular action, but nonetheless, in order
to develop a more complete record, sought comment on its proposed course.6 The Commission
3/ Promoting Investment in the 3550-3700 MHz Band; Petitions for Rulemaking Regarding the
Citizens Broadband Radio Service, Draft Notice of Proposed Rulemaking and Order Terminating
Petitions, GN Docket No. 17-258, RM-11788, RM-11789, FCC-CIRC1710-04 (rel. Oct. 3, 2017) (“Draft
NPRM and Order”).
4/ T-Mobile USA, Inc. Petition for Rulemaking, GN Docket No. 12-354, RM-11789 (filed June 19,
2017) (“Petition”).
5/ See Expanding Flexible Use in Mid-Band Spectrum Between 3.7 and 24 GHz, GN Docket 17-
183, Notice of Inquiry, 32 FCC Rcd 6373 (2017) (“Mid-Band NOI”).
6/ See, e.g., Amendment of Part 15 of the Commission’s Rules, Notice of Proposed Rulemaking and
Order, 31 FCC Rcd 1657, ¶ 30 (2016) (“[Certain parties] suggest changing the required geo-location
accuracy for white space devices from +/-50 meters to +/-100 meters. . . . [W]e tentatively conclude that it
is not necessary[.] . . . We seek comment on this tentative conclusion.”); Permissive Use of the “Next
Generation” Broadcast Television Standard, Notice of Proposed Rulemaking, 32 FCC Rcd 1670, ¶ 62
(2017) (“[W]e tentatively conclude that as long as the synchronization used to implement an [Single
Frequency Networks/Distributed Transmission Systems] minimizes interference within the network and
provides adequate service, then there is no need to require a specific synchronization standard. We seek
comment on this tentative conclusion.”); Service Rules for 698-746, 747-762 and 777-792 MHz Bands et
al., Third Further Notice of Proposed Rulemaking, 23 FCC Rcd 14301, ¶ 73 (2008) (“We tentatively
conclude that it would not serve the public interest to change the current rule governing D Block

3
should take the same path here. First, rejecting the proposals in an Order unnecessarily
forecloses Commission consideration of alternatives to the solutions that we recommended. The
matters raised in the Draft NPRM and Order are complex and development of a more complete
record may produce other ways to address those matters. Second, considering the issues T-
Mobile raised in the context of an NPRM, instead of simply dismissing them in an Order, would
be procedurally more streamlined and result in the resolution of all matters governing the 3.5
GHz band at once. Parties on all sides of the issues in this proceeding have urged the
Commission to finalize rules governing the 3.5 GHz band.7 It would be more responsive to those
requests to avoid creating two separate procedural paths and to consider all issues at once in the
NPRM.
Moreover, the Draft NPRM and Order reaches erroneous conclusions. For example, the
Commission is simply wrong in its conclusion that “T-Mobile presents no compelling evidence”8
for the Commission to change its approach regarding designation of the entire band for PAL use.
Among other things, our Petition was replete with examples of other countries targeting the 3.5
GHz band for 5G operations and arguments regarding global harmonization.9 The Draft NPRM
and Order also ignores arguments regarding the need for wider bandwidths for 5G
communications.10 Finally, the Commission’s proposed finding of “no compelling evidence”
ignores the fact that responses to petitions for rulemaking are often limited because parties wait
until an NPRM is issued to participate in a proceeding. To ensure a more fully developed record,
the public interest favors permitting parties to address these issues in the NPRM.
The need to further supplement the record is highlighted by two reports prepared by Roberson
and Associates, LLC, both of which were distributed at our meetings and are attached to this
letter. The first of those reports discusses how the 3.5 GHz band will be better utilized if the
Commission increases PAL licensees’ access to the entire 150 megahertz of 3.5 GHz spectrum,
which will, in turn, increase investment in the band.11 The second report demonstrates how
increased power limits for CBSDs will not cause harmful interference to incumbent operations in
Protection Zones.12 Dismissing T-Mobile’s proposals on these issues will effectively foreclose
partitioning and disaggregation, and thus to continue prohibiting any partitioning and disaggregation of a
D Block license. We seek comment on this conclusion.”).
7/ See, e.g., Letter from Austin C. Schlick, Director, Communications Law, Google Inc., to Marlene
H. Dortch, Secretary, FCC, GN Docket No. 12-354, RM-11788, RM-11789, Presentation at 6 (filed Sept.
21, 2017) (stating that “[r]ule changes must not delay upcoming deployments”); Letter from Scott K.
Bergmann, Vice President, Regulatory Affairs, CTIA, to Marlene H. Dortch, Secretary, FCC, GN Docket
No. 12-354, RM-11788, RM-11789, at 1-2 (filed Oct. 12, 2017) (urging the Commission to move forward
quickly on various proposals without delaying access to the 3.5 GHz band).
8/ Draft NPRM and Order, ¶ 59.
9/ Petition at 5-7.
10/ Id. at 9, 21-22.
11/ ROBERSON AND ASSOCIATES, LLC, CBRS BAND ASSESSMENT: ENHANCING PAL
OPPORTUNITIES TO OPTIMIZE 5G DEPLOYMENTS 8-9 (2017).
12/ ROBERSON AND ASSOCIATES, LLC, CBRS TECHNICAL ASSESSMENT: CBSD POWER CEILING
INCREASE EXTERNAL TO PROTECTION ZONES 2, 18 (2017).

4
interested parties from responding to these reports, which would be contrary to the development
of a more complete record in this proceeding and the public interest.
Mid-Band NOI13
We noted our strong support of the Commission’s efforts to make mid-band spectrum available
for mobile wireless broadband networks.14 We stated that the 3.7-4.2 GHz band is ideally
situated – because of potential international harmonization, the availability for large-bandwidth
channelization and proximity to other spectrum being evaluated for mobile wireless broadband
use – to be reallocated for mobile wireless broadband operations. As stated in our comments in
this proceeding, T-Mobile also supports the potential reallocation of the 5925-6425 MHz band
for unlicensed operations, assuming the existence of sufficiently detailed protection mechanisms
for incumbent operations. The Commission should consider designating some of the 6425-7125
MHz band for licensed use. Licensed spectrum should be made available using the time-tested
methodology that has made the U.S. wireless broadband market the success it is today. The
Commission should specifically reject any proposals to use experimental market-based
mechanisms, such as those suggested by Intel and Intelsat, to merely give existing licensees
flexible rights to provide terrestrial services in the mid-band spectrum.15 Such a proposal has
several flaws. It would not create uniform treatment of spectrum in the mid-band spectrum
because only some licensees – like Intelsat – may take advantage of the recommended approach.
Accordingly, the proposal will not produce an efficient means of promoting terrestrial use,
denying consumers additional capacity for wireless mobile broadband networks. In addition, the
proposal represents a give-away of spectrum rights worth tens of billions of dollars to companies
that are not fully utilizing spectrum today, rather than U.S. taxpayers getting the benefit of these
funds through an auction. Nor should the Commission use database-driven access methods that
add complexity and inefficiencies to the deployment of services in bands designated for licensed
operations.16
We noted that while there are incumbent operations in the bands identified in the Mid Band NOI,
T-Mobile has suggested techniques for addressing the operational requirements of those current
spectrum users. In particular, in the 3.7-4.2 GHz band, the few remaining fixed service (“FS”)
stations can be relocated using the same process successfully employed for the Personal
Communications Service.17 Fixed satellite service (“FSS”) licensees have other transmission
options, such as fiber deployment, particularly in urban areas. FSS use in rural areas, where
there are no fiber facilities, can be protected by licensed terrestrial stations. In the 6 GHz band,
Cable Television Relay Service (“CARS”) and Broadcast Auxiliary Services (“BAS”) licensees
are increasingly using commercial services to meet their communications requirements, and FS
13/ We did not discuss the mid-band proceeding with Mr. Litman.
14/ See Mid-Band NOI ¶ 12.
15/ Comments of Intelsat License LLC and Intel Corporation, GN Docket No. 17-183, at 10-13 (filed
Oct. 2, 2017).
16/ See, e.g., Comments of Verizon, GN Docket No. 17-183, at 19 (filed Oct. 2, 2017).
17/ Comments of T-Mobile USA, Inc., GN Docket No. 17-183, at 15 (filed Oct. 2, 2017).

5
licensees can potentially be relocated to the 7.1-8.4 GHz band on a shared basis with Federal
users.
Finally, we noted that there are other bands the Commission should explore for potential wireless
operations as part of the Mid Band NOI proceeding. In addition to the 7.1-8.4 GHz band, that
may be used to accommodate relocated FS stations, the Commission should work with the
National Telecommunications and Information Administration to consider reallocating the 4.2-
4.4 GHz band for non-Federal use. It should also consider mobile wireless broadband use of
current non-Federal spectrum in the 4.9 GHz, 12.2-12.7 GHz, and other FS bands.
Spectrum Frontiers Report and Order and Further Notice18
We urged the Commission to proceed promptly to finalize rules covering the spectrum
designated for mobile wireless broadband in the Report and Order in the Spectrum Frontiers
proceeding and to adopt rules governing the spectrum identified in the Further Notice of
Proposed Rulemaking in the proceeding.19 We stated that the rules adopted in the Report and
Order struck an appropriate balance between mobile wireless broadband and satellite services
and that the Commission should reject further encroachment of the bands by the satellite
services. We noted in particular that T-Mobile recently submitted a technical paper that supports
the potential use of the 32 GHz, 47 GHz and 50 GHz bands.20 That technical paper demonstrates
that coexistence between 5G operations and radio astronomy services (“RAS”) and Earth
Exploration Satellite Service (“EESS”) is possible in the 32 GHz, 47 GHz, 50 GHz bands.
Moreover, the risk to RAS operations are further limited because there are only 16 RAS facilities
in remote locations. Given that only a small radius of exclusion is needed to protect RAS
operations in the band, 5G services can coexist with RAS by using a combination of exclusion
zones and coordination.21 As detailed in the report, with very limited constraints needed to
protect EESS receivers, 5G deployments and EESS operations in the band can effectively
coexist.22 The Commission should therefore adopt rules making this spectrum available for
wireless mobile broadband use.
We also observed that while the Report and Order in the Spectrum Frontiers proceeding is a
good first step, only a limited amount of spectrum will be made available for new licensees as a
result of the Commission’s actions – much of the spectrum in the 28 GHz band and 39 GHz band
that is the subject of the Report and Order is already licensed. That is part of the reason why, as
18/ We did not discuss the millimeter wave band proceeding with Mr. Litman.
19/ Use of Spectrum Bands Above 24 GHz for Mobile Radio Services, Report and Order and Further
Notice of Proposed Rulemaking, 31 FCC Rcd 8014 (2016).
20/ Letter from Steve Sharkey, Vice President, Government Affairs, Technology and Engineering
Policy, T-Mobile USA, Inc., to Marlene H. Dortch, Secretary, FCC, GN Docket No. 14-177 (filed Oct. 2,
2017); T-MOBILE, UNLEASHING MILLIMETER WAVE SPECTRUM IN THE 32 GHZ, 47 GHZ, AND 50 GHZ
BANDS: COEXISTENCE OF MOBILE BROADBAND OPERATIONS WITH THE EARTH EXPLORATION
SATELLITE SERVICE AND RADIO ASTRONOMY SERVICE (2017) (“5G Coexistence Study”).
21/ 5G Coexistence Study at 28.
22/ Id.

6
T-Mobile has urged, the Commission should not grant the application submitted by FiberTower
Corporation (“FiberTower”) and AT&T Mobility Spectrum, LLC (“AT&T”), with respect to the
650 FiberTower licenses the Commission has already cancelled.23 That spectrum should be
available for auction to parties that will put it to use. Just as important, grant of the assignment
application with respect to the cancelled licenses would be inconsistent with the Commission’s
obligation to ensure that spectrum is put to productive use and its performance deadlines are
observed.
* * *
Pursuant to Section 1.1206(b)(2) of the Commission’s rules, an electronic copy of this letter is
being filed in the above-referenced dockets and a copy is being provided to each member of the
Commission’s staff with whom we met. Please direct any questions regarding this filing to me.
Respectfully submitted,
/s/ Steve B. Sharkey
Steve B. Sharkey
Vice President, Government Affairs
Technology and Engineering Policy
Attachments
cc: (each electronically, with attachments)
Rachael Bender
Louis Peraertz
Kevin Holmes
Travis Litman
Donald Stockdale
Dana Shaffer
Nese Guendelsberger
Charles Mathias
Matthew Pearl
Blaise Scinto
Paul Powell
Jessica Greffenius
Aalok Mehta
Holly Saurer
23/ AT&T Mobility Spectrum LLC and FiberTower Corporation Seek FCC Consent to the Transfer of
Control of 24 GHz and 39 GHz Licenses, Public Notice, DA 17-261 (rel. Mar. 16, 2017); Reply
Comments of T-Mobile USA, Inc., ULS File Nos. 0007652635, 0007652637 (filed Apr. 13, 2017). My
telephone conference with Ms. Saurer was limited to this matter.

CBRS BAND ASSESSMENT: ENHANCING PAL OPPORTUNITIES TO OPTIMIZE
5G DEPLOYMENTS
M. BIRCHLER, J. HAUG, P. LASTRES & B. PAYNE 11 OCTOBER 2017
V1.01
ThisanalysiswasgeneratedbyRobersonandAssociates,LLCforT-MobileUSA,Inc.
Table of Contents: 1 EXECUTIVE SUMMARY ..................................................................................................... 22 BACKGROUND ...................................................................................................................... 32.1 CURRENT FCC POSITION ..................................................................................................... 32.2 T-MOBILE POSITION ............................................................................................................. 42.3 5G STATUS AND DIRECTION ................................................................................................. 43 ASSESSMENT ......................................................................................................................... 63.1 INCREASE THE AGGREGATION LIMIT TO FIVE PAL CHANNELS ...................................... 63.1.1 5G DEPLOYMENT SCENARIOS ............................................................................................. 63.1.2 5G CHANNELIZATION .......................................................................................................... 73.2 INCREASE PAL SPECTRUM AVAILABILITY TO 150 MHZ ................................................... 83.2.1 FACILITATION OF GREATER INVESTMENT ........................................................................... 93.2.2 GENERATION OF ADDITIONAL AUCTION REVENUE ............................................................ 93.2.3 MULTIPLE CARRIER 5G COMPETITION ................................................................................ 94 REFERENCES ........................................................................................................................ 9

Roberson and Associates, LLC ®
2
1 EXECUTIVE SUMMARY Analysis of increased Primary Access License (PAL) opportunities in the Citizen’s Broadband Radio Service (CBRS) band indicates significant business and technical advantages will accrue, particularly for new Fifth-Generation (5G) system deployments.
The two specific PAL opportunity areas assessed are:
1. Increase the Aggregation Limit to Five PAL Channels
2. Increase PAL Spectrum Availability to 150 MHz.
With regard to the increased PAL channel aggregation limit:
• The Study on “New Radio (NR) Access Technology” states in paragraph 8.1:
“Note that all details for channel bandwidth at least up to 100 MHz per NR carrier are to be specified in Rel-15.”
• Two recent 3GPP contributions indicate that channel bandwidths of 5, 10, 15, 20, 25, 40, 50, 60, 80, and 100 MHz are under consideration for the numerous services being considered under 5G
• 5G specifications cover many frequency bands, but it is reasonable to assume that 40 or 50 MHz channels will be specified for mobile broadband services in the 3.5 GHz band.
With regard to increasing PAL spectrum availability to 150 MHz:
• Recent auctions in Ireland and the Czech Republic allowed for channel bandwidths higher than the 20 MHz LTE maximum
o There were generally three to four 5G operators supported per region
o These spectrum acquisitions are in line with the requirements being developed by 3GPP in their 5G New Radio program
• Increasing the available PAL Spectrum allows for an enhanced competitive environment
o Availability of more than the current 70 MHz for PAL will enable at least two 5G operators in each geographic area
o GAA systems will still be allowed to access the entire 3.5 GHz band on an opportunistic basis.
• Higher auction revenues can be expected because the spectrum will be valued on a more traditional economic basis.
Should the FCC allow PAL licenses across the entire 150 MHz of the CBRS band and allow aggregation of up to five 10 MHz channels then 50 MHz 5G systems could be made available to three licensees. These operators could then provide services compatible with expected offerings in the rest of the world.

Roberson and Associates, LLC ®
3
2 BACKGROUND The assessments contained in this paper are limited to the set of current FCC rules and T-Mobile proposed rule changes described in Sections 2.1 and 2.2.
2.1 Current FCC Position The current Part 96 rules covering CBRS frequency assignments are in sections 96.11, 96.16 and 96.31 of [1]. Current FCC rules directly relevant to T-Mobile’s interests within the scope of this paper are underlined.
96.11 – Frequencies
(a) The Citizens Broadband Radio Service is authorized in the 3550-3700 MHz frequency band.
(1) General Authorized Access Users may operate in the 3550-3700 MHz frequency band.
(2) Priority Access Users may operate in the 3550-3650 MHz frequency band.
(3) Grandfathered Wireless Broadband Licensees may continue to use the 3650-3700 MHz band in accordance with section 90.1338.
96.13 – Frequency Assignments
(a) Each PAL shall be authorized to use a 10 megahertz channel in the 3550-3650 MHz band.
(1) No more than seven PALs shall be assigned in any given License Area at any given time.
(2) Multiple channels held by the same Priority Access Licensee in a given License Area shall be assigned consistent with the requirements of section 96.25.
(3) Any frequencies designated for Priority Access that are not in use by a Priority Access Licensee may be utilized by General Authorized Access Users.
(b) The 3650-3700 MHz band shall be reserved for Grandfathered Wireless Broadband Licensees and GAA Users.
(c) An SAS shall assign authorized CBSDs to specific frequencies, which may be reassigned by that SAS, consistent with this part.
96.31 – Aggregation of Priority Access Licenses
Priority Access Licensees may aggregate up to four PAL channels in any License Area at any given time.
In the following section, we have reproduced T-Mobile’s proposals for modification of the above current CBRS rules.
Roberson and Associates, LLC ®
4
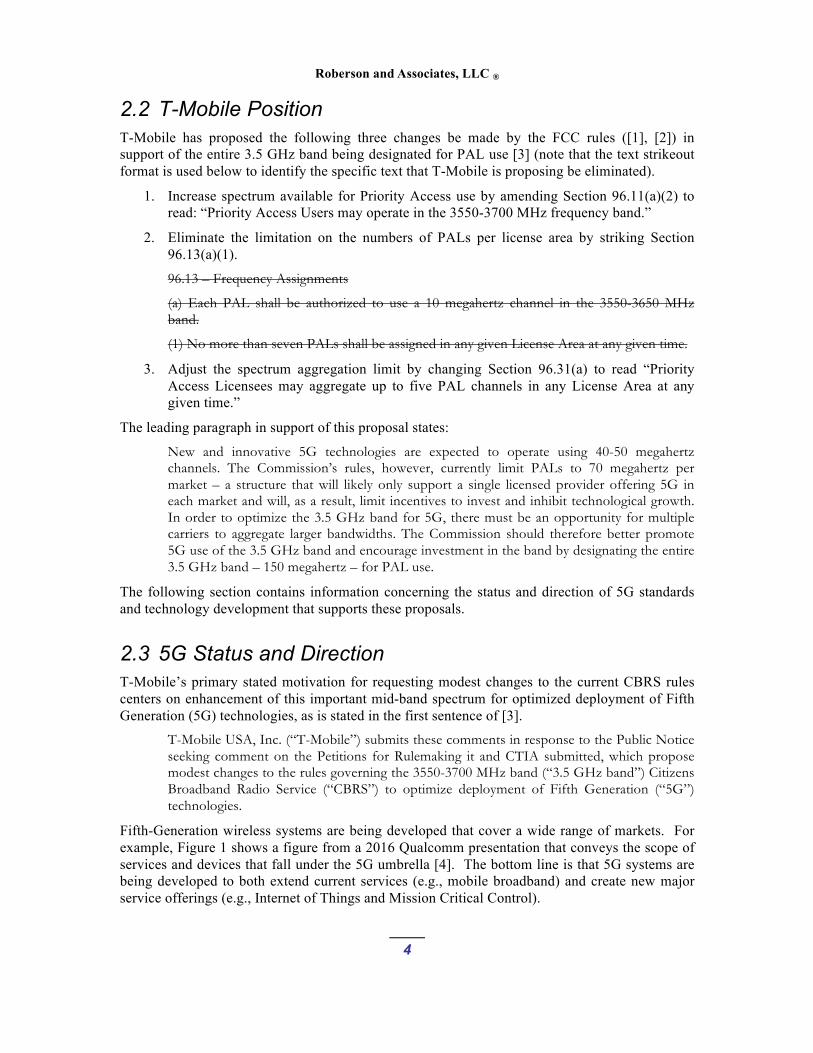
2.2 T-Mobile Position T-Mobile has proposed the following three changes be made by the FCC rules ([1], [2]) in support of the entire 3.5 GHz band being designated for PAL use [3] (note that the text strikeout format is used below to identify the specific text that T-Mobile is proposing be eliminated).
1. Increase spectrum available for Priority Access use by amending Section 96.11(a)(2) to read: “Priority Access Users may operate in the 3550-3700 MHz frequency band.”
2. Eliminate the limitation on the numbers of PALs per license area by striking Section 96.13(a)(1).
96.13 – Frequency Assignments
(a) Each PAL shall be authorized to use a 10 megahertz channel in the 3550-3650 MHz band.
(1) No more than seven PALs shall be assigned in any given License Area at any given time.
3. Adjust the spectrum aggregation limit by changing Section 96.31(a) to read “Priority Access Licensees may aggregate up to five PAL channels in any License Area at any given time.”
The leading paragraph in support of this proposal states:
New and innovative 5G technologies are expected to operate using 40-50 megahertz channels. The Commission’s rules, however, currently limit PALs to 70 megahertz per market – a structure that will likely only support a single licensed provider offering 5G in each market and will, as a result, limit incentives to invest and inhibit technological growth. In order to optimize the 3.5 GHz band for 5G, there must be an opportunity for multiple carriers to aggregate larger bandwidths. The Commission should therefore better promote 5G use of the 3.5 GHz band and encourage investment in the band by designating the entire 3.5 GHz band – 150 megahertz – for PAL use.
The following section contains information concerning the status and direction of 5G standards and technology development that supports these proposals.
2.3 5G Status and Direction T-Mobile’s primary stated motivation for requesting modest changes to the current CBRS rules centers on enhancement of this important mid-band spectrum for optimized deployment of Fifth Generation (5G) technologies, as is stated in the first sentence of [3].
T-Mobile USA, Inc. (“T-Mobile”) submits these comments in response to the Public Notice seeking comment on the Petitions for Rulemaking it and CTIA submitted, which propose modest changes to the rules governing the 3550-3700 MHz band (“3.5 GHz band”) Citizens Broadband Radio Service (“CBRS”) to optimize deployment of Fifth Generation (“5G”) technologies.
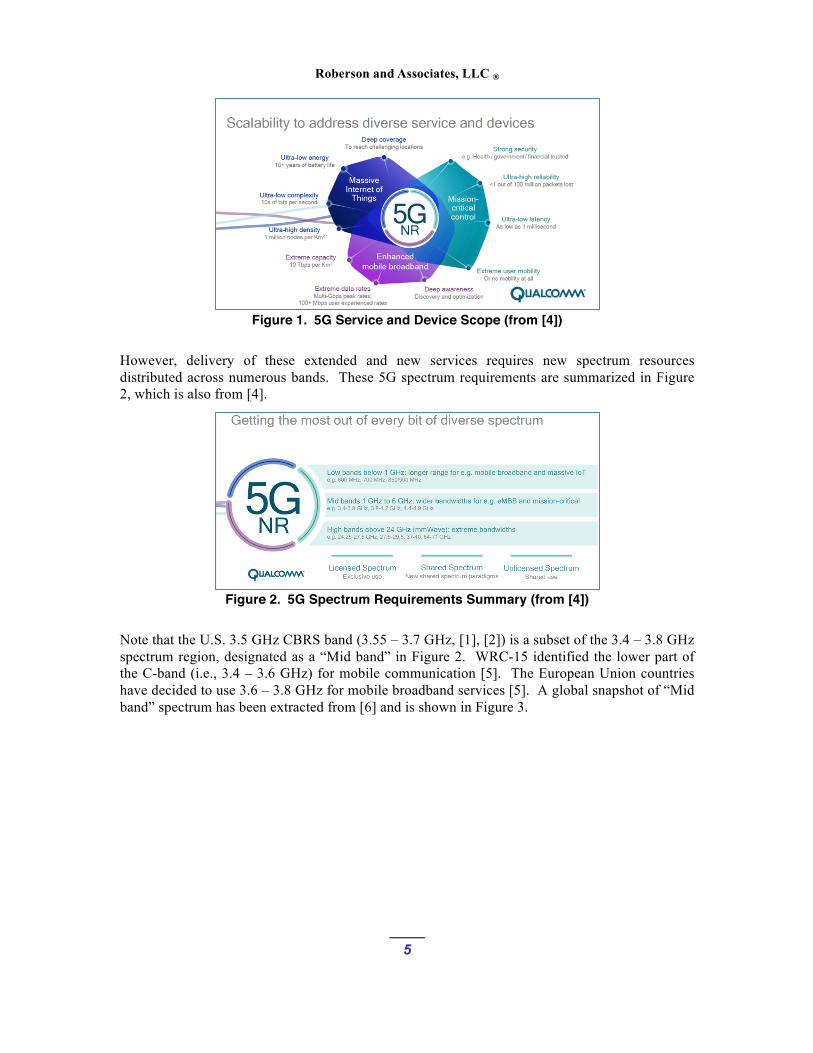
Fifth-Generation wireless systems are being developed that cover a wide range of markets. For example, Figure 1 shows a figure from a 2016 Qualcomm presentation that conveys the scope of services and devices that fall under the 5G umbrella [4]. The bottom line is that 5G systems are being developed to both extend current services (e.g., mobile broadband) and create new major service offerings (e.g., Internet of Things and Mission Critical Control).
Roberson and Associates, LLC ®
5
Figure 1. 5G Service and Device Scope (from [4])
However, delivery of these extended and new services requires new spectrum resources distributed across numerous bands. These 5G spectrum requirements are summarized in Figure 2, which is also from [4].
Figure 2. 5G Spectrum Requirements Summary (from [4])
Note that the U.S. 3.5 GHz CBRS band (3.55 – 3.7 GHz, [1], [2]) is a subset of the 3.4 – 3.8 GHz spectrum region, designated as a “Mid band” in Figure 2. WRC-15 identified the lower part of the C-band (i.e., 3.4 – 3.6 GHz) for mobile communication [5]. The European Union countries have decided to use 3.6 – 3.8 GHz for mobile broadband services [5]. A global snapshot of “Mid band” spectrum has been extracted from [6] and is shown in Figure 3.

Roberson and Associates, LLC ®
6
Figure 3. Global Snapshot of 5G Mid-Band Spectrum (from [6])
The current CBRS band rules allow only 70 MHz of the available 150 MHz to be utilized within a licensed framework (i.e., PAL). Thus, wireless operators planning new 5G services find themselves operating at a “Mid band” spectrum disadvantage in the U.S.
3 ASSESSMENT
3.1 Increase the Aggregation Limit to Five PAL Channels In their Petition for Rulemaking T-Mobile requests that aggregation limit for PALs be increased to five, thus supporting up to 50 MHz bandwidth channels to accommodate emerging 5G applications and technologies. Combination with the ability to assign PALs across the entire 150 MHz CBRS band permits competition among three operators who are each able to offer technologies already being standardized for markets outside of the USA.
3.1.1 5G Deployment Scenarios In the process of standardizing 5G technologies the Third Generation Partnership Project (3GPP) is developing a set of deployment scenarios, some of which may be unique to 5G. Currently these scenarios being evaluated to develop requirements for 5G access technologies. This is ongoing work and in this report we present the latest documented proposals in the study item “Study on Scenarios and Requirements for Next Generation Access Technologies” [9]. In the version published in June 2017 the following scenarios are considered.

Roberson and Associates, LLC ®
7
Deployment Scenario 3.5 GHz? Maximum Bandwidth Indoor hotspot Y 200 MHz (DL+UL) Dense urban Y 200 MHz (DL+UL) Rural Y 200 MHz (DL+UL) Urban macro Y 200 MHz (DL+UL) High speed Y 200 MHz (DL+UL) Extreme long distance coverage in low density areas
N 40 MHz (UL+DL)
Urban coverage for massive connection
N TBD
Highway scenario Y 200 MHz (DL+UL) Urban grid for connected car Y 200 MHz (DL+UL) Commercial air-to-ground scenario
N 40 MHz (DL+UL)
Light aircraft scenario N 40 MHz (DL+UL) Satellite extension to terrestrial N Up to 2 * 10 MHz
The column “3.5 GHz?” indicates whether the range of frequency bands from 3300-4990 MHz are being considered for each type of service.1 The “Maximum Bandwidth” column indicates the maximum bandwidth for combined uplink and downlink. Thus, as discussed shortly, it is expected that channel bandwidths up to 100 MHz are expected to be defined, as well as intermediate channel bandwidths.
3.1.2 5G Channelization It is well known that the principal cellular 4G air interface, LTE, supports individual channels up to 20 MHz and with carrier aggregation (CA) can support even higher bandwidths. Although 3GPP has not yet officially standardized wider channels, the Study on New Radio (NR) Access Technology [10] states in paragraph 8.1:
Note that all details for channel bandwidth at least up to 100 MHz per NR carrier are to be specified in Rel-15.
Typically, the 3GPP document on Physical Channels and Modulation [11] would provide details on the characteristics of physical channels for each supported bandwidth. That the most recent version of this document does not provide these details suggests that a framework has not yet been agreed to. However, Qualcomm’s website contains presentations that support the idea that channel bandwidths up to 100 MHz are being considered [12].
In further support of this expectation, Working Group 4 (WG4) of the RAN technical group has been tasked with studying performance of potential channelizations (as well as other characteristics of proposed radio access technologies). Two recent contributions to this group, “R4-1706929 Way Forward on Spectral Utilization” [13] and “R4-1707091 Discussion on Channel Raster” [14] indicate that channel bandwidths of 5, 10, 15, 20, 25, 40, 50, 60, 80, and
1 Not all these frequencies are currently available in the region that includes the United States, but for this report we assume the applicability to this band indicates applicability to the 3550-3700 MHz band. Note that in the 3GPP document this is referred to as ‘around 4 GHz’.

Roberson and Associates, LLC ®
8
100 MHz are under consideration. The outcome of WG4 studies will inform WG1, who is responsible for the physical layer specifications. Of course, 5G specifications will cover many frequency bands beyond those around 3.5 GHz, but it is reasonable to assume that 40 or 50 MHz channels may be specified in this band for mobile broadband services should the WG4 evaluation be favorable.
3.2 Increase PAL Spectrum Availability to 150 MHz Some of the initial auctions for Mid band 5G spectrum have already occurred in Europe. Ireland was the first to auction spectrum that is intended to support “5G” mobile services. That was followed by an auction in the Czech Republic. Although it’s very early in the process, the results of these early auctions can be assessed with a focus on their relation to the current CBRS band rules.
Ireland reported the results of its auction of 3.6 GHz licenses on May 22, 2017 [7]. The auction was for 350 MHz of spectrum across 3.4 to 3.8 GHz. For each region, there was one 25 MHz “A” Block and 65 “B” Blocks of 5 MHz each that were auctioned and awarded. There was also a limit of 150 MHz per bidder per region.
The winning bidders in the Ireland auction were able to procure large blocks of spectrum that are very consistent with the intentions and expectations of larger channel bandwidths to support 5G enhanced mobile broadband. Vodafone acquired 105 MHz (21 B Blocks) and 85 MHz (17 B Blocks) in the urban and non-urban regions respectively. Three bidders acquired 100 MHz of capacity in every region. Further, the average value for the licenses was $0.0423 per MHz-pop with an annual spectrum usage fee of $0.0124 per MHz-pop to be paid over 15 years. This is much higher than the value received for previous auctions at 3.6 GHz for fixed services.
The Czech Republic announced the results of its 3.7 GHz band auction on July 13, 2017 [8]. Incumbent operators were allowed to purchase up to 40 MHz of spectrum, while new entrant operators were able to purchase up to 80 MHz. Nordic Telecom 5G, a new entrant operator, acquired 80 MHz of spectrum, while O2 Czech Republic and Vodafone Czech Republic were allowed to purchase 40 MHz as incumbent operators. A new entrant PODA was also able to purchase 40 MHz.
As stated above we are early in the 5G spectrum auction process, but the above successful auctions did allow significant spectrum acquisitions (e.g. 105, 100, 85, 80, 40 MHz) per operator per region. There were generally 3-4 operators supported per region. Of course, this was afforded by the large amount of spectrum auctioned, but it does show the increased value and utilization of larger allocations per operator along with the support of multiple operators. These early 5G spectrum auctions are also in line with the 5G New Radio channelization planning and development in 3GPP as described above. The results of these early 5G auctions lead us to recommend modifying the current CBRS band rules.
Increasing the available PAL Spectrum to the entire 150 MHz of the 3.5 GHz band will allow for better utilization. Since 5G will require upwards of 40 MHz channels, the allowance of 50 MHz blocks will encourage at least two (and enable three) 5G operators in each geographic area. Thus, this will allow for greater competition in 5G services.
GAA systems will still be allowed to access the entire 150 MHz of the 3.5 GHz band on an as available basis. As such, unlicensed spectrum entities will continue to be able to access this band for their products and services as intended.

Roberson and Associates, LLC ®
9
3.2.1 Facilitation of Greater Investment Overall these rule changes will open the door to far greater investment by the mobile community. Having certainty and clarity around these rules will ensure that the entire mobile value chain will be willing and able to invest in the 3.5 GHz band. Given the global harmonization of this band it will also allow for global scale to be achieved affording greater consumer benefits both in services and in pricing.
3.2.2 Generation of Additional Auction Revenue The recommended changes to the CBRS rules will also permit greater revenue to be realized from the PAL auction. By specifying a 10-year license term, greater geographic coverage and PALs use over the full 3.5 GHz band, the spectrum will be valued on a more traditional economic basis. Without these changes, the potential PAL auction revenue will be far less. Having the ability to have nationwide coverage of future LTE enhancements and 5G will be critical to the success of this band.
3.2.3 Multiple Carrier 5G Competition Without these rule changes the ability of mobile operators to use this 3.5 GHz band for 5G licensed services will be limited. Carrier aggregation up to at least 40 MHz, a lynchpin of LTE enhanced and 5G, will only be able to be achieved by one operator per market. Under current rules mobile operators will also be limited to the number of PALs they can own thus potentially preventing any single operator from providing nationwide, or for that matter region wide, coverage for 5G licensed services. If the Commission wants a competitive enhanced LTE and 5G market than changing the CBRS rules becomes a priority.
In conclusion, should the FCC allow PAL licenses across the entire 150 MHz of the CBRS band and allow aggregation of up to five 10 MHz channels then 50 MHz 5G systems could be made available to three licensees. These operators could then provide services compatible with expected offerings in the rest of the world.
4 REFERENCES [1] “Amendment of the Commission’s Rules with Regard to Commercial Operations in the
3550 – 3650 MHz Band, Report and Order and Second Further Notice of Proposed Rulemaking,” Federal Register, GN Docket No. 12-354, FCC, Washington DC, 21 Apr 2015.
[2] “Amendment of the Commission’s Rules with Regard to Commercial Operations in the 3550-3650 MHz Band, Order on Reconsideration and Second Report and Order,” GN Docket No. 12-354, FCC, Washington DC, 2 May 2016.
[3] Steve B. Sharkey, John Hunter and Christopher Wieczorek, “Petition for Rulemaking to Maximize Deployment of 5G Technologies in the Citizens Broadband Radio Service; Amendment of the Commission’s Rules with Regard to Commercial Operations in the 3550-3650 MHz Band,” T-Mobile USA, Inc., June 19, 2017.

Roberson and Associates, LLC ®
10
[4] “Making 5G NR a reality: Leading the technology innovations for a unified, more capable 5G air interface,” CTIA Super Mobility 2016 -5G Technical Workshop, Qualcomm Technologies, Inc., September 8th, 2016.
[5] “Considerations for the 3.5 GHz IMT range: getting ready for use,” The WRC series, May 2017.
[6] “Spectrum for 4G and 5G,” Qualcomm Technologies, Inc., August 2017.
[7] “Ireland Leading the Way to 5G in the 3.6 GHz Band” Lemay-Yates Associates, Inc., Spectrum, Spectrum Auctions, Spectrum Newsletter, May 22, 2017.
[8] “Czech Republic Auction sees a Surge in Demand for 5G Spectrum”, Sarah McBride, Ovum, August 1, 2017.
[9] 3GPP TR 38.913 V14.3.0 2017-06: Technical Specification Group Radio Access Network; Study on Scenarios for Next Generation Access Technologies.
[10] 3GPP TR 38.912 V14.1.0 2017-06: Technical Specification Group Radio Access Network; Study on New Radio (NR) Access Technology.
[11] 3GPP TR 38.211 V1.0.0 2017-09: Technical Specification Group Radio Access Network; NR; Physical Channels and Modulation (Release 15).
[12] “Accelerating 5G NR for Enhanced Mobile Broadband,” March 2017, Qualcomm, downloaded from https://www.qualcomm.com/invention/technologies/5g-nr
[13] 3GPP WG4 R4-1706929 Way Forward on Spectral Utilization. 27-29 May 2017.
[14] 3GPP WG4 R4-1707091 Discussion on Channel Raster. 21-25 August 2017.

CBRS TECHNICAL ASSESSMENT: CBSD POWER CEILING INCREASE EXTERNAL TO
PROTECTION ZONES
M. BIRCHLER, J. HAUG & M. NEEDHAM 11 OCTOBER 2017
V1.1
ThisanalysiswasgeneratedbyRobersonandAssociates,LLCforT-MobileUSA.
Table of Contents: 1 EXECUTIVE SUMMARY ..................................................................................................... 22 BACKGROUND ...................................................................................................................... 32.1 CBRS SPECTRUM SHARING SYSTEM ................................................................................... 32.2 CBRS DEVICE POWER LIMITS ............................................................................................. 42.2.1 CURRENT FCC RULES ......................................................................................................... 42.2.2 T-MOBILE RECOMMENDED RULE CHANGES ....................................................................... 42.3 PROBLEM DEFINITION .......................................................................................................... 53 ASSESSMENT OVERVIEW ................................................................................................. 53.1 FRAMEWORK ......................................................................................................................... 63.1.1 GENERAL CONSIDERATIONS ................................................................................................ 63.1.2 SCENARIO ............................................................................................................................ 73.2 METHODOLOGY .................................................................................................................... 93.2.1 OVERVIEW ........................................................................................................................... 93.2.1.1 Segments ........................................................................................................................... 93.2.1.2 Interference Power .......................................................................................................... 113.2.2 COMPONENTS .................................................................................................................... 113.2.2.1 CBSD Deployment Model ............................................................................................. 123.2.2.2 Propagation Models ........................................................................................................ 143.2.2.3 Assessment Metric .......................................................................................................... 164 TECHNICAL ASSESSMENT ............................................................................................. 174.1 ASSESSMENT PARAMETER SUMMARY ............................................................................... 174.2 ASSESSMENT RESULTS ........................................................................................................ 185 DISCUSSION ......................................................................................................................... 186 REFERENCES ...................................................................................................................... 19
Roberson and Associates, LLC ®
2
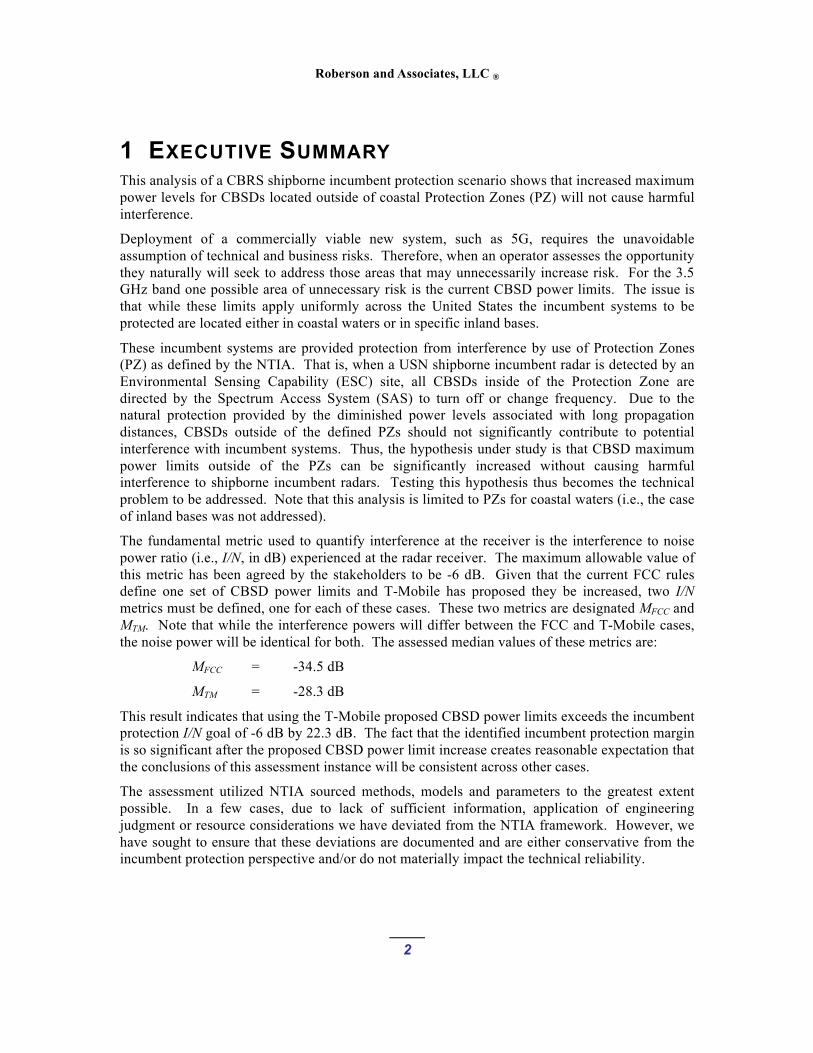
1 EXECUTIVE SUMMARY This analysis of a CBRS shipborne incumbent protection scenario shows that increased maximum power levels for CBSDs located outside of coastal Protection Zones (PZ) will not cause harmful interference.
Deployment of a commercially viable new system, such as 5G, requires the unavoidable assumption of technical and business risks. Therefore, when an operator assesses the opportunity they naturally will seek to address those areas that may unnecessarily increase risk. For the 3.5 GHz band one possible area of unnecessary risk is the current CBSD power limits. The issue is that while these limits apply uniformly across the United States the incumbent systems to be protected are located either in coastal waters or in specific inland bases.
These incumbent systems are provided protection from interference by use of Protection Zones (PZ) as defined by the NTIA. That is, when a USN shipborne incumbent radar is detected by an Environmental Sensing Capability (ESC) site, all CBSDs inside of the Protection Zone are directed by the Spectrum Access System (SAS) to turn off or change frequency. Due to the natural protection provided by the diminished power levels associated with long propagation distances, CBSDs outside of the defined PZs should not significantly contribute to potential interference with incumbent systems. Thus, the hypothesis under study is that CBSD maximum power limits outside of the PZs can be significantly increased without causing harmful interference to shipborne incumbent radars. Testing this hypothesis thus becomes the technical problem to be addressed. Note that this analysis is limited to PZs for coastal waters (i.e., the case of inland bases was not addressed).
The fundamental metric used to quantify interference at the receiver is the interference to noise power ratio (i.e., I/N, in dB) experienced at the radar receiver. The maximum allowable value of this metric has been agreed by the stakeholders to be -6 dB. Given that the current FCC rules define one set of CBSD power limits and T-Mobile has proposed they be increased, two I/N metrics must be defined, one for each of these cases. These two metrics are designated MFCC and MTM. Note that while the interference powers will differ between the FCC and T-Mobile cases, the noise power will be identical for both. The assessed median values of these metrics are:
MFCC = -34.5 dB
MTM = -28.3 dB
This result indicates that using the T-Mobile proposed CBSD power limits exceeds the incumbent protection I/N goal of -6 dB by 22.3 dB. The fact that the identified incumbent protection margin is so significant after the proposed CBSD power limit increase creates reasonable expectation that the conclusions of this assessment instance will be consistent across other cases.
The assessment utilized NTIA sourced methods, models and parameters to the greatest extent possible. In a few cases, due to lack of sufficient information, application of engineering judgment or resource considerations we have deviated from the NTIA framework. However, we have sought to ensure that these deviations are documented and are either conservative from the incumbent protection perspective and/or do not materially impact the technical reliability.

Roberson and Associates, LLC ®
3
2 BACKGROUND
2.1 CBRS Spectrum Sharing System The Federal Communications Commission (FCC) established the Citizens Broadband Radio Service (CBRS) for shared wireless broadband use of the 3550 – 3700 MHz band (3.5 GHz band) by issuance of the Report and Order and Second Further Notice of Proposed Rulemaking [1] and Order on Reconsideration and Second Report and Order [2]. The CBRS spectrum management solution consists of a Spectrum Access System (SAS) with DoD incumbent radar detection provided by Environmental Sensing Capability (ESC) systems.
The CBRS utilizes a three-tier spectrum-sharing solution as defined below:
• Tier 1: Incumbent Access (IA)
• Tier 2: Priority Access (PA)
• Tier 3: General Authorized Access (GAA)
The FCC has defined a Phase 2 sharing solution that utilizes two types of geographic zones (Protection and Non-Protection), each with their own sharing rules. The solution operates by allowing commercial users to request spectrum access from a SAS based on their geographic location.
The following figure shows the currently defined (by the NTIA, [4]) Continental United States (CONUS) Protection Zones (PZ). The coastal zones are demarcated by light blue lines along the Pacific, Atlantic and Gulf coasts. The inland zones associated with military facilities are shown as orange shaded regions.
Figure 1. Coastal and Inland Protection Zones
The SAS utilizes rules that are specific to each of the two geographic zones to manage spectrum access by CBSDs. For Non-Protection zones, the SAS uses only user location to generate a spectrum access response. That is, if the CBSD is located outside the defined Protection Zone,

Roberson and Associates, LLC ®
4
then access will be allowed if other requirements (e.g., proper registration and channel availability, etc.) are met.
For Protection Zones the SAS uses both the user location and incumbent use information from one or more commercial ESC systems to determine if spectrum access will be granted. If the presence of an IA user is detected by one of the ESC systems, then spectrum access is denied to all commercial users with locations inside the predefined Protection Zone. When no incumbent use is detected, the SAS will allow spectrum access just as is done in the Non-Protection zone.
2.2 CBRS Device Power Limits
2.2.1 Current FCC Rules The FCC has amended the Part 96 rules to define the maximum Effective Isotropic Radiated Power (EIRP) for device types that operate in the CBRS band. Figure 2 shows a screenshot of the relevant Part 96 rules section.
Figure 2. Part 96 CBRS Device Power Limits
These device power limits are defined to be uniform over the United States. That is, the same limit applies in Norfolk Virginia as in Lincoln Nebraska.
2.2.2 T-Mobile Recommended Rule Changes As excerpted below, T-Mobile, in [3] proposes that the permitted CBSD output powers be increased.
The Permitted Output Power for Outdoor Operations Should Be Increased. The current rules contain the following effective isotropic radiated power (“EIRP”) limits for CBSDs deployed outdoors: 30 dBm/10 MHz for Category A CBSDs and 47 dBm/10 MHz for Category B CBSDs. The maximum EIRP adopted in the 3.5 GHz band for outdoor operations should be increased. The power limit for Category A CBSDs should be raised by 6 dB while the non- rural and rural Category B CBSD limits should be raised by 2 dB and 9 dB, respectively, to accommodate transmitter variations with respect to outdoor applications. While T-Mobile appreciates that the Commission increased on reconsideration the EIRP limits for non-rural Category B CBSDs from the even lower 40 dBm to 47 dBm, these EIRP limits are still not sufficiently high for robust deployment of 5G technologies. Rather, the existing power levels will limit the coverage that cell sites can achieve, thereby driving up network costs and risking decreased investment in the band.

Roberson and Associates, LLC ®
5
In order for the Commission’s goals for the 3.5 GHz band to be realized, the EIRP limits in Section 96.41(b) must be modified to more accurately reflect real-world deployments. Specifically, the Commission should:
1. Amend the maximum EIRP for outdoor operations at Section 96.41(b) to increase it to: (1) 36 dBm/10 MHz for Category A CBSDs; (2) 49 dBm/10 MHz for Category B non-rural CBSDs; and (3) 56 dBm for Category B rural CBSDs.
As Verizon explained, “[t]here is no evidence that these power levels, which are much lower than traditional macrocell levels, would harm the innovative sharing framework set forth in the [3.5 GHz band].”
T-Mobile has requested that Roberson and Associates provide a technical assessment for use of their proposed higher allowed transmitted power outside of coastal incumbent protected areas.
2.3 Problem Definition Deployment of a commercially viable new system, such as 5G, requires the unavoidable assumption of technical and business risks. Therefore, when an operator assesses the opportunity they naturally will seek to address those areas that may unnecessarily increase risk. For the 3.5 GHz band one possible area of unnecessary risk is the current CBSD power limits. The issue is that, while these limits apply uniformly across the United States, the incumbent DoD systems to be protected are located either in coastal waters or in specific inland bases.
Due to the natural protection provided by long propagation distances, most of the United States’ area that falls outside of the defined Protection Zones will likely insignificantly contribute to potential interference with DoD systems. Testing this hypothesis thus becomes the technical problem to be addressed. The specific technical question to be assessed is:
What is the magnitude of interference to noise power ratio increase at the USN ship’s radar if the power limits on CBSDs outside of the coastal Protection Zone are increased from the currently defined FCC Part 96 values (see Section 2.2.1) to the values proposed by T-Mobile (see Section 2.2.2)?
Note that the above problem definition has excluded the case of interior CONUS DoD bases.
As with all practical technical assessments, numerous decisions must be made concerning the general framework and specific methodologies. The following section defines and discusses these aspects of the hypothesis assessment.
3 ASSESSMENT OVERVIEW This assessment has sought to utilize NTIA sourced methods, models and parameters to the greatest extent possible. In some cases, due to lack of sufficient information, application of engineering judgment or resource considerations we have deviated from the NTIA framework [4].
Given the primacy accorded to incumbent protection in the FCC CBRS rules there is a general imperative to utilize “conservative” means from that perspective. Therefore, where decisions material to the outcome are required we will tend towards those that are credibly conservative from the DoD incumbent’s point of view. However, this general principal must not be taken to such extremes that the assessment’s fairness and/or accuracy unduly suffers.

Roberson and Associates, LLC ®
6
3.1 Framework
3.1.1 General Considerations The primary U.S. Navy incumbent shipborne radars are the Carrier Air Traffic Control (CATC) systems. Thus, a primary consideration is where aircraft carriers are most likely to be found in the United States’ coastal waters. The CONUS has three home ports for these capital ships, those being: Kitsap-Bremerton, Washington; San Diego, California and Norfolk, Virginia. We have chosen Norfolk, with our reasoning supported by Figure 3 and Figure 4.
Figure 3. Geological Map of the CONUS
From the incumbent’s perspective, “conservative” terrain is that which minimizes propagation loss due to geographic features such as mountains. That is, mountains create high propagation losses due to blockage that significantly reduces interference at the receiver. When this consideration is applied to the three aircraft carrier home ports, we note that the two West Coast ports (i.e., Kitsap-Bremerton and San Diego) have significant inland mountainous terrain nearby. However, the inland terrain from Norfolk does not become mountainous until the Appalachian Mountains. Thus, from the perspective of conservative incumbent terrain, the East Coast is clearly preferable.
There is a second major consideration, that being population density. Figure 4 shows a population density (by census tract) map of the United States based on the 2010 census results. As expected, we note a generally higher population density on and interior to the East Coast. Of course, there are high density areas on the West Coast as well. However, the density tends to fall off more quickly as we move inland (and thus outside of the Protection Zones) on the West as compared to the East Coast.

Roberson and Associates, LLC ®
7
Figure 4. Population Density Map of the CONUS
We thus have the advantageous result that from both terrain and population density perspectives the East Coast is clearly the conservative choice from the incumbent’s point of view. We have therefore selected the Norfolk Virginia naval base as the starting point for the assessment.
3.1.2 Scenario USN CATC radars have typically been highly directional in terms of transmit and receive antenna pattern. Due to this fundamental characteristic, estimation of interference at a DoD receiver must be determined within the antenna pattern’s azimuthal bounds. In practice, this requires inclusion of only those CBSDs along the antenna’s boresight azimuth that are within a circle sector at the specified radius and angular antenna pattern width. A simplified diagram describing this characteristic is shown in the following figure.
Figure 5. Directional USN CATC Radar
Returning to the geological and population density maps, note that a south-west path beginning at Norfolk has two advantageous attributes, those being it (1) stays east of the Appalachian Mountains and (2) passes through relatively high population density areas in North Carolina and Georgia. Due to these attributes, we have selected the primary assessment path to be that shown by Figure 6.
The map shown in this figure was generated using Google Earth Pro. The NTIA Protection Zone boundary [4] has been overlaid (light-blue line segments) using the KML file provided by the NTIA. The primary path is shown by two line segments, blue for inside the Protection Zone and red for outside. The distance from the coast to the Protection Zone boundary along this path has

Roberson and Associates, LLC ®
8
been determined to be approximately 70 km while the distance along this path from the Protection Zone boundary to Charlotte, North Carolina is approximately 390 km.
With regard to population centers outside of the Protection Zone, the radar boresight path passes just north of Rayleigh NC (metro population 1.2 million), and through Charlotte NC (metro population 2.5 million). Note also that this path stays to the east of the Appalachian Mountains.
Figure 6. Primary Assessment Path: Protection Zone (PZ) and Geography
Figure 7 provides a population density view of the primary assessment path (dashed red line). This view confirms that the path passes through high density population areas. Note also that there is not an equivalent path to the west or north-west. In particular, note that although the city of Richmond VA is a high-density area to the north-east, it is located inside the Protection Zone (see Figure 6).
Figure 7. Primary Assessment Path: Population Density
Although we cannot claim that the selected primary path is the most conservative, we are confident that its characteristics are uniformly in the conservative direction. As will be discussed in the following sections, we will continue to apply this conservative philosophy (from the

Roberson and Associates, LLC ®
9
incumbent’s perspective) to model and parameter choices associated with the assessment methodology.
3.2 Methodology
3.2.1 Overview Context for the following methodology is provided by Figure 8. Note that a USN nuclear aircraft carrier (CVN) is located offshore near to the Norfolk Naval Base. At the instant of this assessment the CATC radar boresight (red line) is pointing in the direction of Charlotte North Carolina. The resulting antenna pattern (yellow shaded shape) is shown as a circle sector of approximate radius 850 km and 2.3º angular width.
Figure 8. Assessment Methodology Context Diagram
Thus, at this assessment instant only those CBSDs (this analysis will ignore End User Devices) that are located within the antenna pattern are assumed to contribute to interference power at the radar receiver. Note that although the antenna pattern shown extends past Atlanta, the assessment does not need not include this metropolitan area because propagation loss renders CBSDs located there insignificant to the results. Therefore, we have only assessed this pattern out to approximately 500 km (which includes Charlotte NC), as power contributions become insignificant at extremely long propagation distances.
Figure 8 also introduces the concept of “radar pattern segments” or “Segments.” Segments are defined as regions bounded by the radar pattern with boundaries uniformly spaced in the boresight direction. That is, we draw lines that are perpendicular to the boresight line at uniform intervals (1 km intervals are used in the assessment).
3.2.1.1 Segments The first necessary step in describing the methodology is to define these Segments. Starting at the ship, the first segment has a near boundary at a distance of zero from the antenna and a far boundary at 1 km. This first Segment will be designated as S0. The second Segment will have a

Roberson and Associates, LLC ®
10
near boundary at 1 km and far at 2 km. Thus, in general, Sector number k (Sk) will have a near boundary at distance k km and far boundary at (k+1) km from the ship’s radar antenna. Figure 9 shows a detailed view into Sector k (Sk) in support of the following description.
Figure 9. Detail of Sector k
Note that Sector k is shown to contain three distinct types of CBSDs, those being Category A, Category B (non-rural) and Category B (rural). Recall that these are the three types discussed in Section 2.2.2. Details concerning estimation of the number of each CBSD type can be found in Section 3.2.2.1. For purpose of this overview, we need only define that in each Sector the number of these CBSD types will be determined, which will be conveyed by the following notation:
NA,k = Number of Category A CBSDs in Segment k
NB-NR,k = Number of Category B (non-rural) CBSDs in Segment k
NB-R,k = Number of Category B (rural) CBSDs in Segment k.
The actual estimated number of these three CBSD types will depend on numerous factors including Segment area, population density and environment classification (e.g., rural, suburban, urban).
Next, note that along the radar boresight line and equidistant from the two boundaries, an icon called the “Propagation Location” is shown. This is the location at which the selected propagation model (see Section 3.2.2.2 for details) is evaluated for propagation loss from that point to the USN radar antenna. We will calculate two propagation loss values: (1) Category A and B (non-rural) CBSDs and (2) Category B (rural) CBSDs, which are denoted by:
Lk,1 = Propagation path loss from Propagation Location k to the USN radar antenna (linear, i.e., not in dB) for Category A and B (non-rural) CBSDs with a 6-meter antenna height
Lk,2 = Propagation path loss from Propagation Location k to the USN radar antenna (linear, i.e., not in dB) for Category B (rural) CBSDs with a 12-meter antenna height.
The purpose of these concepts is to reduce the assessment complexity by breaking the problem into appropriately sized “block-calculations.” That is, rather than using a methodology that handles calculations at the per-CBSD level (of which there can be many thousands), we use one that allows “block-level” (or in this case, “Segment-level”) processing. As long as the Segments

Roberson and Associates, LLC ®
11
are defined to be small enough relative to the metropolitan areas under study then the loss in estimation accuracy will be small.
3.2.1.2 Interference Power Given the above definition for Segments, we can now proceed to describe interference power (at the USN radar) estimation. First, we must define the transmit powers of the three CBSD types as follows:
PA = Transmit power of a Category A CBSD
PB-NR = Transmit power of a Category B (non-rural) CBSD
PB-R = Transmit power of a Category B (rural) CBSD.
The units for these three power definitions are all Effective Isotropic Radiated Power (EIRP, in mW) in a 10 MHz bandwidth.
We have now defined all of the parameters necessary to calculate the per-Segment interference power contribution (i.e., Ik) at the USN radar antenna:
𝐼" = 𝐿",&[𝑃)𝑁)," + 𝑃,-./𝑁,-./,"] + 𝐿",1𝑃,-/𝑁,-/," (1)
where the units are linear power in mW as measured over a 10 MHz bandwidth as demarcated by a CBRS channel.
Note that Equation (1) is simplified by the fact that a constant propagation loss is applied to the two grouping of CBSDs, those being [Category A and Category B (non-rural)] and [Category B (rural)]. As will be discussed in Sections 3.2.2.1 and 3.2.2.2, we have modeled the CBSD population to also cover indoor operation with associated building loss and have included “clutter loss” factors for suburban and urban locations. Were these details included in this development the notational and mathematical complexity would increase significantly. We have therefore neglected inclusion of these details.
Thus, if a total number of Segments included in the estimation is designated as KTOT, then the total estimated interference power (𝕀343, in mW) at the USN radar antenna is calculated as follows.
𝕀343 = 𝐼"5676-&"89 (2)
Thus, we have described a methodology that allows the efficient estimation of interference power within context of a directional USN radar system. The following sections will provide detailed information on the various components as well as the assessment metric.
3.2.2 Components The previous section provided a high-level description of the assessment methodology. However, many implementation decisions and details must be added in order to complete the technical description. Therefore, the following sections will provide these details for the major assessment components.

Roberson and Associates, LLC ®
12
3.2.2.1 CBSD Deployment Model We use a deployment model in which the density of CBSD sites is tied to the population within a region, as was done in the NTIA study TR 15-517 [4]. There are two components to this. First, the CBSD densities are a function of whether a regional environment is designated as Urban, Suburban, or Rural. To assign these environment designations, we rely on the US Census Bureau’s definition for an urban region a consisting of a population of 1000 or more per square mile [8]. Similarly, a rural region is considered to have a population of less than 500 per square mile [9]. Areas with population densities between these values are designated as Suburban. We may then apply this definition on a Census Tract level such that each tract is classified as Urban, Suburban, or Rural. Figure 10 below shows a map of the Eastern US with the Census Tracts color-coded as one of the three environments. Overlaid on the map is the 2.3 degree radar sweep pattern which extends to 500 km, along with the NTIA PZ boundary. It can be seen that the majority of geographic areas are Rural, but that the radar sweep crosses the major urban areas outside the PZ of Durham-Rayleigh and Charlotte in North Carolina.
Figure 10. Census Tract Population Densities Around Radar Sweep
The second component related to population is the assignment of CBSD densities as a function of population, as well as environment. To model the population densities within the radar sweep pattern, we first drop random points within each Census Tract such that the number of points is proportional to the tract population density – specifically, each point will represent 100 population. Figure 11 below shows the resulting distribution of population points, with those falling inside the radar sweep pattern appearing as red. Again, it can be seen that the radar sweep pattern encompasses areas of high population density outside of the PZ.

Roberson and Associates, LLC ®
13
Figure 11. Population Points Outside and Within Radar Sweep Pattern
We adopt the formulation used in TR 15-517 [4] to determine the density of CBSDs, based on the flowing assumptions:
• In Urban areas, the number of people sharing a CBSD is 50; in Suburban areas, this number is 20, and in Rural areas, the number is 3. This reflects the assumption that in Urban areas, CBSDs would be deployed as “hot spots” in public places, where they are shared among many people, while in rural areas, CBSDs would be deployed in private residences, and only shared among members of a household.
• In Urban areas, there is additionally a 15% increase in population due to a “daytime commuter adjustment factor” (D), reflecting the assumption that a portion of those using the hot spots are not from the local urban population.
• There is a 20% market penetration (MP) of CBSDs, that is, only 20% of the population are using CBSDs in a given area.
• There is a “channel scaling factor” (CS) of 10%, reflecting the assumption that the CBSDs are deployed across a bandwidth of 100 MHz in the 3.5 GHz spectrum, while we are examining the interference only within a 10 MHz block.
The consequent formulas for the number of CBSDs N in a region with population P is as follows:
𝑛;<=>? =𝑃 ⋅ (1 + 𝐷) ⋅ 𝑀𝑃 ⋅ 𝐶𝑆
50 (3)
𝑛JK=K<= = 𝑃 ⋅ 𝑀𝑃 ⋅ 𝐶𝑆20 (4)
𝑛/K<>M = 𝑃 ⋅ 𝑀𝑃 ⋅ 𝐶𝑆3 (5)
As explained above, D = 0.15, MP = 0.2, and CS = 0.1. Additionally, a population point in this model specifically represents P = 100 population (as opposed to the NTIA formulation, in which P is defined over a generic region), so each point now represents a number of CBSDs according to the above formulas, based on the environment type of the Census Tract in which the point is located.

Roberson and Associates, LLC ®
14
Each point is subsequently randomly assigned to be Category A or B (rural or non-rural), according to the defined percentage of each for the associated tract environment, as given in Section 4.1. The total transmitted interference power from each Sector in the radar sweep pattern (explained in Section 3.2.1.1) is then the sum of powers from each point, scaled according to the number of CBSDs assigned to each point per the equations above and the transmit power per their CBSD category. Additionally, a channel usage factor is also applied to each point, to account for non-continuous channel usage. The channel usage factor is based on the environment type, identical to what was done in NTIA TR 15-517 [4], as shown in Table 1 below.
Parameter Urban Suburban Rural
Channel Usage Factor 60 % 40 % 20 %
Table 1. Channel Usage Factors
The received power at the target offshore ship from each Sector is then calculated based on the path loss between the Sector and the ship, as explained in Section 3.2.2.2 below.
3.2.2.2 Propagation Models For this assessment, we chose to look at contributions to the total interference power from CBSDs that could be hundreds of kilometers from the USN ship’s radar. Existing empirical models (e.g., Hata, et. al.) are known to be validated over a significantly smaller distance (e.g., 20 km). Because it is one of the few propagation models that is valid over long distances and includes multiple modes of propagation that are experienced over long paths, the Irregular Terrain Model (ITM) (available from NTIA and based on the seminal work by Longley and Rice, among others) has been used in this study. Information on the ITM can be found in [5].
Various implementations of the models described in [5] have been developed over the last five decades. Two important implementations may be obtained from the NTIA website. One is a C code implementation of the key ITM algorithms. This code has been adapted into a number of tools for predicting path loss, including a common open source program called “SPLAT!” [7] that can compute point-to-point path loss and a set of underlying terrain tiles.
In addition, the NTIA website contains a link to a complete tool called Microcomputer Spectrum Analysis Models (MSAM) that implement point-to-point calculations using either terrain tile data or, in what is known as the “area mode” calculation. The NTIA report of [6] was particularly valuable for providing substantive guidance. In “area mode,” the overall effect of irregular terrain is encapsulated in a factor (Dh) called the “terrain irregularity.”
The propagation loss estimates used in this assessment were obtained using MSAM in the “area mode.” The following parameters were used in this analysis and a complete description of them may be found in the referenced documents.
Parameter Value (Units)
Frequency 3550 (MHz)
Radar Antenna Height (above water) 50 (meters)
Distance Variable: 1.5-650 (km)
Dielectric constant of ground 15
Conductivity of ground .005 S/m
Surface refractivity 301 (N-units)
Roberson and Associates, LLC ®
15
Polarization Horizontal
Climate Continental Temperate
Terrain Irregularity (Dh) 90
Siting Criteria Careful
Time and Situation variability (50, 50)
CBSD Antenna Height 6, 12 (meters)
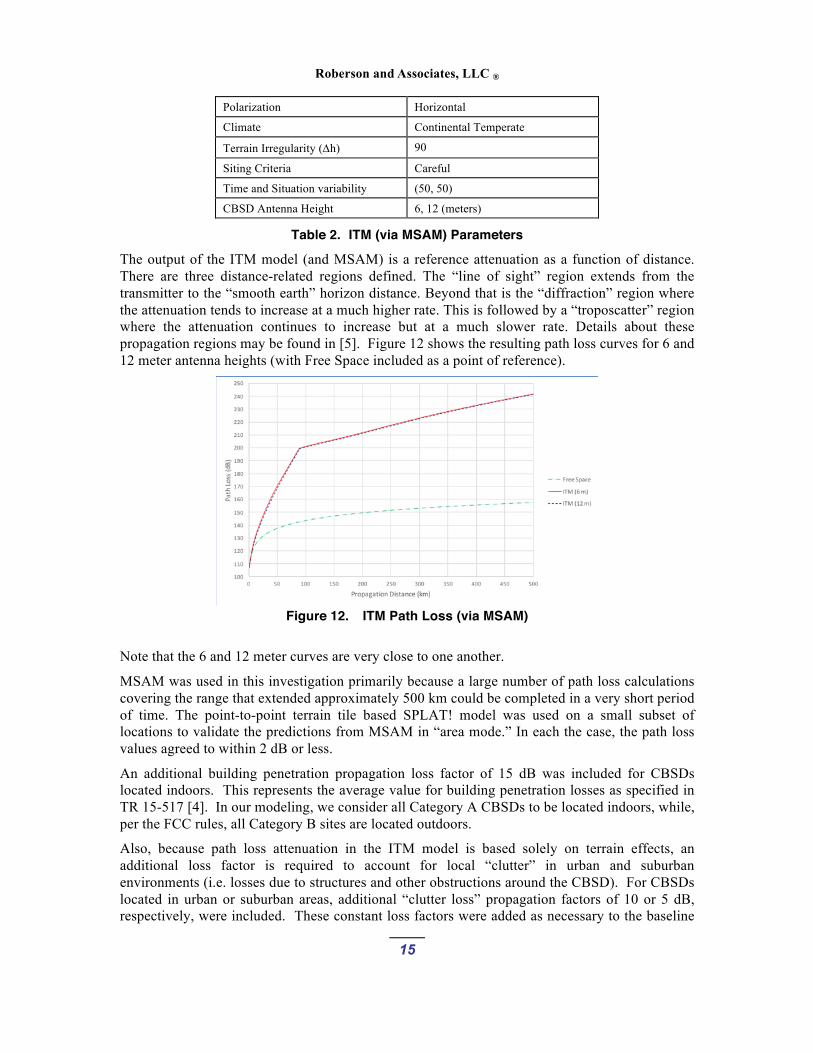
Table 2. ITM (via MSAM) Parameters
The output of the ITM model (and MSAM) is a reference attenuation as a function of distance. There are three distance-related regions defined. The “line of sight” region extends from the transmitter to the “smooth earth” horizon distance. Beyond that is the “diffraction” region where the attenuation tends to increase at a much higher rate. This is followed by a “troposcatter” region where the attenuation continues to increase but at a much slower rate. Details about these propagation regions may be found in [5]. Figure 12 shows the resulting path loss curves for 6 and 12 meter antenna heights (with Free Space included as a point of reference).
Figure 12. ITM Path Loss (via MSAM)
Note that the 6 and 12 meter curves are very close to one another.
MSAM was used in this investigation primarily because a large number of path loss calculations covering the range that extended approximately 500 km could be completed in a very short period of time. The point-to-point terrain tile based SPLAT! model was used on a small subset of locations to validate the predictions from MSAM in “area mode.” In each the case, the path loss values agreed to within 2 dB or less.
An additional building penetration propagation loss factor of 15 dB was included for CBSDs located indoors. This represents the average value for building penetration losses as specified in TR 15-517 [4]. In our modeling, we consider all Category A CBSDs to be located indoors, while, per the FCC rules, all Category B sites are located outdoors.
Also, because path loss attenuation in the ITM model is based solely on terrain effects, an additional loss factor is required to account for local “clutter” in urban and suburban environments (i.e. losses due to structures and other obstructions around the CBSD). For CBSDs located in urban or suburban areas, additional “clutter loss” propagation factors of 10 or 5 dB, respectively, were included. These constant loss factors were added as necessary to the baseline
Roberson and Associates, LLC ®
16
propagation loss predicted by ITM. Note that these values for clutter loss are very conservative, as it has been shown that the use of ITM without any clutter correction gives path losses 10 to 30 dB lower than the corresponding losses for models which explicitly include urban clutter, such as Extended Hata [10].
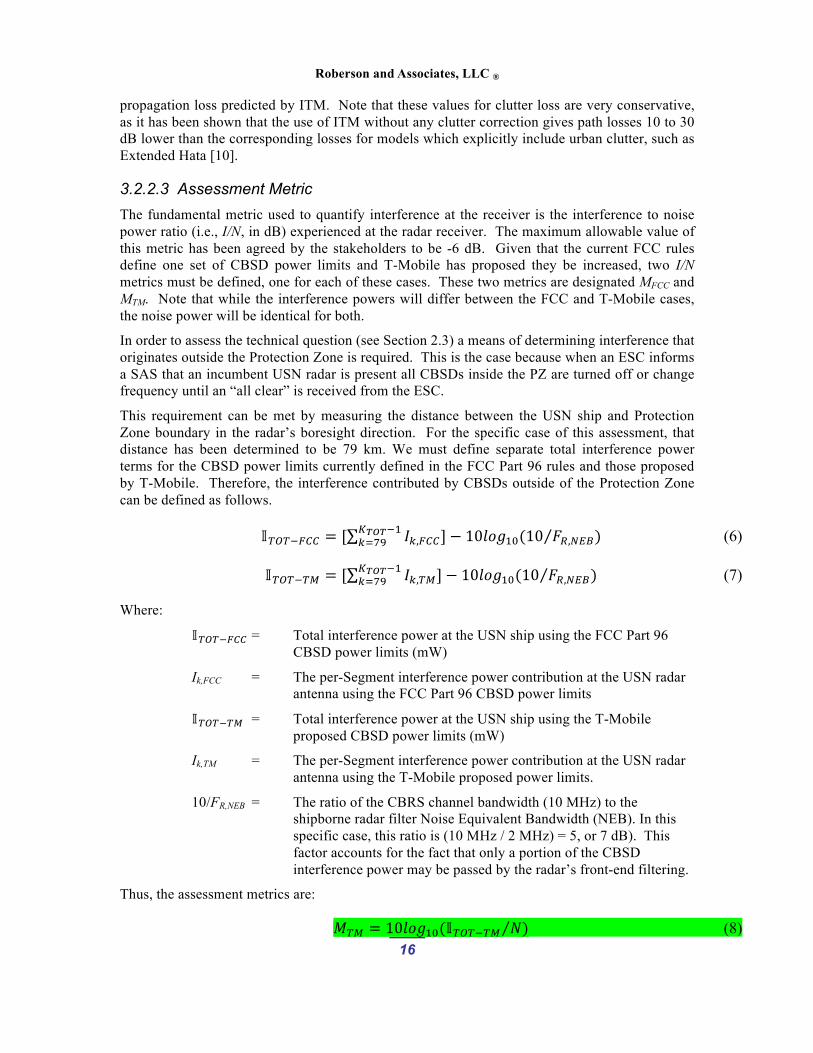
3.2.2.3 Assessment Metric The fundamental metric used to quantify interference at the receiver is the interference to noise power ratio (i.e., I/N, in dB) experienced at the radar receiver. The maximum allowable value of this metric has been agreed by the stakeholders to be -6 dB. Given that the current FCC rules define one set of CBSD power limits and T-Mobile has proposed they be increased, two I/N metrics must be defined, one for each of these cases. These two metrics are designated MFCC and MTM. Note that while the interference powers will differ between the FCC and T-Mobile cases, the noise power will be identical for both.
In order to assess the technical question (see Section 2.3) a means of determining interference that originates outside the Protection Zone is required. This is the case because when an ESC informs a SAS that an incumbent USN radar is present all CBSDs inside the PZ are turned off or change frequency until an “all clear” is received from the ESC.
This requirement can be met by measuring the distance between the USN ship and Protection Zone boundary in the radar’s boresight direction. For the specific case of this assessment, that distance has been determined to be 79 km. We must define separate total interference power terms for the CBSD power limits currently defined in the FCC Part 96 rules and those proposed by T-Mobile. Therefore, the interference contributed by CBSDs outside of the Protection Zone can be defined as follows.
𝕀343-OPP = [ 𝐼",OPP] − 10𝑙𝑜𝑔&9(10 𝐹/,.V,)5676-&"8WX (6)
𝕀343-3Y = [ 𝐼",3Y] − 10𝑙𝑜𝑔&9(10 𝐹/,.V,)5676-&"8WX (7)
Where:
𝕀343-OPP = Total interference power at the USN ship using the FCC Part 96 CBSD power limits (mW)
Ik,FCC = The per-Segment interference power contribution at the USN radar antenna using the FCC Part 96 CBSD power limits
𝕀343-3Y = Total interference power at the USN ship using the T-Mobile proposed CBSD power limits (mW)
Ik,TM = The per-Segment interference power contribution at the USN radar antenna using the T-Mobile proposed power limits.
10/FR,NEB = The ratio of the CBRS channel bandwidth (10 MHz) to the shipborne radar filter Noise Equivalent Bandwidth (NEB). In this specific case, this ratio is (10 MHz / 2 MHz) = 5, or 7 dB). This factor accounts for the fact that only a portion of the CBSD interference power may be passed by the radar’s front-end filtering.
Thus, the assessment metrics are:
𝑀3Y = 10𝑙𝑜𝑔&9(𝕀343-3Y 𝑁) (8)

Roberson and Associates, LLC ®
17
and
𝑀OPP = 10𝑙𝑜𝑔&9(𝕀343-OPP 𝑁) (9)
Where the mean noise power (NdBm in dBm) is determined as a function of the radar (the USN SPN-43 is assumed here) filter Noise Equivalent Bandwidth (FR,NEB, 2 MHz) and Noise Figure (NF,R, 4 dB):
𝑁Z,[ = −174 + 𝑁O,/ + 10𝑙𝑜𝑔&9 10^𝐹/,.V, (10)
and therefore, in mW:
𝑁 = 10._`a &9 (11)
Thus, 𝑀3Y and 𝑀OPP represent the mean I/N ratios in units of dB for the two cases under study. With the definition of these metrics all of the necessary components have been defined to enable the technical assessment.
4 TECHNICAL ASSESSMENT
4.1 Assessment Parameter Summary As has been previously discussed, population density estimates are used to classify segments into one of three types, those being Rural, Suburban and Urban. Each segment type used a distribution of CBSD types as defined by the NTIA [4], as shown in Table 3.
CBSD Type Segment Type (% CBSD Type)
Rural (< 500/mi2) Suburban Urban (> 1000/mi2)
Category A 99 99 80
Category B (non-rural) 0 1 20
Category B (rural) 1 0 0
Table 3. CBSD Distribution by Segment Type
Technical assessments have been conducted for two sets of CBSD parameters. Table 4 shows the baseline parameter set. The power values are based on the current FCC CBRS rules, while the antenna height values were selected by the authors.
CBSD Type Inside Protection Zone Outside Protection Zone
Power (dBm/10MHz)
Antenna Height (m)
Power (dBm/10MHz)
Antenna Height (m)
Category A 30 6 30 6
Category B (non-rural) 47 6 47 6
Category B (rural) 47 12 47 12
Table 4. FCC Baseline CBSD Parameters

Roberson and Associates, LLC ®
18
Table 5 shows the Power values that have been proposed by T-Mobile. Note that the power values for inside the Protection Zone are unchanged from those of Table 4. However, the outside Protection Zone power values have been set to the values proposed by T-Mobile (see Section 2.2.2). Finally, note that the height values in Table 5 are identical to those of Table 4.
CBSD Type Inside Protection Zone Outside Protection Zone
Power (dBm/10MHz)
Antenna Height (m)
Power (dBm/10MHz)
Antenna Height (m)
Category A 30 6 36 6
Category B (non-rural) 47 6 49 6
Category B (rural) 47 12 56 12
Table 5. T-Mobile Proposed CBSD Parameters
Note that the outdoor CBSD power limits were used regardless of if the CBSD is in or outdoors, which is conservative from the incumbent’s perspective. Again, in our model, all Category A CBSDs are considered to be indoors, while Category B sites are all outdoors. The parameters shown in the above tables have been used within context of the assessment methodology to generate the following results.
4.2 Assessment Results Note that due to the use of statistical techniques within the methodology (i.e., CBSD category assignments) the metric quantitative values vary for each model iteration. Therefore, the reported metric values were obtained by taking the average of 500 model iterations.
Whereas the MFCC metric was calculated using the parameters from Table 3 and Table 4, the MTM metric used parameters from Table 3 and Table 5. Additional models and associated parameters utilized in these calculations can be found in Sections 3.2.2.1 and 3.2.2.2.
The results are:
MFCC = -34.5 dB
MTM = -28.3 dB
This result indicates that using the T-Mobile proposed CBSD power limits (see Table 5) exceeds the incumbent protection I/N goal of -6 dB by 22.3 dB. This protection margin gives confidence that sufficient protection is likely to be provided for other cases as well.
5 DISCUSSION The preceding assessment has sought to utilize NTIA sourced methods, models and parameters to the greatest extent possible. In some cases, due to lack of sufficient information, application of engineering judgment or resource considerations we have deviated from the NTIA framework [4]. However, we have sought to ensure that these deviations are either conservative from the incumbent protection perspective and/or do not materially impact technical reliability. These differences are sufficiently documented to allow informed stakeholder review and commentary.

Roberson and Associates, LLC ®
19
The primary technical results of this assessment are supportive of the T-Mobile CBSD power limit proposals. Note that this assessment deals only with the issue of increased power limits for CBSDs located outside of the Protection Zones.
As disclosed in Section 4.2, the assessment results support the hypothesis that significant CBSD power limit increases outside of the Protection Zones are unlikely to negatively impact incumbent interference protection. The fact that the identified incumbent protection margin is so significant creates reasonable expectation that the conclusions of this assessment instance will be consistent across other cases.
6 REFERENCES [1] “Amendment of the Commission’s Rules with Regard to Commercial Operations in the
3550 – 3650 MHz Band, Report and Order and Second Further Notice of Proposed Rulemaking,” Federal Register, GN Docket No. 12-354, FCC, Washington, DC, 21 Apr 2015.
[2] “Amendment of the Commission’s Rules with Regard to Commercial Operations in the 3550-3650 MHz Band, Order on Reconsideration and Second Report and Order,” GN Docket No. 12-354, FCC, Washington, DC, 2 May 2016.
[3] Steve B. Sharkey, John Hunter and Christopher Wieczorek, “Petition for Rulemaking to Maximize Deployment of 5G Technologies in the Citizens Broadband Radio Service; Amendment of the Commission’s Rules with Regard to Commercial Operations in the 3550-3650 MHz Band,” T-Mobile USA, Inc., June 19, 2017.
[4] E. Drocella et al., 3.5 GHz Exclusion Zone Analyses and Methodology, NTIA Report 15-517, March 2016.
[5] Loss Predictions for Tropospheric Communications Circuits,” NBS Tech. Note 101, Vols. I and II, NTIA, 1967.
[6] G. A. Hufford, A. G. Longley, W. A. Kissick, “A Guide to the Use of the ITS Irregular Terrain Model in the Area Prediction Mode,” NTIA Report 82-100, April 1982.
[7] “SPLAT! A Terrestrial RF Path Analysis Application for Linux/Unix,” http://www.qsl.net/kd2bd/splat.html.
[8] United States Census Bureau, “Urban and Rural,”
https://www.census.gov/history/www/programs/geography/urban_and_rural_areas.html
[9] United States Department of Agriculture Economic Research Service, “What is Rural?”, https://www.ers.usda.gov/topics/rural-economy-population/rural-classifications/what-is-rural.aspx
[10] Susan P. Tonkin, “A Tutorial on the Hata and ITM Propagation Models: Confidence, Reliability, and Clutter with Application to Interference Analysis,” Version 1.0, January 27, 2017.

601 Pennsylvania Ave. NW
North Building, Suite 800
Washington, DC 20004
October 2, 2017
Written Ex Parte Communication
Ms. Marlene H. Dortch
Secretary
Federal Communications Commission
445 12th Street, S.W.
Room TW-A325
Washington, D.C. 20554
Re: Use of Spectrum Bands Above 24 GHz for Mobile Radio Services, GN Docket No.
14-177; IB Docket Nos. 15-256, 97-95; WT Docket No. 10-112
Dear Ms. Dortch:
T-Mobile USA, Inc. (“T-Mobile”)1 submits the attached technical study, which responds to the
questions posed in the Commission’s Spectrum Frontiers Report and Order and Further Notice
regarding how best to promote 5G deployment in the bands above 24 GHz while protecting
incumbent services, including the passive radio astronomy and passive earth-exploration satellite
services adjacent to several of the targeted bands.2 The study concludes that 5G deployments in
the 32 GHz, 47 GHz, and 50 GHz bands can coexist with existing radio astronomy services
(“RAS”) and the Earth Exploration Satellite Service (“EESS”).
The study analyzes the potential for coexistence between 5G wireless broadband operations and
passive services located adjacent to the proposed frequencies of 5G operations in the 32 GHz, 47
GHz, and 50 GHz bands. The study relies on widely accepted assumptions regarding the
operating parameters of future 5G technologies as well as current RAS and EESS operations.
Wherever possible, the study employs ITU recommendations and conservative inputs that tend to
overstate the potential likelihood of interference to RAS and EESS operations. Notwithstanding
the use of conservative assumptions biased against a finding of no harmful interference, the
1 T-Mobile USA, Inc. is a wholly owned subsidiary of T-Mobile US, Inc., a publicly traded company.
2 Use of Spectrum Bands Above 24 GHz for Mobile Radio Services, Report and Order and Further Notice
of Proposed Rulemaking, 31 FCC Rcd 8014 (2016).

October 2, 2017
Page 2
analysis demonstrates how coexistence among 5G and RAS and EESS operations in the 32 GHz,
47 GHz, and 50 GHz bands is readily feasible.
In each of the bands studied, the FCC can protect RAS, EESS, and other passive services against
harmful interference by adopting modest operating constraints on new 5G broadband services.
For example, adopting geographic separation and coordination zone requirements can protect
RAS operations with little effect on 5G deployments nationwide because RAS sites are limited in
number and mostly located in remote areas. Similarly, technical innovations in 5G systems will
substantially limit the aggregate amount of out-of-band emissions EESS will experience even
under line-of-sight conditions. These and other factors support the conclusion that 5G operations
in the 32 GHz, 47 GHz, and 50 GHz bands can coexist with passive services without risking
harmful interference even under worst-case conditions.
This study of 5G coexistence scenarios offers an important foundation for further analysis.
Real-world conditions are likely to prove much more favorable to coexistence than the
assumptions we employ here. Furthermore, once the final 5G standard is known, new
mechanisms for coexistence that have not yet been addressed here may prove worthy of further
analysis. Even under the worst-case assumptions and conditions identified in this study,
however, traditional sharing techniques, such as coordination, exclusion zones, and possibly
certain constraints on 5G operations on some channels and in some geographies, will permit
next-generation wireless broadband services in the 32 GHz, 47 GHz, and 50 GHz bands to
coexist with adjacent-channel RAS, EESS, and other passive services on adjacent frequencies.
* * *
Should the Commission have questions concerning this filing, please feel free to contact me.
Sincerely,
/s/ Steve Sharkey
Steve B. Sharkey
Vice President, Government Affairs
Technology and Engineering Policy
T-Mobile USA, Inc.
(202) 654-5900

UNLEASHING MILLIMETER WAVE SPECTRUM IN THE 32 GHZ, 47 GHZ, AND 50 GHZ BANDS:
WITH THE EARTH EXPLORATION SATELLITE SERVICE AND RADIO ASTRONOMY SERVICE
COEXISTENCE OF MOBILE BROADBAND OPERATIONS

T-Mobile | 5G Coexistence Study
Executive SummaryThe Federal Communications Commission (“FCC”) has proposed service rules to support next-generation wireless services in numerous bands above 24 GHz. Recent technical developments have made these bands capable of supporting very high speed, very low latency broadband services. But some of these bands are adjacent to passive services that require protection against harmful interference. In its Spectrum Frontiers Further Notice, the FCC posed a series of questions regarding how best to promote 5G deployment in these frequencies while protecting incumbent services, including the passive radio astronomy and passive earth-exploration satellite services. This report studies the potential for coexistence between 5G wireless broadband operations in the 32 GHz, 47 GHz, and 50 GHz bands and passive services located adjacent to the proposed frequencies of operation. We conclude that 5G deployments in the 32 GHz, 47 GHz, and 50 GHz bands can coexist with existing radio astronomy services (“RAS”), Earth Exploration Satellite Service (“EESS”), and other passive services without causing harmful interference. To reach this conclusion, we relied on widely accepted assumptions regarding the operating parameters of future 5G technologies as well as current RAS and EESS operations. Wherever possible, we employed ITU recommendations and conservative inputs that overstate the potential likelihood of interference to RAS and EESS operations. Notwithstanding our use of very conservative assumptions biased against a finding of no harmful interference, coexistence among 5G and RAS and EESS operations in the 32 GHz, 47 GHz, and 50 GHz bands is readily feasible.
In each of the bands studied, the FCC can protect RAS, EESS, and other passive services against harmful interference from new 5G deployments by adopting modest operating constraints on new 5G broadband services. RAS sites are limited in number and mostly located in remote areas; therefore, adopting a set of geographic separation and coordination zone requirements can protect RAS operations with little effect on 5G deployments nationwide. Similarly, although EESS sensors can scan the entire globe, EESS will experience more path loss than RAS and technical innovations in 5G systems will substantially limit the aggregate amount of out-of-band emissions EESS will experience even under line-of-sight conditions. Specifically, to overcome the poor propagation characteristics of millimeter wave bands, 5G will implement beamforming in both base stations and mobile devices. Beamforming will result in the majority of power directed along the primary

T-Mobile | 5G Coexistence Study
communications path and very little in other directions, and therefore it will improve the ability of 5G base stations and mobile devices to protect passive services in adjacent bands. For example, the primary communications path between a base station and a mobile device is almost never vertical, as would be required to direct interference power at an EESS satellite. Thus beamforming helps to create a large amount of antenna discrimination in the direction of potential victim receivers. In addition, mobile devices transmitting in the spectrum immediately adjacent to the passive band will typically use less than the entire 200 (or 500) megahertz-wide channel, which will further reduce the potential for interference into EESS. Taken together, these factors support the conclusion that 5G operations in the 32 GHz, 47 GHz, and 50 GHz bands can coexist with passive services.
32 GHZ BROADBAND DEPLOYMENTS
The FCC proposed allocating the 31.8-33.4 GHz band for next-generation wireless broadband operations. Immediately below these frequencies, however, is a five hundred megahertz wide primary allocation for RAS, EESS, and other passive services, such as space research. Of the three millimeter wave bands under consideration for supporting 5G services, the 32 GHz band may pose the greatest challenge because this band has relatively favorable propagation characteristics compared to the 47 GHz and 50 GHz frequency bands. But even the 32 GHz band can coexist with passive services in adjacent-band spectrum for numerous reasons, including the necessity of using beamforming to overcome the propagation limitations associated with millimeter wave spectrum, as described above. Beamforming and other 5G innovations will permit 32 GHz broadband deployments to coexist with passive services.
47 GHZ BROADBAND DEPLOYMENTS
The FCC proposed allocating the 47.2-50.2 GHz band for 5G services. In its Spectrum Frontiers Further Notice, the FCC asked what additional safeguards might be needed to protect EESS in the 50.2-50.4 GHz band against the risk of potential interference from 5G deployments in the 47.2-50.2 GHz band. As in the 32 GHz band, the 47 GHz band can support 5G without the need for guard bands or other excessively burdensome constraints to protect adjacent channel passive services given practical constraints on how operators will actually have to deploy 5G services in the field. One of the few analytical differences between our study of the 47 GHz and 32 GHz scenarios is the FCC’s proposal to use 500 megahertz channels in the 47 GHz band instead of the 200 megahertz channels the agency has proposed to use in the 32 GHz band. Because out-of-band emissions from larger channels attenuate or “roll-off” more slowly than emissions from smaller channels, the larger channels proposed for the 47 GHz band have greater potential to increase the interference risk for adjacent EESS and other passive services compared to those adjacent to 32 GHz; however, the additional propagation losses at the higher 47 GHz frequencies offset the increase in risk associated

T-Mobile | 5G Coexistence Study
with larger channels. The results of our 47 GHz analysis are promising enough to allow for the development of protection measures to ensure compatible operations between 5G and passive services without undue constraints on new 5G deployments.
50 GHZ BROADBAND DEPLOYMENTS
The FCC proposed to allocate the 50.4-52.6 GHz band for 5G use. The same types of passive EESS and space research services found in the 32 GHz and 47 GHz band bookend both the lower and upper portions of this 2200 megahertz of spectrum, and the passive band at the lower end is the same band that is adjacent to the upper portion of the 47 GHz band (i.e. 50.2-50.4 GHz). Not surprisingly, the same basic analysis that applied to the 32 GHz and 47 GHz bands applies to the 50 GHz band: the 50 GHz band can support 5G without excessively burdensome constraints on 5G to protect adjacent channel passive services. Among other things, the types of smaller, 200 megahertz channels the FCC has proposed for the 50 GHz band as well as the inferior propagation characteristics of the 50 GHz band relative to lower-frequency spectrum make the 50 GHz especially manageable for 5G deployment. That said, achieving sufficient protection for EESS in the 50.2-50.4 GHz band may require some operational constraints if 5G operations are deployed in both the 47 GHz and 50 GHz bands because the effects of emissions would be cumulative on the interstitial passive services between the two 5G bands. For example, a small guard band could be incorporated at the top of the 47 GHz band allocation or the FCC could reduce the risk of interference by requiring smaller bandwidth channels at the upper end of the 47 GHz band. Protecting passive services in the 52.6-54.25 GHz band should require the least constraints on 5G deployments of any of the three bands under consideration in this report.
Our study of 5G coexistence scenarios offers an important foundation for further analysis. We use conservative assumptions to establish the feasibility of coexistence between next-generation 5G operations and passive services under worst-case conditions. Real-world conditions are likely to prove much more favorable to coexistence than the assumptions we employ here. Furthermore, once the final 5G standard is known and as additional information about the performance criteria of passive systems becomes available, new mechanisms for coexistence that have not yet been addressed here may prove worthy of analysis. But even under worst-case conditions, traditional sharing techniques, such as coordination, exclusion zones, and certain constraints on 5G operations on some channels, will permit the FCC to authorize the deployment of next-generation wireless broadband services in the 32 GHz, 47 GHz, and 50 GHz bands without causing an unacceptable risk of harmful interference to adjacent-channel RAS, EESS operations, and other passive services on adjacent frequencies.

T-Mobile | 5G Coexistence Study
Executive Summary
I. Overview 1
II. General Assumptions and Methodology 1
A. RAS Protection 1
1. General Assumptions 2
a) RAS Threshold Interference Levels 3
b) Emissions from 5G Operations into RAS 3
(1) 5G Base Station Emissions 3
(2) 5G User Equipment Emissions 4
c) Operating Parameters of Radio Astronomy 4
2. Methodology 5
B. EESS/SRS Protection 6
1. General Assumptions 6
a) EESS Threshold Interference Levels 7
b) Emissions from 5G Operations into EESS 8
2. Methodology 8
III. Out-of-Band Emissions Model 11
A. Real World Conditions 11
B. Developing a 5G Model 11
IV. 32 GHz Band (31.8 – 33.4 GHz) 23
A. Background, Band Plan, and Further Notice Questions 23
B. Protection of RAS 24
1. Calculations 24
2. Results 25
C. Protection of EESS 26
1. Calculations 26
2. Results 27
D. Discussion/Conclusions 28
V. 47 GHz Band (47.2 – 50.2 GHz) 29
A. Background, Band Plan, and Further Notice Questions 29
B. Protection of EESS & SRS 30
1. Calculations 30
2. Results 31
C Discussion/Conclusions 32
VI. 50 GHz Band (50.4 – 52.6 GHz) 32
A. Background, Band Plan, and Further Notice Questions 32
B. Protection of EESS & SRS at 50.4 GHz 33
1. Calculations 33
2. Results 33
C. Protection of EESS & SRS at 52.6 GHz 34
1. Calculations 34
2. Results 34
D. Discussion/Conclusions 34
VII. Conclusions 35

T-Mobile | 5G Coexistence Study1
I. OverviewThis study examines how commercial mobile broadband operators can use advanced 5G technologies in the 32 GHz, 47 GHz, and 50 GHz bands as proposed by the FCC.1 We analyze the conditions under which wireless operators can deploy 5G services in these bands while protecting Federal RAS observations and the EESS against harmful interference. Standard operating parameters for 5G systems are not yet definitive and the precise network architecture and use cases for these next-generation wireless systems are not fully defined. Based on a set of conservative assumptions for 5G network operating parameters, however, 5G deployments in the 32 GHz, 47 GHz, and 50 GHz bands can coexist with existing RAS and EESS operations without causing harmful interference.
II. General Assumptions and Methodology
A. RAS PROTECTION
RAS is a passive service that receives radio waves of cosmic origin and allows scientists and researchers to better understand the universe. 2 The 1979 World Administrative Radio Conference (WRC-79) established a RAS spectrum allocation, and the FCC subsequently adopted an allocation in the United States.3 In adopting additional spectrum for RAS in 2004,4 the FCC said it sought to “promote future developments in technology and equipment, [and] position scientific services to increase our understanding of physical phenomena.”5
Services operating in the spectrum allocated for RAS observe and analyze star formation, quasars and pulsars, and the properties of the interstellar medium, while providing a platform for researchers to study the chemical evolution of the universe, the detection of extra-solar planets and many other celestial phenomena.6 RAS is also expected to continue to contribute to advances in imaging techniques and space science. Today, useful RAS frequencies include virtually the entire radiofrequency spectrum, ranging from 2 MHz to 1000 GHz bands and above.7
Despite advances in technology, RAS operations tend to employ antennas with large collecting areas and lengthy integration times—features that can make RAS operations susceptible to interference, especially noise received in the far side lobes of RAS telescopes. Given these characteristics, RAS operations are often located in remote, mountainous areas, such as the Robert C. Byrd Green Bank Telescope in Green Bank, West Virginia or the Arecibo Observatory in Arecibo, Puerto Rico.8 RAS operations are protected from interference by established national radio quiet zones, but conducting operations in remote locations help RAS facilities avoid ambient noise

T-Mobile | 5G Coexistence Study2
conditions and potential interference from satellite networks and inter-satellite links. These facilities’ mountainous settings also help mitigate atmospheric absorption of incoming signals from space that can degrade the accuracy of radio astronomy data.
The FCC has long employed coordination across a wide range of RAS frequencies to avoid harmful interference between passive RAS operations and active radio communications.9 The 32 GHz band is no exception. Coordination between RAS and 5G operations is readily feasible in the 32 GHz band through a combination of exclusion zones in the immediate vicinity of the antenna and a larger coordination area circling the exclusion zone for each RAS earth station.
The National Academy of Sciences’ Committee on Radio Frequencies (“CORF”) agrees. CORF is a chief advocate for U.S. scientists, particularly radio astronomers and remote sensing researchers, who use radio frequencies allocated to RAS and EESS for research. The committee works with the FCC to establish radio-frequency requirements and interference protections.10 CORF “generally supports the sharing of frequency allocations” and explains “RAS bands can be protected regionally by limiting emissions within a certain radius of a facility.”11 According to CORF, fixed-service operations at 32 GHz can be expected to protect RAS when “coordination between prospective transmitting stations and RAS sites [is] based on factors such as altitude and surrounding terrain.”12
Based on ITU recommendations and conservative assumptions regarding the types of antennas and length of integration times for RAS operations as well as the average detrimental interference projected for the band,13 exclusion zones for RAS in the 32 GHz band can be relatively small and coordination would be manageable. Protecting RAS receive sites would not prove overly burdensome to adjacent-channel licensees seeking to deploy 5G service to the public.
1. GENERAL ASSUMPTIONS
In the United States, the 31.8-32.3 GHz passive band is currently allocated to the RAS, EEES, and space research service (“SRS”) on a primary basis in both the Federal and non-Federal tables.14 The FCC proposed authorizing fixed and mobile use in the adjacent 32 GHz band (31.8-33 GHz) in its Spectrum Frontiers Notice.15 The FCC expanded its inquiry to include the 31.8-33.4 GHz band in its Spectrum Frontiers Further Notice in July 2016 because the ITU identified the 31.8-33.4 GHz band as a potential candidate band for 5G.16 ITU WRC-15 will conduct sharing and compatibility studies for the 32 GHz band, which may lead to an allocation for mobile service in the band at WRC-19 and potentially allow for a globally harmonized mobile services allocation in the band. As the FCC stated in its Spectrum Frontiers Report and Order, there is a “significant amount of contiguous bandwidth available in the 32 GHz band,” and “[g]lobal harmonization … will promote global interconnection, roaming, and interoperability.”17 Commenters in the Spectrum Frontiers proceeding have expressed considerable support for allocating the 32 GHz band for fixed and mobile 5G services.18

T-Mobile | 5G Coexistence Study3
There are currently no non-Federal licensees in the 32 GHz band.19 Internationally, the 32 GHz band is allocated for the fixed and radionavigation services.20
Of the three large bands considered in this study of the feasibility of coexistence between mobile terrestrial uses and incumbent uses, only the 32 GHz band is adjacent to RAS.21 If additional RAS activity in the United States at 51.4 GHz or above is identified or initiated, we would apply similar calculations to account for operations in the other frequencies under consideration in this study.
a) Radio Astronomy Threshold Interference Levels
To assess the likelihood of interference-free coexistence between terrestrial mobile operators in the 31.8-33.4 GHz band and adjacent-channel RAS, we used the ITU interference threshold defined in the current in-force ITU recommendation entitled Protection Criteria Used for Radio Astronomical Measurements.22 This 2003 ITU recommendation encourages administrations to take all practical steps to reduce unwanted emissions falling within protected RAS frequencies.23 The recommendation also notes that, while sharing between RAS and communications services can be difficult, sharing may be practical with coordination among the parties involved.24 After reviewing the sensitivity of radio telescopes and other RAS equipment to interference, the ITU report provides a table of threshold levels of interference detrimental to radio astronomy observations.25 The table identifies the center frequency of RAS observations, the bandwidth of operation, minimum antenna noise temperature and receiver noise temperature to derive system sensitivity and threshold interference levels for a variety of RAS operations.26 For the 32 GHz band, the ITU defines the threshold level of input power as -192 dBW/500 MHz.27
b) Emissions from 5G Operations
Standards development for 5G network and user equipment is not yet complete, but the basic system architecture and radio access network functions are well understood. To identify and model the 5G operating parameters capable of producing harmful interference into RAS operations for this study, we used the emissions mask models described in Section III below. We also employed the following assumptions about RAS and 5G system configurations for purposes of this analysis.
(1) 5G Base Station Emissions
For 5G base stations, we assumed that 25% of air-interface resources are used for overhead control functions.28 Consistent with the analysis performed by Reed Engineering on behalf of Nextlink Wireless, LLC by Reed Engineering (the “Reed Report”), we assumed these resources are not beamformed.29 We further assumed that the attenuation of overhead control plane signals in the direction of the RAS receiver is 15 dB while the attenuation of beamformed user plane signals in the direction of the RAS receiver is 40 dB. These assumptions are conservative relative to similar

T-Mobile | 5G Coexistence Study4
assumptions submitted in the record.30 The analysis considered three simultaneous transmitting base stations to calculate the required separation distance. Finally, we assumed that the 5G base station bandwidth is 200 megahertz, consistent with the proposed channelization of the 32 GHz band the FCC proposed in its recent Spectrum Frontiers Further Notice.31
(2) 5G User Equipment Emissions
For 5G user equipment, we assumed 7 dB of losses in addition to free space path loss. These losses could be caused by clutter, terrain, foliage, antenna discrimination, or other factors. Given that the exclusion distance is tens of kilometers and that mobile devices will generally transmit from 1.5 meters above ground level, limiting losses in excess of free-space path loss to only 7 dB represents a very conservative assumption. We further assumed that the mobile device’s antenna gain is 0 dBi, which represents the average gain of all mobiles transmitting in all directions. 5G will support uplink beamforming, which means that mobile devices will have positive antenna gain in the direction of the base station. However, when a large number of mobile devices are randomly distributed around a cell site, most of those devices will not be aligned with the victim RAS antenna. Therefore, the antenna gain in the direction of the RAS antenna will be negative for most mobile devices and positive for a few mobile devices, with the average gain across all mobiles equating to 0 dBi.32 For purposes of calculating the number of simultaneous mobile transmissions that can be supported at the exclusion distance, we assumed that mobile devices may transmit from as far as 1.2 kilometers from the base station. Given the poor propagation of the millimeter wave bands compared to lower-frequency spectrum, assuming a propagation distance of 1.2 kilometers is also an extremely conservative assumption that overstates the potential risk of interference to RAS. Yet another conservative element to the analysis is that the calculation assumes that all mobile devices are 1.2 kilometers closer to the RAS antenna than the base station would be. However mobiles are likely to be distributed somewhat evenly throughout the coverage area of a cell site such that the majority will be less than 1.2 kilometers closer to the RAS antenna than the base station, and roughly half will be farther from the RAS antenna than the base station.
c) Operating Parameters of Radio Astronomy
For RAS operations, we assumed that a RAS receiver has a bandwidth of 300 megahertz. This size receiver bandwidth is relatively small for RAS operations; larger RAS receiver bandwidths tend to improve RAS readings by maximizing the signal-to-noise ratio from the celestial phenomena that are the subject of observation.33 As RAS receiver bandwidth decreases, the effect of any out-of-band power the RAS bandwidth receives will be larger for each megahertz of RAS spectrum. Because the total power is converted to a Power Spectral Density (PSD in dBm/MHz) and because the largest contribution of interference power is in the few megahertz just outside the interferer’s channel, the PSD is higher when the receiver bandwidth is smaller. For example, a 300 MHz receiver bandwidth

T-Mobile | 5G Coexistence Study5
would see greater power per megahertz than a 500 MHz receiver bandwidth. Both receivers would receive interference from the channel edge to 300 MHz, but the 500 MHz receiver would see additional interference power from 300 to 500 MHz. However, the additional interference power is extremely small compared to the power from 0 to 300 MHz, so spreading the total power across 500 MHz results in less power per megahertz than spreading slightly less interference power across 300 MHz. Smaller RAS receiver bandwidths, such as the 300 megahertz RAS bandwidth assumed here, should therefore be considered a worst case scenario for assessing RAS susceptibility to interference. For purposes of our analysis, we assumed RAS would receive only in the 31.5-31.8 GHz band (i.e., 300 MHz) even though RAS may receive across the entire 31.3-31.8 GHz band. Our assumption of a narrower-than-feasible RAS receiver bandwidth has the conservative effect of increasing the power spectral density of unwanted emissions relative to RAS bandwidth. As a further measure to employ conservative assumptions and mitigate the potential risk of interference to RAS, we assumed that the RAS antenna’s side lobe gain is 0 dBi consistent with ITU recommendation ITU-R RA.769-2.34
2. METHODOLOGY
The methodology employed relies on the assumptions identified above and incorporates ITU recommendations or 3GPP standards wherever possible. To project the separation distance and number of mobile devices that could operate in the 32 GHz band alongside RAS operations, we calculated the aggregate interference power from 5G base stations using three inputs: (1) the out-of-band emission (“OOBE”) power described in Section III, below; (2) the antenna discrimination values (15 dB non-beamformed overhead control plane signals in the direction of the RAS receiver and 40 dB attenuation of beamformed user plane signals in the direction of the RAS receiver) as described above; and (3) a simulation of three simultaneous transmitting base stations as described above. Then, we calculated the required path loss between the RAS antenna and 5G base stations using the ITU threshold and RAS antenna’s side lobe gain. With this number, we determined the required separation distance using the free space path loss model.
For mobile devices, we calculated the total out-of-band emissions power for a single mobile device using the out-of-band emissions power described in Section III below. Next, we calculated the total power at the RAS receiver using the total out-of-band power in the RAS receive band, the RAS side lobe antenna gain, free space path loss assuming that mobile devices can be 1.2 kilometers closer to the RAS antenna than base stations, and the other assumed losses. We then compared the total interference power at the RAS antenna to the ITU protection threshold to determine the number of simultaneous transmitting mobile devices can be supported at the calculated distance.

T-Mobile | 5G Coexistence Study6
B. EESS/SRS PROTECTION
1. GENERAL ASSUMPTIONS
EESS is a radiocommunication service that includes passive radio sensing with applications in weather forecasting, agriculture, and study of global warming and other global changes of the Earth and its environment.35 EESS operations use passive sensing, which detects electromagnetic energy generated by natural sources, such as the surface of the Earth and its atmosphere.36 EESS passive sensors use the amount of energy emitted, transmitted, or reflected to observe and measure objects from a distance in order to determine physical properties of the object, such as temperature, ozone gas concentration, and water vapor profiles.37 EESS assists with weather prediction and disaster management.38 As CORF reports, operators in the EESS bands provide “regular and reliable quantitative atmospheric, oceanic, and land measurements to support a wide variety of scientific, commercial, and government (civil and military) data users.”39 Major governmental users include the National Oceanic and Atmospheric Administration, the National Science Foundation, the National Aeronautics and Space Administration, the Department of Defense, especially the U.S. Navy, the Department of Agriculture, the U.S. Geological Survey, the Agency for International Development, the Federal Emergency Management Agency, and the U.S. Forest Service.40
The geometry of a typical EESS satellite sensor is shown in Figure 1 below:200 Rep. ITU-R SM.2092
FIGURE 10-1 In-orbit configuration of a Nadir-sounding passive sensor
TABLE 10-2
Parameters of Nadir sensors
Parameters AMSU-A Push-broom
Type of scan Mechanical Electronic Main antenna gain (dBi) 36 45
Half power beam-width at −3 dB (degrees) 3.3 1.1
Pixel size across track (km) 45 16 Useful swath (km) 2 300 2 300 Polarization V H/V Sensor altitude (km) 850 850 Inclination (degrees) 98.8 98.8 Orbital period (minutes) 102 102 Cold calibration antenna gain (dBi) 36 35 Cold calibration angle relatif to satellite track (degrees)
90 90
Cold calibration angle relatif to Nadir direction (degrees)
83 83
Reflector diameter (m) 0.28 0.9
Source: Report ITU-R SM.2092, Studies Related to the Impact of Active Services Allocated in Adjacent or Nearby Bands on Earth Exploration-Satellite Service (Passive) (2007)
Figure 1: In-orbit Configuration of a Nadir-Sounding Passive Sensor 41

T-Mobile | 5G Coexistence Study7
As shown in Figure 1, an in-orbit sensor covers a 2,300-kilometer swath of the Earth’s surface with multiple pixels, one of which is directly at nadir. Nadir sensors use a sun synchronous polar orbit.42 For interference purposes, the middle pixel directly at nadir is the worst case because all other pixels will have increased distance from the Earth to the satellite and, thus, additional free space loss. This results in additional attenuation of the interfering signals, and the lower look angles of the off-nadir pixels creates increased opportunities for signals to be blocked by man-made and naturally occurring clutter, especially in urban areas where 5G deployments will be the most dense and aggregate interference to EESS will be highest. Consistent with our intent to evaluate worst-case scenarios, the calculations in this study focus on the center pixel of the EESS sensor pattern, which is nadir to the satellite. The logical corollary is that worst-case interference from terrestrial 5G transmitters will occur in the zenith direction from the 5G transmitter to the satellite.
Notwithstanding the different use cases for EESS, many of the interference considerations resemble those that apply to establishing coexistence between RAS and 5G deployments. Our EESS assumptions are therefore similar to our RAS assumptions, but are adjusted to account for the different frequencies in which EESS receivers operate. Unlike RAS receivers, which are located on Earth, typically in remote, mountainous areas, EESS receivers are located nearly directly overhead transmitting base stations and mobile devices. For this reason, the 5G base station discrimination in the direction of the EESS receiver is greater than in the case of RAS receivers. Beamformed signals are assumed to be attenuated by 40 dB in the zenith direction and non-beamformed signals are assumed to be attenuated by 30 dB. These levels of attenuation are easily achieved with standard antenna patterns.
a) EESS Threshold Interference Levels
The ITU has produced a technical report that provides a methodology and framework for documenting the results of the interference assessment between active, broadband services and EESS passive services operating in adjacent and nearby bands. ITU-R SM.2092,43 which is an active ITU recommendation that remains in force, references ITU document Recommendation ITU-R RS.1029, entitled “Interference Criteria for Satellite Passive Remote Sensing.”44 However ITU-R RS.1029 has been withdrawn and replaced with ITU-R RS.2017.45 ITU-R RS.2017 provides information on the performance and interference criteria for satellite passive remote sensing of the Earth and its atmosphere for microwave passive sensors.46 The required interference protection criteria are more restrictive than those that appear in the withdrawn document, ITU-R RS.1029.47 In the interest of studying the worst-case interference scenario, we used the more restrictive values in the newer ITU recommendation, ITU-R RS.2017.48
For the 31.3-31.8 GHz and 50.2-50.4 GHz EESS bands, the interference protection criterion is -166 dBW/200 MHz. For the 52.6-59.3 GHz EESS band, the interference protection criterion is specified

T-Mobile | 5G Coexistence Study8
as -169 dBW/100 MHz. When normalized to a power spectral density per megahertz, both criteria equate to -189 dBW per megahertz. EESS satellite criteria are as specified in ITU-R SM.2092.49 The satellite altitude is 850 kilometers; the pixel size on Earth is 201 square kilometers; and the EESS satellite antenna gain is 45 dBi.50 The transmit and receive channel bandwidths are the same as for the RAS calculation, and the out-of-band power is also as described in Section III below.
b) Emissions from 5G Operations into EESS
To estimate emissions from 5G operations into EESS, we assumed free space loss from Earth to the EESS satellite. For mobile stations, we assumed 6 dB of loss due to antenna discrimination toward the EESS receiver, which matches a value used by satellite operators to evaluate interference to satellites in geosynchronous orbit.51 In a later filing, Verizon noted that this assumption of 6 dB “is much too low, given the beamforming to be used for the return link (i.e., from UTs to base stations) and the relative angle to the satellite.”52 Given that the relative angle to the EESS satellite is approximately 90 degrees plus or minus roughly a half degree, this assumption, which was used by satellite operators in an analysis of interference to satellites with relative angles of 15 to 30 degrees, is conservative. Nevertheless, our analysis assumes only 6 dB of antenna discrimination from mobile devices in the zenith direction.53 Adding to our conservatism, we do not assume any additional attenuation for urban clutter, foliage, or atmospheric absorption. These and other very conservative assumptions will overstate the risk of harmful interference to EESS.
For the purpose of converting the calculated maximum number of sectors that can be supported to the total number of cell sites, we assumed that a 5G system has an average of 2.5 sectors per cell site. Most macro networks include a mix of three-sector sites, two-sector sites, and omni-directional or single-sector sites. In most macro networks, three-sector sites dominate, but the effect of the two-sector and single-sector sites is to reduce the average number of sectors per site in the network. In a small-cell network, many more sites may be single-sector sites. Thus, an assumption of 2.5 sectors per site is conservative and also overstates the potential risk of interference to EESS.54
2. METHODOLOGY
The methodology employed for purposes of this coexistence analysis relies on the assumptions identified above and incorporates ITU recommendations and 3GPP standards where possible. To assess the feasibility of coexistence between incumbent systems and proposed 5G base stations, we first calculated the interference power from a single 5G base station sector using two inputs: (1) the OOBE power described below in Section III; and (2) the antenna discrimination values and percentage beamformed traffic assumptions described above. Next, we calculated the interference power from a single sector at the EESS receiver by applying the free space path loss model and accounting for the EESS antenna gain. We then calculated the maximum number

T-Mobile | 5G Coexistence Study9
of 5G sectors that could be supported within the 201 square kilometer pixel size using the ITU threshold and the total interference power from a single sector. Finally for this portion of the analysis, we calculated the total number of base stations that can simultaneously transmit in a 201 square kilometer area, assuming that the system includes 2.5 sectors per base station.
To assess the coexistence potential of 5G mobile devices with incumbent services, we calculated the total OOBE power for a single mobile device using the OOBE power described in Section III, below. Next, we calculated the total power at the EESS receiver using the total out-of-band power in the EESS receive band, the EESS antenna gain, the antenna discrimination at zenith from mobile devices, and free space path loss from Earth to the satellite. We then compared the total interference power at the EESS antenna to the ITU protection threshold to calculate the number of simultaneous transmitting mobile devices that can be supported in a 201 square kilometer area. The number of mobile devices that can cause interference in a 201 square kilometer area is limited to the number of (outdoor) base station sectors in that area because the technology can typically support only one mobile device transmitting at the edge of the channel at a time using the same resource block.55 Typically, only one mobile in the same sector can use the same resource block at the same time because LTE uses – and 5G is widely expected to use – orthogonal frequency division multiple access (“OFDMA”) technology. The LTE uplink employs a version of OFDMA called Single Carrier Frequency Division Multiple Access (“SC-FDMA”) in which multiple mobile devices are scheduled to transmit in a subset of the available resource blocks, with each mobile allocated a contiguous set of resource blocks. By contrast, 3G technologies use code division multiple access (“CDMA”) in which all devices use the full bandwidth and are distinguished at the receiver by their unique codes. This coding allows multiple devices to use the same frequency at the same time, which is typically not the case with OFDMA or SC-FDMA.56 Because 4G and 5G networks employ only one spectrum resource block within any one sector at any one time, the number of mobile devices capable of causing interference generally will not exceed the number of supported sectors in the same area.
In some areas, of course, operators may employ additional means to reduce emissions from base stations in the zenith direction perhaps as a result of better antenna discrimination than assumed here, overhead gain suppression, or other measures. In these cases, the number of supported mobile devices could become the limiting factor with respect to the feasibility of coexistence between incumbent services and new 5G operations. To account for different network configurations and potential changes to the number of supported mobile devices over time, we analyzed the risk of interference from mobile units independently of the risk of the potential interference from base stations.
While both user equipment and base stations require independent analysis, an analysis of aggregate power from base stations and mobile units is not required. The use of Time Division

T-Mobile | 5G Coexistence Study10
Duplex (“TDD”) operation in the 5G bands will ensure that mobile devices and base stations do not transmit simultaneously. TDD separates in time downstream and upstream directions of traffic.57 The technique allows a single frequency to be used for both downstream and upstream traffic, and the ratio between downstream and upstream traffic can be fixed or adaptive.58 Thus, the interference power will either come from a base station or its mobile devices, but not both at the same time. This principle holds true for each sector/cell site, although unsynchronized base stations within the same 201 square kilometer area may result in some OOBE coming from base transmissions and other OOBE from mobile devices. Regardless, the worst case will be when all OOBE are coming from the transmitter with the highest OOBE.
Just as both base stations and user equipment emissions will not be simultaneously visible to an adjacent-channel passive systems, only a portion of the total emissions from mobile devices will be visible to adjacent-channel passive systems. Mobile devices transmitting in spectrum bands that are not directly adjacent to EESS will have a nearly negligible impact on the total OOBE to the EESS receiver. Although Figures 3, 4, and 7 below show the out-of-band emissions leveling off far from the edge of the channel, this apparent outcome is actually a product of the measurement technique and represents the noise floor of the spectrum analyzer. In reality, the power of the OOBE will generally continue to decrease such that the total out-of-band power in the passive band from non-adjacent mobiles will be nearly negligible. For example, assuming the roll-off slope continues at the same rate, a mobile device transmitting in the second adjacent channel would add about 0.2 dB more interference power in the passive band. Since this is well within the margin of error, the interference contribution from the second adjacent carrier is considered negligible.
In addition, the 200-megahertz channel adjacent to EESS may be shared across multiple mobile devices using frequency division, and only one of those mobile devices will be directly adjacent to the 31.8 GHz border with EESS. In a multiple mobile device scenario, moreover, the adjacent mobile device will use less than the entire 200 megahertz-wide channel. For this reason and given constraints on the ability of OFDMA technologies to support more than one end-user device occupying the same spectrum resource blocks at any given point in time, the maximum number of simultaneously transmitting mobile devices that will cause OOBE to the EESS satellite receiver will be equal to the number of sectors in the adjacent-channel spectrum that the EESS receiver can see.

T-Mobile | 5G Coexistence Study11
III. Out-of-Band Emissions Model
A. REAL WORLD CONDITIONS
Both international standards-setting bodies and national regulators establish out-of-band emissions masks for device performance. But the out-of-band emission masks that standards-setting bodies and national regulators establish are considerably worse than the actual OOBE performance of devices in the field. 3GPP limits, for example, will often exceed regulatory limits at higher offset frequencies that are farther from the band edge. Similarly, actual device performance will exceed the regulatory and standards-body emissions masks by a considerable margin. Allowing margin or “headroom” to exist between actual device performance and the regulatory-agency or standards-body limit helps ensure devices can meet certification tests and allows for production tolerances sufficiently large to reduce the risk that some lots of devices might exceed the regulatory and/or standard limits due to irregularities in product manufacturing.
The phenomenon of standards bodies and national regulatory bodies employing higher than actual OOBE masks is well understood and widely acknowledged. As the National Institute for Standards and Technology said in October 2016, the assumption that transmitters operate at emissions masks required by standards bodies is “nearly always false.”59 NIST explained that “transmitter out-of-band . . . and spurious emissions are usually substantially lower than emission mask limits, often by tens of decibels.”60 As a result, NIST explained that an analysis that fails to account for higher-than-actual emissions masks will overestimate the power levels of most transmitters’ out-of-band emissions, which, in turn, will overestimate the required frequency and distance separations needed for coexistence.61
B. DEVELOPING A 5G MODEL
Like other frequencies, the 32 GHz, 47 GHz, and 50 GHz bands will have regulatory limits on out-of-band emissions and spurious emissions. In addition, 3GPP will set limits on out-of-band and spurious emissions for each of the bands when band classes are established through the standards-setting process. Consistent with existing practice, the 3GPP limits can be expected to meet or exceed the regulatory limits.62 For this reason, using the regulatory limits in an interference calculation is unrealistically conservative. Using 3GPP standard limits instead may offer a slightly more realistic picture of reasonably anticipated field performance, but using 3GPP limits does not account for the additional margin that manufacturers must include in their design to guarantee regulatory and standard compliance of all devices. Of course, the magnitude of the margin available between 3GPP limits and field performance may vary by manufacturer, so assumptions must remain conservative so as to avoid understating the potential risk of interference to RAS and EESS.

T-Mobile | 5G Coexistence Study12
To avoid exaggerating interference consequences by relying on standards-body or regulator emissions masks, we relied on the anticipated in-field emissions masks of 5G devices. In our analysis of the 32 GHz and 50 GHz bands, we assumed two hundred megahertz 5G channels consistent with the FCC’s proposed band plan.63 In our analysis of the 47 GHz band, we analyzed both five hundred megahertz channels, which are consistent with the FCC’s proposed band plan.64
In the Spectrum Frontiers Report and Order, the FCC set OOBE limits for base stations and mobile devices for the 28 GHz, 37 GHz and 39 GHz bands.65 The FCC set the OOBE limit for both a conductive metric and a total radiated power (“TRP”) metric to -13 dBm/MHz, and applied the limit to base stations, transportable stations, and mobile stations.66 The FCC explained that in the millimeter wave bands, transmitters “require higher gain antennas to compensate for significantly higher propagation losses and consequently the antennas will, in general, have much smaller beamwidth, as compared to other lower band mobile systems.”67 Therefore, “OOBE of mmW [millimeter wave] transmitters have highly directive characteristics, concentrating the transmission power along a narrow beam in the direction of maximum EIRP” and “because the beam is narrow and because a transmitter needs to track the relative movement of its intended receiver in order to maintain the communication link, the OOBE of the mmW transmitter should be spatially averaged over the path of the receiver to reflect the spatially transient nature of the transmitter OOBE.”68 As a result, the FCC decided to express the OOBE limit as an equivalent conductive limit, consistent with the OOBE rule for other mobile systems.69
Although the regulatory limits for the three bands examined in this study will be similar to limits that exist today, this similarity is not dispositive because regulatory limits can vary for any number of reasons and an interference analysis based on present-day standards would not be realistic in light of the development of new LTE configurations. Moreover, 3GPP has not yet determined band classes for 5G millimeter wave bands; therefore, no benchmark for the standard emissions masks currently exists that manufacturers might use to ensure compliance.
We can nevertheless reliably estimate key features of 5G operating performance based on observed features of present-day LTE standards, rules and in-field deployment. Due to spectral regrowth, for instance, LTE out-of-band emissions tend to roll off less rapidly with increasing bandwidth. Furthermore, 3GPP OOBE limits for the various channel bandwidths supported by LTE generally scale proportionally.70 Finally, a direct scaling of 3GPP OOBE limits for small LTE carriers to OOBE limits for larger LTE carriers results in more relaxed OOBE requirements for the larger carriers than 3GPP has specified. These characteristics of LTE performance will not change under a 5G New Radio (“NR”) standard. And the persistence of these features into the 5G NR standard allows for a reliable derivation of system performance characteristics of 5G services intended for deployment in the 28 GHz, 37 GHz and 39 GHz bands once differences in bandwidth and other salient features are taken into account.71

T-Mobile | 5G Coexistence Study13
For mobile devices, in any given LTE frame, a two hundred megahertz channel may be shared across multiple mobile devices using frequency division. The worst-case OOBE power will occur when a single mobile device transmits on the entire two hundred megahertz channel in the uplink. This worst-case scenario will likely be very rare. In most frames of LTE operation, multiple mobile devices communicating with the same sector will share the two hundred megahertz channel, and each of those mobile devices will be allocated only a portion of the available two hundred megahertz of spectrum. In any scenario, only one mobile device will be directly adjacent to the 31.8 GHz border with EESS, and, in a multiple mobile device scenario, the adjacent mobile device will use less than the entire two-hundred megahertz. Frequency division of the two hundred megahertz channel will result in narrower transmissions, which means OOBE will fall off more sharply in a multiple-device scenario than in a worst-case single-device scenario. Because OOBE power is dominated by the power closest to the EESS band, mobile devices transmitting in spectrum that is not directly adjacent to EESS will have a highly attenuated impact on the total OOBE to the EESS receiver. Therefore, the number of transmitting mobile devices simultaneously using the same resource blocks in a 5G OFDMA system that will cause OOBE to the EESS satellite receiver will be equal to the number of sectors that the EESS receiver can tolerate.
To estimate the future 3GPP standard limits for two- and five-hundred megahertz 5G channels, we have assumed that OOBE requirements would scale proportionally to those for a twenty-megahertz LTE carrier. Based on current 3GPP precedent for LTE, this assumption should result in a more permissive emissions mask than will actually be imposed by 3GPP. As a result, an analysis based on a scaled 3GPP mask would assume more power into the adjacent passive band than 3GPP will eventually allow, which means that an analysis would overstate the likelihood of interference into adjacent-band operations. We avoided this outcome by using the scaled and adjusted performance of actual equipment in the OOBE model. But to ensure that our model based on actual performance would meet scaled 3GPP limits, we used Table 6.6.2.1.1-1 of 3GPP 36.101 to determine the proper scaling for mobile devices at larger operating bandwidths.72

T-Mobile | 5G Coexistence Study14
3GPP TS 36.101 V13.3.0 (2016-03)
! 202
Release 13
Table 6.6.2.1.1-1: General E-UTRA spectrum emission mask
NOTE: As a general rule, the resolution bandwidth of the measuring equipment should be equal to the measurement bandwidth. However, to improve measurement accuracy, sensitivity and efficiency, the resolution bandwidth may be smaller than the measurement bandwidth. When the resolution bandwidth is smaller than the measurement bandwidth, the result should be integrated over the measurement bandwidth in order to obtain the equivalent noise bandwidth of the measurement bandwidth.
6.6.2.1A Spectrum emission mask for CA
For inter-band carrier aggregation with one component carrier per operating band and the uplink active in two E-UTRA bands, the spectrum emission mask of the UE is defined per component carrier while both component carriers are active and the requirements are specified in subclauses 6.6.2.1 and 6.6.2.2. If for some frequency spectrum emission masks of component carriers overlap then spectrum emission mask allowing higher power spectral density applies for that frequency. If for some frequency a component carrier spectrum emission mask overlaps with the channel bandwidth of another component carrier, then the emission mask does not apply for that frequency.
For intra-band contiguous carrier aggregation the spectrum emission mask of the UE applies to frequencies (ΔfOOB) starting from the ± edge of the aggregated channel bandwidth (Table 5.6A-1) For intra-band contiguous carrier aggregation the bandwidth class B and C, the power of any UE emission shall not exceed the levels specified in Table 6.6.2.1A-0 and Table 6.6.2.1A-1 for the specified channel bandwidth.
Spectrum emission limit (dBm)/ Channel bandwidth
ΔfOOB (MHz)
1.4 MHz
3.0 MHz
5 MHz
10 MHz
15 MHz
20 MHz
Measurement bandwidth
± 0-1 -10 -13 -15 -18 -20 -21 30 kHz
± 1-2.5 -10 -10 -10 -10 -10 -10 1 MHz
± 2.5-2.8 -25 -10 -10 -10 -10 -10 1 MHz
± 2.8-5 -10 -10 -10 -10 -10 1 MHz
± 5-6 -25 -13 -13 -13 -13 1 MHz
± 6-10 -25 -13 -13 -13 1 MHz
± 10-15 -25 -13 -13 1 MHz
± 15-20 -25 -13 1 MHz
± 20-25 -25 1 MHz
3GPP
Source: 3GPP, Evolved Universal Terrestrial Radio Access (E-UTRA); User Equipment (UE) Radio Transmission and Reception: Specification # 36.101 (LTE).
Figure 2: 3GPP Device Emission Masks for LTE
To arrive at the spectrum emissions mask for a 5G device with a two hundred megahertz channel, we multiplied the ∆fOOB ranges above by ten and used the OOBE limit for a twenty-megahertz channel. For example, the maximum OOBE for a twenty-megahertz channel from 0 to 1 MHz outside the occupied bandwidth is -21 dBm per 30 kHz as shown in the table above. For a two hundred megahertz channel, therefore, the maximum OOBE from 0 to 10 MHz outside the occupied bandwidth would be -21 dBm per 30 kHz.
But this straight-line scaling of channel bandwidth does not account for the additional margin attributable to production tolerances and other features discussed above. Therefore, we used OOBE for mobile devices based on actual equipment performance, again scaled to a two hundred megahertz bandwidth. In this case, we conservatively approximated the performance of an iPhone transmitting a 20 MHz LTE channel in Band 41.
OOBE performance of the iPhone varied based on where the channel was located in the band, the side of the channel, and whether the transmission used QPSK or 16QAM modulation. Despite these variations, we were able to approximate the worst-case performance using this method. We found that the lower sider of the uppermost channel when QPSK was the modulation represented the worst-case scenario.73 In the spectrum-analyzer plot reproduced below, worst-case performance is circled in red. Of course, this plot represents only the beginning of the analysis because tolerances for adjacent channel passive services are not directly related to the OOBE roll-off of a single device. In other words, while emissions for a single device may fall below the mask, assessing interference potential to the passive services requires an analysis of the aggregate power from multiple devices.

T-Mobile | 5G Coexistence Study15
In assessing aggregate interference, there are numerous assumptions and parameters involved, such as distance, receive bandwidth, and other factors. We explain and document our aggregate interference in Sections IV.B.2, V.B.2, and VI.B.2 below.
Source: Agilent Technologies; UL Verification Services Inc., Certification Test Report No. 15U21635-E9V3, FCC ID: BCG-E3042A, for Cellular Phone with Bluetooth and WLAN Radios, at 520 (Feb. 4, 2016).
Figure 3: Worst Case iPhone OOBE Performance
After selecting a worst-case iPhone emissions mask, we then scaled the emissions mask of an iPhone operating on a 20 megahertz LTE channel to a presumptive 5G channel that would use a 200 MHz channel. To accurately scale the iPhone emission mask, we used the radiofrequency operating parameters of the least favorable iPhone emissions mask using QPSK modulation. We then plotted straight lines against the curve of this worst-case iPhone’s emissions mask, as shown by the red lines in the graphic below. Representing a curve with straight lines obviously entails some degree of generalization, but we applied conservative measures to our generalization that tend to overstate the OOBE of the iPhone emissions mask. Namely, whenever we generalized a line or angle of the emissions mask curve, we took care to use the line that captured the majority of the emissions within that segment. As a result, any generalizations in this plot of the iPhone’s emissions mask will tend to overstate the iPhone’s OOBE.

T-Mobile | 5G Coexistence Study16
Source: Agilent Technologies, Agilent Technologies; UL Verification Services Inc., Certification Test Report No. 15U21635-E9V3, FCC ID: BCG-E3042A, for Cellular Phone with Bluetooth and WLAN Radios, at 520 (Feb. 4, 2016).
Figure 4: Approximation of Worst Case iPhone OOBE Performance
By carefully measuring each aspect of the iPhone’s emissions mask, we developed a precise model of the mask that was capable of replication. We then scaled that performance to a 200 MHz transmit bandwidth using the same method described above.74 Once the iPhone’s performance was plotted and scaled, this performance level was further adjusted as described below to account for average power, performance variation, and production tolerances.
The scaled OOBE described above represents the maximum amount of out-of-band power that a mobile device will generate when operating at full power in a two hundred megahertz channel. In reality, user equipment rarely operates at full power, especially in urban and suburban areas where cell site density is high and the probability of a user being close to a cell site is high. Likewise, most mobile devices will transmit in less than the full 200 MHz bandwidth most of the time, and therefore the roll-off of their out-of-band emissions will be steeper. Due to these conservative assumptions, the full power iPhone operating parameters shown here are conservative and overstate the potential interference risks to RAS and EESS operations.
Consensus-driven studies support the view that actual performance will exceed standards specifications and provide reliable information about just how much lower actual equipment operating power will be in the field. The Commerce Spectrum Management Advisory Committee (“CSMAC”), for example, conducted a study that analyzes mobile device operations in urban and rural environments, which confirms that user equipment operates about 23 dB lower than full power.75 CSMAC advises the Assistant Secretary for Communications and Information at NTIA on

T-Mobile | 5G Coexistence Study17
a broad range of spectrum policy issues. CMSAC members are selected based on their technical background and expertise, and provide perspective on reforms to enable new technologies and services.76 CSMAC Working Group 1 was tasked with developing recommendations for use of the 1695-1710 MHz band for commercial services while protecting Federal meteorological earth stations from harmful interference.77 In January, 2013, CSMAC Working Group 1 published Monte Carlo simulation results that show that the average transmit power of an LTE mobile device in urban and suburban areas is about 23 dB lower than full power.78
Source: CSMAC Final Report, Working Group 1 – 1695-1710 MHz Meteorological-Satellite, at Appendix 3 (Jan. 22, 2013).
Figure 5: CSMAC Report UE EIRP Distributions for Urban/Suburban and Rural

T-Mobile | 5G Coexistence Study18
Source: CSMAC Final Report, Working Group 1 – 1695-1710 MHz Meteorological-Satellite, at Appendix 3 (Jan. 22, 2013).
Figure 6: CSMAC Report Tabular UE EIRP Data
The CSMAC data shows that mobile devices operate at approximately -3 dBm half the time, which is 23 dB less than the maximum power used in the simulations.79 Out-of-band power will scale with the fundamental power.80 Thus, realistic OOBE based on average power of mobile devices will be 23 dB lower than the OOBE at full power shown in Figures 3 and 4. This power reduction is critical to the EESS analysis because the highest interference power seen by EESS satellites will be where 5G cell site deployments are most dense; and the most dense deployments will be in urban centers.
For the 32 GHz RAS analysis, using the average mobile power in an urban/suburban environment does not offer a realistic portrayal of typical field conditions because most RAS locations are located in remote, rural areas. Therefore, we relied upon the rural power data provided by CSMAC that shows that a mobile’s average power in rural areas is approximately 8 dBm, or 12 dB lower than the maximum power permitted by rule.
Although the CSMAC mobile power curves were based on 4G devices and ours is a 5G analysis, the CSMAC results are conservative for our purposes. For example, Ericsson produced a similar power curve for 5G devices, which shows that 5G mobiles will typically operate at a power level that is 31 dB lower than their maximum power.81 The power level Ericsson employed is 8 dB less mobile power than we have assumed in this analysis and represents yet another element of conservatism. In addition, the CSMAC data was based on the capabilities of 4G devices, which typically operate at 23 dBm EIRP, while 5G devices are expected to operate at 43 dBm. Although on the surface

T-Mobile | 5G Coexistence Study19
this discrepancy may seem to indicate that 4G OOBE is not a good proxy for 5G OOBE, the two figures actually correspond quite closely because the conducted power of 5G devices will not be significantly different than that of 4G devices. The difference is that radiated power in 4G is omni-directional while radiated power in 5G will use uplink beamforming to give mobile devices a gain of roughly 17 dB in the direction of the base station.82 Thus, the fundamental conducted power will be very similar, and due to spatial averaging of OOBE from 5G mobiles,83 the OOBE of a 4G device is reasonably equivalent to the average expected OOBE of a 5G device. For interference calculations to EESS satellites, moreover, the spatial averaging of 5G OOBE in the horizontal plane is nearly irrelevant because only emissions in the zenith direction can cause interference. Furthermore, due to the relatively low height of terrestrial macro base stations and the even lower height of small cells, the vast majority of 5G beamformed uplink transmissions will be at very low elevation angles, very far from the 90 degree angle required to cause interference to EESS. Again, assuming only 6 dB of gain reduction from 5G mobiles in the zenith direction represents a remarkably conservative assumption.
Although we base our mobile OOBE assumptions on the tested performance of an iPhone, our analysis does not assume that all devices will perform as well as the iPhone. After all, the iPhone’s OOBE performance may not be representative of the OOBE of all mobile devices transmitting in a given area because some devices may produce more out-of-band emissions power than the iPhone. In addition, OOBE performance could vary even among the same model of device due to production tolerances. To account for these potential variations from the OOBE performance of any given iPhone, we added 5 dB more power to the iPhone OOBE curves. The introduction of additional power into the OOBE plots creates a curve that is higher than the iPhone curve, but still a few dB below the expected 3GPP emissions mask, so that the resulting maximum power performance curve meets the 3GPP requirements by a smaller margin than the iPhone. Using the iPhone as a base case and then plotting an OOBE performance measure 5 dB worse than the iPhone is thus a conservative assumption that nonetheless comports with the expected 3GPP standard requirement and realistically provides margin to ensure that the standard will be met. In addition, our analysis assumes all devices in a given area will perform 5 dB worse than the iPhone. In other words, we not only assume all non-iPhone devices perform 5 dB worse than the iPhone, but also assume that all devices (including the iPhone) always perform at this worse level. The collective effect of these assumptions is to overstate the emissions of user equipment and, thus, exaggerate the potential for interference to passive services.
The OOBE power curves used in our analysis are shown in Figure 7 below. The dashed brown line shows the worst-case, scaled iPhone performance shown in the circled region of Figure 3 above. This represents the iPhone’s OOBE at full power, and the difference between the yellow line representing the 3GPP mask and the brown dashed line represents the margin by which the iPhone met the 3GPP standard. The orange line represents a performance level at full power that is

T-Mobile | 5G Coexistence Study20
5 dB worse than the iPhone, which reduces the margin by about half. The blue line represents the average power in rural areas per the CSMAC data and is 12 dB lower than the orange line. This blue line represents the OOBE power curve used in the RAS analysis. Finally, the green line represents the average device power in urban and suburban areas per the CSMAC data and is 23 dB lower than the orange line. This green line represents the OOBE power curve used in the EESS analysis.
Figure 7: UE Radiated OOBE Power Curves for RAS and EESS Analysis
For base stations, we used a more realistic roll off that outperforms the regulatory and 3GPP limits by a modest 5 dB in most frequency ranges. We also analyzed out-of-band emissions for existing equipment in the band and found that typical roll-off is to -25 dBm per megahertz across roughly the channel bandwidth. Because both standard and regulatory base station emissions masks are generally flat (i.e., the mask remains at the same emissions level as the frequency offset from the edge of the channel increases), reviewing actual equipment performance provides important information about the real-world consequences of 5G base-station operations on adjacent- channel services.
A typical example of actual base station emissions performance with current-generation millimeter wave equipment is shown in Figure 884 below:

T-Mobile | 5G Coexistence Study21
Source: Cambridge Communication - 2016 29 GHz Test Report
Figure 8: Base Station OOBE Roll-off of Typical 28 GHz Equipment
Equipment currently operating in the millimeter wave spectrum is typically point-to-point or point-to-multipoint equipment; however, 5G base stations are expected to achieve similar, if not better, OOBE performance than current-generation fixed wireless equipment.
But even assuming 5G OOBE performance in the millimeter wave bands is no better than current-generation equipment performance at these frequencies, we would grossly overstate out-of-band power if we were to assume that emissions remain flat as the frequency offset from the edge of the band increases. As shown above, actual emissions generally decrease (i.e., “roll off”) as the frequency offset increases. In addition, it is generally easier to filter emissions from base stations than mobile devices because base stations have less restrictive constraints on size and power. Of course, base stations transmit at higher power levels, which serves to offset the enhanced filtering capability of base stations relative to the filtering capability of user equipment. But this offset is of no consequence because base stations can easily meet the roll-off assumptions contained in this analysis and likely can far exceed our roll-off assumptions by incorporating additional filtering into the base stations. Options to reduce OOBE through increased filtering exist today and could be used to ensure services in adjacent bands are protected.
The assumed base station roll-off for a two hundred megahertz transmission is shown in Figure 9 below, along with the FCC requirement, the 3GPP requirement for a twenty megahertz LTE channel scaled to a two hundred megahertz channel bandwidth,85 and actual performance of existing 28 GHz equipment also scaled to a two hundred megahertz channel bandwidth. This chart clearly shows that scaling the 3GPP requirement to two hundred megahertz results in a requirement that

T-Mobile | 5G Coexistence Study22
is much more lenient than the FCC’s regulatory requirement in the first one hundred megahertz outside the channel. The graph also shows that typical existing mmWave equipment meets the FCC requirement with about 5 to 12 dB of margin. Therefore, for the purpose of assessing interference from 5G base stations to RAS and EESS, we assumed a level of out-of-band emissions performance that just meets the FCC requirement and is similar to but not as aggressive as the roll-off of typical existing equipment. From 0 to 50 MHz, we assumed the roll-off for a two hundred megahertz transmission maintains a slope that is parallel to, and 14 dB below, the 3GPP mask. As shown in Figure 9 below, the assumed performance is required to meet the FCC mask at 10% of the channel bandwidth, which is shown by the red dotted line. Beyond 50 MHz and extending to 200 MHz, the slope of the OOBE roll-off becomes more gentle and roughly parallel to the typical existing equipment performance such that the OOBE at 200 MHz outside the edge of the channel and beyond is -25 dBm per megahertz. This OOBE level is more conservative than the typical existing equipment roll-off shown above and represented by the orange line in Figure 9, because emissions from typical equipment are much lower in the first 10% of the channel bandwidth just outside the band. Due to the relative power levels, the higher power levels just outside the band contribute the most power to the OOBE, and therefore the analyses that follow are much more sensitive to the power levels in the region closest to the fundamental emission than to the power levels two hundred megahertz outside the band.
Figure 9: Base Station OOBE Power Roll-off Curves

T-Mobile | 5G Coexistence Study23
IV. 32 GHz Band (31.8 – 33.4 GHz)
A. BACKGROUND, BAND PLAN, AND FURTHER NOTICE QUESTIONS
To support the deployment of 5G services in the United States, the FCC has proposed to divide the 31.8-33.4 GHz band into eight, two hundred megahertz channels.86 As shown below, the lowermost of these new 5G channels is located immediately adjacent to a five hundred megahertz wide primary allocation for RAS and EESS and other passive services that run from 31.3 GHz to 31.8 GHz. In this portion of the band, which is shown in yellow in the diagram, RAS shares a co-primary allocation with EESS and SRS.87
Passive Band in Region 2(n. 5.340 & US246, RAS US74) Proposed32GHzBandandChannelization(Part30)
EESS, RAS & SRS in all Regions
EESS, RAS, SRS, Fixed and Mobile in Regions 1 and 3 1 2 3 4 5 6 7 8
SpaceResearch(GoldstoneCA) Inter-satel l i te&Radionavigation(n.5.547D) Radionavigation(n.5.547E)
31.3 31.5 31.8 33.432.0 32.2 32.4 32.6 32.8 33.0 33.2
32.3
Figure 10: 32 GHz Band Plan
Outside of the passive band, the proposed 32 GHz band 5G allocation overlaps SRS, ISS, and radionavigation services. In the 31.8-32.3 GHz band, there is a Federal allocation to the radionavigation service and SRS (deep space) (space-to-Earth) on a co-primary basis, and a non-Federal allocation to SRS. Federal and non-Federal SRS operations have the same limitations: use of the band for SRS is limited to Goldstone, CA.88 Administrations must take all necessary measures to prevent harmful interference between the radionavigation service, SRS, and ISS in the band.89 And all airborne or space station operators are urged to take all practicable steps to protect RAS observations in the adjacent bands from harmful interference.90
Between 32.3 GHz and 33 GHz an allocation is available for Federal and non-Federal ISS uses as well as use by the radionavigation service on a co-primary basis. Operators in this band are also required to take all practicable steps to protect RAS observations in the adjacent bands from harmful interference.91 Operations in this band may include non-geostationary inter-satellite links, which are permitted on a secondary basis to geostationary inter-satellite links.92 Ground-based radionavigation aids are not permitted in the 31.8-33.4 GHz portion of the band, except where they operate in cooperation with airborne or shipborne radionavigation devices.93
Finally, in the 33 GHz to 33.4 GHz band, the radionavigation service has a primary allocation for both Federal and non-Federal services. Ground-based radionavigation aids are not permitted in the 31.8-33.4 GHz portion of the band, except where they operate in cooperation with airborne or shipborne radionavigation devices.94 Additionally, the band 33-36 GHz is allocated to the FSS (space-to-Earth)

T-Mobile | 5G Coexistence Study24
on a primary basis for Federal use.95 Coordination between Federal FSS and non-Federal systems is required.96 Federal FSS and mobile-satellite services (“MSS”) are limited to military systems.97
In its Spectrum Frontiers Further Notice, the FCC has asked whether a guard band should be adopted to protect RAS operations in the 31.8 GHz band.98 The FCC noted concerns raised by CORF that incumbent users in the band designed and developed EESS missions without the expectation of transmissions in close proximity to the 31.3-31.8 GHz band. CORF encouraged the FCC to adopt adequate guard bands to protect EESS operations until current satellites can be replaced with satellites equipped with filtering technologies that are better suited to the FCC’s proposed spectrum allocations and emerging applications in those bands. However, operations in the 31.3-31.8 GHz band can be protected without adopting guard bands. Instead, as discussed below, carefully tailored operating requirements can address transmissions from operations in the adjacent band.99 RAS sites are limited in number and located in remote areas, so geographic separation and coordination zones can provide adequate protection. Furthermore, application of guard bands generally throughout the band would limit wireless systems capabilities unnecessarily given that RAS are only in specified remote locations. EESS and SRS operations in the band can also be protected by establishing some targeted constraints on 5G deployments.100
B. PROTECTION OF RAS
1. CALCULATIONS
Detailed calculations are shown in the Appendix, but in general we used the base station emissions model described above to calculate the total out-of-band radiated power that would be seen by a 300 megahertz RAS receiver in the adjacent band. We then calculated the aggregate amount of interference power that would be generated by three simultaneously transmitting base station sectors in the direction of a RAS receiver taking into account the antenna discrimination values for beamformed and non-beamformed transmissions as well as the ratio of this traffic. Using this aggregate interference power, the ITU protection criteria of −192 dBW/500 MHz, and the RAS antenna gain, we calculated the path loss that would be required between the RAS receiver and the interference sources to ensure the ITU protection criteria was not exceeded. We then used the Friis formula to calculate the separation distance required to achieve the required free space path loss, using the center frequency of the passive band in the formula.
The calculation for mobile devices is similar. We used the device emissions model used above to calculate the total out-of-band radiated power that would be seen by a 300 megahertz RAS receiver from a single mobile device. And while we assume 17 dBi of beamforming gain in the direction of the base station, we assume a uniform distribution of mobiles such that the aggregate gain in any direction is 0 dBi. Thus, we assume that there is no antenna discrimination in the direction of the

T-Mobile | 5G Coexistence Study25
RAS antenna in the mobile calculation. We then used the distance calculated in the base station calculation and assumed that mobile devices may transmit from 1.2 kilometers closer to the RAS antenna to calculate the path loss required between mobile devices and the RAS antenna to ensure the ITU protection criteria would not be exceeded. As described previously, the 1.2 kilometer distance is a conservative assumption since 5G cell sizes are generally not expected to be so large given the propagation of millimeter wave bands. We then used the out-of-band power from a single mobile device, the required path loss, the RAS antenna gain, and 7 dB of loss to account for losses in the direction of the RAS antenna due to terrain, clutter, and/or foliage, to calculate the interference power from a single device at the RAS receiver. Finally we compared this interference power from a single device to the ITU protection criteria to calculate the maximum number of mobile devices that could transmit simultaneously without exceeding the ITU criteria.
2. RESULTS
The results of the RAS protection calculations are shown in Table 1 below:
Table 1: Results of RAS Protection Calculations at 32 GHz
These results demonstrate that even with conservative assumptions, including the use of free space loss propagation with no attenuation due to terrain or clutter, exclusion distances required to meet the ITU protection threshold are not exceptionally great and, especially in light of the conservative nature of the assumptions underlying this analysis, appear to provide a solid foundation for coexistence between 5G deployment and radio astronomy services.

T-Mobile | 5G Coexistence Study26
C. PROTECTION OF EESS
1. CALCULATIONS
As described earlier, EESS satellites monitor frequencies in the passive bands and pass directly over the surface of the earth at an altitude of 850 kilometers. At any given time, the EESS satellites receive measurements from a circular area with an eight kilometer radius, or 201 square kilometers.101 Because only one transmitting mobile device will typically occupy a discrete spectrum resource block at any given time in an 5G OFDMA system, interference to EESS satellites from 5G base stations and mobile devices on any particular frequency will be limited to those base stations and devices transmitting in any given 201 square kilometer circular area. Therefore, the analysis generally calculates the number of base stations and mobile devices that can operate in a 201 square kilometer area without exceeding the ITU protection threshold for EESS.
Although base stations just outside the 201 square kilometer circular area could also contribute interference to EESS, the 45 dBi used in our calculations is the peak gain of the EESS antenna,102 and this peak gain is only achievable near the center of the circular area. The gain of interfering signals from most base stations and mobiles within the 201 square kilometer area will be less than the peak, with those near the edge seeing 3 dB less gain (i.e., half as much interference power). Despite this important mitigating factor, our analysis assumes that interfering signals from all base stations and mobile devices within the area are increased by 45 dB due to the satellite’s antenna gain. Therefore, limiting the area of interfering signals to a circle with an eight kilometer radius is statistically accurate.
In addition, EESS space stations circle the Earth once every 102 minutes,103 which means that their ground speed is approximately 6.5 kilometers per second. As a result, the satellite’s eight kilometer radius beam will only stay over any point on Earth (e.g., a base station or mobile) for a maximum of 2.5 seconds, and during this time the base station or mobile may or may not be transmitting. In other words, there is a temporally limited window of opportunity for interference to occur, for which this study has not taken into account in assessing the feasibility of coexistence.
For base stations, we first use the emission model described previously to calculate the total out-of-band power in an adjacent 300 MHz receiver bandwidth. We then use the antenna discrimination assumptions for beamformed and non-beamformed transmissions and the relative percentage of these transmissions to calculate the out-of-band power at the output of the antenna from a single base station sector in the zenith direction toward the EESS satellite. We then calculate the interference power from a single sector at the EESS receiver by applying the free space path loss between the Earth and the EESS satellite and the EESS satellite’s antenna gain. This power is then used along with the ITU protection threshold to calculate the total number of sectors from which

T-Mobile | 5G Coexistence Study27
interference power could be aggregated such that the ITU EESS protection threshold would not be exceeded. As discussed in Section II.B.2 above, we assume a macrocell deployment in which each macro base station includes an average of 2.5 sectors, and this value is used to calculate the number of base stations from the number of sectors. Our base station sector assumptions represent another worst-case estimate because most millimeter wave deployments are expected to be micro cells which will have lower power, lower height, and fewer sectors than a typical macro cell. Therefore, 100 macro cells is equivalent to many more micro cells, and more importantly the aggregate interference power from the equivalent number of micro cells will be lower. Finally, we calculate the implied cell radius using the 201 square kilometer area and the formula for the area of a hexagon.
For mobile devices, the calculation is similar. The total out-of-band power in a 300 MHz receiver bandwidth is calculated using the average device out-of-band power in an urban setting as described above. As with the RAS calculation, we assume no antenna discrimination between the mobile device and the EESS satellite, but we assume a modest 5 dB of losses over free space loss to account for foliage, clutter, and other attenuating effects such as atmospheric absorption. We then add the gain of the EESS antenna to calculate the interference power of a single mobile device at the EESS receiver. Using this value and the ITU protection criteria we then calculate the number of mobile devices that can simultaneously transmit without exceeding the ITU threshold. Since only one mobile device per sector can transmit in the adjacent channel at any given time, the result will be limited by the number of base station sectors if the number of mobiles calculated exceeds the number of sectors that can be supported in a 201 square kilometer area. Otherwise, the number of sectors will be limited to the number of mobiles calculated.
2. RESULTS
The results of the EESS protection calculations are shown in Table 2 below:
Table 2: Results of EESS Protection Calculations at 32 GHz
In this case, the number of mobiles is slightly greater than the number of base station sectors. Given the conservative assumptions chosen for purposes of this analysis, therefore, a maximum of

T-Mobile | 5G Coexistence Study28
1,326 sectors can be deployed in any 201 square kilometer circular area to meet the ITU protection threshold for both base station and mobile device out-of-band emissions.
D. DISCUSSION/CONCLUSIONS
The RAS calculation results shown above show that only a modest radius of exclusion surrounding an RAS facility is required to protect RAS. Footnote US385 in the Table of Allocations defines protection zones around 16 radio astronomy locations, and the distances calculated in this analysis are smaller than these zones. This suggests that 5G services can easily coexist with radio astronomy through a combination of exclusion zones and coordination.
As stated above, the number of base stations can increase if the attenuation in the direction of the EESS satellite can be increased. This increase in attenuation can happen, for example, through power reduction (which will decrease both fundamental emissions and OOBE), greater antenna discrimination, additional filtering, or overhead gain suppression. Given the greater flexibility of controlling harmful emissions from base stations, the interference from mobile stations can be viewed as dominating the analysis. Thus, if operators use methods to further reduce harmful emissions from base stations than assumed in this analysis, the number of simultaneously transmitting base stations will be limited by the number of simultaneously transmitting mobile devices.
The results of the EESS analysis suggest that 5G deployments in the 32 GHz band will be subject to some constraints to fully protect EESS receivers. However, the nature of these constraints are not onerous and do not provide a valid reason not to allocate the band for 5G mobile services. First, the constraints affect only the first adjacent channel in the band plan; other channels in the band plan shown above would not be subject to any constraints necessary to provide sufficient margin to protect RAS against the potential for harmful interference from 5G operations. Second, the cell site density represented by the results is highly unlikely to occur in the vast majority of regions throughout the country. The cell site density required to cause harmful interference to EESS is only possible in a few of the most densely populated areas of the country, which means the constraints are unlikely to prove meaningful to 5G operators outside of a handful of highly urbanized areas.

T-Mobile | 5G Coexistence Study29
V. 47 GHz Band (47.2 – 50.2 GHz)
A. BACKGROUND, BAND PLAN, AND FURTHER NOTICE QUESTIONS
In the 47 GHz Band, the FCC has proposed a three gigahertz band for 5G services comprised of six, 500-megahertz wide channels. The majority of the band does not border any type of passive service,104 but the uppermost portion of the highest frequency channels shares a band edge at 50.2 GHz with two hundred megahertz allocation for EESS and space research services from 50.2 GHz to 50.4. GHz.105 The diagram below shows the proposed band plan; passive services appear in yellow.
Resolution750appliesRASFixed,Mobile&FSSEarth-to-space(US297) Fixed,Mobile(US264)&FSSEarth-to-space(US156,US297,5.338A,5.516B&5.552)(also5.555,US342,5.149&5.340)
Proposed47GHzBandandChannelization(Part30)
EESS&SpaceResearch
Passive(US246&5.340)
61 2 3 4 5
HAPS HAPS
47.2 50.2 50.447.7 48.2 48.7 49.2 49.7
Figure 11: 47 GHz Band Plan
While there are primary non-Federal fixed and mobile broadband allocations throughout the 47 GHz band, there are currently no service rules for terrestrial operations in this band.106 The FCC sought comment on sharing with co-primary Federal services in the 48.2-50.2 GHz band, as well as protection of passive services in the adjacent 50.2-50.4 GHz band; the FCC noted that it understood that there are currently no authorized Federal or non-Federal operations in the 48.2-50.2 GHz band but that there may be future Federal operations in that band.107
In considering its proposed allocation for the 47 GHz band, the FCC asked what steps, if any, should be taken to protect radio astronomy over and above implementing the existing prohibition on aeronautical use in the 48.94-49.04 GHz band.108 The FCC also asked what requirements would be appropriate to protect passive EESS in the 50.2-50.4 GHz bands from fixed and mobile use in the 47.2-50.2 GHz band.109
The FCC should adopt exclusion or coordination zones to ensure protection of RAS from terrestrial service emissions in the 48.94-49.04 GHz band based on information from CORF and other radio astronomy interests on locations where the band is used for radio astronomy observations. The calculations below show that the adjacent 500 megahertz channel in the 47 GHz band plan will pose about the same challenges to protect EESS and SRS as the adjacent 200 megahertz channel in the 32 GHz band. The FCC should work with NASA and other EESS and SRS interests to analyze and develop requirements to mitigate emissions toward satellite receivers. Finally, the FCC asked whether there is any value in establishing a guard band immediately below 52.6 GHz to protect
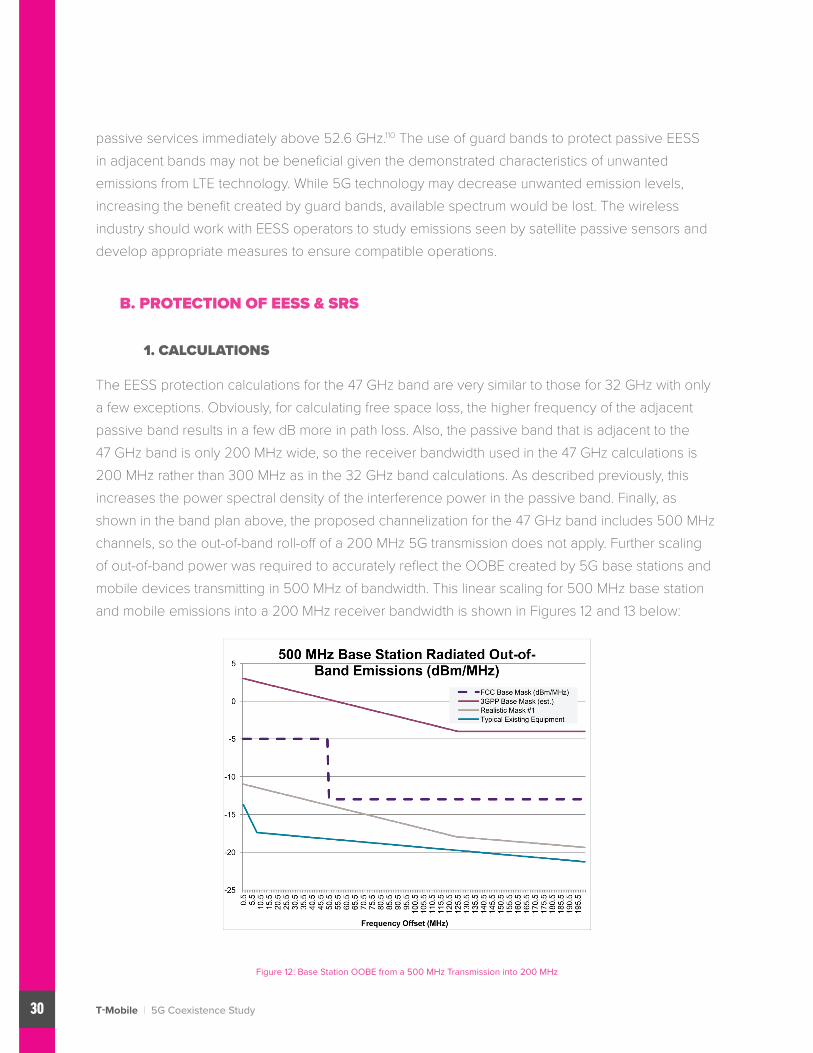
T-Mobile | 5G Coexistence Study30
passive services immediately above 52.6 GHz.110 The use of guard bands to protect passive EESS in adjacent bands may not be beneficial given the demonstrated characteristics of unwanted emissions from LTE technology. While 5G technology may decrease unwanted emission levels, increasing the benefit created by guard bands, available spectrum would be lost. The wireless industry should work with EESS operators to study emissions seen by satellite passive sensors and develop appropriate measures to ensure compatible operations.
B. PROTECTION OF EESS & SRS
1. CALCULATIONS
The EESS protection calculations for the 47 GHz band are very similar to those for 32 GHz with only a few exceptions. Obviously, for calculating free space loss, the higher frequency of the adjacent passive band results in a few dB more in path loss. Also, the passive band that is adjacent to the 47 GHz band is only 200 MHz wide, so the receiver bandwidth used in the 47 GHz calculations is 200 MHz rather than 300 MHz as in the 32 GHz band calculations. As described previously, this increases the power spectral density of the interference power in the passive band. Finally, as shown in the band plan above, the proposed channelization for the 47 GHz band includes 500 MHz channels, so the out-of-band roll-off of a 200 MHz 5G transmission does not apply. Further scaling of out-of-band power was required to accurately reflect the OOBE created by 5G base stations and mobile devices transmitting in 500 MHz of bandwidth. This linear scaling for 500 MHz base station and mobile emissions into a 200 MHz receiver bandwidth is shown in Figures 12 and 13 below:
Figure 12: Base Station OOBE from a 500 MHz Transmission into 200 MHz

T-Mobile | 5G Coexistence Study31
Figure 13: Mobile Device OOBE from a 500 MHz Transmission into 200 MHz
Considering these differences, the calculation methodology is identical to that described above for the 32 MHz band.
2. RESULTS
The results of the EESS protection calculations for the 47 GHz band are shown in Table 3 below:
Table 3: Results of EESS Protection Calculations at 47 GHz
As expected, the out-of-band interference power is higher than in the 32 GHz band due to the slower roll-off from a 500 megahertz 5G transmission. However, this 2 dB increase is offset by about 4 dB of additional propagation losses at 50 GHz compared to 32 GHz such that the power from a single transmitter at the EESS receiver is lower. Nonetheless, the 200 megahertz receiver bandwidth also contributes to the difference because the ITU threshold is no longer scaled to a

T-Mobile | 5G Coexistence Study32
300 megahertz receiver bandwidth. The result is that 500 megahertz channels in the 47 GHz band have approximately the same effect on EESS receivers as 200 megahertz channels in the 32 GHz band.
C. DISCUSSION/CONCLUSIONS
The calculations above show that the adjacent 500 megahertz channel in the 47 GHz band plan will have about the same challenges to protect EESS as the adjacent 200 megahertz channel in the 32 GHz band.
VI. 50 GHz Band (50.4 – 52.6 GHz)
A. BACKGROUND, BAND PLAN, AND FURTHER NOTICE QUESTIONS
In the 50 GHz band, the FCC proposed to allocate 2200 megahertz of spectrum for 5G wireless use. The band would be divided evenly among 11 two hundred megahertz-wide channels. Primary Federal allocations for the fixed and mobile services exist in the 50 GHz band, but are limited to military systems.111 And while there are primary fixed and mobile service allocations throughout this band subject to certain restrictions, there are currently no other service rules for this band.112 In the 50.4-50.9 GHz band, for FSS earth stations, the unwanted emissions power in the band 50.2-50.4 GHz shall not exceed -20 dBW/200 MHz.113 In the 51.4-52.6 GHz band, unwanted emissions power into the adjacent 52.6-54.25 GHz shall not exceed – 33 dBW/100 MHz (measured at the input of the antenna).114
RAS?(n.5.556)
6 7 8 9 10 11
Proposed50GHzBandandChannilization(Part30)
EESS&SpaceResearch
PassiveBand(US246,5.340,5.556)
EESS&SpaceResearch
Passive(US246&5.340)
1 2 3 4 5
50.450.2 52.6 54.2551.4
Figure 14: 50 GHz Band Plan
Passive services bookend both the lower and upper portions of the 50 GHz band. Below 50.4 GHz, the primary EESS and Space Research allocation has a primary allocation. Above 52.6 GHz, there is a co-primary EESS allocation with the SRS in 52.6-54.25 GHz band, and no station is authorized to transmit in the band.

T-Mobile | 5G Coexistence Study33
B. PROTECTION OF EESS & SRS AT 50.4 GHZ
1. CALCULATIONS
The passive band at the lower end of the 50 GHz band is the same passive band we analyzed in the 47 GHz band section above. Therefore, we must consider the aggregate effects of interference power originating from both sides of the 50.2-50.4 GHz band. Our calculations consider the effects of the two bands independently; however, if both bands are allocated for 5G mobile use, protection of EESS passive services in the 50.2-50.4 GHz band must be addressed by considering the aggregate effects of emissions in both bands. This combination of effects may result in addition constraints on 5G deployments that use the adjacent channel in one or both bands.
The calculations for emissions in the 50 GHz band to protect EESS in the 50.2-50.4 GHz band are identical to those described above for 47 GHz except that the channel bandwidth used is 200 megahertz, consistent with the FCC’s proposed channelization in the 50 GHz band.
2. RESULTS
The results of the EESS protection calculations for the 50 GHz band into the 50.2-50.4 GHz passive band are shown in Table 4 below:
Table 4: Results of EESS Protection Calculations of 50.2-50.4 GHz from the 50 GHz Band
These results clearly show the beneficial effects of using smaller bandwidth channels in the adjacent band. The total OOBE power in the EESS receiver bandwidth is approximately 2.7 dB lower than shown in Table 3 for the 47 GHz band where the channelization is 500 megahertz, and the lower interference power results in nearly twice as many simultaneous transmitters allowed.

T-Mobile | 5G Coexistence Study34
C. PROTECTION OF EESS & SRS AT 52.6 GHZ
1. CALCULATIONS
The 52.6 – 54.25 GHz passive band at the upper end of the 50 GHz band has a much larger bandwidth than the 200 megahertz 50.2-50.4 GHz passive band and therefore can support larger bandwidth EESS measurements; however, we continue to use a receiver bandwidth of 300 megahertz for our interference calculations to be conservative. Aside from the different receiver bandwidth and higher frequency, the calculations are identical to those described earlier.
2. RESULTS
The results of the EESS protection calculations for the 50 GHz band into the 52.6-54.25 GHz passive band are shown in Table 5 below:
Table 5: Results of EESS Protection Calculations of 52.6-54.25 GHz from the 50 GHz Band
The results shown here are the most favorable of the three bands analyzed in this report due to the greater path loss of the higher frequency and a transmit bandwidth of 200 megahertz.
D. DISCUSSION/CONCLUSIONS
Protecting EESS passive services in the 52.6-54.25 GHz band will require the least constraints on 5G deployments of any of the three bands under consideration in this report. Protecting passive services the 50.2-50.4 GHz band from 5G operations in the 50 GHz band will need to be performed in conjunction with 5G deployments in the 47 GHz band if 5G services are allocated in both bands. Achieving sufficient protection for EESS in the 50.2-50.4 GHz band if 5G operations are deployed in both the 47 GHz and 50 GHz bands may require a small amount of guard band which would optimally be implemented at the upper end of the 47 GHz band. Alternatively, the risk of interference from OOBE could be reduced by requiring smaller bandwidth channels at the upper end of the 47 GHz band.

T-Mobile | 5G Coexistence Study35
VII. ConclusionsBroadband deployments in the 32 GHz, 47 GHz, and 50 GHz bands can coexist with existing RAS, EESS, and other passive operations without causing harmful interference. This study uses conservative assumptions to establish the feasibility of coexistence under worst-case conditions. Real-world conditions will provide additional margin for interference avoidance. And while the FCC may need to adopt certain modest constraints on 5G deployments within certain channels of the millimeter wave bands under consideration for broadband use, the types of constraints necessary for coexistence are modest and entirely in keeping with robust nationwide 5G deployments. Propagation characteristics, deployment architectures and technical innovations in 5G systems will substantially limit the aggregate amount of out-of-band emissions passive services will experience. Authorizing the use of the 32 GHz, 47 GHz, and 50 GHz bands for 5G deployment promises to unleash the transformative potential of these bands for broadband services while protecting incumbent passive services in adjacent-channel spectrum.

T-Mobile | 5G Coexistence Study36
End Notes1 See Use of Spectrum Bands Above 24 GHz for Mobile Radio Services et al., Report and Order and Further Notice of Proposed Rulemaking, 31 FCC Rcd 8014 ¶¶ 381-99, 408-23 (2016) (“Spectrum Frontiers Report and Order and Further Notice”).
2 See Amendment of Part 2 of the FCC’s Rules to Realign the 76-81 GHz Band and the Frequency Range Above 95 GHz Consistent with International Allocation Changes, et al., Report and Order, 19 FCC Rcd 3212, 3214 ¶ 3 (2004) (“RAS/EESS Order”); 47 C.F.R. § 2.1.
3 Amendment of Part 2 of the FCC’s Rules, Notice of Proposed Rulemaking, 18 FCC Rcd 8347, 8349 ¶ 4 (2003) (“RAS/EESS NPRM”); see also Final Acts of the World Radiocommunication Conference (WRC-2000).
4 See generally RAS/EESS Order.
5 RAS/EESS Order ¶ 1.
6 Id. ¶ 4.
7 Recommendation ITU-R RA.769-2, Protection Criteria Used for Radio Astronomical Measurements (2003).
8 RAS/EESS Order ¶ 13 (“RAS receivers are usually located on high mountains or in remote areas, and access to RAS telescopes is controlled at distances of at least one kilometer”).
9 See generally RAS/EESS Order.
10 The committee also acts as a channel for representing the interests of U.S. scientists in the work of the Scientific Committee on Frequency Allocations for Radio Astronomy and Space Science (“IUCAF”) of the International Council for Science and in working groups of the Radiocommunication Sector of the International Telecommunication Union (“ITU”). See Committee on Radio Frequencies (CORF), The National Academies of Sciences, Engineering, Medicine, http://bit.ly/2vgQzUe (last visited July 27, 2017) (“CORF Overview”); See Comments of the National Academy of Sciences’ Committee on Radio Frequencies, WT Docket No. 14-177 et al., at 2 (filed Sept. 29, 2017) (“CORF Comments”).
11 See CORF Comments at 4.
12 See id. at 8.
13 See id.
14 See 47 C.F.R. § 2.106.
15 In the Matter of Use of Spectrum Bands Above 24 GHz for Mobile Radio Services, Notice of Proposed Rulemaking, 30 FCC Rcd 11878 (2015) (“Spectrum Frontiers NPRM”).
16 Spectrum Frontiers Report and Order ¶¶ 5, 16; Spectrum Frontiers Further Notice ¶ 386.
17 Spectrum Frontiers Further Notice ¶ 389.
18 See, e.g., Comments of Avanti Communications Group PLC, GN Docket No. 14-177 et al., at 7 (filed Jan. 27, 2016) (“We appreciate that the NPRM has opened consideration to the [32 GHz band] – which was the most commonly supported band during the WRC-15 for IMT/5G – as a suitable candidate band for [international mobile telecommunications and 5G] services. . . . It is expected that such the 32 GHz frequency range could be implemented by a single 5G mobile device that could enjoy the prospect of global roaming in around the year 2020.”); Comments of the EMEA Satellite Operators Assn. (ESOA), GN Docket No. 14-177 et al., at 8-9 (Jan. 27, 2016) (supporting a mobile allocation in the 32 GHz band and explaining that “deep-space research operations in the adjacent band could easily be protected from mobile terrestrial operations in this band because such research facilities are few in number and are located in very remote areas that would provide protection from interference” and proposing that concerns regarding the lack of mobile allocation in the 32 GHz band “can be addressed following the sharing and compatibility studies approved by WRC-15 for completion prior to WRC-19”); Comments of the Global VSAT Forum, GN Docket No. 14-177 et al., at 4-5 (filed Jan. 28, 2016) (“While the [32 GHz] band is not globally harmonized as a mobile band, the decision of the WRC-15 to support this band indicates that global harmonization is possible.”).
19 Spectrum Frontiers Further Notice ¶ 386.
20 Id.

T-Mobile | 5G Coexistence Study37
21 The Table of Allocations indicates that RAS observations are made in the 31.3-31.8 GHz band. Although the table also indicates that RAS observations may be carried out under national arrangements in the 51.4-54.25 GHz band, we are not aware of any such use in the United States. See 47 C.F.R. § 2.106 n.5.556. The FCC does not acknowledge any RAS operations in the 50 GHz band. See Spectrum Frontiers Further Notice ¶¶ 418-423. The 51.4-52.6 GHz band is allocated for Fixed and Mobile services on a co-primary basis and unwanted emissions power is limited to -33 dBW/100 MHz (measured at the input of the antenna). See 47 C.F.R. § 2.106 US157. The 52.6-54.25 GHz band is allocated for EESS (passive) and SRS (passive) on a co-primary basis and no station is authorized to transmit in the band except for medical telemetry equipment and white space devices. See id. US246.
22 Recommendation ITU-R RA.769-2, Protection Criteria Used for Radio Astronomical Measurements (2003) (“ITU-R RA.769-2”).
23 Id. at Recommendation 3.
24 Id. at Recommendation 4.
25 Id. at Annex 1, Table 1.
26 Id.
27 Id.
28 In another coexistence study submitted in this docket, Reed Engineering assumed that up to 25% of radio resources are used for sector (cell)-wide non-beamformed transmission at a regular power level. See Co-Existence of 5G Mobile Service and RAS, EESS, and SRS at 31 GHz, at 5, Appendix II (2017), attached to letter from Michele C. Farquhar, counsel to Nextlink Wireless, LLC, to Marlene H. Dortch, Secretary, FCC, GN Docket No. 14-177 et al. (filed Apr. 20, 2017) (Reed Report) (“Radio resources undergoing user-specific beamforming: 75 percent (i.e., no beamforming for 25 percent of resources carrying overhead such as Reference Signals used for cell acquisition).”).
29 Reed Engineering made this assumption based on LTE standards being developed by 3GPP, a partnership of seven telecommunications standard development organizations. See About 3GPP, 3GPP, http://bit.ly/1bKDd48 (last visited Aug. 2, 2017). In its RAS and EESS exclusion zone calculations for macrocells with beamforming, Reed Engineering relied on an LTE example in which reference signals comprised less than 20% of air-interface resources, and also assumes that 5G transmitter overhead signals will contribute less than 25% to interference. See Reed Report at Appendix II at 1.
30 Nokia, for example, identified the antenna discrimination from 5G base stations toward geosynchronous satellites at a look angle of 15 degrees as 48 dB and does not separate losses for beam-formed signals from losses for non-beamformed signals. See Letter from Stacey Black et al. to Marlene H. Dortch, Secretary, Federal Communications Commission, GN Docket No. 14-177 3 (filed June 1, 2016), http://bit.ly/2vLPWhQ.
31 See Spectrum Frontiers Further Notice ¶ 399.
32 Although this is mathematically true in the aggregate, scenarios may arise in which traffic distribution is not uniform and interference to RAS may be more likely. In those circumstances, coordination, detailed propagation analysis, proper site selection, and site engineering will be necessary to eliminate any possibility of interference to RAS when wireless operators deploy 5G networks that employ uplink beamforming in close proximity to RAS antennas.
33 See National Research Council, Spectrum Management for Science in the 21st Century 114, 122 (Feb. 25, 2010), http://bit.ly/2vbiCoj.
34 See ITU-R RA.769-2 at ¶ 1.3.
35 RAS/EESS Order ¶ 3.
36 Id.
37 Id. ¶¶ 1, 3 n.3; 47 C.F.R. § 2.1.
38 WRC-12 Resolution 750.
39 CORF Comments at 4.
40 Id.
41 See Report ITU-R SM.2092 at 200.
42 Id. at 224.
43 See Report ITU-R SM.2092, Studies Related to the Impact of Active Services Allocated in Adjacent or Nearby Bands on Earth Exploration-Satellite Service (Passive) ¶ 9.1.3 (2007) (“ITU-R SM.2092”).

T-Mobile | 5G Coexistence Study38
44 See Recommendation ITU-R RS.1029-2, Interference Criteria for Satellite Passive Remote Sensing (2003) (withdrawn 2012).
45 Recommendation ITU-R RS.2017, Performance and Interference Criteria for Satellite Passive Remote Sensing (2012) (“ITU-R RS.2017”).
46 ITU-R RS.2017 at 1.
47 ITU-R SM.2092 states in paragraph 8.3 that the interference criterion for a specific band “is the maximum permissible interference level for the passive sensor from all sources of interference.” See ITU-R SM.2092 ¶ 8.3 (emphasis added). Although this report does not represent an aggregate analysis and does not consider contributions from all services that may cause interference to EESS, we believe the conservative assumptions used in the study leave sufficient headroom to account for other sources of interference.
48 See ITU-R RS.2017 at Table 2.
49 See ITU-R SM.2092 ¶ 9.1.4.
50 See id.
51 See Letter from to Jennifer A. Manner, EchoStar Corp., to Marlene H. Dortch, FCC, GN Docket No. 14-177 et al. at 7 (filed May 12, 2016).
52 See Letter from to Gregory M. Romano, Verizon, to Marlene H. Dortch, FCC, GN Docket No. 14-177 et al. at 2 (filed May 19, 2016).
53 Nokia calculates that the antenna discrimination from a 5G UE to a geosynchronous satellite is 22 dB. See Presentation: FSS and 5G Coexistence Analysis at 28 GHz System-level Simulation Results at 21 (Exhibit 2 to Letter from to Prakash Moorut, Nokia et al., to Marlene H. Dortch, FCC, GN Docket No. 14-177 et al. at 7 (filed May 12, 2016). This calculation may be a more reasonable assumption for antenna discrimination in the zenith direction.
54 This analysis does not consider indoor base stations as contributing factors to interference analysis. In the case of EESS, the satellite is directly overhead; therefore, signals from indoor users must traverse at least a ceiling and a roof and possibly several intermediate floors, too. The attenuation from these types of barriers at frequencies as high as the millimeter wave bands prevents indoor users from contributing to the interference scenarios relevant for satellite operations. Extensive, multiparty studies support this conclusion. For example, AT&T, Ericsson, Nokia, Samsung, T-Mobile and Verizon examined interference from 5G to GSO satellites at various look angles, all of which could leave a window between a 5G user and the victim satellite. These parties jointly concluded that “indoor devices will not impact FSS at all.” See Letter from Stacey Black et al., to Marlene H. Dortch, Secretary, Federal Communications Commission, GN Docket No. 14-177 (filed June 1, 2016).
55 See Letter from Mark Racek, Ericsson, to Marlene H. Dortch, FCC, GN Docket No. 14-177, RM-11664, at 2-3 (filed June 15, 2016) (“As with LTE, Transmission Time Intervals (“TTI”) are used to coordinate multiplexing and access control. . . . While the number of UEs served by a base station may number in the thousands, that number is not pertinent to the interference calculation, as interference is only generated by transmitting or “active” users (in each TTI and sector)” and “[o]ne UE will be scheduled at each frequency at a time per base station.”) In Ericsson’s parlance, a base station is a single sector of a cell site. See id. at 4 (“81 sites with three sectors = 243 base stations.”).
56 Multi-user MIMO (MU-MIMO) could employ Spatial Diversity Multiple Access (“SDMA”) in which spatially distributed transmission resources occupy the same frequency resource blocks at the same time. While MU-MIMO SDMA deployments in the millimeter wave bands could challenge our assumption about the number of simultaneously transmitting mobile devices on any given frequency, the deployment models currently envisioned for the millimeter wave bands do not appear to contemplate MU-MIMO SDMA uplinks and, in any event, constraints on the use of MU-MIMO SDMA uplinks could be imposed to ensure the number of simultaneously transmissions on any given frequency remains limited. Given the highly conservative nature of our assumptions, however, the necessity of constraints on MU-MIMO SDMA should be viewed skeptically.
57 FCC OET, Tutorial on TDD Systems, Part 1: Overview of Duplex Schemes (2001), http://bit.ly/2vgQzUe.
58 Id. at 5.
59 See National Advanced Spectrum and Communications Test Network (NASCTN), Draft AWS-3 Out of Band Emissions Measurements, Test and Methodology Phase II Test Plan, at 12 (Oct. 11, 2016) (“NASCTN AWS-3 OOBE Report”), http://bit.ly/2tXA67K (“It is sometimes suggested that emission measurements are not needed because it can be assumed that transmitters operate at their required emission mask limits. This assumption is nearly always false. Transmitter out-of-band (OOB) and spurious emissions are usually substantially lower than emission mask limits, often by tens of decibels. Interference studies that assume that transmitter emissions are as high as emission mask limits will therefore overestimate the power levels of most transmitters’ OOB and spurious emissions. As a result, required frequency and distance separations needed for compatible operations between systems will also be overestimated.”).
60 Id.
61 Id.

T-Mobile | 5G Coexistence Study39
62 Some recent FCC emissions masks, including the masks used for mobile and base station emissions used in this study, see infra Sections IV.B, V.B, and VI.B. FCC OOBE limits that may appear more stringent than OOBE limits of 3GPP. The seemingly more stringent FCC limits are illusory. In the millimeter wave bands, the FCC uses a methodology for determining out-of-band emissions that employs a more lenient limit within ten percent of the transmit bandwidth. The 3GPP limits do not calculate OOBE in the same manner, but use limits scaled from the twenty-megahertz LTE emissions mask. The two limits not related: the FCC’s approach is specific to the millimeter wave bands, and the 3GPP approach is specific to the limits associated with 4G LTE in bands below 6 GHz bands.
63 See Spectrum Frontiers Further Notice ¶¶ 399, 423.
64 See id. ¶ 417.
65 See Spectrum Frontiers Report and Order ¶¶ 301-305 (setting the OOBE limit for both conductive metric and TRP metric to -13 dBm/MHz).
66 Spectrum Frontiers Further Notice ¶ 303.
67 Id. ¶ 301.
68 Id.
69 Id.
70 Letter from Dean Brenner, Qualcomm Incorporated, to Marlene Dortch, FCC, GN Docket No. 12-354, at 3 (filed June 19, 2017).
71 The 5G New Radio (“NR”) waveform is expected to be based on Orthogonal Frequency Division Multiplexing or OFDM, just like LTE. The subcarrier bandwidth in NR will be scalable as opposed to fixed as it is today in LTE. The high likelihood of 5G NR standard employing scalable, OFDM makes 4G LTE OOBE performance a reliable proxy for 5G OOBE performance after accounting for changes in bandwidth, frequency and other factors.
72 3GPP, Evolved Universal Terrestrial Radio Access (E-UTRA); User Equipment (UE) Radio Transmission and Reception: Specification # 36.101 (LTE).
73 UL Verification Services Inc., Certification Test Report No. 15U21635-E9V3, FCC ID: BCG-E3042A, for Cellular Phone with Bluetooth and WLAN Radios, at 520 (Feb. 4, 2016), http://bit.ly/2vaOgm8.
74 See, e.g., FCC, Equipment Authorization System, FCC ID BCG-E3042A, OET Exhibits List, http://bit.ly/2vaOgm8.
75 See CSMAC Final Report, Working Group 1 – 1695-1710 MHz Meteorological-Satellite, at Appendix 3 (Jan. 22, 2013) (“CSMAC Report”), http://bit.ly/2vbPD3Y.
76 See NTIA, CSMAC, http://bit.ly/2f2kOIy.
77 See CSMAC Report at Appendix 3.
78 See id.
79 The maximum power assumed in the CSMAC simulations was 20 dBm, whereas 3GPP standards typically allow a maximum power level of 23 dBm. The difference is 20-(-3) = 23 dB but one could also realistically assume that UE power levels between 20 and 23 dBm will be rare such that the 50% point does not change. Thus a calculated difference of 23-(-3) = 26 dB is also reasonable. To be conservative we have assumed a difference of 23 dB.
80 See, e.g., NASCTN AWS-3 OOBE Report at 27 (“The relative offsets in measured power between a transmitter’s fundamental frequency and its 582 OOBE will vary as a function of the resolution bandwidth and measurement detector mode. The amount of this variation is ultimately determined by the modulation of the transmitter’s emissions.”).
81 See Ericsson Study at 5 (showing a maximum conducted power for 5G mobile devices of 26 dBm and a 50% operating point of -5 dBm). The difference is 31 dB.
82 Id. at 5.
83 See discussion supra Section III.B.
84 See R.N. Electronics Ltd., Radio Test Report: Cambridge Communication Systems Ltd., Metnet V4 Report No. 08-8048-2-15, at 55 (Aug. 2015), http://bit.ly/2vx3H7j.
T-Mobile | 5G Coexistence Study40
85 The 3GPP base station specification 36.104 includes several emissions masks depending on region and channel size. The mask depicted here is based on the mask for a 20 megahertz channel using the least restrictive of the regional variants. See 3GPP, Evolved Universal Terrestrial Radio Access (E-UTRA); Base Station (BS) Radio Transmission and Reception: Specification # 36.104 (LTE), Table 6.6.3.1-6.
86 See Spectrum Frontiers NPRM ¶¶ 73-74.
87 No station is currently authorized to transmit in the 31.3-31.8 GHz band. See 47 C.F.R. § 2.106 US246.
88 Id. US262.
89 Id. 5.548.
90 Id. US211.
91 Id. US211.
92 Id. US278.
93 Id. US69.
94 Id. US69.
95 Id. US360.
96 Id. US360.
97 Id. G117.
98 Spectrum Frontiers Further Notice ¶ 397.
99 See infra Section IV.D; see also Comments of the EMEA Satellite Operators Association (“ESOA”), GN Docket No. 14-177 et al., at 9 (filed Jan. 27, 2016) (urging that concerns for protecting services operating in or adjacent to the 32 GHz band “can be addressed with carefully crafted operating requirements.”).
100 See infra Section IV.D.
101 According to ITU Recommendation SM.2092, there are two types of EESS sensors: mechanical and electrical. Mechanical sensors are used today and sequentially scan sections of the Earth, while electronic “push-broom” sensors scan a continuous swath, but are not yet deployed. The parameters used in this analysis correspond to the latter type of sensor as recommended by the ITU. See ITU-R SM.2092 at 3.1.4, 7.1.4, 7.4.2.1.2, 7.5.1, 8.1.3, 8.1.4.
102 See ITU-R SM.2092 at 9.1.4
103 See id. at Table 10-2
104 The 48.94-49.04 GHz band is also used by RAS for spectral line observations, and all practicable steps must be taken to protect radio astronomy in that band from interference.47 C.F.R. § 2.106 US342.
105 47 C.F.R. § 2.106 US246; ITU RR 5.340.1 (the international allocation for the passive services “shall not impose undue constraints on the use of adjacent bands by the primary allocated services in those bands”). International footnote 5.556 provides that RAS observations may be carried out under national arrangements in the 51.4-54.25 GHz band. See 47 C.F.R. § 2.106 n.5.556.
106 See Spectrum Frontiers Further Notice ¶ 408.
107 See id. ¶ 416.
108 See id.
109 See id.
110 See Spectrum Frontiers Further Notice ¶ 423.
111 47 C.F.R. § 2.106 G117.
T-Mobile | 5G Coexistence Study41
112 Spectrum Frontiers Further Notice ¶ 418.
113 47 C.F.R. § 2.106 US 156. Maximum unwanted emissions power may be increased to -10 dBW/200 MHz for earth stations having an antenna gain greater than or equal to 57 dBi. These limits apply under clear-sky conditions. During fading conditions, the limits may be exceeded by earth stations when using uplink power control.
114 See 47 CFR § 2.106 n.US157.
115 47 C.F.R. § 2.106 US246.
T-Mobile | 5G Coexistence Study42
DETAILED CALCULATIONS
APPENDIX A

T-Mobile | 5G Coexistence Study1
RAS Protection from 32 GHz Base Stations
Parameter Value Units SourceITUInterferenceThreshold -192.0 dBW/500MHz ITU-RRA.769-2,Table1ITUInterferenceThreshold -162.0 dBm/500MHzITUThresholdperRASBandwidth -164.2 dBm/300MHz
Parameter Value Units Source
RASRxBandwidth 300 MHzSmallerRxBWareworstcasesoassumingRASisreceivingin31.5-31.8GHzisconservative
RASCenterFrequency 31.65 GHzCenterfrequencyoftheclosest300GHzRASreceivechannel
RASsidelobeantennagain 0 dBi ITU-RRA.769-2,para.1.3
Parameter Value Units Source5GBaseStationTxBandwidth 200 MHz PerFCCproposedchannelization
OOBEPowerintheRASreceiveband 5.46 dBm/300MHz PerrealisticOOBEmodel
PercentRFresourcesneededforcontrol(nobeamforming)
25% SameasReedpaper
AntennadiscriminationtowardRASreceiverfornon-beamformedRF
15 dB SameasReedpaper
AntennadiscriminationtowardRASreceiverforbeamformedRF
40 dB SameasReedpaper
Interferencecontributionofnon-beamformedRF
0.0278 mW
InterferencecontributionofbeamformedRF
0.0003 mW
Totalinterferencepower 0.0281 mWTotalInterferencepower -15.52 dBm/300MHzSimultaneoustransmittingbasestations
3
Aggregateinterferencepower -10.74 dBm/300MHz
Parameter Value Units Source
Totalrequiredpathloss 153.5 dBIxPower(in300MHz)-ProtectionThreshold(in300MHz)+RASgain
Freespacepathlossdistance 35.5 km
5GTransmitterParameters
RASParameters
RASProtectionCriteria
SeparationRequirement

T-Mobile | 5G Coexistence Study2
RAS Protection from 32 GHz Mobile Devices
Parameter Value Units Source
ITUInterferenceThreshold -192.0 dBW/500MHz ITU-RRA.769-2,Table1
ITUInterferenceThreshold -162.0 dBm/500MHz
ITUThresholdperRASBandwidth -164.2 dBm/300MHz
Parameter Value Units Source
RASRxBandwidth 300 MHzSmallerRxBWareworstcasesoassumingRASisreceivingin31.5-31.8GHzisconservative
RASCenterFrequency 31.65 GHzCenterfrequencyoftheclosest300GHzRASreceivechannel
RASsidelobeantennagain 0 dBi ITU-RRA.769-2,para.1.3
Parameter Value Units Source5GBaseStationTxBandwidth 200 MHz PerFCCproposedchannelization
OOBEPowerintheRASreceiveband -13.74 dBm/300MHz iPhoneRuralAveragePower
UEantennagain 0 dBiTotalInterferencepowerfromoneUE
-13.74 dBm/300MHz
Parameter Value Units Source
AssumedCellRadius 1.2 kmVeryconservative(large)cellradiusfor5G
Otherlosses(e.g.,antennadiscriminationtowardRASreceiver,clutter,foliage,terrain,etc.)
7 dBConservativeestimategiventhedistanceandtheheightfromwhichmostUEswilltransmit
TotalpathlossbasedonBaseStationExclusionzoneandcellradiusabove
153.2 dB FreeSpacePathLoss
InterferencepowerfromasingleUEattheRASreceiver
-173.9 dBm/300MHzIxPower(in300MHz)-ProtectionThreshold(in300MHz)+RASgain-Otherlosses
NumberofsimultaneoustransmittingUEsatcelledge
9.3
BecauseonlyoneUEpersectorcantransmitattheedgeofthebandatanygiventime,thisonlyneedstobegreaterthanthenumberofsectors
RASProtectionCriteria
RASParameters
5GTransmitterParameters
UELimitRequirementBasedonBTSDistance

T-Mobile | 5G Coexistence Study3
EESS Protection from 32 GHz Base Stations
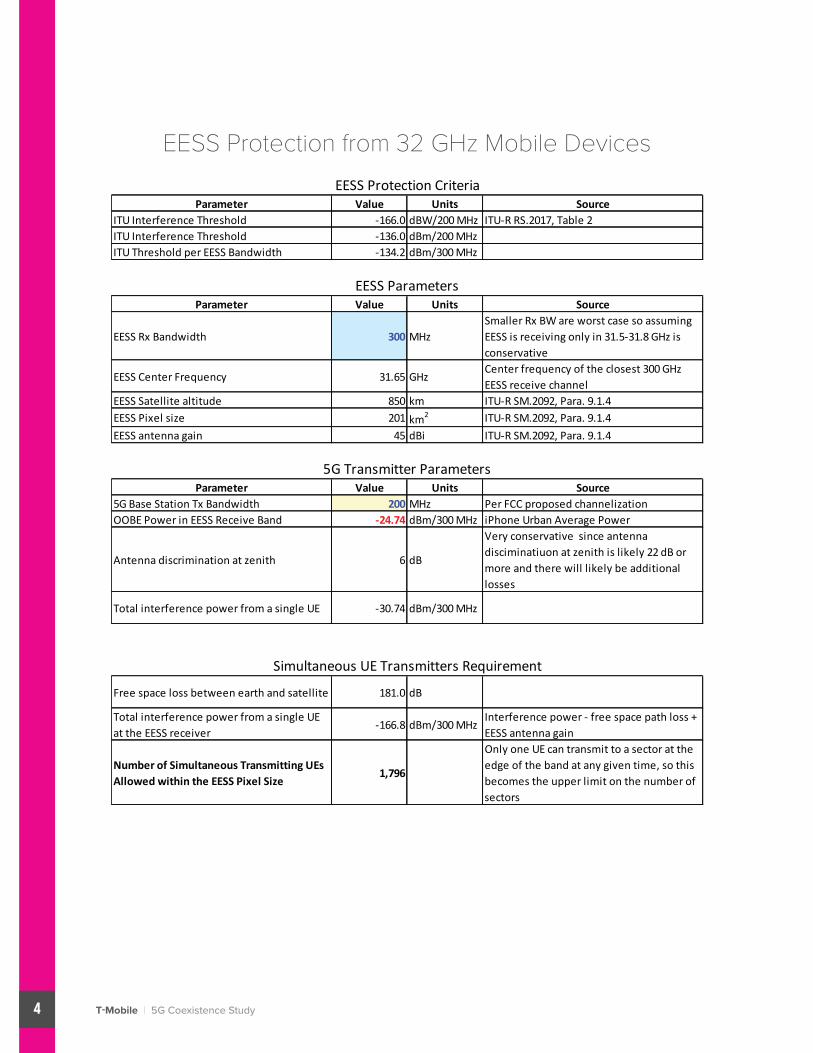
T-Mobile | 5G Coexistence Study4
EESS Protection from 32 GHz Mobile Devices
Parameter Value Units SourceITUInterferenceThreshold -166.0 dBW/200MHz ITU-RRS.2017,Table2ITUInterferenceThreshold -136.0 dBm/200MHzITUThresholdperEESSBandwidth -134.2 dBm/300MHz
Parameter Value Units Source
EESSRxBandwidth 300 MHzSmallerRxBWareworstcasesoassumingEESSisreceivingonlyin31.5-31.8GHzisconservative
EESSCenterFrequency 31.65 GHzCenterfrequencyoftheclosest300GHzEESSreceivechannel
EESSSatellitealtitude 850 km ITU-RSM.2092,Para.9.1.4EESSPixelsize 201 km2 ITU-RSM.2092,Para.9.1.4EESSantennagain 45 dBi ITU-RSM.2092,Para.9.1.4
Parameter Value Units Source5GBaseStationTxBandwidth 200 MHz PerFCCproposedchannelizationOOBEPowerinEESSReceiveBand -24.74 dBm/300MHz iPhoneUrbanAveragePower
Antennadiscriminationatzenith 6 dB
Veryconservativesinceantennadisciminatiuonatzenithislikely22dBormoreandtherewilllikelybeadditionallosses
TotalinterferencepowerfromasingleUE -30.74 dBm/300MHz
Freespacelossbetweenearthandsatellite 181.0 dB
TotalinterferencepowerfromasingleUEattheEESSreceiver
-166.8 dBm/300MHzInterferencepower-freespacepathloss+EESSantennagain
NumberofSimultaneousTransmittingUEsAllowedwithintheEESSPixelSize
1,796
OnlyoneUEcantransmittoasectorattheedgeofthebandatanygiventime,sothisbecomestheupperlimitonthenumberofsectors
EESSProtectionCriteria
EESSParameters
5GTransmitterParameters
SimultaneousUETransmittersRequirement
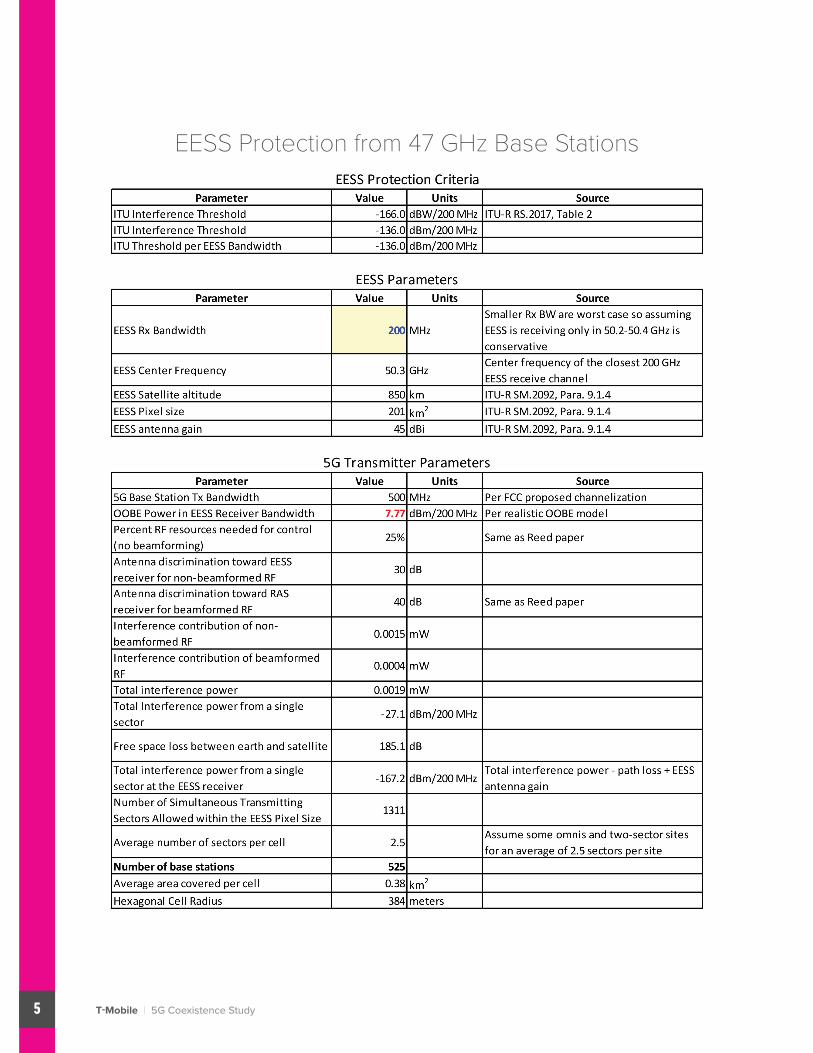
T-Mobile | 5G Coexistence Study5
EESS Protection from 47 GHz Base Stations

T-Mobile | 5G Coexistence Study6
EESS Protection from 47 GHz Mobile Devices
Parameter Value Units SourceITUInterferenceThreshold -166.0 dBW/200MHz ITU-RSM.2092,Table2ITUInterferenceThreshold -136.0 dBm/200MHzITUThresholdperEESSBandwidth -136.0 dBm/300MHz
Parameter Value Units Source
EESSRxBandwidth 200 MHzSmallerRxBWareworstcasesoassumingEESSisreceivingonlyin31.5-31.8GHzisconservative
EESSCenterFrequency 50.3 GHzCenterfrequencyoftheclosest300GHzEESSreceivechannel
EESSSatellitealtitude 850 km ITU-RSM.2092,Para.9.1.4
EESSPixelsize 201 km2 ITU-RSM.2092,Para.9.1.4
EESSantennagain 45 dBi ITU-RSM.2092,Para.9.1.4
Parameter Value Units Source5GBaseStationTxBandwidth 500 MHz PerFCCproposedchannelizationOOBEPowerinEESSReceiveBand -22.30 dBm/200MHz iPhoneUrbanAveragePowerOtherlosses(UEantennadiscriminationtowardEESSreceiver,clutter,atmosphericabsorption,etc.)
6 dBVeryconservativesincemanyUEswilllikelyhaveadditionallossesthatgreatlyexceedtheassumption
TotalinterferencepowerfromasingleUE -28.30 dBm/300MHz
Freespacelossbetweenearthandsatellite 185.1 dB
TotalinterferencepowerfromasingleUEattheEESSreceiver
-168.4 dBm/300MHzInterferencepower-freespacepathloss+EESSantennagain
NumberofSimultaneousTransmittingUEsAllowedwithintheEESSPixelSize
1,727
OnlyoneUEcantransmittoasectorattheedgeofthebandatanygiventime,sothisbecomestheupperlimitonthenumberofsectors
EESSProtectionCriteria
EESSParameters
5GTransmitterParameters
SimultaneousUETransmittersRequirement

T-Mobile | 5G Coexistence Study7
EESS Protection of 50.2-50.4 GHz from 50 GHz Base Stations
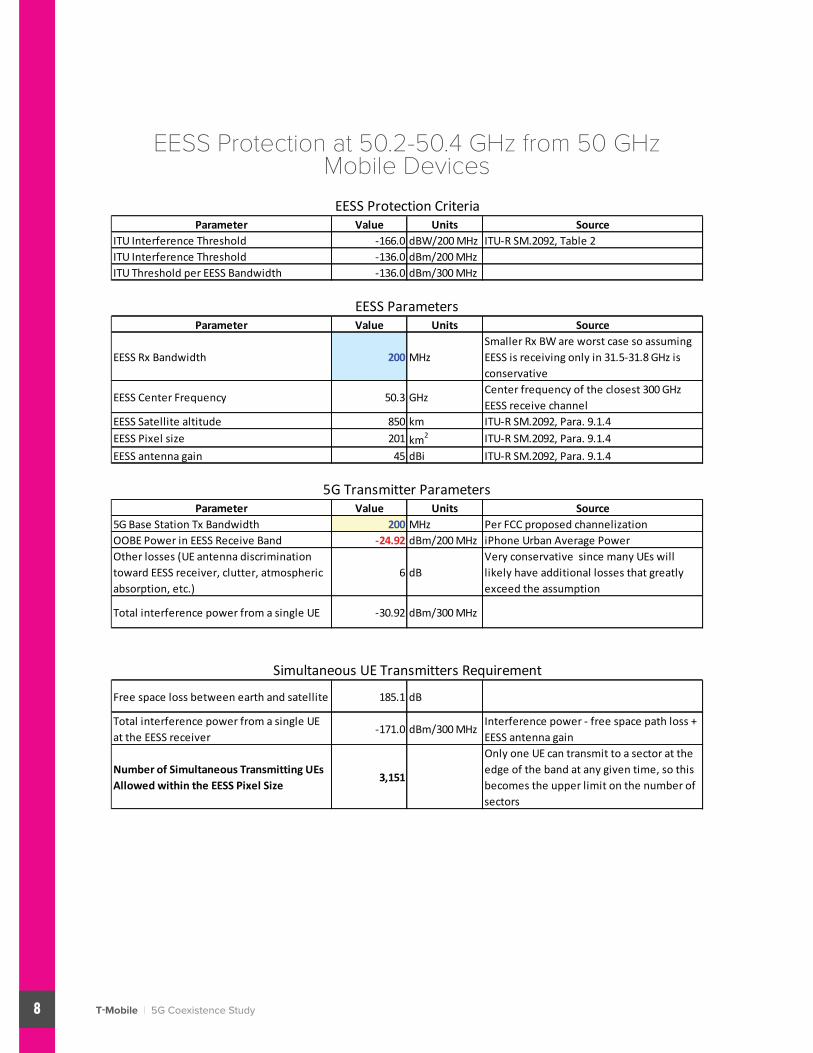
T-Mobile | 5G Coexistence Study8
EESS Protection at 50.2-50.4 GHz from 50 GHz Mobile Devices
Parameter Value Units SourceITUInterferenceThreshold -166.0 dBW/200MHz ITU-RSM.2092,Table2ITUInterferenceThreshold -136.0 dBm/200MHzITUThresholdperEESSBandwidth -136.0 dBm/300MHz
Parameter Value Units Source
EESSRxBandwidth 200 MHzSmallerRxBWareworstcasesoassumingEESSisreceivingonlyin31.5-31.8GHzisconservative
EESSCenterFrequency 50.3 GHzCenterfrequencyoftheclosest300GHzEESSreceivechannel
EESSSatellitealtitude 850 km ITU-RSM.2092,Para.9.1.4
EESSPixelsize 201 km2 ITU-RSM.2092,Para.9.1.4
EESSantennagain 45 dBi ITU-RSM.2092,Para.9.1.4
Parameter Value Units Source5GBaseStationTxBandwidth 200 MHz PerFCCproposedchannelizationOOBEPowerinEESSReceiveBand -24.92 dBm/200MHz iPhoneUrbanAveragePowerOtherlosses(UEantennadiscriminationtowardEESSreceiver,clutter,atmosphericabsorption,etc.)
6 dBVeryconservativesincemanyUEswilllikelyhaveadditionallossesthatgreatlyexceedtheassumption
TotalinterferencepowerfromasingleUE -30.92 dBm/300MHz
Freespacelossbetweenearthandsatellite 185.1 dB
TotalinterferencepowerfromasingleUEattheEESSreceiver
-171.0 dBm/300MHzInterferencepower-freespacepathloss+EESSantennagain
NumberofSimultaneousTransmittingUEsAllowedwithintheEESSPixelSize
3,151
OnlyoneUEcantransmittoasectorattheedgeofthebandatanygiventime,sothisbecomestheupperlimitonthenumberofsectors
EESSProtectionCriteria
EESSParameters
5GTransmitterParameters
SimultaneousUETransmittersRequirement

T-Mobile | 5G Coexistence Study9
EESS Protection of 52.6-54.25 GHz from 50 GHz Base Stations
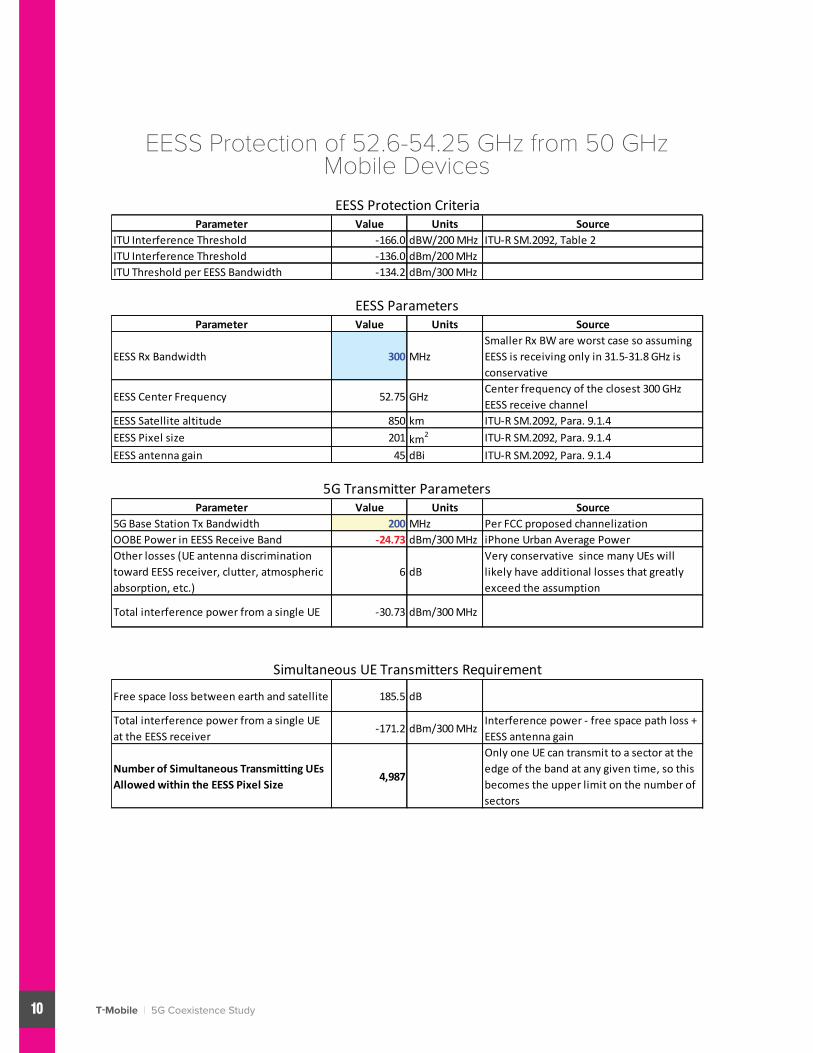
T-Mobile | 5G Coexistence Study10
EESS Protection of 52.6-54.25 GHz from 50 GHz Mobile Devices
Parameter Value Units SourceITUInterferenceThreshold -166.0 dBW/200MHz ITU-RSM.2092,Table2ITUInterferenceThreshold -136.0 dBm/200MHzITUThresholdperEESSBandwidth -134.2 dBm/300MHz
Parameter Value Units Source
EESSRxBandwidth 300 MHzSmallerRxBWareworstcasesoassumingEESSisreceivingonlyin31.5-31.8GHzisconservative
EESSCenterFrequency 52.75 GHzCenterfrequencyoftheclosest300GHzEESSreceivechannel
EESSSatellitealtitude 850 km ITU-RSM.2092,Para.9.1.4
EESSPixelsize 201 km2 ITU-RSM.2092,Para.9.1.4
EESSantennagain 45 dBi ITU-RSM.2092,Para.9.1.4
Parameter Value Units Source5GBaseStationTxBandwidth 200 MHz PerFCCproposedchannelizationOOBEPowerinEESSReceiveBand -24.73 dBm/300MHz iPhoneUrbanAveragePowerOtherlosses(UEantennadiscriminationtowardEESSreceiver,clutter,atmosphericabsorption,etc.)
6 dBVeryconservativesincemanyUEswilllikelyhaveadditionallossesthatgreatlyexceedtheassumption
TotalinterferencepowerfromasingleUE -30.73 dBm/300MHz
Freespacelossbetweenearthandsatellite 185.5 dB
TotalinterferencepowerfromasingleUEattheEESSreceiver
-171.2 dBm/300MHzInterferencepower-freespacepathloss+EESSantennagain
NumberofSimultaneousTransmittingUEsAllowedwithintheEESSPixelSize
4,987
OnlyoneUEcantransmittoasectorattheedgeofthebandatanygiventime,sothisbecomestheupperlimitonthenumberofsectors
EESSProtectionCriteria
EESSParameters
5GTransmitterParameters
SimultaneousUETransmittersRequirement

T-Mobile | 5G Coexistence Study11
RADIO ASTRONOMY LOCATIONS
APPENDIX B

T-Mobile | 5G Coexistence Study1
The Table of Allocations defines 16 locations in which radio astronomy observations are performed in the 31.3-31.8 GHz band:
US74 In the bands 25.55-25.67, 73-74.6, 406.1-410, 608-614, 1400-1427, 1660.5-1670, 2690-2700, and 4990-5000 MHz, and in the bands 10.68-10.7, 15.35-15.4, 23.6-24.0, 31.3-31.5, 86-92, 100-102, 109.5-111.8, 114.25-116, 148.5-151.5, 164-167, 200-209, and 250-252 GHz, the radio astronomy service shall be protected from unwanted emissions only to the extent that such radiation exceeds the level which would be present if the offending station were operating in compliance with the technical standards or criteria applicable to the service in which it operates. Radio astronomy observations in these bands are performed at the locations listed in US385.
US385 Radio astronomy observations may be made in the bands 1350-1400 MHz, 1718.8-1722.2 MHz, and 4950-4990 MHz on an unprotected basis, and in the band 2655-2690 MHz on a secondary basis, at the following radio astronomy observatories: