Via Electronic Filing - transmissionhub.com fileGary E. Guy Via Electronic Filing 2 Center Plaza 110...
131
Gary E. Guy Via Electronic Filing 2 Center Plaza 110 W. Fayette Street Baltimore, Maryland 21201 410.470.1337 443.213.3206 Fax [email protected] May 18, 2012 David J. Collins, Executive Secretary Public Service Commission of Maryland William Donald Schaefer Tower 6 St. Paul Street, 16 th Floor Baltimore, MD 21202-6806 Re: Administrative Docket PC29: Summer Reliability Status Conference Comments of Baltimore Gas and Electric Company Dear Mr. Collins: By Notice dated April 16, 2012 (Notice), the Public Service Commission (PSC) directed electric utilities to report on any potential reliability concerns for the forthcoming summer, as well as the transmission and distribution capability for their respective service territories. The Notice also directed each utility to present its load forecast for the forthcoming summer and provide a comparison of the current load forecast to last year’s load forecast for a comparable period. BGE’s comments responding to the Notice address BGE’s peak load forecast, its demand response and energy efficiency capability, the status of its transmission and distribution systems, and its communications efforts related to summer readiness. Peak Load Forecast Provided in Figure 1 is the 2011 peak load for the BGE zone and three peak load forecasts as recorded in the 2012 PJM Interconnection LLC (PJM) Load Report, all stated on a weather-normalized, unrestricted basis. Normal weather is defined as the 30-year moving average. Unrestricted peak load does not account for the peak load reductions from firm demand response programs. Instead, firm demand response is accounted as a capacity resource to help meet the unrestricted peak load. Two of the three forecasts are BGE forecasts – one that represents the 2011 forecast and the other that represents the current year (2012) forecast. The third forecast is the 2012 PJM forecast for the BGE zone. The primary difference between the two BGE forecasts is the recognition of a slower economic rebound. The 2012 forecast for the summer of 2012 is 273 megawatts (MW) (about 3.7%) lower than the 2011 forecast for the comparable period. The PJM forecast for BGE for the summer of 2012 is 23 MW (about 0.3%) higher than the BGE forecast. The BGE and PJM forecasts show similar growth through the forecast period.
Transcript of Via Electronic Filing - transmissionhub.com fileGary E. Guy Via Electronic Filing 2 Center Plaza 110...
Gary E. Guy
Via Electronic Filing
2 Center Plaza 110 W. Fayette Street Baltimore, Maryland 21201
410.470.1337 443.213.3206 Fax
May 18, 2012
David J. Collins, Executive Secretary
Public Service Commission of Maryland
William Donald Schaefer Tower
6 St. Paul Street, 16th
Floor
Baltimore, MD 21202-6806
Re: Administrative Docket PC29: Summer Reliability Status Conference Comments of Baltimore Gas and Electric Company
Dear Mr. Collins:
By Notice dated April 16, 2012 (Notice), the Public Service Commission (PSC)
directed electric utilities to report on any potential reliability concerns for the forthcoming
summer, as well as the transmission and distribution capability for their respective service
territories. The Notice also directed each utility to present its load forecast for the
forthcoming summer and provide a comparison of the current load forecast to last year’s
load forecast for a comparable period.
BGE’s comments responding to the Notice address BGE’s peak load forecast, its
demand response and energy efficiency capability, the status of its transmission and
distribution systems, and its communications efforts related to summer readiness.
Peak Load Forecast
Provided in Figure 1 is the 2011 peak load for the BGE zone and three peak load
forecasts as recorded in the 2012 PJM Interconnection LLC (PJM) Load Report, all stated
on a weather-normalized, unrestricted basis. Normal weather is defined as the 30-year
moving average. Unrestricted peak load does not account for the peak load reductions
from firm demand response programs. Instead, firm demand response is accounted as a
capacity resource to help meet the unrestricted peak load. Two of the three forecasts are
BGE forecasts – one that represents the 2011 forecast and the other that represents the
current year (2012) forecast. The third forecast is the 2012 PJM forecast for the BGE
zone. The primary difference between the two BGE forecasts is the recognition of a
slower economic rebound. The 2012 forecast for the summer of 2012 is 273 megawatts
(MW) (about 3.7%) lower than the 2011 forecast for the comparable period. The PJM
forecast for BGE for the summer of 2012 is 23 MW (about 0.3%) higher than the BGE
forecast. The BGE and PJM forecasts show similar growth through the forecast period.
David J. Collins, Executive Secretary
May 18, 2012
Page 2
BGE uses personal disposable income as its gauge of economic activity, while PJM uses
an index of several economic variables. Neither is wrong for its intended purpose. PJM
uses what it thinks is the best fit across the entire PJM footprint, while BGE uses what fits
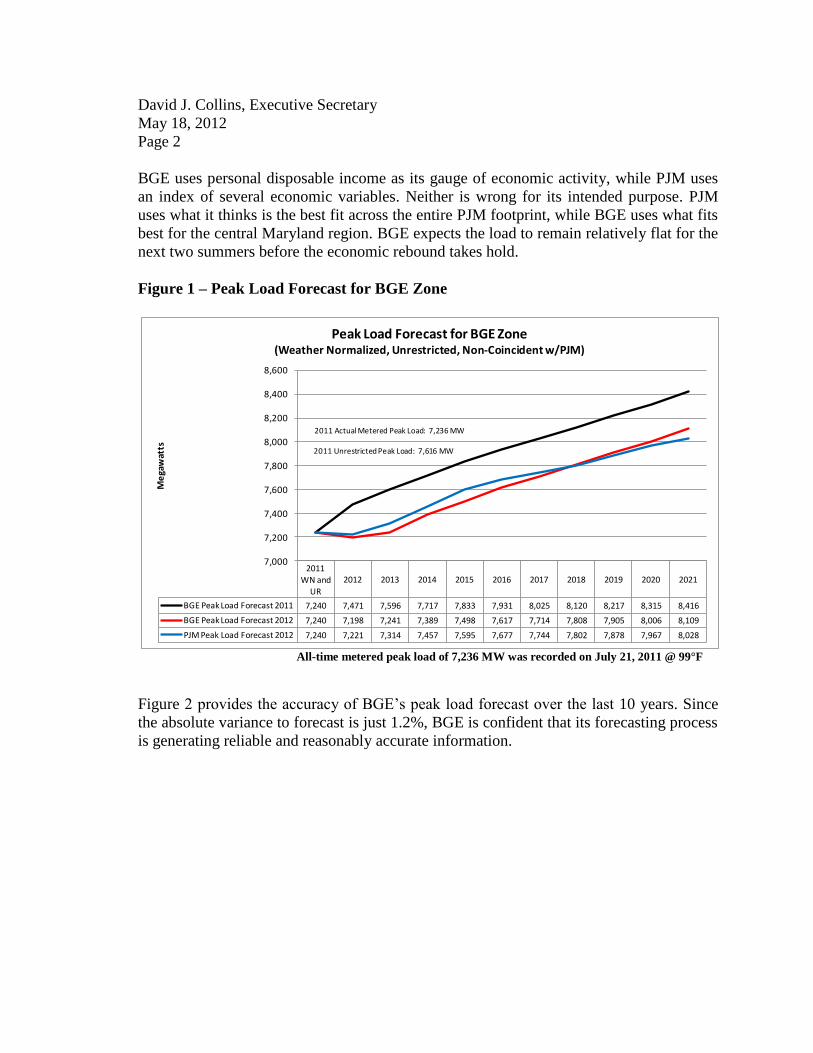
best for the central Maryland region. BGE expects the load to remain relatively flat for the
next two summers before the economic rebound takes hold.
Figure 1 – Peak Load Forecast for BGE Zone
All-time metered peak load of 7,236 MW was recorded on July 21, 2011 @ 99°F
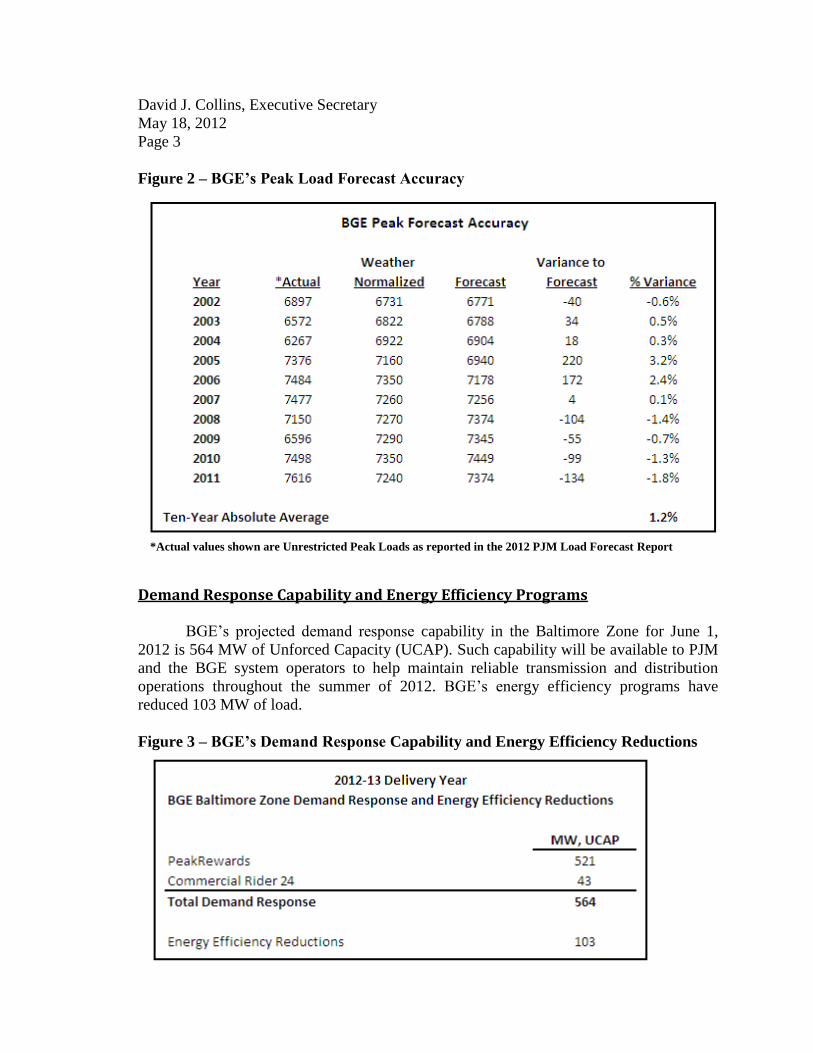
Figure 2 provides the accuracy of BGE’s peak load forecast over the last 10 years. Since
the absolute variance to forecast is just 1.2%, BGE is confident that its forecasting process
is generating reliable and reasonably accurate information.
2011 WN and
UR
2012 2013 2014 2015 2016 2017 2018 2019 2020 2021
BGE Peak Load Forecast 2011 7,240 7,471 7,596 7,717 7,833 7,931 8,025 8,120 8,217 8,315 8,416
BGE Peak Load Forecast 2012 7,240 7,198 7,241 7,389 7,498 7,617 7,714 7,808 7,905 8,006 8,109
PJM Peak Load Forecast 2012 7,240 7,221 7,314 7,457 7,595 7,677 7,744 7,802 7,878 7,967 8,028
7,000
7,200
7,400
7,600
7,800
8,000
8,200
8,400
8,600
Me
gaw
atts
Peak Load Forecast for BGE Zone (Weather Normalized, Unrestricted, Non-Coincident w/PJM)
2011 Unrestricted Peak Load: 7,616 MW
2011 Actual Metered Peak Load: 7,236 MW
David J. Collins, Executive Secretary
May 18, 2012
Page 3
Figure 2 – BGE’s Peak Load Forecast Accuracy
*Actual values shown are Unrestricted Peak Loads as reported in the 2012 PJM Load Forecast Report
Demand Response Capability and Energy Efficiency Programs
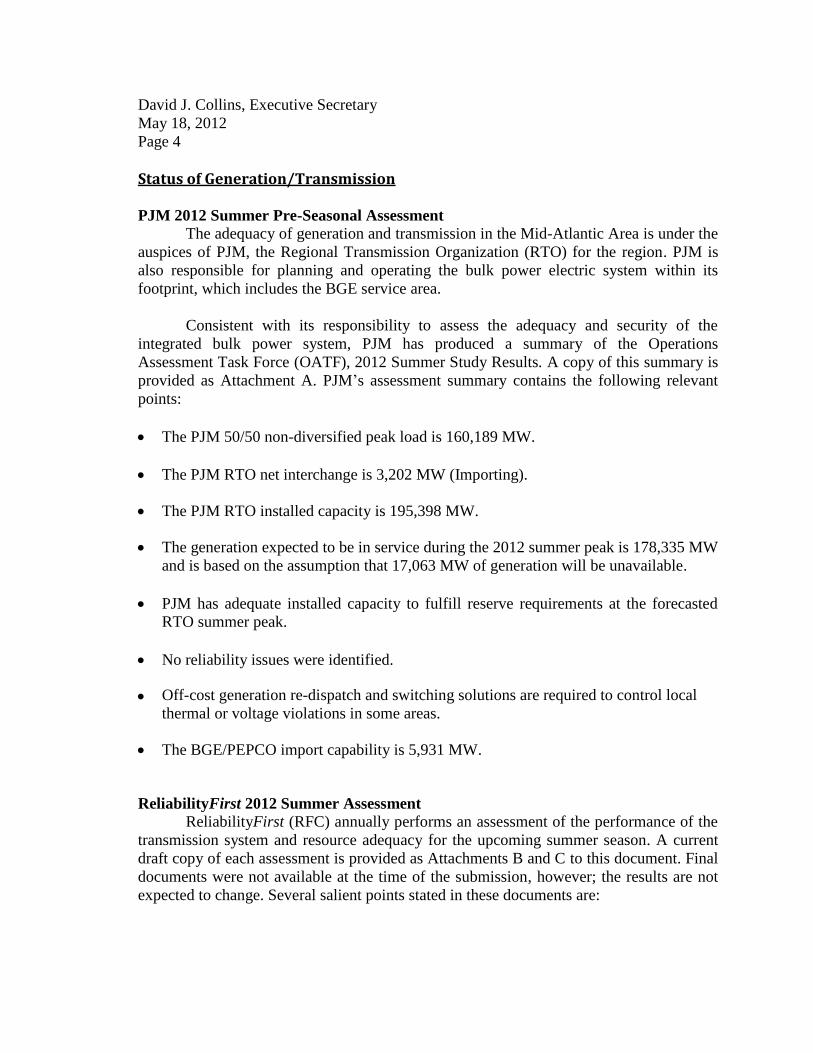
BGE’s projected demand response capability in the Baltimore Zone for June 1,
2012 is 564 MW of Unforced Capacity (UCAP). Such capability will be available to PJM
and the BGE system operators to help maintain reliable transmission and distribution
operations throughout the summer of 2012. BGE’s energy efficiency programs have
reduced 103 MW of load.
Figure 3 – BGE’s Demand Response Capability and Energy Efficiency Reductions
David J. Collins, Executive Secretary
May 18, 2012
Page 4
Status of Generation/Transmission
PJM 2012 Summer Pre-Seasonal Assessment The adequacy of generation and transmission in the Mid-Atlantic Area is under the
auspices of PJM, the Regional Transmission Organization (RTO) for the region. PJM is
also responsible for planning and operating the bulk power electric system within its
footprint, which includes the BGE service area.
Consistent with its responsibility to assess the adequacy and security of the
integrated bulk power system, PJM has produced a summary of the Operations
Assessment Task Force (OATF), 2012 Summer Study Results. A copy of this summary is
provided as Attachment A. PJM’s assessment summary contains the following relevant
points:
The PJM 50/50 non-diversified peak load is 160,189 MW.
The PJM RTO net interchange is 3,202 MW (Importing).
The PJM RTO installed capacity is 195,398 MW.
The generation expected to be in service during the 2012 summer peak is 178,335 MW
and is based on the assumption that 17,063 MW of generation will be unavailable.
PJM has adequate installed capacity to fulfill reserve requirements at the forecasted
RTO summer peak.
No reliability issues were identified.
Off-cost generation re-dispatch and switching solutions are required to control local
thermal or voltage violations in some areas.
The BGE/PEPCO import capability is 5,931 MW.
ReliabilityFirst 2012 Summer Assessment
ReliabilityFirst (RFC) annually performs an assessment of the performance of the
transmission system and resource adequacy for the upcoming summer season. A current
draft copy of each assessment is provided as Attachments B and C to this document. Final
documents were not available at the time of the submission, however; the results are not
expected to change. Several salient points stated in these documents are:

David J. Collins, Executive Secretary
May 18, 2012
Page 5
Demand and Resources
The amount of Ohio Valley Electric Corporation OVEC, PJM and Midwest
Independent System Operator (MISO) net capacity resources in RFC is 213,600 MW.
The forecast 2012 summer Net Internal Demand (NID) for the RFC region is 165,600
MW. (NID accounts for Demand Response as load reduction.)
The projected reserve margin for the RFC region is 48,000 MW, which is 29.0% based
on Net Internal Demand and Net Capacity Resources. This compares to a 32.4%
reserve margin in last summer’s assessment. A slightly lower forecast demand was
offset by fewer forecast Demand Response resources and fewer capacity resources
committed in the PJM and the MISO markets, resulting in a lower reserve margin in
2012. Both MISO and PJM are expected to have sufficient resources to satisfy their
planning reserve requirements.
PJM Net Capacity Resources for the 2012 planning year are 185,600 MW. The
projected reserves for the PJM RTO during the 2012 summer peak are 43,400 MW,
which is 30.5% of the Net Internal Demand of 142,200 MW. The PJM reserve
requirement for the 2012 summer peak demand is 15.6%. The PJM RTO has adequate
reserves to serve the 2012 summer peak demand.
A risk assessment of capacity outages exceeding the forecast reserve margins is
included this year. The forecast reserve margins and assessment criterion are based on
the 50/50 demand forecast with the Demand Response programs activated. While the
probabilities of needing to activate Demand Response resources have a 4% and 2%
probability, respectively for PJM and MISO, both RTOs have sufficient Demand
Response programs that the capacity outages are not expected to exceed the reserve
margins. This risk assessment confirms the reserve margin assessment that the
reserves are adequate for PJM and MISO.
Transmission System Performance
Based on the study work performed by RFC staff, MISO, PJM and Eastern
Interconnection Reliability Assessment Group (ERAG) with transmission owner
participation, the transmission system within the RFC footprint is projected to perform
well over a wide range of operating conditions.
There are no concerns in meeting the target in-service dates of new transmission
facilities. PJM and MISO do not anticipate any other significant transmission lines or
transformers being out of service during the 2012 summer.
No constraints are anticipated that could significantly impact reliability.
David J. Collins, Executive Secretary
May 18, 2012
Page 6
Status of the BGE Transmission System
BGE has completed, or is in the process of completing, several transmission
projects in advance of the 2012 summer season. These projects will help meet the growing
demand for electricity and improve the reliability of supply in the service area. Some of
these transmission projects include:
Rebuild of Northwest substation, where BGE constructed two 230kV rings, added two
230/115kV transformers and created a new 115kV station.
Installation of a fourth 230/115kV transformer at the Waugh Chapel substation.
Expansion at Perryman–Installation of two 2-breaker bays and extension of two new
lines to intercept Harford lines. The service date of this project is May 2012.
Rebuild of High Ridge 230kV substation to a breaker and half configuration. The
service date of this project is June 2012.
In addition, through the PJM planning process, several projects that will increase
reliability in BGE’s service area have been planned and are in various stages of
development. These projects include:
Rebuild of the Burtonsville–Sandy Spring 230kV circuits.
Construction of a new Conastone–Graceton 230kV circuit and associated rebuild of
the Graceton 230kV substation.
Construction of a new Graceton–Bagley 230kV circuit.
Replacement of the Northeast 230/115kV transformers with higher capacity units.
Construction of a Mays Chapel Gas Insulated Switchgear station.
Construction of Melvale 115kV ring bus station.
Construction of a new Bagley–Raphael Road 230kV circuit and associated rebuild of
the Raphael Road 230-kV substation.
Construction of a new Hanover Pike–Northwest double circuit line.
Construction of a new Hanover Pike 500/230kV substation.
Construction of Erdman Gas Insulated Switchgear station.
David J. Collins, Executive Secretary
May 18, 2012
Page 7
Rebuild of Mount Storm–Doubs 500kV line from Mount Storm Substation to Doubs
Substation.
These projects and additional projects that BGE anticipates will be included in
future PJM expansion plans constitute a significant increase in capital investment on
behalf of BGE. The PJM planning process is a collaborative one, in which potential
problems and the merits of alternate solutions are discussed between PJM and
transmission owners. Because only PJM has the information necessary to assess regional
impacts of local transmission projects, PJM is the planning authority and makes decisions
as to the best and most cost-effective solutions to address any identified problems.
Additionally, there are generation interconnection requests within the BGE service
that are in various stages of the interconnection process. These facilities, if constructed,
will also increase reliability in the BGE service area.
BGE continues to cooperate with PJM to develop new operating procedures to be
implemented in case of abnormal system conditions in various parts of the BGE
transmission system. In order to maintain operations proficiency, BGE’s transmission
operations personnel are attending internal system operator training and an annual PJM
system operator seminar aimed at operator preparation for the upcoming peak season.
BGE System Operations personnel are participating in several drills to maintain operations
proficiency, including the PJM System Restoration Drill, PJM Emergency Procedures
Drill, Business Continuity Drill and several Alternate Control Facility Drills.
Status of the BGE Distribution System
Distribution Capital, Operation and Maintenance Projects
BGE has completed several distribution projects within the past year that have
helped meet the growing demand for electricity and/or improve the reliability of supply in
its service territory, including:
New or Upgraded Substation Transformers
– Ridgeview 110-1 – Upgrade
– Joppatowne 110-2 – New
– Mitchellville 33-1 – New
– South River 33-2 – New
– Stepney 33-2 – New
– Forest Hill 33-2 – New
– Contee Road 33-2 – New
New Distribution 13kV Feeders
– 8 new 13kV feeders

David J. Collins, Executive Secretary
May 18, 2012
Page 8
Feeder Reliability/Capacity Upgrades
– 11-13kV feeder reliability upgrades
– 2-13kV feeder capacity upgrades
Summer Peak Load Forecast
BGE expects to operate the BGE electric distribution system reliably to meet its
customer load demands this summer. In February 2012, BGE adjusted its summer peak
load forecast to account for recent known load growth. Based upon this load forecast,
BGE developed distribution feeder load transfers from more loaded distribution feeders to
less loaded distribution feeders. This is an integral part of BGE’s routine preparation
process for upcoming peak summer and winter load seasons. BGE’s distribution facility
loading projections take into account the most recent load forecasts, the planned
distribution feeder load transfers and the distribution system projects that are under way.
Based upon the load forecasts and planned operating configuration, BGE updated its
operating procedures.
BGE conducts refresher training for its distribution system operations personnel
for the summer distribution system outlook, including the load forecast and summer
operating procedures.
Communications
BGE educates customers and other key stakeholders, including the media,
legislators and public officials, about a variety of topics that are important to our
customers and our business during the summer months. Using a proactive, integrated,
customer-centric approach to communications is especially effective during the summer
months when extremely hot weather, thunderstorms and hurricanes can impact BGE’s
service area. BGE strives to educate customers throughout the year about how to prepare
for and stay safe during severe weather, as well as how the utility prepares and responds to
storms and extremely hot weather. BGE communicates these messages to customers
through a variety of channels, including its website (bge.com), conversations in social
media (Facebook, Twitter, blogs), traditional media, community events, advertising and
customer outreach such as the Connections bill insert. When BGE experiences a
significant summer event, it ensures a continuous focus on communicating with customers
before, during and after an event. BGE’s communications team works very closely with
the Customer Contact Center and other parts of the organization to ensure consistent
messages are being delivered to customers. BGE’s proactive and holistic communications
approach is also vital in its efforts to enhance communication with its PeakRewardsSM
customers, who are instrumental in helping the company maintain system reliability
during the summer months. BGE is committed to regularly communicating with
PeakRewards customers before, during and after potential and actual program activations,
using a variety of communications channels
David J. Collins, Executive Secretary
May 18, 2012
Page 9
Summary Based on its review of PJM and RFC reports on generation and regional
transmission adequacy, its assessment of the BGE system, the system projects that are
under way, the load response programs in place and the forecasted peak demand load,
BGE does not anticipate customer load loss due to system capacity deficiencies this
summer. This, however, does not preclude outages caused by equipment problems and/or
weather event conditions. Normal preparatory and operating measures are being taken to
manage the system during the summer peak load period. BGE is committed to delivering
energy safely, economically and reliably to its customers.
Respectfully submitted,
/s/ Gary E. Guy
Gary E. Guy
Attachments
cc: Paula Carmody, Office of People’s Counsel

Attachment A

PJM©2010 www.pjm.com
Operations Assessment Task Force 2012 Summer Study Results
PJM Operating Committee Jeffrey McLaughlin
May 8, 2012
PJM©2010 2
Overview
• Case Parameters • 50/50 Non-diversified peak load study results • BGE\PEPCO Import Capability
www.pjm.com
PJM©2010 3
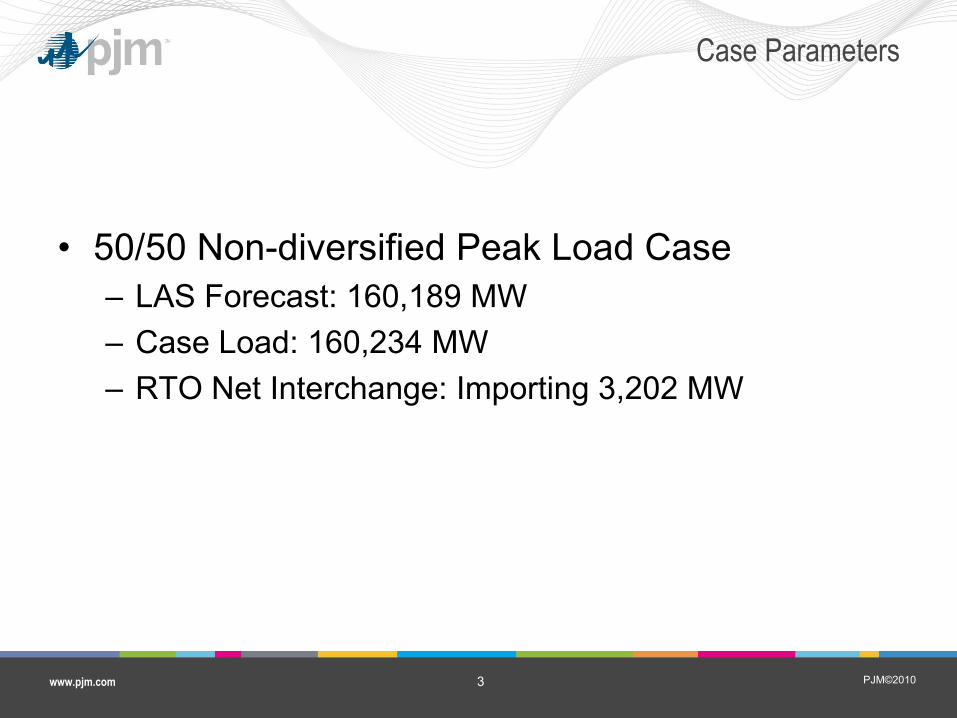
Case Parameters
• 50/50 Non-diversified Peak Load Case – LAS Forecast: 160,189 MW – Case Load: 160,234 MW – RTO Net Interchange: Importing 3,202 MW
www.pjm.com
PJM©2010 4
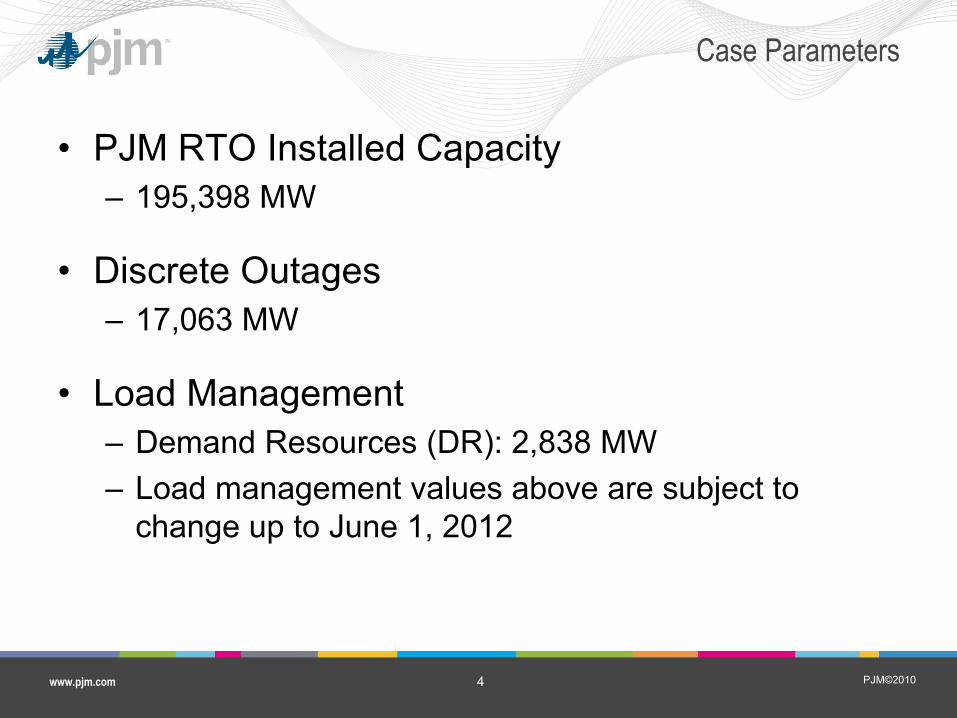
Case Parameters
• PJM RTO Installed Capacity – 195,398 MW
• Discrete Outages – 17,063 MW
• Load Management – Demand Resources (DR): 2,838 MW – Load management values above are subject to
change up to June 1, 2012
www.pjm.com
PJM©2010 5
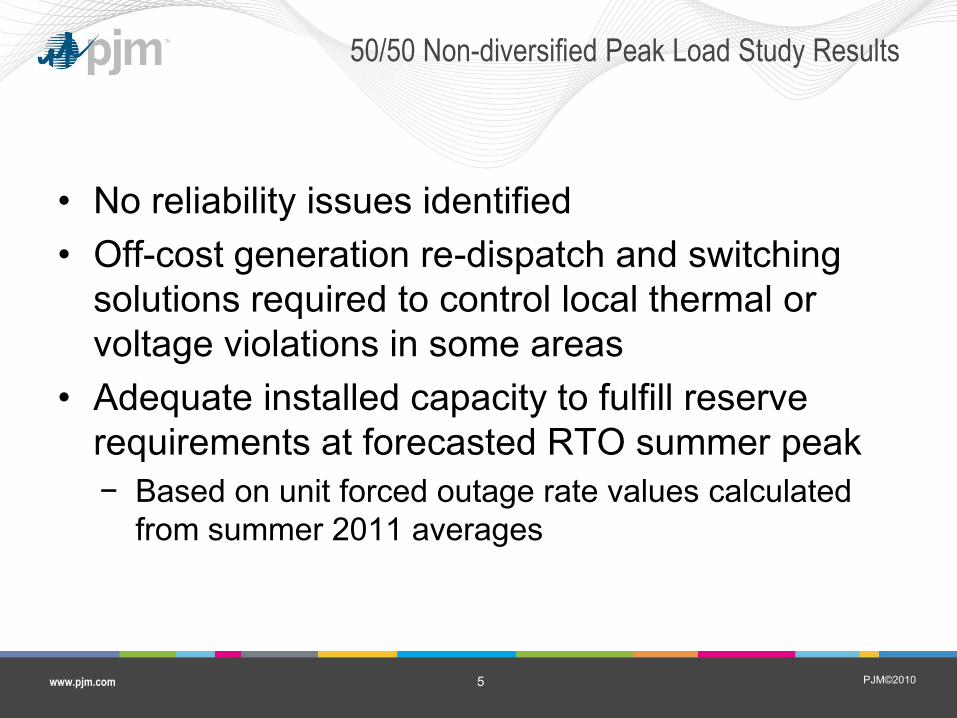
50/50 Non-diversified Peak Load Study Results
• No reliability issues identified • Off-cost generation re-dispatch and switching
solutions required to control local thermal or voltage violations in some areas
• Adequate installed capacity to fulfill reserve requirements at forecasted RTO summer peak − Based on unit forced outage rate values calculated
from summer 2011 averages
www.pjm.com
PJM©2010 6
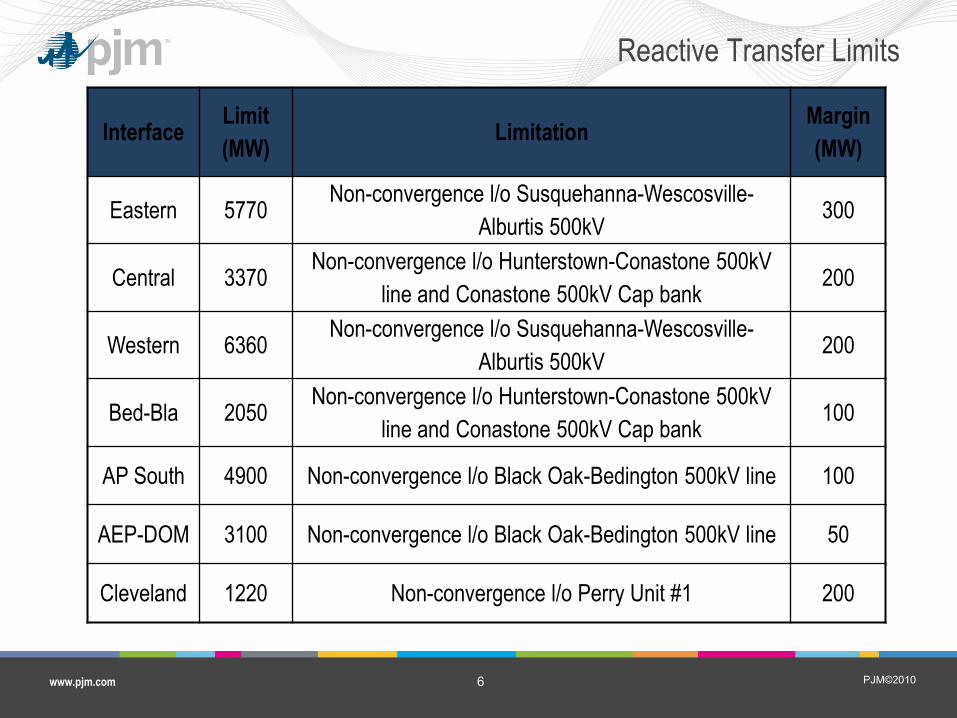
Reactive Transfer Limits
www.pjm.com
Interface Limit
(MW) Limitation
Margin
(MW)
Eastern 5770 Non-convergence l/o Susquehanna-Wescosville-
Alburtis 500kV 300
Central 3370 Non-convergence l/o Hunterstown-Conastone 500kV
line and Conastone 500kV Cap bank 200
Western 6360 Non-convergence l/o Susquehanna-Wescosville-
Alburtis 500kV 200
Bed-Bla 2050 Non-convergence l/o Hunterstown-Conastone 500kV
line and Conastone 500kV Cap bank 100
AP South 4900 Non-convergence l/o Black Oak-Bedington 500kV line 100
AEP-DOM 3100 Non-convergence l/o Black Oak-Bedington 500kV line 50
Cleveland 1220 Non-convergence l/o Perry Unit #1 200
PJM©2010 7
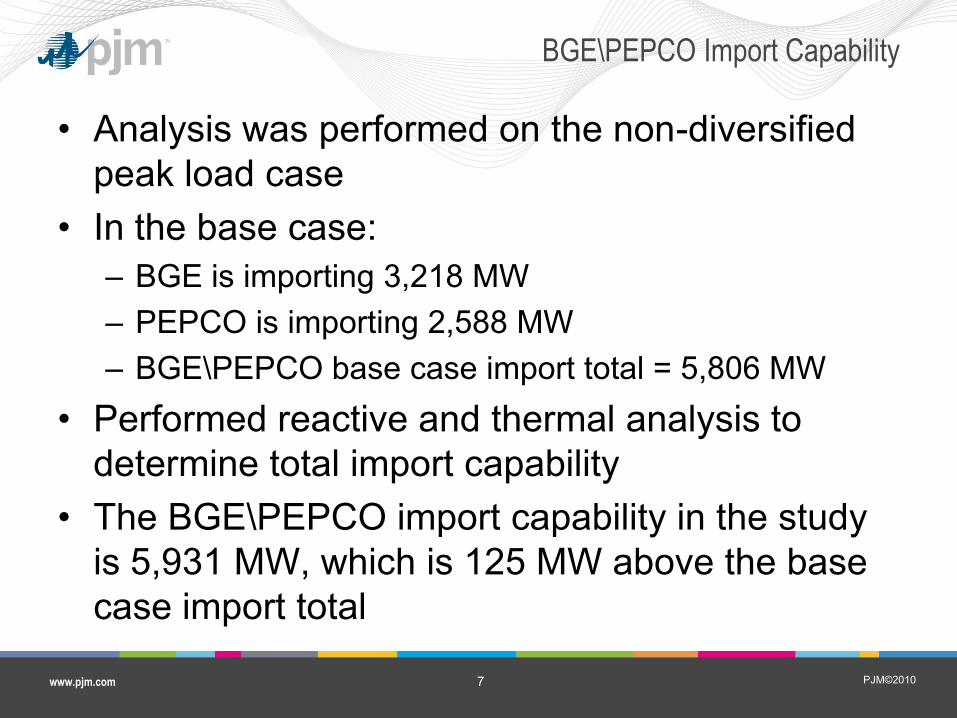
BGE\PEPCO Import Capability
• Analysis was performed on the non-diversified peak load case
• In the base case: – BGE is importing 3,218 MW – PEPCO is importing 2,588 MW – BGE\PEPCO base case import total = 5,806 MW
• Performed reactive and thermal analysis to determine total import capability
• The BGE\PEPCO import capability in the study is 5,931 MW, which is 125 MW above the base case import total
www.pjm.com

PJM©2010 www.pjm.com
Questions?

Attachment B
CORPORATION
2012 SUMMER SEASONAL ASSESSMENT
OF TRANSMISSION SYSTEM PERFORMANCE
May 23, 2012
.
Table of Contents
Introduction .............................................................................................................................. 1
Executive Summary .................................................................................................................. 4
Study Area Assessments ........................................................................................................6
The Power Flow Model ................................................................................................................................... 7
PJM East Study Area Assessment ................................................................................................................. 10
PJM South Study Area Assessment .............................................................................................................. 17
PJM West Study Area Assessment ................................................................................................................ 21
PJM Northern Illinois Study Area Assessment ............................................................................................. 32
MISO WUMS Study Area Assessment ......................................................................................................... 38
Lakes Study Area Assessment ...................................................................................................................... 43
MISO Southern Indiana Study Area Assessment .......................................................................................... 48
OVEC Study Area Assessment ..................................................................................................................... 53
Summary of PJM 2012 Summer Operating Study .............................................................. 55
Summary of MISO 2012 Summer Operating Study ........................................................... 60
Summary of ERAG Assessment ............................................................................................ 67
Appendix A - Study Procedure .............................................................................................. 70
Base Case Development ......................................................................................................70
Monitored Facilities .............................................................................................................71
Contingencies Analyzed ......................................................................................................71
Use of Operating Guides .....................................................................................................72
ReliabilityFirst Assessment Method ..................................................................................72
Thermal Analysis .......................................................................................................................................... 73
Voltage Analysis ........................................................................................................................................... 76
Appendix B – Definitions Acronyms and Abbreviations .................................................... 81
Definitions ............................................................................................................................81
Acronyms ..............................................................................................................................86
Power Flow Abbreviations ..................................................................................................87
2012 Summer Assessment of Transmission System Performance 1
Introduction
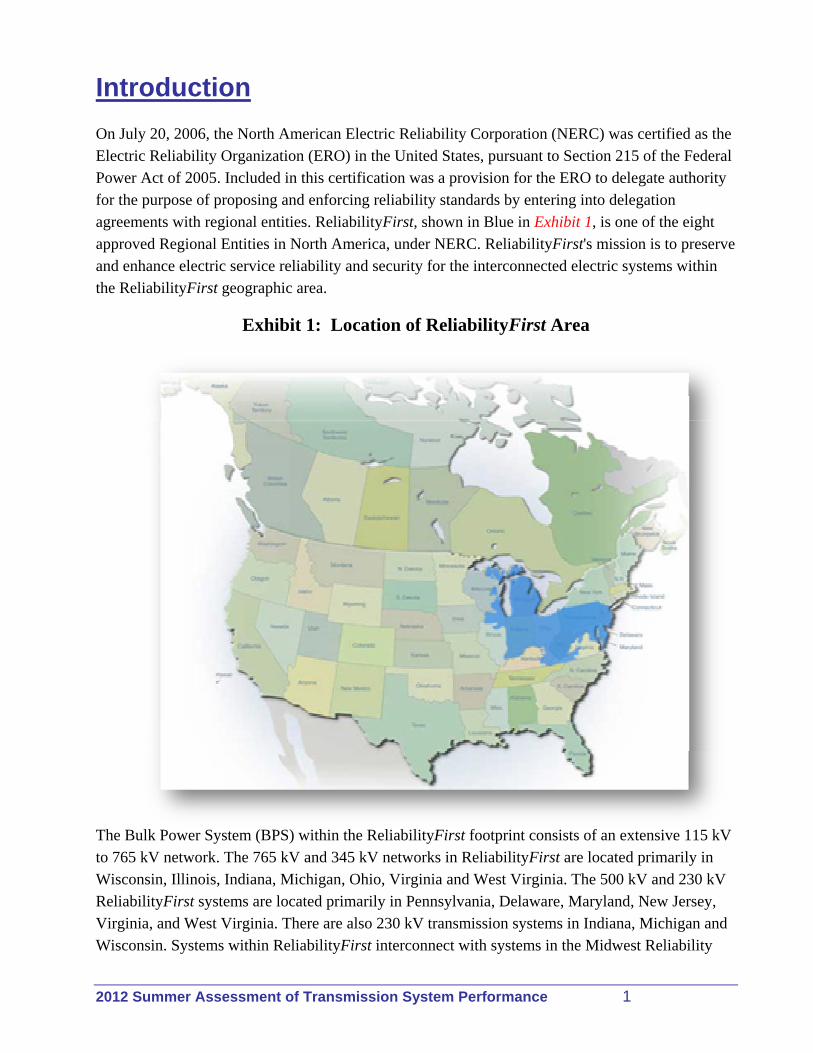
On July 20, 2006, the North American Electric Reliability Corporation (NERC) was certified as the Electric Reliability Organization (ERO) in the United States, pursuant to Section 215 of the Federal Power Act of 2005. Included in this certification was a provision for the ERO to delegate authority for the purpose of proposing and enforcing reliability standards by entering into delegation agreements with regional entities. ReliabilityFirst, shown in Blue in Exhibit 1, is one of the eight approved Regional Entities in North America, under NERC. ReliabilityFirst's mission is to preserve and enhance electric service reliability and security for the interconnected electric systems within the ReliabilityFirst geographic area.
Exhibit 1: Location of ReliabilityFirst Area
The Bulk Power System (BPS) within the ReliabilityFirst footprint consists of an extensive 115 kV to 765 kV network. The 765 kV and 345 kV networks in ReliabilityFirst are located primarily in Wisconsin, Illinois, Indiana, Michigan, Ohio, Virginia and West Virginia. The 500 kV and 230 kV ReliabilityFirst systems are located primarily in Pennsylvania, Delaware, Maryland, New Jersey, Virginia, and West Virginia. There are also 230 kV transmission systems in Indiana, Michigan and Wisconsin. Systems within ReliabilityFirst interconnect with systems in the Midwest Reliability
2012 Summer Assessment of Transmission System Performance 2
Organization (MRO), Northeast Power Coordinating Council (NPCC) and Southeastern Reliability Corporation (SERC) regions.
This assessment fulfills the requirements in NERC Reliability Standard TPL-005 and the Electric Reliability Organization (ERO) Rules of Procedure under Section 800 that ReliabilityFirst conduct a seasonal transmission assessment and provide a wide-area assessment of the projected performance of the system within the ReliabilityFirst footprint.
This ReliabilityFirst transmission assessment is based upon results from studies performed by ReliabilityFirst staff, the Midwest Independent System Operator (MISO), PJM Interconnection LLC (PJM) and the Eastern Interconnection Reliability Assessment Group (ERAG) with Transmission Owner participation. The results of the ReliabilityFirst study and summaries of MISO, PJM and ERAG studies are included in this assessment report. ReliabilityFirst’s use of its own study work along with assessment studies performed by other entities, allows it to consider a wide variety of analysis that encompass different scenarios and methods.
ReliabilityFirst’s approach to transmission studies consists of a series of thermal and voltage analyses, several of which are designed to stress the BPS beyond minimum planning and operating criteria.
The purpose of the PJM Operations Assessment Task Force (OATF) study is to determine the ability of the PJM RTO bulk power transmission system, as it is expected to exist during the 2012 summer peak load period, to be operated reliably according to the principles and guidelines contained within the PJM Manuals. The analysis conducted included steady-state contingency analysis; thermal and reactive, PV analysis on critical interfaces and the ability to support transfers across the PJM network. The postulated thermal, reactive and dynamic performance was conducted over a wide range of conditions. The conditions simulated include higher than anticipated load and lower than anticipated generation availability.
The MISO Coordinated Seasonal Transmission Assessment (CSA) is performed in order to analyze and assess the MISO transmission system under projected peak load conditions for the Summer of 2012. The coordination of this study across MISO’s area provides the benefit of reviewing the network over a much larger area than would normally be assessed by the individual participating transmission owners. This assessment has focused on the performance of large scale steady-state contingency analysis, critical interface analysis (PV) for selected areas where voltage stability margins are known to be small, and a wide area FCITC transfer analyses under category B contingencies.
The ERAG appraisals are done in support of the NERC Reliability Standard TPL-005 - Regional and Interregional Self-Assessment Reliability Reports. In this assessment, inter-regional transfer capability values were determined by the three ERAG working groups. These three groups are NPCC-ReliabilityFirst (N-R), SERC East-ReliabilityFirst (SER), and MRO-ReliabilityFirst-SERC West-SPP (MRSWS).

2012 Summer Assessment of Transmission System Performance 3
This assessment report does not attempt to determine load or generator deliverability, Planning Transfer Capability (PTC), Available Transfer Capability (ATC), Available Flowgate Capacity (AFC), the availability of transmission service, or provide a forecast of anticipated dispatch patterns for the 2012 Summer season. Transmission Reliability Margins (TRMs) are not included in this report. Also, the studies documented in this report are not intended to fulfill all of the study requirements for Transmission Planners listed in NERC Standards.
2012 Summer Assessment of Transmission System Performance 4
Executive Summary This report presents a seasonal assessment of the projected performance of the transmission system within ReliabilityFirst’s footprint for the 2012 Summer peak season. Based on the study work by ReliabilityFirst staff, MISO, PJM and ERAG summarized in this assessment, the transmission system within the ReliabilityFirst footprint is projected to perform well over a wide range of operating conditions, provided that new facilities go into service as scheduled, and that transmission operators take appropriate action to control flows, reactive reserves, and voltages.
Many new facility additions to the bulk-power system since last summer are expected to be placed in-service within the ReliabilityFirst footprint. These include a total of 287 miles of transmission line at 100 kV and above, plus eleven new transformers with a total capacity of 6,950 MVA and two replacement transformers with a total capacity of 1,500 MVA. These system changes are expected to enhance reliability of the bulk-power system within ReliabilityFirst.
The original ITCTransmission (ITCT) Bunce Creek (B3N) Phase Angle Regulating transformer (PAR) that failed in March 2003 has been replaced by two (series) PARs. On this interface, the J5D PAR has been in service for a long time, the L51D and B3N PARs came in service on April 5, and the L4D PAR is expected to come in service on May 17. All four PAR installations on the Michigan – Ontario interface are expected to be in service this summer.
There are no concerns in meeting the target in-service dates of new transmission facilities. PJM and MISO do not anticipate any other significant transmission lines or transformers being out-of-service during the 2012 Summer. No constraints are anticipated that could significantly impact reliability.
This 2012 Summer Seasonal Assessment of Transmission System Performance assesses the transmission system within ReliabilityFirst by gauging its strength through a series of power flow analyses. The analyses performed by ReliabilityFirst staff are:
Thermal Overloads for Base and First Contingency Conditions Sensitivity Analysis of Thermal Overloads for Base and First Contingency Conditions First Contingency Incremental Transfer Capability (FCITC) Analysis Generation Redispatch Analysis Thermal Non-Simultaneous Export and Transfer Crossing Study Area Scenarios Thermal Simultaneous Transfer Capability Voltage Screening Under Base and First Contingency Conditions Voltage Screening at Thermal Non-Simultaneous Transfer Capability Levels Power versus Voltage Curve Scenarios Resulting from Operating or Planning Experience Thermal and Voltage Analysis of Stuck Breaker Contingencies (new)
As shown in Exhibit 2, one transmission constraint within ReliabilityFirst continues to be highlighted in this ReliabilityFirst transmission assessment study. The highlighted transmission constraint, identified in voltage screening and Power versus Voltage (PV) curve analyses, is the import capability into the PJM East and PJM South Study Areas being voltage constrained for some

2012 Summer Assessment of Transmission System Performance 5
operating conditions. This voltage constraint was also highlighted in the 2010 and 2011 Summer assessments.
PJM monitors conditions on several 500 kV interfaces, including the AP South and [AP] Black Oak-[AP] Bedington reactive interfaces and controls west-to-east flows to ensure operating criteria are met. A significant re-enforcement to this area, the 218-mile 500 kV TrAIL power line (which begins in southwestern Pennsylvania, crosses northern West Virginia and terminates in Loudoun County, Virginia) went into service in May 2011. This line boosted west-to-east transfer capability and has also allowed PJM to accelerate the reconstruction of the 100-mile Mt Storm-Doubs 500 kV line, which runs on a roughly parallel path to the TrAIL.
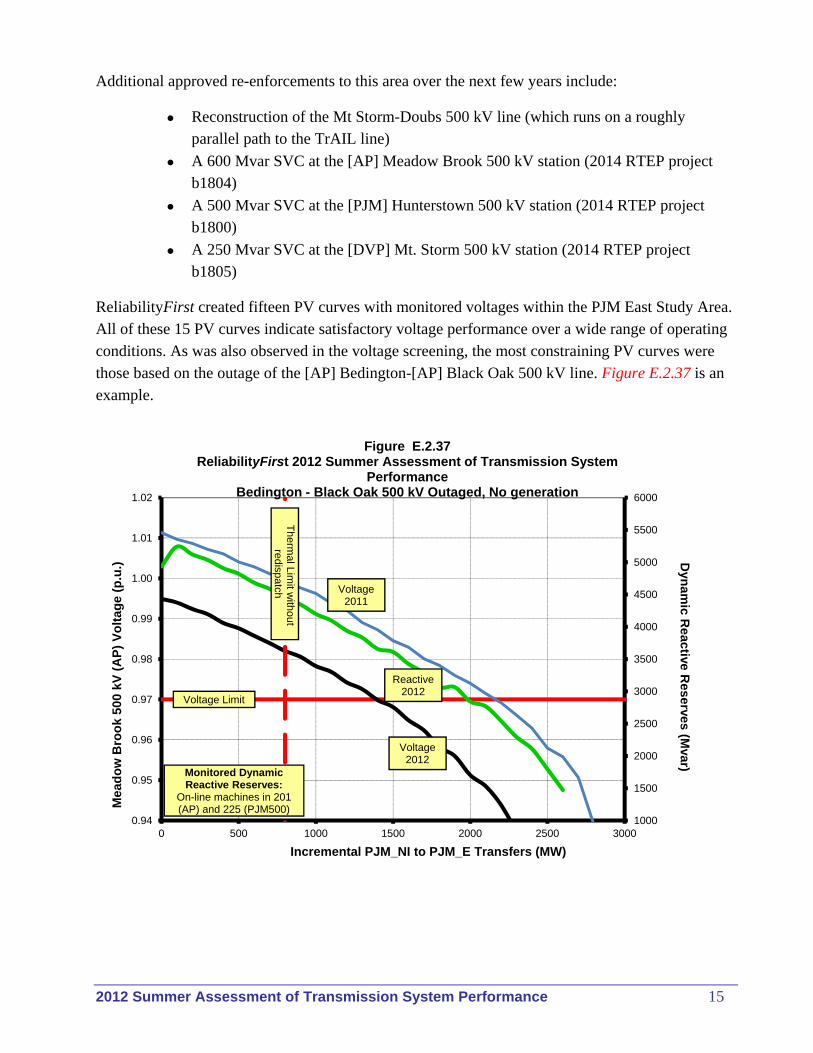
Additional approved re-enforcements to this area over the next few years include:
Reconstruction of the Mt Storm-Doubs 500 kV line (which runs on a roughly parallel path to the TrAIL line)
Install a 600 Mvar SVC at the [AP] Meadow Brook 500 kV station
Install a 500 Mvar SVC at the [PJM] Hunterstown 500 kV station
Install a 250 Mvar SVC at the [DVP] Mt. Storm 500 kV station
Exhibit 2: Highlighted Constraint
2012 Summer Assessment of Transmission System Performance 6
Study Area Assessments
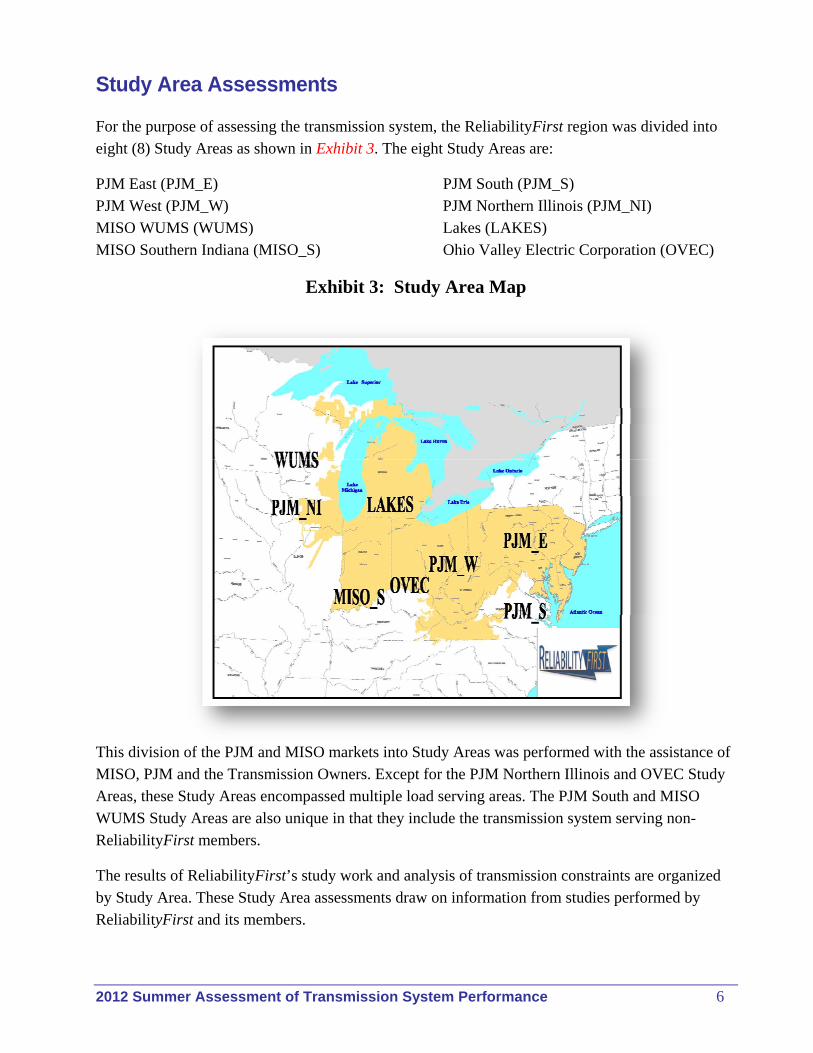
For the purpose of assessing the transmission system, the ReliabilityFirst region was divided into eight (8) Study Areas as shown in Exhibit 3. The eight Study Areas are:
PJM East (PJM_E) PJM South (PJM_S) PJM West (PJM_W) PJM Northern Illinois (PJM_NI) MISO WUMS (WUMS) Lakes (LAKES) MISO Southern Indiana (MISO_S) Ohio Valley Electric Corporation (OVEC)
Exhibit 3: Study Area Map
This division of the PJM and MISO markets into Study Areas was performed with the assistance of MISO, PJM and the Transmission Owners. Except for the PJM Northern Illinois and OVEC Study Areas, these Study Areas encompassed multiple load serving areas. The PJM South and MISO WUMS Study Areas are also unique in that they include the transmission system serving non-ReliabilityFirst members.
The results of ReliabilityFirst’s study work and analysis of transmission constraints are organized by Study Area. These Study Area assessments draw on information from studies performed by ReliabilityFirst and its members.
2012 Summer Assessment of Transmission System Performance 7
The Power Flow Model
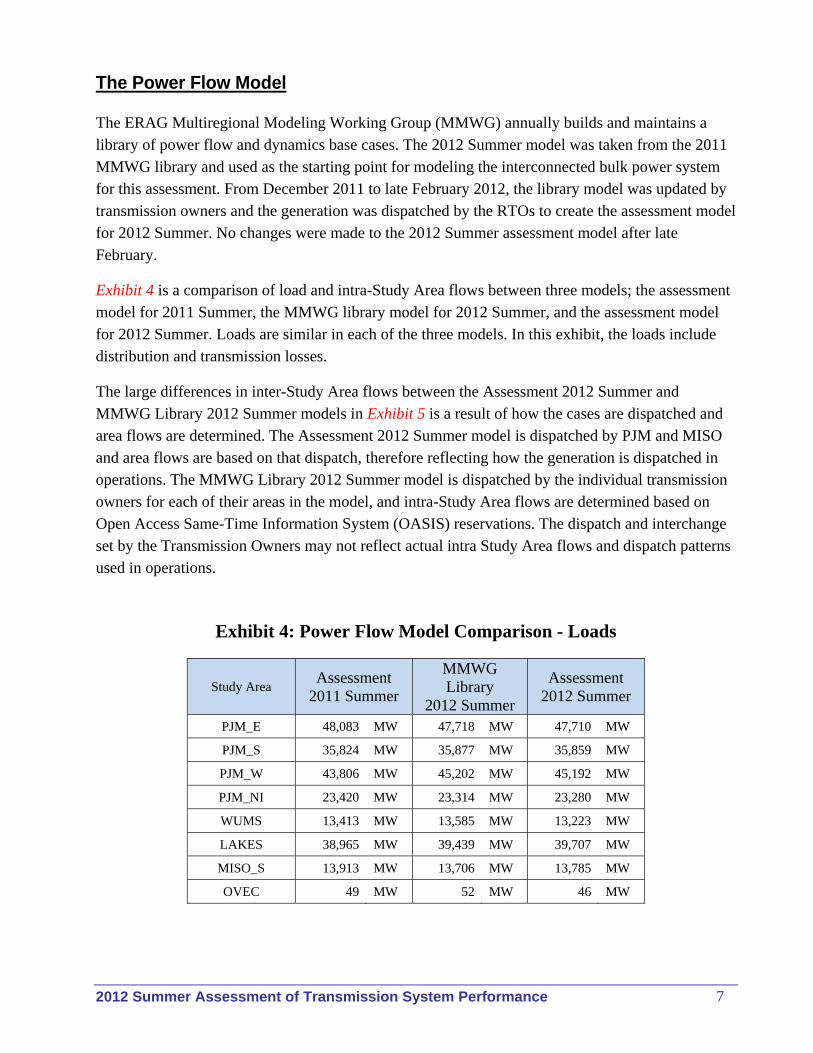
The ERAG Multiregional Modeling Working Group (MMWG) annually builds and maintains a library of power flow and dynamics base cases. The 2012 Summer model was taken from the 2011 MMWG library and used as the starting point for modeling the interconnected bulk power system for this assessment. From December 2011 to late February 2012, the library model was updated by transmission owners and the generation was dispatched by the RTOs to create the assessment model for 2012 Summer. No changes were made to the 2012 Summer assessment model after late February.
Exhibit 4 is a comparison of load and intra-Study Area flows between three models; the assessment model for 2011 Summer, the MMWG library model for 2012 Summer, and the assessment model for 2012 Summer. Loads are similar in each of the three models. In this exhibit, the loads include distribution and transmission losses.
The large differences in inter-Study Area flows between the Assessment 2012 Summer and MMWG Library 2012 Summer models in Exhibit 5 is a result of how the cases are dispatched and area flows are determined. The Assessment 2012 Summer model is dispatched by PJM and MISO and area flows are based on that dispatch, therefore reflecting how the generation is dispatched in operations. The MMWG Library 2012 Summer model is dispatched by the individual transmission owners for each of their areas in the model, and intra-Study Area flows are determined based on Open Access Same-Time Information System (OASIS) reservations. The dispatch and interchange set by the Transmission Owners may not reflect actual intra Study Area flows and dispatch patterns used in operations.
Exhibit 4: Power Flow Model Comparison - Loads
Study Area Assessment
2011 Summer
MMWG Library
2012 Summer
Assessment 2012 Summer
PJM_E 48,083 MW 47,718 MW 47,710 MW
PJM_S 35,824 MW 35,877 MW 35,859 MW
PJM_W 43,806 MW 45,202 MW 45,192 MW
PJM_NI 23,420 MW 23,314 MW 23,280 MW
WUMS 13,413 MW 13,585 MW 13,223 MW
LAKES 38,965 MW 39,439 MW 39,707 MW
MISO_S 13,913 MW 13,706 MW 13,785 MW
OVEC 49 MW 52 MW 46 MW
2012 Summer Assessment of Transmission System Performance 8
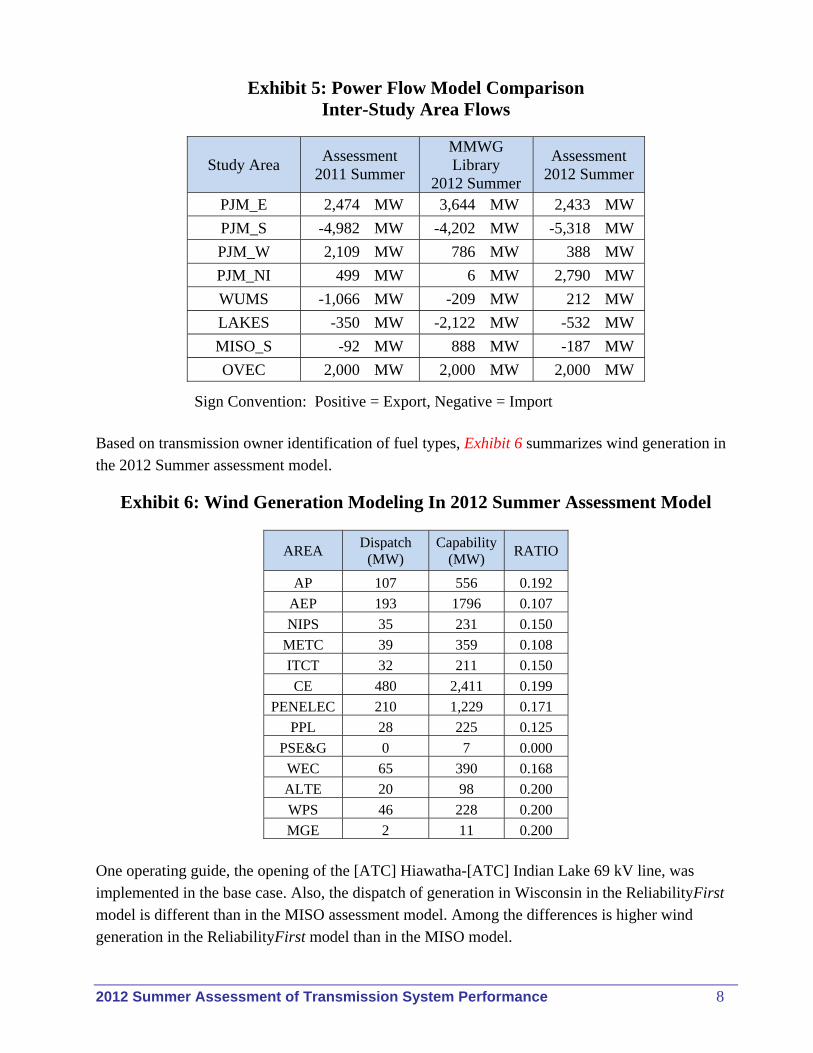
Exhibit 5: Power Flow Model Comparison Inter-Study Area Flows
Study Area Assessment
2011 Summer
MMWG Library
2012 Summer
Assessment 2012 Summer
PJM_E 2,474 MW 3,644 MW 2,433 MW
PJM_S -4,982 MW -4,202 MW -5,318 MW
PJM_W 2,109 MW 786 MW 388 MW
PJM_NI 499 MW 6 MW 2,790 MW
WUMS -1,066 MW -209 MW 212 MW
LAKES -350 MW -2,122 MW -532 MW
MISO_S -92 MW 888 MW -187 MW
OVEC 2,000 MW 2,000 MW 2,000 MW
Sign Convention: Positive = Export, Negative = Import
Based on transmission owner identification of fuel types, Exhibit 6 summarizes wind generation in the 2012 Summer assessment model.
Exhibit 6: Wind Generation Modeling In 2012 Summer Assessment Model
AREA Dispatch
(MW) Capability
(MW) RATIO
AP 107 556 0.192
AEP 193 1796 0.107
NIPS 35 231 0.150
METC 39 359 0.108
ITCT 32 211 0.150
CE 480 2,411 0.199
PENELEC 210 1,229 0.171
PPL 28 225 0.125
PSE&G 0 7 0.000
WEC 65 390 0.168
ALTE 20 98 0.200
WPS 46 228 0.200
MGE 2 11 0.200 One operating guide, the opening of the [ATC] Hiawatha-[ATC] Indian Lake 69 kV line, was implemented in the base case. Also, the dispatch of generation in Wisconsin in the ReliabilityFirst model is different than in the MISO assessment model. Among the differences is higher wind generation in the ReliabilityFirst model than in the MISO model.

2012 Summer Assessment of Transmission System Performance 9
Due to construction schedule changes, the in-service date of the [SIGE] AB Brown-[BREC] Reid 345 kV line has been delayed from 2012 Summer to 2012 Fall. This new line was removed from the 2012 Summer model, however an existing series reactor on the underlying [SIGE] Francisco-[SIGE] Elliott 138 kV line was inadvertently left out of service. This series reactor limits flows on this 138 kV line, which has a high participation factor for transfers without the new 345 kV line in service. Therefore the model no longer exactly represents expected conditions in southern Indiana and northern Kentucky.

2012 Summer Assessment of Transmission System Performance 10
PJM East Study Area Assessment
Assessment Summary
The PJM East Study Area, contains Atlantic City Electric (AE), Delmarva Power (DP&L), Jersey Central Power & Light Company (JCP&L), Metropolitan Edison Company (METED), PECO Energy Company (PECO), Pennsylvania Electric Company (PENELEC), PPL Utilities (PPL), Public Service Electric & Gas (PSE&G), Rockland Electric Company (RECO), and UGI Utilities, Inc. (UGI). The primary load centers in the PJM East Study Area are the cities of Philadelphia, PA; Newark, NJ; Wilmington, DE; and the surrounding metropolitan areas. The footprint of the PJM East Study Area is different from the footprints used by PJM in their transmission analysis process.
The BPS serving the PJM East Study Area is expected to perform well over a wide range of operating conditions, provided that expected new facilities are placed into service as scheduled, and that transmission operators take appropriate action to control flows, reactive reserves and voltages.
Thermal Analysis Results
Constraint: [PENELEC] Bear Rock-[PENELEC] Altoona 230 kV line Contingency: None Loading: 101% of the 488 MVA normal rating
Under base conditions, the [PENELEC] Bear Rock-[PENELEC] Altoona 230 kV line was loaded slightly over 100% of its normal rating. This is a not a reliability limit. It is a function of the energy component of generation in the vicinity. In the real time dispatch, energy only units are not permitted to cause loadings on the system in excess of facility ratings. In this model, this loading can be decreased by decreasing generation at [PENELEC] Allegheny Ridge (wind), [PENELEC] Seward (coal) or [PENELEC] Homer City (coal).
Constraint: One [PENELEC] Shawville 230/115 kV transformer Contingency: Outage of the other [PENELEC] Shawville 230/115 kV transformer Loading: 103% of the 158 MVA transformer 1 and 117% of the 144 MVA transformer 2 emergency rating
There is a pair of 2014 RTEP projects (b1169 and 1170) to replace breakers at Shawville. In this model, this loading can be mitigated by decreasing generation at [PENELEC] Shawville units 1 or 2 (coal) among others.

2012 Summer Assessment of Transmission System Performance 11
Constraint: [PECO] Eddystone 230/138 kV transformer 8 Contingency: [PECO] Chichester 230/138 kV transformer 9 and 2 Loading: 106% of the 461 MVA emergency rating
There is a 2016 RTEP project (b1720) to increase the effective rating of the Eddystone transformer. In this model, this loading can be mitigated by decreasing generation at [PECO] Eddystone 3 or 4 (oil/natural gas), among others.
Constraint: [PECO] Emilie 230/138 kV transformer 8 Contingency: [PECO] Emilie 230/138 kV transformer 7 Loading: 112% of the 458 MVA emergency rating
Loading of this transformer is not mentioned in the 2011 PJM RTEP. In this model, this loading can be mitigated by decreasing [PECO] Ford Mill generation (natural gas).
Constraint: [METED] Glendon-[JCP&L] Gilbert 115 kV Ckt 1 Contingency: [JCP&L] Gilbert-[JCP&L] Morris Park-[PPL] Martins Creek 115 kV Ckt 1 Loading: 101% of the 128 MVA emergency rating
ReliabilityFirst identified two small generators, totaling 19 MW, that when increased to 100% of modeled capability would decrease the post contingency flow to less than 100% of its emergency rating.
No additional overloads in the PJM East Study Area were observed for first contingency conditions.
The transfers reported in this Study Area assessment are shown in Exhibit 7. Imports into the PJM East Study Area (sink directions) are indicated by red lines. The transfer crossing the PJM East Study Area and the source transfer for the PJM East Study Area are shown in green. For transfers crossing the PJM East Study Area and the source transfer only BPS facilities within the PJM East Study Area were monitored.
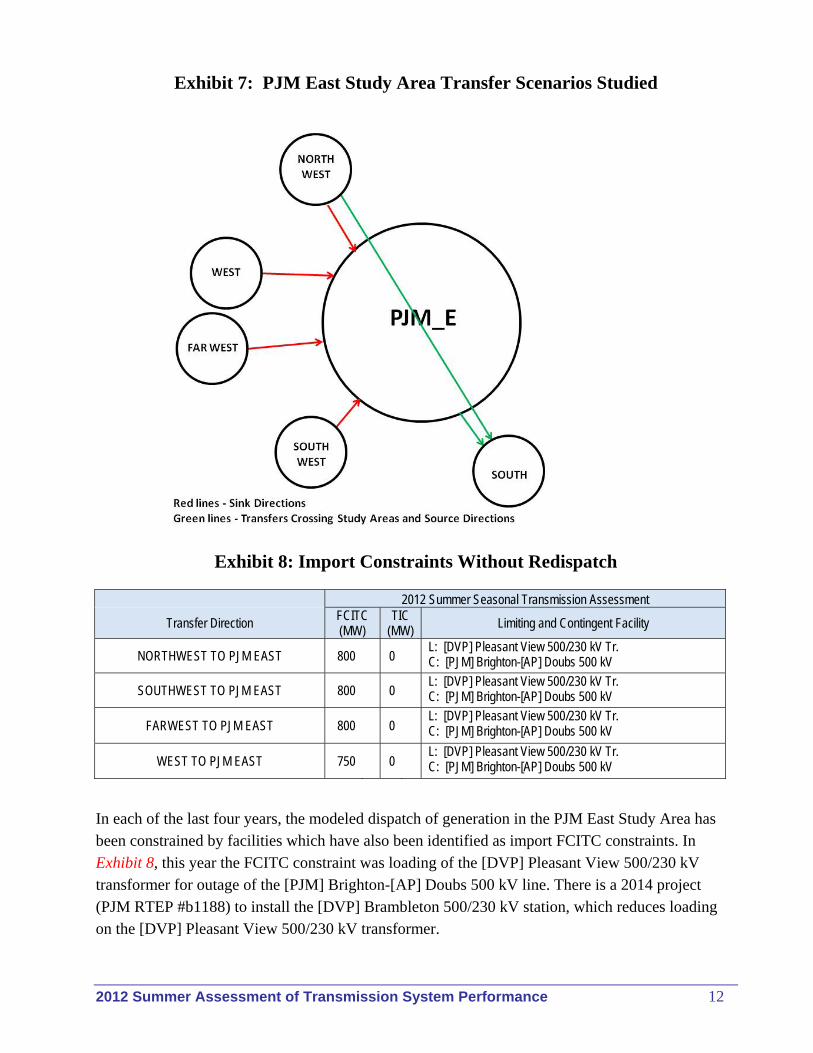
2012 Summer Assessment of Transmission System Performance 12
Exhibit 7: PJM East Study Area Transfer Scenarios Studied
Exhibit 8: Import Constraints Without Redispatch
2012 Summer Seasonal Transmission Assessment
Transfer Direction FCITC (MW)
TIC (MW) Limiting and Contingent Facility
NORTHWEST TO PJM EAST 800 0 L: [DVP] Pleasant View 500/230 kV Tr. C: [PJM] Brighton-[AP] Doubs 500 kV
SOUTHWEST TO PJM EAST 800 0 L: [DVP] Pleasant View 500/230 kV Tr. C: [PJM] Brighton-[AP] Doubs 500 kV
FARWEST TO PJM EAST 800 0 L: [DVP] Pleasant View 500/230 kV Tr. C: [PJM] Brighton-[AP] Doubs 500 kV
WEST TO PJM EAST 750 0 L: [DVP] Pleasant View 500/230 kV Tr. C: [PJM] Brighton-[AP] Doubs 500 kV
In each of the last four years, the modeled dispatch of generation in the PJM East Study Area has been constrained by facilities which have also been identified as import FCITC constraints. In Exhibit 8, this year the FCITC constraint was loading of the [DVP] Pleasant View 500/230 kV transformer for outage of the [PJM] Brighton-[AP] Doubs 500 kV line. There is a 2014 project (PJM RTEP #b1188) to install the [DVP] Brambleton 500/230 kV station, which reduces loading on the [DVP] Pleasant View 500/230 kV transformer.
2012 Summer Assessment of Transmission System Performance 13
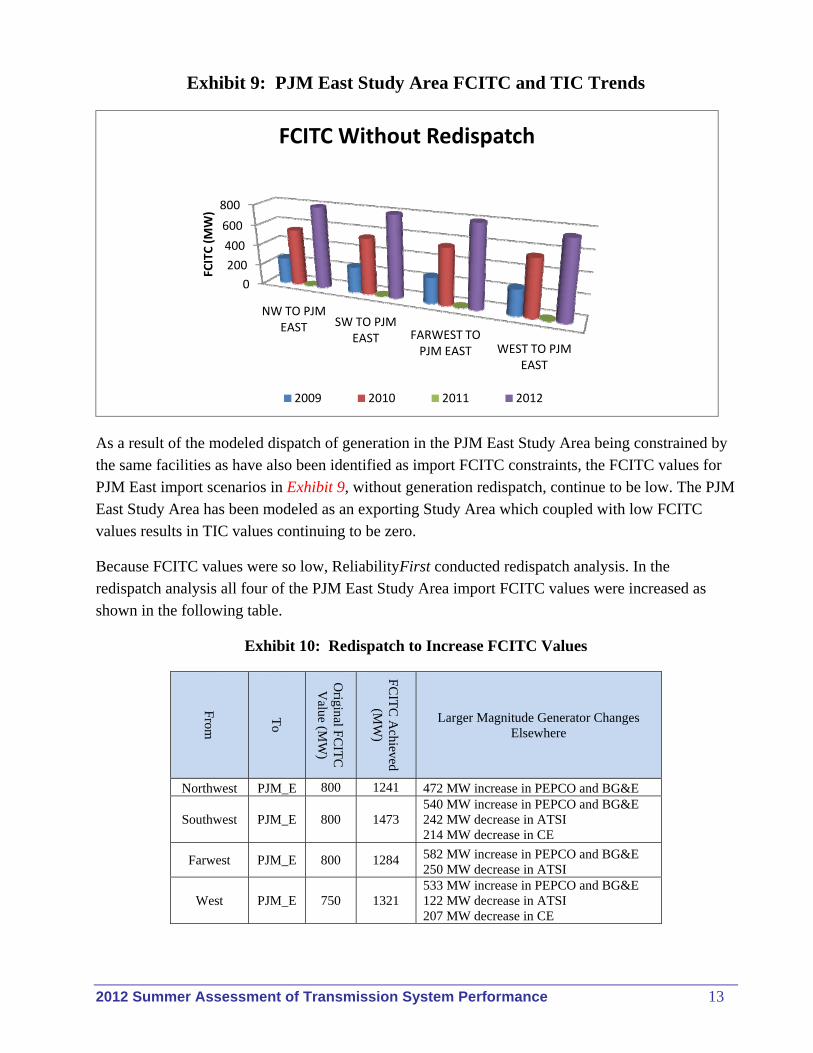
Exhibit 9: PJM East Study Area FCITC and TIC Trends
As a result of the modeled dispatch of generation in the PJM East Study Area being constrained by the same facilities as have also been identified as import FCITC constraints, the FCITC values for PJM East import scenarios in Exhibit 9, without generation redispatch, continue to be low. The PJM East Study Area has been modeled as an exporting Study Area which coupled with low FCITC values results in TIC values continuing to be zero.
Because FCITC values were so low, ReliabilityFirst conducted redispatch analysis. In the redispatch analysis all four of the PJM East Study Area import FCITC values were increased as shown in the following table.
Exhibit 10: Redispatch to Increase FCITC Values
From
To
Original F
CIT
C
Value (M
W)
FC
ITC
Achieved
(MW
)
Larger Magnitude Generator Changes Elsewhere
Northwest PJM_E 800 1241 472 MW increase in PEPCO and BG&E
Southwest PJM_E 800 1473 540 MW increase in PEPCO and BG&E 242 MW decrease in ATSI 214 MW decrease in CE
Farwest PJM_E 800 1284 582 MW increase in PEPCO and BG&E 250 MW decrease in ATSI
West PJM_E 750 1321 533 MW increase in PEPCO and BG&E 122 MW decrease in ATSI 207 MW decrease in CE
0
200
400
600
800
NW TO PJM EAST SW TO PJM
EAST FARWEST TO PJM EAST WEST TO PJM
EAST
FCITC (MW)
FCITC Without Redispatch
2009 2010 2011 2012
2012 Summer Assessment of Transmission System Performance 14
The dispatches summarized in Exhibit 10 may be different than those that would be determined by MISO or PJM using Security Constrained Economic Dispatch (SCED) methods.
ReliabilityFirst conducted FCITC analyses of one transfer crossing the PJM East Study Area, Northwest to South. In this scenario, the PJM Bedington – Black Oak reactive interface becomes constrained at a transfer level of approximately 1,600 MW. This is consistent with voltage analysis results.
One PJM East export scenario was analyzed, exports to the south. In this scenario, loading of the [METED] Yorkana-[PPL] Brunner Island 230 kV line was observed to be a constraint at a transfer level of 2,200 MW. For transfers above 2,500 MW, it was observed that the Roxbury tie between AP and FE would need to be opened on a post contingency basis.
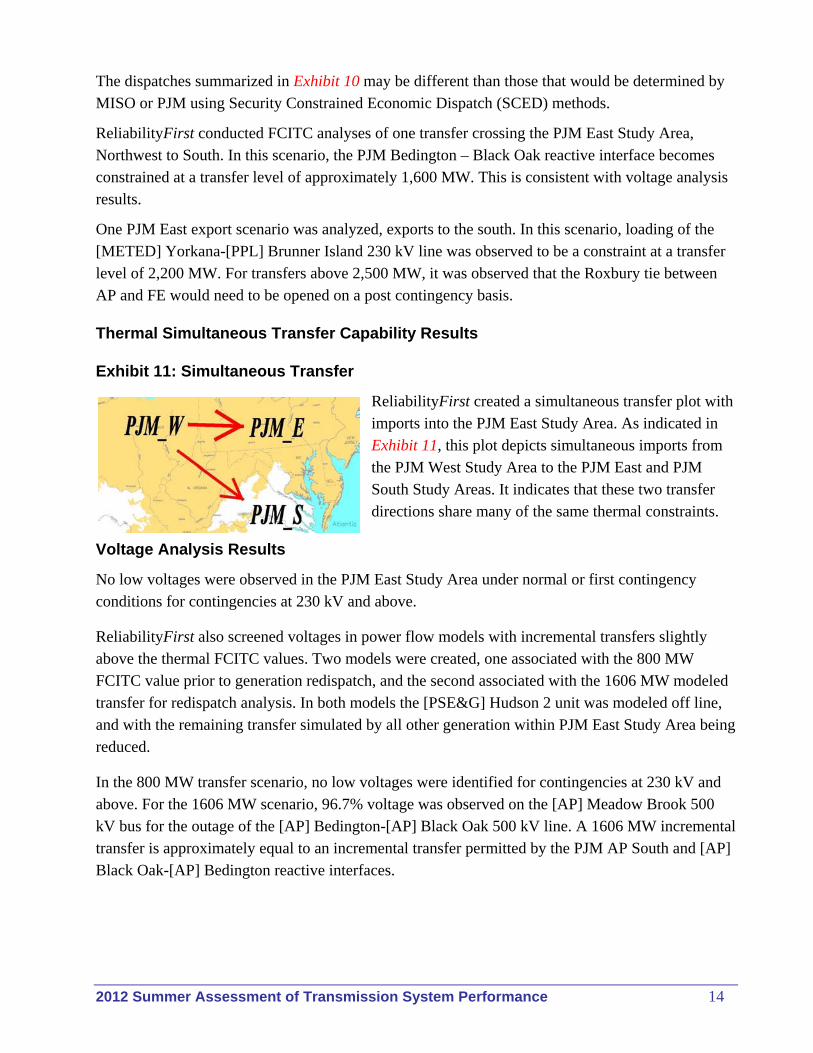
Thermal Simultaneous Transfer Capability Results
Exhibit 11: Simultaneous Transfer
ReliabilityFirst created a simultaneous transfer plot with imports into the PJM East Study Area. As indicated in Exhibit 11, this plot depicts simultaneous imports from the PJM West Study Area to the PJM East and PJM South Study Areas. It indicates that these two transfer directions share many of the same thermal constraints.
Voltage Analysis Results
No low voltages were observed in the PJM East Study Area under normal or first contingency conditions for contingencies at 230 kV and above.
ReliabilityFirst also screened voltages in power flow models with incremental transfers slightly above the thermal FCITC values. Two models were created, one associated with the 800 MW FCITC value prior to generation redispatch, and the second associated with the 1606 MW modeled transfer for redispatch analysis. In both models the [PSE&G] Hudson 2 unit was modeled off line, and with the remaining transfer simulated by all other generation within PJM East Study Area being reduced.
In the 800 MW transfer scenario, no low voltages were identified for contingencies at 230 kV and above. For the 1606 MW scenario, 96.7% voltage was observed on the [AP] Meadow Brook 500 kV bus for the outage of the [AP] Bedington-[AP] Black Oak 500 kV line. A 1606 MW incremental transfer is approximately equal to an incremental transfer permitted by the PJM AP South and [AP] Black Oak-[AP] Bedington reactive interfaces.
2012 Summer Assessment of Transmission System Performance 15
Additional approved re-enforcements to this area over the next few years include:
Reconstruction of the Mt Storm-Doubs 500 kV line (which runs on a roughly parallel path to the TrAIL line)
A 600 Mvar SVC at the [AP] Meadow Brook 500 kV station (2014 RTEP project b1804)
A 500 Mvar SVC at the [PJM] Hunterstown 500 kV station (2014 RTEP project b1800)
A 250 Mvar SVC at the [DVP] Mt. Storm 500 kV station (2014 RTEP project b1805)
ReliabilityFirst created fifteen PV curves with monitored voltages within the PJM East Study Area. All of these 15 PV curves indicate satisfactory voltage performance over a wide range of operating conditions. As was also observed in the voltage screening, the most constraining PV curves were those based on the outage of the [AP] Bedington-[AP] Black Oak 500 kV line. Figure E.2.37 is an example.
1000
1500
2000
2500
3000
3500
4000
4500
5000
5500
6000
0.94
0.95
0.96
0.97
0.98
0.99
1.00
1.01
1.02
0 500 1000 1500 2000 2500 3000
Dyn
amic R
eactive Reserves (M
var)M
ead
ow
Bro
ok
500
kV (
AP
) V
olt
age
(p.u
.)
Incremental PJM_NI to PJM_E Transfers (MW)
Figure E.2.37ReliabilityFirst 2012 Summer Assessment of Transmission System
PerformanceBedington - Black Oak 500 kV Outaged, No generation
Voltage 2011
Monitored DynamicReactive Reserves:
On-line machines in 201(AP) and 225 (PJM500)
Voltage Limit
Reactive 2012
Therm
al Limit w
ithout redispatch
Voltage 2012
2012 Summer Assessment of Transmission System Performance 16
Thermal and Voltage Analysis of Stuck Breaker Contingencies (new)
No thermal loadings above emergency ratings were observed in the PJM East Study Area for contingencies involving stuck 345 kV and above (EHV) breakers.
No low voltages were observed in the PJM East Study area for contingencies involving stuck EHV breakers.
2012 Summer Assessment of Transmission System Performance 17
PJM South Study Area Assessment
Assessment Summary
The PJM South Study Area is comprised of Baltimore Gas & Electric Company (BG&E), Potomac Electric Power Company (PEPCO) and Dominion Virginia Power (DVP). BG&E and PEPCO are members of ReliabilityFirst and DVP is a member of SERC Corporation (SERC). The primary load centers in the PJM South Study Area include the cities of Baltimore, MD; Washington, DC; Richmond, VA; and Norfolk, VA.
The BPS serving the PJM South Study Area is expected to perform well over a wide range of operating conditions, provided that new facilities go into service as scheduled, and that transmission operators take appropriate action to control flows, reactive reserves and voltages.
Thermal Analysis Results
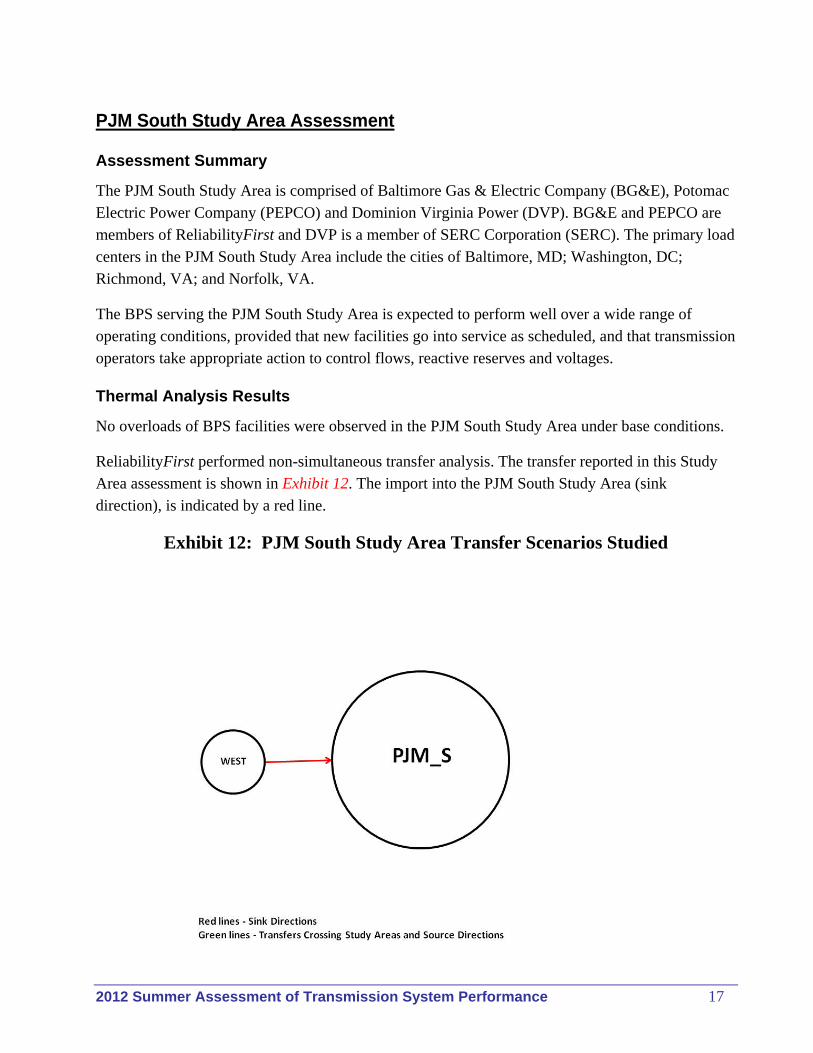
No overloads of BPS facilities were observed in the PJM South Study Area under base conditions.
ReliabilityFirst performed non-simultaneous transfer analysis. The transfer reported in this Study Area assessment is shown in Exhibit 12. The import into the PJM South Study Area (sink direction), is indicated by a red line.
Exhibit 12: PJM South Study Area Transfer Scenarios Studied
2012 Summer Assessment of Transmission System Performance 18
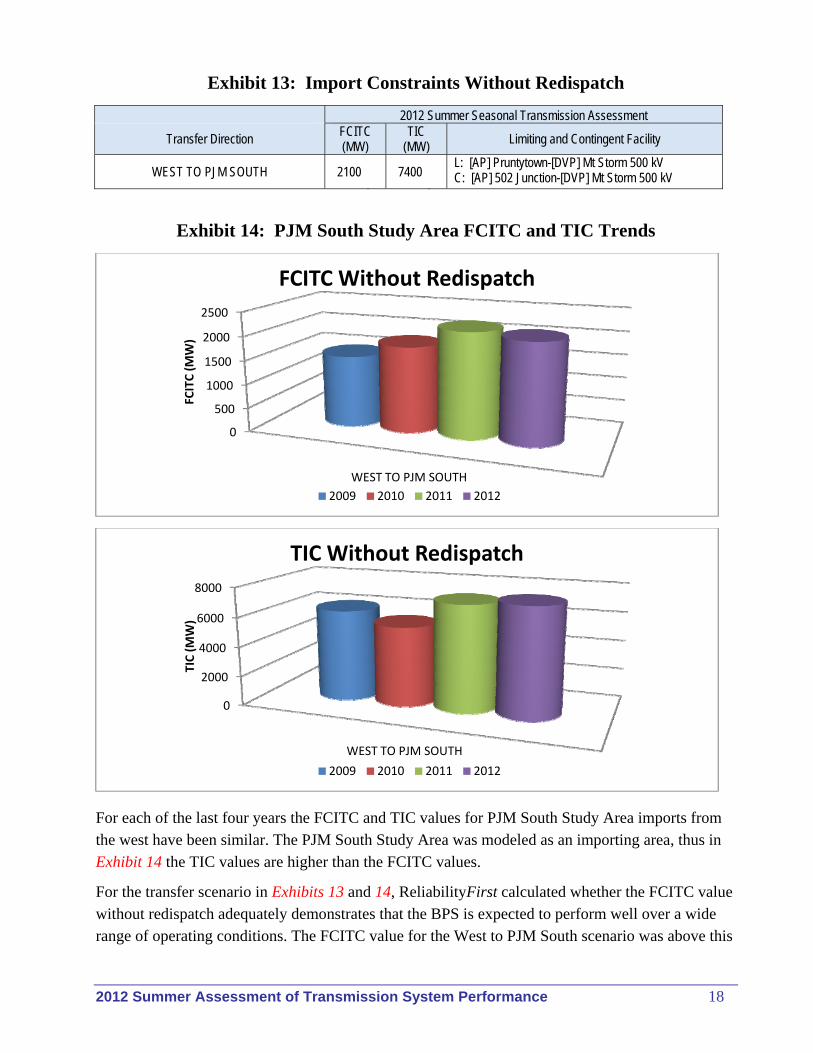
Exhibit 13: Import Constraints Without Redispatch
2012 Summer Seasonal Transmission Assessment
Transfer Direction FCITC (MW)
TIC (MW) Limiting and Contingent Facility
WEST TO PJM SOUTH 2100 7400 L: [AP] Pruntytown-[DVP] Mt Storm 500 kV C: [AP] 502 Junction-[DVP] Mt Storm 500 kV
Exhibit 14: PJM South Study Area FCITC and TIC Trends
For each of the last four years the FCITC and TIC values for PJM South Study Area imports from the west have been similar. The PJM South Study Area was modeled as an importing area, thus in Exhibit 14 the TIC values are higher than the FCITC values.
For the transfer scenario in Exhibits 13 and 14, ReliabilityFirst calculated whether the FCITC value without redispatch adequately demonstrates that the BPS is expected to perform well over a wide range of operating conditions. The FCITC value for the West to PJM South scenario was above this
0
500
1000
1500
2000
2500
WEST TO PJM SOUTH
FCITC (MW)
FCITC Without Redispatch
2009 2010 2011 2012
0
2000
4000
6000
8000
WEST TO PJM SOUTH
TIC (MW)
TIC Without Redispatch
2009 2010 2011 2012
2012 Summer Assessment of Transmission System Performance 19
criterion, thus redispatch analysis was not performed.
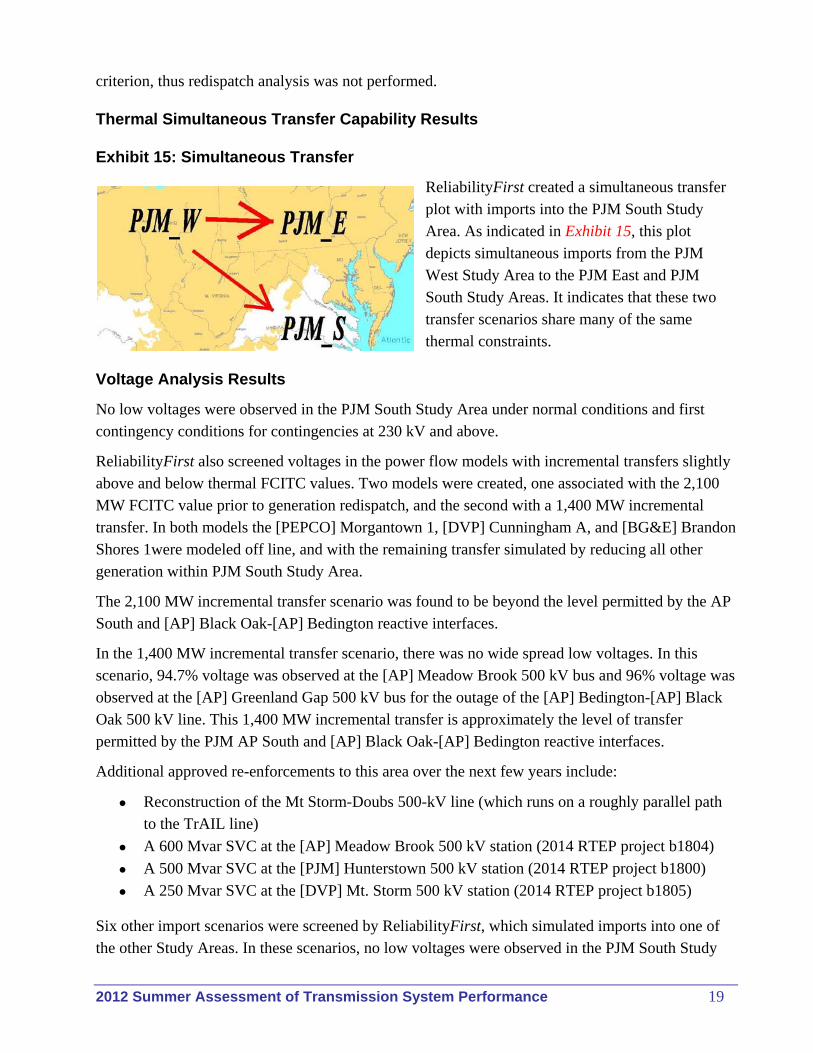
Thermal Simultaneous Transfer Capability Results
Exhibit 15: Simultaneous Transfer
ReliabilityFirst created a simultaneous transfer plot with imports into the PJM South Study Area. As indicated in Exhibit 15, this plot depicts simultaneous imports from the PJM West Study Area to the PJM East and PJM South Study Areas. It indicates that these two transfer scenarios share many of the same thermal constraints.
Voltage Analysis Results
No low voltages were observed in the PJM South Study Area under normal conditions and first contingency conditions for contingencies at 230 kV and above.
ReliabilityFirst also screened voltages in the power flow models with incremental transfers slightly above and below thermal FCITC values. Two models were created, one associated with the 2,100 MW FCITC value prior to generation redispatch, and the second with a 1,400 MW incremental transfer. In both models the [PEPCO] Morgantown 1, [DVP] Cunningham A, and [BG&E] Brandon Shores 1were modeled off line, and with the remaining transfer simulated by reducing all other generation within PJM South Study Area.
The 2,100 MW incremental transfer scenario was found to be beyond the level permitted by the AP South and [AP] Black Oak-[AP] Bedington reactive interfaces.
In the 1,400 MW incremental transfer scenario, there was no wide spread low voltages. In this scenario, 94.7% voltage was observed at the [AP] Meadow Brook 500 kV bus and 96% voltage was observed at the [AP] Greenland Gap 500 kV bus for the outage of the [AP] Bedington-[AP] Black Oak 500 kV line. This 1,400 MW incremental transfer is approximately the level of transfer permitted by the PJM AP South and [AP] Black Oak-[AP] Bedington reactive interfaces.
Additional approved re-enforcements to this area over the next few years include:
Reconstruction of the Mt Storm-Doubs 500-kV line (which runs on a roughly parallel path to the TrAIL line)
A 600 Mvar SVC at the [AP] Meadow Brook 500 kV station (2014 RTEP project b1804)
A 500 Mvar SVC at the [PJM] Hunterstown 500 kV station (2014 RTEP project b1800)
A 250 Mvar SVC at the [DVP] Mt. Storm 500 kV station (2014 RTEP project b1805)
Six other import scenarios were screened by ReliabilityFirst, which simulated imports into one of the other Study Areas. In these scenarios, no low voltages were observed in the PJM South Study
2012 Summer Assessment of Transmission System Performance 20
Area for contingencies at 230 kV and above.
One PV curve was created depicting voltage at [PJM] Waugh Chapel, with the [AP] Bedington-[AP] Black Oak 500 kV line out of service, and increasing incremental transfers from the PJM West Study Area to the PJM South Study Area. This curve depicts satisfactory voltage performance over a wide range of operating conditions. At the same time, it indicates the continuing need for PJM to monitor conditions on several 500 kV interfaces including the AP South and [AP] Black Oak-[AP] Bedington reactive interfaces and control those west-to-east flows to ensure operating criteria are met.
Thermal and Voltage Analysis of Stuck Breaker Contingencies (new)
No thermal loadings above emergency ratings were observed in the PJM South Study Area for contingencies involving stuck EHV breakers.
No low voltages were observed in the PJM South Study Area for contingencies involving stuck EHV breakers.
2012 Summer Assessment of Transmission System Performance 21
PJM West Study Area Assessment
Assessment Summary
The PJM West Study Area consists of American Electric Power (AEP), Allegheny Power (AP), Dayton Power and Light (DAY), Duquesne Light Company (DLCO), Duke Energy Kentucky (DEK), Duke Energy Ohio (DEO), and L S Power’s Riverside generating plant (IPRV). The large population centers in the PJM West Study Area are Pittsburgh, PA; Cincinnati, Columbus, and Dayton, OH; Roanoke, VA; and Charleston, WV. It should be noted that the footprint of the PJM West Study Area is different from the footprints of various subregions used by PJM in their transmission analysis process.
The BPS serving the PJM West Study Area is expected to perform well over a wide range of operating conditions, provided that new facilities go into service as scheduled, and that transmission operators take appropriate action to control flows, reactive reserves and voltages.
Thermal Analysis Results
Constraint: [AEP] Amos-[AEP] Poca section of [AEP] Amos-[AEP] Chemical No. 1 138 kV line Contingency: [AEP] Amos-[AEP] Chemical No. 2 138 kV line Loading: 105% of the 296 MVA emergency rating
There is a 2014 RTEP project (b1042) to perform a sag study and complete necessary remediation to raise the emergency rating of this line. In sensitivity analysis additional contingencies involving facilities at [AEP] Amos or [AEP] Kanawha River that potentially result in overload of this line section were identified.. An operating procedure, opening a bus tie at Chemical, has been developed to address this constraint.
Constraint: [AEP] Kammer-[AEP] Ormet138 kV No.1 line Contingency: [AEP] Kammer #3 Loading: 103% of the 296 MVA emergency rating
To serve the Ormet aluminum reduction plant load, there is currently a requirement that two of the three generators at the [AEP] Kammer 138 kV station be dispatched. In this model, all three Kammer generators are dispatched, but at levels less than modeled capability. Post contingency loading of this line can be mitigated by increasing generation at [AEP] Kammer 1 and 2 (coal).
AEP has notified PJM Interconnection of its intent to retire Kammer 1, 2 and 3 as part of its plan to meet EPA regulations. In preparation for this retirement, a Kammer station improvement plan is under development that will mitigate the [AEP] Kammer-[AEP] Ormet No. 1 138 kV constraint.
2012 Summer Assessment of Transmission System Performance 22
Constraint: [AEP] Roanoke-[AEP] Moseley 138 kV line Contingency: [AEP] Cloverdale- [AEP] Joshua Falls 765 kV line Loading: 110% of the 151 MVA emergency rating
There is a 2014 RTEP project (b1041) to perform a sag study and complete necessary remediation to raise the emergency rating of this line. In this model, post contingency loading of this line could be mitigated by increasing generation at [AEP] Smith Mountain (pumped storage).
Constraint: [AP] Allegheny Ludlum 4 Jct-[AP] Springdale 138 kV Contingency: [AP] Shaffers Corner-[AP] Springdale 138 kV Ckt 1 Loading: 105% of the 240 MVA emergency rating
There is a 2014 RTEP project (b1133) to upgrade terminal equipment at Springdale. In this model, post contingency loading of this line could be mitigated by increasing generation at [AP] Armstrong (coal), or decreasing generation at [AP] Springdale 3,4,5 (natural gas).
Constraint: [AP] Black Oak-[AP] Cross School 138 kV Contingency: [AP] Black Oak-[AP] Hatfield 500 kV Ckt 1 Loading: 102% of the 201 MVA emergency rating
There is a Special Protection Scheme at Black Oak that opens the #3 500/138 kV transformer at Black Oak for loss of the Hatfield-Black Oak 500 kV line. This will mitigate the identified overload. There is a 2013 RTEP project (b1171.1) to install a second 500/138 kV transformer at Black Oak, and a 2013 RTEP project (b1235) to reconductor the [AP]Black Oak-[AP]Albright 138 kV line.
Constraint: [AP] Black Oak 138/500 kV transformer Contingency: [AP] Black Oak-[AP] Hatfield 500 kV Ckt 1 Loading: 101% of the 437 MVA emergency rating
There is a 2013 RTEP project (b1171.1) to install a second 500/138 kV transformer at Black Oak. There is a Special Protection Scheme at Black Oak that opens the #3 500/138 kV transformer at Black Oak for loss of the Hatfield-Black Oak 500 kV line. This will mitigate the identified overload. Also in this model, this constraint can be mitigated by decreasing generation at [AP] Warrior Run (cogeneration), or [AP] Albright (coal and sawdust) among other generators.
Constraint: [AP] Marlowe-[AP] Halfway 138 kV Contingency: [AP] Bedington-[AP] Doubs 500 kV Ckt 1 Loading: Slightly over 100% of the 309 MVA emergency rating
The 2011 PJM RTEP mentions the installation of a 2 MW generator (methane) at Halfway in 2013. In the sensitivity analysis, this line was also observed to be heavily loaded (99%) for the outage of the [AP] Bedington-[AP] Nipetown 138 kV line. There is a 2013 RTEP
2012 Summer Assessment of Transmission System Performance 23
project (b1385) to reconductor the [AP] Marlowe-[AP] Paramount 138 kV line. In this model, post contingency loading of this line could be mitigated by decreasing generation at [AP] R. Paul Smith (coal).
Constraint: [DEO&K] Todhunter-[DEO&K] Trenton 138 kV Contingency: [AEP] Tanners Creek 345/138 kV Tr. Loading: 116% of the 201 MVA emergency rating
There is a 2013 PJM RTEP project (b1576) to reconductor this line. This line was also observed to be overloaded for several additional contingencies involving DEM or AEP transmission facilities. In this model, this constraint can be mitigated by increasing generation at [AEP] Tanners Creek (138 kV coal). This constraint can also be mitigated by opening 138 kV breaker 806 at [DEO&K] Trenton Station.
No additional overloads without operating guides were observed for base or first contingency conditions.
In sensitivity analysis, a few additional facilities were identified by ReliabilityFirst for review.
Constraint: [AEP] Chemical-[AEP] Capital Hill 138 kV line Contingency: [AEP] Kanawha River 345/138 kV transformer B Loading: 94% of the 205 MVA emergency rating
There is a 2016 AEP supplemental project (s0358) to install a second 345/138 kV transformer at [AEP] Kanawha River. This will mitigate this potential constraint.
Constraint: [AEP] Tristate-[AEP] Darrah 138 kV line Contingency: [AEP] Baker 765/345 kV transformer No. 100 Loading: 94% of the 151 MVA emergency rating
There is a 2014 RTEP project (b1045) to perform a sag study and complete necessary remediation to raise the emergency rating of this line. In this model, post contingency loading of this line can be mitigated by decreasing generation at [AEP] Twelve Pole Creek (natural gas), or [IPRV] Zelda (natural gas), among others.
Constraint: [AEP] Tristate-[AEP] Kenova 138 kV line Contingency: [AEP] Baker 765/345 kV transformer. No. 100 Loading: 99% of the 334 MVA emergency rating
There is a 2015 RTEP project (b1432) to perform a sag study and complete necessary remediation to raise the emergency rating of this line. In this model, post contingency loading of this line can be mitigated by decreasing generation at [AEP] Twelve Pole Creek (natural gas), or [IPRV] Zelda (natural gas), among others.
2012 Summer Assessment of Transmission System Performance 24
Constraint: [AEP] Turner-[AEP] Ruth 138 kV line Contingency: [AEP] Kanawha River 345/138 kV transformer B Loading: 94% of the 201 MVA emergency rating
There is an AEP 2016 supplemental project (s0358) to install a second 345/138 kV transformer at [AEP] Kanawha River, which will mitigate this potential constraint. If in addition to the transmission contingency either Kanawha River 1 or 2 are off line (an N-1-1 or N-2 event), ReliabilityFirst did not identify a change in generation dispatch that could mitigate the resulting overload. PJM has identified four “switching helps” for this constraint, which are opening 138 kV breakers at Wyoming, Bradley, Turner, or Cabin Creek.
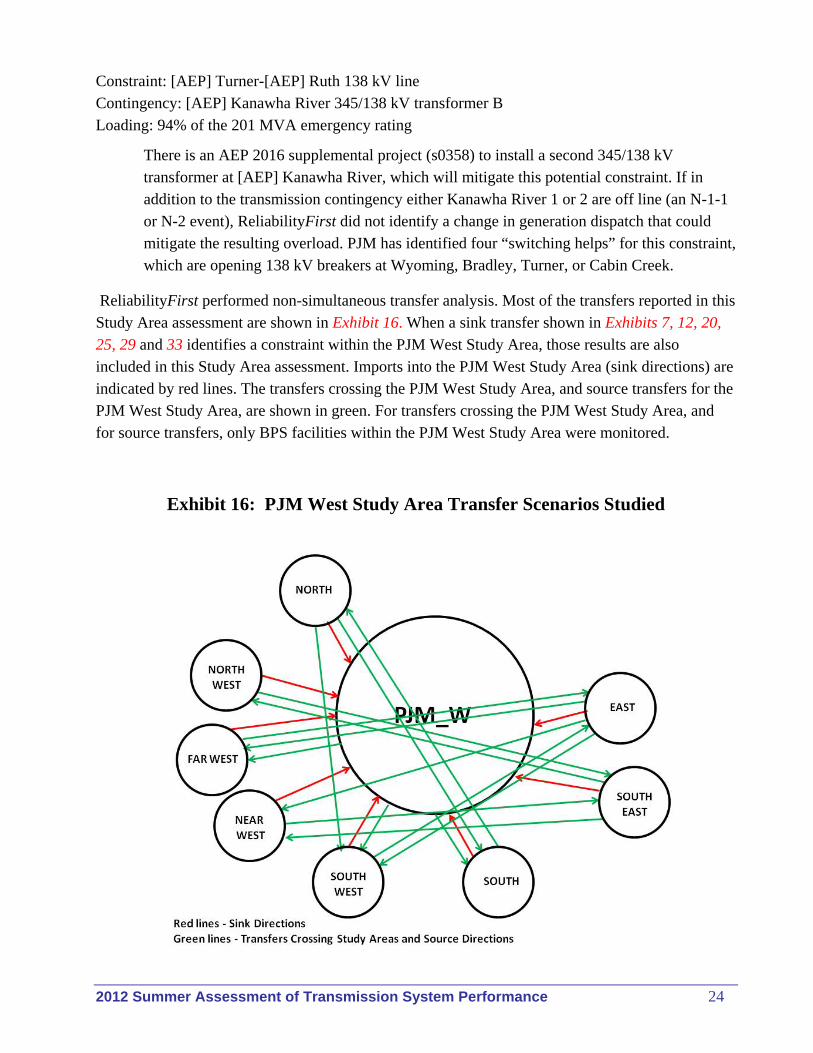
ReliabilityFirst performed non-simultaneous transfer analysis. Most of the transfers reported in this Study Area assessment are shown in Exhibit 16. When a sink transfer shown in Exhibits 7, 12, 20, 25, 29 and 33 identifies a constraint within the PJM West Study Area, those results are also included in this Study Area assessment. Imports into the PJM West Study Area (sink directions) are indicated by red lines. The transfers crossing the PJM West Study Area, and source transfers for the PJM West Study Area, are shown in green. For transfers crossing the PJM West Study Area, and for source transfers, only BPS facilities within the PJM West Study Area were monitored.
Exhibit 16: PJM West Study Area Transfer Scenarios Studied
2012 Summer Assessment of Transmission System Performance 25
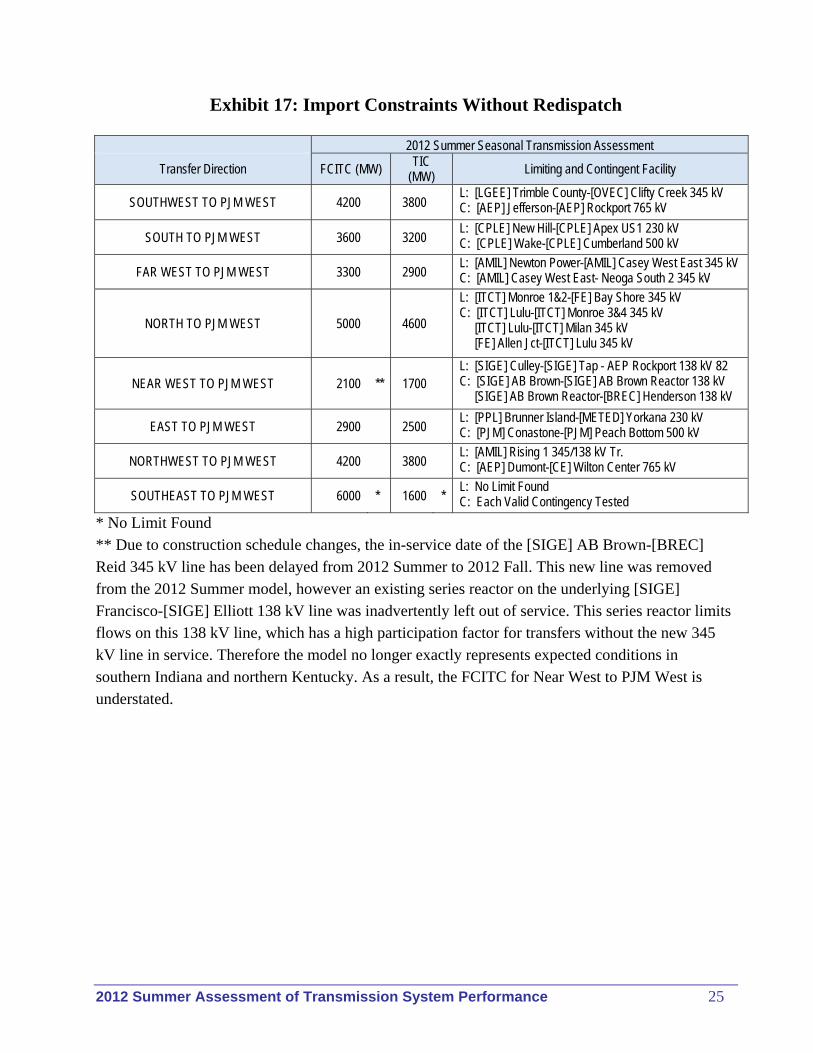
Exhibit 17: Import Constraints Without Redispatch
2012 Summer Seasonal Transmission Assessment
Transfer Direction FCITC (MW) TIC
(MW) Limiting and Contingent Facility
SOUTHWEST TO PJM WEST 4200 3800 L: [LGEE] Trimble County-[OVEC] Clifty Creek 345 kV C: [AEP] Jefferson-[AEP] Rockport 765 kV
SOUTH TO PJM WEST 3600 3200 L: [CPLE] New Hill-[CPLE] Apex US1 230 kV C: [CPLE] Wake-[CPLE] Cumberland 500 kV
FAR WEST TO PJM WEST 3300 2900 L: [AMIL] Newton Power-[AMIL] Casey West East 345 kV C: [AMIL] Casey West East- Neoga South 2 345 kV
NORTH TO PJM WEST 5000 4600
L: [ITCT] Monroe 1&2-[FE] Bay Shore 345 kV C: [ITCT] Lulu-[ITCT] Monroe 3&4 345 kV [ITCT] Lulu-[ITCT] Milan 345 kV [FE] Allen Jct-[ITCT] Lulu 345 kV
NEAR WEST TO PJM WEST 2100 ** 1700 L: [SIGE] Culley-[SIGE] Tap - AEP Rockport 138 kV 82 C: [SIGE] AB Brown-[SIGE] AB Brown Reactor 138 kV [SIGE] AB Brown Reactor-[BREC] Henderson 138 kV
EAST TO PJM WEST 2900 2500 L: [PPL] Brunner Island-[METED] Yorkana 230 kV C: [PJM] Conastone-[PJM] Peach Bottom 500 kV
NORTHWEST TO PJM WEST 4200 3800 L: [AMIL] Rising 1 345/138 kV Tr. C: [AEP] Dumont-[CE] Wilton Center 765 kV
SOUTHEAST TO PJM WEST 6000 * 1600 * L: No Limit Found C: Each Valid Contingency Tested
* No Limit Found ** Due to construction schedule changes, the in-service date of the [SIGE] AB Brown-[BREC] Reid 345 kV line has been delayed from 2012 Summer to 2012 Fall. This new line was removed from the 2012 Summer model, however an existing series reactor on the underlying [SIGE] Francisco-[SIGE] Elliott 138 kV line was inadvertently left out of service. This series reactor limits flows on this 138 kV line, which has a high participation factor for transfers without the new 345 kV line in service. Therefore the model no longer exactly represents expected conditions in southern Indiana and northern Kentucky. As a result, the FCITC for Near West to PJM West is understated.
2012 Summer Assessment of Transmission System Performance 26
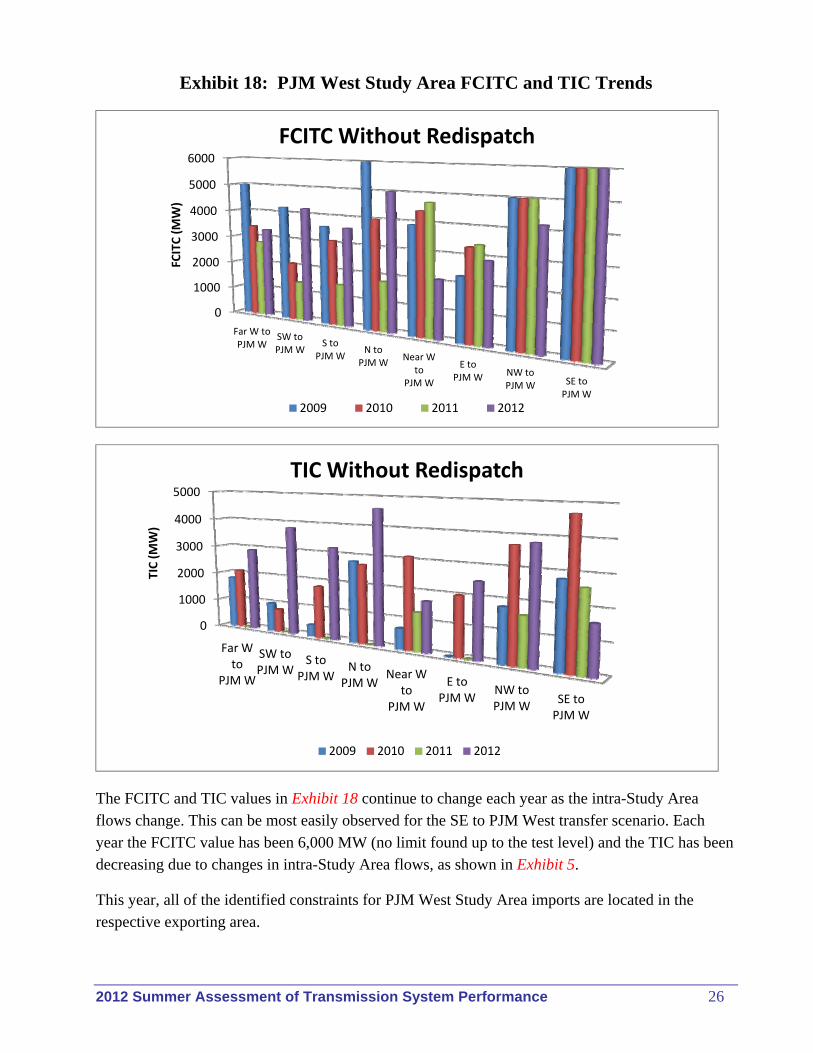
Exhibit 18: PJM West Study Area FCITC and TIC Trends
The FCITC and TIC values in Exhibit 18 continue to change each year as the intra-Study Area flows change. This can be most easily observed for the SE to PJM West transfer scenario. Each year the FCITC value has been 6,000 MW (no limit found up to the test level) and the TIC has been decreasing due to changes in intra-Study Area flows, as shown in Exhibit 5.
This year, all of the identified constraints for PJM West Study Area imports are located in the respective exporting area.
0
1000
2000
3000
4000
5000
6000
Far W toPJM W
SW toPJM W
S toPJM W
N toPJM W
Near W to
PJM W
E toPJM W NW to
PJM W SE toPJM W
FCITC (MW)
FCITC Without Redispatch
2009 2010 2011 2012
0
1000
2000
3000
4000
5000
Far W to
PJM W
SW toPJM W
S toPJM W
N toPJM W
Near W to
PJM W
E toPJM W
NW toPJM W
SE toPJM W
TIC (MW)
TIC Without Redispatch
2009 2010 2011 2012

2012 Summer Assessment of Transmission System Performance 27
As shown in Exhibit 16, ReliabilityFirst conducted FCITC analysis of source transfers and transfers crossing the PJM West Study Area. Most of these transfer scenarios had FCITC values over 3,000 MW. Among the exceptions were:
Northwest to Southeast and Near-west to Southeast scenarios: Loading of the [AEP] Joshua Falls 765/138 kV transformer for outage of the [AEP] Cloverdale 765/345 kV transformer was observed to be a constraint at an incremental transfer level of approximately 1,900 MW. There is a 2015 RTEP project (b1660) to install a 765/500 kV transformer at [AEP] Cloverdale. This project also includes the addition of a second 765/345 kV transformer at [AEP] Cloverdale. These additions will mitigate this constraint.
Southwest to East: Loading of the [AEP] Clinch River-[AEP] Lebanon section of the [AEP] Clinch River-[AEP] Saltville 138 kV line for outage of the [TVA] Sullivan-[AEP] Broadford 500 kV line and [AEP] Broadford 500/765 kV transformer was observed as a constraint at a transfer level of approximately 1,800 MW. There is a 2015 RTEP project (b1483) to perform a sag study and complete necessary remediation to raise the emergency rating of this line.
2012 Summer Assessment of Transmission System Performance 28
Thermal Simultaneous Transfer Capability Results
Exhibit 19: Simultaneous Transfer
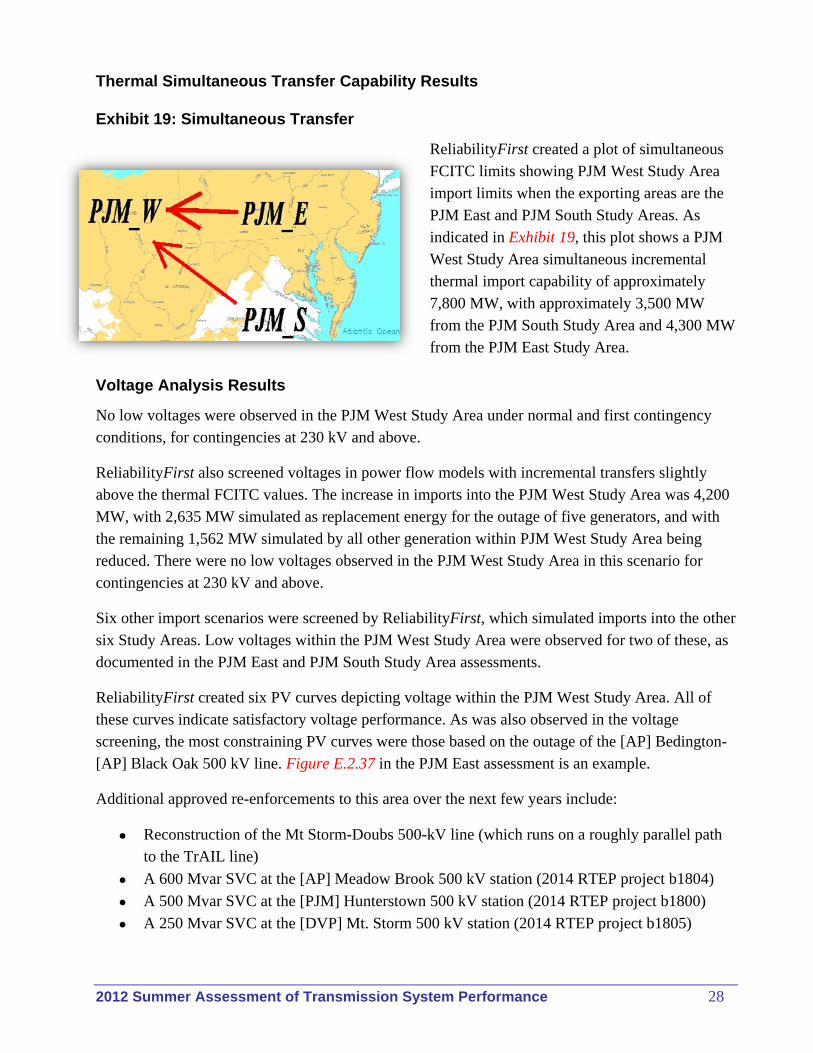
ReliabilityFirst created a plot of simultaneous FCITC limits showing PJM West Study Area import limits when the exporting areas are the PJM East and PJM South Study Areas. As indicated in Exhibit 19, this plot shows a PJM West Study Area simultaneous incremental thermal import capability of approximately 7,800 MW, with approximately 3,500 MW from the PJM South Study Area and 4,300 MW from the PJM East Study Area.
Voltage Analysis Results
No low voltages were observed in the PJM West Study Area under normal and first contingency conditions, for contingencies at 230 kV and above.
ReliabilityFirst also screened voltages in power flow models with incremental transfers slightly above the thermal FCITC values. The increase in imports into the PJM West Study Area was 4,200 MW, with 2,635 MW simulated as replacement energy for the outage of five generators, and with the remaining 1,562 MW simulated by all other generation within PJM West Study Area being reduced. There were no low voltages observed in the PJM West Study Area in this scenario for contingencies at 230 kV and above.
Six other import scenarios were screened by ReliabilityFirst, which simulated imports into the other six Study Areas. Low voltages within the PJM West Study Area were observed for two of these, as documented in the PJM East and PJM South Study Area assessments.
ReliabilityFirst created six PV curves depicting voltage within the PJM West Study Area. All of these curves indicate satisfactory voltage performance. As was also observed in the voltage screening, the most constraining PV curves were those based on the outage of the [AP] Bedington-[AP] Black Oak 500 kV line. Figure E.2.37 in the PJM East assessment is an example.
Additional approved re-enforcements to this area over the next few years include:
Reconstruction of the Mt Storm-Doubs 500-kV line (which runs on a roughly parallel path to the TrAIL line)
A 600 Mvar SVC at the [AP] Meadow Brook 500 kV station (2014 RTEP project b1804)
A 500 Mvar SVC at the [PJM] Hunterstown 500 kV station (2014 RTEP project b1800)
A 250 Mvar SVC at the [DVP] Mt. Storm 500 kV station (2014 RTEP project b1805)
2012 Summer Assessment of Transmission System Performance 29
Thermal and Voltage Analysis of Stuck Breaker Contingencies (new)
The following thermal loadings were observed in the PJM West Study Area.
Constraint: [AEP] Amos-[AEP] Poca section of [AEP] Amos-[AEP] Chemical No. 1 138 kV line Contingency: SLG fault plus two different stuck breaker events at [AEP] Kanawha River 345 kV Loading: 102% of the 296 MVA emergency rating
In this model, ReliabilityFirst found no generation redispatch to mitigate this constraint. There is a 2014 RTEP project (b1042) to perform a sag study and complete necessary remediation to raise the emergency rating of this line. There is also an AEP supplemental project (s0358) to install a second 345/138 kV transformer at [AEP] Kanawha River. The existing stuck breaker events at Kanawha River include outage of the existing [AEP] Kanawha River 345/138 kV Tr. B; addition of the second transformer will reduce the impact of a stuck breaker event.
Constraint: [AEP] Roanoke-[AEP] Moseley 138 kV line Contingency: SLG fault plus stuck breaker at [AEP] Cloverdale 345 kV Loading: 105% of the 151 MVA emergency rating
In this model, post contingency loading of this line could be mitigated by increasing generation at [AEP] Smith Mountain (pumped storage). There is a 2014 RTEP project (b1041) to perform a sag study and complete necessary remediation to raise the emergency rating of this line.
Constraint: [AEP] Roanoke-[AEP] Moseley 138 kV line Contingency: SLG fault plus stuck breaker at [AEP] Joshua Falls 765 kV Loading: 110% of the 151 MVA emergency rating
In this model, post contingency loading of this line could be mitigated by increasing generation at [AEP] Smith Mountain (pumped storage). There is a 2014 RTEP project (b1041) to perform a sag study and complete necessary remediation to raise the emergency rating of this line.
Constraint: [AEP] Ruth-[AEP] Turner 138 kV line Contingency: SLG fault plus two different stuck breaker events at [AEP] Kanawha River 345 kV Loading: 101% of the 201 MVA emergency rating
In this model, ReliabilityFirst found no generation redispatch to mitigate this constraint. There is an AEP 2016 supplemental project (s0358) to install a second 345/138 kV transformer at [AEP] Kanawha River. The existing stuck breaker events at Kanawha River include outage of the existing [AEP] Kanawha River 345/138 kV Tr. B; addition of the second transformer will reduce the impact of a stuck breaker event.
2012 Summer Assessment of Transmission System Performance 30
Constraint: [AP] Willow Island-[AP] Eureka-[AP] St. Mary’s 138 kV circuit Contingency: SLG fault plus stuck breaker at [AEP] Kammer 345 kV Loading: 110% of the 151 MVA emergency rating
In this model, post contingency loading of this line could be mitigated by decreasing generation at [AP] Willow Island (coal) or by increasing generation at [AEP] Kammer (coal). There is a 2013 PJM RTEP project (b1230) to reconductor the [AP] Willow Island-[AP] Eureka-[AP] St. Mary’s 138 kV circuit.
Constraint: [AP] Black Oak-[AP] Cross School 138 kV circuit Contingency: SLG fault plus stuck breaker at [AP] Hatfield 500 kV Loading: 101% of the 201 MVA emergency rating
There is a Special Protection Scheme at Black Oak that opens the #3 500/138 kV transformer at Black Oak for loss of the Hatfield-Black Oak 500 kV line. This will mitigate the identified overload. There is also a 2013 RTEP project (b1171.1) to install a second 500/138 kV transformer at [AP] Black Oak, and a 2013 RTEP project (b1235) to reconductor the [AP]Black Oak-[AP]Albright 138 kV line.
Constraint: [AP] Marlowe-[AP] Halfway 138 kV circuit Contingency: SLG fault plus one of two stuck breaker events at [AP] Doubs 500 kV Loading: 104% of the 309 MVA emergency rating
In this model, post contingency loading of this line could be mitigated by decreasing generation at [AP] R. Paul Smith (coal). There is a 2013 RTEP project (b1385) to reconductor the [AP] Marlowe-[AP] Paramount 138 kV line.
Constraint: [DLCO] Collier 345/138 kV transformer 1 or 2 Contingency: SLG fault plus stuck breaker events at [DLCO] Collier 345 kV Loading: 101% of the 382 MVA emergency rating
In this model, post contingency loading of this line could be mitigated by increasing generation at [DLCO] Brunot Island (natural gas) or [DLCO] Elrama (coal) among others. There is a 2013 RTEP project (s0321) to install a third transformer at Collier.
Constraint: [DEO&K] Todhunter-[DEO&K] Trenton 138 kV line Contingency: SLG fault plus one of seven stuck breakers at [AEP] Desoto or [AEP] Tanners Creek 345 kV Loading: Up to 121% of the 201 MVA emergency rating
In this model, this constraint can be mitigated by increasing generation at [AEP] Tanners Creek (coal). There is a 2013 PJM RTEP project (b1576) to reconductor this line.

2012 Summer Assessment of Transmission System Performance 31
Constraint: [DEO&K] Silver Grove 345/138 kV transformer Contingency: SLG fault plus stuck breaker at [DEO&K] Redbank 345 kV Loading: Up to 104% of the 487 MVA emergency rating
In this model, this constraint can be mitigated by decreasing generation at [DEO&K] Zimmer (coal). This constraint can also be mitigated by 138 kV switching at [DEO&K] Silver Grove to isolate load. On April 12, 2012 the PJM TEAC presented a proposal to convert the Redbank into a ring bus station.
No low voltages were observed in the PJM West Study Area for contingencies involving stuck EHV breakers.

2012 Summer Assessment of Transmission System Performance 32
PJM Northern Illinois Study Area Assessment
Assessment Summary
The PJM Northern Illinois Study Area is comprised of Commonwealth Edison Company (CE). The primary load centers in the PJM Northern Illinois Study Area are the city of Chicago, IL and the surrounding metropolitan areas. Generation in the PJM Northern Illinois Study Area is located predominantly in the southern and western portions of the CE service territory. Significant south to north and west to east flows occur on the CE transmission system to supply the load centers in the northeast portion of the CE service territory from generation in the south and west.
The BPS serving the PJM Northern Illinois Study Area is expected to perform well over a wide range of operating conditions, provided that new facilities go into service as scheduled, and that transmission operators take appropriate action to control flows, reactive reserves, and voltages.
Thermal Analysis Results
No overloads were observed in the PJM Northern Illinois Study Area under base case and first contingency conditions.
In the sensitivity analysis, no facilities in the PJM Northern Illinois Study Area were identified as having a high likelihood of becoming constrained beyond the capability of PJM and MISO to mitigate with redispatch.
ReliabilityFirst performed non-simultaneous transfer analysis. The transfers reported in this Study Area assessment are shown in Exhibit 20. Sink directions, or imports into the PJM Northern Illinois Study Area, are indicated by red lines. The transfers crossing the PJM Northern Illinois Study Area are shown in green. For transfers crossing the PJM Northern Illinois Study Area, only BPS facilities within the PJM Northern Illinois Study Area were monitored.
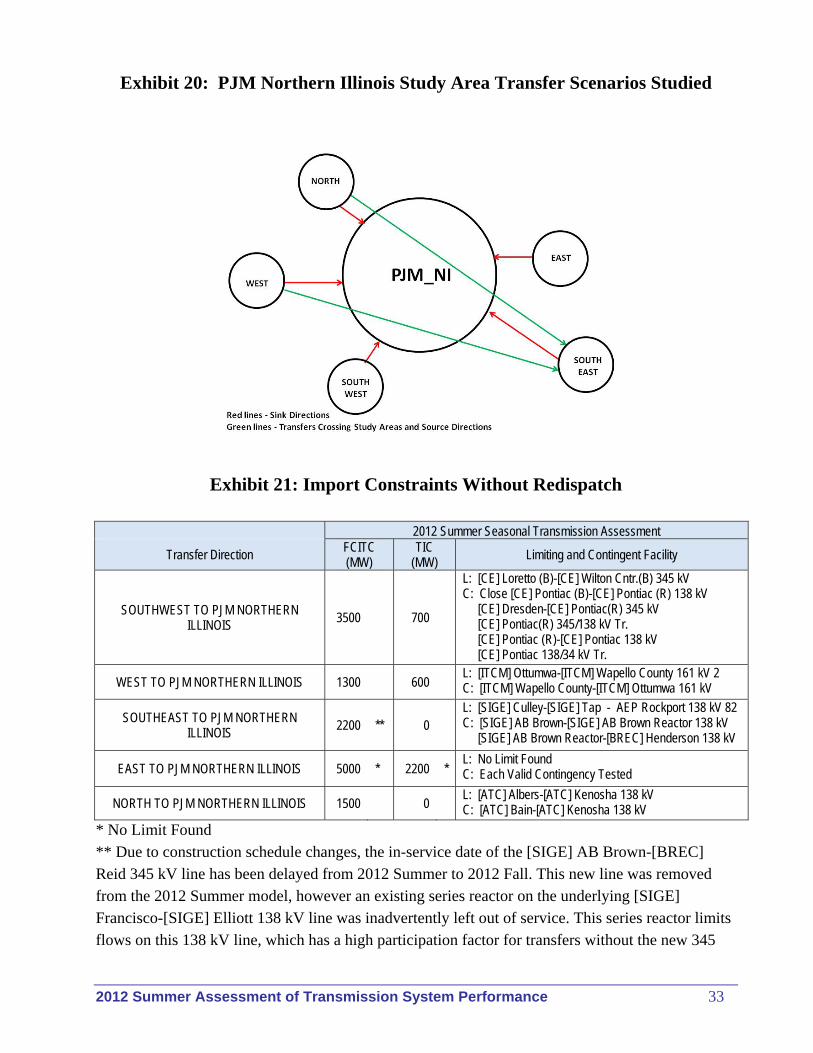
2012 Summer Assessment of Transmission System Performance 33
Exhibit 20: PJM Northern Illinois Study Area Transfer Scenarios Studied
Exhibit 21: Import Constraints Without Redispatch
2012 Summer Seasonal Transmission Assessment
Transfer Direction FCITC (MW)
TIC (MW) Limiting and Contingent Facility
SOUTHWEST TO PJM NORTHERN ILLINOIS 3500 700
L: [CE] Loretto (B)-[CE] Wilton Cntr.(B) 345 kV C: Close [CE] Pontiac (B)-[CE] Pontiac (R) 138 kV [CE] Dresden-[CE] Pontiac(R) 345 kV [CE] Pontiac(R) 345/138 kV Tr. [CE] Pontiac (R)-[CE] Pontiac 138 kV [CE] Pontiac 138/34 kV Tr.
WEST TO PJM NORTHERN ILLINOIS 1300 600 L: [ITCM] Ottumwa-[ITCM] Wapello County 161 kV 2 C: [ITCM] Wapello County-[ITCM] Ottumwa 161 kV
SOUTHEAST TO PJM NORTHERN ILLINOIS 2200 ** 0
L: [SIGE] Culley-[SIGE] Tap - AEP Rockport 138 kV 82 C: [SIGE] AB Brown-[SIGE] AB Brown Reactor 138 kV [SIGE] AB Brown Reactor-[BREC] Henderson 138 kV
EAST TO PJM NORTHERN ILLINOIS 5000 * 2200 * L: No Limit Found C: Each Valid Contingency Tested
NORTH TO PJM NORTHERN ILLINOIS 1500 0 L: [ATC] Albers-[ATC] Kenosha 138 kV C: [ATC] Bain-[ATC] Kenosha 138 kV
* No Limit Found ** Due to construction schedule changes, the in-service date of the [SIGE] AB Brown-[BREC] Reid 345 kV line has been delayed from 2012 Summer to 2012 Fall. This new line was removed from the 2012 Summer model, however an existing series reactor on the underlying [SIGE] Francisco-[SIGE] Elliott 138 kV line was inadvertently left out of service. This series reactor limits flows on this 138 kV line, which has a high participation factor for transfers without the new 345
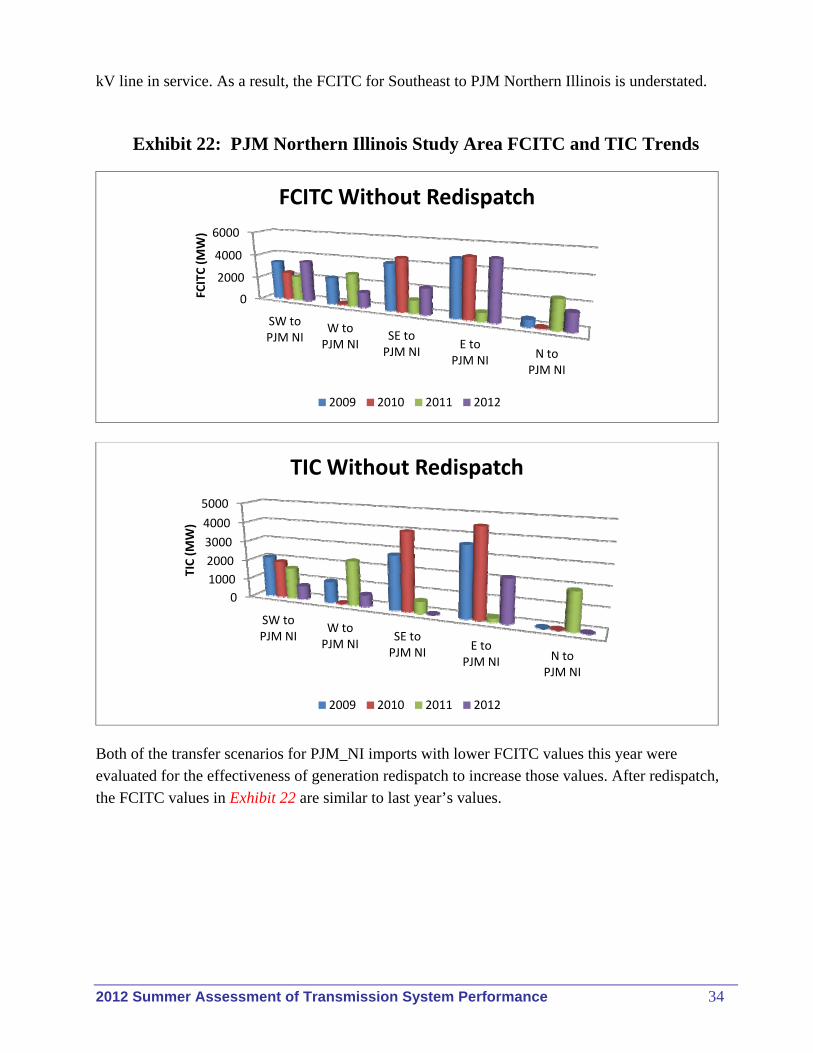
2012 Summer Assessment of Transmission System Performance 34
kV line in service. As a result, the FCITC for Southeast to PJM Northern Illinois is understated.
Exhibit 22: PJM Northern Illinois Study Area FCITC and TIC Trends
Both of the transfer scenarios for PJM_NI imports with lower FCITC values this year were evaluated for the effectiveness of generation redispatch to increase those values. After redispatch, the FCITC values in Exhibit 22 are similar to last year’s values.
0
2000
4000
6000
SW toPJM NI
W toPJM NI
SE toPJM NI
E toPJM NI
N toPJM NI
FCITC (MW)
FCITC Without Redispatch
2009 2010 2011 2012
0
1000
2000
3000
4000
5000
SW toPJM NI
W toPJM NI
SE toPJM NI
E toPJM NI N to
PJM NI
TIC (MW)
TIC Without Redispatch
2009 2010 2011 2012
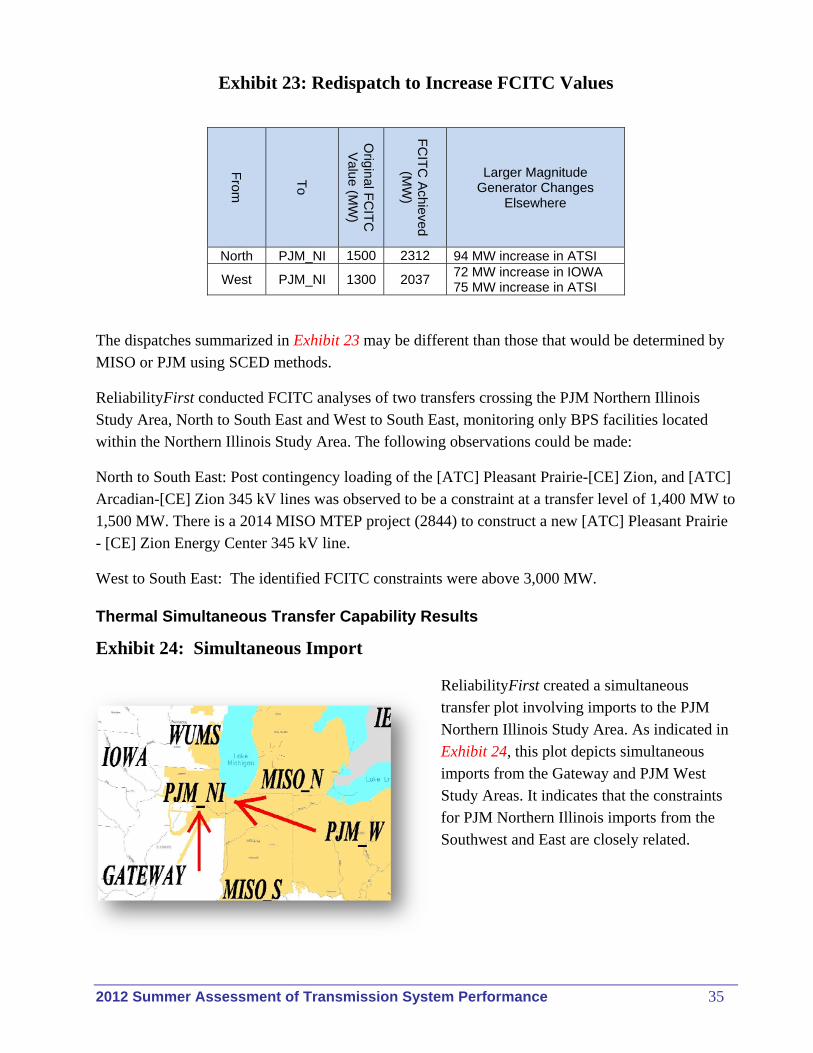
2012 Summer Assessment of Transmission System Performance 35
Exhibit 23: Redispatch to Increase FCITC Values
From
To
Original F
CIT
C
Value (M
W)
FC
ITC
Achieved
(MW
)
Larger Magnitude Generator Changes
Elsewhere
North PJM_NI 1500 2312 94 MW increase in ATSI
West PJM_NI 1300 2037 72 MW increase in IOWA 75 MW increase in ATSI
The dispatches summarized in Exhibit 23 may be different than those that would be determined by MISO or PJM using SCED methods.
ReliabilityFirst conducted FCITC analyses of two transfers crossing the PJM Northern Illinois Study Area, North to South East and West to South East, monitoring only BPS facilities located within the Northern Illinois Study Area. The following observations could be made:
North to South East: Post contingency loading of the [ATC] Pleasant Prairie-[CE] Zion, and [ATC] Arcadian-[CE] Zion 345 kV lines was observed to be a constraint at a transfer level of 1,400 MW to 1,500 MW. There is a 2014 MISO MTEP project (2844) to construct a new [ATC] Pleasant Prairie - [CE] Zion Energy Center 345 kV line.
West to South East: The identified FCITC constraints were above 3,000 MW.
Thermal Simultaneous Transfer Capability Results
Exhibit 24: Simultaneous Import
ReliabilityFirst created a simultaneous transfer plot involving imports to the PJM Northern Illinois Study Area. As indicated in Exhibit 24, this plot depicts simultaneous imports from the Gateway and PJM West Study Areas. It indicates that the constraints for PJM Northern Illinois imports from the Southwest and East are closely related.
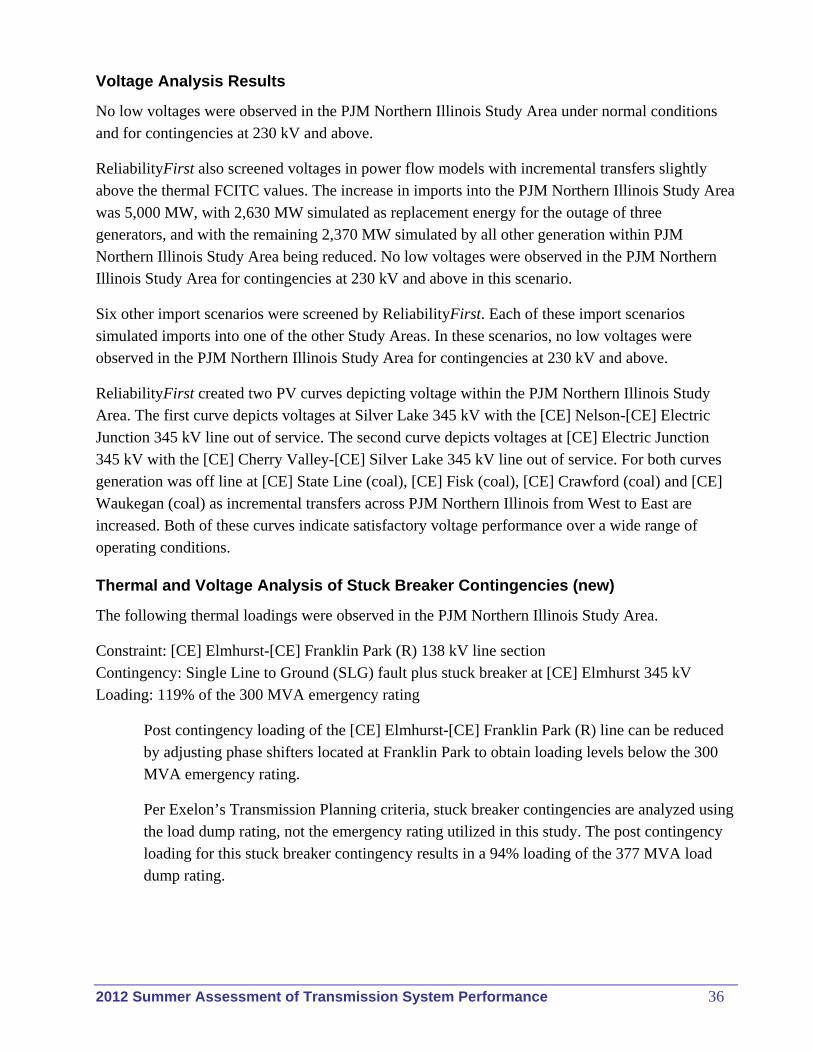
2012 Summer Assessment of Transmission System Performance 36
Voltage Analysis Results
No low voltages were observed in the PJM Northern Illinois Study Area under normal conditions and for contingencies at 230 kV and above.
ReliabilityFirst also screened voltages in power flow models with incremental transfers slightly above the thermal FCITC values. The increase in imports into the PJM Northern Illinois Study Area was 5,000 MW, with 2,630 MW simulated as replacement energy for the outage of three generators, and with the remaining 2,370 MW simulated by all other generation within PJM Northern Illinois Study Area being reduced. No low voltages were observed in the PJM Northern Illinois Study Area for contingencies at 230 kV and above in this scenario.
Six other import scenarios were screened by ReliabilityFirst. Each of these import scenarios simulated imports into one of the other Study Areas. In these scenarios, no low voltages were observed in the PJM Northern Illinois Study Area for contingencies at 230 kV and above.
ReliabilityFirst created two PV curves depicting voltage within the PJM Northern Illinois Study Area. The first curve depicts voltages at Silver Lake 345 kV with the [CE] Nelson-[CE] Electric Junction 345 kV line out of service. The second curve depicts voltages at [CE] Electric Junction 345 kV with the [CE] Cherry Valley-[CE] Silver Lake 345 kV line out of service. For both curves generation was off line at [CE] State Line (coal), [CE] Fisk (coal), [CE] Crawford (coal) and [CE] Waukegan (coal) as incremental transfers across PJM Northern Illinois from West to East are increased. Both of these curves indicate satisfactory voltage performance over a wide range of operating conditions.
Thermal and Voltage Analysis of Stuck Breaker Contingencies (new)
The following thermal loadings were observed in the PJM Northern Illinois Study Area.
Constraint: [CE] Elmhurst-[CE] Franklin Park (R) 138 kV line section Contingency: Single Line to Ground (SLG) fault plus stuck breaker at [CE] Elmhurst 345 kV Loading: 119% of the 300 MVA emergency rating
Post contingency loading of the [CE] Elmhurst-[CE] Franklin Park (R) line can be reduced by adjusting phase shifters located at Franklin Park to obtain loading levels below the 300 MVA emergency rating.
Per Exelon’s Transmission Planning criteria, stuck breaker contingencies are analyzed using the load dump rating, not the emergency rating utilized in this study. The post contingency loading for this stuck breaker contingency results in a 94% loading of the 377 MVA load dump rating.

2012 Summer Assessment of Transmission System Performance 37
Constraint: [CE] Cherry Valley (B) 345/138 kV transformer Contingency: SLG fault plus stuck breaker at [CE] Cherry Valley 345 kV Loading: 108% of the 442 MVA emergency rating
Post contingency loading of the [CE] Cherry Valley (B) 345/138 kV transformer can be reduced by decreasing generation at [CE] Lee County (natural gas) or [ATC] Columbia (coal), among others.
The post contingency loading for this stuck breaker contingency results in a 92% loading of the 520 MVA load dump rating.
No low voltages were observed in the PJM Northern Illinois Study Area for contingencies involving stuck EHV breakers.
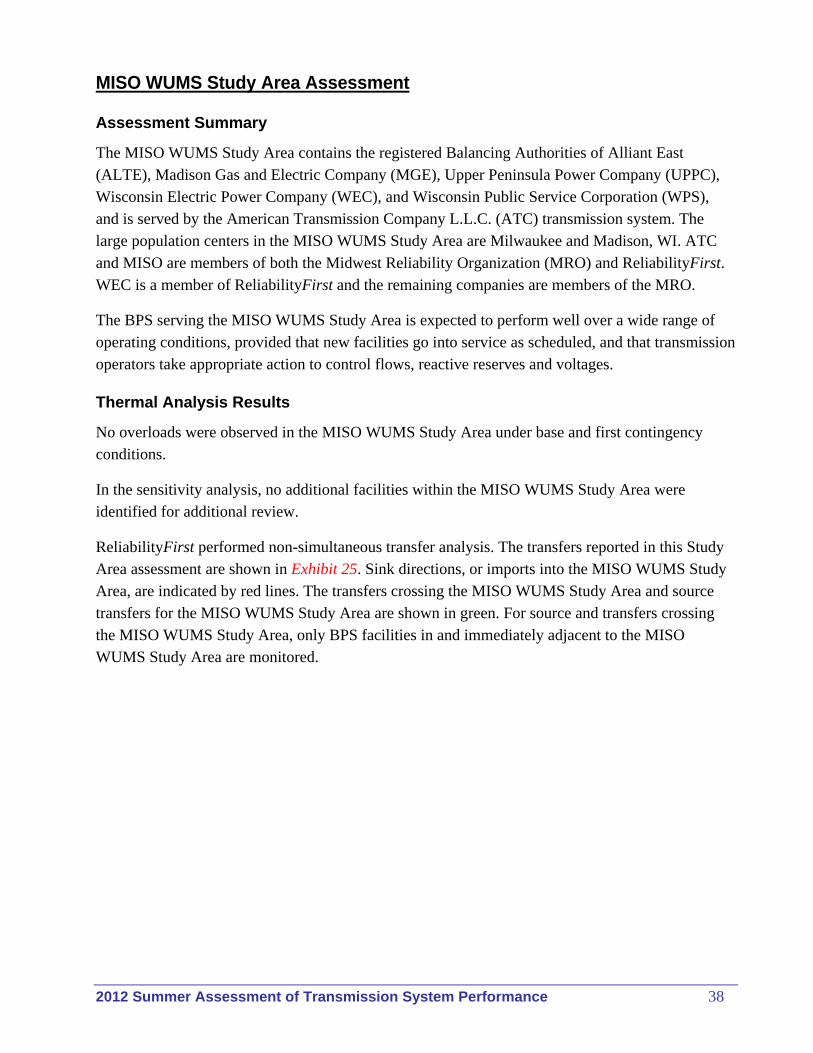
2012 Summer Assessment of Transmission System Performance 38
MISO WUMS Study Area Assessment
Assessment Summary
The MISO WUMS Study Area contains the registered Balancing Authorities of Alliant East (ALTE), Madison Gas and Electric Company (MGE), Upper Peninsula Power Company (UPPC), Wisconsin Electric Power Company (WEC), and Wisconsin Public Service Corporation (WPS), and is served by the American Transmission Company L.L.C. (ATC) transmission system. The large population centers in the MISO WUMS Study Area are Milwaukee and Madison, WI. ATC and MISO are members of both the Midwest Reliability Organization (MRO) and ReliabilityFirst. WEC is a member of ReliabilityFirst and the remaining companies are members of the MRO.
The BPS serving the MISO WUMS Study Area is expected to perform well over a wide range of operating conditions, provided that new facilities go into service as scheduled, and that transmission operators take appropriate action to control flows, reactive reserves and voltages.
Thermal Analysis Results
No overloads were observed in the MISO WUMS Study Area under base and first contingency conditions.
In the sensitivity analysis, no additional facilities within the MISO WUMS Study Area were identified for additional review.
ReliabilityFirst performed non-simultaneous transfer analysis. The transfers reported in this Study Area assessment are shown in Exhibit 25. Sink directions, or imports into the MISO WUMS Study Area, are indicated by red lines. The transfers crossing the MISO WUMS Study Area and source transfers for the MISO WUMS Study Area are shown in green. For source and transfers crossing the MISO WUMS Study Area, only BPS facilities in and immediately adjacent to the MISO WUMS Study Area are monitored.
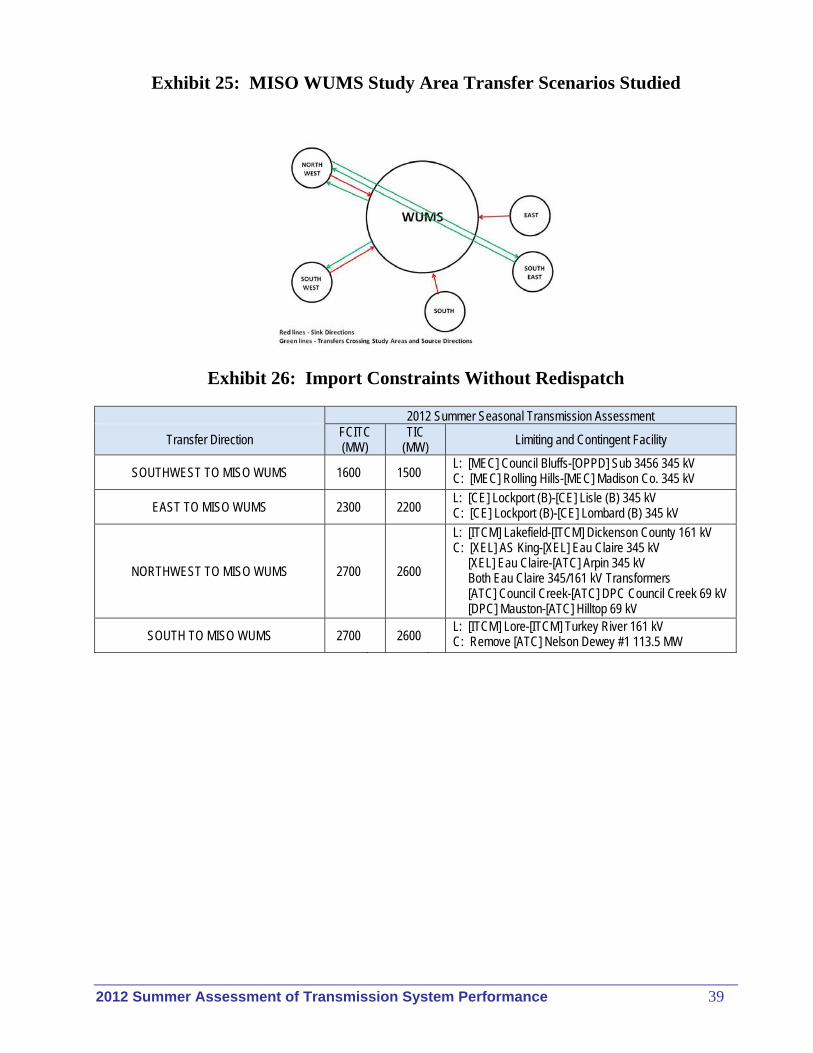
2012 Summer Assessment of Transmission System Performance 39
Exhibit 25: MISO WUMS Study Area Transfer Scenarios Studied
Exhibit 26: Import Constraints Without Redispatch
2012 Summer Seasonal Transmission Assessment
Transfer Direction FCITC (MW)
TIC (MW) Limiting and Contingent Facility
SOUTHWEST TO MISO WUMS 1600 1500 L: [MEC] Council Bluffs-[OPPD] Sub 3456 345 kV C: [MEC] Rolling Hills-[MEC] Madison Co. 345 kV
EAST TO MISO WUMS 2300 2200 L: [CE] Lockport (B)-[CE] Lisle (B) 345 kV C: [CE] Lockport (B)-[CE] Lombard (B) 345 kV
NORTHWEST TO MISO WUMS 2700 2600
L: [ITCM] Lakefield-[ITCM] Dickenson County 161 kV C: [XEL] AS King-[XEL] Eau Claire 345 kV [XEL] Eau Claire-[ATC] Arpin 345 kV Both Eau Claire 345/161 kV Transformers [ATC] Council Creek-[ATC] DPC Council Creek 69 kV [DPC] Mauston-[ATC] Hilltop 69 kV
SOUTH TO MISO WUMS 2700 2600 L: [ITCM] Lore-[ITCM] Turkey River 161 kV C: Remove [ATC] Nelson Dewey #1 113.5 MW

2012 Summer Assessment of Transmission System Performance 40
Exhibit 27: MISO WUMS Study Area FCITC and TIC Trends
In the 2011 Summer assessment, the WUMS inter-Study Area flow was a 1,066 MW import. In this 2012 Summer assessment it was a 212 MW export, a difference of approximately 1,300 MW. As would be expected, this difference in base inter-Study Area flows causes a general increase in FCITC values as shown in Exhibit 27.
For the transfer scenarios in Exhibits 26 and 27, ReliabilityFirst calculated whether the FCITC value without redispatch adequately demonstrates that the BPS is expected to perform well over a wide range of operating conditions. All of the MISO WUMS Study Area import scenarios have FCITC values above this criterion, thus redispatch analysis was not performed.
ReliabilityFirst conducted FCITC analysis of two transfers crossing the MISO WUMS Study Area, North West to South East and South East to North West, monitoring only BPS facilities located within and adjacent to the MISO WUMS Study Area. The following observation can be made:
0
1000
2000
3000
4000
SW TO WUMSNW TO WUMS
E TO WUMSS TO WUMS
FCITC (MW)
FCITC Without Redispatch
2009 2010 2011 2012
0
1000
2000
3000
4000
SW TO WUMSNW TO WUMS
E TO WUMSS TO WUMS
TIC (MW)
TIC Without Redispatch
2009 2010 2011 2012
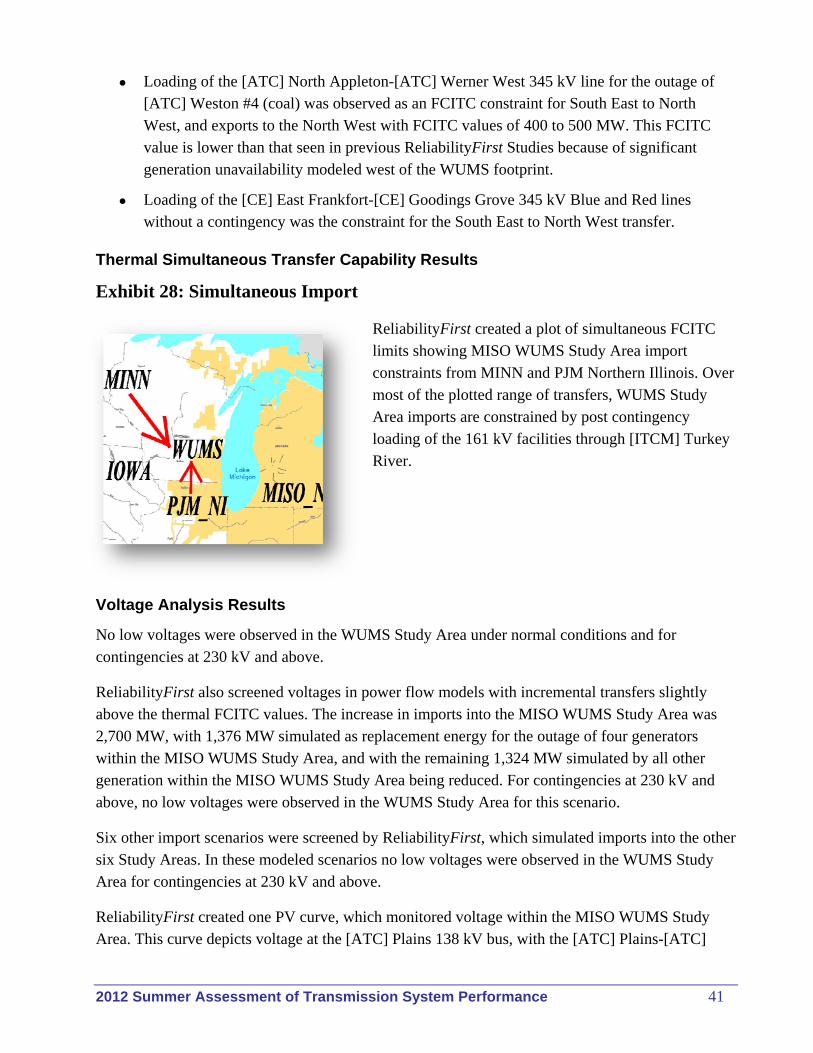
2012 Summer Assessment of Transmission System Performance 41
Loading of the [ATC] North Appleton-[ATC] Werner West 345 kV line for the outage of [ATC] Weston #4 (coal) was observed as an FCITC constraint for South East to North West, and exports to the North West with FCITC values of 400 to 500 MW. This FCITC value is lower than that seen in previous ReliabilityFirst Studies because of significant generation unavailability modeled west of the WUMS footprint.
Loading of the [CE] East Frankfort-[CE] Goodings Grove 345 kV Blue and Red lines without a contingency was the constraint for the South East to North West transfer.
Thermal Simultaneous Transfer Capability Results
Exhibit 28: Simultaneous Import
ReliabilityFirst created a plot of simultaneous FCITC limits showing MISO WUMS Study Area import constraints from MINN and PJM Northern Illinois. Over most of the plotted range of transfers, WUMS Study Area imports are constrained by post contingency loading of the 161 kV facilities through [ITCM] Turkey River.
Voltage Analysis Results
No low voltages were observed in the WUMS Study Area under normal conditions and for contingencies at 230 kV and above.
ReliabilityFirst also screened voltages in power flow models with incremental transfers slightly above the thermal FCITC values. The increase in imports into the MISO WUMS Study Area was 2,700 MW, with 1,376 MW simulated as replacement energy for the outage of four generators within the MISO WUMS Study Area, and with the remaining 1,324 MW simulated by all other generation within the MISO WUMS Study Area being reduced. For contingencies at 230 kV and above, no low voltages were observed in the WUMS Study Area for this scenario.
Six other import scenarios were screened by ReliabilityFirst, which simulated imports into the other six Study Areas. In these modeled scenarios no low voltages were observed in the WUMS Study Area for contingencies at 230 kV and above.
ReliabilityFirst created one PV curve, which monitored voltage within the MISO WUMS Study Area. This curve depicts voltage at the [ATC] Plains 138 kV bus, with the [ATC] Plains-[ATC]

2012 Summer Assessment of Transmission System Performance 42
Morgan 345 kV and [ATC] Hiawatha-[ATC] Indian Lake 69 kV lines open and two generators at [ATC] Presque Isle (coal) out of service, as imports into the WUMS Study Area from the South are increased. This plot indicates satisfactory voltages over a wide range of operating conditions.
Thermal and Voltage Analysis of Stuck Breaker Contingencies (new)
In this assessment, ReliabilityFirst performed analysis of Category P4 event (stuck breaker after a single line to ground fault) at 300 kV and above. Post contingency thermal performance was compared to the emergency ratings, and voltage performance was compared to Transmission Owners first contingency voltage criteria. No simulations were made to evaluate the effectiveness of generation adjustments to mitigate any identified overloads or low voltages.
The following thermal loadings were observed in the MISO WUMS Study Area.
Constraint: [ATC] Bain 345/138 kV transformer Contingency: SLG fault plus stuck breaker at [ATC] Pleasant Prairie 345 kV Loading: 157% of the 382 MVA emergency rating
The event results in the only outlet for [ATC] Pleasant Prairie 2 becoming the [ATC] Bain 345/138 kV transformer. Although the loading on this transformer is higher than the two hour emergency rating, it is below the thirty minute rating ATC has for this transformer. The thirty minute rating allows sufficient time to back down Pleasant Prairie unit 2 (coal) and bring the loading on the Bain transformer back to within its normal rating. Furthermore, ATC has a planned project to rebuild the Pleasant Prairie substation to a breaker-and-a half configuration in May of 2013. The stuck breaker contingency that causes the high loading on the Bain transformer will no longer be valid after the rebuild.
No low voltages were observed in the MISO WUMS Study Area for contingencies involving stuck EHV breakers.
2012 Summer Assessment of Transmission System Performance 43
Lakes Study Area Assessment
Assessment Summary
The Lakes Study Area includes American Transmission Systems, Inc (ATSI), ITCTransmission (ITCT), Northern Indiana Public Service Company (NIPS), Michigan Electric Transmission Company (METC), and Wolverine Power Cooperative (Wolverine). The large population centers in the Lakes Study Area are Cleveland, OH; Detroit, MI and the northwest Indiana metropolitan area surrounding Gary, IN.
The BPS serving the Lakes Study Area is expected to perform well over a wide range of operating conditions, provided that new facilities go into service as scheduled, and that transmission operators take appropriate action to control flows, reactive reserves and voltages.
Thermal Analysis Results
Constraint: [ATSI] Lakeview-[ATSI] Ottawa 138 kV Contingency: None Loading: 105% of the 295 MVA normal rating
This line and the [ATSI] Greenfield-[ATSI] Lakeview 138 kV line were also observed to load in excess of emergency ratings for the first contingency outage of the [ATSI] Beaver-[ATSI] Davis-Besse 345 kV line. There is a winter 2012 RTEP project (b1547) to reconductor the Lakeview-Ottawa-Greenfield 138 kV line. In this model, loading of this line can be mitigated by decreasing generation at [ATSI] Fremont (natural gas) or [ATSI] Bay Shore (coal), among others.
Constraint: [METC] Bullock B-[METC] Bullock W 138 kV Contingency: [METC] Tittabawassee-[METC] Dow Corning #2 138 kV Ckt 1 Loading: 102% of the 192 MVA normal rating
There is a 2013 MISO MTEP project (2496) to upgrade terminal equipment at Bullock. In this model, this overload can be mitigated by decreasing generation at [METC] Midland Cogeneration Venture (natural gas).
Constraint: [METC] Donaldson Creek-[METC] Redwood 138 kV Contingency: [METC] Pere Marquette-[METC] Lake County 138 kV Ckt 1 Loading: 105% of the 73 MVA normal rating
There is a 2014 MISO MTEP project (1272) to install a second 138/69 kV transformer at Redwood. For 2012, Wolverine would need to open the Redwood-Hart 69 kV line section to relieve this first contingency loading.
No additional overloads were observed in the Lakes Study Area under base and first contingency conditions.
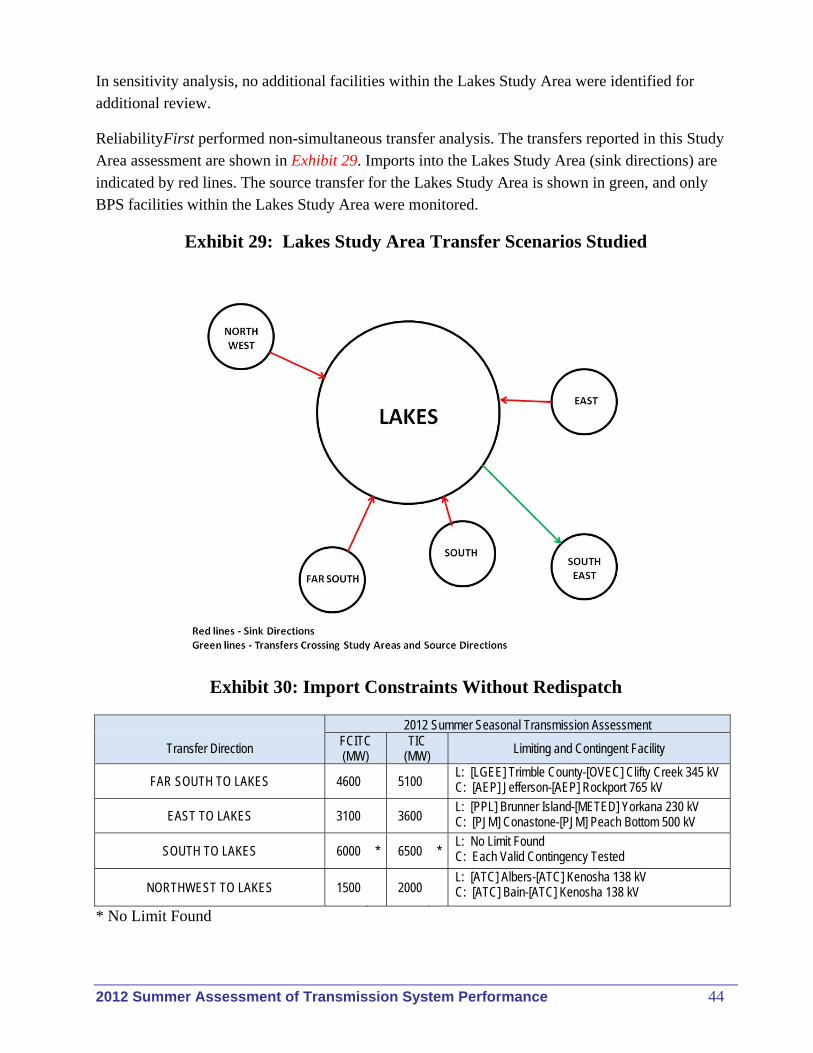
2012 Summer Assessment of Transmission System Performance 44
In sensitivity analysis, no additional facilities within the Lakes Study Area were identified for additional review.
ReliabilityFirst performed non-simultaneous transfer analysis. The transfers reported in this Study Area assessment are shown in Exhibit 29. Imports into the Lakes Study Area (sink directions) are indicated by red lines. The source transfer for the Lakes Study Area is shown in green, and only BPS facilities within the Lakes Study Area were monitored.
Exhibit 29: Lakes Study Area Transfer Scenarios Studied
Exhibit 30: Import Constraints Without Redispatch
2012 Summer Seasonal Transmission Assessment
Transfer Direction FCITC (MW)
TIC (MW) Limiting and Contingent Facility
FAR SOUTH TO LAKES 4600 5100 L: [LGEE] Trimble County-[OVEC] Clifty Creek 345 kV C: [AEP] Jefferson-[AEP] Rockport 765 kV
EAST TO LAKES 3100 3600 L: [PPL] Brunner Island-[METED] Yorkana 230 kV C: [PJM] Conastone-[PJM] Peach Bottom 500 kV
SOUTH TO LAKES 6000 * 6500 * L: No Limit Found C: Each Valid Contingency Tested
NORTHWEST TO LAKES 1500 2000 L: [ATC] Albers-[ATC] Kenosha 138 kV C: [ATC] Bain-[ATC] Kenosha 138 kV
* No Limit Found
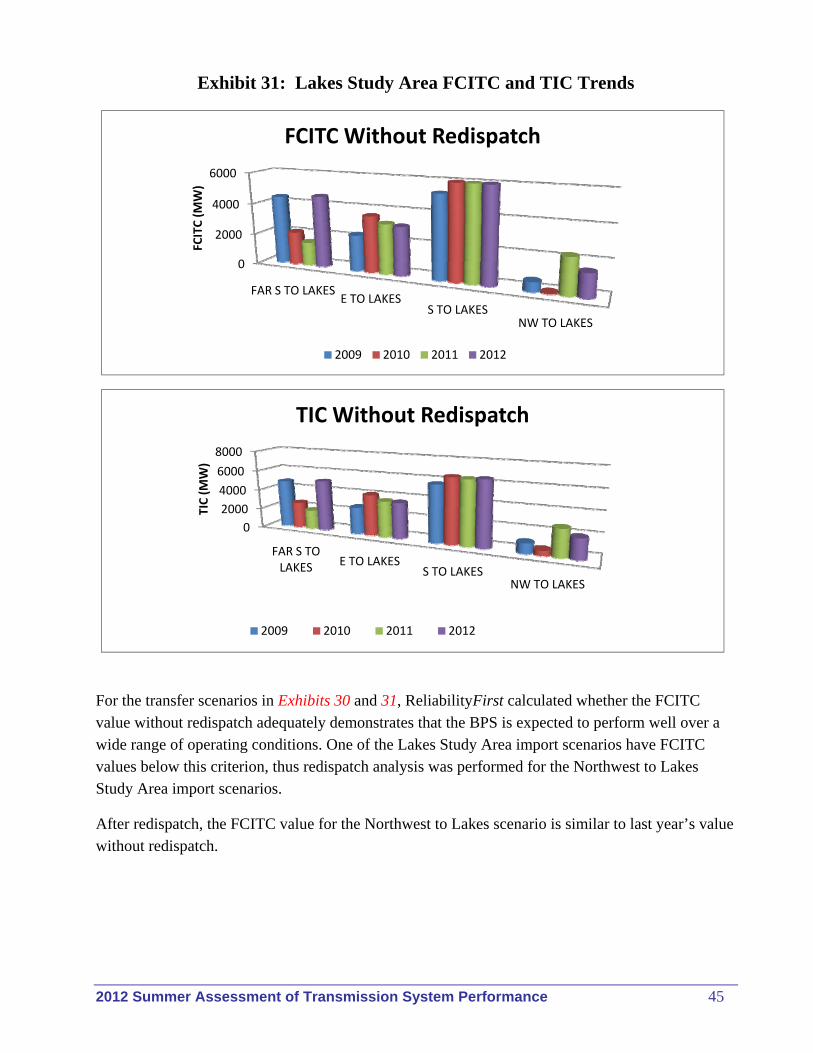
2012 Summer Assessment of Transmission System Performance 45
Exhibit 31: Lakes Study Area FCITC and TIC Trends
For the transfer scenarios in Exhibits 30 and 31, ReliabilityFirst calculated whether the FCITC value without redispatch adequately demonstrates that the BPS is expected to perform well over a wide range of operating conditions. One of the Lakes Study Area import scenarios have FCITC values below this criterion, thus redispatch analysis was performed for the Northwest to Lakes Study Area import scenarios.
After redispatch, the FCITC value for the Northwest to Lakes scenario is similar to last year’s value without redispatch.
0
2000
4000
6000
FAR S TO LAKESE TO LAKES
S TO LAKESNW TO LAKES
FCITC (MW)
FCITC Without Redispatch
2009 2010 2011 2012
0
2000
4000
6000
8000
FAR S TO LAKES E TO LAKES
S TO LAKESNW TO LAKES
TIC (MW)
TIC Without Redispatch
2009 2010 2011 2012
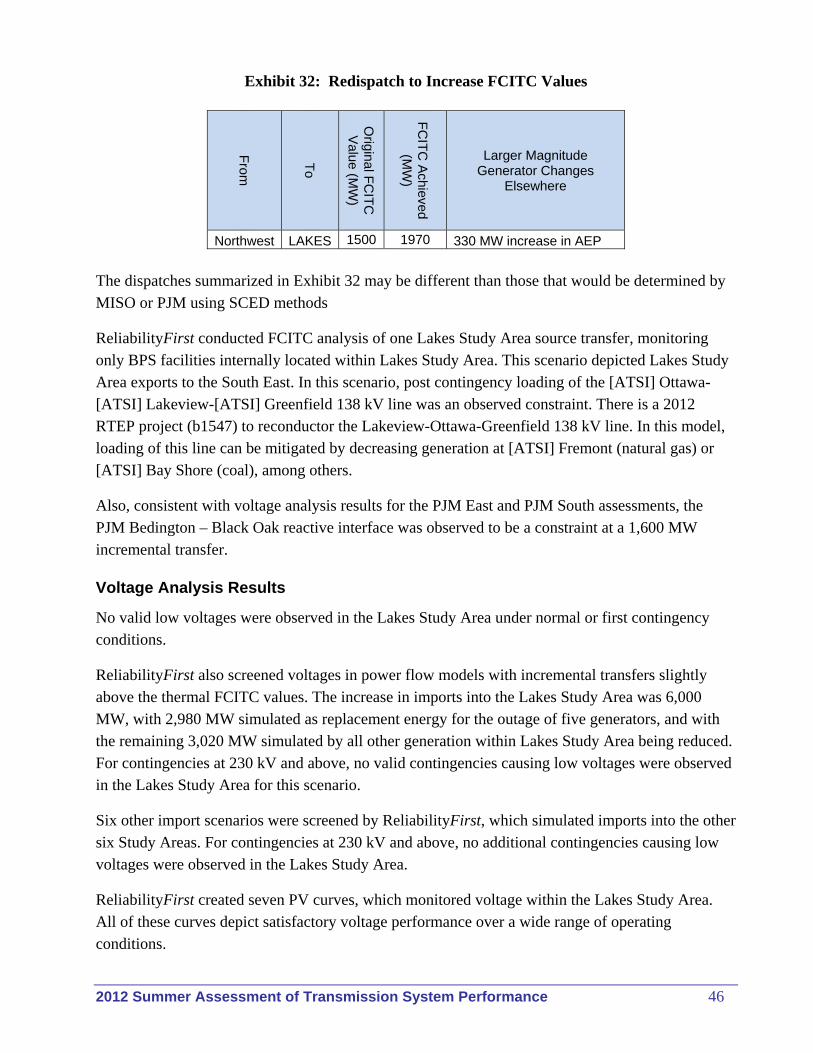
2012 Summer Assessment of Transmission System Performance 46
Exhibit 32: Redispatch to Increase FCITC Values
From
To
Original F
CIT
C
Value (M
W)
FC
ITC
Achieved
(MW
)
Larger Magnitude Generator Changes
Elsewhere
Northwest LAKES 1500 1970 330 MW increase in AEP The dispatches summarized in Exhibit 32 may be different than those that would be determined by MISO or PJM using SCED methods
ReliabilityFirst conducted FCITC analysis of one Lakes Study Area source transfer, monitoring only BPS facilities internally located within Lakes Study Area. This scenario depicted Lakes Study Area exports to the South East. In this scenario, post contingency loading of the [ATSI] Ottawa-[ATSI] Lakeview-[ATSI] Greenfield 138 kV line was an observed constraint. There is a 2012 RTEP project (b1547) to reconductor the Lakeview-Ottawa-Greenfield 138 kV line. In this model, loading of this line can be mitigated by decreasing generation at [ATSI] Fremont (natural gas) or [ATSI] Bay Shore (coal), among others.
Also, consistent with voltage analysis results for the PJM East and PJM South assessments, the PJM Bedington – Black Oak reactive interface was observed to be a constraint at a 1,600 MW incremental transfer.
Voltage Analysis Results
No valid low voltages were observed in the Lakes Study Area under normal or first contingency conditions.
ReliabilityFirst also screened voltages in power flow models with incremental transfers slightly above the thermal FCITC values. The increase in imports into the Lakes Study Area was 6,000 MW, with 2,980 MW simulated as replacement energy for the outage of five generators, and with the remaining 3,020 MW simulated by all other generation within Lakes Study Area being reduced. For contingencies at 230 kV and above, no valid contingencies causing low voltages were observed in the Lakes Study Area for this scenario.
Six other import scenarios were screened by ReliabilityFirst, which simulated imports into the other six Study Areas. For contingencies at 230 kV and above, no additional contingencies causing low voltages were observed in the Lakes Study Area.
ReliabilityFirst created seven PV curves, which monitored voltage within the Lakes Study Area. All of these curves depict satisfactory voltage performance over a wide range of operating conditions.
2012 Summer Assessment of Transmission System Performance 47
Thermal and Voltage Analysis of Stuck Breaker Contingencies (new)
The following thermal loading was observed in the Lakes Study Area.
Constraint: [ATSI] Ottawa-[ATSI] Lakeview-[ATSI] Greenfield 138 kV line Contingency: SLG fault, one of four stuck breaker events at [ATSI] Davis-Besse or [ATSI] Beaver 345 kV Loading: 114% of the 375 MVA emergency rating
In this model, loading of this line can be mitigated by decreasing generation at [ATSI] Fremont (natural gas) or [ATSI] Bay Shore (coal), among others. There is a winter 2012 RTEP project (b1547) to reconductor the Lakeview-Ottawa-Greenfield 138 kV line.
No low voltages were observed in the Lakes Study Area for contingencies involving stuck EHV breakers.

2012 Summer Assessment of Transmission System Performance 48
MISO Southern Indiana Study Area Assessment
Assessment Summary
The MISO Southern Indiana Study Area consists of Duke Energy Indiana (DEI), Hoosier Energy Rural Electric Cooperative, Inc. (HE), Indianapolis Power and Light Company (IPL), and Southern Indiana Gas and Electric Company (SIGE/VECTREN), which defines the central and southern portions of Indiana. The large population centers in the MISO Southern Indiana Study Area are Indianapolis, IN; and Evansville, IN.
The majority of generation within the MISO Southern Indiana Study Area is base load coal-fired units positioned along the western and southern borders of the state of Indiana. This creates a natural south-to-north bias across the area, except for the very southern portion of the state, where there are north-to-south flows across the Ohio River.
The BPS serving the MISO Southern Indiana Study Area is expected to perform well over a wide range of operating conditions, provided that new facilities go into service as scheduled, and that transmission operators take appropriate action to control flows, reactive reserves and voltages.
Thermal Analysis Results
No overloads in the MISO Southern Indiana Study Area were observed under base case and first contingency conditions.
In the sensitivity analysis, a few facilities in the MISO Southern Indiana Study Area were identified for review by ReliabilityFirst, which are:
Constraint: [DEI] LAF Cumberland Ave-[DEI] LAF AE Staley North 138 kV Ckt 1 Contingency: [DEI] Tippecanoe Lab-[DEI] Westwood 2 138 kV Ckt 1 Loading: 85% of the 146 MVA emergency rating,
In this model, the 1096 MW of generation at [AEP] Fowler Ridge (wind) and [AEP] Meadow Lake (wind) was dispatched to 111 MW. In this model, post contingency loading of this line reaches 100% when generation at these two locations increases to approximately 370 MW.
Applying an operating guide, which includes coordinated generation redispatch between MISO and PJM, will relieve loading. Opening the [DEI] Westwood 138345-1 circuit breaker is also included if wind generation is rising too rapidly and line loading is excessive.
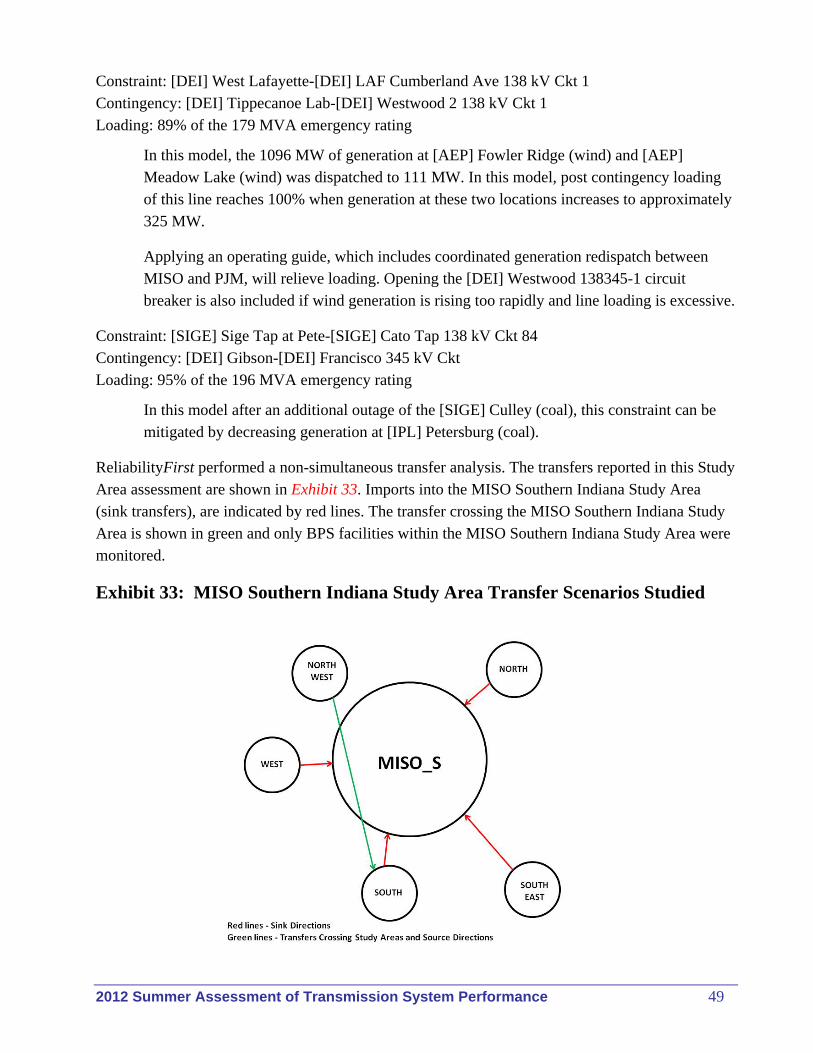
2012 Summer Assessment of Transmission System Performance 49
Constraint: [DEI] West Lafayette-[DEI] LAF Cumberland Ave 138 kV Ckt 1 Contingency: [DEI] Tippecanoe Lab-[DEI] Westwood 2 138 kV Ckt 1 Loading: 89% of the 179 MVA emergency rating
In this model, the 1096 MW of generation at [AEP] Fowler Ridge (wind) and [AEP] Meadow Lake (wind) was dispatched to 111 MW. In this model, post contingency loading of this line reaches 100% when generation at these two locations increases to approximately 325 MW.
Applying an operating guide, which includes coordinated generation redispatch between MISO and PJM, will relieve loading. Opening the [DEI] Westwood 138345-1 circuit breaker is also included if wind generation is rising too rapidly and line loading is excessive.
Constraint: [SIGE] Sige Tap at Pete-[SIGE] Cato Tap 138 kV Ckt 84 Contingency: [DEI] Gibson-[DEI] Francisco 345 kV Ckt Loading: 95% of the 196 MVA emergency rating
In this model after an additional outage of the [SIGE] Culley (coal), this constraint can be mitigated by decreasing generation at [IPL] Petersburg (coal).
ReliabilityFirst performed a non-simultaneous transfer analysis. The transfers reported in this Study Area assessment are shown in Exhibit 33. Imports into the MISO Southern Indiana Study Area (sink transfers), are indicated by red lines. The transfer crossing the MISO Southern Indiana Study Area is shown in green and only BPS facilities within the MISO Southern Indiana Study Area were monitored.
Exhibit 33: MISO Southern Indiana Study Area Transfer Scenarios Studied
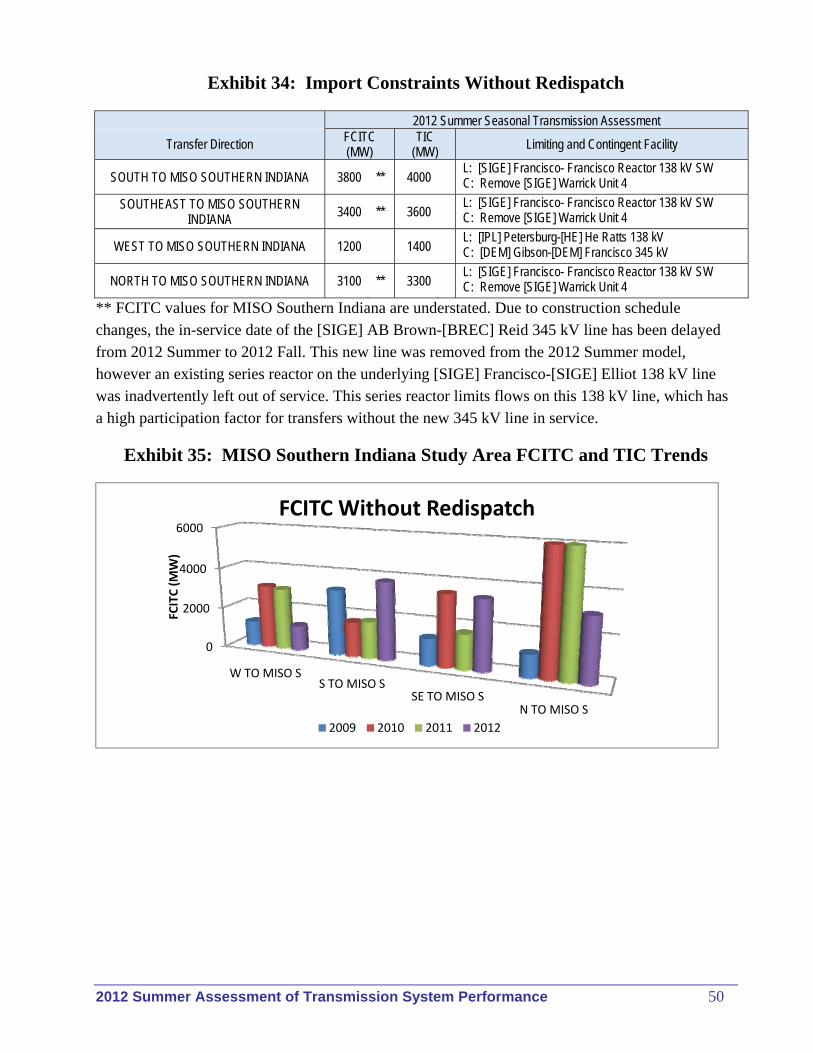
2012 Summer Assessment of Transmission System Performance 50
Exhibit 34: Import Constraints Without Redispatch
2012 Summer Seasonal Transmission Assessment
Transfer Direction FCITC (MW)
TIC (MW)
Limiting and Contingent Facility
SOUTH TO MISO SOUTHERN INDIANA 3800 ** 4000 L: [SIGE] Francisco- Francisco Reactor 138 kV SW C: Remove [SIGE] Warrick Unit 4
SOUTHEAST TO MISO SOUTHERN INDIANA 3400 ** 3600
L: [SIGE] Francisco- Francisco Reactor 138 kV SW C: Remove [SIGE] Warrick Unit 4
WEST TO MISO SOUTHERN INDIANA 1200 1400 L: [IPL] Petersburg-[HE] He Ratts 138 kV C: [DEM] Gibson-[DEM] Francisco 345 kV
NORTH TO MISO SOUTHERN INDIANA 3100 ** 3300 L: [SIGE] Francisco- Francisco Reactor 138 kV SW C: Remove [SIGE] Warrick Unit 4
** FCITC values for MISO Southern Indiana are understated. Due to construction schedule changes, the in-service date of the [SIGE] AB Brown-[BREC] Reid 345 kV line has been delayed from 2012 Summer to 2012 Fall. This new line was removed from the 2012 Summer model, however an existing series reactor on the underlying [SIGE] Francisco-[SIGE] Elliot 138 kV line was inadvertently left out of service. This series reactor limits flows on this 138 kV line, which has a high participation factor for transfers without the new 345 kV line in service.
Exhibit 35: MISO Southern Indiana Study Area FCITC and TIC Trends
0
2000
4000
6000
W TO MISO SS TO MISO S
SE TO MISO SN TO MISO S
FCITC (MW)
FCITC Without Redispatch
2009 2010 2011 2012
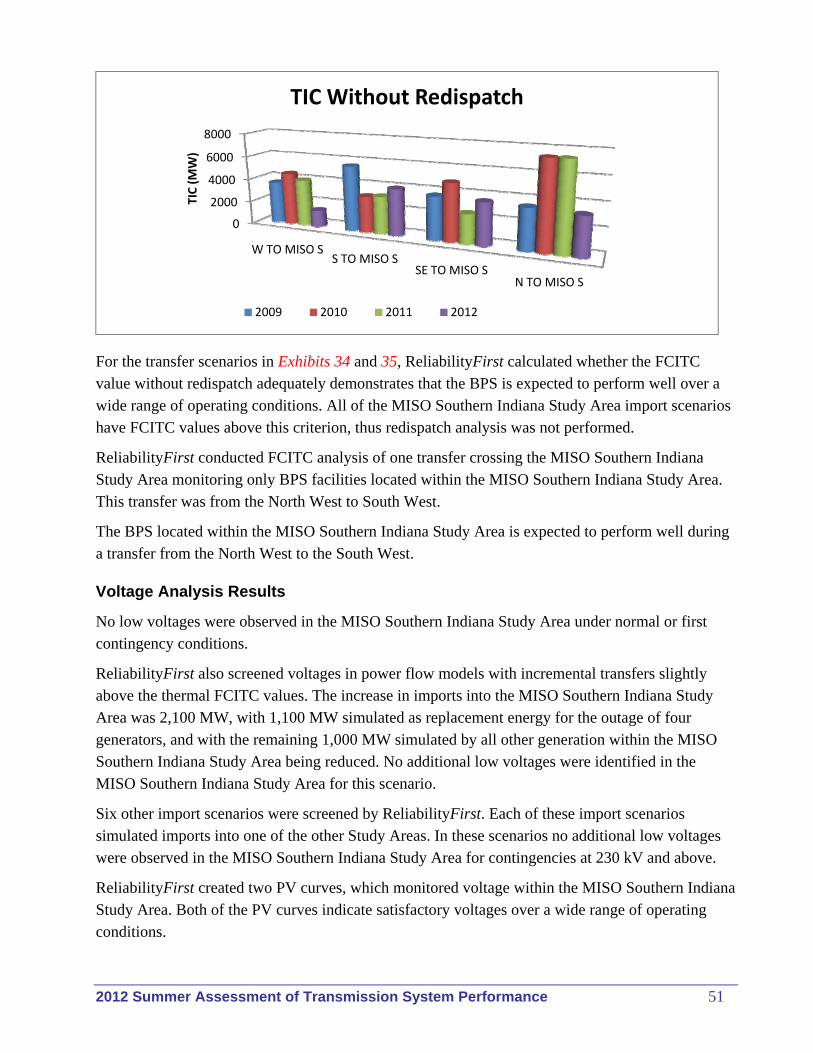
2012 Summer Assessment of Transmission System Performance 51
For the transfer scenarios in Exhibits 34 and 35, ReliabilityFirst calculated whether the FCITC value without redispatch adequately demonstrates that the BPS is expected to perform well over a wide range of operating conditions. All of the MISO Southern Indiana Study Area import scenarios have FCITC values above this criterion, thus redispatch analysis was not performed.
ReliabilityFirst conducted FCITC analysis of one transfer crossing the MISO Southern Indiana Study Area monitoring only BPS facilities located within the MISO Southern Indiana Study Area. This transfer was from the North West to South West.
The BPS located within the MISO Southern Indiana Study Area is expected to perform well during a transfer from the North West to the South West.
Voltage Analysis Results
No low voltages were observed in the MISO Southern Indiana Study Area under normal or first contingency conditions.
ReliabilityFirst also screened voltages in power flow models with incremental transfers slightly above the thermal FCITC values. The increase in imports into the MISO Southern Indiana Study Area was 2,100 MW, with 1,100 MW simulated as replacement energy for the outage of four generators, and with the remaining 1,000 MW simulated by all other generation within the MISO Southern Indiana Study Area being reduced. No additional low voltages were identified in the MISO Southern Indiana Study Area for this scenario.
Six other import scenarios were screened by ReliabilityFirst. Each of these import scenarios simulated imports into one of the other Study Areas. In these scenarios no additional low voltages were observed in the MISO Southern Indiana Study Area for contingencies at 230 kV and above.
ReliabilityFirst created two PV curves, which monitored voltage within the MISO Southern Indiana Study Area. Both of the PV curves indicate satisfactory voltages over a wide range of operating conditions.
0
2000
4000
6000
8000
W TO MISO SS TO MISO S
SE TO MISO SN TO MISO S
TIC (MW)
TIC Without Redispatch
2009 2010 2011 2012
2012 Summer Assessment of Transmission System Performance 52
Thermal and Voltage Analysis of Stuck Breaker Contingencies (new)
The following thermal loading was observed in the MISO Southern Indiana Study Area.
Constraint: [IPL] Hanna 345/138 kV Transformer East Contingency: SLG fault plus stuck breaker at [IPL] Hanna 345 kV Loading: Up to 126% of the 275 MVA emergency rating
In this model, increasing generation at [IPL] Stout (coal and oil) and [IPL] Prichard (coal and oil) could reduce the post contingency loading to 111% of the emergency rating. On an emergency basis, IPL permits these transformers to load to as high as 120% of the 275 MVA emergency rating.
No low voltages were observed in the MISO Southern Indiana Study Area for contingencies involving stuck EHV breakers.
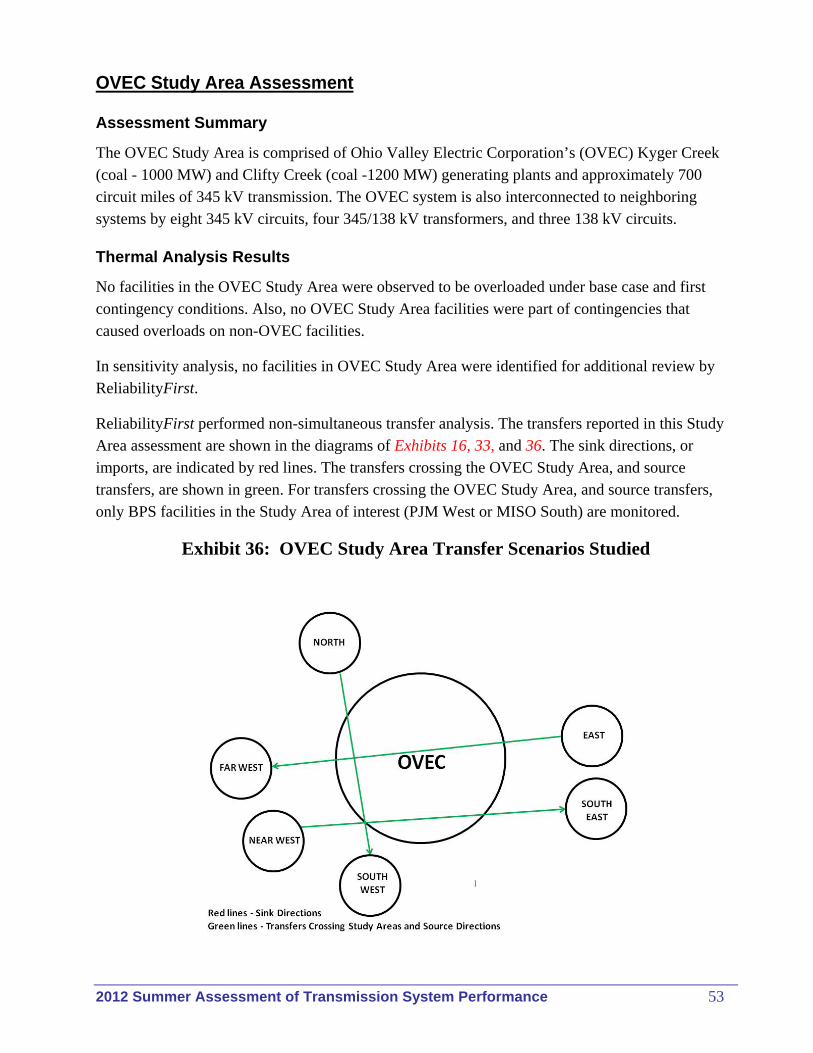
2012 Summer Assessment of Transmission System Performance 53
OVEC Study Area Assessment
Assessment Summary
The OVEC Study Area is comprised of Ohio Valley Electric Corporation’s (OVEC) Kyger Creek (coal - 1000 MW) and Clifty Creek (coal -1200 MW) generating plants and approximately 700 circuit miles of 345 kV transmission. The OVEC system is also interconnected to neighboring systems by eight 345 kV circuits, four 345/138 kV transformers, and three 138 kV circuits.
Thermal Analysis Results
No facilities in the OVEC Study Area were observed to be overloaded under base case and first contingency conditions. Also, no OVEC Study Area facilities were part of contingencies that caused overloads on non-OVEC facilities.
In sensitivity analysis, no facilities in OVEC Study Area were identified for additional review by ReliabilityFirst.
ReliabilityFirst performed non-simultaneous transfer analysis. The transfers reported in this Study Area assessment are shown in the diagrams of Exhibits 16, 33, and 36. The sink directions, or imports, are indicated by red lines. The transfers crossing the OVEC Study Area, and source transfers, are shown in green. For transfers crossing the OVEC Study Area, and source transfers, only BPS facilities in the Study Area of interest (PJM West or MISO South) are monitored.
Exhibit 36: OVEC Study Area Transfer Scenarios Studied
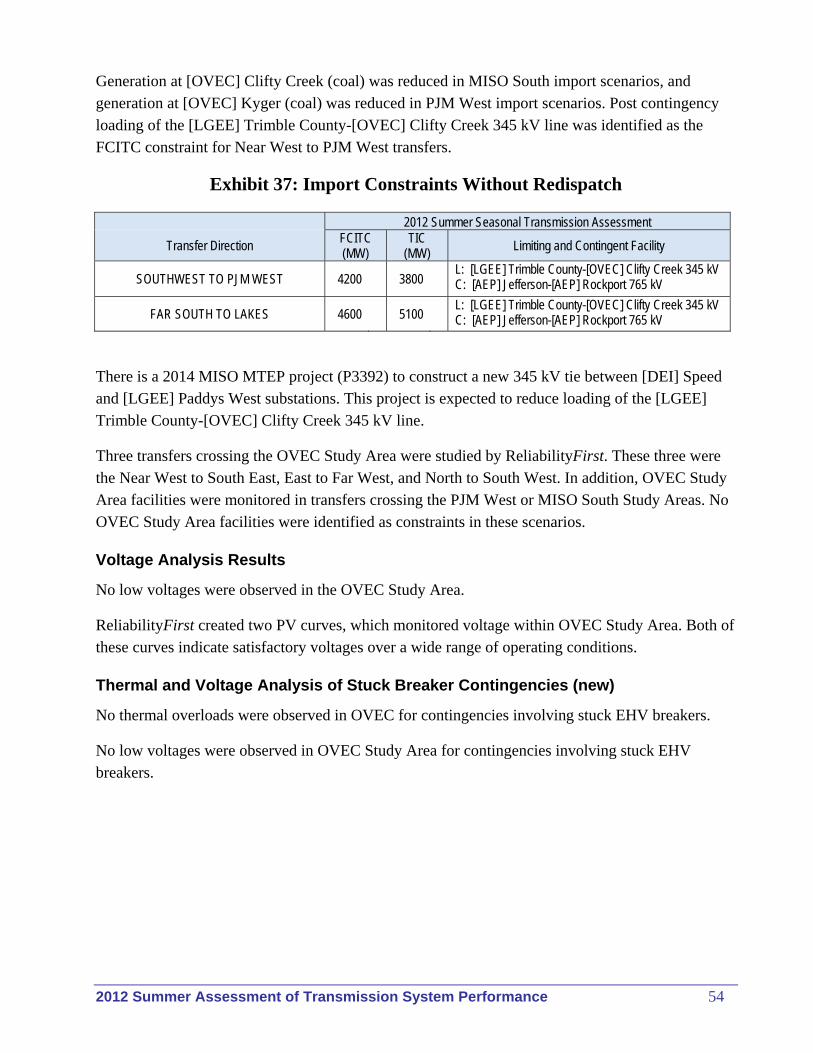
2012 Summer Assessment of Transmission System Performance 54
Generation at [OVEC] Clifty Creek (coal) was reduced in MISO South import scenarios, and generation at [OVEC] Kyger (coal) was reduced in PJM West import scenarios. Post contingency loading of the [LGEE] Trimble County-[OVEC] Clifty Creek 345 kV line was identified as the FCITC constraint for Near West to PJM West transfers.
Exhibit 37: Import Constraints Without Redispatch
2012 Summer Seasonal Transmission Assessment
Transfer Direction FCITC (MW)
TIC (MW)
Limiting and Contingent Facility
SOUTHWEST TO PJM WEST 4200 3800 L: [LGEE] Trimble County-[OVEC] Clifty Creek 345 kV C: [AEP] Jefferson-[AEP] Rockport 765 kV
FAR SOUTH TO LAKES 4600 5100 L: [LGEE] Trimble County-[OVEC] Clifty Creek 345 kV C: [AEP] Jefferson-[AEP] Rockport 765 kV
There is a 2014 MISO MTEP project (P3392) to construct a new 345 kV tie between [DEI] Speed and [LGEE] Paddys West substations. This project is expected to reduce loading of the [LGEE] Trimble County-[OVEC] Clifty Creek 345 kV line.
Three transfers crossing the OVEC Study Area were studied by ReliabilityFirst. These three were the Near West to South East, East to Far West, and North to South West. In addition, OVEC Study Area facilities were monitored in transfers crossing the PJM West or MISO South Study Areas. No OVEC Study Area facilities were identified as constraints in these scenarios.
Voltage Analysis Results
No low voltages were observed in the OVEC Study Area.
ReliabilityFirst created two PV curves, which monitored voltage within OVEC Study Area. Both of these curves indicate satisfactory voltages over a wide range of operating conditions.
Thermal and Voltage Analysis of Stuck Breaker Contingencies (new)
No thermal overloads were observed in OVEC for contingencies involving stuck EHV breakers.
No low voltages were observed in OVEC Study Area for contingencies involving stuck EHV breakers.
2012 Summer Assessment of Transmission System Performance 55
Summary of PJM 2012 Summer Operating Study
The purpose of the PJM Operations Assessment Task Force (OATF) study is to determine the ability of the PJM RTO bulk power transmission system, as it is expected to exist during the 2012 summer peak load period, to be operated reliably according to the principles and guidelines contained within the PJM Manuals. The analysis conducted included steady-state contingency analysis; thermal and reactive, PV analysis on critical interfaces and the ability to support transfers across the PJM network. To assess the system over a range of conditions, analysis was conducted at a higher than anticipated PJM RTO peak load and lower than anticipated generation availability in certain key areas. This PJM section of the RFC report presents the significant findings of the PJM OATF study. The findings are based on the postulated system conditions, which will be different from actual operating conditions due to unplanned generation and transmission outages, the effects of unforeseen weather on load, transaction patterns, circulation and unit availability other than what was simulated in the study.
Overall Assessment
Based on the study results, the PJM RTO bulk power transmission system can be operated reliably during the 2012 summer peak load period in accordance with the operating principles and guidelines contained within the PJM Manuals.
Demand
The PJM RTO 2011 summer peak was 163,762 MW which occurred on July 21, 2011 at hour ending 17:00 EDT. On a weather-normalized basis, the PJM RTO 2011 summer peak forecast was 154,383 MW. The forecast for the PJM RTO 2012 summer peak is 153,782 MW. PJM forecasts the load of the entire RTO and the individual transmission zones on a coincident basis. The non-coincident PJM RTO load of 160,189 MW modeled in the summer base case was derived from the PJM 50/50 summer peak load forecast as published in the PJM Load Analysis Subcommittee (LAS) Report dated January 2012.
Acceptance of Demand Side Management (DSM) resources will continue to the end of May 2012. Approximately 4,000 MW has been accepted already. For the 2011 summer peak period, PJM had 11,600 MW of Demand Side resources available. PJM expects similar amounts for this summer’s peak period and are using last year's actual DSM as this year's forecast. The total amount of Energy Efficiency for the PJM area that is expected to be available on peak for the 2012 summer peak period is 581 MW.
Generation
The total PJM capacity resources expected to be in service during the 2012 summer peak period is 195,398 MW. PJM has no long-term outages of significant generation expected for the 2012 summer peak period. Generator economic dispatch data used in the model was derived from
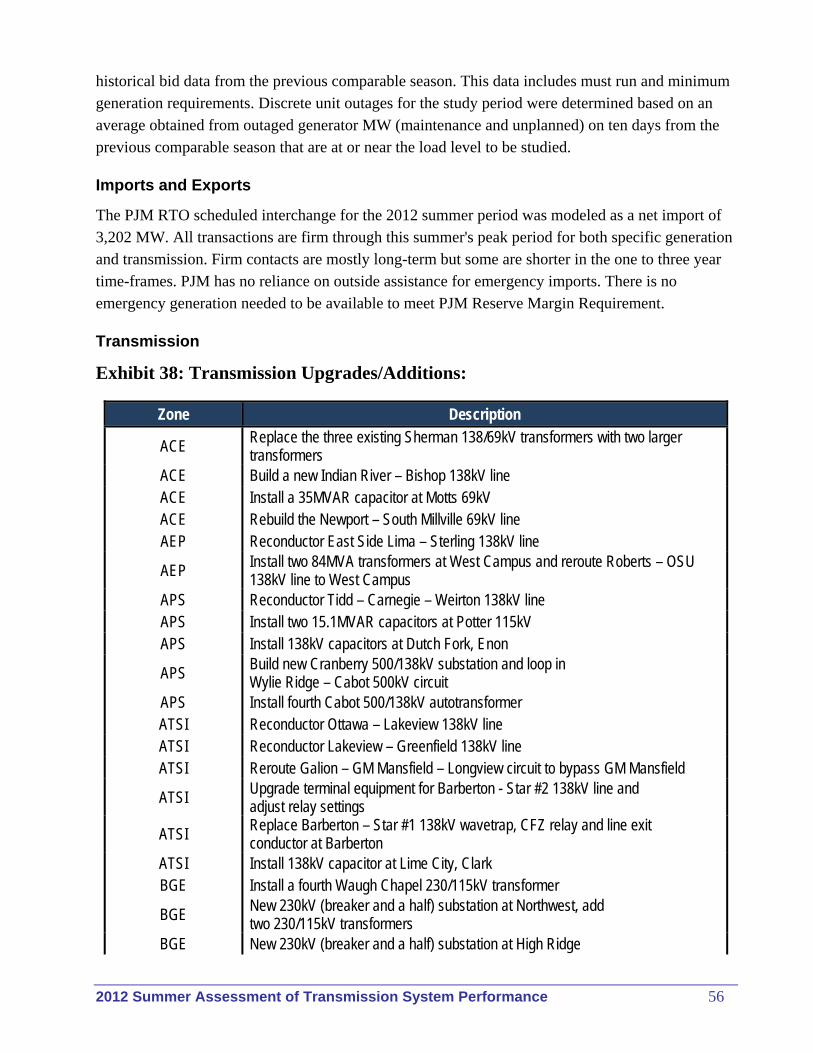
2012 Summer Assessment of Transmission System Performance 56
historical bid data from the previous comparable season. This data includes must run and minimum generation requirements. Discrete unit outages for the study period were determined based on an average obtained from outaged generator MW (maintenance and unplanned) on ten days from the previous comparable season that are at or near the load level to be studied.
Imports and Exports
The PJM RTO scheduled interchange for the 2012 summer period was modeled as a net import of 3,202 MW. All transactions are firm through this summer's peak period for both specific generation and transmission. Firm contacts are mostly long-term but some are shorter in the one to three year time-frames. PJM has no reliance on outside assistance for emergency imports. There is no emergency generation needed to be available to meet PJM Reserve Margin Requirement.
Transmission
Exhibit 38: Transmission Upgrades/Additions:
Zone Description
ACE Replace the three existing Sherman 138/69kV transformers with two larger transformers
ACE Build a new Indian River – Bishop 138kV line ACE Install a 35MVAR capacitor at Motts 69kV ACE Rebuild the Newport – South Millville 69kV line AEP Reconductor East Side Lima – Sterling 138kV line
AEP Install two 84MVA transformers at West Campus and reroute Roberts – OSU 138kV line to West Campus
APS Reconductor Tidd – Carnegie – Weirton 138kV line APS Install two 15.1MVAR capacitors at Potter 115kV APS Install 138kV capacitors at Dutch Fork, Enon
APS Build new Cranberry 500/138kV substation and loop in Wylie Ridge – Cabot 500kV circuit
APS Install fourth Cabot 500/138kV autotransformer ATSI Reconductor Ottawa – Lakeview 138kV line ATSI Reconductor Lakeview – Greenfield 138kV line ATSI Reroute Galion – GM Mansfield – Longview circuit to bypass GM Mansfield
ATSI Upgrade terminal equipment for Barberton - Star #2 138kV line and adjust relay settings
ATSI Replace Barberton – Star #1 138kV wavetrap, CFZ relay and line exit conductor at Barberton
ATSI Install 138kV capacitor at Lime City, Clark BGE Install a fourth Waugh Chapel 230/115kV transformer
BGE New 230kV (breaker and a half) substation at Northwest, add two 230/115kV transformers
BGE New 230kV (breaker and a half) substation at High Ridge
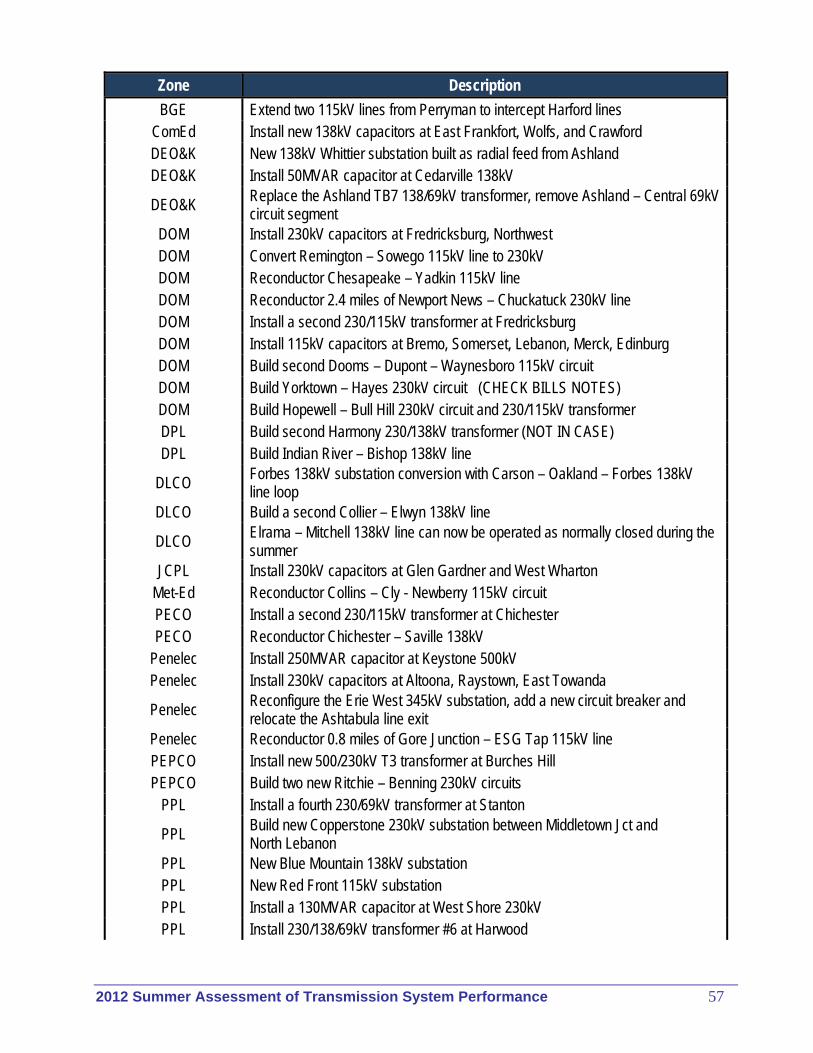
2012 Summer Assessment of Transmission System Performance 57
Zone Description
BGE Extend two 115kV lines from Perryman to intercept Harford lines ComEd Install new 138kV capacitors at East Frankfort, Wolfs, and Crawford DEO&K New 138kV Whittier substation built as radial feed from Ashland DEO&K Install 50MVAR capacitor at Cedarville 138kV
DEO&K Replace the Ashland TB7 138/69kV transformer, remove Ashland – Central 69kV circuit segment
DOM Install 230kV capacitors at Fredricksburg, Northwest DOM Convert Remington – Sowego 115kV line to 230kV DOM Reconductor Chesapeake – Yadkin 115kV line DOM Reconductor 2.4 miles of Newport News – Chuckatuck 230kV line DOM Install a second 230/115kV transformer at Fredricksburg DOM Install 115kV capacitors at Bremo, Somerset, Lebanon, Merck, Edinburg DOM Build second Dooms – Dupont – Waynesboro 115kV circuit DOM Build Yorktown – Hayes 230kV circuit (CHECK BILLS NOTES) DOM Build Hopewell – Bull Hill 230kV circuit and 230/115kV transformer DPL Build second Harmony 230/138kV transformer (NOT IN CASE) DPL Build Indian River – Bishop 138kV line
DLCO Forbes 138kV substation conversion with Carson – Oakland – Forbes 138kV line loop
DLCO Build a second Collier – Elwyn 138kV line
DLCO Elrama – Mitchell 138kV line can now be operated as normally closed during the summer
JCPL Install 230kV capacitors at Glen Gardner and West Wharton Met-Ed Reconductor Collins – Cly - Newberry 115kV circuit PECO Install a second 230/115kV transformer at Chichester PECO Reconductor Chichester – Saville 138kV
Penelec Install 250MVAR capacitor at Keystone 500kV Penelec Install 230kV capacitors at Altoona, Raystown, East Towanda
Penelec Reconfigure the Erie West 345kV substation, add a new circuit breaker and relocate the Ashtabula line exit
Penelec Reconductor 0.8 miles of Gore Junction – ESG Tap 115kV line PEPCO Install new 500/230kV T3 transformer at Burches Hill PEPCO Build two new Ritchie – Benning 230kV circuits
PPL Install a fourth 230/69kV transformer at Stanton
PPL Build new Copperstone 230kV substation between Middletown Jct and North Lebanon
PPL New Blue Mountain 138kV substation PPL New Red Front 115kV substation PPL Install a 130MVAR capacitor at West Shore 230kV PPL Install 230/138/69kV transformer #6 at Harwood
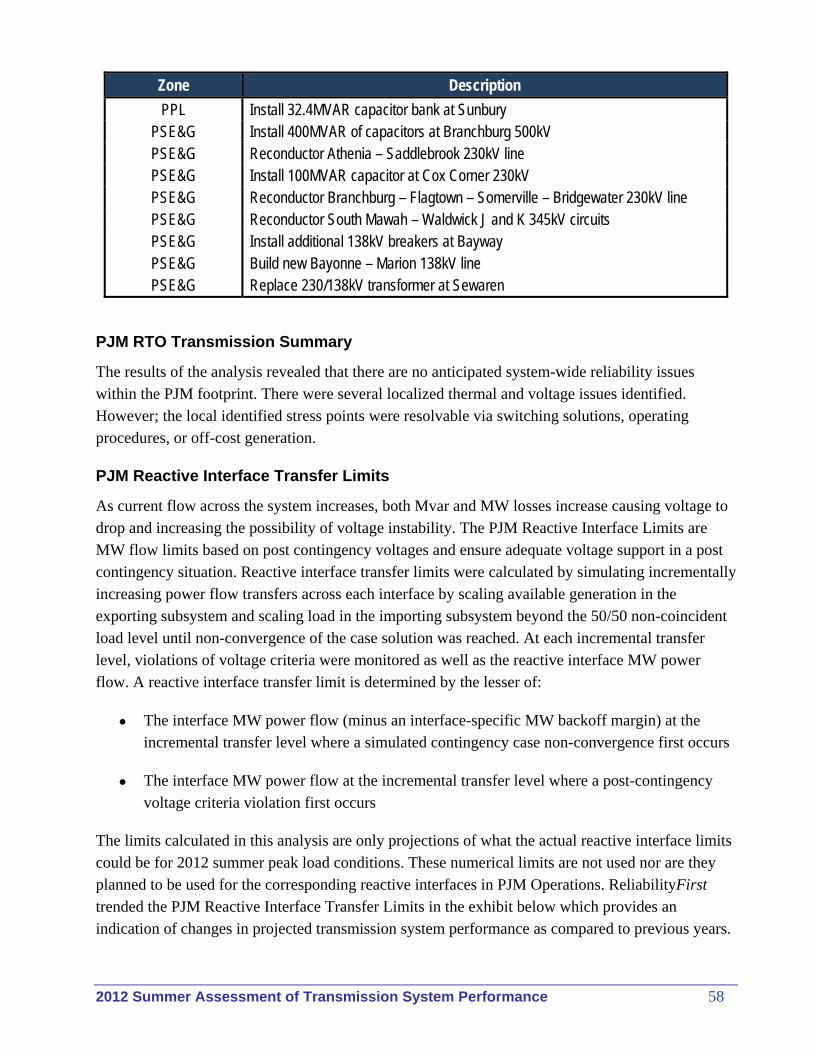
2012 Summer Assessment of Transmission System Performance 58
Zone Description
PPL Install 32.4MVAR capacitor bank at Sunbury PSE&G Install 400MVAR of capacitors at Branchburg 500kV PSE&G Reconductor Athenia – Saddlebrook 230kV line PSE&G Install 100MVAR capacitor at Cox Corner 230kV PSE&G Reconductor Branchburg – Flagtown – Somerville – Bridgewater 230kV line PSE&G Reconductor South Mawah – Waldwick J and K 345kV circuits PSE&G Install additional 138kV breakers at Bayway PSE&G Build new Bayonne – Marion 138kV line PSE&G Replace 230/138kV transformer at Sewaren
PJM RTO Transmission Summary
The results of the analysis revealed that there are no anticipated system-wide reliability issues within the PJM footprint. There were several localized thermal and voltage issues identified. However; the local identified stress points were resolvable via switching solutions, operating procedures, or off-cost generation.
PJM Reactive Interface Transfer Limits
As current flow across the system increases, both Mvar and MW losses increase causing voltage to drop and increasing the possibility of voltage instability. The PJM Reactive Interface Limits are MW flow limits based on post contingency voltages and ensure adequate voltage support in a post contingency situation. Reactive interface transfer limits were calculated by simulating incrementally increasing power flow transfers across each interface by scaling available generation in the exporting subsystem and scaling load in the importing subsystem beyond the 50/50 non-coincident load level until non-convergence of the case solution was reached. At each incremental transfer level, violations of voltage criteria were monitored as well as the reactive interface MW power flow. A reactive interface transfer limit is determined by the lesser of:
The interface MW power flow (minus an interface-specific MW backoff margin) at the incremental transfer level where a simulated contingency case non-convergence first occurs
The interface MW power flow at the incremental transfer level where a post-contingency voltage criteria violation first occurs
The limits calculated in this analysis are only projections of what the actual reactive interface limits could be for 2012 summer peak load conditions. These numerical limits are not used nor are they planned to be used for the corresponding reactive interfaces in PJM Operations. ReliabilityFirst trended the PJM Reactive Interface Transfer Limits in the exhibit below which provides an indication of changes in projected transmission system performance as compared to previous years.
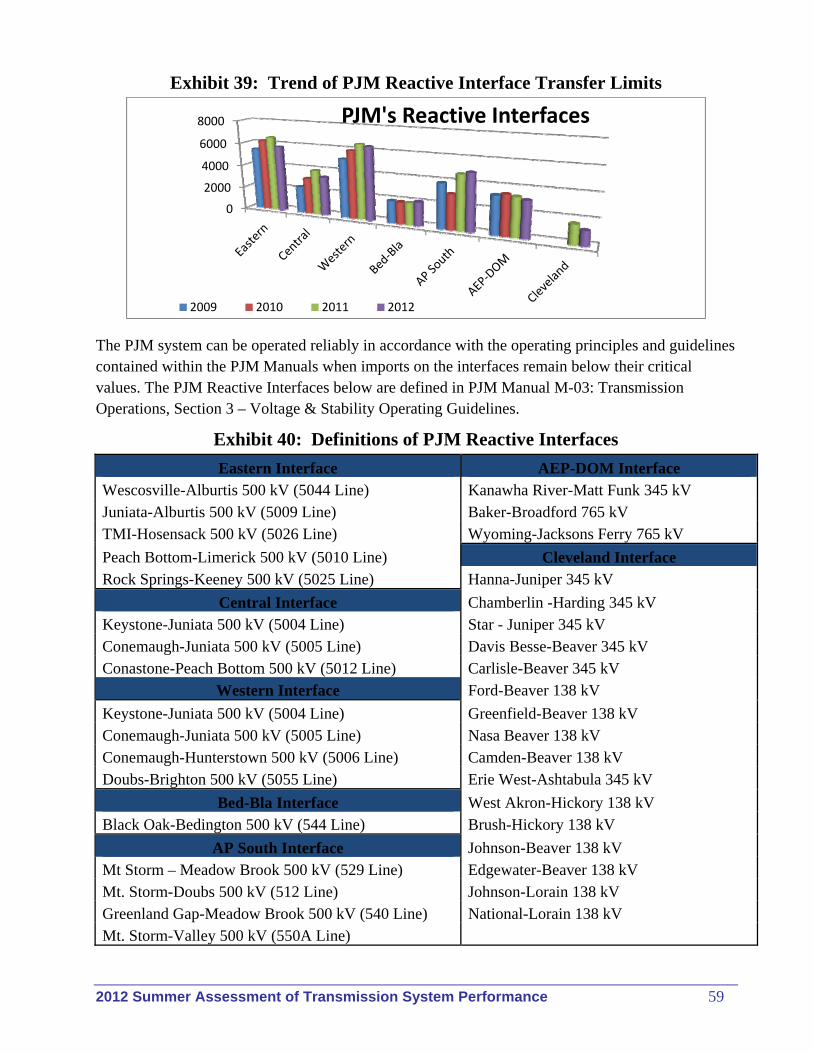
2012 Summer Assessment of Transmission System Performance 59
Exhibit 39: Trend of PJM Reactive Interface Transfer Limits
The PJM system can be operated reliably in accordance with the operating principles and guidelines contained within the PJM Manuals when imports on the interfaces remain below their critical values. The PJM Reactive Interfaces below are defined in PJM Manual M-03: Transmission Operations, Section 3 – Voltage & Stability Operating Guidelines.
Exhibit 40: Definitions of PJM Reactive Interfaces
Eastern Interface AEP-DOM Interface Wescosville-Alburtis 500 kV (5044 Line) Kanawha River-Matt Funk 345 kV Juniata-Alburtis 500 kV (5009 Line) Baker-Broadford 765 kV TMI-Hosensack 500 kV (5026 Line) Wyoming-Jacksons Ferry 765 kV
Peach Bottom-Limerick 500 kV (5010 Line) Cleveland Interface Rock Springs-Keeney 500 kV (5025 Line) Hanna-Juniper 345 kV
Central Interface Chamberlin -Harding 345 kV Keystone-Juniata 500 kV (5004 Line) Star - Juniper 345 kV Conemaugh-Juniata 500 kV (5005 Line) Davis Besse-Beaver 345 kV Conastone-Peach Bottom 500 kV (5012 Line) Carlisle-Beaver 345 kV
Western Interface Ford-Beaver 138 kV
Keystone-Juniata 500 kV (5004 Line) Greenfield-Beaver 138 kV Conemaugh-Juniata 500 kV (5005 Line) Nasa Beaver 138 kV Conemaugh-Hunterstown 500 kV (5006 Line) Camden-Beaver 138 kV Doubs-Brighton 500 kV (5055 Line) Erie West-Ashtabula 345 kV
Bed-Bla Interface West Akron-Hickory 138 kV Black Oak-Bedington 500 kV (544 Line) Brush-Hickory 138 kV
AP South Interface Johnson-Beaver 138 kV Mt Storm – Meadow Brook 500 kV (529 Line) Edgewater-Beaver 138 kV Mt. Storm-Doubs 500 kV (512 Line) Johnson-Lorain 138 kV Greenland Gap-Meadow Brook 500 kV (540 Line) National-Lorain 138 kV Mt. Storm-Valley 500 kV (550A Line)
0
2000
4000
6000
8000 PJM's Reactive Interfaces
2009 2010 2011 2012
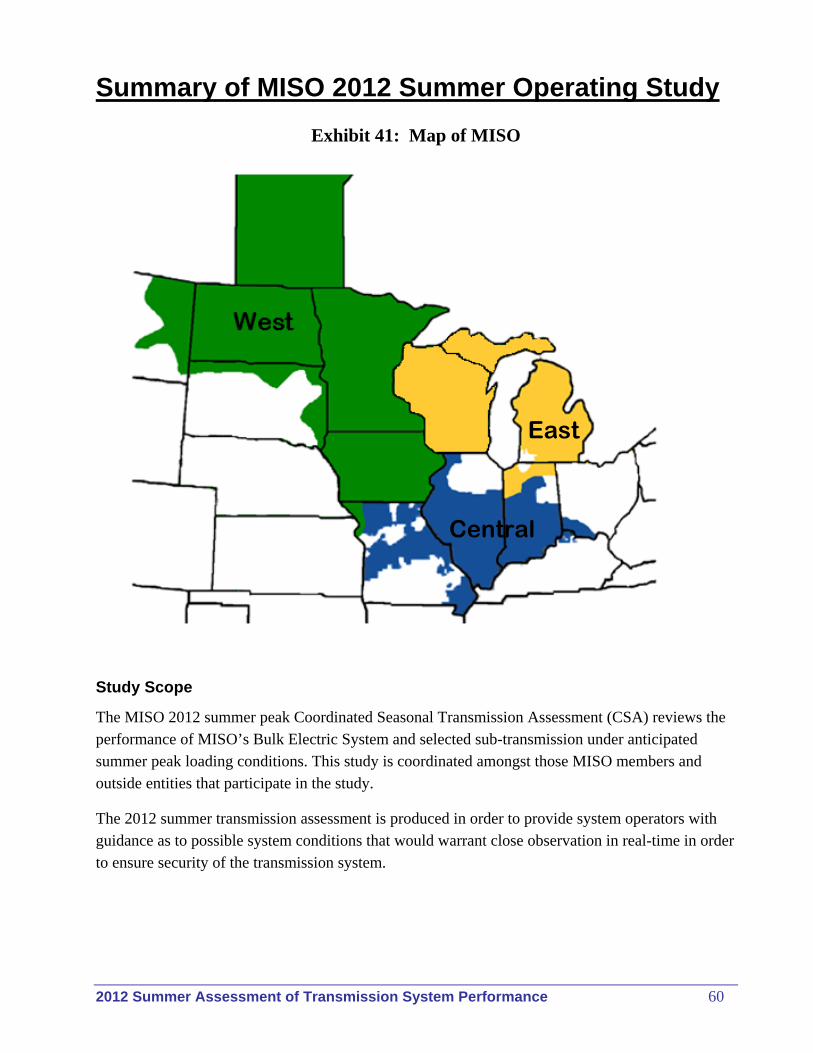
2012 Summer Assessment of Transmission System Performance 60
Summary of MISO 2012 Summer Operating Study
Exhibit 41: Map of MISO
Study Scope
The MISO 2012 summer peak Coordinated Seasonal Transmission Assessment (CSA) reviews the performance of MISO’s Bulk Electric System and selected sub-transmission under anticipated summer peak loading conditions. This study is coordinated amongst those MISO members and outside entities that participate in the study.
The 2012 summer transmission assessment is produced in order to provide system operators with guidance as to possible system conditions that would warrant close observation in real-time in order to ensure security of the transmission system.
East
Central
2012 Summer Assessment of Transmission System Performance 61
The 2012 CSA performed the following transmission system assessments:
Steady State AC contingency analysis of the MISO’s Reliability Coordinator footprint.
Transfer analysis that identifies thermal limitations using First Contingency Incremental Transfer Capability (FCITC) analysis. The list of inter/intra regional transfers considered in the study is shown below:
o MISO Central & East to MISO West o MISO Central & SPP to Northwest & Dakotas o MISO West to MISO Central & Northeast o Southern Indiana to Big River Electric Corporation (BREC) o PJM Northern Illinois to PJM Mid-Atlantic o MISO Illinois & Missouri to SPP/TVA/SOCO/AECI o Illinois to Indiana o South to North into Michigan & Independent Electricity System Operators (IESO) o North to South sourcing from (IESO) o MISO Illinois/Missouri & PJM N. Illinois to EES/TVA/SPP
Critical Interface voltage stability analysis of areas that are either known to experience voltage stability limitations under certain operating conditions or are suspected of having potential voltage stability limitations., The interfaces analyzed are:
o Minnesota-Wisconsin Export Interface (MWEX) o St. Louis East Interface
Large Load Area screening analysis within the MISO footprint for potential voltage instability arising from limited local reactive reserves under severe disturbances and load sensitivities., The Large Load areas covered in this assessment are:
o Vectren and Big Rivers Area o St. Louis Metro Area o Twin Cities Metro Area
Overall Assessment
Based on the study results, the MISO Bulk Electric System can be operated reliably during the summer 2012 peak load period in accordance with the operating principles and guidelines contained within the MISO manuals.
No significant transmission constraints are expected to cause a reliability concern for the upcoming season. No cascading/IROL events are expected in the up-coming season.
2012 Summer Assessment of Transmission System Performance 62
Demand
MISO’s projected non-coincident 2012 summer peak demand in the power flow model used in the transmission assessment is 100,084 MW. This excludes the projected summer peak demand of the Duke Energy Ohio & Kentucky area which is no longer in MISO effective January 1, 2012. Overall, this is an increase of 1,739 MW from the 2011 non-coincident projected summer peak demand of 98,345 MW for the same area in the 2011 summer assessment power flow models. The peak demand numbers represent the non-coincident peak demand of MISO member utilities and not just for RFC areas only. Power flow model control areas of MISO member utilities include loads of other utilities that are not MISO members. Therefore, the demand in the power flow model is not directly comparable to the resource assessment demand forecast for MISO member utilities.
Generation
Total amount of generation available to serve MISO load from internally and externally designated capacity resources during the 2012 summer peak period is 114,475 MW.
No major generation unit outages in the MISO RFC footprint are expected during the 2012 summer peak period.
Interchange
The net scheduled interchange for MISO in the power flow model is -2,157 MW, which indicates a net import of power by the MISO member utilities in the 2012 summer peak.
Steady State Analysis
Category B contingencies were simulated on facilities greater than 100 kV (with the exception of some 69 kV where applicable). Explicitly defined category C contingencies for some MISO control areas were simulated as well as automated bus double branches for MISO control areas for 200 kV and above were simulated.
In general, the MISO BPS is expected to perform adequately. There were 80 facilities in the MISO RFC areas that showed potential loading or voltage issues. All of these issues can be resolved either by system re-dispatch from the base case dispatch used, or by known operating guidelines or operator intervention. MISO Operational personnel and other study participants have been advised of these conditions.
Transfer Capabilities
Transfer analysis is for both intra and inter-regional transfers to/from or across MISO’s footprint. Any transmission facility that exceeded its normal rating under base transfer conditions or its emergency rating under first or multiple contingency conditions with a transfer distribution factor (TDF) greater than or equal to three percent (0.03) were reported.
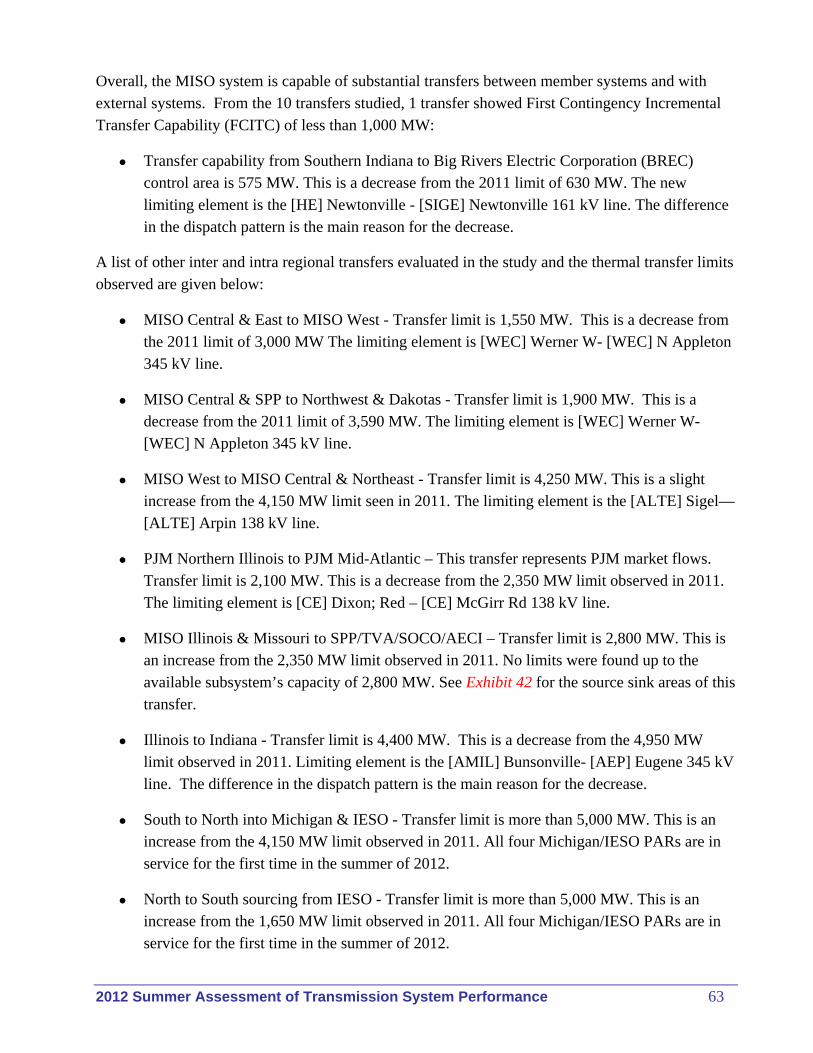
2012 Summer Assessment of Transmission System Performance 63
Overall, the MISO system is capable of substantial transfers between member systems and with external systems. From the 10 transfers studied, 1 transfer showed First Contingency Incremental Transfer Capability (FCITC) of less than 1,000 MW:
Transfer capability from Southern Indiana to Big Rivers Electric Corporation (BREC) control area is 575 MW. This is a decrease from the 2011 limit of 630 MW. The new limiting element is the [HE] Newtonville - [SIGE] Newtonville 161 kV line. The difference in the dispatch pattern is the main reason for the decrease.
A list of other inter and intra regional transfers evaluated in the study and the thermal transfer limits observed are given below:
MISO Central & East to MISO West - Transfer limit is 1,550 MW. This is a decrease from the 2011 limit of 3,000 MW The limiting element is [WEC] Werner W- [WEC] N Appleton 345 kV line.
MISO Central & SPP to Northwest & Dakotas - Transfer limit is 1,900 MW. This is a decrease from the 2011 limit of 3,590 MW. The limiting element is [WEC] Werner W- [WEC] N Appleton 345 kV line.
MISO West to MISO Central & Northeast - Transfer limit is 4,250 MW. This is a slight increase from the 4,150 MW limit seen in 2011. The limiting element is the [ALTE] Sigel—[ALTE] Arpin 138 kV line.
PJM Northern Illinois to PJM Mid-Atlantic – This transfer represents PJM market flows. Transfer limit is 2,100 MW. This is a decrease from the 2,350 MW limit observed in 2011. The limiting element is [CE] Dixon; Red – [CE] McGirr Rd 138 kV line.
MISO Illinois & Missouri to SPP/TVA/SOCO/AECI – Transfer limit is 2,800 MW. This is an increase from the 2,350 MW limit observed in 2011. No limits were found up to the available subsystem’s capacity of 2,800 MW. See Exhibit 42 for the source sink areas of this transfer.
Illinois to Indiana - Transfer limit is 4,400 MW. This is a decrease from the 4,950 MW limit observed in 2011. Limiting element is the [AMIL] Bunsonville- [AEP] Eugene 345 kV line. The difference in the dispatch pattern is the main reason for the decrease.
South to North into Michigan & IESO - Transfer limit is more than 5,000 MW. This is an increase from the 4,150 MW limit observed in 2011. All four Michigan/IESO PARs are in service for the first time in the summer of 2012.
North to South sourcing from IESO - Transfer limit is more than 5,000 MW. This is an increase from the 1,650 MW limit observed in 2011. All four Michigan/IESO PARs are in service for the first time in the summer of 2012.
2012 Summer Assessment of Transmission System Performance 64
MISO Illinois, Missouri & PJM N. Illinois to EES/TVA/SPP - Transfer limit is 4,800 MW. The limiting element is the [AMMO] Palmyra 345/161 kV transformer. This transfer was not performed in 2011.
Exhibit 42: Southern Illinois/Missouri to SPP/AECI/SOCO/TVA Transfer
Large Load Area Analysis
Large load/generation metropolitan areas were defined to be studied. Screening was performed to identify critical contingencies and buses with low voltage issues. The critical contingencies were evaluated on base case conditions as well as select prior outage scenarios. This was done for the 50/50 peak load and for a 90/10 peak along with a 3-5% PF reduction. VQ curves were produced for buses (transmission and, if applicable, sub-transmission) below criteria. VQ curve gives reactive power margin at the tested bus.
The purpose of this analysis is to stress the Bulk Electric System in order to determine if the large load areas have adequate reactive reserves, by subjecting it to multiple contingency events. The three large load areas that were studied showed sufficient reactive reserves for single contingencies, and Category C contingencies with prior unit outages at 50/50 and 90/10 peak load levels, and up to 3% decrease in power factors.
•Vectren & Big Rivers Area – For the Vectren/Big Rivers Large Load Area Analysis, base case scenario and a prior-outage scenario was studied.
2012 Summer Assessment of Transmission System Performance 65
The lowest reactive reserves occurred under the extreme conditions of a prior outage and a category C contingency event under the 90/10 load levels and a 3% power factor reduction.
Voltage Stability Analysis
MISO performed a PV voltage stability analysis on the identified critical areas. For each base and contingent case, the transfer was increased incrementally, and the power flow was solved until a steady-state voltage violation is detected. The analysis was repeated until a voltage collapse is detected. Interfaces critical to the transfer were monitored and plotted against critical bus voltages.
No significant voltage violations were observed.
TLR LMP and PCLLRW Expectations
No concerns expected for summer peak period.
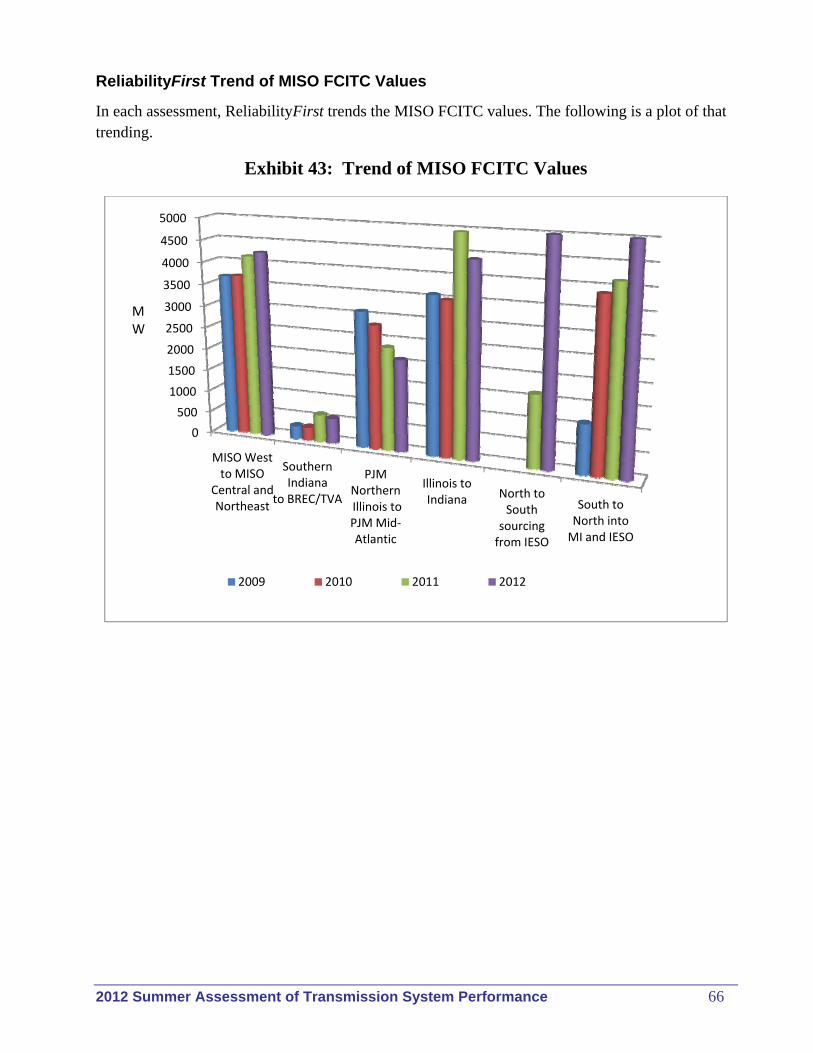
2012 Summer Assessment of Transmission System Performance 66
ReliabilityFirst Trend of MISO FCITC Values
In each assessment, ReliabilityFirst trends the MISO FCITC values. The following is a plot of that trending.
Exhibit 43: Trend of MISO FCITC Values
0
500
1000
1500
2000
2500
3000
3500
4000
4500
5000
MISO West to MISO
Central and Northeast
Southern Indiana
to BREC/TVA
PJM NorthernIllinois to PJM Mid‐Atlantic
Illinois to Indiana North to
South sourcing from IESO
South to North into MI and IESO
2009 2010 2011 2012
MW
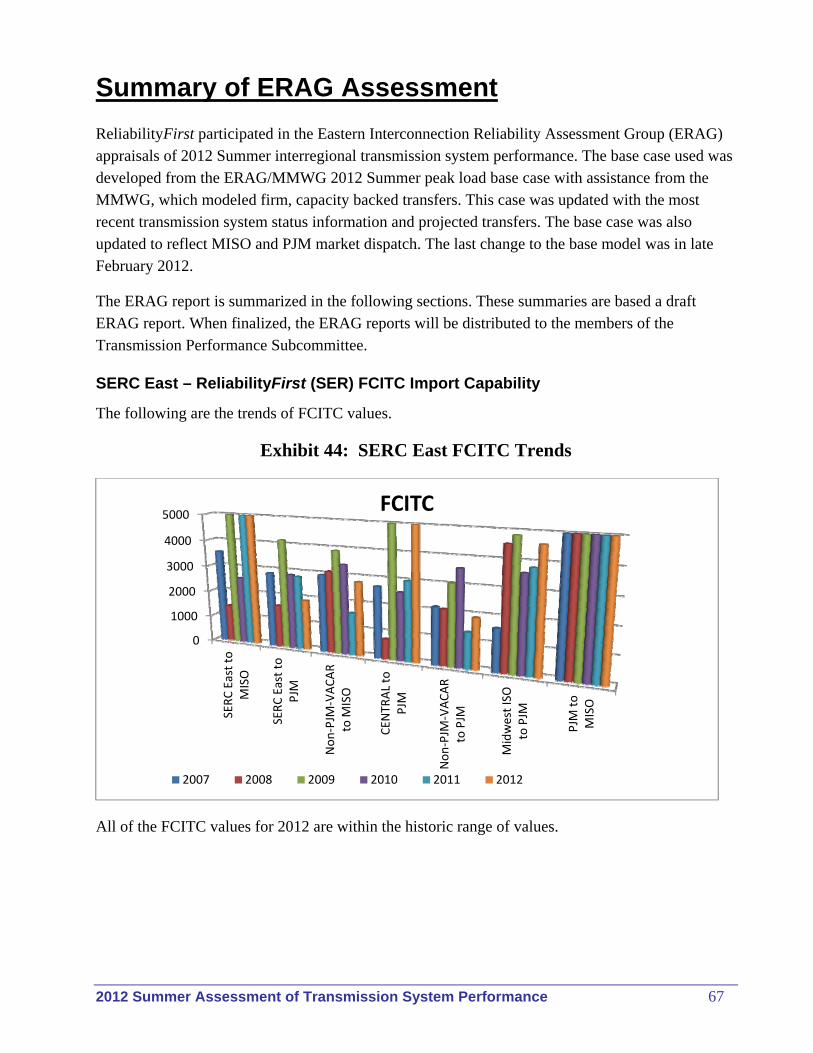
2012 Summer Assessment of Transmission System Performance 67
Summary of ERAG Assessment
ReliabilityFirst participated in the Eastern Interconnection Reliability Assessment Group (ERAG) appraisals of 2012 Summer interregional transmission system performance. The base case used was developed from the ERAG/MMWG 2012 Summer peak load base case with assistance from the MMWG, which modeled firm, capacity backed transfers. This case was updated with the most recent transmission system status information and projected transfers. The base case was also updated to reflect MISO and PJM market dispatch. The last change to the base model was in late February 2012.
The ERAG report is summarized in the following sections. These summaries are based a draft ERAG report. When finalized, the ERAG reports will be distributed to the members of the Transmission Performance Subcommittee.
SERC East – ReliabilityFirst (SER) FCITC Import Capability
The following are the trends of FCITC values.
Exhibit 44: SERC East FCITC Trends
All of the FCITC values for 2012 are within the historic range of values.
0
1000
2000
3000
4000
5000
SERC East to
MISO
SERC East to
PJM
Non‐PJM
‐VACAR
to M
ISO
CEN
TRAL to
PJM
Non‐PJM
‐VACAR
to PJM
Midwest ISO
to PJM
PJM
to
MISO
FCITC
2007 2008 2009 2010 2011 2012
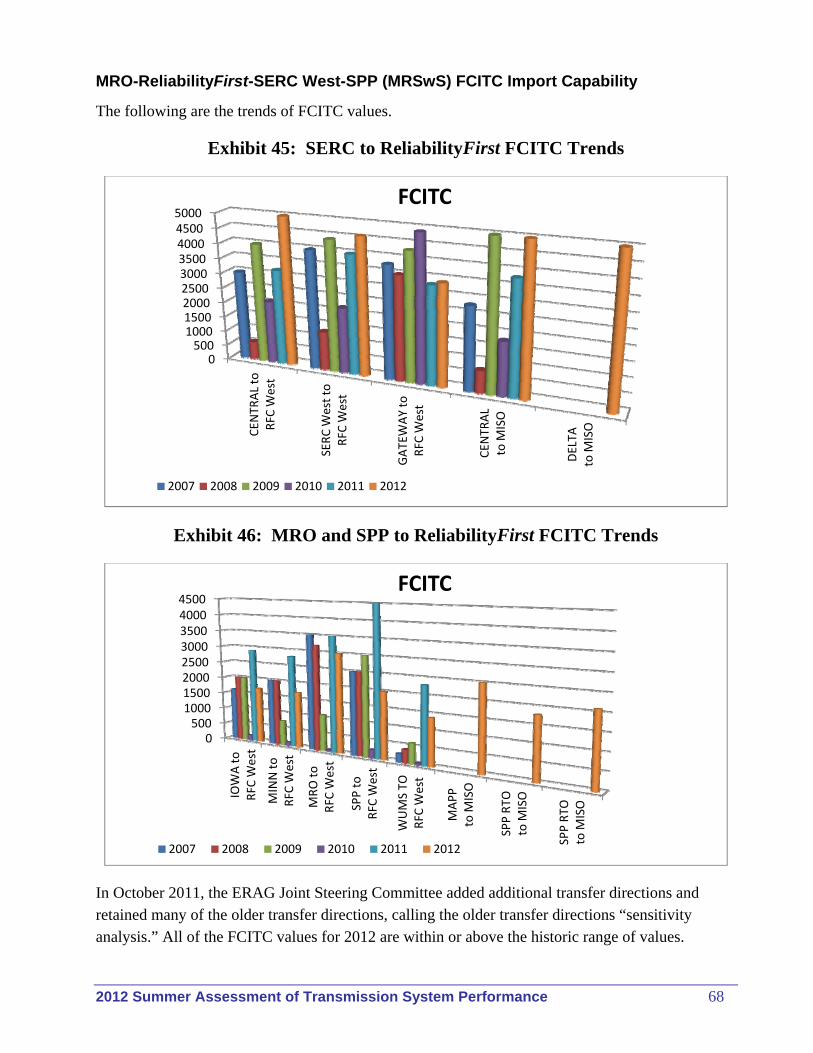
2012 Summer Assessment of Transmission System Performance 68
MRO-ReliabilityFirst-SERC West-SPP (MRSwS) FCITC Import Capability
The following are the trends of FCITC values.
Exhibit 45: SERC to ReliabilityFirst FCITC Trends
Exhibit 46: MRO and SPP to ReliabilityFirst FCITC Trends
In October 2011, the ERAG Joint Steering Committee added additional transfer directions and retained many of the older transfer directions, calling the older transfer directions “sensitivity analysis.” All of the FCITC values for 2012 are within or above the historic range of values.
0500
100015002000250030003500400045005000
CEN
TRAL to
RFC
West
SERC W
est to
RFC
West
GATEWAY to
RFC
West
CEN
TRAL
to M
ISO
DELTA
to M
ISO
FCITC
2007 2008 2009 2010 2011 2012
0500
10001500200025003000350040004500
IOWA to
RFC
West
MINN to
RFC
West
MRO to
RFC
West
SPP to
RFC
West
WUMS TO
RFC
West
MAPP
to M
ISO
SPP RTO
to M
ISO
SPP RTO
to M
ISO
FCITC
2007 2008 2009 2010 2011 2012
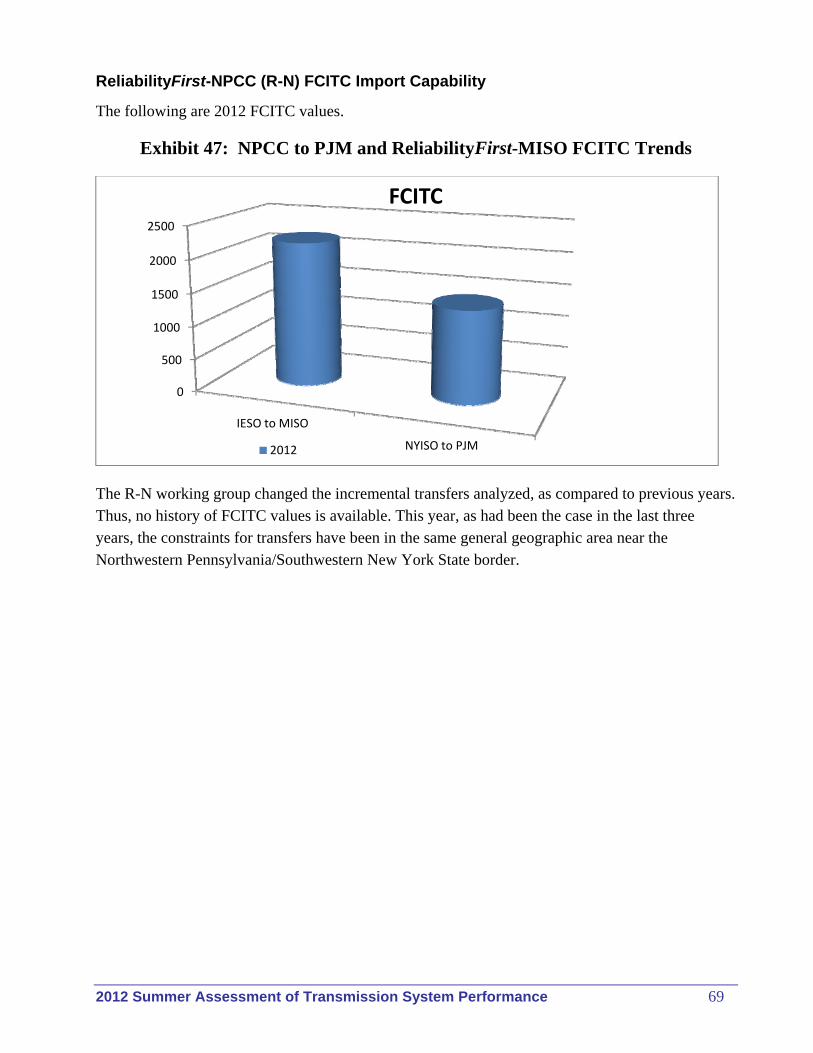
2012 Summer Assessment of Transmission System Performance 69
ReliabilityFirst-NPCC (R-N) FCITC Import Capability
The following are 2012 FCITC values.
Exhibit 47: NPCC to PJM and ReliabilityFirst-MISO FCITC Trends
The R-N working group changed the incremental transfers analyzed, as compared to previous years. Thus, no history of FCITC values is available. This year, as had been the case in the last three years, the constraints for transfers have been in the same general geographic area near the Northwestern Pennsylvania/Southwestern New York State border.
0
500
1000
1500
2000
2500
IESO to MISO
NYISO to PJM
FCITC
2012
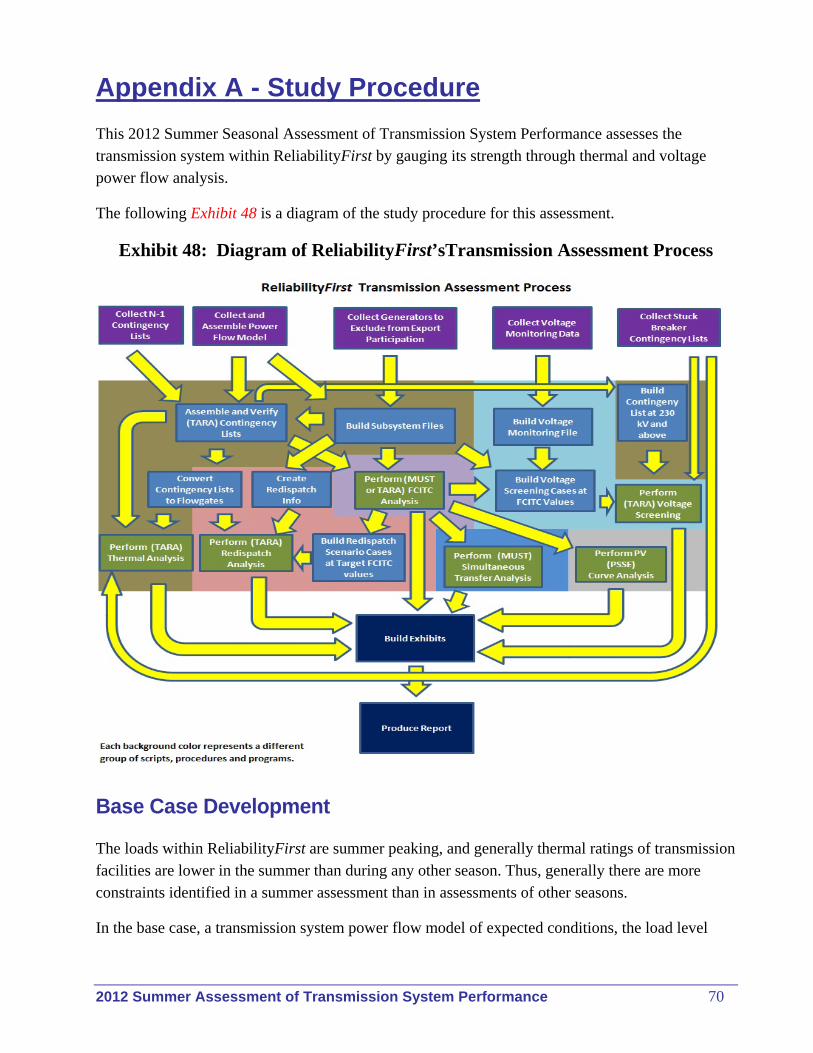
2012 Summer Assessment of Transmission System Performance 70
Appendix A - Study Procedure
This 2012 Summer Seasonal Assessment of Transmission System Performance assesses the transmission system within ReliabilityFirst by gauging its strength through thermal and voltage power flow analysis.
The following Exhibit 48 is a diagram of the study procedure for this assessment.
Exhibit 48: Diagram of ReliabilityFirst’sTransmission Assessment Process
Base Case Development
The loads within ReliabilityFirst are summer peaking, and generally thermal ratings of transmission facilities are lower in the summer than during any other season. Thus, generally there are more constraints identified in a summer assessment than in assessments of other seasons.
In the base case, a transmission system power flow model of expected conditions, the load level
2012 Summer Assessment of Transmission System Performance 71
represented is the summation of the forecast peak loads of the individual member systems, resulting in modeled loads being higher than those reported in resource assessments. Using non-coincidental operating company peak loads is intentional, because it tests the system beyond the most likely conditions. This load modeling is representative of an 80/20 load forecast for MISO or PJM, which is an 80% probability that actual peak load levels will be lower, and a 20% probability that loads will be higher than modeled, and is representative of a 50/50 load forecast for individual transmission owners.
The base case utilized for this study was updated from the 2011 Series ERAG Multiregional Modeling Working Group (MMWG) case by the transmission owners, and the generation dispatched using a Security Constrained Economic Dispatch (SCED) by MISO and PJM. The Seasonal working group also had the opportunity to update and correct the model based on preliminary thermal and voltage analysis results. The transfers modeled in this base case represent projected firm transactions.
Monitored Facilities
In this assessment the monitored areas for import scenarios included all of ReliabilityFirst and the areas immediately adjacent to ReliabilityFirst, thus accounting for any inter-regional loop flows.
Contingencies Analyzed
The NERC performance criteria for Category B (single contingency) events dictates that the system remain stable and operate within both applicable thermal and voltage ratings, without curtailment of firm transfers or cascading outages.
Planned or controlled interruption of electric supply to radial customers, or some local network customers, connected to or supplied by the faulted element, or by the affected area, may occur in certain areas without impacting the overall reliability of the interconnected transmission systems. To prepare for the next contingency, system adjustments are permitted, including curtailments of contracted firm (non-recallable) electric power transfers.
The NERC Category B contingencies are defined as:
B-1 Generator, three phase, single line to ground (SLG), or no fault, normal clearing B-2 Transmission element, three phase, single line to ground, or no fault, normal clearing B-3 Transformer, three phase, single line to ground, or no fault, normal clearing B-4 Single pole (dc) line, normal clearing
For this study, ReliabilityFirst requested contingency lists from the Transmission Owners which were self- reported to include all valid NERC Category B-2 and B-3 (transmission and transformer) events for facilities operating at 100 kV or higher. ReliabilityFirst staff provided a contingency list for NERC Category B-1 (generator) events at 200 MVA and above. The ReliabilityFirst

2012 Summer Assessment of Transmission System Performance 72
contingency list is a composite of lists provided by Transmission Owners and written by ReliabilityFirst staff.
In the recently adopted NERC Standard TPL-001-2, a Category P4 event is defined as a multiple contingency caused by a stuck breaker attempting to clear a fault on a generator, transmission circuit, transformer, shunt device or bus section. No interruption of firm transmission service, and no non-consequential load is to be permitted for Category P4 events on EHV facilities (300 kV and above) once all of the requirements in the standard are rolled in. This 2012 Summer assessment is the first in which ReliabilityFirst evaluated Category P4 events.
Use of Operating Guides
One or more operating guides may be assumed to be available or implemented to obtain the transfer capability levels reported. However, depending on the specific outage, implementation of other related operating guide(s) could be required. Some of these operating guides have been in use for a considerable period of time. The operating guides identified in this study have been verified by the Seasonal Working Group and are considered effective, to a varying extent, in relieving the loadings on the constraining transmission facilities and increasing transfer capabilities.
For this study, the operating guides were assumed available for all transfer directions, and were utilized if transfer capability is increased. If an operating guide does not increase transfer capability, then the guide was not used in thermal analysis.
No analysis of the effectiveness of operating guides to mitigate stuck breaker contingencies, NERC Category P4, was performed.
ReliabilityFirst Assessment Method
ReliabilityFirst’s approach to transmission studies consists of a series of thermal and voltage analyses, several of which are designed to stress the BPS beyond minimum planning and operating criteria. As a result, constraints identified in this assessment are not necessarily an indication of a need for transmission reinforcements due to violation of NERC TPL Reliability Standards.
Although this assessment attempted to stress the ReliabilityFirst transmission systems in many different ways, it is not possible to anticipate all possible operating conditions. The transfer capabilities and voltage levels documented in this report are based on only one set of forecast conditions for the period under study, they should not be considered absolute or optimal. Transfer capabilities can and do vary significantly as load levels, specific generation, transmission, and scheduled transfer conditions change. Therefore, this report should only be used as a guide for conditions that may arise during the 2012 Summer peak load season.
This report does not define absolute transfer capabilities or voltage levels, but rather identifies facilities that could constrain transfers and provides a measure of the level of transfers that can be
2012 Summer Assessment of Transmission System Performance 73
supported between various Study Areas. Because of the impracticality of studying all possible system operating conditions, transfer constraints above or below the transfer capabilities reported herein may occur under certain real-time operating conditions. Furthermore, it is possible that some load cannot be served under certain unusual, real-time operating conditions.
Thermal Analysis
Thermal analysis is a comparison of facility loadings under varying operating conditions to their applicable thermal ratings. Thermal ratings and facility loadings are expressed in terms of MW or MVA. The study attempted to identify an operating edge and robustness of the transmission system by identifying constraints to various simulated transfers and scenarios.
Six different tests were used to perform thermal analysis on the base case.
Thermal Overloads for Base Case and First Contingency Conditions
The objective of the first test is to identify overloads under base case (NERC Category A) and first contingency (NERC Category B) conditions. These overloads identified are sometimes symptoms of local area problems that may require close monitoring during the upcoming peak load season. The ratings used for linear analysis in this examination are MVA ratings that have not been adjusted downward to account for Mvar flow. The percent loadings are calculated using MW flow and MVA ratings. When linear analysis identified an overload, a full power flow solution was performed to confirm that overload.
Sensitivity Analysis of Thermal Overloads for Base and First Contingency Conditions
The second test was sensitivity analysis of thermal loading under system normal (NERC Category A) and first contingency (NERC Category B) conditions for a change in generation dispatch or availability. It is a screening of N-1-1 contingencies (NERC Category C) where one of the contingencies is the outage of a generator. The objectives of sensitivity analysis calculations are 1) to determine the ability to mitigate base case and first contingency overloads with generation dispatch and 2) to provide a means of measuring the likelihood of an overload. Sensitivity analysis should not be construed to signify probability of occurrence because it is a deterministic function, and a localized departure from the MISO and PJM provided economic dispatch.
In this assessment, the constraint identification in the sensitivity analysis was based upon dispatching generation near the constraint (response factor over 5%) of helper and harmer to 85% of dispatchable capability, which corresponds, roughly, to the average generation loading within ReliabilityFirst in the original base case. This screening identifies numerous constraints, many of were assigned a relatively low likelihood scoring by the screening program. Only the constraints with a high likelihood scoring are evaluated in this assessment.
2012 Summer Assessment of Transmission System Performance 74
First Contingency Incremental Transfer Capability (FCITC) Analysis
The third test examined the ability of the transmission system to support simulated non-simultaneous power transfers in many directions. The objective of this third test is to identify an operating edge of the transmission system by identifying constraints to various simulated transfers. For this study, ReliabilityFirst was divided into multiple internal Study Areas. Likewise, the neighboring Regions were divided into multiple external Areas. This division of the markets into Study Areas was performed with the assistance of MISO, PJM, and the Transmission Owners. Except for the PJM Northern Illinois Study Area, these Study Areas encompassed multiple load serving areas. The results in this report were determined using these internal and external Study Areas to simulate 30 different import transfer scenarios.
Transfers were simulated by increasing pre-selected generation and decreasing load, if needed, in one Study Area and decreasing generation in another, using a non-market dispatch without consideration of the best utilization of resources to meet reliability requirements. The transfers were overlaid on the projected seasonal peak load conditions and were designed to stress the ReliabilityFirst BPS. Because they were selected to stress the BPS, these transfers were not intended to reflect typical or projected generation availability. Therefore, these transfers should not be construed as being normal or projected operating conditions. Often, a reliability constrained economic redispatch of available resources can result in higher FCITC values.
FCITC cannot be used as an absolute indicator of the capability of a power system; FCITC is only determined for specific system conditions represented in the study case. Any changes to study case specific conditions, such as: variations in generation dispatch, system configuration, load, or other transfers not modeled in the study case can significantly affect level of determined transfer capability.
Using linear power flow analysis techniques, NERC Category B contingencies were modeled in conjunction with the various power transfers to determine the FCITC of the ReliabilityFirst network.
PARs are non-linear devices that control MW flows, and their operation has to be simplified in a linear analysis. In the FCITC assessment, they are treated as constant angle devices, which most accurately simulate flows in the time period between when a contingency occurs, and the PARs begin to respond to the changed conditions.
Omitted from the FCITC based exhibits are all the events listed that were noted as having a power transfer distribution factor (PTDF) or outage transfer distribution factor (OTDF) below three percent, as having an operating guide, special protection system, or switching procedure that could be used to increase transfer capability, or flows that were directly controlled by a PAR. Both non-simultaneous Normal Incremental Transfer Capability (NITC) and FCITC calculations assume that there are no other transfers taking place other than those described in the base interchange table.
2012 Summer Assessment of Transmission System Performance 75
When FCITC values are above the threshold established by the Transmission Performance Subcommittee the ability the market may have to mitigate the transfer constraint was not considered in the calculation of the transfer capabilities documented in this report. Thus, there may be no direct comparison between the constraints observed using these Study Areas and the reliability analyses conducted by the RTOs using a security constrained market dispatch to mitigate those transmission constraints.
Generation Redispatch Analysis
The fourth type of thermal analysis is generation redispatch analysis. While FCITC analysis can be an appropriate analytical tool, the FCITC values almost always understate the ability serve load by mitigating transmission constraints with generation redispatch.
When FCITC values are below the threshold established by the Transmission Performance Subcommittee, the ability the market may have to mitigate the transfer limit was considered. This was performed using TARA's Security Constrained Redispatch (SCRD) function. A power flow model was built with a transfer above the threshold, and SCRD was used to calculate the least change in generation levels required to make the model secure for first contingencies. The results of this analysis are summarized in this report as an increased FCITC value. Additional details supporting this summary were provided to the Transmission Owners and Planners.
In the SCRD analysis, adjustments to selected PARs were made to increase FCITC values. Also, any facilities that were overloaded for base case or first contingency conditions in the base case were ignored, unless they were identified as a transfer limit in the FCITC analysis.
For each of the transfers analyzed with SCRD, the transmission planners were provided with the binding constraints and associated shadow prices, as well as a listing of the individual generators redispatched. In this analysis, Wind generation is permitted to be decreased, but not increased, to mitigate transmission constraints. ReliabilityFirst used SCRD, minimizing the change in generator MW, to evaluate the effectiveness of redispatch, MISO and PJM use SCED, minimizing the increase in costs, in their analysis, and thus there may be no direct comparison of the generator adjustments identified in this assessment with those identified in MISO and PJM assessments.
For SCRD, shadow price is a measure of the MW of redispatch required to decrease the constraint flow by 1 MW. The value of the shadow price can provide Transmission Planners and Planning Authorities powerful insight into problems. In this SCRD analysis, a relatively small shadow price, (generally below 20.0), would indicate an effective redispatch. Large shadow prices, (generally over 100.0) would indicate that while redispatch may be possible to mitigate the constraint, that other alternatives should be considered, if the target FCITC value is to be achieved.
Thermal Simultaneous Transfer Capability
The fifth type of thermal analysis performed is simultaneous transfer analysis. The objective of
2012 Summer Assessment of Transmission System Performance 76
simultaneous transfer analysis is to identify additional transmission constraints that may result from transfers occurring simultaneously. In this analysis the magnitude of two different transfers are varied, and the resulting constraints with over three percent PTDF/OTDF values are identified. This analysis demonstrates the interdependencies of FCITC values, and shows that two FCITC values cannot simply be added together to provide a meaningful number.
Thermal Non-Simultaneous Source and Transfers Crossing Study Area Scenarios
The sixth type of thermal analysis was FCITC analysis of transfers crossing Study Areas and source transfers. The objective of these tests is to identify an operating edge of the transmission system within selected Study Areas by identifying constraints to various simulated transfers. The transfers crossing Study Areas and source transfers are scenarios where there was not agreement among the members of the Transmission Performance Subcommittee on the importance of the transfer in assessing the BPS. For these transfers, only a portion of the BPS is monitored, and instead of selecting FCITC constraints, representatives of the Working Group of the Study Area being monitored review the FCITC results and make observations.
Voltage Analysis
Voltage analysis is a review of applicable voltage ratings and performance under varying operating conditions. Voltage ratings and performance are expressed in terms of kV or Per Unit voltage. The study attempted to identify an operating edge and robustness of the transmission system by identifying voltage drop for various simulated transfers and scenarios. This typically involved stressing the transmission system beyond planning and operating criteria. Given the more stringent testing criteria utilized in this assessment, the transmission voltage constraints identified in this study are not necessarily an indication of a need for transmission reinforcements due to violation of planning or operating criteria/standards.
For nearly all system contingencies, different parts of the power system will experience changes in voltages. In some areas voltages rise, while in others voltages will fall. Usually equipment and system operators are able to adjust the voltages to maintain acceptable levels. If voltages rise too much however, equipment can be damaged due to insulation or other hardware failures. If the voltages fall too low, portions of the BPS may become uncontrollable, and voltage will continue to decline, resulting in a blackout. The greatest risk is usually to an importing area where the lowest voltages may be experienced.
Three different tests were used to perform voltage analysis on the base case.
Voltage Screening Under Base Case and First Contingency Conditions
The objective of voltage screening under base case and first contingency conditions is to identify voltage issues. These voltage issues are sometimes symptoms of local area problems that may require close monitoring during the upcoming peak load season. All contingencies of facilities with
2012 Summer Assessment of Transmission System Performance 77
at least one terminal operating at 230 kV or higher in the ReliabilityFirst contingency list were analyzed to determine if any voltage criteria violations exist. Each transmission owner has supplied their voltage criteria.
Voltage Screening at Thermal Non-Simultaneous Transfer Capability Levels
For each Study Area analyzed, a selected thermal import transfer scenario was studied for voltage limits. The objective of voltage screening at thermal non-simultaneous thermal import capability is to establish a relationship between thermal and voltage performance of the BPS. All contingencies of facilities with at least one terminal operating at 230 kV or higher in the ReliabilityFirst contingency list were applied to this model. Each transmission owner was requested to supply their voltage criteria.
For each selected transfer into a Study Area, generation outages were identified for the importing area that sum to approximately 50 percent of the thermal FCITC import limit. No complete generating station outages were taken unless that station was on a single radial transmission line. These generator outages stress the system from a reactive perspective. In some instances, where local generation would be dispatched after a contingency occurs, this stress may be beyond those typically encountered.
An AC power flow model for transfers into each Study Area was developed with the generator outages as described above. The transfer level being studied was the highest of the following: 10 percent above the thermal transfer constraint, the thermal transfer constraint plus 200 MW, or equal to the amount of generation being outaged if a single generator outage was greater than the previous levels. By modeling a transfer level slightly greater than the identified thermal constraint, when no voltage constraint is identified we have confirmed that there is a margin between the thermal transfer constraint and the nose of a PV curve.
The difference between the transfer level and the MW of generator outages was modeled by scaling down all other on-line generation in the importing Study Area. The source points used to simulate the transfer were the same as used in the linear FCITC analysis.
PV Curve Scenarios Resulting from Operating or Planning Experience
The primary objective of PV curve analysis is to verify that the transmission owners’ voltage criteria are sufficient to prevent voltage instability. A number of PV curves were selected for study based on the potential for voltage limitations that had been identified through past operating or planning experience. Increasing power transfers were modeled across the area of interest in order to stress the transmission network.
In those scenarios that involved the outage of one or more generating units, it was recognized that the source of replacement generation could impact study results. Replacement generation was selected outside the area of interest and located in a direction that increased the level of power transfer in the same direction as the incremental transfer applied as part of the analysis. This was

2012 Summer Assessment of Transmission System Performance 78
done to ensure that the replacement generation did not counteract the incremental transfer stress on the system being studied.
The process for creating PV curves entails building a power flow model with transmission and generation facility outages known to negatively impact voltage performance. Then a series of models with increasing stress on voltage performance were created. This stress was applied in the form of increasing power transfers. Voltage was then monitored in each of these models at a bus that is indicative of area voltage performance. The series of models normally ended beyond the point where the low voltage operating limit was reached, and often continues until reaching the nose of the curve, which is an unstable operating condition.
In addition to monitoring bus voltage as transfer levels were increased, dynamic reactive reserves in the area of interest were also monitored. At each incremental transfer level, remaining reactive power generating capability was calculated. These values are plotted against a secondary vertical axis on the PV Curve diagrams. In this way, the relationship between voltage performance and on-line generation reactive reserves is demonstrated. Also, reported to the transmission planners, are the generators that reached their maximum var capabilities as transfers increased, and modal analysis of the nose of the PV curve. Modal analysis is a planning tool, which provides insight into the causes for reaching the node, and the location of any voltage collapse that may have been simulated.
The locations where voltages were monitored as power transfers were increased in the PV curves are shown on Exhibit 3. The numbers in the purple circles indicate the number of unique PV curves analyzed with voltage monitored at that location. Only one selected PV curve is presented in this report. The selection was based on the observed relationship between the thermal and voltage FCITC constraints. All of the PV curves have been provided to the Transmission Owners and Planners.
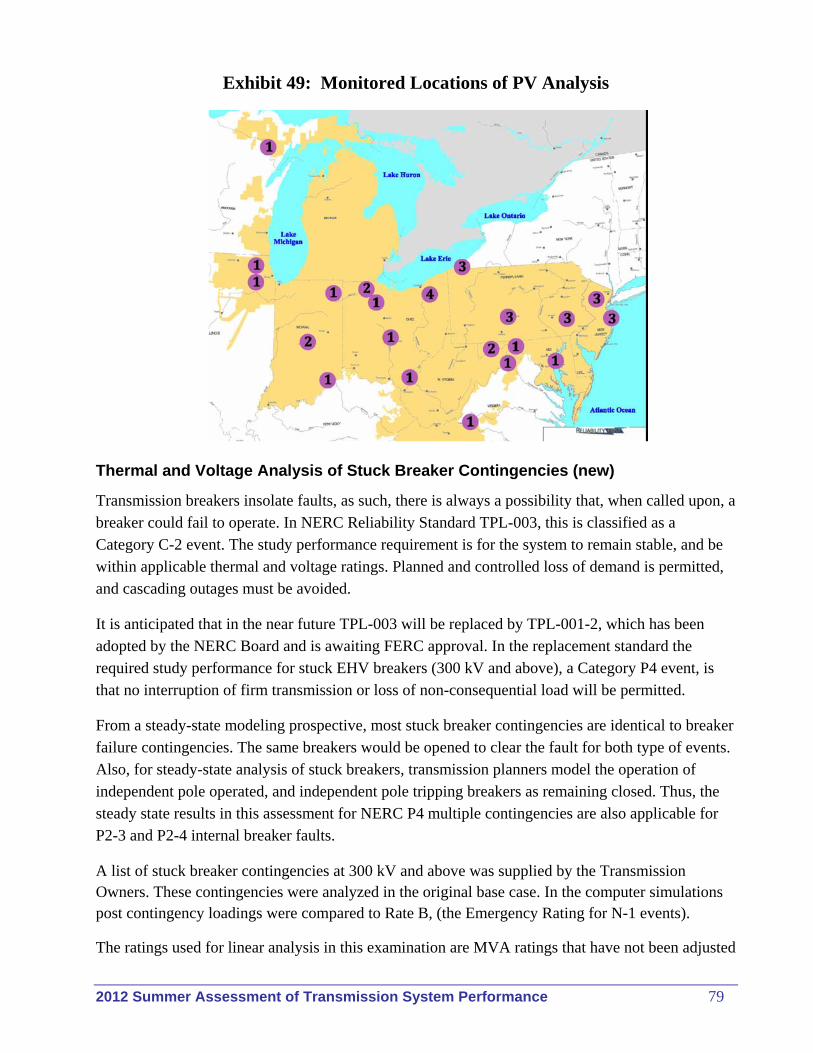
2012 Summer Assessment of Transmission System Performance 79
Exhibit 49: Monitored Locations of PV Analysis
Thermal and Voltage Analysis of Stuck Breaker Contingencies (new)
Transmission breakers insolate faults, as such, there is always a possibility that, when called upon, a breaker could fail to operate. In NERC Reliability Standard TPL-003, this is classified as a Category C-2 event. The study performance requirement is for the system to remain stable, and be within applicable thermal and voltage ratings. Planned and controlled loss of demand is permitted, and cascading outages must be avoided.
It is anticipated that in the near future TPL-003 will be replaced by TPL-001-2, which has been adopted by the NERC Board and is awaiting FERC approval. In the replacement standard the required study performance for stuck EHV breakers (300 kV and above), a Category P4 event, is that no interruption of firm transmission or loss of non-consequential load will be permitted.
From a steady-state modeling prospective, most stuck breaker contingencies are identical to breaker failure contingencies. The same breakers would be opened to clear the fault for both type of events. Also, for steady-state analysis of stuck breakers, transmission planners model the operation of independent pole operated, and independent pole tripping breakers as remaining closed. Thus, the steady state results in this assessment for NERC P4 multiple contingencies are also applicable for P2-3 and P2-4 internal breaker faults.
A list of stuck breaker contingencies at 300 kV and above was supplied by the Transmission Owners. These contingencies were analyzed in the original base case. In the computer simulations post contingency loadings were compared to Rate B, (the Emergency Rating for N-1 events).
The ratings used for linear analysis in this examination are MVA ratings that have not been adjusted

2012 Summer Assessment of Transmission System Performance 80
downward to account for Mvar flow. The percent loadings are calculated using MW flow and MVA ratings. When linear analysis identified an overload, a full power flow solution was performed to confirm that overload.
Post-contingency voltages were compared to member criteria for N-1 events. Each transmission owner has supplied their voltage criteria.
2012 Summer Assessment of Transmission System Performance 81
Appendix B – Definitions Acronyms and Abbreviations
Definitions
Most of the transfer capability definitions presented in this section are based on the NERC Transmission Transfer Capability publication, dated May 1995. A few are based on the Glossary of Terms Used in NERC Reliability Standards, the NERC Rule of Procedure or are non-NERC definitions. The definition of the Bulk Electric System is the ReliabilityFirst definition. In addition to the definitions, this section also contains a discussion on transfer capability and response factor calculations. These definitions build upon one another and are not in alphabetic order.
Bulk Electric System (BES) – (1) individual generation resources larger than 20 MVA or a generation plant with aggregate
capacity greater than 75 MVA that is connected via a step-up transformer(s) to facilities operated at voltages of 100 kV or higher,
– (2) lines operated at voltages of 100 kV or higher, – (3) transformers (other than generator step-up) with both primary and secondary windings of 100
kV or higher, and – (4) associated auxiliary and protection and control system equipment that could automatically trip
a BES facility independent of the protection and control equipment’s voltage level
The ReliabilityFirst Bulk Electric System excludes: – (1) radial facilities connected to load serving facilities or individual generation resources smaller
than 20 MVA or a generation plant with aggregate capacity less than 75 MVA where the failure of the radial facilities will not adversely affect the reliable steady-state operation of other facilities operated at voltages of 100 kV or higher and
– (2) balance of generating plant control and operation functions (other than protection systems that directly control the unit itself and step-up transformer); these facilities would include relays and systems that automatically trip a unit for boiler, turbine, environmental, and/or other plant restrictions, and
– (3) all other facilities operated at voltages below 100 kV. Bulk Power System (BPS) facilities and control systems necessary for operating an interconnected electric energy supply and transmission network (or any portion thereof), and electric energy from generating facilities needed to maintain transmission system reliability. The term does not include facilities used in the local distribution of electric energy.
Normal Incremental Transfer Capability (NITC) The amount of electric power, incremental above normal base power transfers, that can be transferred between two areas of the interconnected transmission systems under conditions where pre-contingency loadings reach the normal thermal rating of a facility, prior to any first contingency transfer limits being reached. When this occurs, NITC replaces FCITC as the most limiting transfer capability. For calculation purposes, NITC is equal to the normal rating of the monitored facility, minus the MW flow on the monitored facility in the base case, divided by the PTDF.

2012 Summer Assessment of Transmission System Performance 82
First Contingency Incremental Transfer Capability (FCITC) The amount of electric power, incremental above normal base power transfers, which can be transferred over the interconnected transmission systems in a reliable manner based on all of the following conditions:
1. For the existing or planned system configuration, and with normal (pre-contingency) operating procedures in effect, all facility loadings are within normal ratings and all voltages are within normal limits,
2. The electric systems are capable of absorbing the dynamic power swings, and remaining stable, following a disturbance that results in the loss of any single electric system element, such as a transmission line, transformer, or generating unit, and
3. After the dynamic power swings subside following a disturbance that results in the loss of any single electric system element as described in 2 above, and after the operation of any automatic operating systems, but before any post-contingency operator-initiated system adjustments are implemented, all transmission facility loading are within emergency ratings and all voltages are within emergency limits.
For calculation purposes, FCITC is equal to the emergency rating of the monitored facility, minus the post contingency MW flow on the monitored facility (without the transfer), divided by the OTDF.
For reporting of FCITC, ReliabilityFirst utilizes post-contingency operator-initiated operating guides which have been approved by either PJM or MISO. When any guide is used to increase the reported FCITC, the FCITC value without the guide is documented and provided to the Transmission Owners and Planners.
First Contingency Total Transfer Capability (FCTTC) Total amount of electric power (net of normal base power transfers plus first contingency incremental transfers) that can be transferred between two areas of the interconnected transmission systems in a reliable manner based on conditions 1, 2 and 3 in the FCITC definition above.
For calculation purposes, FCTTC is equal to the FCITC as defined above plus the net of base case transfers from the exporting to the importing Study Areas. FCTTC values below zero are reported as zero.
Excluded Transfer Capability Limitations Transfer capability is determined by considering all network facilities within an area of interest. There will be occasions, however, when loadings on non-bulk power facilities may restrict the calculated transfer capability. As recommended in the NERC Transmission Transfer Capability publication, such limitations may be excluded from the results published in this report only if (a) there is an established operating procedure to eliminate the overload condition, and (b) the facility involved has a minimal effect on the bulk power supply system. Transfer responses below 3.0% are taken as prima facie evidence of minimal effect.
2012 Summer Assessment of Transmission System Performance 83
Negative Transfer Capability Levels Negative transfer capability levels indicate that the limiting facility is already overloaded under the contingency condition being considered without any additional transfers from those already modeled in the base case. As with positive transfer capability values, negative transfer capability values serve as a means of measuring the relative strength of the system from one season to the next.
In this assessment, negative transfer capability levels are reported as zero.
Power Transfer Distribution Factor (PTDF) A measure of the responsiveness or change in electrical loadings on system facilities due to a change in electric power transfer from one area to another, expressed in percent (up to 100%) of the change in power transfer. The PTDF applies only for the pre-contingency configuration of the systems under study. PTDF is equal to the MW flow on the monitored facility under the transfer case, minus the MW flow on the monitored facility under the base case, divided by the MW transfer level.
PTDF can be analyzed in terms of Generator Distribution Factors (GDF). Each individual generator participating in the transfer can have has a different impact upon loading of system facilities. In this analysis, PTDF can be viewed as the weighted average of GDF values.
Total Import Capability (TIC) This non-NERC term is a measure of the total non-simultaneous import capability of a study area. TIC is equal to the First Contingency Incremental Transfer Capability (FCITC) minus the net interchange of the study area. TIC values below zero are displayed as zero.
Line Outage Distribution Factor (LODF) A measure of the redistribution of electric power on remaining system facilities caused by a contingency (or removal from service) of another system facility, expressed in percent (up to 100%) of the pre-contingency electrical loading on the contingent facility. LODF is equal to the post contingency MW flow on the monitored facility, minus the pre-contingency MW flow on the monitored facility, divided by the pre-contingency MW flow on the contingent facility.
Outage Transfer Distribution Factor (OTDF) The electric power transfer distribution factor (PTDF) with a specific system facility removed from service (contingency). The OTDF applies only for the post-contingency configuration of the systems under study. OTDF is equal to the PTDF of the monitored facility, plus the product of the LODF (for that monitored/contingent facility pair) and the PTDF of the contingent facility.
Transfer Distribution Factor (TDF) This is a reference to either the OTDF or the PTDF. The context, (with or without a specific facility removed from service) determines which of the two terms is being referenced. In this assessment, this term is used to permit both OTDF and PTDF constraints to be listed in the same exhibit.

2012 Summer Assessment of Transmission System Performance 84
Normal Rating The rating as defined by the equipment owner that specifies the level of electrical loading, usually expressed in megawatts (MW) or other appropriate units that a system, facility, or element can support or withstand through the daily demand cycles without loss of equipment life.
Emergency Rating The rating as defined by the equipment owner that specifies the level of electrical loading or output, usually expressed in megawatts (MW) or Mvar or other appropriate units, that a system, facility, or element can support, produce, or withstand for a finite period. The rating assumes acceptable loss of equipment life or other physical or safety limitations for the equipment involved.
Helper Generators and Harmer Generators These are non-NERC terms. Increasing the output of a helper generator decreases flow on the constrained facility and increasing the output of a harmer generator increases flow on the constrained facility. In sensitivity analysis calculations, generators are categorized as helpers or harmers based on their impact upon a given constraint.
2012 Summer Assessment of Transmission System Performance 85
Sensitivity Analysis The objective of sensitivity analysis calculations is to provide a means of measuring the likelihood that a particular flowgate gets overloaded for the mix of harmer and helper generation of each flowgate. Many of the constraints identified in sensitivity analysis are N-1-1 (second contingency) constraints. Sensitivity analysis should not be construed to signify probability of occurrence because it is a deterministic function.
Interconnection Reliability Operating Limit (IROL) A system operating limit that, if violated, could lead to instability, uncontrolled separation, or cascading outages that adversely impact the reliability of the BPS.
2012 Summer Assessment of Transmission System Performance 86
Acronyms
Several of these Acronyms are also defined in the Glossary of Terms Used in NERC Reliability
Standards. AFC Available Flowgate Capacity ATC Available Transfer Capability BPS Bulk Power System CBM Capacity Benefit Margin Dvar Dynamic var source ERAG Eastern Interconnection Reliability Assessment Group FERC Federal Energy Regulatory Commission HVDC High Voltage Direct Current ISO Independent System Operator LMP Locational Marginal Pricing MMWG Multiregional Modeling Working Group MTEP MISO's Transmission Expansion Plan NERC North American Electric Reliability Council OASIS Open Access Same-Time Information System PAR Phase Angle Regulator or Phase Angle Regulating Transformer PCLLRW Post-Contingency Local Load Relief Warnings PV Power versus Voltage RC Reliability Committee RTEP PJM's Regional Transmission Expansion Plan RTO Regional Transmission Organization SCED Security Constrained Economic Dispatch SCRD Security Constrained Dispatch SPS Special Protection System SVC Static Var Compensator TDF Transfer Distribution Factor (either Power or Outage) TLR Transmission Loading Relief TPS Transmission Performance Subcommittee TRM Transmission Reliability Margin VFT Variable Frequency Transformer
2012 Summer Assessment of Transmission System Performance 87
Power Flow Abbreviations
Throughout this report these abbreviations are placed in brackets and are used to identify the location of a transmission facility. Generally, these bracketed abbreviations identify the power flow model area associated with the buses to which a transmission facility is connected. In this report, these abbreviations are generally not used to identify the owner of a transmission facility. Often the owner of a facility and the power flow model area associated with one or more of the buses to which the transmission facility is connected are different.
This is only a list of abbreviations. It does not constitute a complete list of companies for each category.
ReliabilityFirst Corporation Power Flow Abbreviations
MISO Midwest Independent System Operator CPP Cleveland Public Power DEM Duke Energy Midwest DEI Duke Energy Indiana HE Hoosier Energy Rural Electric Cooperative, Inc IPL Indianapolis Power and Light Company MECS Michigan Electric Coordinated Systems
ITCT ITCTransmission in Michigan (ITC) METC Michigan Electric Transmission Company CONS Consumers Energy DECO Detroit Edison Company NIPS Northern Indiana Public Service Company SIGE Southern Indiana Gas and Electric Co. (VECTREN) WOLV Wolverine Power Supply Cooperative, Inc. WUMS Wisconsin-Upper Michigan Systems ATC American Transmission Company (ATCLLC) WEC Wisconsin Electric Power Company (WE) PJM PJM Interconnection AE Atlantic Electric AEP American Electric Power System -AP AEP-Appalachian Power Company -CS AEP-Columbus Southern Power Company -IM AEP-Indiana Michigan Power Company -KG AEP-Kingsport Power Company -KP AEP-Kentucky Power Company -OP AEP-Ohio Power Company -WP AEP-Wheeling Power Company AP Allegheny Power ATSI American Transmission Systems, Inc. CEI The Cleveland Electric Illuminating Company OE Ohio Edison System TE The Toledo Edison Company BG&E Baltimore Gas and Electric Company

2012 Summer Assessment of Transmission System Performance 88
CE Commonwealth Edison Company (NI) DAY Dayton Power and Light Company DEM Duke Energy Midwest DEK Duke Energy Kentucky DEO Duke Energy Ohio DLCO Duquesne Light Company DP&L Delmarva Power and Light Company IPRV IP – Riverside JCP&L Jersey Central Power and Light Company METED Metropolitan Edison Company PECO PECO Energy Company PENELEC Pennsylvania Electric Company PEPCO Potomac Electric Power Company PJM EHV, LDV, and SE agreement facilities in PJM PPL PPL Electric Utilities PSE&G Public Service Electric and Gas Company RECO Rockland Electric Company UGI UGI Utilities, Inc. Non-RTO OVEC Ohio Valley Electric Corporation

Attachment C
CORPORATION
2012 SUMMER ASSESSMENT OF
DEMAND AND RESOURCES
Draft
Table of Contents
SUMMER RESOURCE ASSESSMENT ...................................................................................... 1
Introduction ............................................................................................................................ 1
Executive Summary ................................................................................................................ 2
Demand, Capacity and Reserve Margins ........................................................................ 2
PJM RTO........................................................................................................................................ 3
Demand ............................................................................................................................ 3
Generation ....................................................................................................................... 3
Imports and Exports on Peak .......................................................................................... 4
Reliability Assessment Analysis ...................................................................................... 4
MISO .............................................................................................................................................. 6
Demand ............................................................................................................................ 6
Generation ....................................................................................................................... 7
Imports and Exports on Peak .......................................................................................... 7
Reliability Assessment Analysis ...................................................................................... 8
RELIABILITYFIRST .................................................................................................................... 9
Demand ............................................................................................................................ 9
Generation ..................................................................................................................... 11
Imports and Exports on Peak ........................................................................................ 13
Reliability Assessment Analysis .................................................................................... 13
RISK ASSESSMENT ................................................................................................................... 15
PJM & MISO ................................................................................................................. 15
APPENDIX A ............................................................................................................................... 17
APPENDIX B ............................................................................................................................... 19
ReliabilityFirst - 2012 Summer Assessment of Demand and Resources - DRAFT 1
SUMMER RESOURCE ASSESSMENT
Introduction All ReliabilityFirst Corporation (RFC) members are affiliated with either the Midwest Independent Transmission System Operator (MISO) or the PJM Interconnection (PJM) Regional Transmission Organization (RTO) for market operations and reliability coordination. Ohio Valley Electric Corporation (OVEC), a generation and transmission company located in Indiana, Kentucky and Ohio, is not a member of either RTO. Also, RFC does not officially designate subregions. MISO and PJM each operate as a single Balancing Authority area. Since all RFC demand is in either MISO or PJM, except for the small load (less than 100 MW) within the OVEC Balancing Authority area, the reliability of the PJM RTO and MISO are assessed, and the results used to indicate the reliability of the RFC Region.
This assessment provides information on the projected resource adequacy for the upcoming summer season across the RFC region. The RFC Resource Adequacy Assessment Standard BAL-502-RFC-02 is a Federal Energy Regulatory Commission (FERC) approved regional standard, which requires Planning Coordinators to identify the minimum planning reserves to satisfy a resource adequacy criterion that is used to assess their respective areas of RFC. PJM and MISO are the Planning Coordinators for their market areas. The reserve requirements in this assessment are based upon the explicit probability analyses conducted by these two Planning Coordinators in RFC.
In this report, Demand Response (DR) is defined as the demand that can be interrupted to maintain balance between capacity resources and demand. It may consist of Interruptible Load (IL), Direct Control Load Management (DCLM), or load used as a capacity resource. The approved RFC Resource Adequacy Assessment Standard requires the reserve margins be calculated with DR used as a load reduction. The reserve margin used in this assessment is therefore based on Net Internal Demand (NID).
The report for the RFC region includes the resources and demand only in the RFC area operated by PJM, MISO, and OVEC. The remaining area of PJM operates within the SERC Reliability Corporation (SERC) region, and the remaining area of MISO operates in the Midwest Reliability Organization (MRO) or SERC regions.
In this assessment, forecast demand, capacity, and interchange values for RFC, PJM, MISO and OVEC are rounded to the nearest 100 MW. Also note that it is possible that reports or other data released by PJM or MISO for this assessment period may differ from the data reported in this assessment, owing to when various data were reported. ReliabilityFirst does not expect any differences to alter the conclusions of this assessment.
ReliabilityFirst - 2012 Summer Assessment of Demand and Resources - DRAFT 2
Executive Summary Demand, Capacity and Reserve Margins
The projected reserve margin for the RFC region is 48,000 MW, which is 29.0% based on NID and Net Capacity Resources. This compares to a 32.4% reserve margin in last summer’s assessment. A slightly lower forecast demand was offset by fewer forecast Demand Response resources and fewer capacity resources committed in the PJM and MISO markets, resulting in a lower reserve margin in 2012. Both MISO and PJM are expected to have sufficient resources to satisfy their planning reserve requirements. Therefore, the resulting reserve margin for this summer in the ReliabilityFirst region is adequate.
Approximately 87% of the PJM demand and approximately 48% of the MISO demand is within the RFC region. Since OVEC is not a member of either RTO market, its demand of approximately 100 MW was added to that of the PJM and MISO areas within RFC to obtain a forecast summer 2012 coincident peak demand for the RFC region of 165,600 MW NID. This is 1,500 MW higher than the NID peak of 164,100 MW forecast for the summer 2011. Changing economic conditions can have a significant influence on electrical peak demand forecasts. Since the NID forecast includes load reductions for DR, the 1,300 MW of reduced DR year over year accounts for nearly all of the change in this year’s forecast NID, suggesting that economic conditions are forecast to be similar to last year.
The amount of OVEC, PJM and MISO net capacity resources in RFC is 213,600 MW. This is 3,600 MW less net capacity resources than the 217,200 MW that was in the 2011 summer assessment. Capacity resources committed to the markets at the beginning of the summer period are assumed constant for the summer. Only MISO includes new capacity that is placed in-service after the start of the planning year (June). Approximately 100 MW was included in MISO for the 2012 summer reserve margins.
PJM net capacity resources for the 2012 planning year are 185,600 MW. The projected reserves for the PJM RTO during the 2012 summer peak are 43,400 MW, which is 30.5% of the Net Internal Demand of 142,200 MW. The PJM reserve requirement for the 2012 summer peak demand is 15.6%. The PJM RTO has adequate reserves to serve the 2012 summer peak demand.
The MISO net capacity resources for the 2012 planning year are 113,900 MW. The current projected reserves for the MISO for the 2012 summer peak are 25,300 MW, which is 28.7%, of the Net Internal Demand of 88,600 MW. The MISO reserve requirement is 16.7% for each month of the 2012 planning year. The MISO summer reserve margin is forecast to be adequate.
A risk assessment of capacity outages exceeding the forecast reserve margins is included this year. The forecast reserve margins and assessment criterion are based on the 50/50 demand forecasts with the Demand Response programs activated. While the probabilities of needing to activate Demand Response resources have a 4% and 2% probability respectively for PJM and MISO, both RTOs have sufficient Demand Response programs that the capacity outages are not expected to exceed the reserve margins. This risk assessment confirms the reserve margin assessment that the reserve margins are adequate for PJM and MISO.
ReliabilityFirst - 2012 Summer Assessment of Demand and Resources - DRAFT 3
PJM RTO Demand
The PJM demand forecast includes non-coincident and RTO coincident models for each PJM zone. The PJM load forecast process produces a weather distribution of peak load forecasts by applying a Monte Carlo simulation using weather data from 1974 to 2010. This year's forecast reflects PJM's adoption of an independent consultant's recommendation to replace the load model's previous economic driver (Gross Metropolitan Product) with a variable that incorporates six economic measures (Gross Domestic Product, Gross Metropolitan Product, Real Personal Income, Population, Households, and Non-Manufacturing Employment). The PJM RTO 2011 summer peak was 158,042 MW which occurred on July 21, 2011 hour ending 17:00 EDT. On a weather-normalized basis, the PJM RTO 2011 summer peak forecast was 146,475 MW. The projection for the 2012 PJM RTO summer peak is 153,800 MW with the integration of Duke Energy Ohio – Kentucky (DEOK) into PJM. PJM forecasts the load of the entire RTO and the individual transmission zones on a coincident basis. Since PJM is summer-peaking, the coincident 50/50 summer peaks are used in resource adequacy evaluations.
For the 2012/2013 delivery year, PJM has contractually interruptible demand side management of 11,600 MW. Demand response can reduce PJM's peak demand by 7.8 percent. For Measurement and Verification (M&V) of demand response, participants submit load data from the EDC meters used for retail service or from meters meeting PJM's standards (See PJM Manual 11, Section 10.6). Participants will be audited.
Energy Efficiency programs included in the 2012 load forecast are impacts approved for use in the PJM Reliability Pricing Model. At time of the 2012 load forecast publication, 600 MW of Energy Efficiency programs have been approved as Reliability Pricing Model resources in 2012. Measurement and Verification of energy efficiency programs are governed by rules specified in PJM Manual 18B. To demonstrate the value of an energy efficiency resource, resource providers must comply with the M&V standards defined in this manual by establishing M&V plans, providing post-installation M&V reports, and undergoing an M&V audit.
Regional analysis was achieved as a result of having regional models. The PJM load forecast process produced a weather distribution of peak load forecasts by applying a Monte Carlo simulation for each model. The official peak load forecast is the median (50/50)1 value, but extreme peak forecasts (90/10)1 are also published and used in reliability analyses. A downward revision to the economic outlook for the PJM area has resulted in lower peak and energy forecasts in the 2012 load report, compared to the same year in the 2011 load report.
Generation
The total PJM capacity resources expected to be in service during the 2012 summer peak period is
1 See Appendix B for an explanation of the 50/50 and 90/10 demand forecasts.

ReliabilityFirst - 2012 Summer Assessment of Demand and Resources - DRAFT 4
185,400 MW of Existing Certain generation within the PJM RTO. This total includes the addition of DEOK generation. Existing Other and Existing Inoperable are not counted towards PJM capacity values.
Variable generation amounts to 5,600 MW nameplate and 700 MW expected on peak. Variable resources are only counted partially for PJM resource adequacy studies. Both wind and solar initially utilize class average capacity factors which are 13 percent for wind and 38 percent for solar. Performance over the peak period is tracked and the class average capacity factor is supplanted with historic information. After three years of operation, only historic performance over the peak period is used to determine the individual unit's capacity factor.
PJM has additional renewable resources of 1,100 MW of Biomass capacity counted fully in the capacity calculations.
PJM has 7,800 MW of conventional and pumped storage hydro generation, and reservoir levels are adequate. PJM is not experiencing or expecting any conditions that would reduce overall capacity or reduce specific unit types.
No significant generation is expected to be out of service over the summer peak period.
Imports and Exports on Peak
PJM has firm capacity imports of 1,400 MW. No non-firm imports are planned at this time. No additional firm capacity imports are planned at this time. All planned transactions are firm for both generation and transmission.
PJM has firm capacity exports of 1,200 MW. No non-firm exports are planned at this time. No additional firm capacity exports are planned at this time. All planned transactions are firm for both generation and transmission.
Reliability Assessment Analysis
The PJM projected reserve margin for summer 2012 is 30.5 percent, based on NID, with DR as a load reduction. The reserve margin is well in excess of the required reserve margin of 15.6 percent. PJM has adopted a Loss of Load Expectation (LOLE) standard of one occurrence in ten years. PJM performs an annual LOLE study to determine the reserve margin required to satisfy this criterion. The study recognizes, among other factors, load forecast uncertainty due to economics and weather, generator unavailability, deliverability of resources to load, and the benefit of interconnection with neighboring systems. The methods and modeling assumptions used in this study are available in PJM Manual 202. Details on the 2012 reserve margin requirement can be found in the latest (2011) Reserve Requirement Report3 available through the PJM website. Reserve margins are slightly lower than the 2011 forecast levels even with the addition of Duke Energy’s load and generation. 2 http://www.pjm.com/~/media/documents/manuals/m20.ashx 3 http://www.pjm.com/planning/resource-adequacy-planning/~/media/planning/res-adeq/2011-rrs-study.ashx
ReliabilityFirst - 2012 Summer Assessment of Demand and Resources - DRAFT 5
PJM has established rules/procedures to ensure fuel is conserved to maintain an adequate level on-site fuel supplies under forecasted peak load conditions. PJM coordinates with neighboring entities and gas pipelines to quickly address fuel issues.
No fuel supply or supply transportation/delivery issues are anticipated.
ReliabilityFirst - 2012 Summer Assessment of Demand and Resources - DRAFT 6
MISO Demand
The demands as reported by Network Customers are weather normalized, or 50/50, forecasts. A 50/50 forecast is the mean value in a normal probability distribution, indicating there is a 50 percent chance the actual load will be higher and a 50 percent chance the actual load will be lower than the forecast. Historically, reported load forecasts have been accurate as each member has expert knowledge of their individual loads with respect to weather and economic assumptions. During last year’s summer season, MISO experienced an instantaneous peak of 103,975 MW and settled peak of 103,621 MW on July 20th hour ending 17:00 EST. The instantaneous load is the highest value metered during the peak hour, while the settled load is the integrated average value of metered data over the peak hour. For consistency with other reporting entities, the settled load of 103,621 MW is being utilized for the purpose of this analysis.
Last year’s unrestricted non-coincident demand forecast of 102,700 MW is 4.9 percent higher than this year’s unrestricted non-coincident demand forecast of 97,600 MW. This difference is mostly due to the Duke Energy Ohio - Kentucky exit from MISO effective January 2012, which accounts for approximately an 11.7 percent reduction from last year’s demand forecast.
An unrestricted non-coincident peak demand is created on a regional basis by summing the coincident monthly forecasts for the individual Load Serving Entities (LSE) in the larger regional area of interest. Using historic market data, a load diversity factor was calculated by observing the individual peaks of each Local Balancing Authority and comparing them against the system peak. This produced an estimated diversity of 4,500 MW; therefore, the MISO is able to estimate a coincident Total Internal Demand (TID) of 93,100 MW.
MISO bases its resource evaluation on the actual market peak. MISO currently separates Demand Resources into two separate categories, Interruptible Load, and Direct Controlled Load Management (DCLM). Interruptible load of 3,500 MW (3.8 percent of TID) for this assessment is the magnitude of customer demand (usually industrial) that, in accordance with contractual arrangements, can be interrupted at the time of peak by direct control of the system operator (remote tripping), or by action of the customer at the direct request of the system operator. DCLM of 1,000 MW (1.1 percent of TID) for this assessment is the magnitude of customer demand (usually residential) that can be interrupted at the time of peak by direct control of the applicable system operator. DCLM is typically used for “peak shaving.” The Resource Adequacy processes as set forth in Module E of MISO’s tariff acts as the measurement and verification tool for demand response.
The MISO does not currently track Energy Efficiency programs; however, they may be reflected in individual LSE load forecasts. To account for uncertainties in load forecasts, MISO applies a probability distribution, Load Forecast Uncertainty, to consider a larger range of forecasted demand levels. Load Forecast Uncertainty is derived from variance analyses to determine how likely forecasts will deviate from actual load.

ReliabilityFirst - 2012 Summer Assessment of Demand and Resources - DRAFT 7
Generation
Last year’s Existing (Certain, Other, and Inoperable) capacity of 133,700 MW is 2.7 percent higher than MISO’s projected Existing capacity of 122,000 MW for the 2012 summer season. A large part of this difference is due to DEOK’s exit from MISO on January 1, 2012. The remaining MW changes were from new generation4, retirements and suspensions5, and reclassified units6, which brought the net MW reduction to 8.7 percent.
MISO projects 100 MW of Future, Planned capacity over the assessment timeframe, which is included in this assessment. Of the Existing and Future capacity, it is difficult to predict the wind capacity available on peak due to the intermittent nature of wind. However, MISO determined maximum wind capacity credits using an Equivalent Load Carrying Capacity, a metric commonly utilized by the National Renewable Energy Laboratory. MISO used the Equivalent Load Carrying Capacity for wind generation and Loss of Load Expectation analyses for the summer seasonal assessment. Wind shows an Existing-Certain capacity of 800 MW on peak over the assessment timeframe utilizing a 14.7 percent capacity credit for those resources committed as capacity to MISO within the Module E Capacity Tracking tool. It is important to note that not all Existing wind capacity was committed in the Module E Capacity Tracking tool. The Existing-Other capacity for wind is 9,200 MW on peak over the assessment timeframe. Hydro shows an Existing-Certain capacity of 3,100 MW on peak over the assessment timeframe. The Existing-Other capacity for hydro is 300 MW on peak over the assessment timeframe. Of the Existing and Future capacity, biomass shows 200 MW on peak throughout the assessment timeframe. MISO anticipates 3,500 MW of Behind-the-Meter Generation (BTMG) to be available for the 2012 summer season. Hydro conditions for the summer appear normal and there are no reports of reservoir levels showing insufficiencies to meet both peak demand the daily energy demand throughout the summer. MISO has no reports experiencing or expecting conditions (i.e. weather, fuel supply, fuel transportation) that would reduce capacity. MISO does not anticipate any existing significant generating units being out-of-service or retired during the summer season.
Imports and Exports on Peak
MISO reports interchange transactions in the MISO market that are expected to net 3,200 MW. The forecast reflects 1,800, MW of power exports and 5,000 MW of power imports which are considered available for the market. MISO does not intend to rely on outside assistance or external resources for emergency imports for this summer season.
4 New Generation does not necessarily refer to newly built generation. It is simply new from the March 2011 Commercial Model to the March 2012 Commercial Model.
5 Retirement and suspension information gathered under the Midwest ISO Attachment Y process. 6 MW Change from last year Commercial Model, Unit either designated to BTMG or Pseudo Tied Out of MISO
ReliabilityFirst - 2012 Summer Assessment of Demand and Resources - DRAFT 8
Reliability Assessment Analysis
The goal of a LOLE study is to determine a level of reserves which ensures that the probabilities for loss of load within the MISO system over each integrated peak hour for the planning period sum to 1 day in 10 years, or 0.1 days/year.7 Refer to Table 2-4 of the 2012 LOLE Study Report for a comparison of
Planning Year 2012 PRM to last year’s PRM
According to the 2012 LOLE study, the reserve margin requirement calculated for the MISO is 16.7 percent of MISO Net Internal Demand of its market area for the 2012 summer season. In addition to the 107,100 MW of Existing-certain capacity resources and 100 MW of Future Planned capacity, MISO expects 3,200 MW of external resources which are available to serve load. Behind-the-meter generation is considered a capacity resource when calculating the MISO reserve margin, thus making it reserve margin neutral. This 3,500 MW of additional capacity arrives at the expected capacity of 113,900 MW and brings the projected reserve margin for MISO to 25,300 MW, which is 28.7 percent of MISO Net Internal Demand. Since the 2012 summer projected reserve margin of 28.7 percent is higher than the 16.7 percent MISO system planning reserve margin for 2012, firm load curtailment is a very low probability event for the 2012 summer period.
For inclusion in seasonal assessments, the MISO utilizes Energy Information Administration fuel forecasts to identify any system wide fuel shortages, and there are none projected for the 2012 summer period. In addition to the seasonal assessments, the MISO’s Independent Market Monitor submits a monthly report to the MISO’s Board of Directors which covers fuel availability and security issues. During the operating horizon, the MISO relies on market participants to anticipate reliability concerns related to the fuel supply or fuel delivery. Since there are no requirements to verify the operability of backup fuel systems or inventories, supply adequacy and potential problems must be communicated appropriately by the market participants to enable adequate response time.
7 https://www.midwestiso.org/Library/Repository/Study/LOLE/2012%20LOLE%20Study%20Report.pdf
ReliabilityFirst - 2012 Summer Assessment of Demand and Resources - DRAFT 9
RELIABILITYFIRST Demand
In this assessment, the data related to the RFC areas of PJM and MISO are combined with the data from OVEC to develop the RFC regional data. The demand forecasts used in this assessment are all based on the coincident peak demand of MISO’s Local Balancing Authorities (LBAs) and the coincident peak of PJM’s load zones. Both PJM and MISO demand forecasts are based on an expected or 50/50 demand forecast. Actual data from the past four years indicates minimal diversity (less than 100 MW) between the RTO coincident peak demands and the RFC coincident peak demands. For this assessment, no additional diversity is included for the RFC region; therefore, the RFC coincident peak demand is simply the sum of the PJM, MISO and OVEC peak demands (rounded to nearest 100 MW). The composite RFC region forecast is considered a 50/50 demand forecast.
PJM and MISO use the categories of Direct Control Load Management, and Interruptible Load to account for the expected combined potential DR reduction within the RFC region. PJM and MISO also include demand reductions for load in their respective markets that are treated as a capacity resource as DR. The load related to Energy Efficiency programs is included as a capacity resource in the PJM market. Load served behind-the-meter from BTMG is load as a capacity resource in MISO. The combined Direct Control Load Management during the summer is 1,400 MW, and the Interruptible Demand is 8,700 MW. Load as a capacity resource is an additional 3,100 MW. This is a total demand reduction of 13,200 MW and is the maximum controlled demand mitigation that is expected to be available during peak demand conditions.
Since demand reduction programs are a contractual management of system demand, utilization reduces the reserve margin requirement for the RTO. Net Internal Demand is TID less the demand reduction. Reserve margin requirements are based on Net Internal Demand.
The Net Internal Demand peak of the RFC region for the 2012 summer season is 165,600 MW and is projected to occur during July 2012. This value is based on a TID forecast of 178,800 MW, with the full reduction of 13,200 MW (7.4 percent of TID) from the demand response programs within the region (see Table RFC-1).
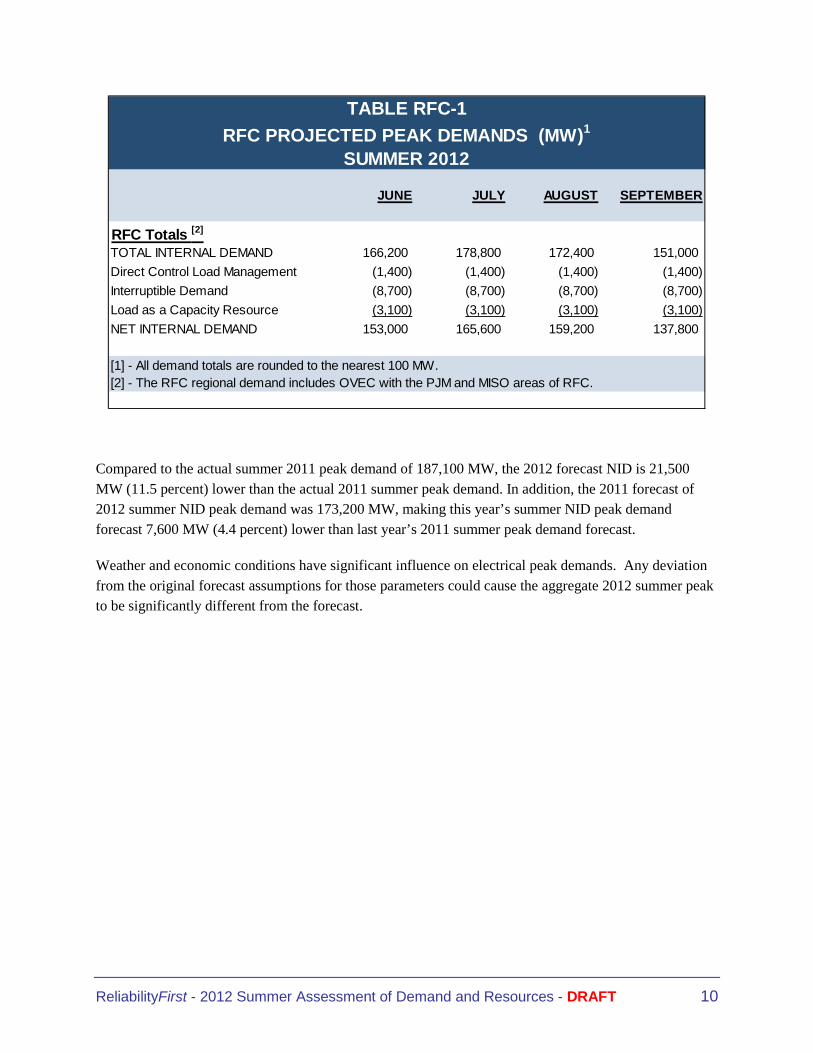
ReliabilityFirst - 2012 Summer Assessment of Demand and Resources - DRAFT 10
JUNE JULY AUGUST SEPTEMBER
RFC Totals [2]
TOTAL INTERNAL DEMAND 166,200 178,800 172,400 151,000
Direct Control Load Management (1,400) (1,400) (1,400) (1,400)
Interruptible Demand (8,700) (8,700) (8,700) (8,700)
Load as a Capacity Resource (3,100) (3,100) (3,100) (3,100)
NET INTERNAL DEMAND 153,000 165,600 159,200 137,800
[2] - The RFC regional demand includes OVEC with the PJM and MISO areas of RFC.[1] - All demand totals are rounded to the nearest 100 MW.
TABLE RFC-1
RFC PROJECTED PEAK DEMANDS (MW)1
SUMMER 2012
Compared to the actual summer 2011 peak demand of 187,100 MW, the 2012 forecast NID is 21,500 MW (11.5 percent) lower than the actual 2011 summer peak demand. In addition, the 2011 forecast of 2012 summer NID peak demand was 173,200 MW, making this year’s summer NID peak demand forecast 7,600 MW (4.4 percent) lower than last year’s 2011 summer peak demand forecast.
Weather and economic conditions have significant influence on electrical peak demands. Any deviation from the original forecast assumptions for those parameters could cause the aggregate 2012 summer peak to be significantly different from the forecast.
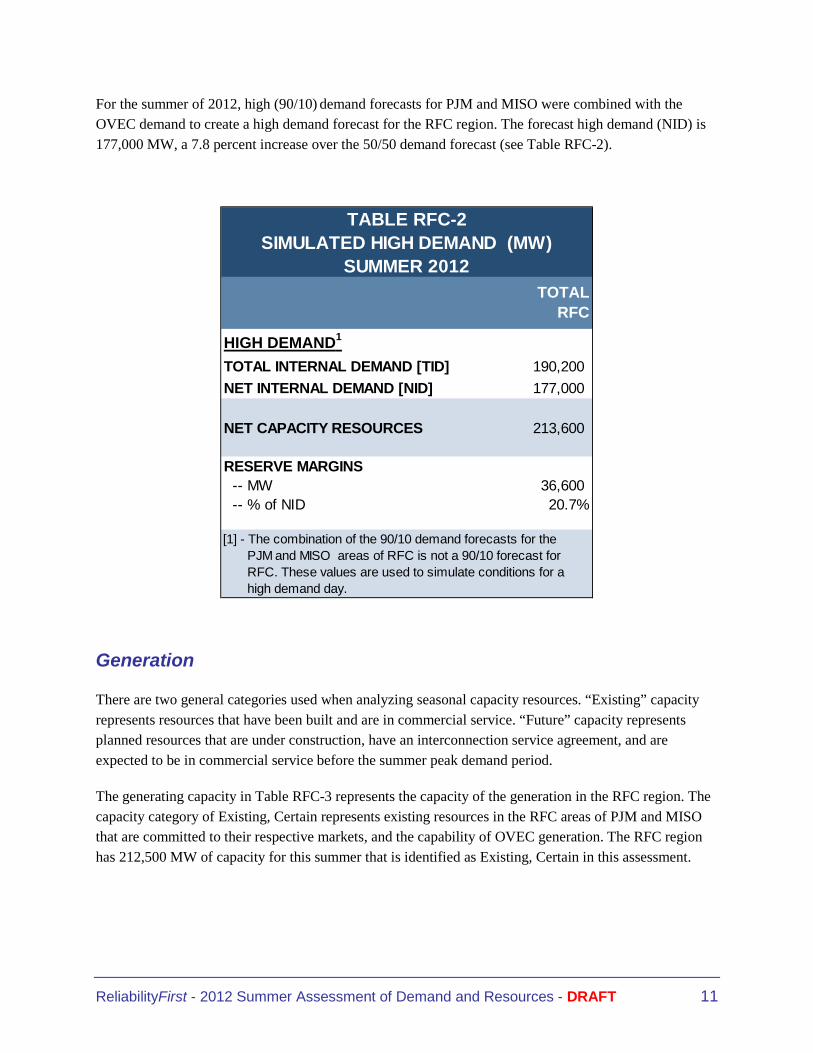
ReliabilityFirst - 2012 Summer Assessment of Demand and Resources - DRAFT 11
For the summer of 2012, high (90/10) demand forecasts for PJM and MISO were combined with the OVEC demand to create a high demand forecast for the RFC region. The forecast high demand (NID) is 177,000 MW, a 7.8 percent increase over the 50/50 demand forecast (see Table RFC-2).
TOTALRFC
HIGH DEMAND1
TOTAL INTERNAL DEMAND [TID] 190,200
NET INTERNAL DEMAND [NID] 177,000
NET CAPACITY RESOURCES 213,600
RESERVE MARGINS -- MW 36,600 -- % of NID 20.7%
TABLE RFC-2SIMULATED HIGH DEMAND (MW)
SUMMER 2012
[1] - The combination of the 90/10 demand forecasts for the PJM and MISO areas of RFC is not a 90/10 forecast for RFC. These values are used to simulate conditions for a high demand day.
Generation
There are two general categories used when analyzing seasonal capacity resources. “Existing” capacity represents resources that have been built and are in commercial service. “Future” capacity represents planned resources that are under construction, have an interconnection service agreement, and are expected to be in commercial service before the summer peak demand period.
The generating capacity in Table RFC-3 represents the capacity of the generation in the RFC region. The capacity category of Existing, Certain represents existing resources in the RFC areas of PJM and MISO that are committed to their respective markets, and the capability of OVEC generation. The RFC region has 212,500 MW of capacity for this summer that is identified as Existing, Certain in this assessment.
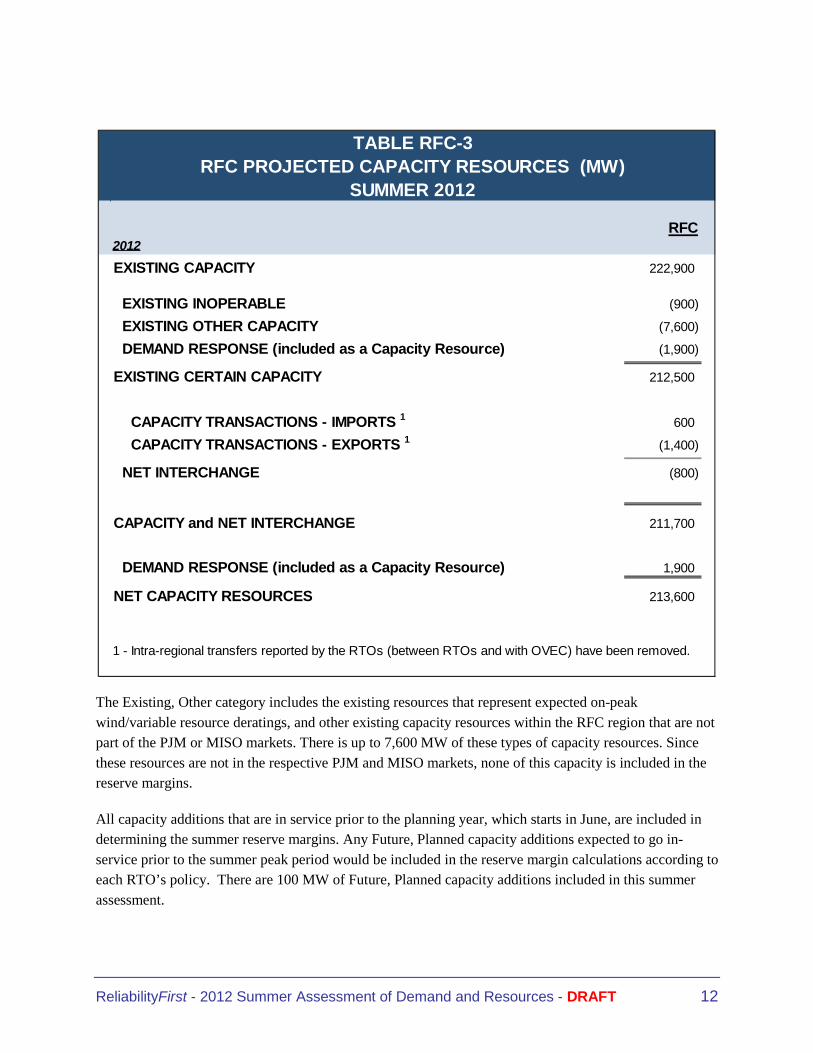
ReliabilityFirst - 2012 Summer Assessment of Demand and Resources - DRAFT 12
RFC2012EXISTING CAPACITY 222,900
EXISTING INOPERABLE (900)
EXISTING OTHER CAPACITY (7,600)
DEMAND RESPONSE (included as a Capacity Resource) (1,900)
EXISTING CERTAIN CAPACITY 212,500
CAPACITY TRANSACTIONS - IMPORTS 1 600
CAPACITY TRANSACTIONS - EXPORTS 1 (1,400)
NET INTERCHANGE (800)
CAPACITY and NET INTERCHANGE 211,700
DEMAND RESPONSE (included as a Capacity Resource) 1,900
NET CAPACITY RESOURCES 213,600
1 - Intra-regional transfers reported by the RTOs (between RTOs and with OVEC) have been removed.
TABLE RFC-3RFC PROJECTED CAPACITY RESOURCES (MW)
SUMMER 2012
The Existing, Other category includes the existing resources that represent expected on-peak wind/variable resource deratings, and other existing capacity resources within the RFC region that are not part of the PJM or MISO markets. There is up to 7,600 MW of these types of capacity resources. Since these resources are not in the respective PJM and MISO markets, none of this capacity is included in the reserve margins.
All capacity additions that are in service prior to the planning year, which starts in June, are included in determining the summer reserve margins. Any Future, Planned capacity additions expected to go in-service prior to the summer peak period would be included in the reserve margin calculations according to each RTO’s policy. There are 100 MW of Future, Planned capacity additions included in this summer assessment.
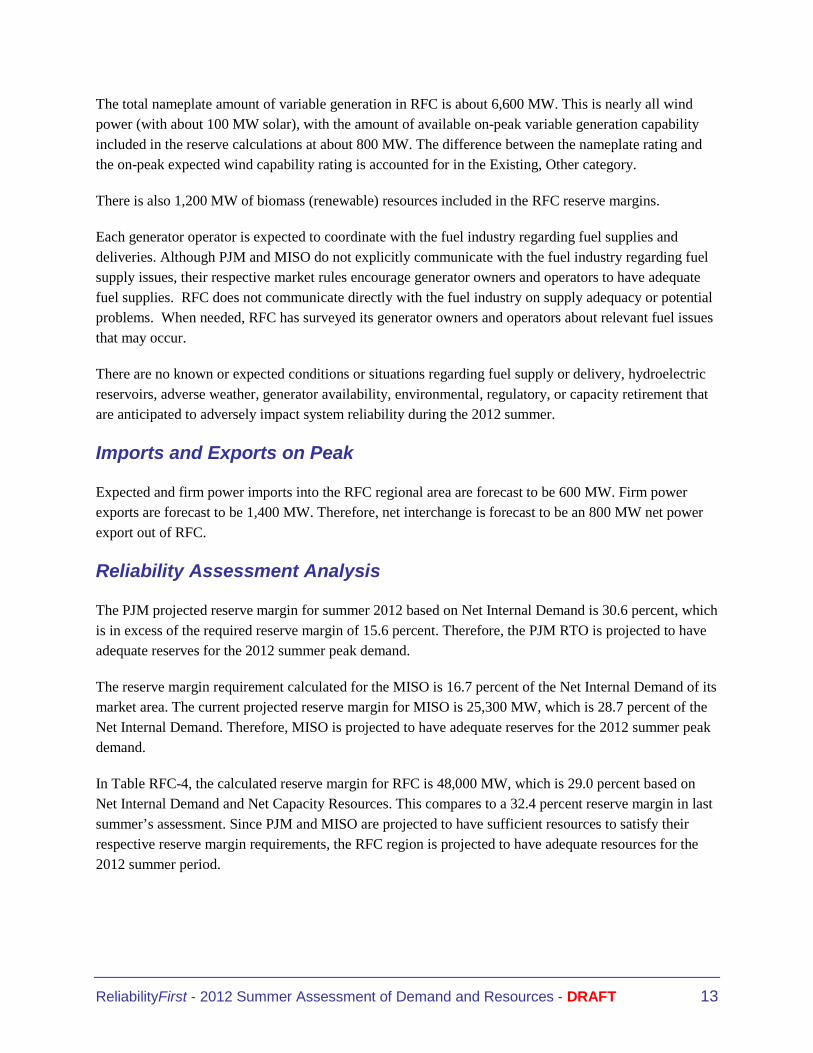
ReliabilityFirst - 2012 Summer Assessment of Demand and Resources - DRAFT 13
The total nameplate amount of variable generation in RFC is about 6,600 MW. This is nearly all wind power (with about 100 MW solar), with the amount of available on-peak variable generation capability included in the reserve calculations at about 800 MW. The difference between the nameplate rating and the on-peak expected wind capability rating is accounted for in the Existing, Other category.
There is also 1,200 MW of biomass (renewable) resources included in the RFC reserve margins.
Each generator operator is expected to coordinate with the fuel industry regarding fuel supplies and deliveries. Although PJM and MISO do not explicitly communicate with the fuel industry regarding fuel supply issues, their respective market rules encourage generator owners and operators to have adequate fuel supplies. RFC does not communicate directly with the fuel industry on supply adequacy or potential problems. When needed, RFC has surveyed its generator owners and operators about relevant fuel issues that may occur.
There are no known or expected conditions or situations regarding fuel supply or delivery, hydroelectric reservoirs, adverse weather, generator availability, environmental, regulatory, or capacity retirement that are anticipated to adversely impact system reliability during the 2012 summer.
Imports and Exports on Peak
Expected and firm power imports into the RFC regional area are forecast to be 600 MW. Firm power exports are forecast to be 1,400 MW. Therefore, net interchange is forecast to be an 800 MW net power export out of RFC.
Reliability Assessment Analysis
The PJM projected reserve margin for summer 2012 based on Net Internal Demand is 30.6 percent, which is in excess of the required reserve margin of 15.6 percent. Therefore, the PJM RTO is projected to have adequate reserves for the 2012 summer peak demand.
The reserve margin requirement calculated for the MISO is 16.7 percent of the Net Internal Demand of its market area. The current projected reserve margin for MISO is 25,300 MW, which is 28.7 percent of the Net Internal Demand. Therefore, MISO is projected to have adequate reserves for the 2012 summer peak demand.
In Table RFC-4, the calculated reserve margin for RFC is 48,000 MW, which is 29.0 percent based on Net Internal Demand and Net Capacity Resources. This compares to a 32.4 percent reserve margin in last summer’s assessment. Since PJM and MISO are projected to have sufficient resources to satisfy their respective reserve margin requirements, the RFC region is projected to have adequate resources for the 2012 summer period.
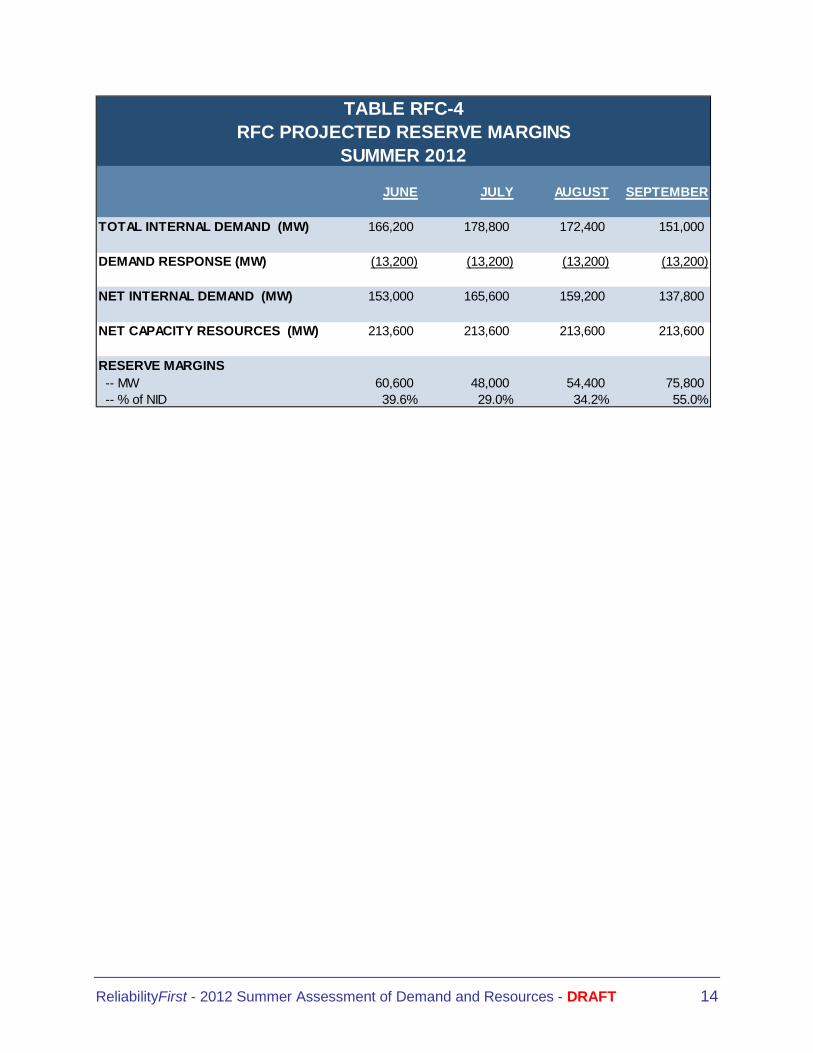
ReliabilityFirst - 2012 Summer Assessment of Demand and Resources - DRAFT 14
JUNE JULY AUGUST SEPTEMBER
TOTAL INTERNAL DEMAND (MW) 166,200 178,800 172,400 151,000
DEMAND RESPONSE (MW) (13,200) (13,200) (13,200) (13,200)
NET INTERNAL DEMAND (MW) 153,000 165,600 159,200 137,800
NET CAPACITY RESOURCES (MW) 213,600 213,600 213,600 213,600
RESERVE MARGINS -- MW 60,600 48,000 54,400 75,800 -- % of NID 39.6% 29.0% 34.2% 55.0%
TABLE RFC-4RFC PROJECTED RESERVE MARGINS
SUMMER 2012
ReliabilityFirst - 2012 Summer Assessment of Demand and Resources - DRAFT 15
RISK ASSESSMENT PJM & MISO
The ReliabilityFirst Board of Directors has encouraged the ReliabilityFirst staff and stakeholders to enhance the reliability assessment reports. Last year, the Resource Assessment Subcommittee suggested an enhancement to the resource assessment that would potentially evaluate the risk associated with random outages reducing the available capacity resources below the load obligations of the PJM or MISO members. The Board suggested this enhancement be included with this year’s seasonal Resource Assessment reports.
The stacked bar charts on the following pages are based on summer 2012 demand and capacity resource data for the PJM and MISO RTOs. Also included as a load obligation, is the daily operating reserve requirement for PJM and MISO at the time of the peak demand. The range of expected generator outages is included as scheduled and random outages. The random outages are based on actual NERC Generator Availability Data System (GADS) outage data collected for 2009-2010.
The committed resources in PJM/MISO are in shades of blue and only include the net interchange that is a capacity commitment to each market. Additional interchange transactions that may be available at the time of the peak are not included as they are not firm commitments to satisfying each RTO’s reserve margin requirement.
In shades of green are the firm demand and the demand that can be contractually reduced as a Demand Response resource. The firm demand constitutes the Net Internal Demand, with Total Internal Demand including the Demand Response. Between the NID and Demand Response bars is the daily Operating Reserve requirement. There are two sets of stacked demand bars on the chart, one representing the 50/50 demand forecast, and the second the 90/10 demand forecast. Since Demand Response is utilized first to reduce the load obligation when there is insufficient capacity, this part is at the top of the demand forecast bar. In the event that utilization of all demand response is not sufficient to balance capacity with load obligations, system operators may first reduce operating reserves prior to interrupting firm load customers. The yellow (second) section of the demand bar represents the operating reserves.
Between the Resources bar and the Demand bars is the Outage bar. Scheduled outages during the summer season are generally minimal, and that is reflected in the small amount of Scheduled Maintenance (colored gray) in the Outage bar. The remainder of the Outage bar represents the entire range of random outages (in pink, rose and red colors on the chart) which occurred during the two year reference period.
To the left side of the range of random outages are the percentages related to the number of random outage events that equaled or exceeded the amount of outages shown above that line on the Outage bar. Data points going down the Outage bar represent an increasing amount of expected random outages, and also a decreasing probability for each random outage event. As shown by the outage event percentages noted, the distribution of random outages is not linear throughout the range of outages observed.

ReliabilityFirst - 2012 Summer Assessment of Demand and Resources - DRAFT 16
Next to the Demand bars are the probabilities that the random outages will reduce the available capacity resources below that reference demand line. These are probabilities for the explicit conditions represented on this chart by the committed capacity, interchange, demand forecast, and operating reserves.
The 4% probability at the top of the 50/50 Demand bar of the PJM chart represents the probability that Demand Response would have to be activated at the time of the 50/50 demand peak, with no additional purchases of power available beyond the committed amount (1,990 MW). The similar probability of activating Demand response at the 50/50 demand peak for MISO is 2% for this summer.
The probability at the maximum random outage level is less than 1%. Both PJM and MISO have additional Demand Response resources that could be utilized at that demand level for the 50/50 demand forecast. Interruption of firm load is not likely for expected demand conditions this summer.
At a 90/10 demand forecast level, the probabilities of activating Demand Response increase to 92% and 48% respectively for PJM and MISO. The charts also identify the probabilities of fully utilizing the forecast Demand Response at 2% for PJM and 3% for MISO.
This does not mean that these are the probabilities of interrupting firm load during high demand (90/10). System Operators may reduce their planned daily operating reserves, if doing so would not jeopardize their ability to react to the next most severe contingency that may occur. Additional purchases of power (if available), public appeals for conservation and implementation of voltage reduction programs also have the potential to improve the capacity/load balance. These measures have not been included in these charts, yet they would reduce the probabilities of fully utilizing demand response, needing reduced operating reserves or interrupting firm load, respectively. The probabilities indicate a very low likelihood of interrupting firm load, even if severe weather creates a high system demand.
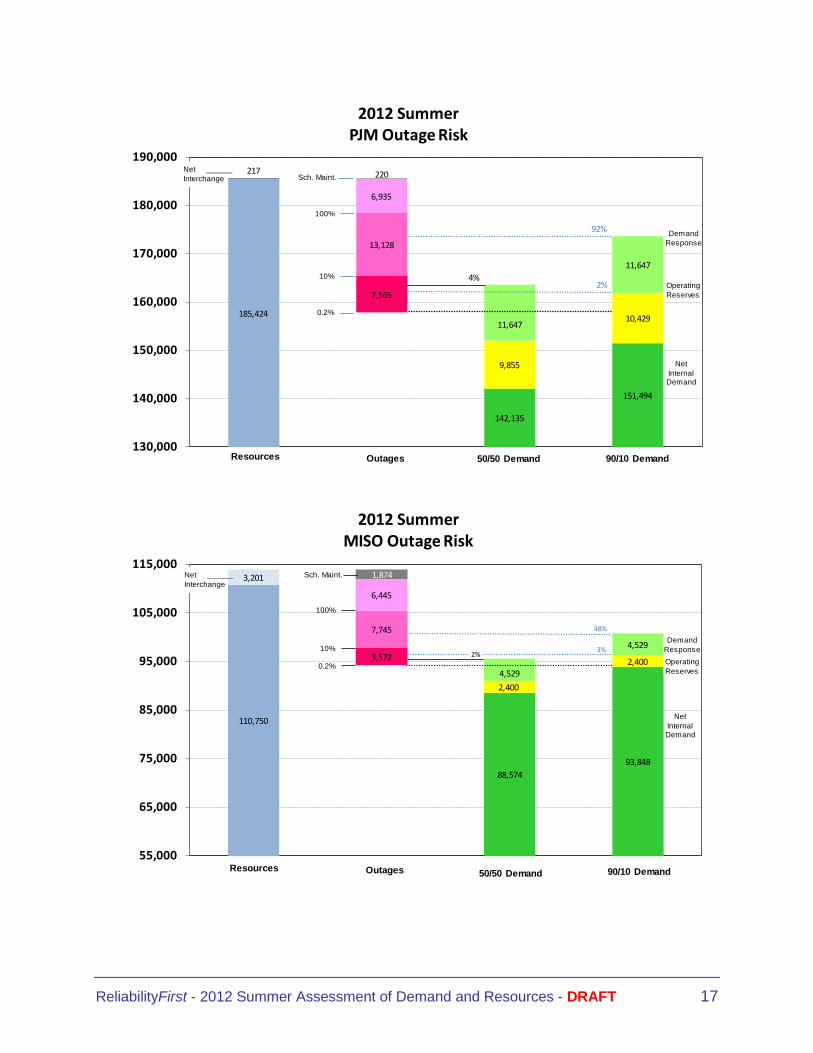
ReliabilityFirst - 2012 Summer Assessment of Demand and Resources - DRAFT 17
7,565
13,128
6,935
185,424
217
142,135
151,494
9,855
10,42911,647
11,647
220
130,000
140,000
150,000
160,000
170,000
180,000
190,000
2012 SummerPJM Outage Risk
Resources 90/10 DemandOutages 50/50 Demand
Net ______Interchange
100%
0.2%
Sch. Maint.
10%
DemandResponse
OperatingReserves
4%
NetInternalDemand
92%
2%
3,572
7,745
6,445
110,750
3,201
88,57493,848
2,400
2,4004,529
4,529
1,874
55,000
65,000
75,000
85,000
95,000
105,000
115,000
2012 SummerMISO Outage Risk
Resources50/50 DemandOutages 90/10 Demand
Net ______Interchange
100%
0.2%
Sch. Maint.
10%Demand
Response
OperatingReserves
NetInternalDemand
48%
2% 3%
ReliabilityFirst - 2012 Summer Assessment of Demand and Resources - DRAFT 18
APPENDIX A
ACRONYMS BTMG – Behind-the-Meter Generation
DCLM – Direct Control Load Management
DEOK – Duke Energy Ohio – Kentucky
DR – Demand Response
FERC – Federal Energy Regulatory Commission
GADS – Generator Availability Data System
IL – Interruptible Load
LBAs – Local Balancing Authority
LOLE – Loss Of Load Expectation
LSE – Load Serving Entity
M&V – Measurement and Verification
MISO – Midwest Independent Transmission System Operator
MRO – Midwest Reliability Organization
NERC – North American Electric Reliability Corporation
NID – Net Internal Demand
OVEC – Ohio Valley Electric Corporation
PJM – PJM RTO
RFC – ReliabilityFirst Corporation
RTO – Regional Transmission Organization
SERC – SERC Reliability Corporation
TID – Total Internal Demand

ReliabilityFirst - 2012 Summer Assessment of Demand and Resources - DRAFT 19
APPENDIX B
Demand forecasts can be prepared as a probabilistic distribution of expected demands with associated
probabilities of occurrence. The median value of such a demand distribution is the mid-point value of the
distribution. Half of the distribution is less than this value and half is greater than this value. This is
referred to as a 50/50 forecast, meaning that 50 percent of the demand probability distribution is lower
than the forecast demand and 50 percent of the demand probability distribution is higher than the forecast
demand.
Most demand forecasts are developed utilizing a forecast of expected economic conditions. In those cases
the forecast demand distribution would be derived from weather variability, and the impact of weather on
electric demand. A 50/50 demand forecast based on expected economic conditions would have demands
associated with median or 50/50 weather. In this context, a 50/50 demand forecast utilizes median
weather impacts, meaning that the weather impact distribution is at the 50th percentile of increasing
severity of weather. Milder weather (lower weather related demand) than the forecast has a 50 percent
probability of occurring, and more severe weather (higher weather related demand) is also expected to
have a 50 percent probability of occurring.
A 90/10 demand forecast is a forecast utilizing the associated weather impact distribution at the 90th
percentile of the increasing severity weather distribution. This means that the weather impact included in
the demand forecast is based on weather where the probability for milder weather is 90 percent, and the
probability for more severe weather is 10 percent.