Variance Analysis Summary · PDF fileVariance Analysis Summary : ... FY 2014-2015 Variance...
56
Variance Analysis Summary : Aboriginal Affairs and Northern Development Canada (AANDC) Financial Statements (Unaudited) Fiscal Year 2014-2015
Transcript of Variance Analysis Summary · PDF fileVariance Analysis Summary : ... FY 2014-2015 Variance...

Variance Analysis Summary : Aboriginal Affairs and Northern Development
Canada (AANDC) Financial Statements (Unaudited) Fiscal Year 2014-2015

1 NCR#7661921 - v20
Table of Contents Part A – Statement of Financial Position ............................................................................................ 3
FY 2014-2015 Variance Summary .................................................................................................. 4
Statement of Financial Position (Unaudited) .............................................................................. 4
A 1 – Accounts Payable and Accrued Liabilities ............................................................................ 5 A 2a – Other Liabilities (Trust Accounts Related) .......................................................................... 6 A 2b – Other Liabilities (Guarantee Deposits) ................................................................................ 7 A 3 – Settled Claims ......................................................................................................................... 8 A 4 – Provision for Claims and Litigation ........................................................................................ 9 A 5 – Environmental Liabilities ....................................................................................................... 11 A 6 – Provision for Loan Guarantees ............................................................................................ 13 A 7 – Employee Future Benefits .................................................................................................... 14 A 8 – Due from the Consolidated Revenue Fund ........................................................................ 15 A 9 – Interest Receivable ............................................................................................................... 16 A 10 – Loans Receivable ............................................................................................................... 17 A 11 – Tangible Capital Assets...................................................................................................... 18
Part B – Statement of Operations ..................................................................................................... 19
B 1 – Statement of Operations – 2014-2015 versus 2013-2014 ................................................ 20 Highlights of Major Variances – Statement of Operations.................................................... 21
2014-15 versus 2013-2014 ....................................................................................................... 21
B 2 – Statement of Operations – Actual versus Planned ............................................................ 22 Highlights of Major Variances – Statement of Operations........................................................... 23
Actual versus Planned ................................................................................................................ 23
Part C – Expenses – Note 19 – Segmented Information ................................................................ 25
C 1 – First Nations (Transfer Payments) ...................................................................................... 26 C 2 – Provincial/Territorial Governments and Institutions (Transfer Payments) ....................... 27 C 3 – Industry (Transfer Payments) .............................................................................................. 28 C 4 – Contaminated Sites (Transfer Payments) .......................................................................... 29 C 5 – Non-Profit Organization (Transfer Payments) .................................................................... 30 C 6 – Claims and Litigation (Transfer Payments) ........................................................................ 31 C 7 – Salary and Employee Future Benefits ................................................................................ 32 C 8 – Court Awards and Other Settlement ................................................................................... 33 C 9 – Claims and Litigation (Operating Expenses) ...................................................................... 34 C 10 – Contaminated Sites (Operating Expenses) ...................................................................... 35 C 11 – Professional Services ......................................................................................................... 36 C 12 – Legal Services .................................................................................................................... 37 C 13 – Travel and Relocation ........................................................................................................ 38 C 14 – Rental of Buildings and Machinery.................................................................................... 39

2 NCR#7661921 - v20
C 15 – Bad Debt Expenses ............................................................................................................ 40 C 16 – Machinery and Equipment ................................................................................................. 41 C 17 – Utilities, materials and supplies ......................................................................................... 42 C 18 – Operating Expenses - Other .............................................................................................. 43 C 19 – Expenses incurred on behalf of Government ................................................................... 45
Part D – Revenues – Note 19 – Segmented Information ................................................................ 46
D 1 – Norman Wells Project Profits ............................................................................................... 48 D 2 – Resource Royalties .............................................................................................................. 49 D 3 – Interest on Loans .................................................................................................................. 50 D 4 – Miscellaneous Revenue ....................................................................................................... 51 D 5 – Lease and Rentals ................................................................................................................ 52 D 6 – Finance and Administrative Services .................................................................................. 53
Part E - Other ...................................................................................................................................... 54
E 1 – Parliamentary Authorities – Budgetary Authorities Provided and Used ........................... 55
Note: Some totals may not fully add up due to rounding.

3 NCR#7661921 - v20
Part A – Statement of Financial Position Fiscal Year 2014-2015
4 NCR#7661921 - v20
FY 2014-2015 Variance Summary Statement of Financial Position (Unaudited) As at March 31 (in thousands of dollars)
2015 2014 Year-Over-Year Variance Explained Unexplained Reference
$ % % % Liabilities Accounts payable and accrued liabilities (note 4) 688,212 632,704 55,508 9% 7% 2% A 1 Vacation pay and compensatory leave 15,194 16,242 (1,049) -6% Other liabilities (note 5) 70,606 82,476 (11,870) -14% -14% 0% A 2a, A2b Trust accounts (note 6) 892,254 890,472 1,782 0% -3% 0% Settled claims (note 7) 281,854 356,355 (74,501) -21% -21% 0% A 3 Provision for claims and litigation (note 8) 10,635,848 9,755,837 880,011 9% 9% 0% A 4 Environmental liabilities (note 8) 3,000,346 2,702,986 297,360 11% 11% 0% A 5 Provision for loan guarantees (note 8) 1,405 410 995 243% 245% -3% A 6 Employee future benefits (note 9) 25,586 21,010 4,576 22% 22% 0% A 7 Total Liabilities 15,611,305 14,458,492 1,152,812 8% Financial Assets Due from the Consolidated Revenue Fund 1,638,093 1,587,441 50,653 3% 3% 0% A 8 Accounts receivable and advances (note 10) 69,321 68,661 660 1% Interest receivable (note 11) 1,462 1,759 (297) -17% -21% 4% A 9 Loans receivable (note 12) 858,256 834,970 23,286 3% 3% 0% A 10 Total gross financial assets 2,567,132 2,492,831 74,302 3% Financial assets held on behalf of government Interest receivable(note 11) (1,462) (1,759) Loans receivable (note 12) (858,256) (834,970) (23,286) 3% Total financial assets held on behalf of government (859,718) (836,729) (22,989) 3% Total net financial assets 1,707,414 1,656,102 51,313 3% Departmental net debt 13,903,891 12,802,390 1,101,499 9% Non Financial Assets Land held for future claims settlements 39,570 39,570 - 0% Tangible capital assets 92,958 67,662 25,296 37% 38% -1% A 11
Total non financial assets 132,528 107,232 25,296 24% Departmental net financial position (note 15) (13,771,363) (12,695,158) (1,076,203) 8%

5 NCR#7661921 - v20
A 1 – Accounts Payable and Accrued Liabilities (Financial Reporting Account 211XX, 216XX)
(2014-2015 AANDC Financial Statements Note 4)
Financial Statement Data (in thousands of dollars) Fiscal Year 2014-2015 688,212 Fiscal Year 2013-2014 632,704 Variance (+Increase / -Decrease) 55,508 Percentage (+Increase / -Decrease) 9% Explanation of Major Variances Variance $ Variance % Payables At Year-End (PAYE) - Transfer Payments The increase is explained by previous year balances of PAYE’s remaining in the account at end of 2014-2015. PAYE balances were not released at the same rate compared to the previous year.
51,297 8%
Accrued Liabilities - Salary & Wages This variance is a result of a new salary payment schedule that was initiated in 2014-15. The new schedule delayed salary payment by 2 weeks and increased the salary accruals at year end by the equivalent pay for 2 weeks.
10,424 2%
Payables At Year-End - Regular Payments This variance arises as a result of: 1) a shorter "cut-off date" established by cost centers for the set-up of PAYE’s which resulted in a net reduction in PAYE’s year-over-year; and 2) a decrease in claim request to the Resolution and Individual Affairs (RIA) sector from fiscal year 2013-14,
-19,501 -3%
Total Explained 42,220 7% Total Unexplained 13,288 2%

6 NCR#7661921 - v20
A 2a – Other Liabilities (Trust Accounts Related) (Financial Reporting Account 23441, 23442)
(2014-2015 AANDC Financial Statements Note 5)
Financial Statement Data (in thousands of dollars) Fiscal Year 2014-2015 53,343 Fiscal Year 2013-2014 47,406 Variance (+Increase / -Decrease) 5,937 Percentage (+Increase / -Decrease) 13% Explanation of Major Variances Variance $ Variance %
The majority of the variance is mainly attributed to a balance increase in the Indian Moneys Suspense Account. During 2014-15, total receipts credited to the Indian Moneys Suspense Account exceeded total releases by $5.91M. The Indian Moneys Suspense Account receives funds on a temporary basis on behalf of First Nations and their members pending resolution of specific conditions or uncertainties. Significant items include a new rental agreement at Indian Oil and Gas Canada ($4.1M), and multiple agreements for an Alberta region band ($1.68M).
5,908 12%
Total Explained 5,908 12% Total Unexplained 29 0%

7 NCR#7661921 - v20
A 2b – Other Liabilities (Guarantee Deposits) (Financial Reporting Account 23211, 23213)
(2014-2015 AANDC Financial Statements Note 5)
Financial Statement Data (in thousands of dollars) Fiscal Year 2014-2015 17,262 Fiscal Year 2013-2014 35,070 Variance (+Increase / -Decrease) -17,808 Percentage (+Increase / -Decrease) -51% Explanation of Major Variances Variance $ Variance % On April 1, 2014, the Government of the Northwest Territories (GNWT) became responsible for managing public land, water, and resources in the Northwest Territories (NWT). The NWT Devolution process included the transfer of cash securities to the GNWT.
-16,264 -46%
Total Explained -16,264 -46% Total Unexplained -1,544 -4%

8 NCR#7661921 - v20
A 3 – Settled Claims (Financial Reporting Account 24114)
(2014-2015 AANDC Financial Statements Note 7)
Financial Statement Data (in thousands of dollars) Fiscal Year 2014-2015 281,854 Fiscal Year 2013-2014 356,355 Variance (+Increase / -Decrease) -74,501 Percentage (+Increase / -Decrease) -21% Explanation of Major Variances Variance $ Variance % Payments for settled claims are generally made over a number of years. The settled claim liability represents the present value of the future scheduled claim payments of all outstanding settled claims. The total decrease in the liability is due to a combination of the following: - $87.4M payments made in 2014-15 which reduced the total liability. - Offset by $12.9M increase in present value.
-74,501 -21%
Total Explained -74,501 -21% Total Unexplained 0 0%

9 NCR#7661921 - v20
A 4 – Provision for Claims and Litigation (Financial Reporting Account 21433) (2014-2015 AANDC Financial Note 6)
Financial Statement Data (in thousands of dollars)
Fiscal Year 2014-15 10,635,848 Fiscal Year 2013-15 9,755,837 Variance (+Increase / -Decrease) 880,011 Percentage (+Increase / -Decrease) 9% Explanation of Major Variances Variance $ Variance % Specific Claims (including claims filed at the Specific Claim Tribunal) The increase in balance is explained by 44 new claims that were added to the inventory ($290M) which was offset by settlements of 15 claims ($36M) as well as the removal of 8 claims ($70M) because they were withdrawn, invalid or did not demonstrate a lawful obligation. The remaining variance is explained by changes in valuation due to claims progressing through the process and changes in the Consumer Price Index (CPI) rates.
193,096 2%
Indian Residential School Claims The majority of this variance is due to a combination of the following: - 6,020 claims were settled for a total of $386M; - A decrease in the total of claim estimate from 33,670 to 33,170; - Revisions to the estimation of settlement amounts which impacts the estimated liability.
-479,115 -5%
Comprehensive Native Land Claims The increase in balance is attributed to the recognition of an additional five claims with a likely status; two claims were changed from inactive to Agreement-in-Principal Status and three British Columbia claims were added with a status of Agreement-in-Principal. In addition, inflationary changes (Final Domestic Demand Implicit Price Index) and population increases over the noted period further increased the amount.
927,425 10%

10 NCR#7661921 - v20
Litigation The majority of this increase is due to the approval three negotiation mandates ($245M). This was offset by seven settlements (-$2M) and one discontinuance (-$4M).
238,560 2%
Non-Litigation The increase is due to the addition of new claims in the Corporate Labour Relations Branch
45 0%
Total Explained 880,011 9% Total Unexplained 0 0%

11 NCR#7661921 - v20
A 5 – Environmental Liabilities (Financial Reporting Account 21433)
(2014-2015 AANDC Financial Statement Note 8)
Financial Statement Data (in thousands of dollars) Fiscal Year 2014-2015 3,000,346 Fiscal Year 2013-2014 2,702,986 Variance (+Increase / -Decrease) 297,360 Percentage (+Increase / -Decrease) 11% Explanation of Major Variances Variance $ Variance %
The total liability for Faro Mine (in the Northern region) increased in 2014-2015. The main reason is due to the costs for additional care and maintenance and program management activities for a 3-year delay in the commencement of remediation activities for the contaminated sites related to North Fork Rose Creek. The total liability for Giant Mine (in the Northern region) has increased due to the costs of additional care and maintenance and program management activities resulting from 26 additional measures included in the Environmental Assessment which will cause a 4-year delay in the project definition phase of the project. Furthermore, an increase in the Consumer Price Index (CPI) rate used in the calculation of the cost estimate for contaminated sites resulted in an increase of the liability.
325,861
12%
A decrease of liability in the Northern Region for Fuel related Practices resulted from a combination of the following: - Expenditures reducing liability to existing sites (-$4M); -Site closures and more accurate data becoming available reducing liability (- $27M).
-31,803 -1%

12 NCR#7661921 - v20
A decrease of liability in the Northern Region for Others resulted from a combination of the following: - Expenditures reducing liability to existing sites (-$2M); -Site closures and more accurate data becoming available reducing liability (- $8M).
-10,003 0%
An increase of liability in the Southern region resulted from a combination of the following: - Expenditures reducing liability to existing sites (- $18M); - More accurate data becoming available increasing liability ($28M).
13,552 1%
Total Explained 297,607 11% Total Unexplained -247 0%
13 NCR#7661921 - v20
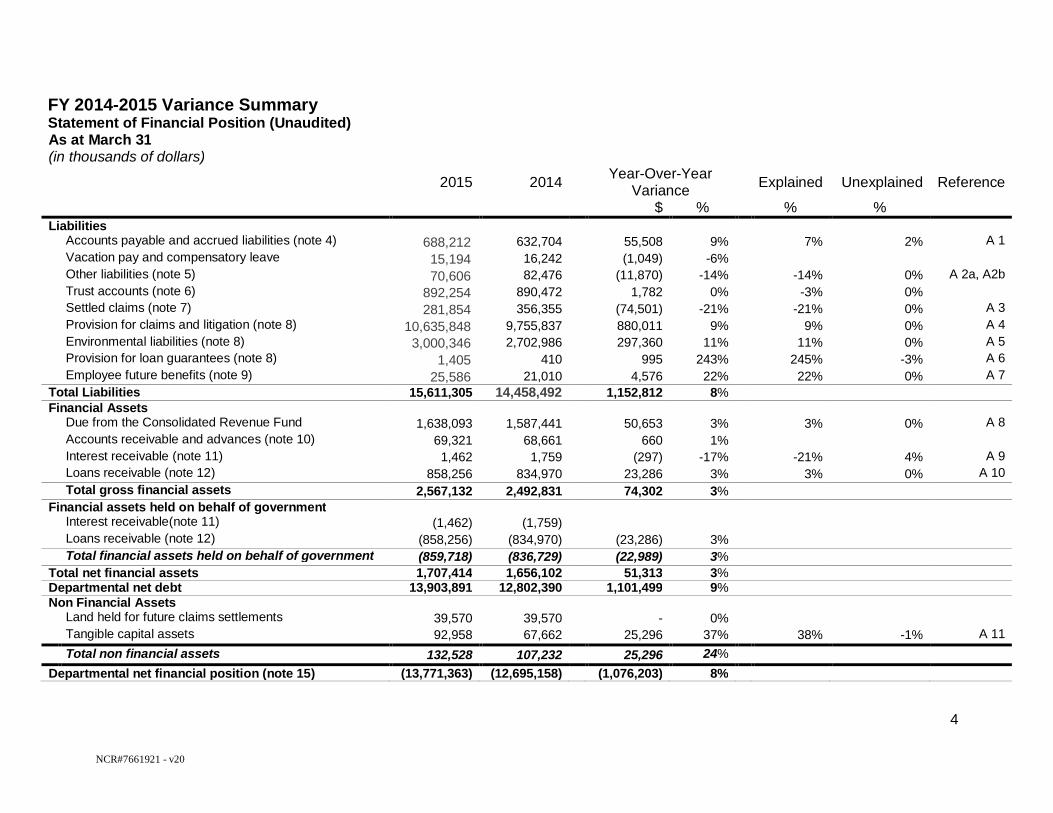
A 6 – Provision for Loan Guarantees
(2014-2015 AANDC Financial Statements Note 8)
Financial Statement Data (In thousands of dollars) Fiscal Year 2014-2015 1,405 Fiscal Year 2013-2014 410 Variance (+Increase / -Decrease) 995 Percentage (+Increase / -Decrease) 243% Explanation of Major Variances Variance $ Variance % Provision for Losses - On Reserve Housing Guarantees: In 2014-15, AANDC changed the methodology to assess future recoveries on defaulted loans consistent with the Public Sector Accounting Board Handbook Section PS 3300.25- Contingent Liabilities. This resulted in an increase to the provision for losses of $1 million. In addition, there was a new default in the amount of $10,444 that further increased the estimate of the provision for losses.
1,006 245%
Total Explained 1,006 245% Total Unexplained -11 -3%

14 NCR#7661921 - v20
A 7 – Employee Future Benefits (Financial Reporting Account 21415)
(2014-2015 AANDC Financial Statements Note 9)
Financial Statement Data (in thousands of dollars) Fiscal Year 2014-2015 25,586 Fiscal Year 2013-2014 21,010 Variance (+Increase / -Decrease) 4,576 Percentage (+Increase / -Decrease) 22% Explanation of Major Variances Variance $ Variance %
The Employee Severance Benefit Liability is based on a calculation promulgated by the Office of the Comptroller General of Canada. The increase in the liability is due to an increase in the Treasury Board of Canada Secretariat (TBS) Employee Severance Benefit Liability Rate by 2.04% from 5.84% to 7.88%.
4,524 22%
Total Explained 4,524 22% Total Unexplained 52 0%

15 NCR#7661921 - v20
A 8 – Due from the Consolidated Revenue Fund (Financial Reporting Account 11242, 13314, 13315, 13392, 21111, 21112, 21113, 21119,
21128, 21132, 21134, 21151, 21613, 23211, 23213, 23214, 23221, 23222, 23223, 23225, 23441, 23442)
Financial Statement Data (in thousands of dollars) Fiscal Year 2014-2015 1,638,094 Fiscal Year 2013-2014 1,587,441 Variance (+Increase/ -Decrease) 50,653 Percentage (+Increase/ -Decrease) 3% Explanation of Major Variances The increase in the account Due from the Consolidated Revenue Fund is attributed mainly to the overall increase Accounts payable and accrued liabilities. Here is the breakdown (details are available in the Statement of Financial Position Tab 1): 1- Increase of $51,297M in Payables at Year-End for Transfer Payments; 2- Increase of $10,424M in Accrued liabilities for Salary and wages; 3- Decrease of $19,501M in Payables at Year- End for Regular suppliers.

16 NCR#7661921 - v20
A 9 – Interest Receivable (Financial Reporting Account 11234 , 11239)
(2014-2015 AANDC Financial Statement Note 11)
Financial Statement Data (in thousands of dollars) Fiscal Year 2014-2015 1,462 Fiscal Year 2013-2014 1,759 Variance (+Increase / -Decrease) -297 Percentage (+Increase / -Decrease) -17% Explanation of Major Variances Variance $ Variance % Direct Loans The interest receivable related to Direct Loans decreased because loan repayments are ongoing and the Principal amount is steadily decreasing. Hence, the portion related to accrued interest steadily decreases accordingly.
-190 -11%
Guaranteed Loans - Defaulted Guaranteed Loans Interest increased due to loans not being repaid and high interest rates accruing on outstanding balances.
1,741 99%
Guaranteed Loans and Direct Loans - Allowance for Doubtful Account The allowance related to doubtful interest receivable has increased with the addition of new doubtful accounts in Guaranteed Loans for Housing and Indian Economic Development Guarantees in the amount of $2.2M. That increase was offset by a decrease in the allowance for interest related to Direct Loans in the amount of $253,000.
-1,918 -109%
Total Explained -367 -21% Total Unexplained 70 4%

17 NCR#7661921 - v20
A 10 – Loans Receivable (Financial Reporting Account 11234, 11239, 1333X, 1337X, 1338X, 13399, 13439)
(2014-2015 AANDC Financial Statement Note 12)
Financial Statement Data (in thousands of dollars) Fiscal Year 2014-2015 858,256 Fiscal Year 2013-2014 834,970 Variance (+Increase / -Decrease) 23,286 Percentage (+Increase / -Decrease) 3% Explanation of Major Variances Variance $ Variance % Direct Loans: British Columbia Treaty Commission - First Nations in British Columbia: The number of loans to First Nations in British Columbia increased from 6,243 in 2013-2014 to 6,490 in 2014-2015 with the issuance of new loans of $22M, offset by loan repayments of $1.8M, resulting in a $20.2M increase in outstanding loans balances.
20,186 2%
Direct Loans: Native Claimants: The number of loans to Native Claimants increased from 2,619 in 2014-2015 to 2,646 in 2013-2014 due to the issuance of new loans in the amount of $16.5M, offset by loan repayments of $11M. This resulted in a $5.5M net increase in the outstanding loan balance.
5,448 1%
Total Explained 25,634 3% Total Unexplained -2,348 0%

18 NCR#7661921 - v20
A 11 – Tangible Capital Assets (Financial Reporting Account 161XX, 163XX, and 514XX)
(2014-2015 AANDC Financial Statement Note 14)
Financial Statement Data (in thousands of dollars) Fiscal Year 2014-2015 92,958 Fiscal Year 2013-2014 67,662 Variance (+Increase / -Decrease) 25,296 Percentage (+Increase / -Decrease) 37% Explanation of Major Variances Variance $ Variance % The capitalization of Work in Progress (WIP) costs related to the Canadian High Arctic Research Station (CHARS) project account for $26M of the increase in capital assets. 26,244 39% This variance is attributed to the transfer of WIP costs incurred during the upgrade and betterment of purchased\developed informatics software. The effects of this WIP transfer are as follows: 1) Increase in computer purchased and developed software account to capitalize WIP software ($9,031); 2) Increase in accumulated amortization on computer purchased and developed software account to recognized the accumulated amortization due to the transferred software (-$5,646); 3) Decrease in work in progress for software account showing the transfer of the software from WIP to capital asset (-$1,408).
1,977 3%
This variance is as a result of assets transferred to the Government of the North West Territories in relation to the NWT devolution. The resulting effects of this event are: 1) a decrease in the buildings account to remove the costs of the assets written off (-$4,859); 2) a decrease in accumulated amortization to remove the accumulated amortization due to the assets written off ($2,107).
-2,752 -4%
Total Explained 25,469 38% Total Unexplained -173 -1%

19 NCR#7661921 - v20
Part B – Statement of Operations

20 NCR#7661921 - v20
B 1 – Statement of Operations – 2014-2015 versus 2013-2014
For the Year Ended March 31 (in thousands of dollars) 2015 2014 Year-Over-Year Variance $ % Expenses People 3,786,451 3,389,603 396,848 12% Land and Economy 1,623,181 1,417,535 205,646 15% Government 2,400,738 1,336,544 1,064,194 80% North 655,183 595,255 59,928 10% Internal Services 324,718 402,579 (77,861) -19% Expenses incurred on behalf of Government (5,883) 8,906 (14,789) -166% Total expenses 8,784,388 7,150,422 1,633,966 23% Revenues Norman Wells project profits 74,779 83,503 (8,724) -10% Resource royalties 59,541 16,283 43,258 266% Interest on loans 7,761 6,168 1,593 26% Leases and rentals 1,670 2,665 (995) -37% Miscellaneous 2,005 5,021 (3,016) -60% Finance and administrative services 3,135 690 2,445 354% Revenues earned on behalf of Government (143,080) (112,870) (30,210) 27% Total revenues 5,811 1,460 4,351 298% Net cost from continuing operations 8,778,577 7,148,962 1,629,625 23%

21 NCR#7661921 - v20
Highlights of Major Variances – Statement of Operations 2014-15 versus 2013-2014 EXPENSES
There were no significant changes to the Department’s strategic outcomes from 2013-2014 to 2014-2015. Additionally, no material adjustments were made to the strategic outcomes during the year. The explanation of individual variances grouped by strategic outcomes can be found in the expense variance summaries in part C.
People The increase is largely explained by the change in the provision for claims and litigation for litigation claims, non-litigation claims and Indian Residential Schools claims (See C9 on page 34).
Land and Economy The increase is mainly attributed to an increase of transfer payments as a result of increase funding for Infrastructure and Capacity in 2014-2015.
Government The increase is explained by an increase in the change in the provision for claims and litigation for specific claims and comprehensive claims (See C6 on page 31).
North The decrease is explained by the change in the provision for environmental liabilities in the Northern Region (See C4 on page 29 and C10 on page 35).
Internal Services
The decrease primarily resulted from the combination of the following: - decrease in court award and other settlements - reduction of legal services payments - expenditures were reallocated from expenses such as Professional Services to WIP (Work in Progress) or capital assets accounts for internally developed projects and the construction of the Canadian High Arctic Research Station (CHARS).
REVENUE
Variance analysis for revenue is provided in Part D “Revenue – Note 19 Segmented Information”.

22 NCR#7661921 - v20
B 2 – Statement of Operations – Actual versus Planned
For the Year Ended March 31 (in thousands of dollars) 2015 2015 Variance (Actual versus Planned) Planned $ % Expenses People 3,786,451 3,615,556 (170,895) -5% Land and Economy 1,623,181 1,456,886 (166,295) 10% Government 2,400,738 1,811,253 (589,485) -25% North 655,182 86,256 (568,926) -87% Internal Services 324,718 273,305 (51,413) -16% Expenses incurred on behalf of
Government (5,883) (4,612) 1,271 -22%
Total expenses 8,784,387 7,238,644 (1,545,743) -164% Revenues Resource royalties 59,541 49,629 38,727 65% Norman Wells project 74,779 98,268 (25,150) -34% Interest on loans 7,761 5,955 (1,806) -23% Leases and rentals 1,670 724 2,107 126% Miscellaneous 2,005 3,777 (1,281) -64% Finance and administrative services 3,135 710 (2,425) -77% Revenues earned on behalf of
Government (143,080) (157,351) (14,271) 10%
Total revenues 5,811 1,712 (4,099) -71% Net cost from continuing operations 8,778,576 7,236,932 (1,541,644) -18%

23 NCR#7661921 - v20
Highlights of Major Variances – Statement of Operations
Actual versus Planned 2015 Planned Results
The forecasted financial information for 2014-2015 only included amounts presented in the 2014-2015 Report on Plan and Priorities. The Supplementary Estimates C was not included in the 2014-2015 forecasts.
Accruals for new contingent liabilities for claims and litigations and new environmental liabilities were excluded from the forecast as they could not be reasonably foreseen or quantified.
EXPENSES
Land and Economy
The variance between actual and planned for Land and Economy is due to an increase in transfer payment authorities made available through Supplementary Estimates, the majority of which were for the following programs: Urban Aboriginal Participation, Infrastructure and Capacity and Community Developments.
Government
The variance between the actual and planned is explained by an increase in the actual provision for claims and litigation for specific claims and comprehensive claims (See C9 on page 34).
North
The North presents the highest variance between actual and planned amounts. The variance is largely attributed to an increase in accrued environmental liabilities recorded for the northern regions (see C4 on page 29 and C10 on page 35) while a decrease was forecasted for remediation of existing contaminated sites.
Internal Services
The variance is largely attributed to the variance between actual and forecasted refund of prior year expenses ($45.7M). The actual refunds of prior year figures are higher than forecasted number using historical data.
REVENUES
Resource Royalties
The variance is explained by an increase in mining royalty revenue due to diamond mines exhausting the remaining of their deduction pools which in turn generates higher royalty payables to AANDC than usual (See D2 on page 49).

24 NCR#7661921 - v20
Norman Wells Project Profits
The total amount of revenue for Norman Wells profit-sharing is lower than forecasted due to the decrease in average crude oil price, a pipeline leak and cleanup costs which were incurred in May 2011 but affecting AANDC revenues in 2014-2015 (See D1 on page 48).
Interest on Loans
The interest accrued on defaulted Ministerial Loan Guarantees is higher than forecasted due to a system issue uncovered at year-end. The debt management module of AANDC’s Grants and Contributions Information Management System (GCIMS) which calculates interest will be corrected in 2015-2016.
Leases and Rentals
The actual lease and rental revenue is higher than forecasted because a significant portion was subject to transfer under the NWT devolution. The forecasted leases and rental revenue excluded revenue subject to the transfer.
Miscellaneous Revenue
The variance between the planned and actual 2014-2015 actual revenue is due to an extraordinary, refund of revenue reducing 2014-2015 actuals (See D4 on page 51).
Finance and Administrative Services
The variance between the planned and actual 2014-2015 actual revenue is explained by two new agreements signed with Health Canada and the Public Health Agency of Canada in 2014-15.

25 NCR#7661921 - v20
Part C – Expenses – Note 19 – Segmented Information As at March 31
(in thousands of dollars)
2015 2014 Yr-Over-Yr Variance Explained Unexplained Ref.
$ % % % Transfer Payments
First Nations 5,323,039 5,511,630 (188,591) -3% -4% 1% C 1 Industry 76,574 104,795 (28,221) -27% -26% -1% C 3 Non-Profit Organizations 65,386 41,473 23,913 58% 58% 0% C 5 Other 646 547 99 18% Provincial/territorial governments and institutions 897,697 857,128 40,569 5% 5% 0% C 2 Environmental liabilities 103,219 40,358 99,861 156% 155% 1% C 4 Claims and litigation 1,120,521 (264,251) 1,384,772 524% 524% 0% C 6 Refunds/adjustments on prior years expenditures (49,954) (53,895) 3,941 -7% Total Transfer Payments 7,537,128 6,237,785 1,336,343 21%
Operating Expenses Accommodations 37,569 41,836 (4,267) -10% Amortization expense 8,020 8,677 (657) -8% Bad debt expense 11,310 2,479 8,831 356% 292% 65% C 15 Claims and litigation (240,511) (694,837) 454,326 65% 65% 0% C 9 Court awards and other settlements 385,431 517,872 (132,441) -26% -26% 0% C 8 Information services 12,058 12,727 (669) -5% Machinery and equipment 6,491 16,762 (10,271) -61% -60% -1% C 16 Other 13,848 8,971 4,877 54% -53% -2% C 18 Professional and special services 229,534 204,785 24,749 12% 7% 5% C 11 Legal services 84,307 117,880 (33,573) -28% -27% -1% C 12 Rentals of buildings and machinery 14,965 12,631 2,334 18% 18% 0% C 14 Repair and maintenance 3,140 2,616 524 20% Transportation and telecommunications 2,460 2,790 (330) -12% Travel and relocation 24,518 22,791 1,727 8% 8% 0% C 13 Utilities, materials and supplies 4,036 5,134 (1,098) -21% -25% 4% C 17 Refunds/adjustments to prior year expenditures (17,595) (18,991) 1,396 -7% Environmental liabilities 194,141 131,795 25,346 47% 48% -1% C 10 Salaries and employee future benefits 479,420 507,813 (28,393) -6% -6% 0% C 7 Expenses incurred on behalf of government (5,883) 8,906 (14,789) -166% 0% -166% C 19
Total Operating Expenses 1,247,260 912,637 297,622 33% Total Expenses 8,784,388 7,150,422 1,633,965 23%

26 NCR#7661921 - v20
C 1 – First Nations (Transfer Payments)
Variance Summary - First Nations (Transfer Payments)
(Financial Reporting Account 51171, 51118)
Financial Statement Data (in thousands of dollars) Fiscal Year 2014-2015 5,323,039 Fiscal Year 2013-2014 5,511,630 Variance (+Increase / -Decrease) -188,591 Percentage (+Increase / -Decrease) -3%
Explanation of Major Variances Variance $ Variance %
In fiscal year 2013-2014, a one-time settlement payment of $124M to the Nipissing First Nation was made for a specific claim.
-124,504 -2%
In fiscal year 2013-2014, a one-time settlement payment of $120M settlement payment to the Chippewas Thames First Nation was made for a specific claim.
-119,960 -2%
Total Explained -244,464 -4%
Total Unexplained 55,873 1%

27 NCR#7661921 - v20
C 2 – Provincial/Territorial Governments and Institutions (Transfer Payments)
Variance Summary - Provincial/Territorial Governments and Institutions (Transfer Payments)
(Financial Reporting Account 51139)
Financial Statement Data (in thousands of dollars) Fiscal Year 2014-2015 897,697 Fiscal Year 2013-2014 857,128 Variance (+Increase / -Decrease) 40,569 Percentage (+Increase / -Decrease) 5% Explanation of Major Variances Variance $ Variance %
The variance is due to offsetting coding reclassifications, an increase in recurring funding agreements, as well as an increase in emergency response funding. More specific details are:
- Reclassification between transfer payments to Industry (C 3) and to Provincial/Territorial Governments and Institutions (C 2);
- The Government of Yukon agreements increased by $12,297;
- The Government of Ontario 1965 Welfare agreement funding increased by $19,213;
- Emergency response funding increased by $7,645.
40,569 5%
Total Explained 40,569 5% Total Unexplained 0 0%

28 NCR#7661921 - v20
C 3 – Industry (Transfer Payments)
Variance Summary - Industry (Transfer Payments)
(Financial Reporting Account 51171) (2014-15 AANDC Financial Statements Note 8)
Financial Statement Data (in thousands of dollars)
Fiscal Year 2014-2015 76,574
Fiscal Year 2013-2014 104,795
Variance (+Increase / -Decrease) -28,221
Percentage (+Increase / -Decrease) -27%
Explanation of Major Variances Variance $ Variance %
A company was hired as an alternate service provider to First Nations for Social Development programs. A reclassification of expenditures resulted in a year over year offsetting variances for transfer payments to Industry (C 3) and for Non-profit Organizations (C 5) in the amount of $12M. The remaining $2M variance is due to a decrease in activity volume as a third party manager.
-14,074 -13%
A single payment made to a consulting company in fiscal year 13-14 was not repeated in 14-15. -9,415 -9%
A coding reclassification resulted in offsetting variances between transfer payments to Industry (C 3) and to Provincial/Territorial Governments and Institutions (C 2) in the amount of $4M.
-4,090 -4%
Total Explained -27,578 -26%
Total Unexplained -643 -1%

29 NCR#7661921 - v20
C 4 – Contaminated Sites (Transfer Payments) Variance Summary - Contaminated Sites (Transfer Payments)
(Financial Reporting Account 51171)
Financial Statement Data (in thousands of dollars) Fiscal Year 2014-2015 103,219 Fiscal Year 2013-2014 40,358 Variance (+Increase / -Decrease) 62,861 Percentage (+Increase / -Decrease) 156% Explanation of Major Variances Variance $ Variance %
This represents the change in the Environmental Liability and corresponding expense that is allocated to transfer payment expense.
Southern Region: There was an increase of $14,533K Grants and Contributions (G&C) transfer payment expense as a result of an increase in the liability in 2014-15. The majority of the increase in environmental liabilities is attributed to an increase in cost estimates by $29M and additional liability of $3.5M for 17 new sites, offset by actual expenditures reducing the liabilities by $18M. In 2013-2014, there was a $25M G&C transfer payment expense decrease. Therefore, total G&C transfer payment expense variance in the southern region from 2013-14 to 2014-15 was $39.2M.
39,225 97%
Northern Region: An expense in the amount of $89M for G&C transfer payment was recorded in the northern region in 14-15. The total environmental liability increased by $284M, of which $89M (31%) is recorded as a transfer payment expense based on the actual percentage of total remediation expenditure in 2014-2015. This increase can be broken by territory as follows: - Increase of $55M in the Yukon - Increase $43M in the North West Territories - Decrease of $9.5M in Nunavut. The majority of the increase in environmental liabilities is attributed to an increase in estimates for Faro Mine and Giant Mine as well as additional liability resulting from the addition of two sites in the Nunavut and Yukon. This was partially offset by actual expenditures reducing the liability. In 2013-2014, the liability increase which was allocated to G&C expense in the northern region was $65M. Therefore, the total G&C expense variance in the northern region from 2013-14 to 2014-15 is $ 23.6M.
23,636 59%
Total Explained 62,861 156%
Total Unexplained 0 0%

30 NCR#7661921 - v20
C 5 – Non-Profit Organization (Transfer Payments)
Variance Summary - Non-Profit Organization (Transfer Payments)
Financial Statement Data (in thousands of dollars) Fiscal Year 2014-2015 65,386 Fiscal Year 2013-2014 41,473 Variance (+Increase / -Decrease) 23,913 Percentage (+Increase / -Decrease) 58% Explanation of Major Variances Variance $ Variance %
CANADIAN RED CROSS - Funding increased in particular due to Emergency Response and Recovery activities. 4,309 10%
NORTHERN WATERWORKS - This variance is due to new agreements that increased funding by $2M. 2,040 5%
BC SMITH&ASSOCIATES- This company was hired as an alternate service provider to First Nations for Social Development programs. An expenditure reclassification resulted in offsetting variances between transfer payments to Industry (C 3) and to Non-profit Organizations (C 5) in the amount of $12M.
12,010 29%
NAV CANADA - This is funding to forest fire Non-Profit Organization due to extensive forest fires in Quebec. 5,585 13%
Total Explained 23,945 58% Total Unexplained -32 0%

31 NCR#7661921 - v20
C 6 – Claims and Litigation (Transfer Payments)
Variance Summary - Claims and Litigation (Transfer Payments)
(Financial Reporting Account 51171) (2014-15 AANDC Financial Statements Note 8)
Financial Statement Data (in thousands of dollars) Fiscal Year 2014-2015 1,120,521 Fiscal Year 2013-2014 -264,251 Variance (+Increase / -Decrease) 1,384,772 Percentage (+Increase / -Decrease) 524%
Explanation of Major Variances
This expense represents the change in the Provision for Claims and Litigation for specific claims and comprehensive claims. The provision for claims increased mainly due to an increase in the provision for Comprehensive Land Claims (+$927M) which is due to the addition of five claims included in the provision with a likely status. In addition, inflationary changes and population increases also contributed to the increase. The Specific Claims provision increased by $193M due to the addition of 44 new claims with a likely status that were added to the inventory ($290M) which was partially offset by the settlement of 15 claims ($36M) as well as the removal of 8 claims ($70M).

32 NCR#7661921 - v20
C 7 – Salary and Employee Future Benefits
Variance Summary - Salary and Employee Future Benefits
(Financial Reporting Account 51311, 51312, 51846)
Financial Statement Data (in thousands of dollars)
Fiscal Year 2014-2015 479,420
Fiscal Year 2013-2014 507,813
Variance (+Increase / -Decrease) -28,393
Percentage (+Increase / -Decrease) -6%
Explanation of Major Variances Variance $ Variance %
Moving from fiscal year 2013-2014 to 2014-2015 the overall Full Time Equivalents (FTE) showed a reduction of 6.1%. This led to a similar reduction in the salaries and wages expense.
-28,043 -6%
Total Explained -28,043 -6%
Total Unexplained -350 0%

33 NCR#7661921 - v20
C 8 – Court Awards and Other Settlement
Variance Summary - Court Awards and Other Settlement
(Financial Reporting Account 51722) (2014-15 AANDC Financial Statements Note 8)
Financial Statement Data (in thousands of dollars) Fiscal Year 2014-2015 385,431 Fiscal Year 2013-2014 517,872 Variance (+Increase / -Decrease) -132,441 Percentage (+Increase / -Decrease) -26%
Explanation of Major Variances
These expenses are related to the settlement claims against the Crown, and court awards. Decrease of $132M in the 2014-15 expenses: The majority of the decrease is due to the settlement of a litigation claim in 2013-14: Slate Falls Nation v. The AG (Canada) and Ontario Power Generation Inc. ($57.5M). In addition, expenses related to payments of settlements for Indian Residential Schools Claims decreased by $74.92M due to a decrease in the average settlement payment.
34 NCR#7661921 - v20
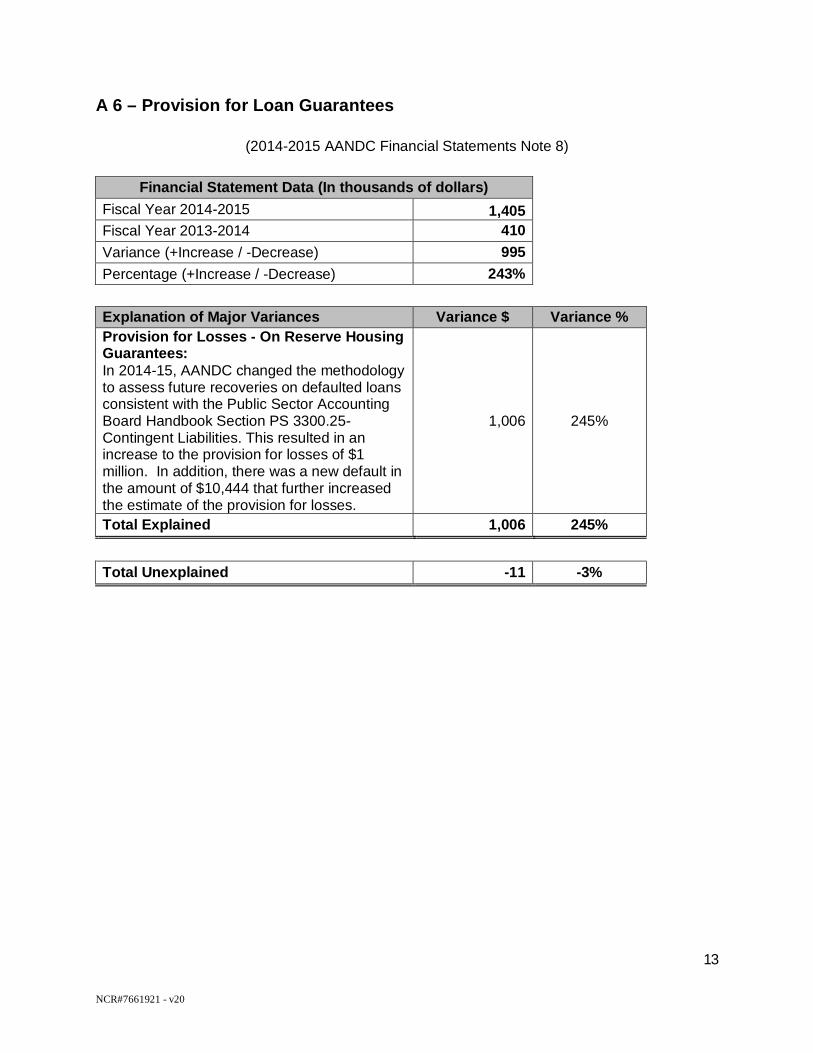
C 9 – Claims and Litigation (Operating Expenses)
Variance Summary - Claims and Litigation (Operating Expenses)
(Financial Reporting Account 51722) (2014-15 AANDC Financial Statements Note 8)
Financial Statement Data (in thousands of dollars) Fiscal Year 2014-2015 -240,511 Fiscal Year 2013-2014 -694,837 Variance (+Increase / -Decrease) 454,326 Percentage (+Increase / -Decrease) 65%
Explanation of Major Variances
The expense under this line item represents the change in the Provision for Claims and Litigation. The provision includes litigation claims, non-litigation claims and Indian Residential Schools Claims. The expense decreased by less in 2014-2015 as compared to the previous year as a result of less settlements for litigation and non-litigation ($2M in 2014-2015 rather than $69M 2013-2014). The expense due to settlements was partially offset by the addition of three new mandates for litigation claims which was greater than the new claims added in 2014-2015. The provision has decreased in the past two years due to the settlement of Indian Residential Schools Claims however the decrease for 2014-2015 was not significant compared to 2013-2014 due to a reduction in the average dollar payment amount per settlement. The combination of lower settlements and added negotiation mandates resulted in a lower expense for 2014-15 as compared to 2013-14.

35 NCR#7661921 - v20
C 10 – Contaminated Sites (Operating Expenses)
Variance Summary - Contaminated Sites (Operating Expenses) (Financial Reporting Account 51321)
(2014-2015 AANDC Financial Statements Note 8) Financial Statement Data (in thousands of dollars)
Fiscal Year 2014-2015 194,141 Fiscal Year 2013-2014 131,795 Variance (+Increase / -Decrease) 62,347 Percentage (+Increase / -Decrease) 47%
Explanation of Major Variances Variance $ Variance
% This represents the change in the Environmental Liability balance and corresponding expense which is allocated to operating and maintenance (O&M) expenses. The majority of the increase in O&M operating expenses occurred in the northern region. The total liability increased by $284M, of which $195M (69%) is recorded as an operating expense based on the actual percentage of actual remediation expenditures in 2014-2015. This increase can be broken by territory as follows: - Increase of $134M in the Yukon - Increase $100M in the North West Territories - Decrease of $21M in Nunavut. The majority of the increase in environmental liabilities is attributed to an increase in estimates for Faro Mine and Giant Mine as well as additional liability resulting from the addition of two sites in the Yukon and Nunavut. This was partially offset by actual expenditures which reduce the liability (-$166M). The increase in the northern region was slightly offset by a decrease of $933K resulting from actual expenditures reducing the liability in the southern region. In 2013-14, the liability increase which was allocated to O&M expenses was $132M therefore; the total variance for O&M expenses in 2014-15 is $62M.
62,347 47%
Total Explained 62,347 47% Total Unexplained 0 0%

36 NCR#7661921 - v20
C 11 – Professional Services
Variance Summary - Professional Services
(Financial Reporting Account 51321)
Financial Statement Data (in thousands of dollars) Fiscal Year 2014-2015 229,534 Fiscal Year 2013-2014 204,785 Variance (+Increase / -Decrease) 24,749 Percentage (+Increase / -Decrease) 12%
Explanation of Major Variances Variance $ Variance %
A reclassification from legal services (C 12) to professional services (C 11) resulted in offsetting variances. 23,584 12%
Total Explained 23,584 12%
Total Unexplained 1,165 1%

37 NCR#7661921 - v20
C 12 – Legal Services
Variance Summary - Legal Services (Financial Reporting Account 51321)
Financial Statement Data (in thousands of dollars) Fiscal Year 2014-2015 84,307 Fiscal Year 2013-2014 117,880 Variance (+Increase / -Decrease) -33,573 Percentage (+Increase / -Decrease) -28% Explanation of Major Variances Variance $ Variance %
A reclassification from legal services (C 12) to professional services (C 11) resulted in offsetting variances. -23,584 -20%
There was a decrease in Legal Services for the Secretariat of the Adjudicator due to a reduction of the number of cases. -2,617 -2%
There was a decrease in Services provided by other departments without charge. -1,149 -1%
There was an overall decrease in legal service fees. -4,970 -4%
Total Explained -32,320 -27% Total Unexplained -1,253 -1%

38 NCR#7661921 - v20
C 13 – Travel and Relocation
Variance Summary - Travel and Relocation
(Financial Reporting Account 51321)
Financial Statement Data (in thousands of dollars)
Fiscal Year 2014-2015 24,518
Fiscal Year 2013-2014 22,791
Variance (+Increase / -Decrease) 1,727
Percentage (+Increase / -Decrease) 8%
Explanation of Major Variances Variance $ Variance %
The overall departmental travel expenditures increased in 2014-15. The 2014-15 annual budget limit for expenses related to travel and hospitality was $30.10M which is based on the 2013-14 actual spending on those activities. The actual amount spent totaled to $24.52M, well below the budget limit. The total travel expenses increased year-over-year by $1.73M of which $1.63M was due to the travel costs for public servants and non-public servants and a $0.1M was for employee relocation costs.
1,727 8%
Total Explained 1,727 8%
Total Unexplained 0 0%

39 NCR#7661921 - v20
C 14 – Rental of Buildings and Machinery
Variance Summary- Rental of Buildings and Machinery
(Financial Reporting Account 51321)
Financial Statement Data (in thousands of dollars) Fiscal Year 2014-2015 14,965 Fiscal Year 2013-2014 12,631 Variance (+Increase / -Decrease) 2,334 Percentage (+Increase / -Decrease) 18%
Explanation of Major Variances Variance $ Variance %
This variance represents an overall increase in expenses for license and maintenance fees for software that were related to Distributed Computing Environment (DCE).
3,572 28%
There is a reduction in spending on license and maintenance fees for application software as well as application development and delivery software. The majority of the decrease was due to reduced expenses for ORACLE financial systems, SAP transition expenses and other software.
-1,316 -10%
Total Explained 2,256 18%
Total Unexplained 78 0%

40 NCR#7661921 - v20
C 15 – Bad Debt Expenses
Variance Summary - Bad Debt Expenses
Financial Statement Data (in thousands of dollars) Fiscal Year 2014-2015 11,310 Fiscal Year 2013-2014 2,479 Variance (+Increase / -Decrease) 8,831 Percentage (+Increase / -Decrease) 356%
Explanation of Major Variances Variance $
Variance %
Allowance for doubtful accounts - Most of the increase is in Headquarters for the amount of $5.8 million due to accounts receivable deemed uncollectable under the Aboriginal Business Canada program (ABC Program)
5,784 233%
Guaranteed loans - The increase in the allowance for doubtful accounts is mostly due to the interest on outstanding defaulted loan guarantees in Ontario for the amount of $1.4 million.
1,445 58%
Total Explained 7,229 292%
Total Unexplained 1,602 65%

41 NCR#7661921 - v20
C 16 – Machinery and Equipment Variance Summary - Machinery and Equipment
(Financial Reporting Account 51321) (2014-15 AANDC Expense)
Financial Statement Data (in thousands of dollars)
Fiscal Year 2014-2015 6,491
Fiscal Year 2013-2014 16,762
Variance (+Increase / -Decrease) -10,271
Percentage (+Increase / -Decrease) -61%
Explanation of Major Variances Variance $ Variance %
The total expenditure for machinery and equipment significantly declined in 2014-15. This is because the bulk of purchases of furniture and fixtures and computer equipment occurred in 2013-14.
The expenses of furniture and fixtures decreased. There were significant purchases of furniture in the National Capital Region in 2013-14 due to the implementation of Workplace 2.0 projects.
-2,166 -13%
New desktop and laptop computers were purchased in 2013-2014. -2,058 -12%
There were significant purchases of software licenses to support application development in fiscal year 2013-14. -4,971 -30%
Multi-functional printers were purchased in 2013-14. -839 -5%
Total Explained -10,034 -60%
Total Unexplained -237 -1%

42 NCR#7661921 - v20
C 17 – Utilities, materials and supplies
Variance Summary - Utilities, materials and supplies
(Financial Reporting Account 51321)
Financial Statement Data (in thousands of dollars)
Fiscal Year 2014-2015 4,036
Fiscal Year 2013-2014 5,134
Variance (+Increase / -Decrease) -1,098
Percentage (+Increase / -Decrease) -21%
Explanation of Major Variances Variance $ Variance %
The reduction of $604,278 in the regions is mainly due to the Northwest Territories (NWT) Devolution. The expense of utilities, materials and supplies of NWT region was decreased by $521,904, and that of Yukon region was decreased by $71,232.
-604 -12%
The expense for utilities, materials and supplies in headquarters was reduced by $686,596 in 2014-15. -687 -13%
Total Explained -1,291 -25%
Total Unexplained 193 4%

43 NCR#7661921 - v20
C 18 – Operating Expenses - Other Variance Summary - Operating Expenses - Other
(Financial Reporting Account 51192, 51321, 51511, 51631, 51635, 51711, 51726, 51729, 51733)
Financial Statement Data (in thousands of dollars)
Fiscal Year 2014-2015 13,848
Fiscal Year 2013-2014 8,971
Variance (+Increase / -Decrease) 4,877
Percentage (+Increase / -Decrease) -54%
Explanation of Major Variances Variance $
Variance %
Econ 8295 - Other Payments Disbursement of Earmarked Fund - The payments from Environmental Studies Research Fund was increased by $2.3M compared to fiscal year 2013-14 as a result of the transfer of the surplus balance to GNWT subsequent to the NWT Devolution.
2,313 -26%
Econ 3469 - Charges to Other Liability Accounts The variance under Econ 3469 is attributed to the provision for losses on Reserve Housing Guarantees. The provision for losses has increased due to a change in the forecasting methodology in 2014-15 for recoveries on defaulted loans which is used in the estimate of the provision for losses of $1 million. The change of the methodology decreased the forecasted recoveries which increased the estimated provision for losses. Also, there was a new default for the amount of $10,444 in On Reserve Housing program that further increased the estimated provision for losses. In total, the provision for losses was increased by $0.995M.
995 -11%
Econ 3425 - Reallocation of Expenditures/Costs within a Department
- A loss of $2.6M on disposal of physical assets was incurred due to NWT devolution.
- In 2013-14, corporate accounting undertook an asset validation exercise and made adjustments accordingly which resulted in a credit of $1.4M in the Other Expense Account. This exercise was not repeated in 2014-15.
3,978 -44%

44 NCR#7661921 - v20
Econ 3259 - Miscellaneous Expenditures not Elsewhere Classified The total expense under Econ 3259 was reduced by $2.57M, which is explained by the following: 1. An expenditure of $1.79M related to Indian Residential School claim settlement in 2013-14 was not repeated in 2014-15. 2. An amount of -$1.42M is due to the recovery from a crown corporation’s instalments payable to a First Nation recipient. 3. A clean-up in the amount of - $0.71M was undertaken by corporate accounting in 2013-14 in order to prepare the conversion from Oracle to SAP. This activity was not repeated in 2014-15. 4. The royalties distributed to First Nations increased by $1.35M year-over-year due to the increase in mining and oil & gas resource revenues.
-2,571 29%
Total Explained 4,715 -53%
Total Unexplained 162 -2%

45 NCR#7661921 - v20
C 19 – Expenses incurred on behalf of Government
Variance Summary - Expenses incurred on behalf of Government
(Financial Reporting Account 51732, 51171)
Financial Statement Data (in thousands of dollars)
Fiscal Year 2014-2015 -5,883
Fiscal Year 2013-2014 8,906
Variance (+Increase / -Decrease) -14,789
Percentage (+Increase / -Decrease) -166%
Explanation of Major Variances Variance $ Variance %
Expenses incurred on behalf of government are a line item within the Statement of Operations as per the government reporting standards. AANDC does not hold the account within its financial reporting system and it is reported only for presentation purposes. Expenses incurred on behalf of government are an offset to the gross expenses and are calculated from the AANDC's bad debt expenses related to loans and interest receivable (assets held on behalf of government). When bad debt expenses increase, the expenses incurred on behalf of government decrease. If the bad debt expenses decrease, the expenses incurred on behalf of government increase. The majority of the variance is related to Direct Loans - Native Claimants.
- -
Total Explained 0 0%
Total Unexplained -14,789 -166%
46 NCR#7661921 - v20
Part D – Revenues – Note 19 – Segmented Information

47 NCR#7661921 - v20
Revenue - Note 19 Segmented Information (Unaudited)
As at March 31 (in thousands of dollars)
2015 2014 Yr-Over-Yr Variance Explained Unexplained Reference $ % % % Revenues
Norman Wells project profits 74,779 83,503 (8,724) -10% -18% 7% REV 1
Resource royalties 59,541 16,283 43,258 266% 266% -1% REV 2
Interest on loans 7,761 6,168 1,593 26% 26% 0% REV 3 Miscellaneous 2,005 5,021 (3,016) -60% -60% 0% REV 4
Leases and rentals 1,670 2,665 (995) -37% -37% 0% REV 5 Finance and administrative services 3,135 690 2,445 354% Revenues earned on behalf of Government (143,080) (112,870) (30,210) 27% NOTE
Total Revenues 5,811 1,460 (4,351) 298%
NOTE: Revenues earned on behalf of Government
All revenues, except "Finance and administrative services" and "Gain on sale of crown assets", are included in Revenues earned on behalf of Government.

48 NCR#7661921 - v20
D 1 – Norman Wells Project Profits
Variance Summary - Norman Wells Project Profits
(Financial Reporting Account 42129)
Financial Statement Data (in thousands of dollars) Fiscal Year 2014-2015 74,779 Fiscal Year 2013-2014 83,503 Variance (+Increase / -Decrease) -8,724 Percentage (+Increase / -Decrease) -10%
Explanation of Major Variances Variance $ Variance %
The total amount of revenue for Norman Wells profit sharing has decreased by $8.7M due to the following reasons:
1. A decrease in average crude oil price. 2. A pipeline leak and cleanup costs incurred in May
2011 but charged in 2014. 3. A decrease in gas sales and a refund of $1M to the
Town of Norman Wells as per the Gas Supply Termination Agreement.
4. A pipeline surcharge to a petroleum company for exceeding a maximum monthly volume stipulated in an Inducement Agreement for production years 2010-2014 for $0.95M.
-8,724 -10%
Total Explained -8,724 -10%
Total Unexplained 0 0%

49 NCR#7661921 - v20
D 2 – Resource Royalties
Variance Summary - Resource Royalties
(Financial Reporting Account 42311)
Financial Statement Data (in thousands of dollars) Fiscal Year 2014-2015 59,541 Fiscal Year 2013-2014 16,283 Variance (+Increase / -Decrease) 43,258 Percentage (+Increase / -Decrease) 266%
Explanation of Major Variances Variance $ Variance %
Mining Royalties - The amount collected in royalty revenues for 2014-15 increased from the previous year by $54M. This is due to a credit issued in 2013-14 to a diamond mine in the amount of $20M related to royalties earned in 2008 after a re-statement was received. In addition, three months of royalties due from 2014 were received by AANDC for diamonds related to the sale of the mine. Two diamond mines have exhausted the remainder of their deduction pools which in turn generated higher royalty revenue for AANDC than in previous years. Furthermore, the increase price of diamond in 2014-2015 has increased the royalty revenue.
52,973 325%
Oil and Gas – The resource royalty decreased by $8.3M in oil and gas as a result of the NWT devolution. As of April 2014, the collection of oil and gas royalty from the production fields in NWT falls in GNWT`s jurisdiction. As a result of the devolution, five per cent in annual royalties on two thirds of oil production from the Norman Wells Proven Area is now paid to NWT. Further contributing to the decrease was a one-time payment resulting from an oil dispute in the amount of $1.5M.
-9,589 -59%
Total Explained 43,383 266%
Total Unexplained -125 -1%

50 NCR#7661921 - v20
D 3 – Interest on Loans
Variance Summary - Interest on Loans
(Financial Reporting Account 42129)
Financial Statement Data (in thousands of dollars)
Fiscal Year 2014-2015 7,761 Fiscal Year 2013-2014 6,168 Variance (+Increase / -Decrease) 1,594 Percentage (+Increase / -Decrease) 26%
Explanation of Major Variances Variance $ Variance %
Community and infrastructure - This higher interest revenue is due to low repayment rate, which results in high balances owed on defaulted ministerial guaranteed loans.
2,116 34%
Aboriginal rights and interests - Variance due to repayment of settled claims. Reduced principal leads to less interest over time which is the case here. Yearly variance is expected to go down yearly as repayments flow in until full repayment.
-899 -15%
Management and implementation - Variance due to increased interest accrued on settled claims. 388 6%
Community development - Not a significant variance, yearly variance due to interest rates. -11 0%
Total Explained 1,594 26%
Total Unexplained 0 0%

51 NCR#7661921 - v20
D 4 – Miscellaneous Revenue
Variance Summary - Miscellaneous Revenue
(Financial Reporting Account 42314, 42315, 42319, 42411, 42412, 42541, 42631, 42635,42719, 42733)
Financial Statement Data (in thousands of dollars) Fiscal Year 2014-2015 2,005 Fiscal Year 2013-2014 5,021 Variance (+Increase / -Decrease) -3,016 Percentage (+Increase / -Decrease) -60%
Explanation of Major Variances Variance $Variance %
Enviro Studies and Other: The decrease is due to the differences in projects managed by the Environmental Studies Research Fund Secretariat which has decreased by $2.2M as a result of the transfer of the surplus balance to GNWT subsequent to the NWT Devolution. Further, there was additional revenue refund made for other miscellaneous revenue in the amount of $3.3M.
-5,518 -110%
Crown Assets: There was an increase of $2M in revenue from the sale of Non-Capital Assets to Outside Parties. Further, there was an increase of interest revenue from overdue account receivable in the amount of $0.5M.
2,516 50%
Total Explained -3,002 -60%
Total Unexplained -14 0%

52 NCR#7661921 - v20
D 5 – Lease and Rentals Variance Summary - Lease and Rental (Financial Reporting Account 42312)
Financial Statement Data (in thousands of dollars) Fiscal Year 2014-2015 1,670 Fiscal Year 2013-2014 2,665 Variance (+Increase / -Decrease) -995 Percentage (+Increase / -Decrease) -37% Explanation of Major Variances Variance $ Variance %
The decrease in 2015 for Lease and Rental Revenue is due to NWT devolution in 2014-15. Certain leases and rentals were transferred to the Government of the Northwest Territories. The land leases have decreased by $467k and Rental of Unimproved land has decreased by $515k.
-981 -37%
Total Explained -981 -37%
Total Unexplained -13 0%

53 NCR#7661921 - v20
D 6 – Finance and Administrative Services
Variance Summary - Finance and administrative services
(Financial Reporting Account 42320)
Financial Statement Data (in thousands of dollars) Fiscal Year 2014-2015 3,135 Fiscal Year 2013-2014 690 Variance (+Increase / -Decrease) 2,445 Percentage (+Increase / -Decrease) 354% Explanation of Major Variances Variance $ Variance %
The variance is explained by two new agreements signed with Health Canada and the Public Health Agency of Canada in 2014-15, which are for project costs related to AANDC’s Grants and Contributions Information Management System (GCIMS).
2,465 357%
Total Explained 2,465 357%
Total Unexplained -20 -3%

54 NCR#7661921 - v20
Part E - Other

55 NCR#7661921 - v20
E 1 – Parliamentary Authorities – Budgetary Authorities Provided and Used (2014-2015 AANDC Financial Statement Note 3b)
Financial Statement Data (in thousands of dollars) Fiscal Year 2014-2015 Authorities Provided 8,730,597 Fiscal Year 2014-2015 Authorities Used 7,691,653 Authorities Available for Future Years 34,689 Variance (+Increase/ -Decrease) 1,004,255 Percentage (+Increase/ -Decrease) 12% Explanation of Major Variances Variance $ Variance % Funds deferred from 2014-2015 to future years for various initiatives to be used for the same intended purposes (note some are still in the approval process). Major items include:
- Specific Claims Settlement Fund ($664M) - Indian Residential Schools Settlement Agreement
($164M) - Various other initiatives totaling $101M (e.g.
Operation Return Home, Federal Contaminated Sites Action Plan, Income Assistance Reform)
928,997 10.6%
Budget carryforwards - Operating budget carryforward $18M - Capital budget carryforward $2M
20,406 0.2%
Remaining Balance - The remaining balance of $40M is related to funding
set aside for a variety of uses, most notably to meet the statutory funding requirements under the Territorial Formula Financing as stipulated in the Northwest Territories Lands and Resources Devolution Agreement ($33M).
40,012 0.5%
Subtotal 989,415 11.3% Net Lapse 14,840 0.2%
Notes:
The above information is as of January 11, 2016. It is subject to change as the re-profile requests have not all been approved by the Department of Finance at this time. Should some of these requests be refused, the result will be a corresponding increase in the net lapse.
The net lapse is a result of the implementation of saving measures from Budget 2012 as well as a delay in certain activities and projects. Furthermore, more cautious spending with regards to staffing, departmental travel, hospitality, and professional services has resulted in efficiencies.