Sampling Weights and Variance Estimation - Child Care … · Sampling Weights and Variance...
43
Sampling Weights and Variance Estimation Jerry West Senior Fellow
Transcript of Sampling Weights and Variance Estimation - Child Care … · Sampling Weights and Variance...

Sampling Weights and Variance Estimation
Jerry West
Senior Fellow

Introduce you to
– Sampling weights
– Methods for calculating variances and standard
errors for complex sample designs
General introduction to these topics
Weights are unique to research studies and
data sets
Options for calculating variances and standard
errors will vary by study
Overview
2

You will have a basic understanding of
sampling weights and variance calculations for
complex sample designs that are used in many
of the national early care and education
studies
You will use weights and use procedures that
are appropriate for calculating variances and
standard errors for these designs in your
research
You will increase your chances of having your
work published by doing these things
Webinar Goals
3

Sampling Weights

Sampling Weights: What’s All the Fuss About?
Generate more questions from data users than
any other topic
Use and misuse in professional literature
Today’s topics
– What are sampling weights and why are they
important?
– Why use weights in your analyses?
– Does using weights make a difference?
– Why so many different weights?
– Can I use weights with my software? How?
– Frequently asked questions on weights, when and
how to use them?
5

What is a Sampling Weight?
A sampling weight is used to indicate the relative
strength of an observation.
In the simplest case, each observation is counted
equally.
For example, if we wish to calculate the mean age
for webinar participants, we just sum everyone’s
age and divide by the number of participants.
6

What is a Sampling Weight (continued)?
When we use unweighted data, each
observation is counted equally.
Unweighted data represents only the
observations of those in the sample that
provide data.
When we weight the data, the observations are
counted relative to sample members’
representation in the population.
Weights allow analyses that represent the
target population.
7

Why are Weights Important?
You can get different answers:
Simple mean: (4+2+1+5+2)/5 = 2.8
Weighted mean:
{(4*1)+(2*2)+(1*4)+(5*1)+(2*2)}/10=2.1
or
(4+2+2+1+1+1+1+5+2+2)/10=2.1
Value 4 2 1 5 2
Weight 1 2 4 1 2
8

Sample Designs for Early Care and Education
Studies
Many are designed to produce national
estimates (FACES, ECLS-K, ECLS-B, HSIS,
NHES)
Rely on sample data, i.e. data on the entire
population was not collected
Programs, schools, teachers, classrooms, and
children did not have an equal probability of
selection.
Not all selected programs, schools, teachers,
classrooms, parents, children participated.
9

Why Use Weights?
Weights compensate for not collecting data from
the entire population and for using a complex
sample design
Weights
– Adjust for differential selection probabilities
– Adjust for differential nonresponse and attrition
– Reduce potential bias associated with nonresponse
– Are used when estimating characteristics of the
population
10

Does Using Weights Make a Difference? (ECLS-K)
11
Base Year
Characteristic
(C1CWO) Unweighted
Weighted
(Base Weight)
Weighted
(Final Weight,
C1CW0)
Race/Ethnicity
White 57 56 58
Black 15 16 16
Hispanic 18 20 19
Asian 6 3 3
School Type
Public 78 87 85
Private 22 13 15
Source: ECLS-K

Does Using Weights Make a Difference? (HSIS)
Child Outcome
Unweighted Weighted
Beta
T vs. C
SE
Beta
Beta
T vs. C
SE
Beta
PPVT 3.93* 1.47 4.01* 1.98
WJ Applied
Problems
3.19* 1.21 2.83 2.16
WJ Word 5.94* 1.3 5.76* 2.87
* p <= .05
12

Why So Many Different Weights?
Most data sets for the large-scale national
studies have many different weights
Weights vary according to:
– Level of analysis: child, teacher/classroom or
program/school
– Round(s) of data: cross-sectional or longitudinal
– Source(s) of data: child assessment, parent
interview, and/or teacher questionnaires
Choice of weight to use will be driven by your
research question
13

There are 43 weights on the FACES
2006 data files, how do I know which
one to use?
– Weight should match your research
question
– Consider level of analysis, sources of data,
and whether your question requires one or
more than one round of data
– There is no perfect weight!
Which Weight Should I Use?

SUMMARY OF DATA COLLECTION COMPONENTS, BY WAVE
Fall 2006 Spring 2007 Spring 2008 Spring 2009
3-Year-Olds
Child in Head Start
Child in Head Start
Child in Kindergarten
Assessment Parent Interview Teacher Child Rating Teacher Interview Classroom Observation
Center Director Interview
Education Coordinator Interview
4-Year-Olds
Child in Head Start
Child in Kindergarten
Assessment Parent Interview Teacher Child Rating Teacher Interview Classroom Observation Center Director Interview
Education Coordinator Interview
FACES Study Design

When children enter Head Start, do their
language, literacy, and early math skills differ
by gender and race/ethnicity?
– How many rounds of data are needed?
– What is/are the source(s) of these data?
– What is the level of analysis?
Example 1 – Choosing the Best Weight

Do the gains children make in their language,
literacy, and math skills across their first year
in Head Start differ by their skill level at
program entry?
– How many rounds of data are needed?
– What is/are the source(s) of these data?
– What is the level of analysis?
Example 2 – Choosing the Best Weight
17

Are the gains children make in their language,
literacy, and math skills during their time in
Head Start influenced by the quality of their
Head Start classrooms and teachers?
– How many rounds of data are needed?
– What is/are the source(s) of these data?
– What is the level of analysis?
Example 3 – Choosing the Best Weight

How to Use Weights with Commonly Used
Software Packages
Use
– “WEIGHT” statement in SAS, or
– “WEIGHT BY xxxxx” in SPSS
– [weight=xxxxx] in Stata
Weights often sum up to population totals.
Normalizing weights
– Normalize weights for certain software packages (SPSS)
– Impact greatest on estimates of standard errors and
significance tests
19

How do I Normalize the Weights?
Calculate a new weight that sums to the
sample size
The new weight is equal to the weight found
on the data file multiplied by the ratio of the
sample size (number of cases with a positive
value for the given weight) to the sum of the
weights.
20

ECLS-K Example - Normalizing Weights
Weight to be normalized: C2PW0
Sum of weights: 3,865,946
Total number of cases with a positive weight:
18,950
Normalized weight =
C2PW0 * (18,950 / 3,865,946)
Sum of normalized weight = 18,950
21

Other Frequently Asked Questions
When selecting a weight, do I have to subset
my dataset?
What happens to cases where there is no
positive weight?
What weights do I use if analyzing a
subsample of cases?
What if I’m running a regression - what weights
do I use?
What weight do I use if I’m using a multi-level
model?
22

Summary
Weights should be used when analyzing data from national studies of early care and education such as FACES, ECLS-K, ECLS-B, HSIS, and NHES.
The appropriate weight should be selected based on: – Level of analysis
– Round(s) of data
– Source(s) of data
Weights adjust for unit, but not for item nonresponse
There may not be a “perfect” weight for some analyses. The best weight can be determined with some descriptive analyses.
23

Participant Questions
?
24

VARIANCE
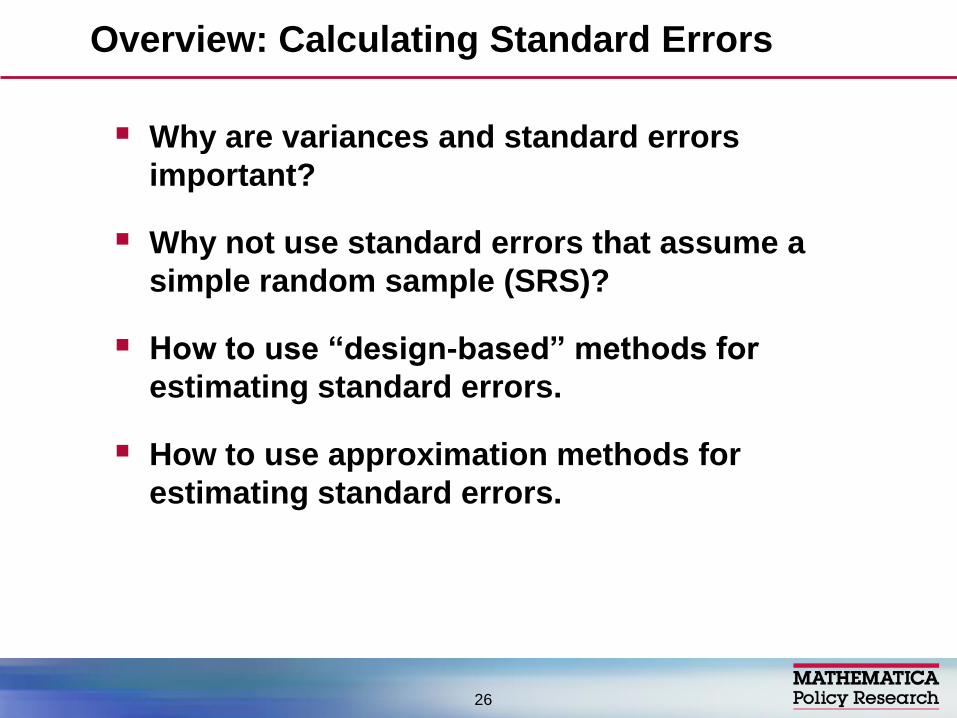
Overview: Calculating Standard Errors
Why are variances and standard errors
important?
Why not use standard errors that assume a
simple random sample (SRS)?
How to use “design-based” methods for
estimating standard errors.
How to use approximation methods for
estimating standard errors.
26

Data from national early childhood and
education studies are used to estimate
population characteristics and to test
hypotheses
– differences between two or more groups of children,
classrooms, schools/programs
– relationships between characteristics of children
and/or their environments
Standard errors are a measure of the
variability of those estimates
Standard errors are used when testing whether
the differences or the relationships are
statistically significant
Why are variances and standard errors
important?
27

Most standard procedures in commonly-used
statistical software packages assume data are
from a simple random sample.
The procedures are not appropriate for
complex multi-stage, clustered sample designs
with unequal probabilities of selection.
Software packages designed for simple
random samples tend to underestimate the
standard errors for complex sample designs.
Estimating Variances and Standard Errors
28

Children’s
Reading Score
By Poverty
Status
Mean T-Score
(Fall K)
Standard Error
Standard
Method (SRS)
Design-Based
(JK2)
All children 50.1 .080 .215
Below poverty 44.5 .163 .316
At or above
poverty 51.4 .087 .189
Design-Based versus Simple Random
Sample (ECLS-K)
29

Design-based variance estimation methods
– Replication methods
– Taylor Series methods
Approximation method
Design-based methods are preferred
Getting the Right Variance
30

Design-Based Methods
Replication techniques
Replicate weights
– ECLS-K, ECLS-B, and HSIS replication weights
use jackknife methods.
– Software to use
• WESVAR replication series (JK2, JKn)
• AM (JK2)
• SUDAAN (JK2)
31

Design-Based Methods
Taylor Series
– Use PSU and strata IDs from data file
– Software
• SUDAAN
• STATA
• SAS (using PROC SURVEY)
• AM
32

Approximation Method
Two steps:
1) Normalize weights
– May need to adjust weights so standard error is
based on actual sample size rather than population
size
2) Use design effect (DEFF)
– To account for complex sampling design
33

Step 1 - Normalizing Weights
Weights on FACES, ECLS-K, ECLS-B, and HSIS
sum to the population totals.
Calculate a new weight that sums to the sample
size
The new (normalized) weight is equal to:
sampling weight X n(weight)/N(weight)
34

ECLS-K Example - Normalizing Weights
Weight to be normalized: C2PW0
Sum of weights: 3,865,946
Total number of cases with a positive weight:
18,950
Normalized weight =
C2PW0 * (18,950 / 3,865,946)
Sum of normalized weight = 18,950
35

Step 2 - Adjusting for Complex Design
Use design effect (DEFF) to adjust SRS
standard errors
What is a design effect?
– Ratio of the variance of dependent variable produced
by specialized software that accounts for the
complex design to the variance of the same
dependent variable produced using procedures that
assume SRS.
36

Using design effects
DEFF = Design variance / SRS Variance
_______ DEFT = √ DEFF = (Design standard error / SRS standard error)
Example for fall ECLS-K kindergarten reading scores
SE (SRS) = .063
SE (Design) = .156
DEFF = .1562 = 6.15 .0632
_____ DEFT = .156 = √ 6.15 = 2.48 .063
37

3 Ways of Using the DEFF
Multiply the SRS standard error produced by the
square root of the DEFF (i.e., DEFT).
Adjust the t-statistic by dividing it by the square
root of the design effect (DEFT) or adjust the F-
statistic by dividing it by the DEFF.
Adjust the sampling weight such that an
adjusted standard error is produced.
38

Using a DEFF-Adjusted Weight
First step, create a weight that sums to the sample size (normalized weight).
Second step, divide this normalized weight by the DEFF.
Use this weight for analyses and the standards errors produced will approximate the standard errors obtained using “exact” methods.
39

For SAS Users
SAS base procedures such as PROC REG,
PROC FREQ, PROC MEANS do account for the
actual sample size but not for complex
sampling.
SAS procedures such as SURVEYMEAN and
SURVEYREG (procedures that begin with
"SURVEY"), use Taylor series method to
provide exact estimates by incorporate
complex sampling procedures into the
standard error estimation.
40

Regression Analysis with Complex Sample
Designs
Use appropriate software such as AM,
WESVAR, SUDAAN, or SAS (SURVEYREG
procedure).
For SAS (PROC REG procedure) use DEFF-
adjusted weights.
For SPSS, use normalized, DEFF-adjusted
weights.
41

Summary
National early childhood and education studies
use complex sample designs
The appropriate weight should be used
depending on the type of analysis.
The standard error calculation should be
based on sample total rather than population
total.
The standard errors should be adjusted for the
complex design either using software or the
design effects.
42

Participant Questions
?
43