Using Sessions from Clickstream Data Analysis to · PDF fileUsing Sessions from Clickstream...
12
Using Sessions from Clickstream Data Analysis to Uncover Different Types of Twitter Behaviour Florian Meier, Johannes Aigner and David Elsweiler Information Science Group Universität Regensburg {first name}.{last name}@ur.de Abstract While much is known about how Twitter is used for specific tasks or by particular groups of users, we understand surprisingly little about how the service is used generally on a daily basis. To learn more about general Twitter behaviour we perform a cluster analysis on a rich set of longitudinal interaction log data describing interactions 44 users had with the Twitter website over a 5 month period. We report on and interpret 5 clusters representing common usage patterns with the service. Keywords: Twitter; clickstream data; clustering; information behaviour 1. Introduction No Social Media application has attracted more research attention than the micro-blogging service Twitter. Many research areas make use of Twitter data for diverse purposes. These include linguistic analysis (Owoputi et al, 2013), sentiment analysis (Nakov et al, 2016), event detection (Sakaki, Okazaki & Matsuo, 2010) or to understand behaviour with Twitter during specific events, such as science conferences (Wen, Trattner & Parra, 2014) or presidential debates (Lin et al., 2013). Few studies, however, have investigated how Twitter is used on a day-to-day basis. We do not know, for example, what a typical Twitter session looks like, which features or sub- pages of the site are important or how Twitter behaviour can be characterized in general. This belies the fact that „[u]nderstanding how users behave when they connect to social networking sites creates opportunities for better interface design, richer studies of social interactions, and improved design of
Transcript of Using Sessions from Clickstream Data Analysis to · PDF fileUsing Sessions from Clickstream...
Using Sessions from Clickstream Data Analysis to Uncover Different Types of Twitter Behaviour
Florian Meier, Johannes Aigner and David Elsweiler Information Science Group
Universität Regensburg {first name}.{last name}@ur.de
Abstract While much is known about how Twitter is used for specific tasks or by particular groups of users, we understand surprisingly little about how the service is used generally on a daily basis. To learn more about general Twitter behaviour we perform a cluster analysis on a rich set of longitudinal interaction log data describing interactions 44 users had with the Twitter website over a 5 month period. We report on and interpret 5 clusters representing common usage patterns with the service.
Keywords: Twitter; clickstream data; clustering; information behaviour
1. Introduction No Social Media application has attracted more research attention than the micro-blogging service Twitter. Many research areas make use of Twitter data for diverse purposes. These include linguistic analysis (Owoputi et al, 2013), sentiment analysis (Nakov et al, 2016), event detection (Sakaki, Okazaki & Matsuo, 2010) or to understand behaviour with Twitter during specific events, such as science conferences (Wen, Trattner & Parra, 2014) or presidential debates (Lin et al., 2013). Few studies, however, have investigated how Twitter is used on a day-to-day basis. We do not know, for example, what a typical Twitter session looks like, which features or sub-pages of the site are important or how Twitter behaviour can be characterized in general. This belies the fact that „[u]nderstanding how users behave when they connect to social networking sites creates opportunities for better interface design, richer studies of social interactions, and improved design of

content distribution systems“ (Benevenuto et al., 2009, p.49). Our main focus in this work is to understand what Twitter session behaviour can tell us about different types of Twitter use. To this end we leverage rich behavioural clickstream data from a naturalistic setting to gain insight into Twitter users’ behaviour at a session level. 44 users provide unrestricted access to their interaction data with the Twitter website over a period of 5 months. We first identify user session then, focusing on 57 specific interactions (features), we perform a cluster analysis to identify common session types.
Our specific contributions are: (i) We compare 560 clustering approaches using different clustering algorithms, cluster sizes and input parameters to find the best combination for the data, (ii) We identify five primary clusters of Twitter sessions revealing different types of Twitter behaviour, (iii) We characterize these cluster types in detail by referring to the session features they exhibit, (iv) Finally, we investigate whether the time of day has an influence on the way Twitter users behave.
2. Related Work The two lines of research most relevant to the work described in this paper are: (i) studies investigating general Twitter behaviour and (ii) studies analysing social media clickstream data. We give a short review of both.
(i) Java et al. (2007) were amongst the first to study Twitter behaviour. They created a taxonomy of intentions when using the service, as well as types of users. Subsequent work has investigated the usage of certain Twitter features including @-Mentions (Honeycutt & Herring, 2009;Wang et al. 2013), Hashtags (Lin et al., 2013), favouriting/liking (Meier, Elsweiler & Wilson 2014), forwarding of messages via retweets (RT) (boyd, Golder & Lotan 2010) and how the Twitter search is used (Teevan, Ramage & Morris 2011). Other work has investigated how certain groups of users such as celebrities or academics make use of Twitter (Marwick & boyd 2011;Wen, Trattner & Parra, 2014). To our knowledge no studies exist, which have investigated Twitter behaviour generally, i.e. to determine what a typical Twitter session looks like or how behaviour can vary.
(ii) Click-through or click-stream data refers to data that records and stores user interaction with an application in a highly detailed manner (Dumais et al., 2014). In the context of social media applications Benevenuto et al. used

the HTTP request response pairs from a Brazilian social network aggregator to compare user behaviour characteristics from several thousand users of four different social media applications (Orkut, MySpace, Hi5, LinkedIn) (Benevenuto et al., 2009). They discovered that up to 92% of user interaction is latent i.e. browsing behaviour (Benevenuto et al., 2009, p. 58). This reveals that crawled data or data collected via APIs accounts for only a tiny fraction of user behaviour. Schneider and colleagues published similar work studying four different social media applications (Facebook, LinkedIn, Hi5, StudiVZ) and finding similar outcomes (Schneider et al., 2009). Wang et al. use clickstream data1 from the Chinese social media application Renren to build click models capable of distinguishing between normal users and malicious users or bot accounts (Wang et al., 2013). Similar to our work Wang et al. are using unsupervised clustering approaches for user behaviour analysis (Wang et al., 2016). However, they focus on designing, implementing and testing a framework for visualizing behavioural clusters and not describing the clusters in detail. Although these studies provide initial insights into social media use, most of the analysis is high-level and lacks a detailed description of usage patterns.
Finally, the work by Buscher et al. is relevant from a methodological perspective (Buscher et al., 2013). In their work they also used clustering on clickstream data for SERP page interaction to identify different behavioural clusters. Their approach and discussion of results inspired our own analyses.
3. Study Methodology
3.1 Collecting Clickstream Data The Twitter API offers simple access to behavioural data for the service. Data sourced in this way is limited in that it is biased towards active engagement and omits latent interactions, such as Tweet consumption and navigation of sub-pages. To get a detailed picture of how users interact with Twitter requires a richer and more detailed set of interactions to be captured. This was the motivation for designing and implementing an extension for the Chrome web browser. The extension records user interaction in a highly detailed manner. Besides metadata from viewed or interacted Tweets the extension recorded the timestamp, the type of interaction, the context (URL)
1 7 mio. clicks from 16 000 users in a period of 2 month.

in which it occurred (e.g. the users own Timeline), as well as detailed information on mouse movement (e.g. clicking or scrolling).
3.2. Participants From end of March 2015 to the end of August 2015 44 users downloaded and installed the extension from the Chrome Web Store. The link to the extension was passed on via Twitter posts, e-mail lists and internet fora. Our aim was to recruit a sample of users that is as heterogeneous as possible with respect to their account statistics in order to investigate Twitter session behaviour from a diverse range of different users. Table 1 shows the account information from 27 of the users, who could reliably be mapped to an account and consented to being identified. All account statistics are highly skewed and long tailed, which hints to varying Twitter behaviour among the participants. During the study about 180 K events were recorded and participants viewed 270 K Tweets.
TABLE 1: Twitter Account statistics for the study participants
(n=27) min max mean median Tweets(n) 0 73 780 5637 59 Following Count (n) 4 1041 203 57 Follower Count (n) 0 1139 202.5 39 Favourites Count 0 44520 1796 18.50 Registered Years (years) (NA=12) 2 6 4.6 5
3.3 Event Categorization and Session Segmentation Several data preparation steps were performed before analysing the data. First, low-level single events were categorized into higher-level event categories based on the context (URL) in which they occurred. The first event in Figure 1 shows a click on a Tweet occurring on the own Timeline (URL: http://twitter.com), which was categorized as a TIMELINE2 event. Certain types of events have fixed event categories regardless in which context they occurred. E.g. a search query is always classified as an event from event category SEARCH.
2 From this point further event categories are set in small caps.

FIG. 1. Visualization of important data preparation steps
In a next step, the stream of events was split into sessions by using five minutes of user inactivity as a threshold for the start of a new session (cf. Figure 1) an established approach in the literature (Schneider et al., 2009).
4. Session Characteristics and Clustering Experiment Using five minutes inactivity as a session threshold results in an overall session count of 4573 sessions for all users. On average a session contains 38.71 events (min=2, max=2155, median=11, IQR=31) and lasts slightly over 4 minutes (median=83 sec, IQR=270 sec). However, sessions can be as short as only 1 sec (min) or even last for 3 hours and longer (max=11080 sec). About 25% of participants used Twitter for 2 sessions per day and 40% of the participants had one session per day during the study period. However, the maximum lies at 10 sessions per day. These stark differences are a first hint that users behave differently and have different motivations and goals in mind when using Twitter. We investigate whether session features described in Figure 2 characterize sessions in a way that they can be used to discriminate sessions from each other and reveal different types of Twitter usage patterns. To this end we applied an unsupervised learning approach to the sessions in order to allow for different patterns of behaviour to emerge from the data. We empirically assessed the best clustering approach for our data by comparing different algorithms, cluster sizes (k=2 to 15) and input parameters. We compared the following five clustering algorithms: (i) K-Means (ii) Fuzzy C-Means (iii)
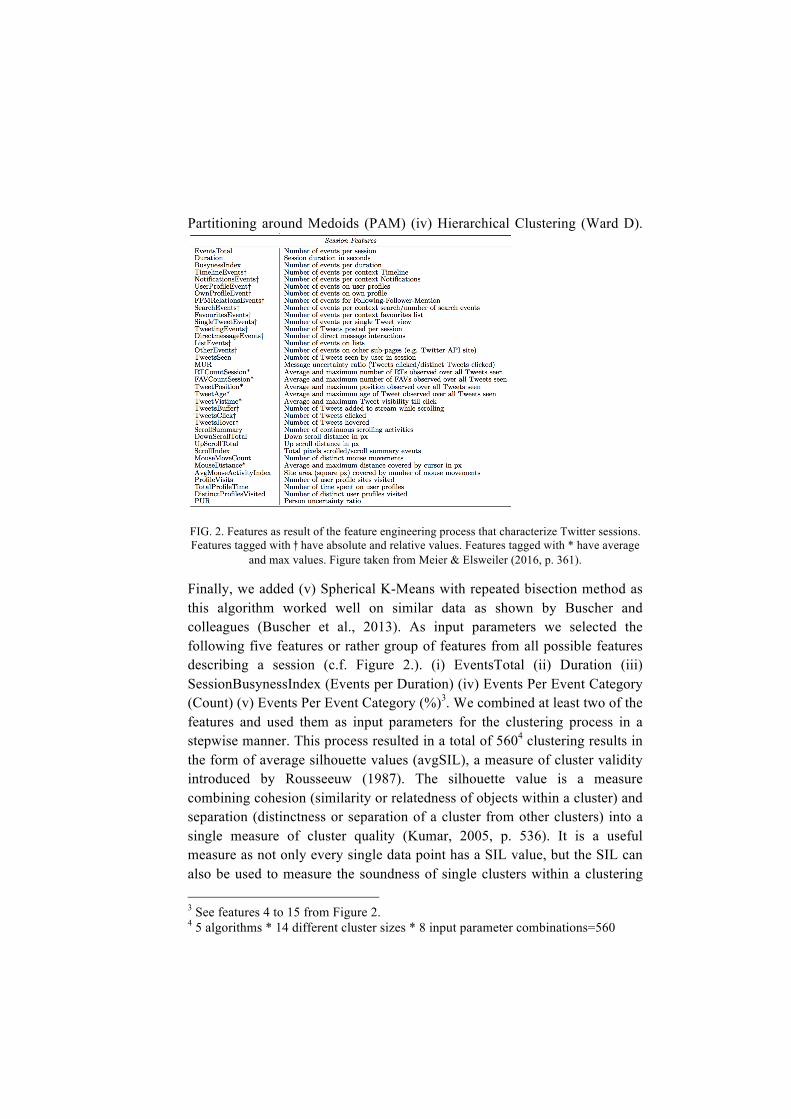
Partitioning around Medoids (PAM) (iv) Hierarchical Clustering (Ward D).
FIG. 2. Features as result of the feature engineering process that characterize Twitter sessions. Features tagged with † have absolute and relative values. Features tagged with * have average
and max values. Figure taken from Meier & Elsweiler (2016, p. 361).
Finally, we added (v) Spherical K-Means with repeated bisection method as this algorithm worked well on similar data as shown by Buscher and colleagues (Buscher et al., 2013). As input parameters we selected the following five features or rather group of features from all possible features describing a session (c.f. Figure 2.). (i) EventsTotal (ii) Duration (iii) SessionBusynessIndex (Events per Duration) (iv) Events Per Event Category (Count) (v) Events Per Event Category (%)3. We combined at least two of the features and used them as input parameters for the clustering process in a stepwise manner. This process resulted in a total of 5604 clustering results in the form of average silhouette values (avgSIL), a measure of cluster validity introduced by Rousseeuw (1987). The silhouette value is a measure combining cohesion (similarity or relatedness of objects within a cluster) and separation (distinctness or separation of a cluster from other clusters) into a single measure of cluster quality (Kumar, 2005, p. 536). It is a useful measure as not only every single data point has a SIL value, but the SIL can also be used to measure the soundness of single clusters within a clustering 3 See features 4 to 15 from Figure 2. 4 5 algorithms * 14 different cluster sizes * 8 input parameter combinations=560

result as well as the cluster result in total by averaging the SIL values for every cluster, as we did in our experiment (Kumar, 2005, p.542). Using the Spherical K-Means algorithm and using the SBI and the relative number of events per event category as input parameters achieved the most promising result. The highest average SIL (0.74) can be detected at a cluster size of k=5. Additionally, besides looking at the SIL width, one also has to manually check the single SIL values of each cluster of the clustering result to determine the soundness of cluster sizes. Besides one dominant cluster the number of sessions per cluster is balanced and each cluster at least has a SIL value of 0.36. We take these clusters for further interpretation in the following section.
5. Cluster Interpretation The clusters were interpreted by taking a multistep approach. In a first step we investigated which event categories i.e. Twitter subpages were particularly popular compared to the rest of the event categories in the sessions in each cluster. This can be done by interpreting the distribution of events per event category visualized by the boxplots in Figure 4. In a next step we derived potential use cases for the dominant event categories in every cluster. We try to think of plausible sequences of events that explain the dominance of these event categories and identify behavioural patterns in the five clusters.
FIG. 4. Proportion of events per event category for sessions in each cluster

Cluster 1, Surf Timeline5 (n=3718): shows a clear dominance of events from event category TIMELINE. The median of the boxplot lies at 100% revealing that half of all sessions from that cluster have timeline interaction exclusively. Other event categories are dominated by outliers to the top hinting to the fact that within sessions of this cluster other Twitter subpages are rarely or never visited. As most sessions belong to this cluster those can be interpreted to be the most typical Twitter sessions. Cluster 2, Check Notifications (n=157): although the NOTIFICATIONS category is the most dominant, events from other event categories, namely TWEETING, TIMELINE and DIRECT MESSAGING are very popular too. This pattern shapes a coherent picture of users looking at their notifications and being active themselves by either Tweeting or sending direct messages. Cluster 3, User Interaction (n=492): most events occur on other user's profile pages (USERPROFILEINT). Compared to other clusters a certain proportion of events from event category FFM RELATIONS are observed. Users clicking on @-Mentions and visiting the profile sites of this user can explain these high proportions. Another combination of both categories could be the action of users un/following accounts by using the button from this users’ profile page. Cluster 4, Other and Own Profile (n=96): This cluster shows a dominance of event category OTHER combined with events from category OWNPROFILEINT. Via their own profile users are able to view their posted Tweets or finding links to their favourites list or profile settings. Users who want to get more information on Twitter as a company, look up the Twitter blog, or visit the Twitter API pages all generate events within Twitter subpages belonging to event category OTHER. Cluster 5, Information Seeking (n=110): The last cluster shows a dominance of events from category SEARCH and SINGLE TWEET. It is the most information behaviour related cluster as it reveals users searching for information by issuing queries or clicking on hashtags and investigating Tweets and responses to those Tweets in more detail by viewing them in the single page view. In a next step we are using the features introduced in Figure 2 to characterize each cluster in more detail and if necessary find differences between them. A highly significant Shapiro-Wilk-Test for all features and all clusters proves 5 From this point further clusters names have the font weight bold.
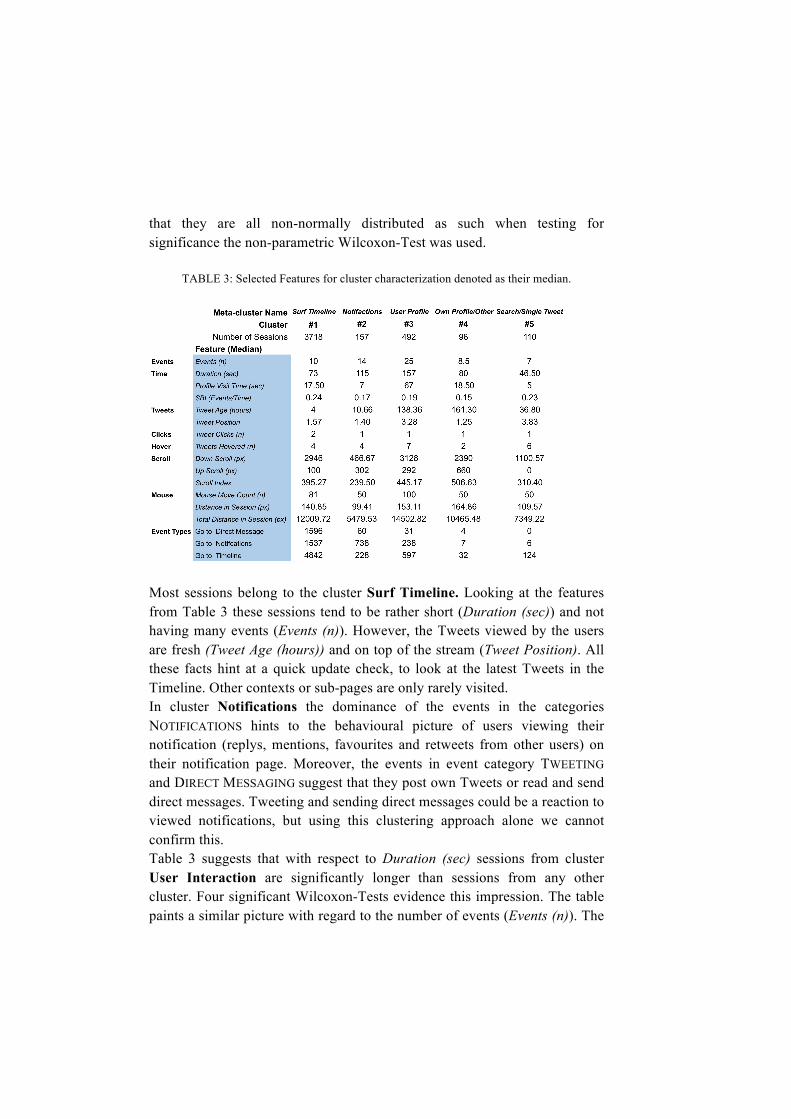
that they are all non-normally distributed as such when testing for significance the non-parametric Wilcoxon-Test was used.
TABLE 3: Selected Features for cluster characterization denoted as their median.
Most sessions belong to the cluster Surf Timeline. Looking at the features from Table 3 these sessions tend to be rather short (Duration (sec)) and not having many events (Events (n)). However, the Tweets viewed by the users are fresh (Tweet Age (hours)) and on top of the stream (Tweet Position). All these facts hint at a quick update check, to look at the latest Tweets in the Timeline. Other contexts or sub-pages are only rarely visited. In cluster Notifications the dominance of the events in the categories NOTIFICATIONS hints to the behavioural picture of users viewing their notification (replys, mentions, favourites and retweets from other users) on their notification page. Moreover, the events in event category TWEETING and DIRECT MESSAGING suggest that they post own Tweets or read and send direct messages. Tweeting and sending direct messages could be a reaction to viewed notifications, but using this clustering approach alone we cannot confirm this. Table 3 suggests that with respect to Duration (sec) sessions from cluster User Interaction are significantly longer than sessions from any other cluster. Four significant Wilcoxon-Tests evidence this impression. The table paints a similar picture with regard to the number of events (Events (n)). The

fact that Median Profile Visit Time (sec) is longest (67 sec) for sessions in this cluster is a further hint that user profile interaction is essential for sessions in this cluster. Additionally, it is striking that during those sessions many Tweets get viewed (Tweets Hovered (n)) and those Tweets are much older (Tweet Age (hours)=138,36) compared to the median age of Tweets from other clusters. Finally, when looking at all features concerning mouse movement and scrolling one can see that this sessions are very intense and much harder work as those values are all very high. Cluster 3 is the second biggest cluster and as such visiting user profile sites happens quite frequently. Reasons for visiting user profiles could be manifold. Whether it is for checking a users latest Tweets, making an informed decision on whether one should un/follow this account, or if it is for re-finding previously seen Tweets, which other studies have shown (Meier & Elsweiler, 2016). All these motivations can lead to characteristic behaviour on user profiles. Besides the median age of viewed Tweets being oldest in Cluster 4 no other distinctive features can be observed. However, the small numbers of viewed Tweets can be explained by most interaction occurring on subpages of category OTHER on which no Tweets are present. A slightly different trend can be observed concerning the Information Seeking cluster. Sessions from this cluster have significantly less events than session from clusters 1, 2 and 3 but are not significantly longer or shorter compared to Surf Timeline or Own Profile / Other. Moreover, features with respect to scrolling and mouse movement are also less prevalent compared to other clusters. However, more Tweets are hovered over (Tweets Hovered (n) = 6). This indicates that during search sessions there's a certain focus on consumption of information (i.e. reading Tweets) rather than interaction. Moreover, the Event Types rows from Table 3 indicate that in sessions from cluster 5 no steps to other event categories are taken, thus searching for information seems to be a rather self-contained, separate kind of behavioural pattern. Finally, we analysed whether time of day has an effect on the occurrence of sessions from certain clusters. We hypothesized that sessions from cluster Surf Timeline would rather occur during the day whereas sessions that are more time intensive, like sessions from cluster 2, 3, 4 would rather occur after work i. e. during spare time. We divide sessions into two groups on whether they belong to Surf Timeline or not. Further, we look at the period between 6:00 AM and 11:00 PM and split the sessions on whether they started before 2:00 PM or after 2:00 PM. A Chi-Square-Test couldn’t find a

significant difference between the distributions (p=0.297). In a next step we built six different groups by splitting the time period into morning, noon and evening. Again pairwise Chi-Square tests comparing the distributions of all possible combinations showed no significant differences. We conclude that time of day does not have an effect on type of Twitter behaviour.
6. Summary & Future Work This work presented a characterization of Twitter user behaviour by using clustering on session data from a log study of 44 users in a naturalistic setting. In a clustering experiment we evaluated 560 approaches in which the best approach separated 4573 user sessions into 5 clusters. By using session-related features we were able to identify several typical Twitter behaviours. The most notable three are: (i) sessions from cluster Surf Timeline represent the typical Twitter session, which is about 73 sec long, where interaction mostly occurs in the context TIMELINE and the latest Tweets are viewed. (ii) The User Interaction cluster where interaction mostly occurs on the profile sites of other users and sessions tend to be long and intensive and many old Tweets are viewed. (iii) The Information Seeking Cluster, where people deliberately search for information. The User Interaction cluster probably reveals the most surprising behaviour and opens up several possible questions. What are motivations for visiting the profile sites of other users? What tasks are users trying to fulfil when visiting profiles? We mention some, but there are probably many more. There is certainly room for improving the user profile page view in general to support users with the variety of tasks they have. Investigating sequences of low-level events and thus explaining those clusters in even more detail are possibilities for future work.
References Benevenuto, F., Rodrigues, T., Cha, M. & Almeida, V. (2009). Characterizing user behavior in
online social networks. In Proc. IMC’09 (pp. 49–62). New York, NY, USA: ACM. boyd, D., Golder, S. and Lotan, G. (2010). Tweet, Tweet, Retweet: Conversational Aspects of
Retweeting on Twitter. In Proc. HICSS '10 (pp.1-10).Washington, DC, USA: IEEE CS. Buscher, G., White, R. W., Dumais, S. and Huan, J.(2012). Large-scale analysis of individual
and task differences in search result page examination strategies. In Proc. WSDM'12 (pp. 373-382). New York, NY, USA: ACM.
Dumais, S., Jeffries, R., Russell, D. M., Tang, D. & Teevan, J. (2014). Understanding user behavior through log data and analysis. In Ways of knowing in HCI (pp. 349-372). Springer.
Lin, Y., Margolin, D., Keegan, B., Baronchelli, A., and Lazer, D. (2013). #Bigbirds Never Die: Understanding Social Dynamics of Emergent Hashtags. In ICWSM’13 (pp.370-379). Palo Alto: AAAI.
Marwick, A. and boyd, D. (2011). To See and Be Seen: Celebrity Practice on Twitter Convergence: The International Journal of Research into New Media Technologies May, 17: (pp. 139-158).
Meier, F., Elsweiler, D. & Wilson, M. L. (2014). More than liking and bookmarking? towards understanding twitter favouriting behaviour. In Proc. ICWSM’14. Palo Alto: AAAI.
Meier, F. and Elsweiler, D. (2016). Going back in Time: An Investigation of Social Media Re-finding. In Proc. SIGIR '16 (pp.355-364). New York, NY, USA: ACM.
Nakov, P., Ritter, A., Rosenthal, S., Stoyanov, V. and Sebastiani, F. (2016). SemEval-2016 task 4: Sentiment analysis in Twitter. In Proc. SemEval ’16, San Diego, CA, USA.
Owoputi, O., Connor, B., Dyer, C., Gimpel, K., Schneider, N. & Smith, N. A. (2013). Im- proved part-of-speech tagging for online conversational text with word clusters. In Proc. naacl-hlt’13 (pp. 380–390).
Rousseeuw, P. J. (1987). Silhouettes: A graphical aid to the interpretation and validation of cluster analysis. In: Journal of Computational and Applied Mathematics, 20(C), (pp. 53–65).
Sakaki, T., Okazaki, M., and Matsuo, Y. (2010). Earthquake shakes Twitter users: real-time event detection by social sensors. In Proc. WWW '10 (pp.851-860). New York, NY, USA: ACM.
Schneider, F., Feldmann, A., Krishnamurthy, B. & Willinger, W. (2009). Understanding online social network usage from a network perspective. In Proc. IMC’09 (pp. 35–48). New York, NY, USA: ACM.
Tan, P., Steinbach, M. and Kumar, V. (2005). Introduction to Data Mining. Boston, MA: Addison-Wesley Longman Publishing.
Teevan, J., Ramage, D. and Ringel Morris, M. (2011). #TwitterSearch: a comparison of microblog search and web search. In Proc. WSDM '11 (pp.35-44). New York, NY, USA: ACM.
Wang, G., Konolige, T., Wilson, C., Wang, X., Zheng, H. & Zhao, B. Y. (2013). You are how you click: Clickstream analysis for sybil detection. In Proc. SEC’13 (pp. 241-256). USE- NIX Association.
Wang, B., Wang, C., Bu, J., Chen, C., Zhang, W. V., Cai, D., and He, X. (2013). Whom to mention: expand the diffusion of tweets by @ recommendation on micro-blogging systems. In Proc. WWW '13 (pp. 1331-1340). New York, NY, USA: ACM.
Wang, G., Zhang, X., Tang, S., Zheng, H. & Zhao, B. Y. (2016). Unsupervised clickstream clustering for user behavior analysis. In Proc. CHI’16 (pp. 225–236). New York, NY, USA: ACM.
Wen, X., Lin, Y., Trattner, C. and Parra, D. (2014). Twitter in academic conferences: usage, networking and participation over time. In Proc. HT '14 (pp.285-290). New York, NY, USA: ACM.


![AIGNER ARCHIVE IMAGE SHEET - Yale University Art Gallery · IMAGE SHEET. 3 AIGNER ARCHIVE IMAGE CAPTIONS [01] Lucien Aigner, Mussolini at Stresa, 1935. Gelatin silver print, 13 ×](https://static.fdocuments.us/doc/165x107/5f4192f8660186021b5598e8/aigner-archive-image-sheet-yale-university-art-gallery-image-sheet-3-aigner-archive.jpg)