User’s Manual EHP-50G
90
NARDA Safety Test Solutions S.r.l. Socio Unico Sales & Support: Via Leonardo da Vinci, 21/23 20090 Segrate (MI) - ITALY Tel.: +39 02 2699871 Fax: +39 02 26998700 Manufacturing Plant: Via Benessea, 29/B 17035 Cisano sul Neva (SV) Tel.: +39 0182 58641 Fax: +39 0182 586400 http://www.narda-sts.it SERIAL NUMBER OF THE INSTRUMENT You can find the Serial Number on the bottom cover of the instrument. The Serial Number is in the form: 000XY00000. The first three digits and the two letters are the Serial Number prefix, the last five digits are the Serial Number suffix. The prefix is the same for identical instruments, it changes only when a configuration change is made to the instrument. The suffix is different for each instrument Document EHP50GEN-80106-1.69 – Copyright © NARDA 2018 User’s Manual EHP-50G ELECTRIC AND MAGNETIC FIELD PROBE - ANALYZER From 1 Hz up to 400 kHz
Transcript of User’s Manual EHP-50G
NARDA Safety Test Solutions S.r.l. Socio Unico
Sales & Support: Via Leonardo da Vinci, 21/23 20090 Segrate (MI) - ITALY Tel.: +39 02 2699871 Fax: +39 02 26998700
Manufacturing Plant: Via Benessea, 29/B 17035 Cisano sul Neva (SV) Tel.: +39 0182 58641 Fax: +39 0182 586400
http://www.narda-sts.it
SERIAL NUMBER OF THE INSTRUMENT You can find the Serial Number on the bottom cover of the instrument. The Serial Number is in the form: 000XY00000. The first three digits and the two letters are the Serial Number prefix, the last five digits are the Serial Number suffix. The prefix is the same for identical instruments, it changes only when a configuration change is made to the instrument. The suffix is different for each instrument Document EHP50GEN-80106-1.69 – Copyright © NARDA 2018
User’s Manual
EHP-50G
ELECTRIC AND MAGNETIC FIELD PROBE - ANALYZER
From 1 Hz up to 400 kHz
II Note and symbols
NOTE: ® Names and Logo are registered trademarks of Narda Safety Test Solutions GmbH and L3 Communications Holdings, Inc. – Trade names are trademarks of the owners.
If the instrument is used in any other way than as described in this User’s Manual, it may become unsafe.
Before using this product, the related documentation must be read with great care and fully understood to familiarize with all the safety prescriptions.
To ensure the correct use and the maximum safety level, the User shall know all the instructions and recommendations contained in this document.
This product is a Safety Class III instrument according to IEC classification and has been designed to meet the requirements of EN61010-1 (Safety Requirements for Electrical Equipment for Measurement, Control and Laboratory Use).
In accordance with the IEC classification, the power supply of this product meets requirements Safety Class II and Installation Category II (having double insulation and able to carry out mono-phase power supply operations).
It complies with the requirements of Pollution Class II (usually only non-conductive pollution). However, occasionally it may become temporarily conductive due to condense on it.
The information contained in this document is subject to change without notice.
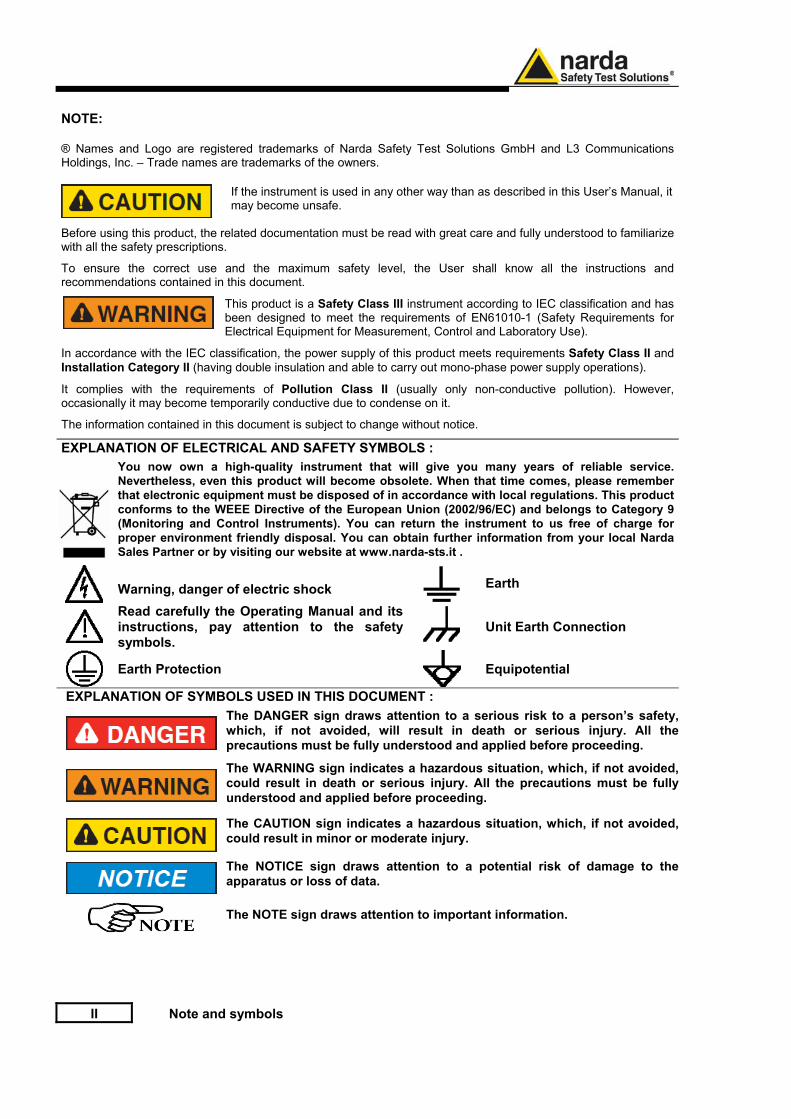
EXPLANATION OF ELECTRICAL AND SAFETY SYMBOLS :
You now own a high-quality instrument that will give you many years of reliable service. Nevertheless, even this product will become obsolete. When that time comes, please remember that electronic equipment must be disposed of in accordance with local regulations. This product conforms to the WEEE Directive of the European Union (2002/96/EC) and belongs to Category 9 (Monitoring and Control Instruments). You can return the instrument to us free of charge for proper environment friendly disposal. You can obtain further information from your local Narda Sales Partner or by visiting our website at www.narda-sts.it .
Warning, danger of electric shock Earth
Read carefully the Operating Manual and its instructions, pay attention to the safety symbols.
Unit Earth Connection
Earth Protection Equipotential
EXPLANATION OF SYMBOLS USED IN THIS DOCUMENT :
The DANGER sign draws attention to a serious risk to a person’s safety, which, if not avoided, will result in death or serious injury. All the precautions must be fully understood and applied before proceeding.
The WARNING sign indicates a hazardous situation, which, if not avoided, could result in death or serious injury. All the precautions must be fully understood and applied before proceeding.
The CAUTION sign indicates a hazardous situation, which, if not avoided, could result in minor or moderate injury.
The NOTICE sign draws attention to a potential risk of damage to the apparatus or loss of data.
The NOTE sign draws attention to important information.
Contents III
Contents
Page Safety requirements and instructions…..........…….....…………………EC Declaration of Conformity ..........................………………................
VII VIII
1 General information Page 1.1 Documentation......................................................….…….................. 1.2 Introduction ……………….....................…………………..…………….1.3 Configuration and Standard accessories............................................ 1.4 Optional accessories ..............................................………………….. 1.5 Main specifications.................................................………................. 1.6 Isotropic E&H field analyzer EHP-50G typical uncertainty and Anisotropy……………………………………………………………. 1.6.1 Typical uncertainty of EHP-50G……………………………………… 1.6.2 Explication Notes………………………………………………………. 1.6.3 Measurements uncertainty of EHP-50G (Weighted Peak mode)…
1.7 Anisotropy…………………………………………………………………. 1.8 Overload level……………………………………………………………. 1.9 EHP-50G panel...................................………..………………………..
1-1 1-1 1-3 1-3 1-4 1-5 1-5 1-6 1-7 1-8 1-11 1-12
2 Software interface Page 2.1 Introduction…………….........................................…...……………….. 2.2 Preliminary inspection…….............................……...…...……………. 2.3 Work Environment………..........................…………..……………….. 2.4 To return for repair…..…..................................……...………………. 2.5 Equipment cleaning………..…….….................……...…..…………… 2.6 Power supply and battery recharging………………………................ 2.7 EHP-50G connected to a PC……………………………..……………. 2.8 EHP-50G stand alone mode….….………………………..…………… 2.9 EHP-50G with 8053B DISPLAY.………………………….…………… 2.10 Battery management…………….………………………..………….. 2.11 Avoiding measurement errors……………………………................
2-1 2-1 2-1 2-1 2-1 2-2 2-3 2-3 2-3 2-3 2-4
3 EHP-TS installation Page 3.1 Introduction…………………………………………………..…………… 3.2 Hardware requirements…………………………...………..…………… 3.3 Installing EHP-TS Software………….………………..…………………
3-1 3-1 3-2
IV Contents
4 EHP-TS software Page 4.1 EHP-TS Applications………………………………………..… 4.2 EHP-50F Applications.……….....…………………………….. 4.2.1 Main menu………………….………………………………… 4.3 Mode section.………………………………………………….. 4.4 Span section……………...……………………………………. 4.5 Standard………………………………………………………… 4.6 Data section…………………………………………………..… 4.6.1 Waterfall………………………………………………………. 4.6.1.1 Data recording……………………………………………… 4.7 Style section.……………………………………………………. 4.8 ICNIRP…………………………………………….………..…… 4.9 IEEE………..………………………………………………..….. 4.10 Weighted Peal Function (Time Domain) [Optional]…..….. 4.10.1 Weighted Peak requirements…………………………….. 4.10.1.1 Weighted Peak Activation Procedure…………………. 4.10.2 EHP-TS Settings..…………………………………………. 4.10.3 Weighted Peak Mode……………………………………… 4.10.3.1 Dynamic ranges…………………………………………. 4.11 Additional functions provided by EHP-200TS……………..
4-1 4-2 4-2 4-4 4-5 4-7 4-9 4-13 4-17 4-18 4-19 4-21 4-23 4-23 4-23 4-24 4-25 4-27 4-29
5 EHP-50G Stand alone mode Page 5.1 Stand alone mode description………….………………….…. 5.2 EHP-50G Data Logger………………………………………… 5.2.1 Run EHP-50G Stand Alone mode software………………. 5.2.2 Use EHP-50G Logger……………………………………….. 5.2.3 EHP-50G battery charging…………………………………..
5-1 5-2 5-2 5-5 5-5
6 Update Firmware Page 6.1 Update firmware…………..…………………………………… 6.2 To run the update software..…………………………………. 6.3 To transfer data ………………………………………………..
6-1 6-1 6-1
7 Uninstalling software Page 7.1 Uninstalling EHP-TS Software ………………………..………
7-1
8 Uninstalling USB-OC Page 8.1 Uninstalling driver for USB-OC……………..……………..…..
8-1
Contents V
9 Accessories Page 9.1 Introduction………………….……………………………....... 9.1.1 Preliminary inspection……..…...………………………...... 9.1.2 Work environment….………………………………………. 9.1.3 Return for repair………………………………………….… 9.1.4 Cleaning…………………………………………………..…. 9.1.5 Power supply and battery chargers…………………….… 9.1.6 Weighted Peak Option…………………………………….. 9.2 USB-OC Optical USB Converter………………………….... 9.2.1 Introduction………………………………………………….. 9.2.2 Installation…………………………………………………... 9.3 8053-OC Optical RS232 Converter…………………..…..… 9.3.1 Introduction………………………………………………..… 9.3.2 Installation…………………………………………….…….. 9.4 8053-OC-PS Power Supply………………………..…..…… 9.4.1 Introduction…………………………………………………. 9.4.2 Installation…………………………………………………... 9.5 8053B DISPLAY Unit………………………………………… 9.5.1 Introduction…………………………………………………. 9.5.2 Standard Accessories……………………………………... 9.5.3 Optional Accessories.……………………………………... 9.5.4 8053B Main Specifications…..……………………………. 9.5.5 Field Probes………………………………………………… 9.5.6 8053B Front Panel……………………………………….… 9.5.7 8053B Side Panel………………………………………….. 9.5.8 8053B Battery charger….…………………………………. 9.5.9 To substitute the mains connector……………………….. 9.5.10 To check the internal batteries………………………….. 9.6 TR-02A Tripod……………………………………………....... 9.6.1 Introduction……………………………………………..…… 9.7 TT-01 Fiber glass Telescopic support…………….…..…… 9.7.1 Introduction……………………………………………..…… 9.8 Other accessories……………………………………..………
9-1 9-1 9-1 9-1 9-1 9-2 9-2 9-3 9-3 9-3 9-4 9-4 9-4 9-5 9-5 9-5 9-6 9-7 9-7 9-7 9-8 9-9 9-10 9-10 9-11 9-11 9-11 9-12 9-12 9-14 9-14 9-15
VI Contents
Figures Figure
Page
1-1 1-2 1-3 1-4 1-5 1-6 3-1 4-1 4-2 4-3 4-4 4-5 4-6 4-7 4-8 4-9 4-10 5-1 6-1 7-1 8-1 9-1 9-2 9-3 9-4 9-5 9-6 9-7 9-8 9-9
Block Diagram of the EHP-50G …………………. 3D mesh measurements of magnetic probe……. EHP-50G axes……………………………………… Overload level EHP-50G (B Field, RMS)………... Overload level EHP-50G (E Field, RMS)………... EHP-50G panel ........………...............………….. EHP-TS Installation……………………………….. EHP50 EHP-TS Main Window…………………… Defining frequency band through the PC mouse Zoom window………………………………………. Data section………………………………………… Waterfall - Graph 2D………………………………. Waterfall Main Window……………………………. Waterfall - Graph 3D………………………………. Electric and magnetic fields………………………. Power density spectrum………………………….. New wave impedance function………………….. Shorting loop……………………………………….. EHP-50G Upgrading Utility Main Window…….... Uninstalling EHP-TS………………………………. Uninstalling USB-OC……………………………… USB-OC Adapter..………………………………… 8053-OC Panels…………………………………… 8053-OC-PS Connectors…………………………. 8053B……………………………………………….. 8053 Logger Interface software…………….…… 8053 Front Panel……………………………..…… 8053 Side Panel…………………………………… TR-02A Tripod…..……………………….………… TT-01 Fiber Glass Telescopic Support…………..
1-2 1-8 1-9 1-11 1-11 1-12 3-2 4-2 4-5 4-6 4-9 4-13 4-14 4-15 4-29 4-29 4-30 5-1 6-1 7-1 8-1 9-3 9-4 9-5 9-6 9-6 9-10 9-10 9-12 9-14
Tables Table
Page
1-1 2-1 9-1 9-2 9-3 9-4 9-5 9-6 9-7
Technical Specifications of the EHP-50G….….... Autonomy of the battery…………………………… Technical Specifications of the USB-OC………... Technical Specifications of the 8053-OC…..…… Technical Specifications of the 8053-OC-PS…… Technical Specifications of the 8053 DISPLAY… EHP-200A Electric and Magnetic Field Probe….. Technical Specifications of the TR-02A….……… Technical Specifications of the TT-01……………
1-4 2-3 9-3 9-4 9-5 9-8 9-9 9-12 9-14
EC Conformity VII
SAFETY RECOMMENDATIONS AND INSTRUCTIONS This product has been designed, produced and tested in Italy, and it left the factory in conditions fully complying with the current safety standards. To maintain it in safe conditions and ensure correct use, these general instructions must be fully understood and applied before the product is used. • When the device must be connected permanently, first provide effective grounding; • If the device must be connected to other equipment or accessories, make sure they are all safely
grounded; • In case of devices permanently connected to the power supply, and lacking any fuses or other
devices of mains protection, the power line must be equipped with adequate protection commensurate to the consumption of all the devices connected to it;
• In case of connection of the device to the power mains, make sure before connection that the voltage selected on the voltage switch and the fuses are adequate for the voltage of the actual mains;
• Devices in Safety Class I, equipped with connection to the power mains by means of cord and plug, can only be plugged into a socket equipped with a ground wire;
• Any interruption or loosening of the ground wire or of a connecting power cable, inside or outside the device, will cause a potential risk for the safety of the personnel;
• Ground connections must not be interrupted intentionally; • To prevent the possible danger of electrocution, do not remove any covers, panels or guards
installed on the device, and refer only to NARDA Service Centers if maintenance should be necessary;
• To maintain adequate protection from fire hazards, replace fuses only with others of the same type and rating;
• Follow the safety regulations and any additional instructions in this manual to prevent accidents and damages.
VIII Safety Consideration
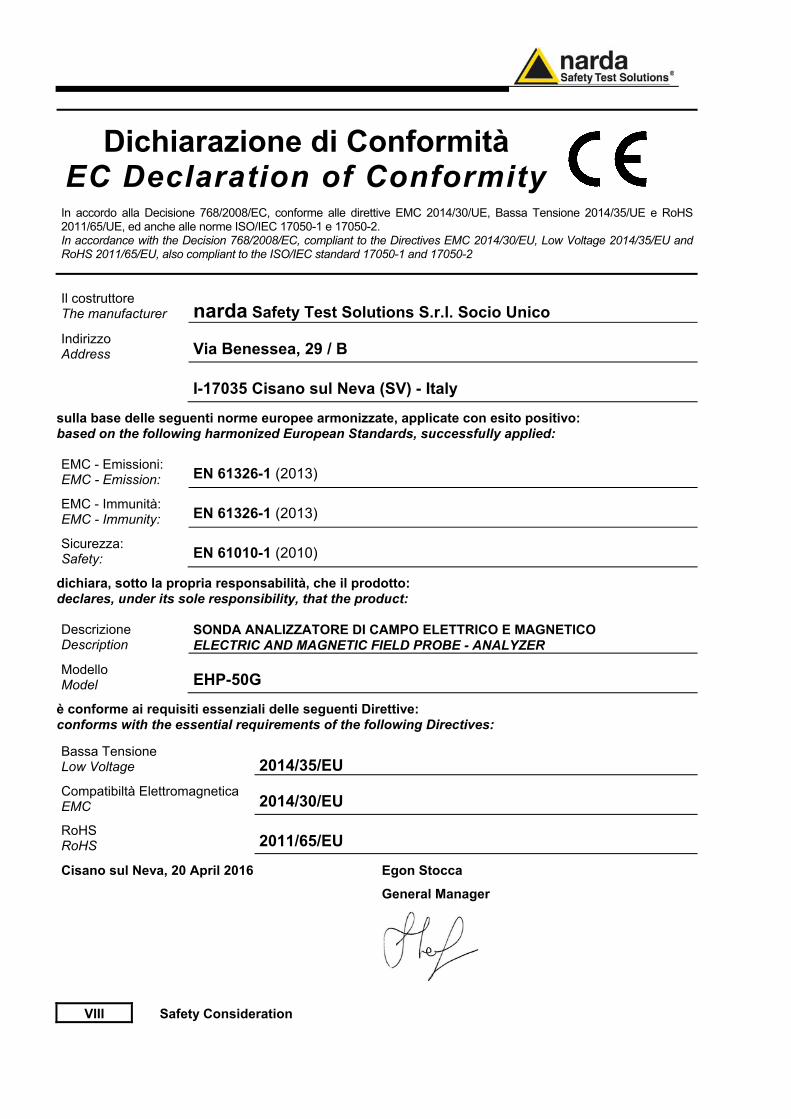
Dichiarazione di Conformità EC Declaration of Conformity
In accordo alla Decisione 768/2008/EC, conforme alle direttive EMC 2014/30/UE, Bassa Tensione 2014/35/UE e RoHS 2011/65/UE, ed anche alle norme ISO/IEC 17050-1 e 17050-2. In accordance with the Decision 768/2008/EC, compliant to the Directives EMC 2014/30/EU, Low Voltage 2014/35/EU and RoHS 2011/65/EU, also compliant to the ISO/IEC standard 17050-1 and 17050-2
Il costruttore The manufacturer narda Safety Test Solutions S.r.l. Socio Unico
Indirizzo Address Via Benessea, 29 / B
I-17035 Cisano sul Neva (SV) - Italy
sulla base delle seguenti norme europee armonizzate, applicate con esito positivo: based on the following harmonized European Standards, successfully applied:
EMC - Emissioni: EMC - Emission: EN 61326-1 (2013)
EMC - Immunità: EMC - Immunity: EN 61326-1 (2013)
Sicurezza: Safety: EN 61010-1 (2010)
dichiara, sotto la propria responsabilità, che il prodotto: declares, under its sole responsibility, that the product:
Descrizione Description
SONDA ANALIZZATORE DI CAMPO ELETTRICO E MAGNETICO ELECTRIC AND MAGNETIC FIELD PROBE - ANALYZER
Modello Model EHP-50G
è conforme ai requisiti essenziali delle seguenti Direttive: conforms with the essential requirements of the following Directives:
Bassa Tensione Low Voltage 2014/35/EU
Compatibiltà Elettromagnetica EMC 2014/30/EU
RoHS RoHS 2011/65/EU
Cisano sul Neva, 20 April 2016
Egon Stocca
General Manager
General Information 1-1
1 - General information 1.1 Documentation
The following documents are included in this Manual: • A questionnaire to be sent to NARDA together with the apparatus
should service be required. • A checklist of the Accessories included in the shipment. This Manual includes description of EHP-50G standard and optional accessories.
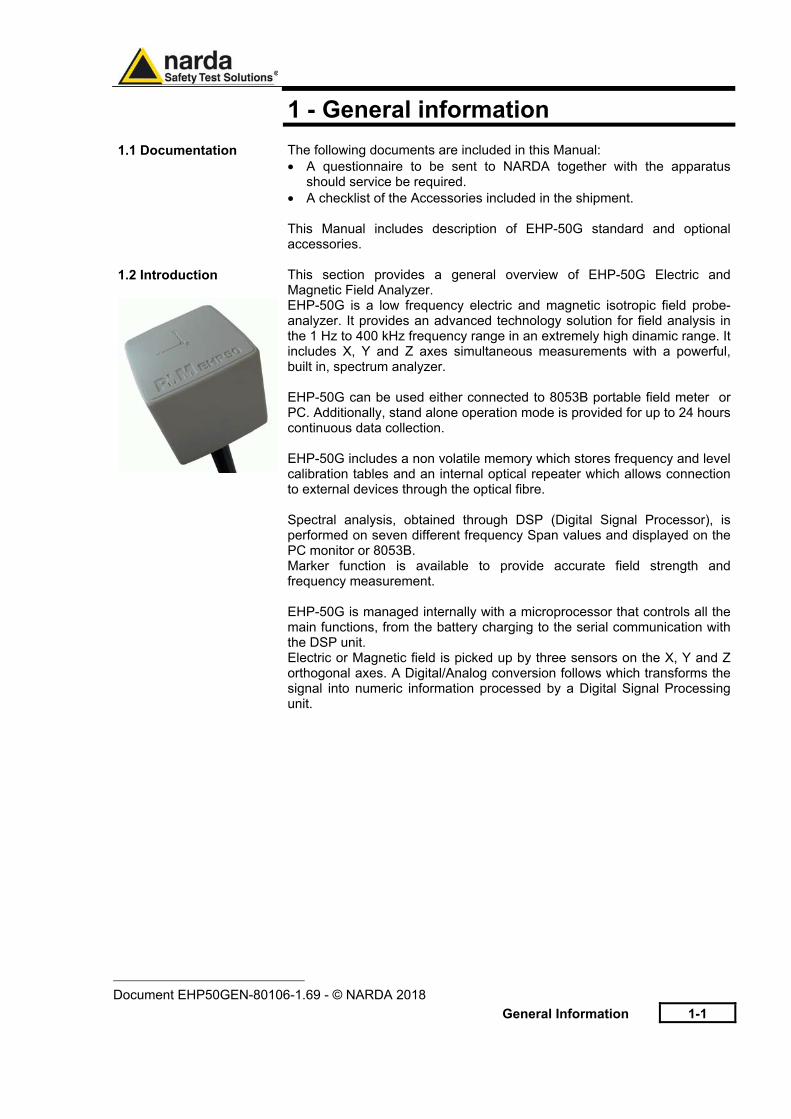
1.2 Introduction
This section provides a general overview of EHP-50G Electric and Magnetic Field Analyzer. EHP-50G is a low frequency electric and magnetic isotropic field probe-analyzer. It provides an advanced technology solution for field analysis in the 1 Hz to 400 kHz frequency range in an extremely high dinamic range. It includes X, Y and Z axes simultaneous measurements with a powerful, built in, spectrum analyzer. EHP-50G can be used either connected to 8053B portable field meter or PC. Additionally, stand alone operation mode is provided for up to 24 hours continuous data collection. EHP-50G includes a non volatile memory which stores frequency and level calibration tables and an internal optical repeater which allows connection to external devices through the optical fibre. Spectral analysis, obtained through DSP (Digital Signal Processor), is performed on seven different frequency Span values and displayed on the PC monitor or 8053B. Marker function is available to provide accurate field strength and frequency measurement. EHP-50G is managed internally with a microprocessor that controls all the main functions, from the battery charging to the serial communication with the DSP unit. Electric or Magnetic field is picked up by three sensors on the X, Y and Z orthogonal axes. A Digital/Analog conversion follows which transforms the signal into numeric information processed by a Digital Signal Processing unit.
Document EHP50GEN-80106-1.69 - © NARDA 2018
1-2 General Information
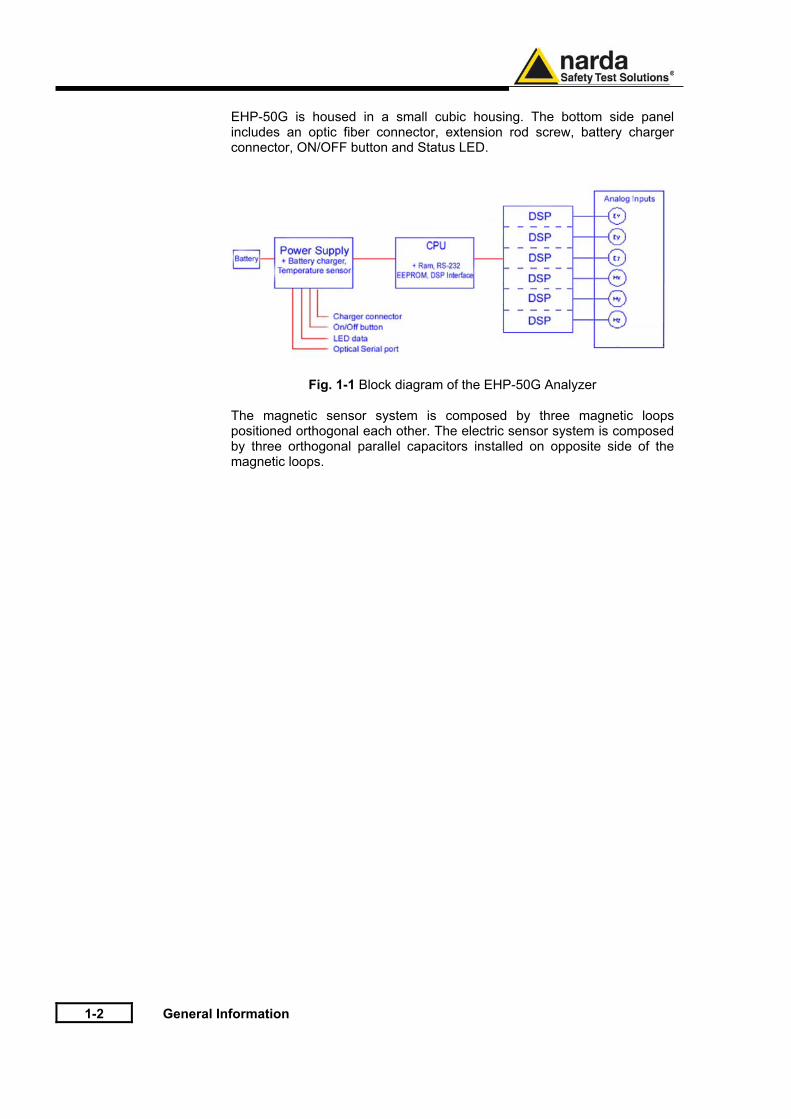
EHP-50G is housed in a small cubic housing. The bottom side panel
includes an optic fiber connector, extension rod screw, battery charger connector, ON/OFF button and Status LED.
Fig. 1-1 Block diagram of the EHP-50G Analyzer
The magnetic sensor system is composed by three magnetic loops positioned orthogonal each other. The electric sensor system is composed by three orthogonal parallel capacitors installed on opposite side of the magnetic loops.
General Information 1-3
1.3 Configuration and Standard Accessories
EHP-50G can be purchased as part of two different sets, for 8053B or Stand-alone/PC use, which difference consist of the included accessories. • 8053-SC Soft carrying case, holds basic unit and accessories including
8053-Display; • AC/DC battery charger; • International AC plug adapter; • FO-8053/10 Cable, fibre optic 10m • FO-10USB Cable, fibre optic 10m; • USB-OC Optical to USB converter; • Optical bridge connector; • Plastic rod support, 50cm; • Mini tripod, bench top; • EHP-TS Software Media; • Operating manual EHP-50G; • Certificate of calibration; • Return for Repair Form
1.4 Optional Accessories
The following accessories may be ordered as options: • 2013/35 kit (including the EHP-50G itself); • 8053B; • SB-04 Switching Control Box; • FO-20USB Cable, fiber optic 20m; • FO-40USB Cable, fiber optic 40m; • FO-8053/20 Cable, fiber optic 20m; • FO-8053/40 Cable, fiber optic 40m; • FO-8053/80 Cable, fiber optic 80m; • 8053-OC Optical to RS232 converter; • 8053-OC-PS Power Supply; • TR-02A wooden tripod 1-2m with soft carrying bag; • TT-01 telescopic mast (120-420 cm) with carrying bag; • 8053-CC Rigid case; • 8053-CA Car Adapter.
1-4 General Information
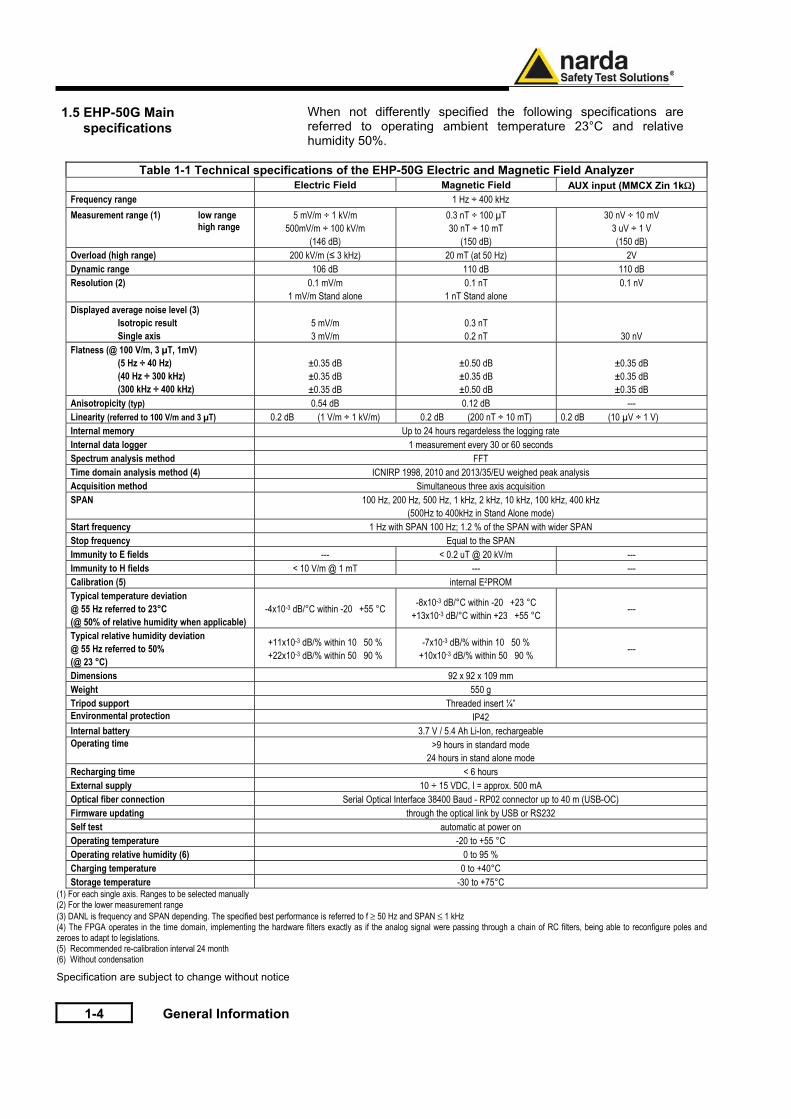
1.5 EHP-50G Main specifications
When not differently specified the following specifications are referred to operating ambient temperature 23°C and relative humidity 50%.
Table 1-1 Technical specifications of the EHP-50G Electric and Magnetic Field Analyzer Electric Field Magnetic Field AUX input (MMCX Zin 1kΩ)
Frequency range 1 Hz ÷ 400 kHz
Measurement range (1) low range high range
5 mV/m ÷ 1 kV/m 500mV/m ÷ 100 kV/m
(146 dB)
0.3 nT ÷ 100 µT 30 nT ÷ 10 mT
(150 dB)
30 nV ÷ 10 mV 3 uV ÷ 1 V (150 dB)
Overload (high range) 200 kV/m (≤ 3 kHz) 20 mT (at 50 Hz) 2V Dynamic range 106 dB 110 dB 110 dB Resolution (2) 0.1 mV/m
1 mV/m Stand alone 0.1 nT
1 nT Stand alone 0.1 nV
Displayed average noise level (3) Isotropic result Single axis
5 mV/m 3 mV/m
0.3 nT 0.2 nT
30 nV Flatness (@ 100 V/m, 3 µT, 1mV) (5 Hz ÷ 40 Hz) (40 Hz ÷ 300 kHz) (300 kHz ÷ 400 kHz)
±0.35 dB ±0.35 dB ±0.35 dB
±0.50 dB ±0.35 dB ±0.50 dB
±0.35 dB ±0.35 dB ±0.35 dB
Anisotropicity (typ) 0.54 dB 0.12 dB --- Linearity (referred to 100 V/m and 3 µT) 0.2 dB (1 V/m ÷ 1 kV/m) 0.2 dB (200 nT ÷ 10 mT) 0.2 dB (10 µV ÷ 1 V) Internal memory Up to 24 hours regardeless the logging rate Internal data logger 1 measurement every 30 or 60 seconds Spectrum analysis method FFT Time domain analysis method (4) ICNIRP 1998, 2010 and 2013/35/EU weighed peak analysis Acquisition method Simultaneous three axis acquisition SPAN 100 Hz, 200 Hz, 500 Hz, 1 kHz, 2 kHz, 10 kHz, 100 kHz, 400 kHz
(500Hz to 400kHz in Stand Alone mode) Start frequency 1 Hz with SPAN 100 Hz; 1.2 % of the SPAN with wider SPAN Stop frequency Equal to the SPAN Immunity to E fields --- < 0.2 uT @ 20 kV/m --- Immunity to H fields < 10 V/m @ 1 mT --- --- Calibration (5) internal E2PROM Typical temperature deviation @ 55 Hz referred to 23°C (@ 50% of relative humidity when applicable)
-4x10⁻³ dB/°C within -20 +55 °C -8x10⁻³ dB/°C within -20 +23 °C
+13x10-3 dB/°C within +23 +55 °C ---
Typical relative humidity deviation @ 55 Hz referred to 50% (@ 23 °C)
+11x10-3 dB/% within 10 50 % +22x10-3 dB/% within 50 90 %
-7x10⁻³ dB/% within 10 50 % +10x10-3 dB/% within 50 90 %
---
Dimensions 92 x 92 x 109 mm Weight 550 g Tripod support Threaded insert ¼” Environmental protection IP42 Internal battery 3.7 V / 5.4 Ah Li-Ion, rechargeable Operating time >9 hours in standard mode
24 hours in stand alone mode Recharging time < 6 hours External supply 10 ÷ 15 VDC, I = approx. 500 mA Optical fiber connection Serial Optical Interface 38400 Baud - RP02 connector up to 40 m (USB-OC) Firmware updating through the optical link by USB or RS232 Self test automatic at power on Operating temperature -20 to +55 °C Operating relative humidity (6) 0 to 95 % Charging temperature 0 to +40°C Storage temperature -30 to +75°C
(1) For each single axis. Ranges to be selected manually (2) For the lower measurement range (3) DANL is frequency and SPAN depending. The specified best performance is referred to f ≥ 50 Hz and SPAN ≤ 1 kHz (4) The FPGA operates in the time domain, implementing the hardware filters exactly as if the analog signal were passing through a chain of RC filters, being able to reconfigure poles and zeroes to adapt to legislations. (5) Recommended re-calibration interval 24 month (6) Without condensation
Specification are subject to change without notice
General Information 1-5
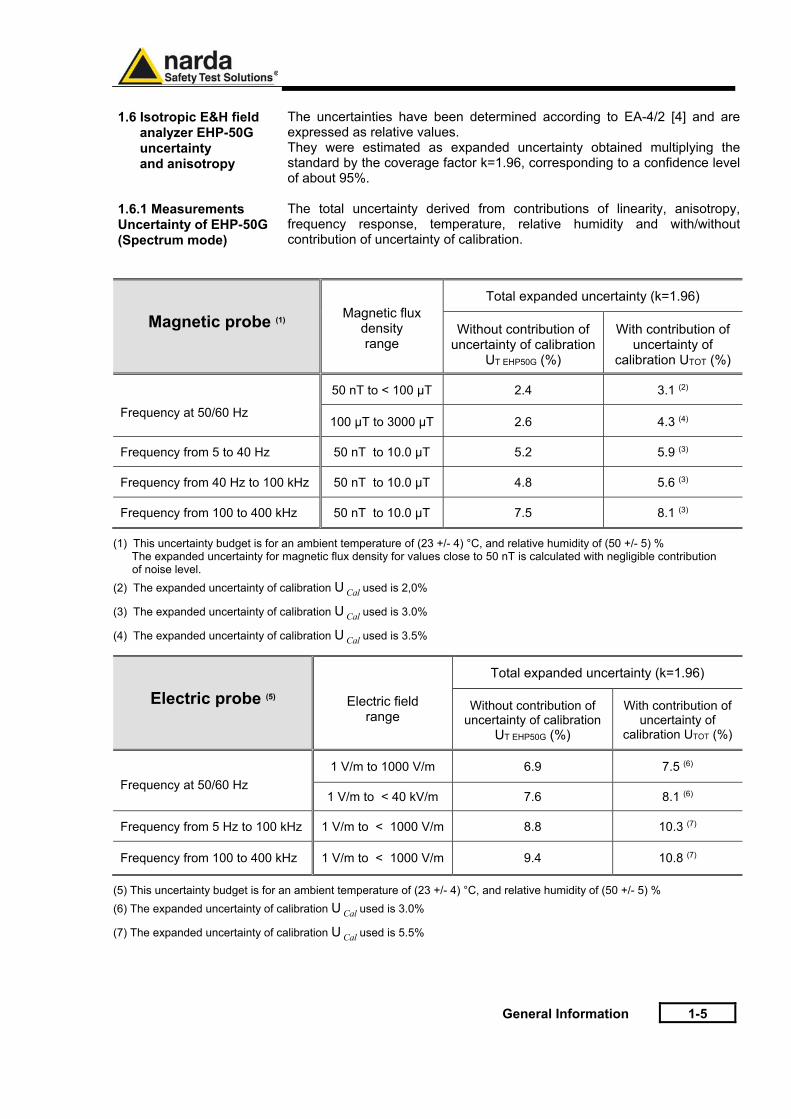
1.6 Isotropic E&H field analyzer EHP-50G uncertainty and anisotropy
The uncertainties have been determined according to EA-4/2 [4] and are expressed as relative values. They were estimated as expanded uncertainty obtained multiplying the standard by the coverage factor k=1.96, corresponding to a confidence level of about 95%.
1.6.1 Measurements Uncertainty of EHP-50G (Spectrum mode)
The total uncertainty derived from contributions of linearity, anisotropy, frequency response, temperature, relative humidity and with/without contribution of uncertainty of calibration.
Magnetic probe (1)
Magnetic flux density range
Total expanded uncertainty (k=1.96)
Without contribution of uncertainty of calibration
UT EHP50G (%)
With contribution of uncertainty of
calibration UTOT (%)
Frequency at 50/60 Hz
50 nT to < 100 µT 2.4 3.1 (2)
100 µT to 3000 µT 2.6 4.3 (4)
Frequency from 5 to 40 Hz 50 nT to 10.0 µT 5.2 5.9 (3)
Frequency from 40 Hz to 100 kHz 50 nT to 10.0 µT 4.8 5.6 (3)
Frequency from 100 to 400 kHz 50 nT to 10.0 µT 7.5 8.1 (3)
(1) This uncertainty budget is for an ambient temperature of (23 +/- 4) °C, and relative humidity of (50 +/- 5) % The expanded uncertainty for magnetic flux density for values close to 50 nT is calculated with negligible contribution
of noise level.
(2) The expanded uncertainty of calibration U Cal used is 2,0%
(3) The expanded uncertainty of calibration U Cal used is 3.0%
(4) The expanded uncertainty of calibration U Cal used is 3.5%
Electric probe (5)
Electric field range
Total expanded uncertainty (k=1.96)
Without contribution of uncertainty of calibration
UT EHP50G (%)
With contribution of uncertainty of
calibration UTOT (%)
Frequency at 50/60 Hz
1 V/m to 1000 V/m 6.9 7.5 (6)
1 V/m to < 40 kV/m 7.6 8.1 (6)
Frequency from 5 Hz to 100 kHz 1 V/m to < 1000 V/m 8.8 10.3 (7)
Frequency from 100 to 400 kHz 1 V/m to < 1000 V/m 9.4 10.8 (7)
(5) This uncertainty budget is for an ambient temperature of (23 +/- 4) °C, and relative humidity of (50 +/- 5) %
(6) The expanded uncertainty of calibration U Cal used is 3.0%
(7) The expanded uncertainty of calibration U Cal used is 5.5%
1-6 General Information
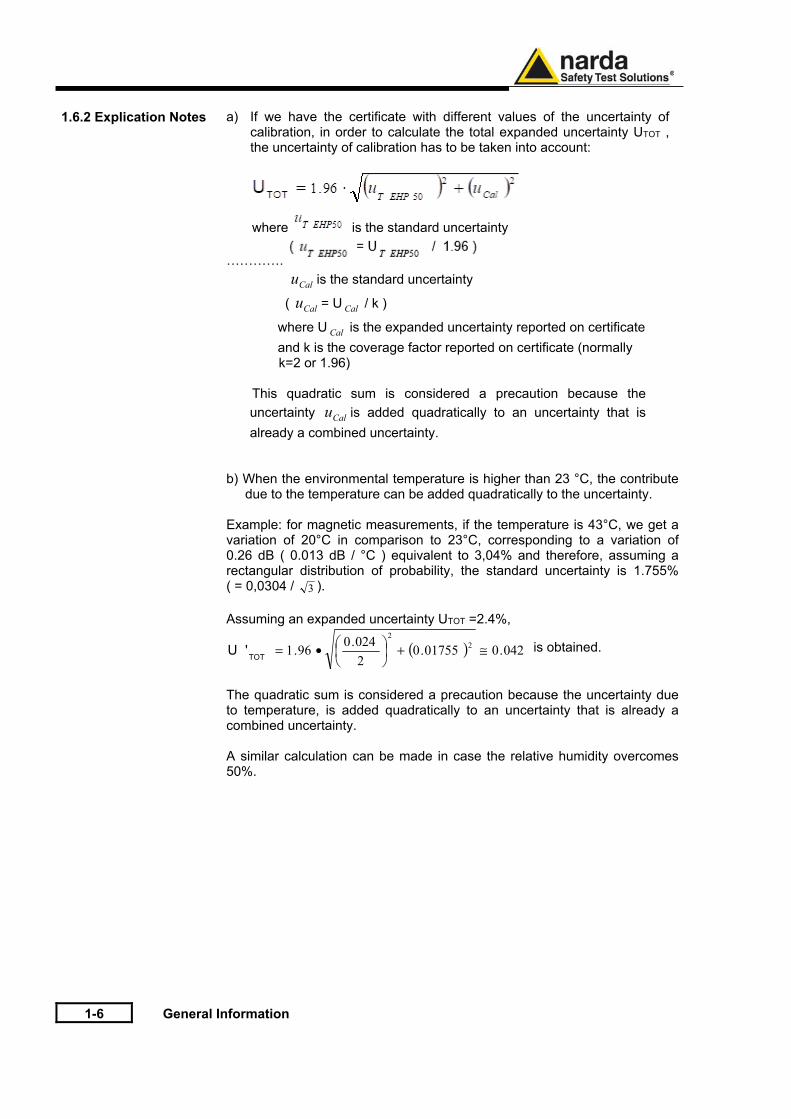
1.6.2 Explication Notes
a) If we have the certificate with different values of the uncertainty of
calibration, in order to calculate the total expanded uncertainty UTOT , the uncertainty of calibration has to be taken into account:
where is the standard uncertainty
………….
Calu is the standard uncertainty
( Calu = U Cal / k )
where U Cal is the expanded uncertainty reported on certificate
and k is the coverage factor reported on certificate (normally k=2 or 1.96)
This quadratic sum is considered a precaution because the
uncertainty Calu is added quadratically to an uncertainty that is
already a combined uncertainty.
b) When the environmental temperature is higher than 23 °C, the contribute due to the temperature can be added quadratically to the uncertainty.
Example: for magnetic measurements, if the temperature is 43°C, we get avariation of 20°C in comparison to 23°C, corresponding to a variation of 0.26 dB ( 0.013 dB / °C ) equivalent to 3,04% and therefore, assuming a rectangular distribution of probability, the standard uncertainty is 1.755% ( = 0,0304 / 3 ). Assuming an expanded uncertainty UTOT =2.4%,
( ) 042.001755.02024.096.1 2
2
≅+
•=
TOT'U is obtained.
The quadratic sum is considered a precaution because the uncertainty due to temperature, is added quadratically to an uncertainty that is already a combined uncertainty. A similar calculation can be made in case the relative humidity overcomes 50%.
General Information 1-7
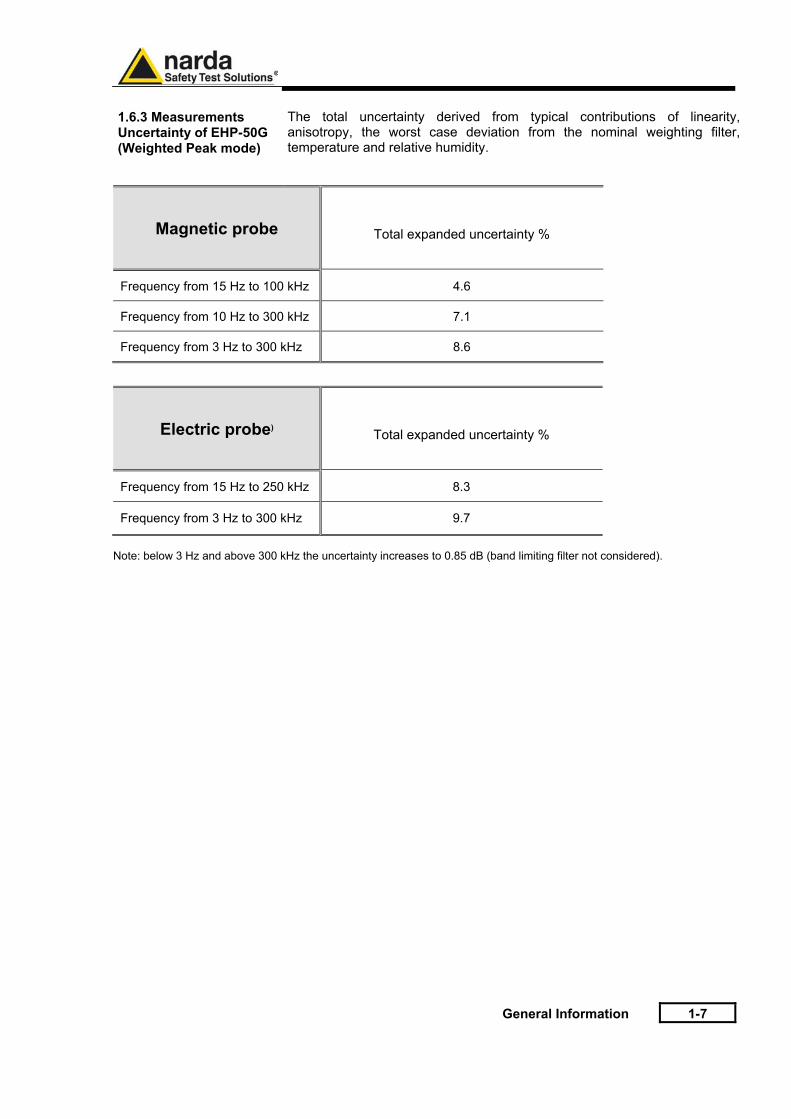
1.6.3 Measurements Uncertainty of EHP-50G (Weighted Peak mode)
The total uncertainty derived from typical contributions of linearity, anisotropy, the worst case deviation from the nominal weighting filter, temperature and relative humidity.
Magnetic probe
Total expanded uncertainty %
Frequency from 15 Hz to 100 kHz 4.6
Frequency from 10 Hz to 300 kHz 7.1
Frequency from 3 Hz to 300 kHz 8.6
Electric probe)
Total expanded uncertainty %
Frequency from 15 Hz to 250 kHz 8.3
Frequency from 3 Hz to 300 kHz 9.7
Note: below 3 Hz and above 300 kHz the uncertainty increases to 0.85 dB (band limiting filter not considered).
1-8 General Information
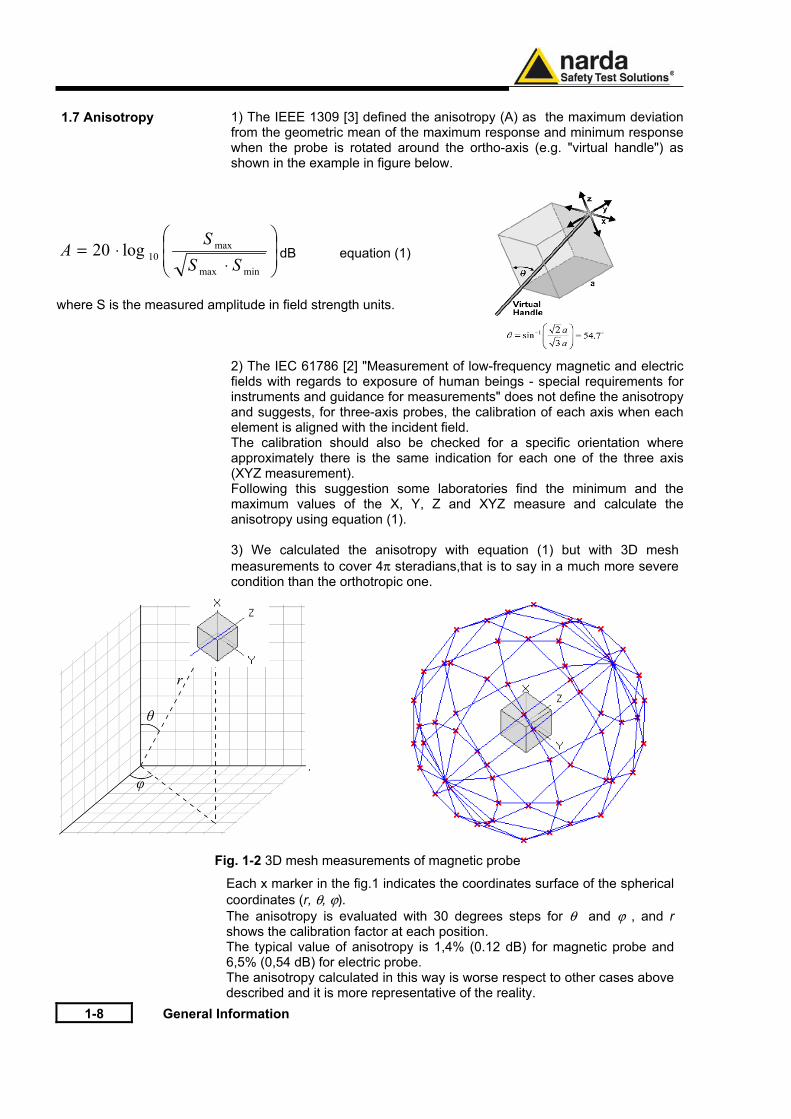
1.7 Anisotropy
1) The IEEE 1309 [3] defined the anisotropy (A) as the maximum deviation from the geometric mean of the maximum response and minimum response when the probe is rotated around the ortho-axis (e.g. "virtual handle") as shown in the example in figure below.
⋅⋅=
minmax
max10log20
SSSA dB equation (1)
where S is the measured amplitude in field strength units. 2) The IEC 61786 [2] "Measurement of low-frequency magnetic and electric
fields with regards to exposure of human beings - special requirements for instruments and guidance for measurements" does not define the anisotropy and suggests, for three-axis probes, the calibration of each axis when each element is aligned with the incident field. The calibration should also be checked for a specific orientation where approximately there is the same indication for each one of the three axis (XYZ measurement). Following this suggestion some laboratories find the minimum and the maximum values of the X, Y, Z and XYZ measure and calculate the anisotropy using equation (1).
3) We calculated the anisotropy with equation (1) but with 3D mesh measurements to cover 4π steradians,that is to say in a much more severe condition than the orthotropic one.
Fig. 1-2 3D mesh measurements of magnetic probe
Each x marker in the fig.1 indicates the coordinates surface of the spherical coordinates (r, θ, ϕ). The anisotropy is evaluated with 30 degrees steps for θ and ϕ , and r shows the calibration factor at each position. The typical value of anisotropy is 1,4% (0.12 dB) for magnetic probe and 6,5% (0,54 dB) for electric probe. The anisotropy calculated in this way is worse respect to other cases above described and it is more representative of the reality.
General Information 1-9
A good evaluation of the anisotropy of a field probe should be carried out in
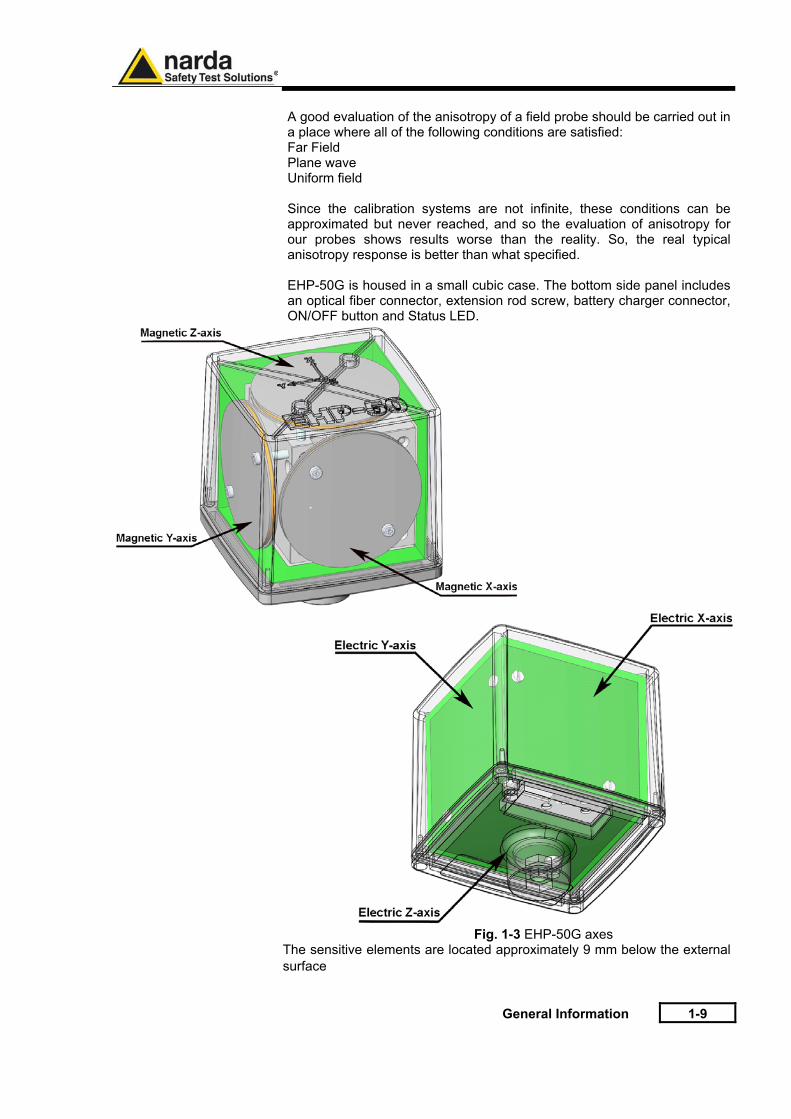
a place where all of the following conditions are satisfied: Far Field Plane wave Uniform field Since the calibration systems are not infinite, these conditions can be approximated but never reached, and so the evaluation of anisotropy for our probes shows results worse than the reality. So, the real typical anisotropy response is better than what specified. EHP-50G is housed in a small cubic case. The bottom side panel includes an optical fiber connector, extension rod screw, battery charger connector, ON/OFF button and Status LED.
Fig. 1-3 EHP-50G axes
The sensitive elements are located approximately 9 mm below the external surface
1-10 General Information
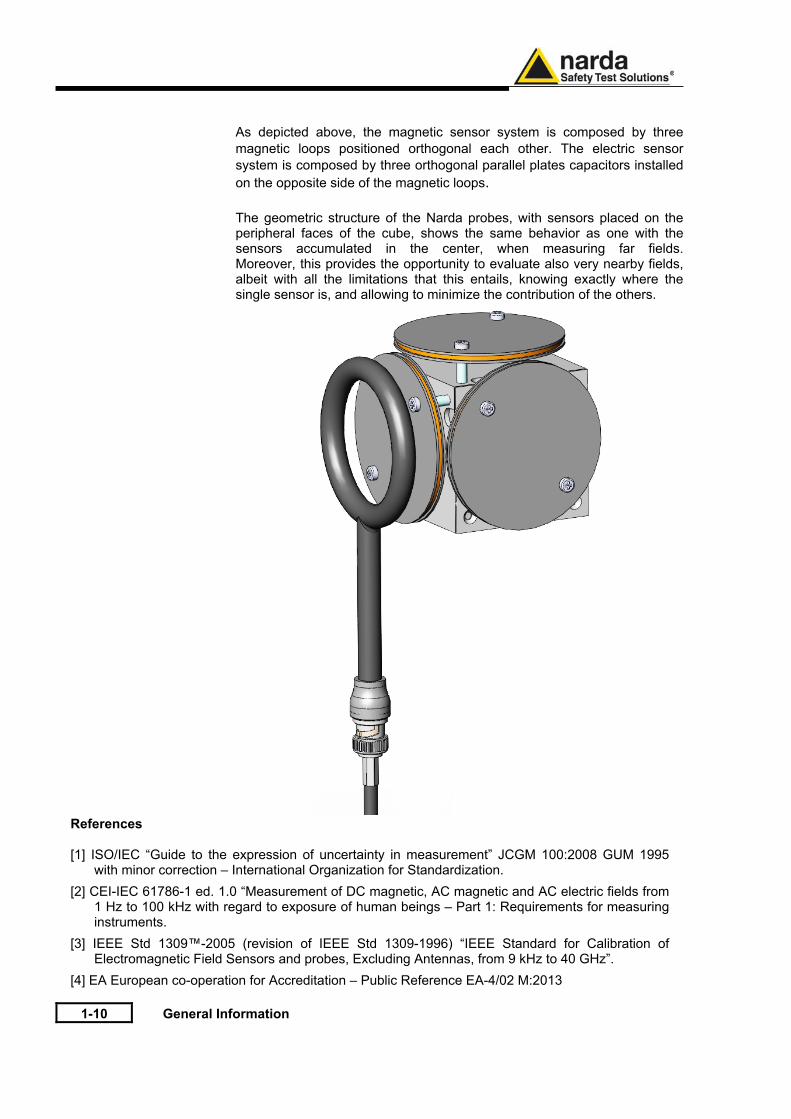
As depicted above, the magnetic sensor system is composed by three magnetic loops positioned orthogonal each other. The electric sensor system is composed by three orthogonal parallel plates capacitors installed on the opposite side of the magnetic loops.
The geometric structure of the Narda probes, with sensors placed on the peripheral faces of the cube, shows the same behavior as one with the sensors accumulated in the center, when measuring far fields.Moreover, this provides the opportunity to evaluate also very nearby fields, albeit with all the limitations that this entails, knowing exactly where the single sensor is, and allowing to minimize the contribution of the others.
References
[1] ISO/IEC “Guide to the expression of uncertainty in measurement” JCGM 100:2008 GUM 1995 with minor correction – International Organization for Standardization.
[2] CEI-IEC 61786-1 ed. 1.0 “Measurement of DC magnetic, AC magnetic and AC electric fields from 1 Hz to 100 kHz with regard to exposure of human beings – Part 1: Requirements for measuring instruments.
[3] IEEE Std 1309™-2005 (revision of IEEE Std 1309-1996) “IEEE Standard for Calibration of Electromagnetic Field Sensors and probes, Excluding Antennas, from 9 kHz to 40 GHz”.
[4] EA European co-operation for Accreditation – Public Reference EA-4/02 M:2013
General Information 1-11
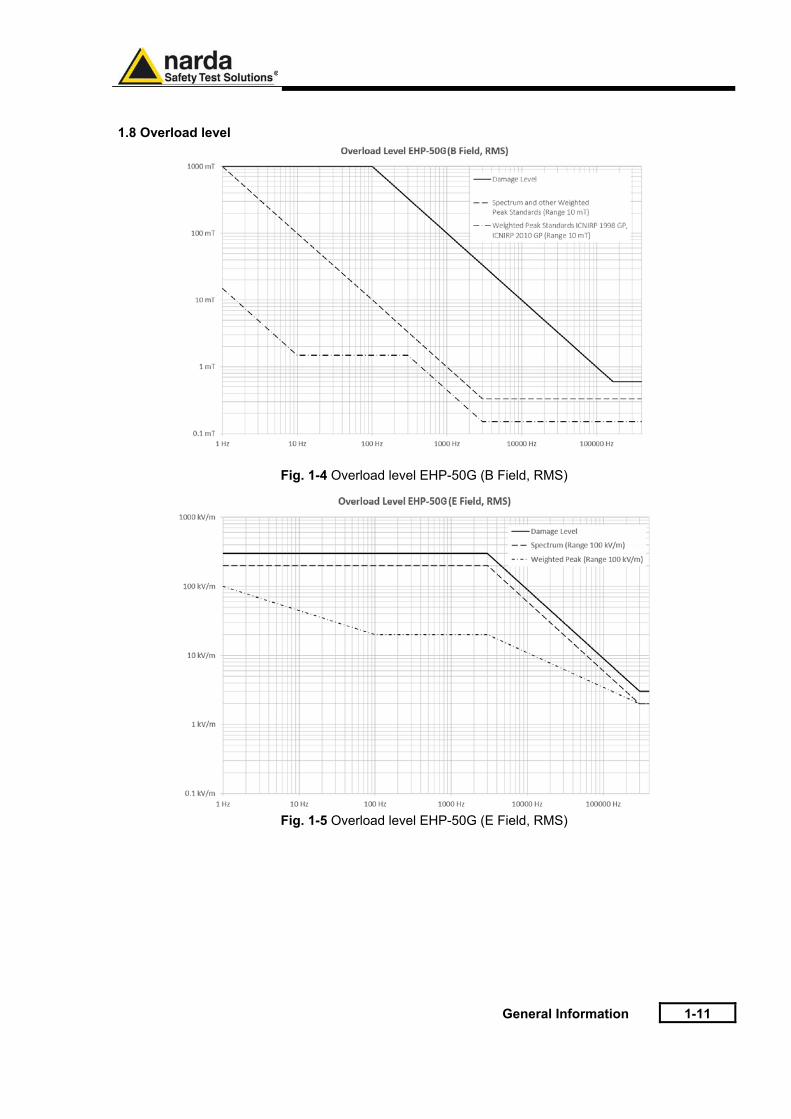
1.8 Overload level
Fig. 1-4 Overload level EHP-50G (B Field, RMS)
Fig. 1-5 Overload level EHP-50G (E Field, RMS)
1-12 General Information
1.9 EHP-50G Panel
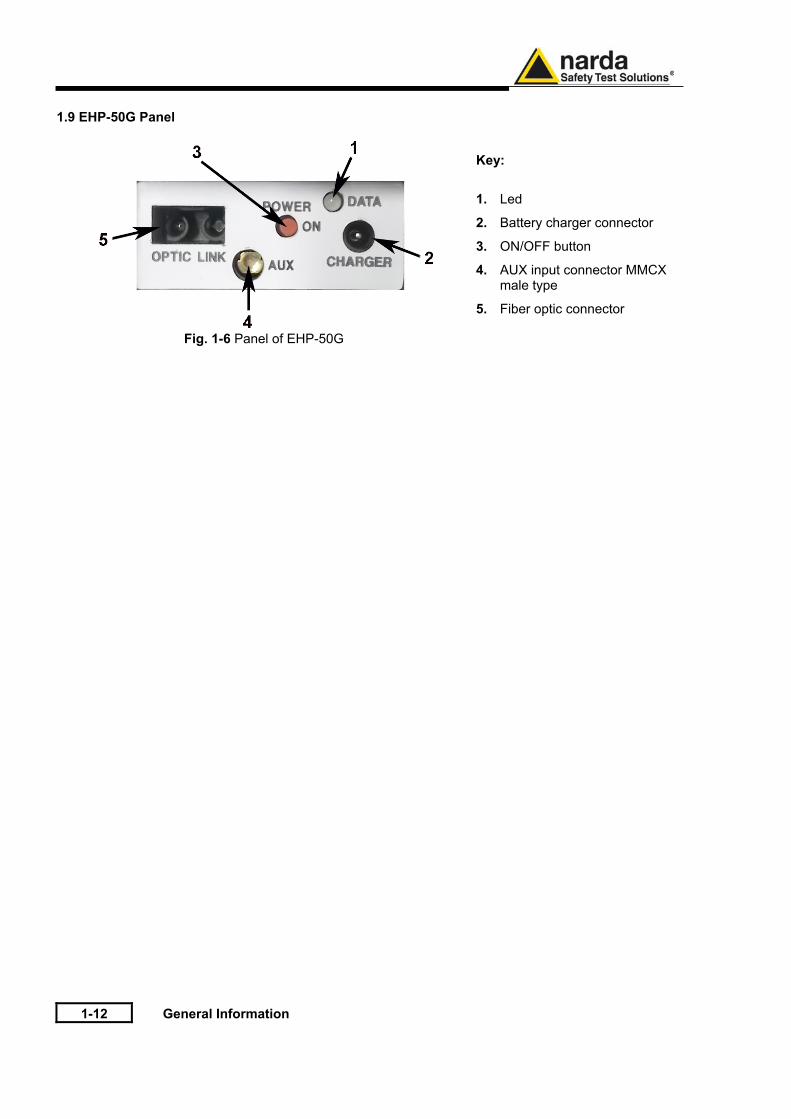
Fig. 1-6 Panel of EHP-50G
Key:
1. Led
2. Battery charger connector
3. ON/OFF button
4. AUX input connector MMCX male type
5. Fiber optic connector

Installation and use 2-1
2 - Installation and use
2.1 Introduction
This section provides the information required for installing and using the EHP-50G Analyzer. Information is included regarding initial inspection, power requirements, interconnections, work environment, assembly, cleaning, storage and shipment.
2.2 Preliminary inspection
Inspect the packaging for any damage. If the packaging or anti-shock material have been damaged, check that the contents are complete and that the meter has not suffered electric or mechanical damage. Check that all the Accessories are there against the checklist found with the apparatus. Inform the carrier and NARDA of any damage that has occurred.
2.3 Work environment The work environment of the Accessories, must come within the following conditions:
• Temperature • Humidity
From -20°C to +55°C 0 to 95% relative
The meter must be stored in a clean and dry environment, free from acid dusts and humidity. The storage environment must come within the range of the following conditions:
• Temperature • Humidity
From -30°C to + 75°C < 100% relative without condense
2.4 To return for repair When the meter needs to be returned to NARDA for repair, please complete the questionnaire appended to this User’s Manual, filling in all the data that will be useful for the service you have requested. For reducing the period of time required for the repairs, it is necessary to be as specific as possible in describing the problem. If the problem only occurs in certain circumstances, please describe in detail how it happens. If possible it is better to reuse the original packaging; making sure that the apparatus is wrapped in thick paper or plastic. Otherwise, use strong packaging by using a sufficient quantity of shock absorbent material around all sides of the meter to ensure that it is compact and does not move around inside the package. In particular, take every precaution to protect the front panels. Finish the package by sealing it up tightly. Apply a FRAGILE label to the package to encourage greater care in its handling.
Nowadays there are restrictions on the shipment of hazardous materials, eg. some types of lithium batteries. Please, check the proper, safe, shipping mode, with the help of your courier, in the case the product is equipped with batteries.
2.5 To clean the meter
Use a dry, clean and non-abrasive cloth for cleaning the meter. Do not use solvents, acids, turpentine, acetone or other similar products for cleaning the meter in order to avoid damaging it.
Document EHP50GEN-80106-1.69 - © NARDA 2018
2-2 Installation and use
2.6 Power supply and battery recharging
EHP-50G has an internal rechargeable Li-Ion battery that can be recharged with the battery charger supplied with it.
Make a full charging cycle before using the Analyzer for longest battery operation time.
ALWAYS connect the battery charger to the power supply BEFORE connecting it to the EHP-50G. The battery charger has an internal protective circuit that will limit the output of current if there is any load when connecting to the mains. Always remove the shorting loop connector when recharging EHP-50G.
Battery charger: output: DC, 10 - 15 V, ~ 500 mA
Connector:
+-
In order to safeguard the features of the batteries, it is crucial to have a complete recharge before storing them for periods longer than 4 months. Therefore, it is warmly suggested recharging the batteries at least every 4 months even though the device has not been used.
The minimum voltage level for operation is about 3.25V. The batteries must be recharged for lower voltages. Below such voltage the analyzer will turn OFF automatically.
The time required for recharging the batteries is about 4-5 hours. When the recharge is complete, this is indicated by the Led of the EHP-50G, with a rapidly blinking Green light.
To take measurements ALWAYS remove the battery charger from the EHP-50G Analyzer otherwise the system does not work.
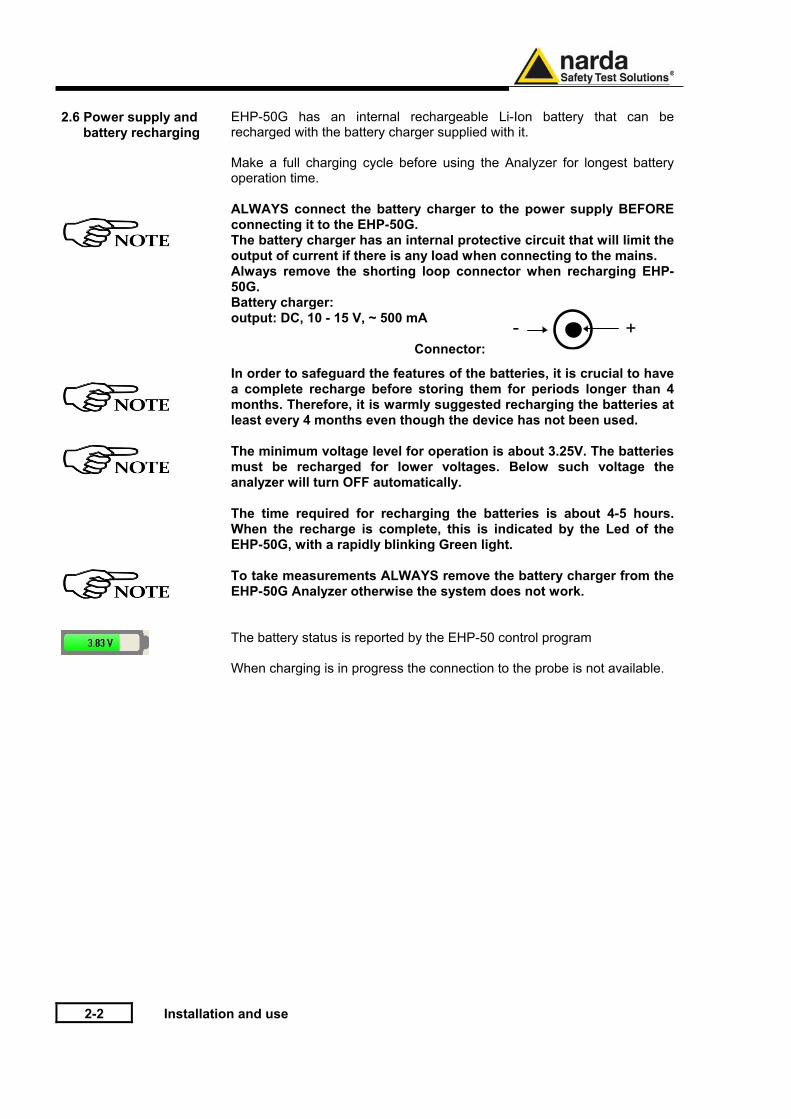
The battery status is reported by the EHP-50 control program
When charging is in progress the connection to the probe is not available.
Installation and use 2-3
2.7 EHP-50G connected to a PC
Using the EHP-TS software spectrum analysis can be displayed on a PC Please refer to chapter 5 of this manual for software instructions.
2.8 EHP-50G stand alone Mode
The EHP-50G offers a Stand-alone mode of operation and thanks to its internal memory is possible to perform a long term acquisition without connecting it to any external device. With EHP-50G is possible to collect data every 1 minute or every 30 seconds for 24 hours. Later on, it is possible to download all collected data to any PC by using the provided EHP-TS PC software.
2.9 EHP-50F with 8053B
EHP-50G is linked to 8053 DISPLAY via the optic fiber link.
See 8053 DISPLAY Manual for further details
2.10 Battery management
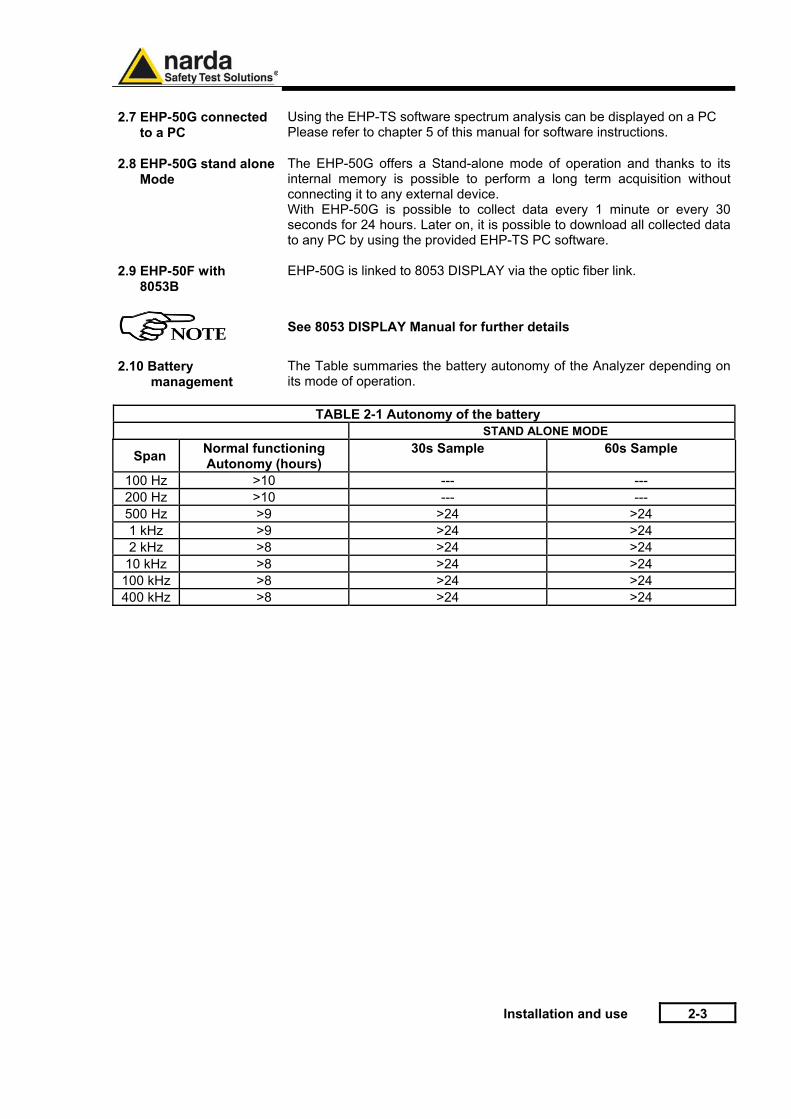
The Table summaries the battery autonomy of the Analyzer depending on its mode of operation.
TABLE 2-1 Autonomy of the battery
STAND ALONE MODE
Span Normal functioning Autonomy (hours)
30s Sample 60s Sample
100 Hz >10 --- --- 200 Hz >10 --- --- 500 Hz >9 >24 >24 1 kHz >9 >24 >24 2 kHz >8 >24 >24
10 kHz >8 >24 >24 100 kHz >8 >24 >24 400 kHz >8 >24 >24
2-4 Installation and use
2.11 Avoiding measurement errors
To avoid disturbing the measurements in progress, the user or other persons or mobile vehicles should stay at least 5 meters away from the Analyzers. We also recommend that the probe be set up a long way from metal objects or masses. To perform correct measurements, the tripod TR-02A to hold EHP-50G is mandatory. Using an unsuitable support could influence the measurements that have been taken and, therefore, determine incorrect results. We recommend always using the isolated extension support supplied with EHP-50G for supporting the Analyzer. We also recommend that the TR-02A optional tripod be used for positioning EHP-50G at the height set out in the reference standards for the measurement in progress and that this configuration is always maintained so that the measurements taken can be repeated.
The intensity of the measured field mainly depends on its voltage and the geometry of the system under examination as well as the distance between the conductors and the measurement points. In the vicinity of cables, the reading of the field value may be very high and vary with the location of the probe. From the definition of the potential difference between to points:
drr
rEV −=
2
1
21
It is evident that, keeping the potential difference constant as the distance between the two points under examination decreases, the intensity of the field necessarily increases. For example: the intensity of the electric field between two armatures of a parallel-plate capacitor situated at a distance of 0.1 m and having a potential difference of 100 V is equal to:
mKV
mVE 1
1,0100 ==
It should be noted that a voltage of 100 V, in these conditions, generates a field of 1000 V/m. It is, therefore, possible, in the vicinity of 220 V conductors, that there may be a field, which is much higher than 220 V/m.
EHP-TS software 3-1
3 – EHP-TS installation 3.1 Introduction
EHP-TS is a useful software tool developed for remote PC control, through fibre optic link, of EHP family Electromagnetic field analyzers. By means of the recently introduced USB-OC optical to USB converter, EHP-50G and EHP-200A can be connected to a PC USB port. Using the former optical/RS232 adapter, the selected COM port should be assigned to the application software (see cap.5 EHP-TS applications). EHP-TS software requires that at least one of the mentioned analyzers is connected to PC in order to run. The EHP-TS installation program automatically installs the driver for USB optical converter.
3.2 Hardware requirements
Minimum requirements:
• Processor: Pentium or equivalent • 256 MB RAM • At least 64 MB of free space on hard disk • 1 free USB or RS232 port • Windows Operating system™ XP/Vista/Win7/Win8
The User might have the need of administrator privileges to install and run the software in Windows Vista, 7 and 8; for further information see the next paragraph.
EHP-TS software does not work with EHP50A/B.
The EHP-50G requires an EHP50-TS software version 1.61, included in the EHP-TS software setup version 1.64 or later. The new releases can be downloaded directly from the narda website.http://www.narda-sts.it
1
Document EHP50GEN-80106-1.69 - © NARDA 2018
3-2 EHP-TS software
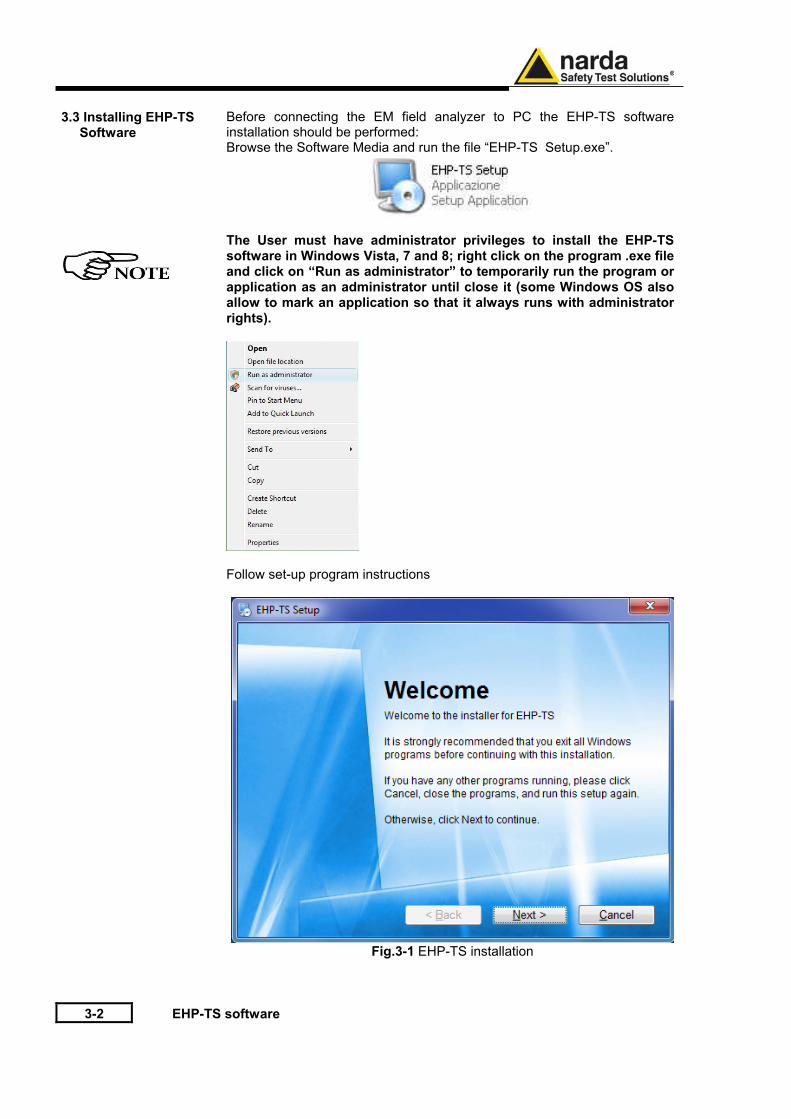
3.3 Installing EHP-TS Software
Before connecting the EM field analyzer to PC the EHP-TS software installation should be performed: Browse the Software Media and run the file “EHP-TS Setup.exe”.
The User must have administrator privileges to install the EHP-TS software in Windows Vista, 7 and 8; right click on the program .exe file and click on “Run as administrator” to temporarily run the program or application as an administrator until close it (some Windows OS also allow to mark an application so that it always runs with administrator rights).
Follow set-up program instructions
Fig.3-1 EHP-TS installation
EHP-TS software 3-3
3-4 EHP-TS software
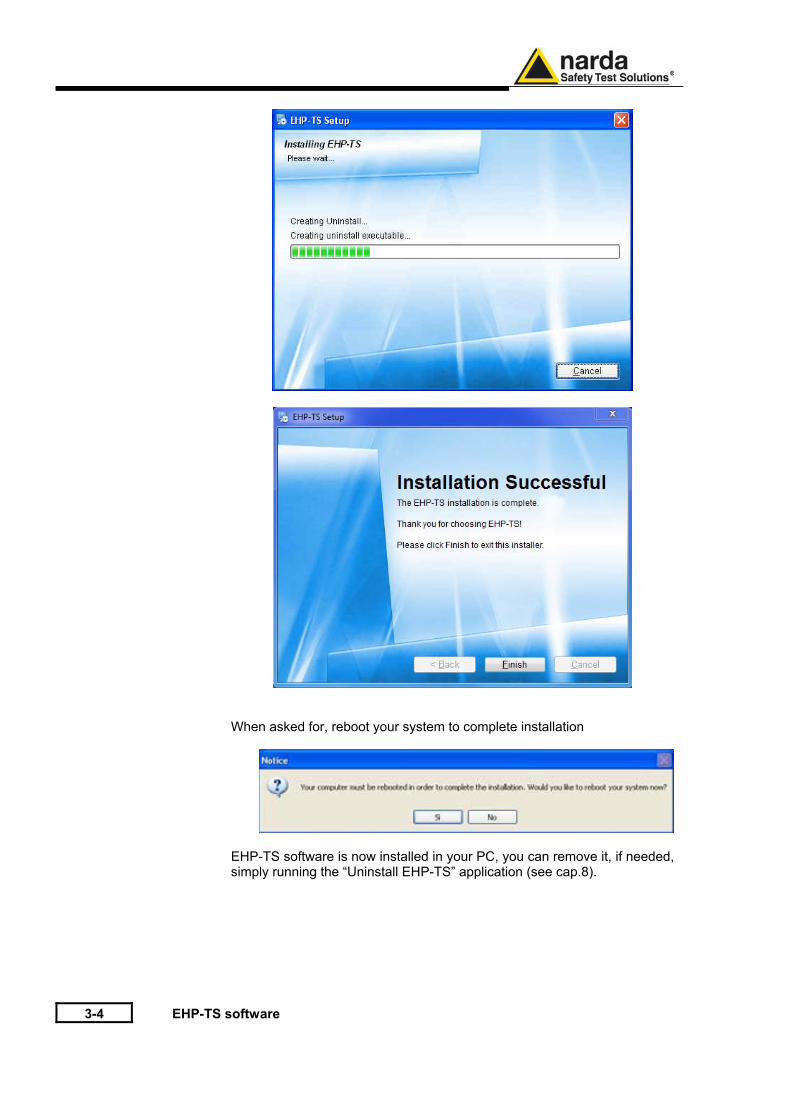
When asked for, reboot your system to complete installation
EHP-TS software is now installed in your PC, you can remove it, if needed, simply running the “Uninstall EHP-TS” application (see cap.8).
Description 4-1
4 – EHP-TS software 4.1 EHP-TS Applications
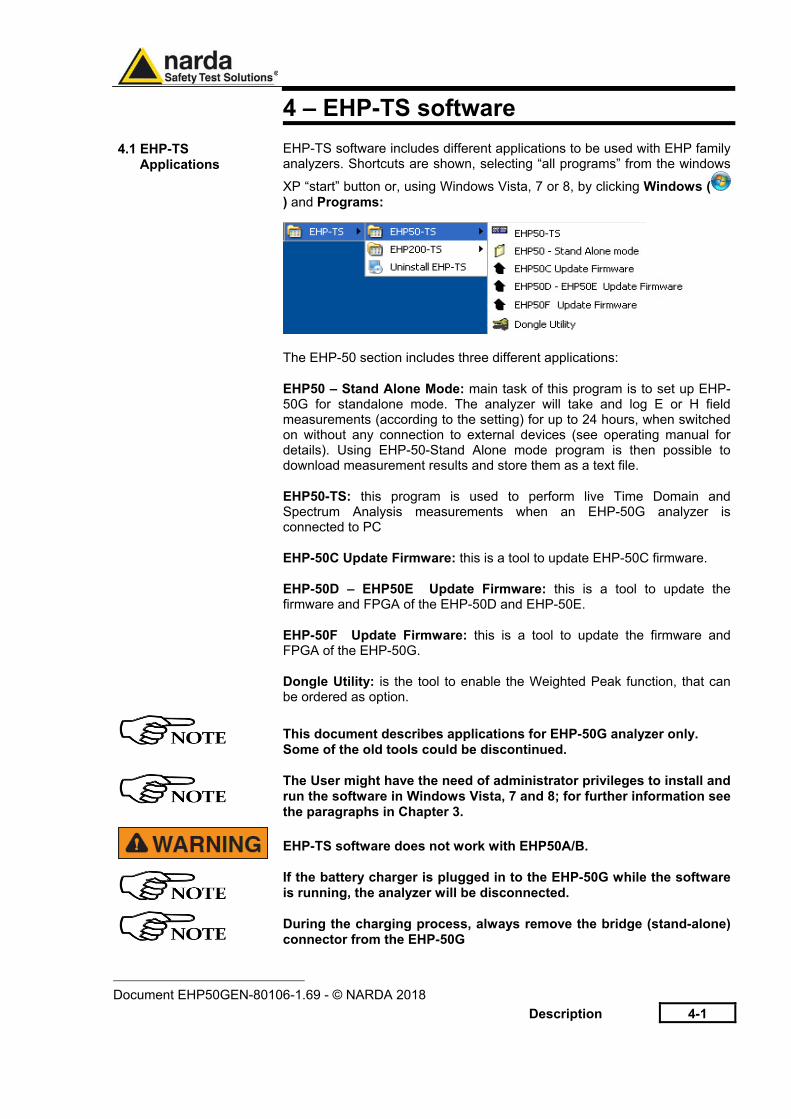
EHP-TS software includes different applications to be used with EHP family analyzers. Shortcuts are shown, selecting “all programs” from the windows
XP “start” button or, using Windows Vista, 7 or 8, by clicking Windows () and Programs:
The EHP-50 section includes three different applications: EHP50 – Stand Alone Mode: main task of this program is to set up EHP-50G for standalone mode. The analyzer will take and log E or H field measurements (according to the setting) for up to 24 hours, when switched on without any connection to external devices (see operating manual for details). Using EHP-50-Stand Alone mode program is then possible to download measurement results and store them as a text file. EHP50-TS: this program is used to perform live Time Domain and Spectrum Analysis measurements when an EHP-50G analyzer is connected to PC EHP-50C Update Firmware: this is a tool to update EHP-50C firmware. EHP-50D – EHP50E Update Firmware: this is a tool to update the firmware and FPGA of the EHP-50D and EHP-50E. EHP-50F Update Firmware: this is a tool to update the firmware and FPGA of the EHP-50G. Dongle Utility: is the tool to enable the Weighted Peak function, that can be ordered as option.
This document describes applications for EHP-50G analyzer only. Some of the old tools could be discontinued.
The User might have the need of administrator privileges to install and run the software in Windows Vista, 7 and 8; for further information see the paragraphs in Chapter 3.
EHP-TS software does not work with EHP50A/B.
If the battery charger is plugged in to the EHP-50G while the software is running, the analyzer will be disconnected. During the charging process, always remove the bridge (stand-alone) connector from the EHP-50G
1
Document EHP50GEN-80106-1.69 - © NARDA 2018
4-2 Description
4.2 EHP50-TS Application
4.2.1 Main menu
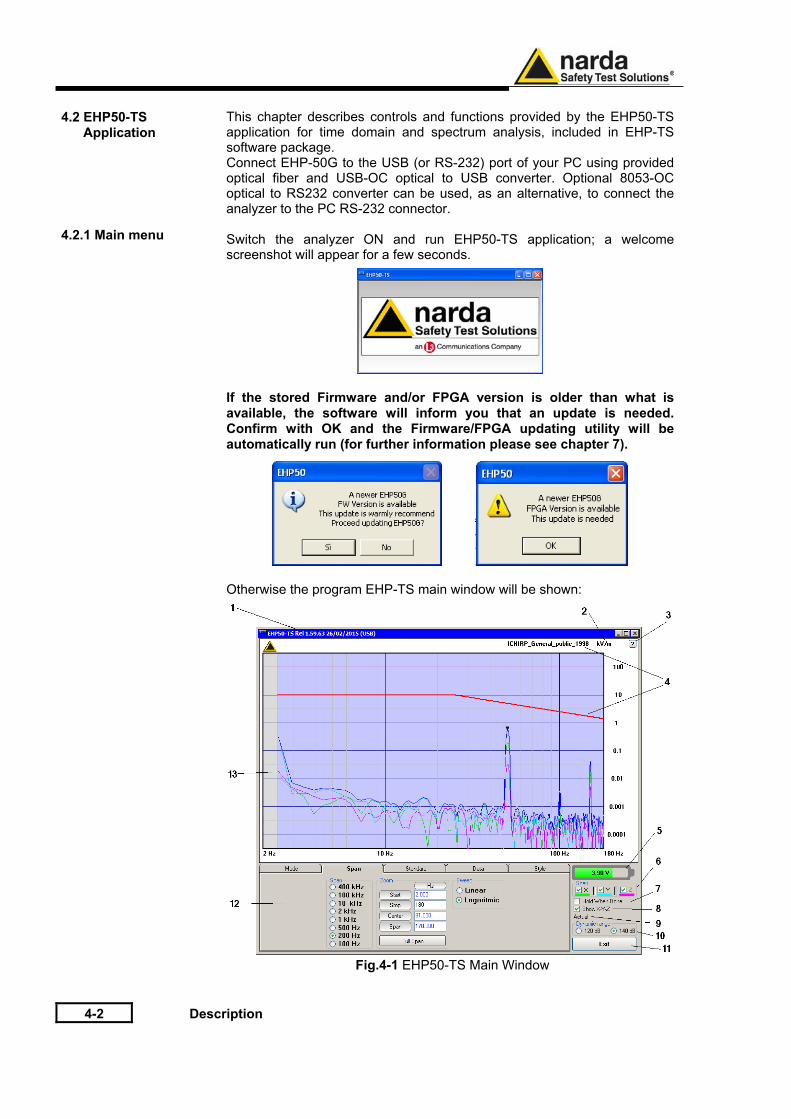
This chapter describes controls and functions provided by the EHP50-TS application for time domain and spectrum analysis, included in EHP-TS software package. Connect EHP-50G to the USB (or RS-232) port of your PC using provided optical fiber and USB-OC optical to USB converter. Optional 8053-OC optical to RS232 converter can be used, as an alternative, to connect the analyzer to the PC RS-232 connector. Switch the analyzer ON and run EHP50-TS application; a welcome screenshot will appear for a few seconds.
If the stored Firmware and/or FPGA version is older than what is available, the software will inform you that an update is needed. Confirm with OK and the Firmware/FPGA updating utility will be automatically run (for further information please see chapter 7).
Otherwise the program EHP-TS main window will be shown:
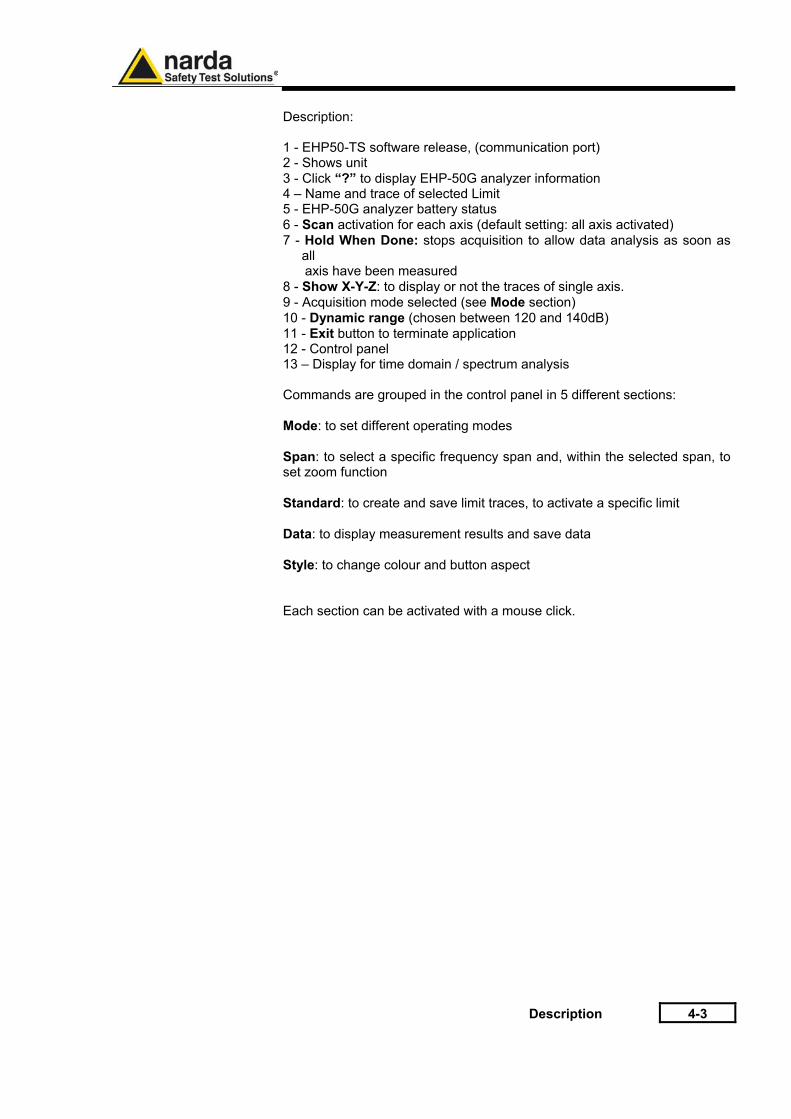
Fig.4-1 EHP50-TS Main Window
Description 4-3
Description: 1 - EHP50-TS software release, (communication port) 2 - Shows unit 3 - Click “?” to display EHP-50G analyzer information 4 – Name and trace of selected Limit 5 - EHP-50G analyzer battery status 6 - Scan activation for each axis (default setting: all axis activated) 7 - Hold When Done: stops acquisition to allow data analysis as soon as
all axis have been measured 8 - Show X-Y-Z: to display or not the traces of single axis. 9 - Acquisition mode selected (see Mode section) 10 - Dynamic range (chosen between 120 and 140dB) 11 - Exit button to terminate application 12 - Control panel 13 – Display for time domain / spectrum analysis Commands are grouped in the control panel in 5 different sections: Mode: to set different operating modes Span: to select a specific frequency span and, within the selected span, to set zoom function Standard: to create and save limit traces, to activate a specific limit Data: to display measurement results and save data Style: to change colour and button aspect Each section can be activated with a mouse click.
4-4 Description
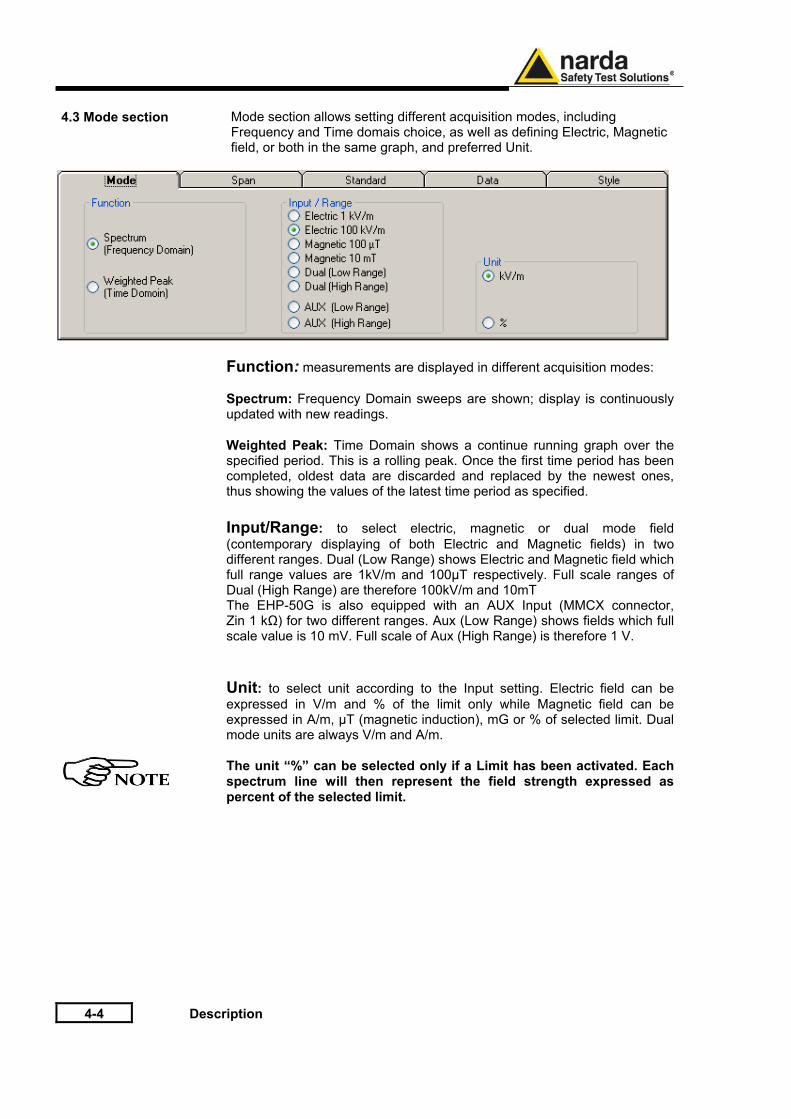
4.3 Mode section
Mode section allows setting different acquisition modes, including Frequency and Time domais choice, as well as defining Electric, Magnetic field, or both in the same graph, and preferred Unit.
Function: measurements are displayed in different acquisition modes: Spectrum: Frequency Domain sweeps are shown; display is continuously updated with new readings. Weighted Peak: Time Domain shows a continue running graph over the specified period. This is a rolling peak. Once the first time period has been completed, oldest data are discarded and replaced by the newest ones, thus showing the values of the latest time period as specified. Input/Range: to select electric, magnetic or dual mode field (contemporary displaying of both Electric and Magnetic fields) in two different ranges. Dual (Low Range) shows Electric and Magnetic field which full range values are 1kV/m and 100μT respectively. Full scale ranges of Dual (High Range) are therefore 100kV/m and 10mT The EHP-50G is also equipped with an AUX Input (MMCX connector, Zin 1 kΩ) for two different ranges. Aux (Low Range) shows fields which full scale value is 10 mV. Full scale of Aux (High Range) is therefore 1 V. Unit: to select unit according to the Input setting. Electric field can be expressed in V/m and % of the limit only while Magnetic field can be expressed in A/m, μT (magnetic induction), mG or % of selected limit. Dual mode units are always V/m and A/m. The unit “%” can be selected only if a Limit has been activated. Each spectrum line will then represent the field strength expressed as percent of the selected limit.
Description 4-5
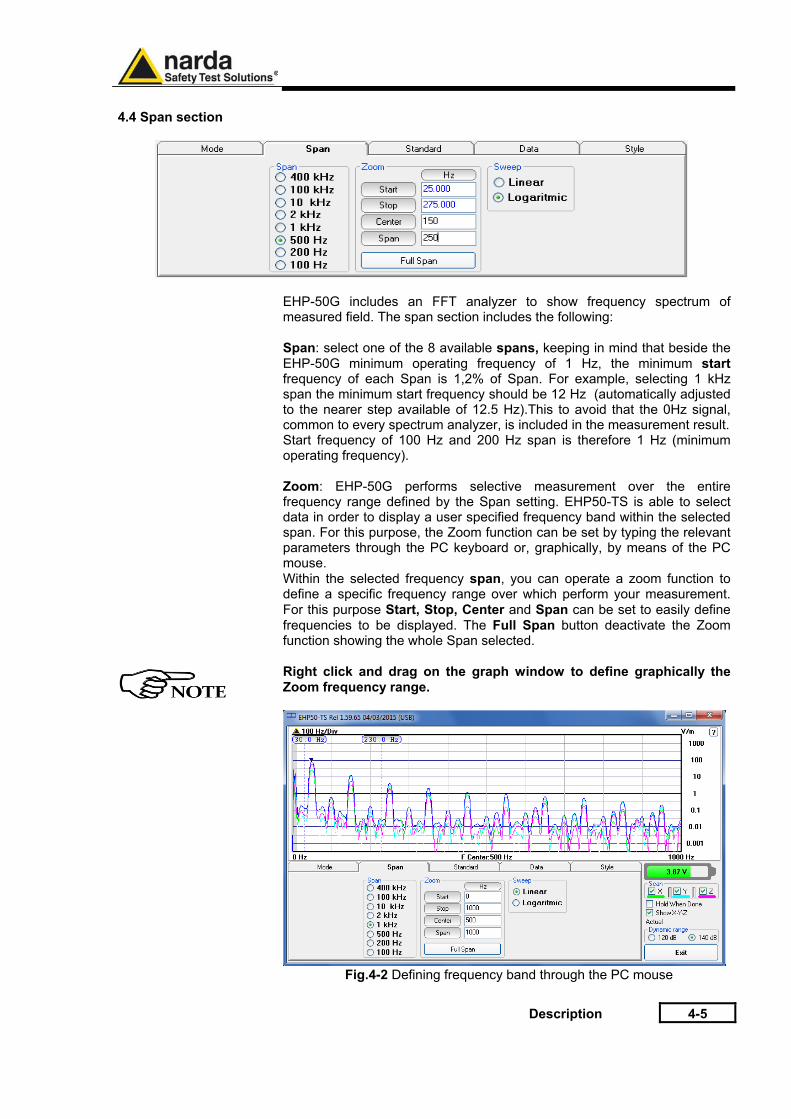
4.4 Span section
EHP-50G includes an FFT analyzer to show frequency spectrum of measured field. The span section includes the following: Span: select one of the 8 available spans, keeping in mind that beside the EHP-50G minimum operating frequency of 1 Hz, the minimum start frequency of each Span is 1,2% of Span. For example, selecting 1 kHz span the minimum start frequency should be 12 Hz (automatically adjusted to the nearer step available of 12.5 Hz).This to avoid that the 0Hz signal, common to every spectrum analyzer, is included in the measurement result.Start frequency of 100 Hz and 200 Hz span is therefore 1 Hz (minimum operating frequency). Zoom: EHP-50G performs selective measurement over the entire frequency range defined by the Span setting. EHP50-TS is able to select data in order to display a user specified frequency band within the selected span. For this purpose, the Zoom function can be set by typing the relevant parameters through the PC keyboard or, graphically, by means of the PC mouse. Within the selected frequency span, you can operate a zoom function to define a specific frequency range over which perform your measurement. For this purpose Start, Stop, Center and Span can be set to easily define frequencies to be displayed. The Full Span button deactivate the Zoom function showing the whole Span selected. Right click and drag on the graph window to define graphically the Zoom frequency range.
Fig.4-2 Defining frequency band through the PC mouse
4-6 Description
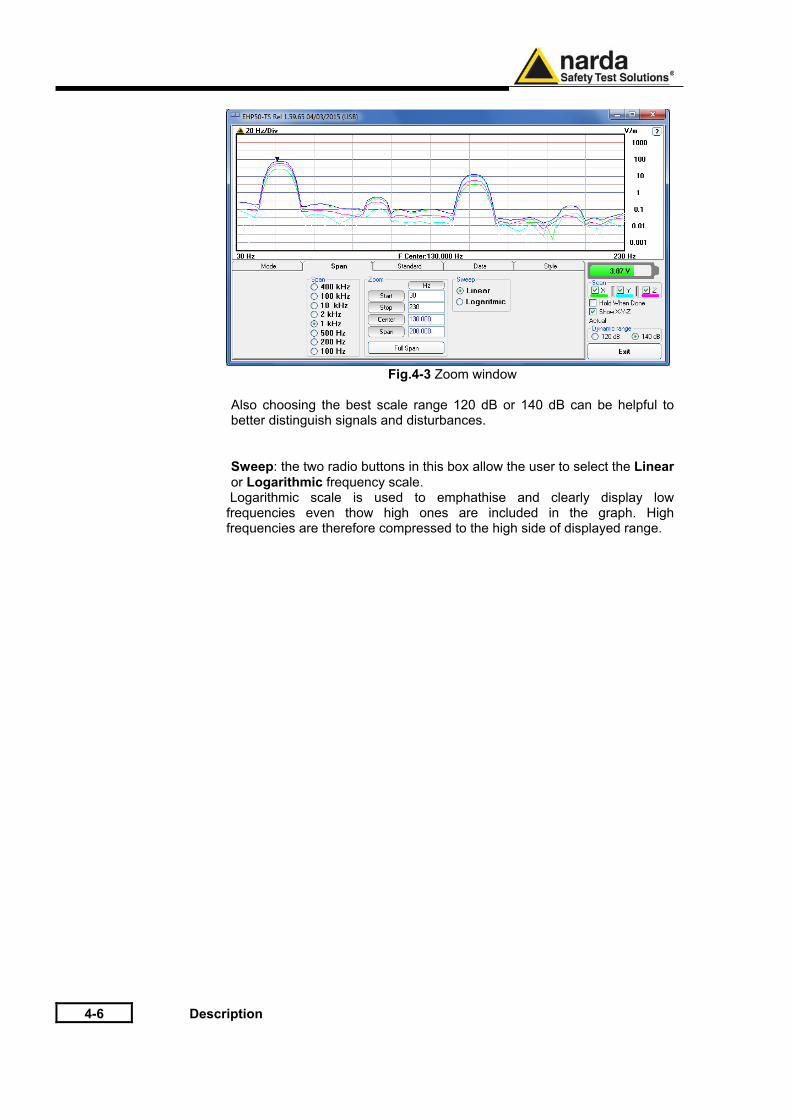
Fig.4-3 Zoom window
Also choosing the best scale range 120 dB or 140 dB can be helpful to better distinguish signals and disturbances. Sweep: the two radio buttons in this box allow the user to select the Linear or Logarithmic frequency scale.
Logarithmic scale is used to emphathise and clearly display low frequencies even thow high ones are included in the graph. High frequencies are therefore compressed to the high side of displayed range.
Description 4-7
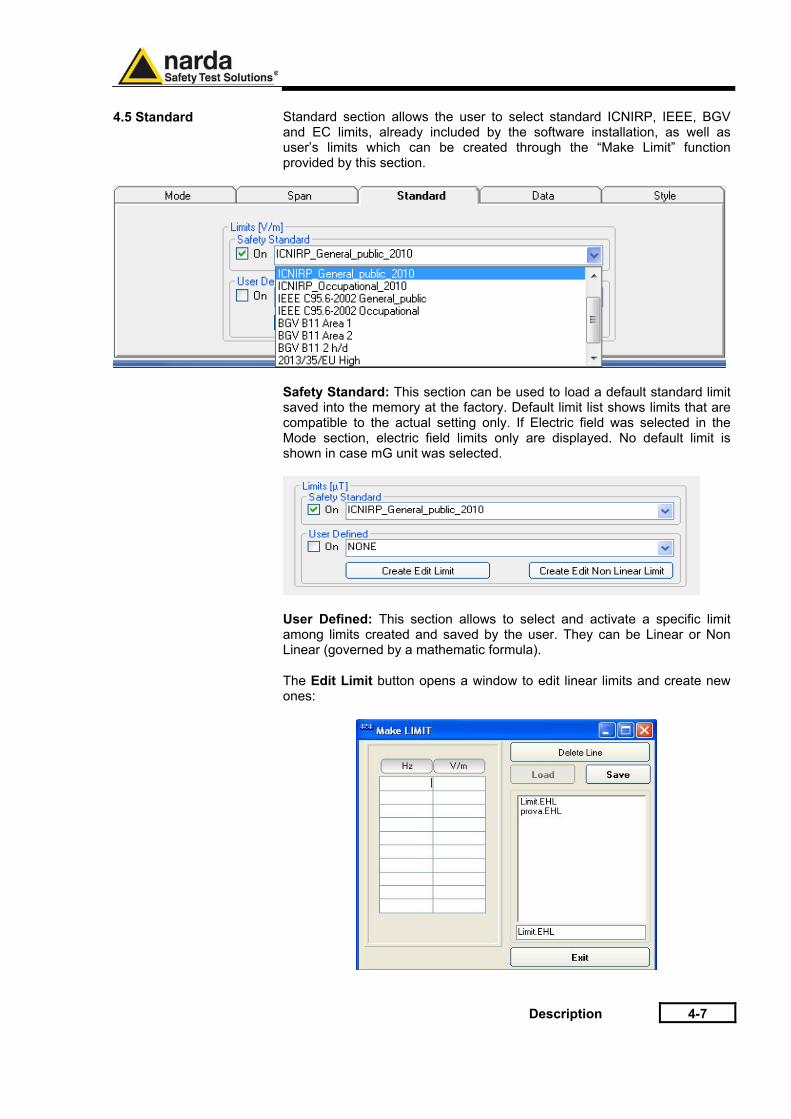
4.5 Standard
Standard section allows the user to select standard ICNIRP, IEEE, BGV and EC limits, already included by the software installation, as well as user’s limits which can be created through the “Make Limit” function provided by this section.
Safety Standard: This section can be used to load a default standard limit saved into the memory at the factory. Default limit list shows limits that are compatible to the actual setting only. If Electric field was selected in the Mode section, electric field limits only are displayed. No default limit is shown in case mG unit was selected.
User Defined: This section allows to select and activate a specific limit among limits created and saved by the user. They can be Linear or Non Linear (governed by a mathematic formula). The Edit Limit button opens a window to edit linear limits and create new ones:
4-8 Description
Type frequency and field strength for each point of the required limit and
click save to save it under the program directory. The limit file will be created as a linear interpolation between specified points.
When the ICNIRP or IEEE limit is selected, the software automatically calculates the corresponding total integration of the measured signals, and compares the result with the threshold set by the standard, considering whether it is or is not exceeded.
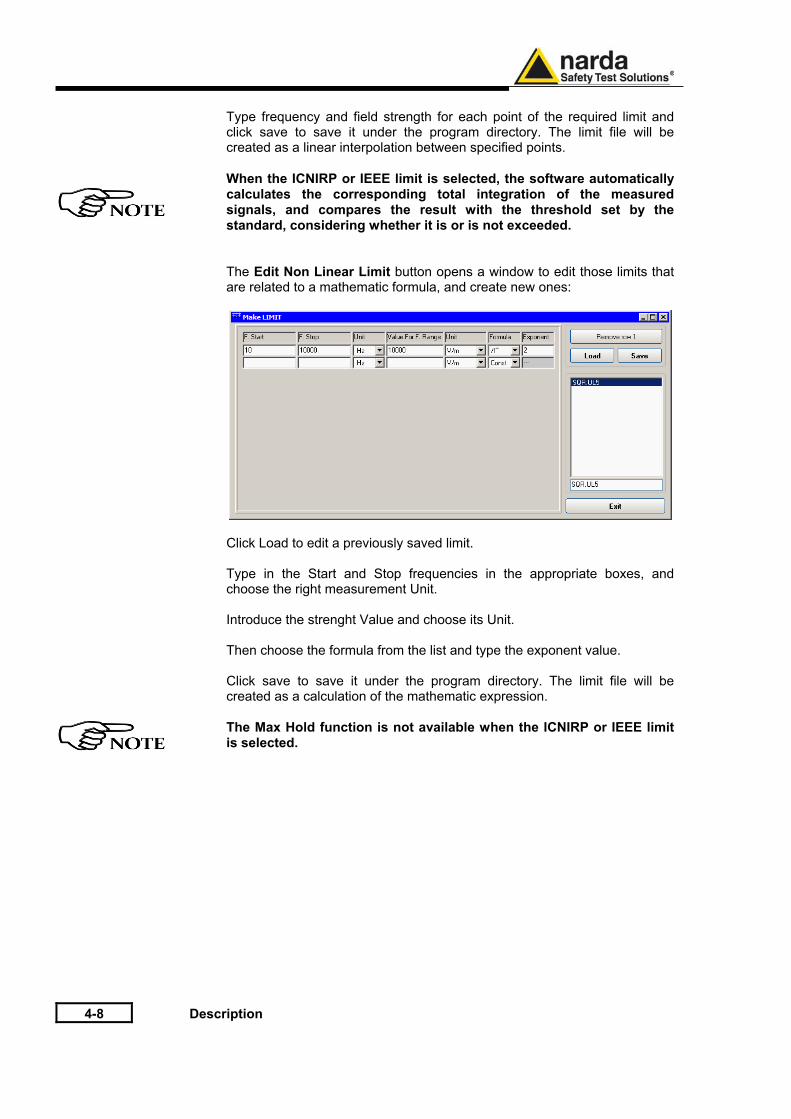
The Edit Non Linear Limit button opens a window to edit those limits that are related to a mathematic formula, and create new ones:
Click Load to edit a previously saved limit. Type in the Start and Stop frequencies in the appropriate boxes, and choose the right measurement Unit. Introduce the strenght Value and choose its Unit. Then choose the formula from the list and type the exponent value. Click save to save it under the program directory. The limit file will be created as a calculation of the mathematic expression.
The Max Hold function is not available when the ICNIRP or IEEE limit is selected.
Description 4-9
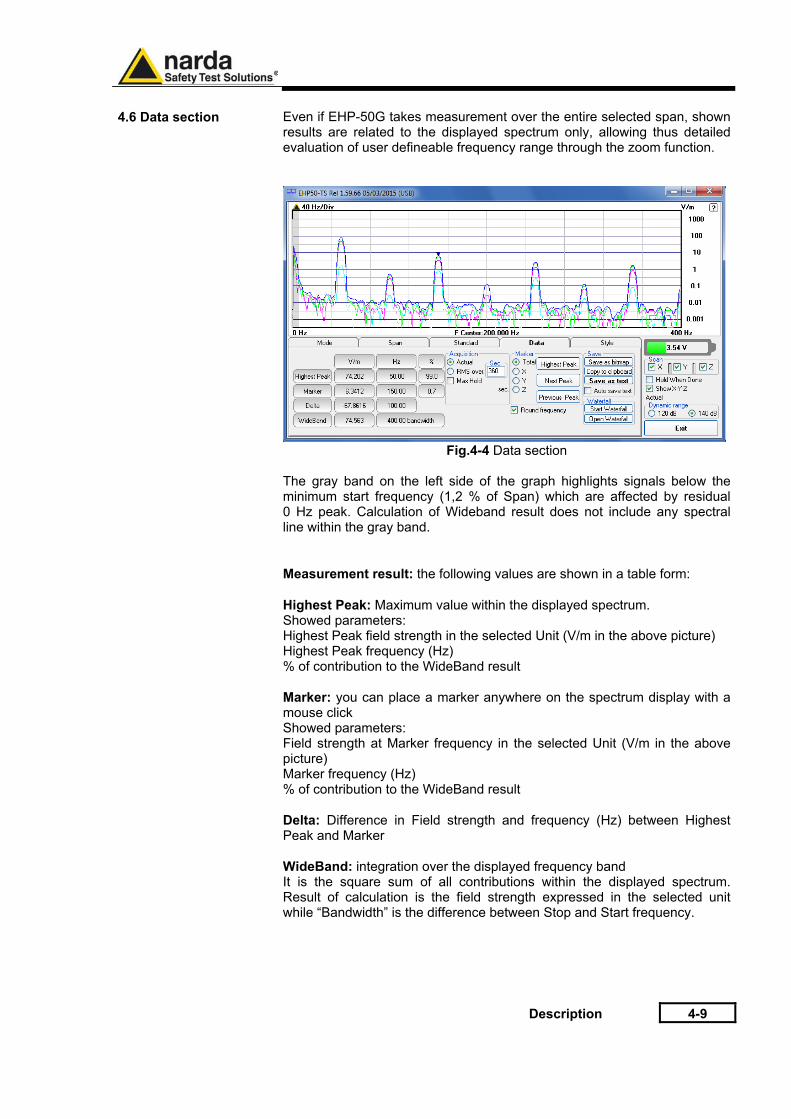
4.6 Data section Even if EHP-50G takes measurement over the entire selected span, shown
results are related to the displayed spectrum only, allowing thus detailed evaluation of user defineable frequency range through the zoom function.
Fig.4-4 Data section
The gray band on the left side of the graph highlights signals below the minimum start frequency (1,2 % of Span) which are affected by residual 0 Hz peak. Calculation of Wideband result does not include any spectral line within the gray band. Measurement result: the following values are shown in a table form: Highest Peak: Maximum value within the displayed spectrum. Showed parameters: Highest Peak field strength in the selected Unit (V/m in the above picture) Highest Peak frequency (Hz) % of contribution to the WideBand result Marker: you can place a marker anywhere on the spectrum display with a mouse click Showed parameters: Field strength at Marker frequency in the selected Unit (V/m in the above picture) Marker frequency (Hz) % of contribution to the WideBand result Delta: Difference in Field strength and frequency (Hz) between Highest Peak and Marker WideBand: integration over the displayed frequency band It is the square sum of all contributions within the displayed spectrum. Result of calculation is the field strength expressed in the selected unit while “Bandwidth” is the difference between Stop and Start frequency.
4-10 Description
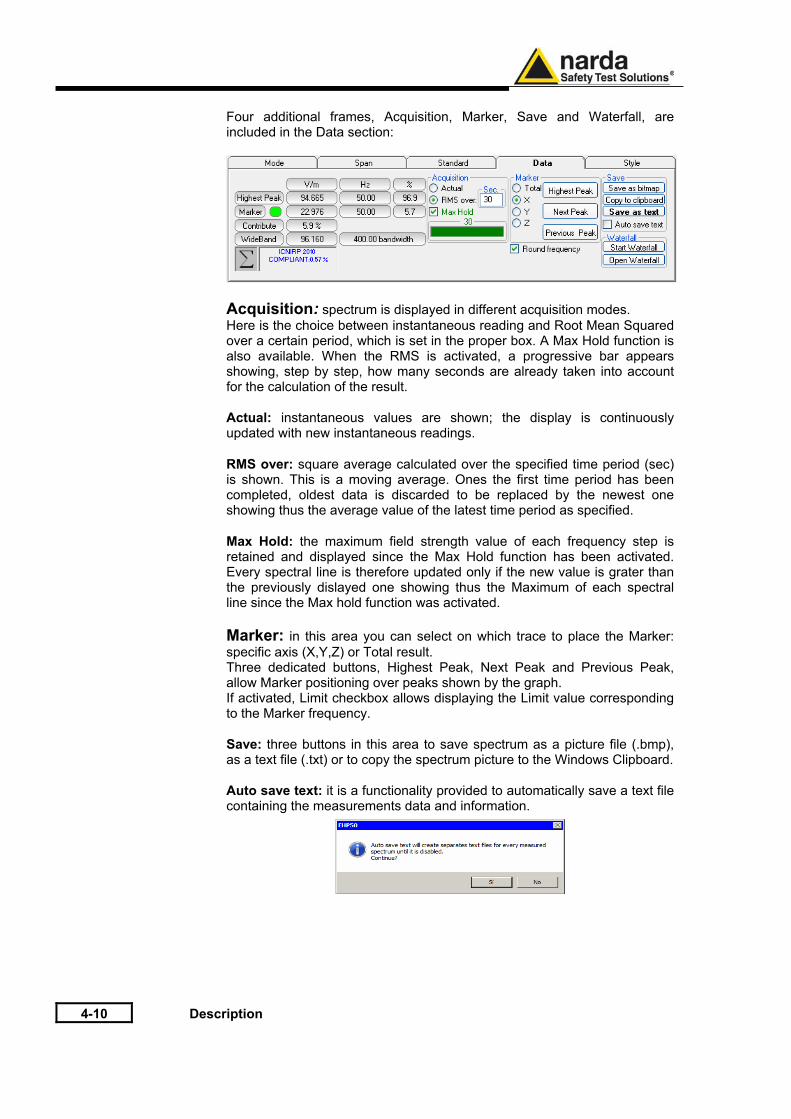
Four additional frames, Acquisition, Marker, Save and Waterfall, are
included in the Data section:
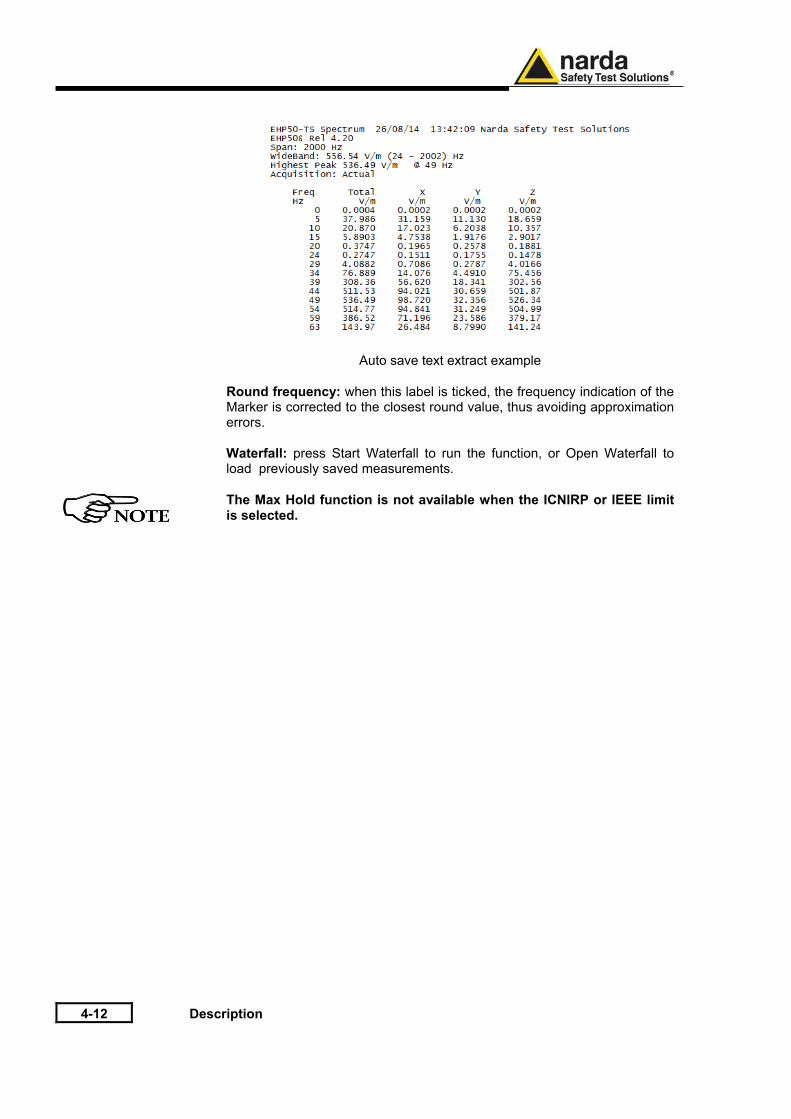
Acquisition: spectrum is displayed in different acquisition modes. Here is the choice between instantaneous reading and Root Mean Squared over a certain period, which is set in the proper box. A Max Hold function is also available. When the RMS is activated, a progressive bar appears showing, step by step, how many seconds are already taken into account for the calculation of the result. Actual: instantaneous values are shown; the display is continuously updated with new instantaneous readings. RMS over: square average calculated over the specified time period (sec) is shown. This is a moving average. Ones the first time period has been completed, oldest data is discarded to be replaced by the newest one showing thus the average value of the latest time period as specified. Max Hold: the maximum field strength value of each frequency step is retained and displayed since the Max Hold function has been activated. Every spectral line is therefore updated only if the new value is grater than the previously dislayed one showing thus the Maximum of each spectral line since the Max hold function was activated. Marker: in this area you can select on which trace to place the Marker: specific axis (X,Y,Z) or Total result. Three dedicated buttons, Highest Peak, Next Peak and Previous Peak, allow Marker positioning over peaks shown by the graph. If activated, Limit checkbox allows displaying the Limit value corresponding to the Marker frequency. Save: three buttons in this area to save spectrum as a picture file (.bmp), as a text file (.txt) or to copy the spectrum picture to the Windows Clipboard. Auto save text: it is a functionality provided to automatically save a text file containing the measurements data and information.
Description 4-11
It is also possible to insert a comment.
The user can select the path where the files will be stored.
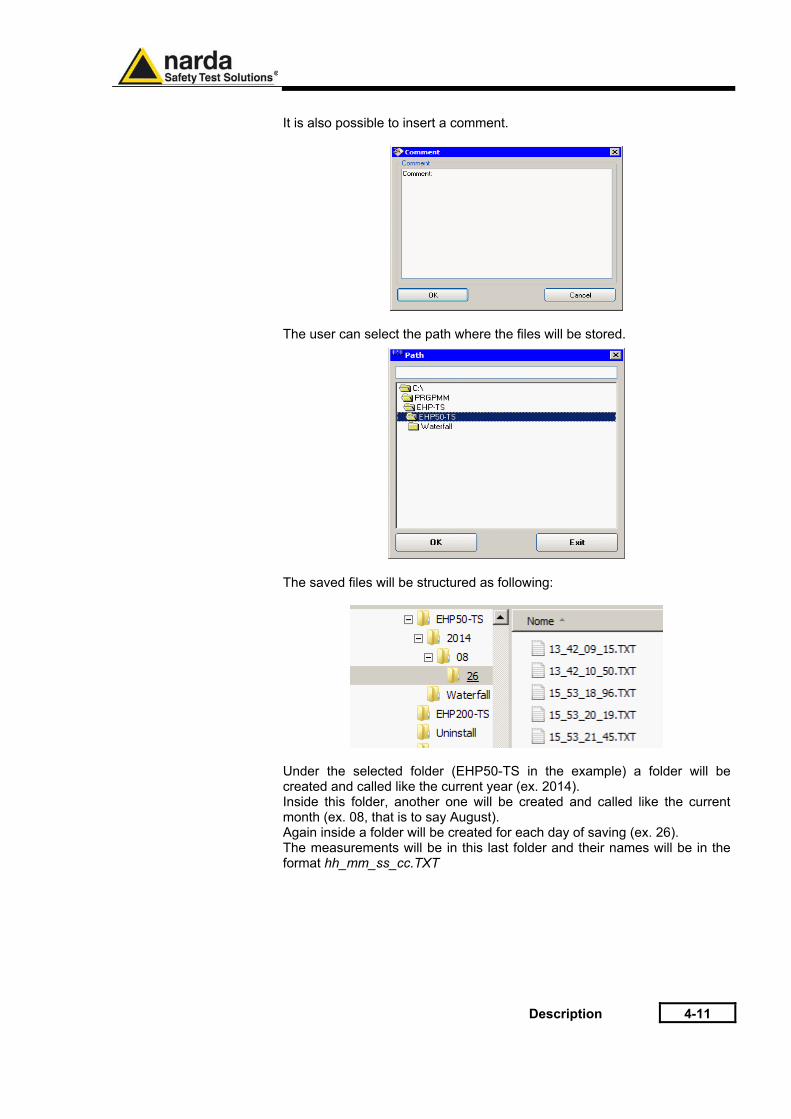
The saved files will be structured as following:
Under the selected folder (EHP50-TS in the example) a folder will be created and called like the current year (ex. 2014). Inside this folder, another one will be created and called like the current month (ex. 08, that is to say August). Again inside a folder will be created for each day of saving (ex. 26). The measurements will be in this last folder and their names will be in the format hh_mm_ss_cc.TXT
4-12 Description
Auto save text extract example Round frequency: when this label is ticked, the frequency indication of the Marker is corrected to the closest round value, thus avoiding approximation errors. Waterfall: press Start Waterfall to run the function, or Open Waterfall to load previously saved measurements.
The Max Hold function is not available when the ICNIRP or IEEE limit is selected.
Description 4-13
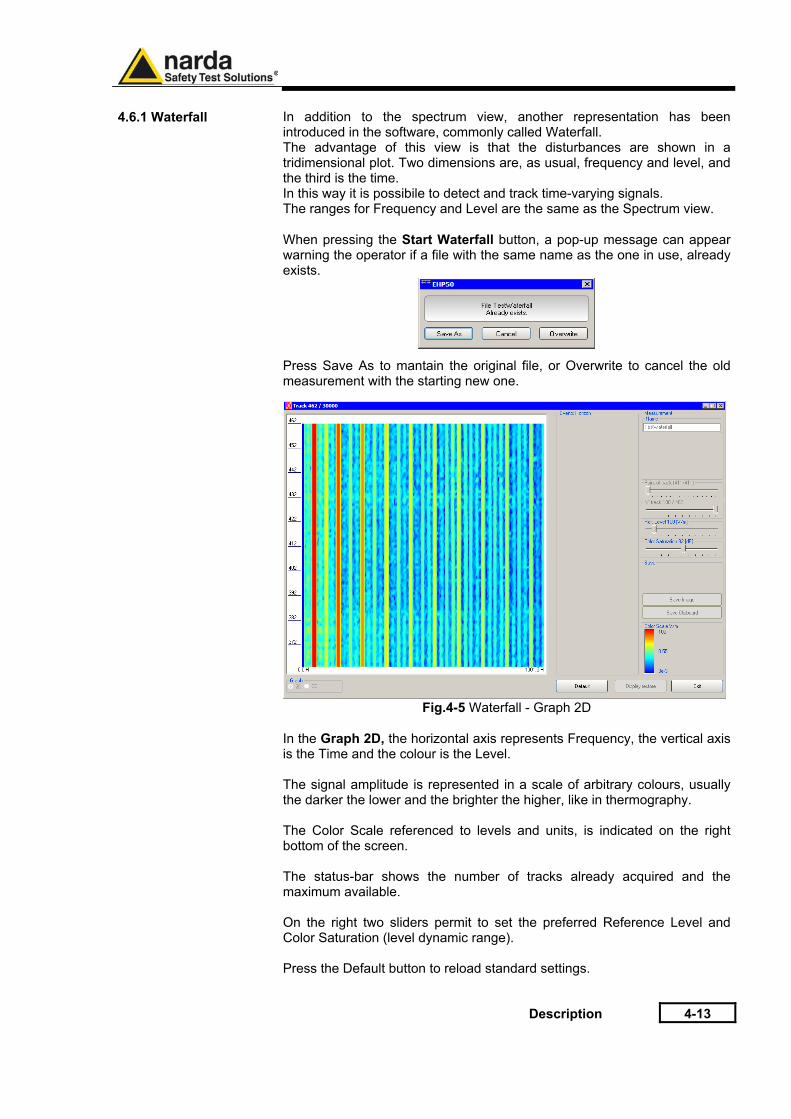
4.6.1 Waterfall In addition to the spectrum view, another representation has been
introduced in the software, commonly called Waterfall. The advantage of this view is that the disturbances are shown in a tridimensional plot. Two dimensions are, as usual, frequency and level, and the third is the time. In this way it is possibile to detect and track time-varying signals. The ranges for Frequency and Level are the same as the Spectrum view.
When pressing the Start Waterfall button, a pop-up message can appear warning the operator if a file with the same name as the one in use, already exists.
Press Save As to mantain the original file, or Overwrite to cancel the old measurement with the starting new one.
Fig.4-5 Waterfall - Graph 2D
In the Graph 2D, the horizontal axis represents Frequency, the vertical axis is the Time and the colour is the Level. The signal amplitude is represented in a scale of arbitrary colours, usually the darker the lower and the brighter the higher, like in thermography. The Color Scale referenced to levels and units, is indicated on the right bottom of the screen. The status-bar shows the number of tracks already acquired and the maximum available. On the right two sliders permit to set the preferred Reference Level and Color Saturation (level dynamic range). Press the Default button to reload standard settings.
4-14 Description
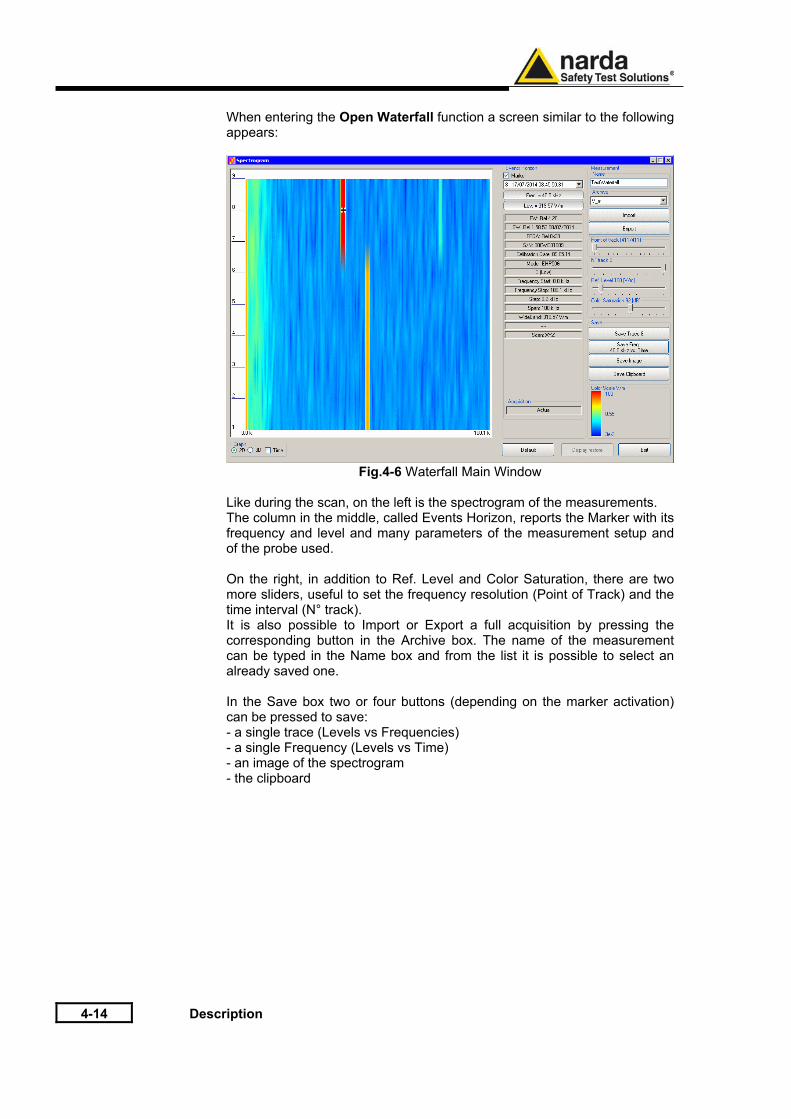
When entering the Open Waterfall function a screen similar to the following
appears:
Fig.4-6 Waterfall Main Window Like during the scan, on the left is the spectrogram of the measurements. The column in the middle, called Events Horizon, reports the Marker with its frequency and level and many parameters of the measurement setup and of the probe used. On the right, in addition to Ref. Level and Color Saturation, there are two more sliders, useful to set the frequency resolution (Point of Track) and the time interval (N° track). It is also possible to Import or Export a full acquisition by pressing the corresponding button in the Archive box. The name of the measurement can be typed in the Name box and from the list it is possible to select an already saved one. In the Save box two or four buttons (depending on the marker activation) can be pressed to save: - a single trace (Levels vs Frequencies) - a single Frequency (Levels vs Time) - an image of the spectrogram - the clipboard
Description 4-15
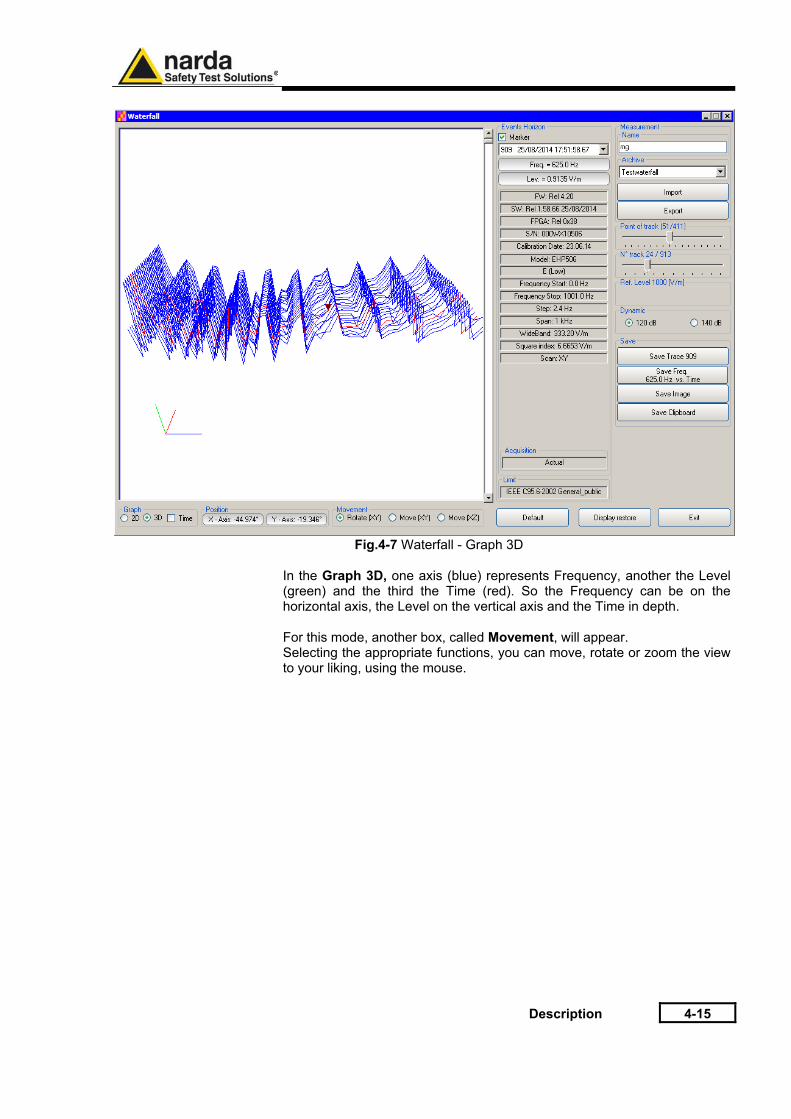
Fig.4-7 Waterfall - Graph 3D
In the Graph 3D, one axis (blue) represents Frequency, another the Level (green) and the third the Time (red). So the Frequency can be on the horizontal axis, the Level on the vertical axis and the Time in depth. For this mode, another box, called Movement, will appear. Selecting the appropriate functions, you can move, rotate or zoom the view to your liking, using the mouse.
4-16 Description
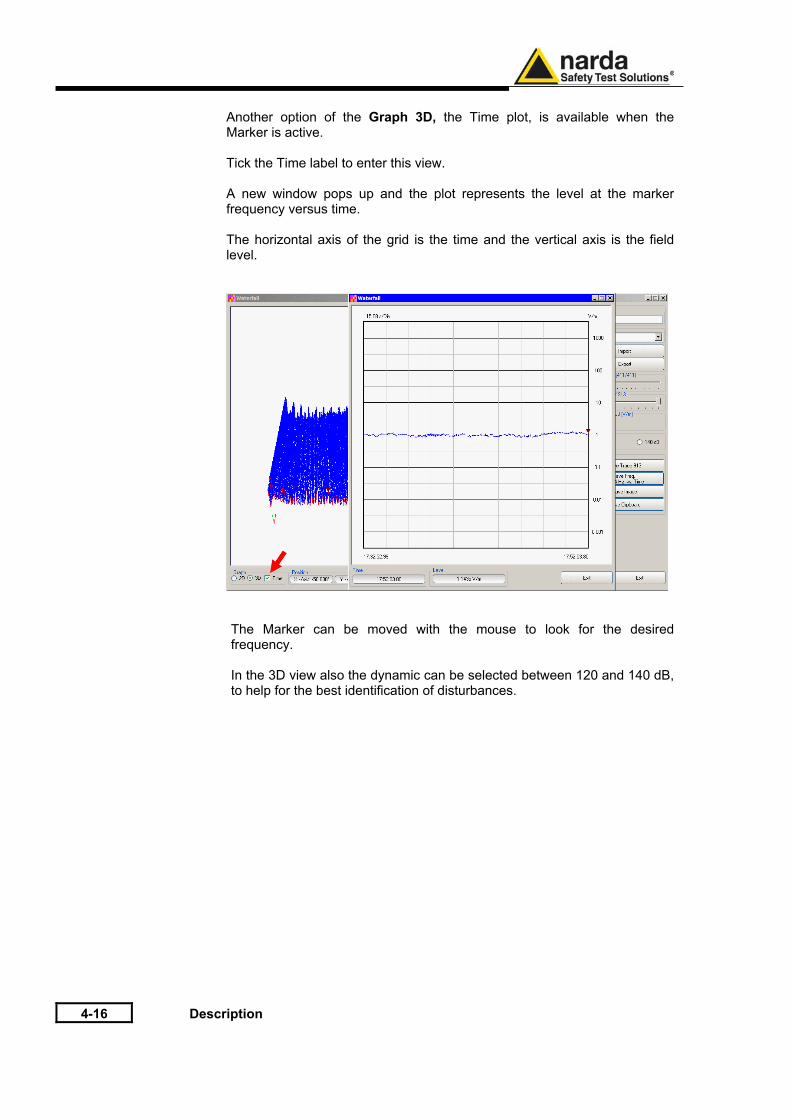
Another option of the Graph 3D, the Time plot, is available when the
Marker is active. Tick the Time label to enter this view. A new window pops up and the plot represents the level at the marker frequency versus time. The horizontal axis of the grid is the time and the vertical axis is the field level.
The Marker can be moved with the mouse to look for the desired frequency. In the 3D view also the dynamic can be selected between 120 and 140 dB, to help for the best identification of disturbances.
Description 4-17
4.6.1.1 Data recording The subsequent spectra are automatically recorded and saved in a single
file *.WF5 localized in the folder Waterfall in the program root, inclusive of all the analyzer settings. The stored files can be recalled when in Data mode or at startup entering the Open Waterfall window. The filename is set by the operator prior to starting the test and it is indicated at the upper right corner of the Waterfall window. The maximum number of spectra that can be recorded is of 30.000 and it is indicated, togheter with the current track number, in the status bar of the Waterfall window.
4-18 Description
4.7 Style section
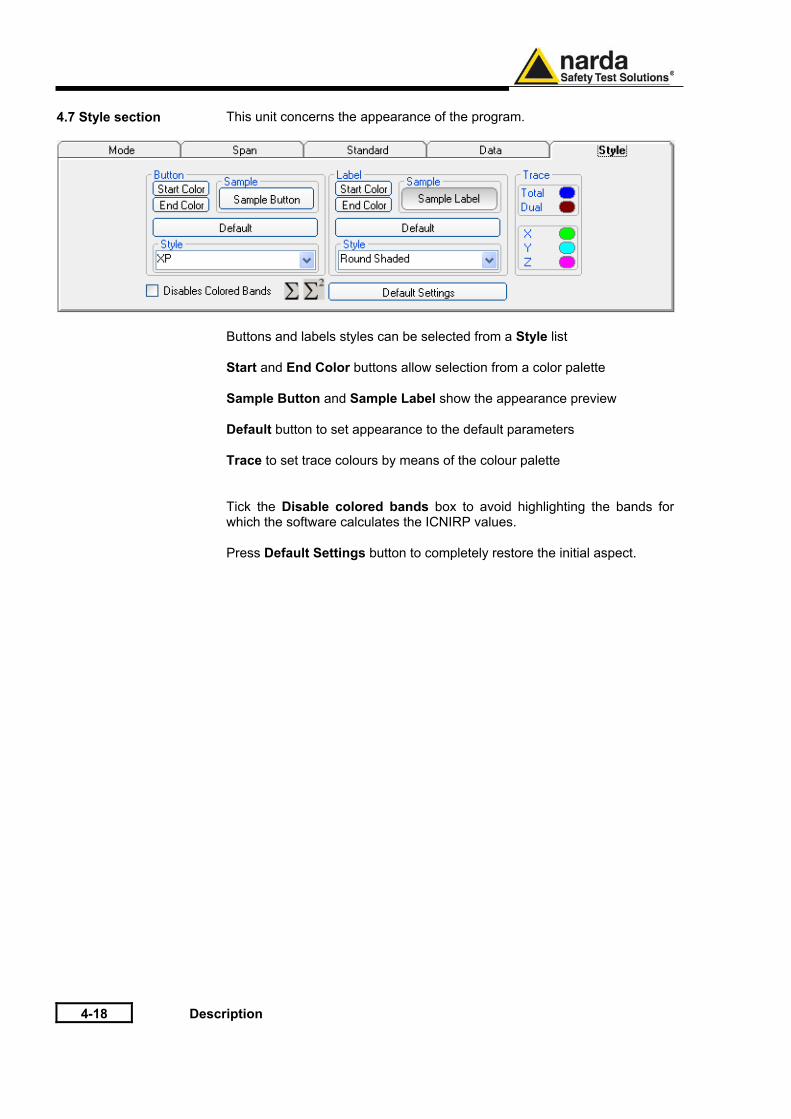
This unit concerns the appearance of the program.
Buttons and labels styles can be selected from a Style list Start and End Color buttons allow selection from a color palette Sample Button and Sample Label show the appearance preview Default button to set appearance to the default parameters Trace to set trace colours by means of the colour palette Tick the Disable colored bands box to avoid highlighting the bands for which the software calculates the ICNIRP values. Press Default Settings button to completely restore the initial aspect.
Description 4-19
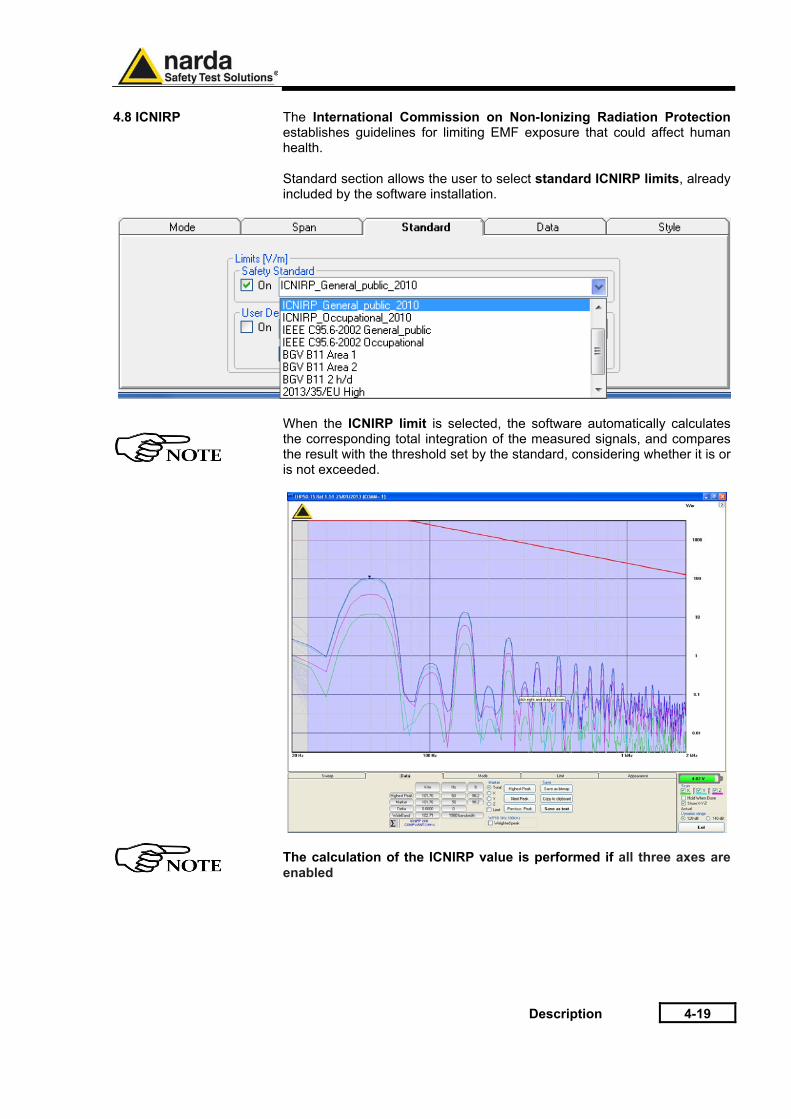
4.8 ICNIRP
The International Commission on Non-Ionizing Radiation Protection establishes guidelines for limiting EMF exposure that could affect human health. Standard section allows the user to select standard ICNIRP limits, already included by the software installation.
When the ICNIRP limit is selected, the software automatically calculates the corresponding total integration of the measured signals, and compares the result with the threshold set by the standard, considering whether it is or is not exceeded.
The calculation of the ICNIRP value is performed if all three axes are enabled
4-20 Description
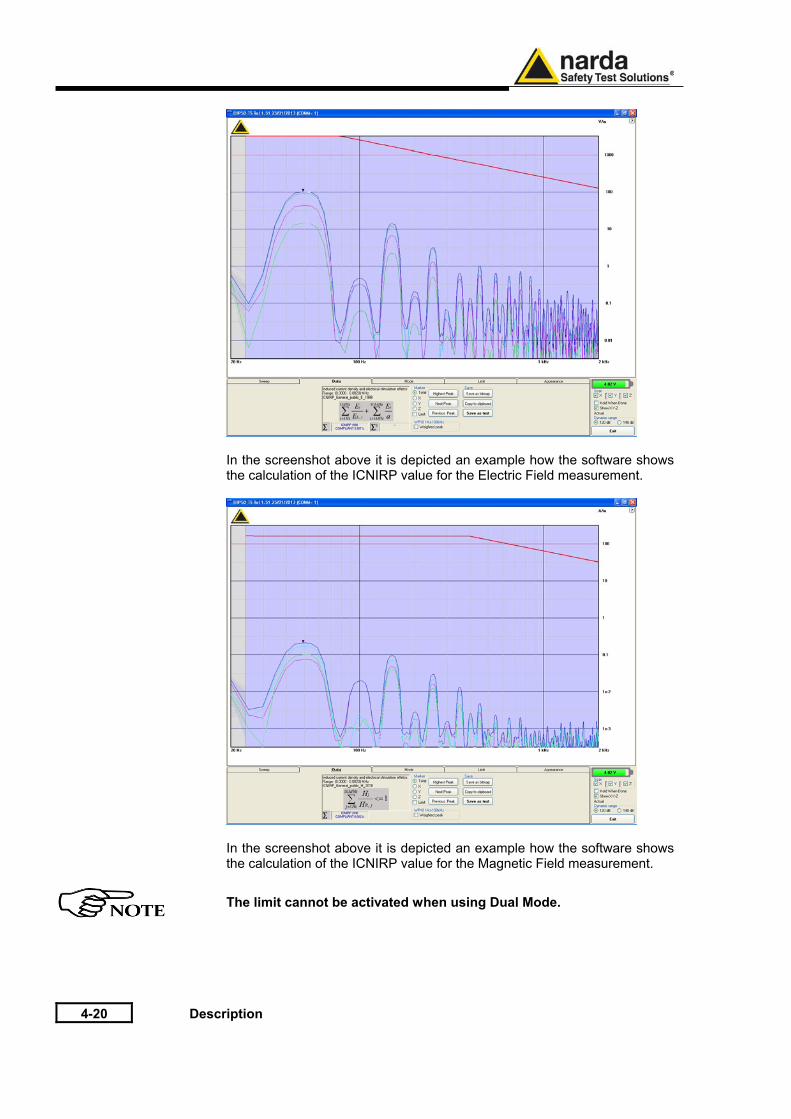
In the screenshot above it is depicted an example how the software shows the calculation of the ICNIRP value for the Electric Field measurement.
In the screenshot above it is depicted an example how the software shows the calculation of the ICNIRP value for the Magnetic Field measurement.
The limit cannot be activated when using Dual Mode.
Description 4-21
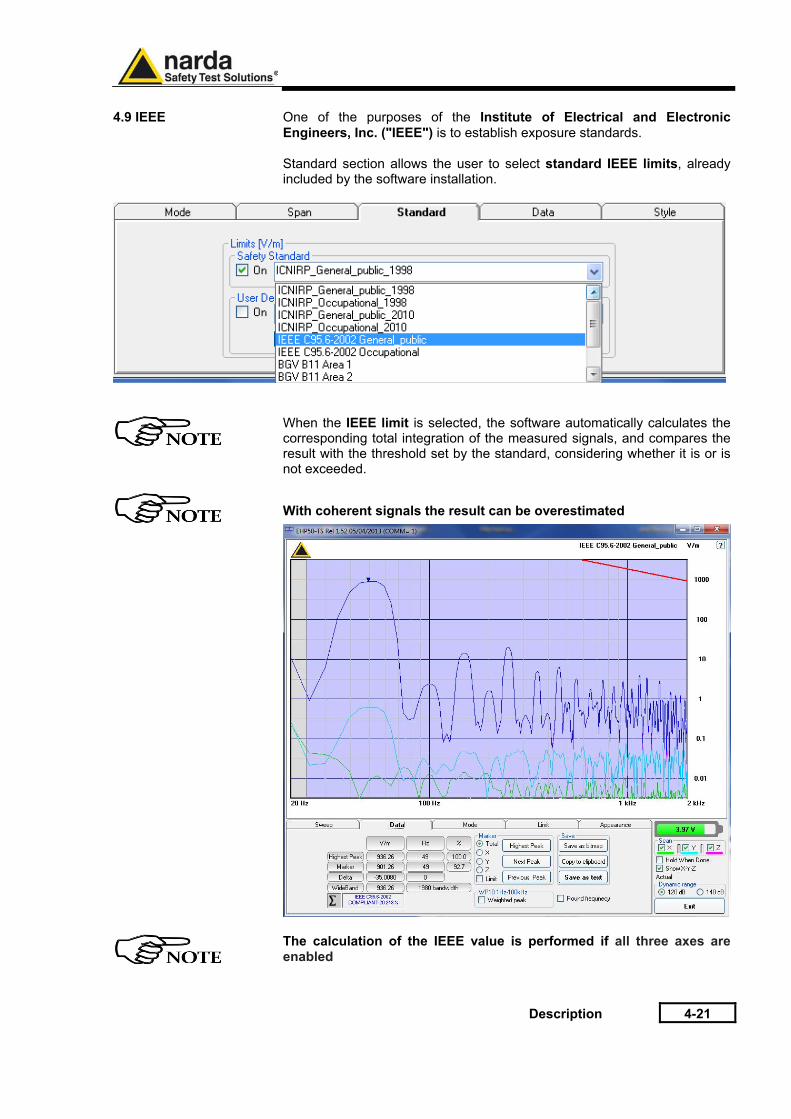
4.9 IEEE
One of the purposes of the Institute of Electrical and Electronic Engineers, Inc. ("IEEE") is to establish exposure standards. Standard section allows the user to select standard IEEE limits, already included by the software installation.
When the IEEE limit is selected, the software automatically calculates the corresponding total integration of the measured signals, and compares the result with the threshold set by the standard, considering whether it is or is not exceeded.
With coherent signals the result can be overestimated
The calculation of the IEEE value is performed if all three axes are enabled
4-22 Description
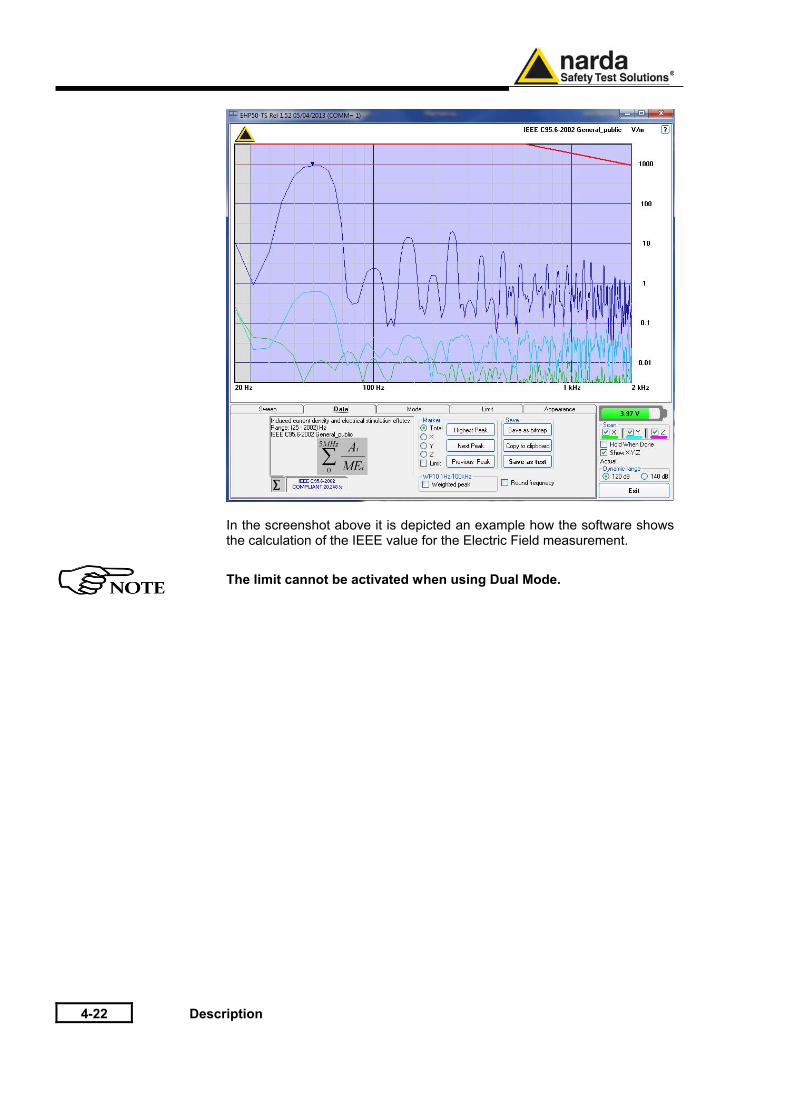
In the screenshot above it is depicted an example how the software shows the calculation of the IEEE value for the Electric Field measurement.
The limit cannot be activated when using Dual Mode.
Description 4-23
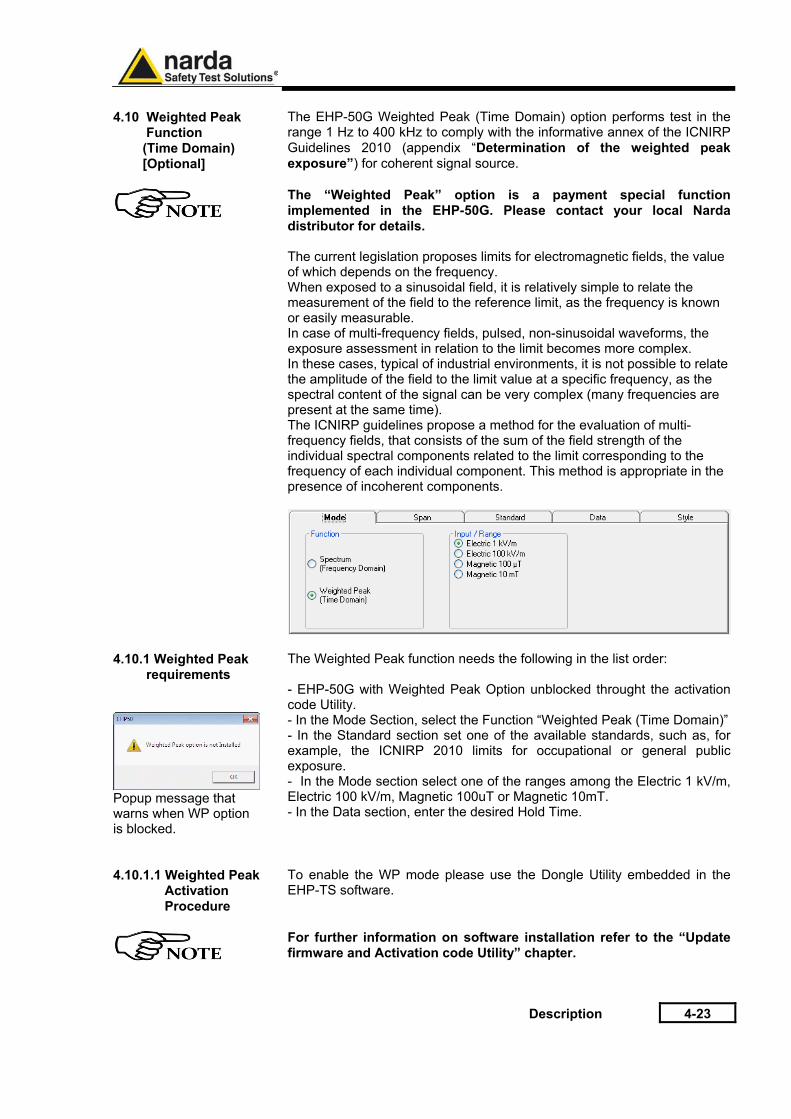
4.10 Weighted Peak Function (Time Domain) [Optional]
The EHP-50G Weighted Peak (Time Domain) option performs test in the range 1 Hz to 400 kHz to comply with the informative annex of the ICNIRP Guidelines 2010 (appendix “Determination of the weighted peak exposure”) for coherent signal source.
The “Weighted Peak” option is a payment special function implemented in the EHP-50G. Please contact your local Narda distributor for details.
The current legislation proposes limits for electromagnetic fields, the value of which depends on the frequency. When exposed to a sinusoidal field, it is relatively simple to relate the measurement of the field to the reference limit, as the frequency is known or easily measurable. In case of multi-frequency fields, pulsed, non-sinusoidal waveforms, the exposure assessment in relation to the limit becomes more complex. In these cases, typical of industrial environments, it is not possible to relate the amplitude of the field to the limit value at a specific frequency, as the spectral content of the signal can be very complex (many frequencies are present at the same time). The ICNIRP guidelines propose a method for the evaluation of multi-frequency fields, that consists of the sum of the field strength of the individual spectral components related to the limit corresponding to the frequency of each individual component. This method is appropriate in the presence of incoherent components.
4.10.1 Weighted Peak requirements
Popup message that warns when WP option is blocked.
The Weighted Peak function needs the following in the list order: - EHP-50G with Weighted Peak Option unblocked throught the activation code Utility. - In the Mode Section, select the Function “Weighted Peak (Time Domain)” - In the Standard section set one of the available standards, such as, for example, the ICNIRP 2010 limits for occupational or general public exposure. - In the Mode section select one of the ranges among the Electric 1 kV/m, Electric 100 kV/m, Magnetic 100uT or Magnetic 10mT. - In the Data section, enter the desired Hold Time.
4.10.1.1 Weighted Peak Activation Procedure
To enable the WP mode please use the Dongle Utility embedded in the EHP-TS software.
For further information on software installation refer to the “Update firmware and Activation code Utility” chapter.
4-24 Description
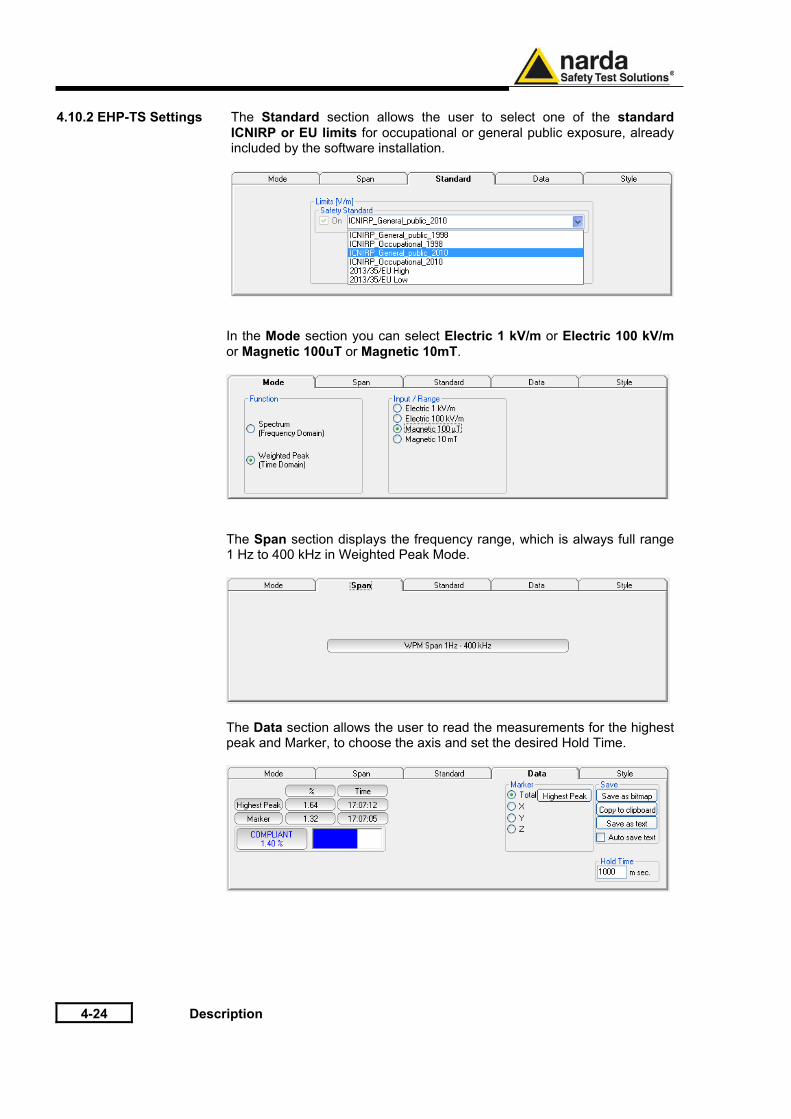
4.10.2 EHP-TS Settings The Standard section allows the user to select one of the standard
ICNIRP or EU limits for occupational or general public exposure, already included by the software installation.
In the Mode section you can select Electric 1 kV/m or Electric 100 kV/m
or Magnetic 100uT or Magnetic 10mT.
The Span section displays the frequency range, which is always full range 1 Hz to 400 kHz in Weighted Peak Mode.
The Data section allows the user to read the measurements for the highest
peak and Marker, to choose the axis and set the desired Hold Time.
Description 4-25
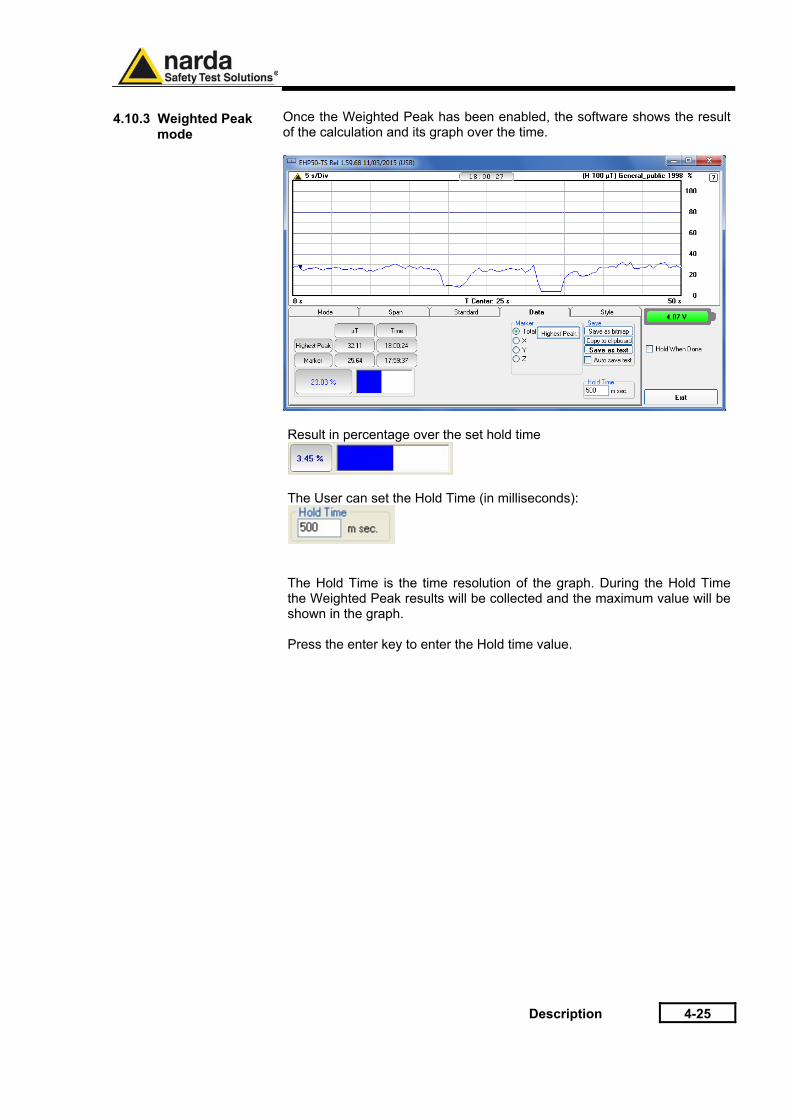
4.10.3 Weighted Peak mode
Once the Weighted Peak has been enabled, the software shows the result of the calculation and its graph over the time.
Result in percentage over the set hold time
The User can set the Hold Time (in milliseconds):
The Hold Time is the time resolution of the graph. During the Hold Time the Weighted Peak results will be collected and the maximum value will be shown in the graph. Press the enter key to enter the Hold time value.
4-26 Description
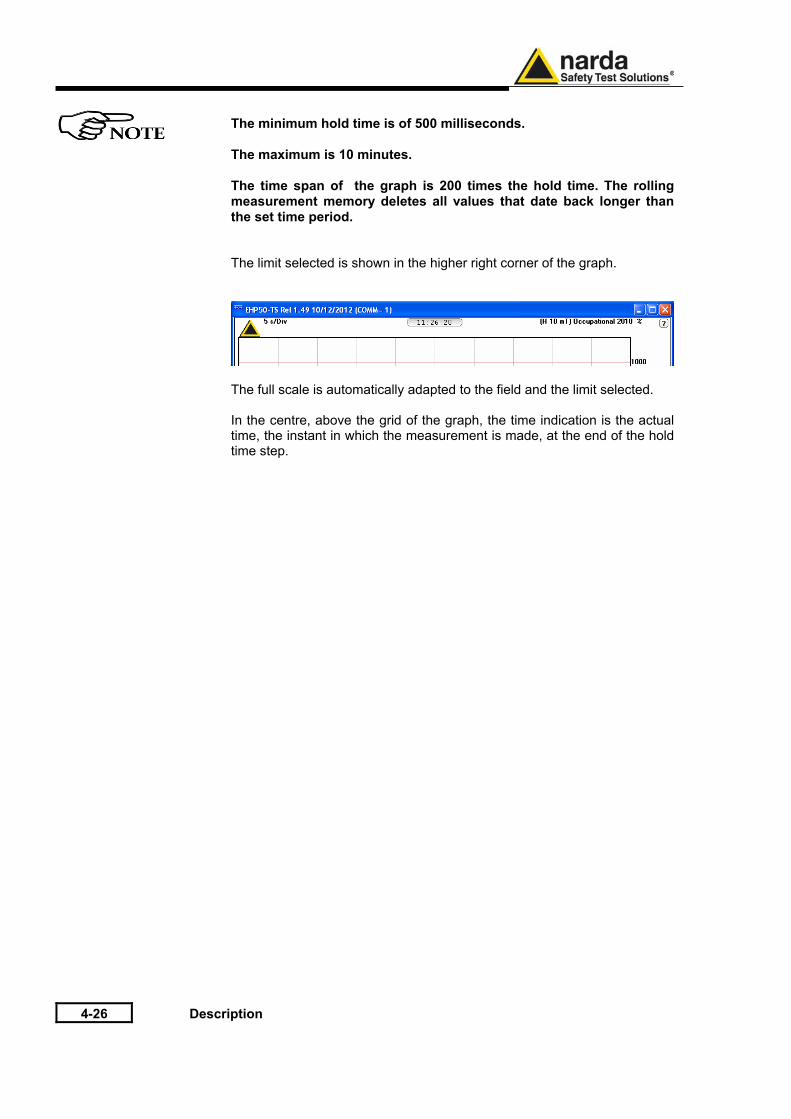
The minimum hold time is of 500 milliseconds. The maximum is 10 minutes. The time span of the graph is 200 times the hold time. The rolling measurement memory deletes all values that date back longer than the set time period.
The limit selected is shown in the higher right corner of the graph.
The full scale is automatically adapted to the field and the limit selected. In the centre, above the grid of the graph, the time indication is the actual time, the instant in which the measurement is made, at the end of the hold time step.
Description 4-27
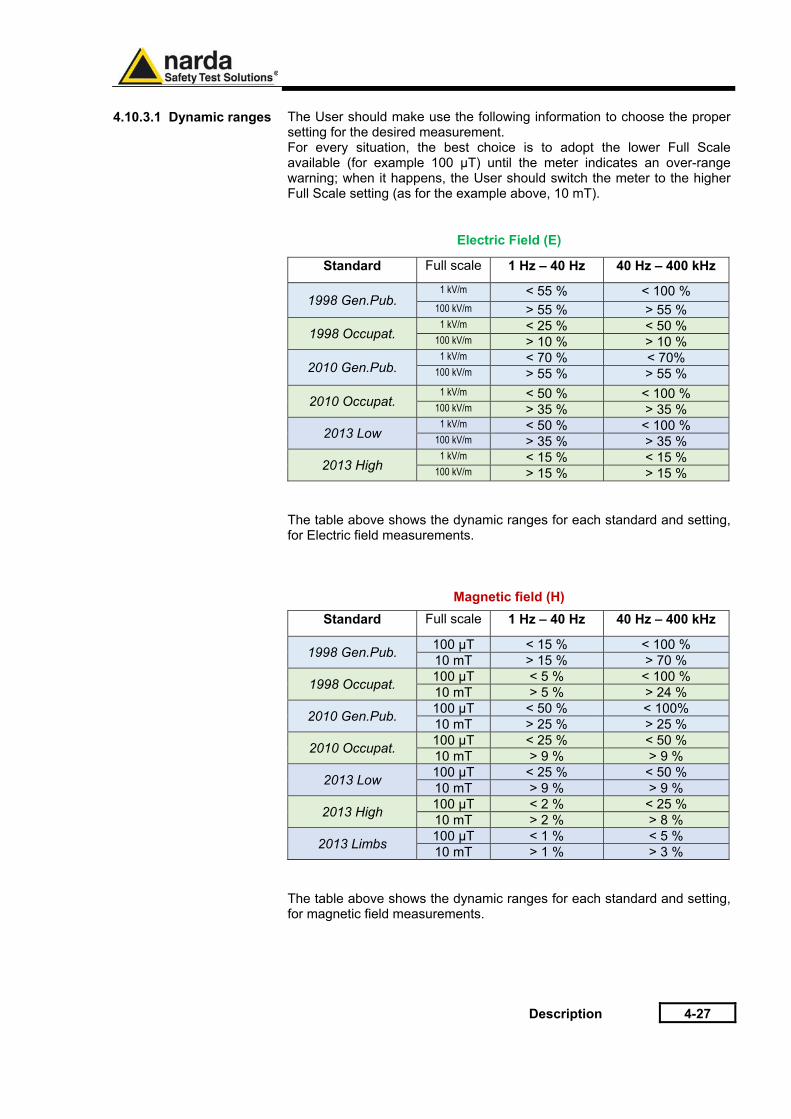
4.10.3.1 Dynamic ranges The User should make use the following information to choose the proper
setting for the desired measurement. For every situation, the best choice is to adopt the lower Full Scale available (for example 100 µT) until the meter indicates an over-range warning; when it happens, the User should switch the meter to the higher Full Scale setting (as for the example above, 10 mT).
Electric Field (E)
Standard Full scale 1 Hz – 40 Hz 40 Hz – 400 kHz
1998 Gen.Pub. 1 kV/m < 55 % < 100 %
100 kV/m > 55 % > 55 %
1998 Occupat. 1 kV/m < 25 % < 50 %
100 kV/m > 10 % > 10 %
2010 Gen.Pub. 1 kV/m < 70 % < 70%
100 kV/m > 55 % > 55 %
2010 Occupat. 1 kV/m < 50 % < 100 %
100 kV/m > 35 % > 35 %
2013 Low 1 kV/m < 50 % < 100 %
100 kV/m > 35 % > 35 %
2013 High 1 kV/m < 15 % < 15 %
100 kV/m > 15 % > 15 %
The table above shows the dynamic ranges for each standard and setting, for Electric field measurements.
Magnetic field (H)
Standard Full scale 1 Hz – 40 Hz 40 Hz – 400 kHz
1998 Gen.Pub. 100 µT < 15 % < 100 % 10 mT > 15 % > 70 %
1998 Occupat. 100 µT < 5 % < 100 % 10 mT > 5 % > 24 %
2010 Gen.Pub. 100 µT < 50 % < 100% 10 mT > 25 % > 25 %
2010 Occupat. 100 µT < 25 % < 50 % 10 mT > 9 % > 9 %
2013 Low 100 µT < 25 % < 50 % 10 mT > 9 % > 9 %
2013 High 100 µT < 2 % < 25 % 10 mT > 2 % > 8 %
2013 Limbs 100 µT < 1 % < 5 % 10 mT > 1 % > 3 %
The table above shows the dynamic ranges for each standard and setting, for magnetic field measurements.
4-28 Description
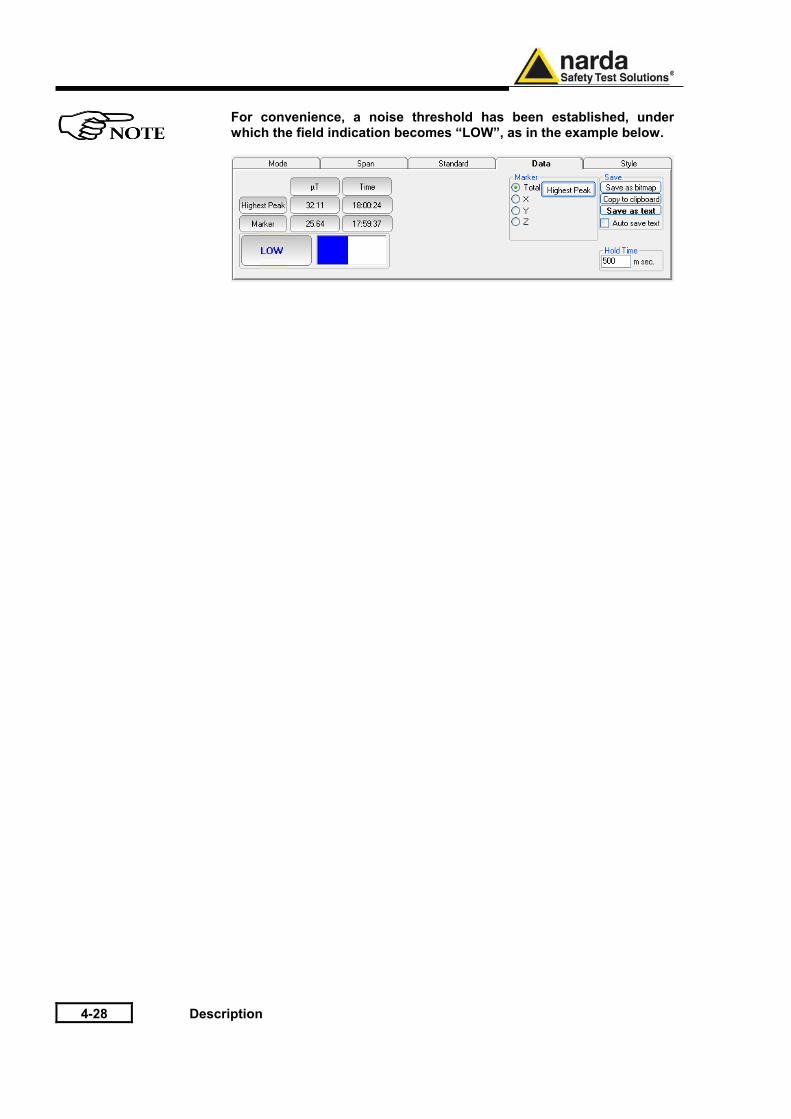
For convenience, a noise threshold has been established, under which the field indication becomes “LOW”, as in the example below.
Description 4-29
4.11 Additional functions provided by EHP200-TS
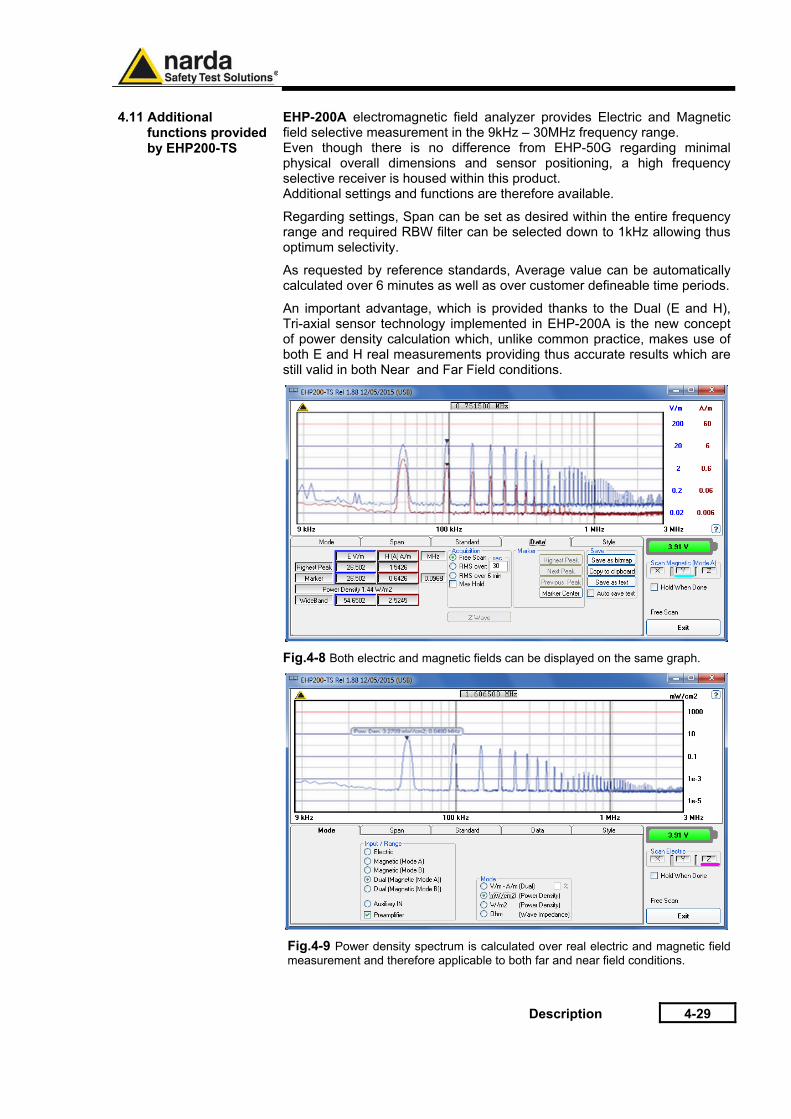
EHP-200A electromagnetic field analyzer provides Electric and Magnetic field selective measurement in the 9kHz – 30MHz frequency range. Even though there is no difference from EHP-50G regarding minimal physical overall dimensions and sensor positioning, a high frequency selective receiver is housed within this product. Additional settings and functions are therefore available.
Regarding settings, Span can be set as desired within the entire frequency range and required RBW filter can be selected down to 1kHz allowing thus optimum selectivity.
As requested by reference standards, Average value can be automatically calculated over 6 minutes as well as over customer defineable time periods.
An important advantage, which is provided thanks to the Dual (E and H), Tri-axial sensor technology implemented in EHP-200A is the new concept of power density calculation which, unlike common practice, makes use of both E and H real measurements providing thus accurate results which are still valid in both Near and Far Field conditions.
Fig.4-8 Both electric and magnetic fields can be displayed on the same graph.
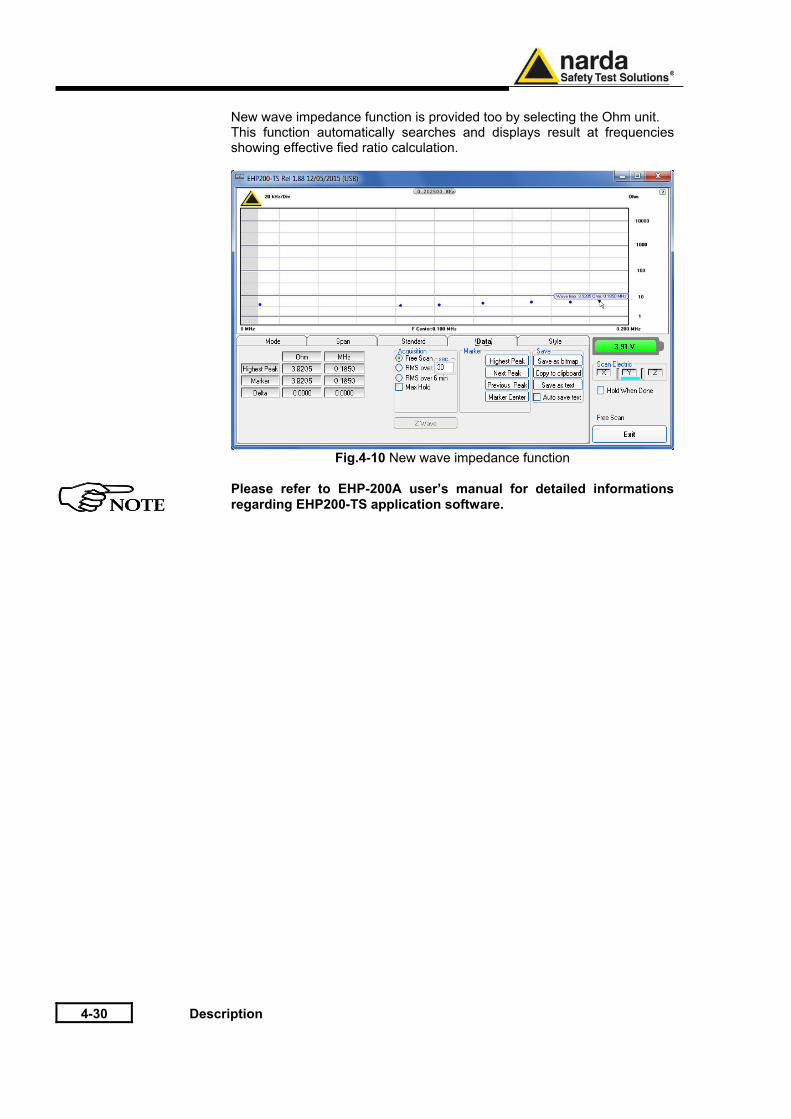
Fig.4-9 Power density spectrum is calculated over real electric and magnetic field measurement and therefore applicable to both far and near field conditions.
4-30 Description
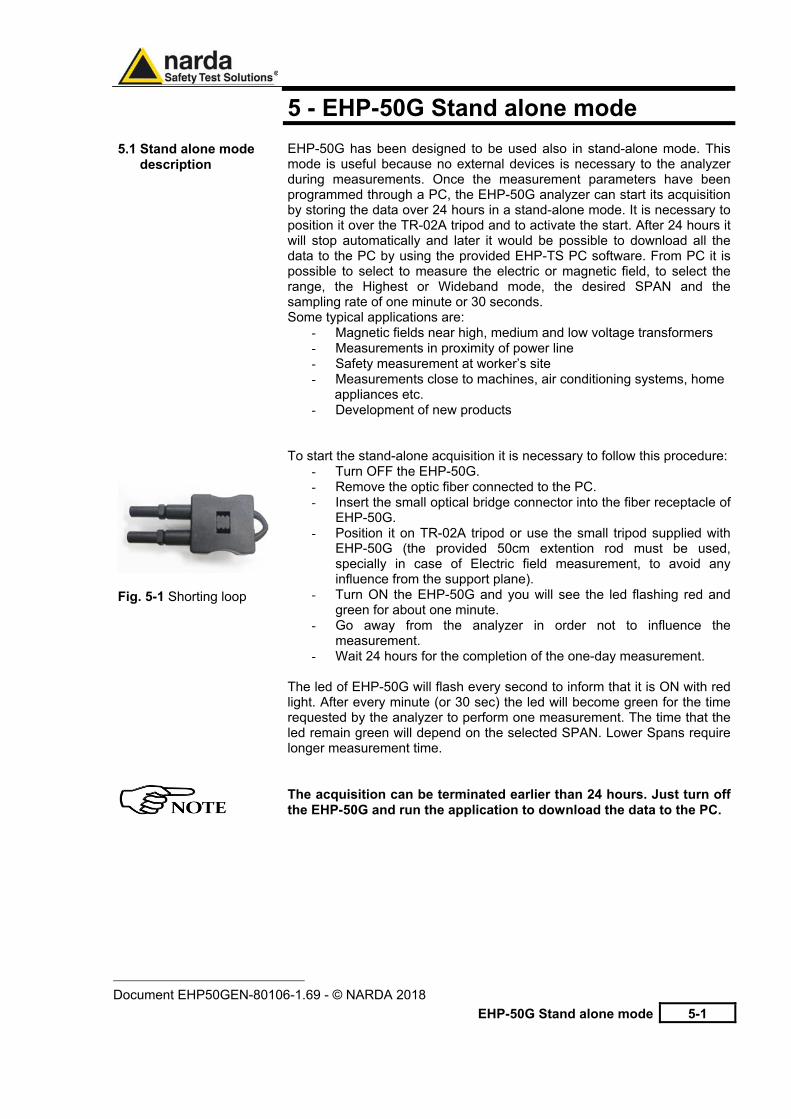
New wave impedance function is provided too by selecting the Ohm unit.
This function automatically searches and displays result at frequencies showing effective fied ratio calculation.
Fig.4-10 New wave impedance function
Please refer to EHP-200A user’s manual for detailed informations regarding EHP200-TS application software.
EHP-50G Stand alone mode 5-1
5 - EHP-50G Stand alone mode
5.1 Stand alone mode description
EHP-50G has been designed to be used also in stand-alone mode. This mode is useful because no external devices is necessary to the analyzer during measurements. Once the measurement parameters have been programmed through a PC, the EHP-50G analyzer can start its acquisition by storing the data over 24 hours in a stand-alone mode. It is necessary to position it over the TR-02A tripod and to activate the start. After 24 hours it will stop automatically and later it would be possible to download all the data to the PC by using the provided EHP-TS PC software. From PC it is possible to select to measure the electric or magnetic field, to select the range, the Highest or Wideband mode, the desired SPAN and the sampling rate of one minute or 30 seconds. Some typical applications are:
- Magnetic fields near high, medium and low voltage transformers - Measurements in proximity of power line - Safety measurement at worker’s site - Measurements close to machines, air conditioning systems, home
appliances etc. - Development of new products
Fig. 5-1 Shorting loop
To start the stand-alone acquisition it is necessary to follow this procedure: - Turn OFF the EHP-50G. - Remove the optic fiber connected to the PC. - Insert the small optical bridge connector into the fiber receptacle of
EHP-50G. - Position it on TR-02A tripod or use the small tripod supplied with
EHP-50G (the provided 50cm extention rod must be used, specially in case of Electric field measurement, to avoid any influence from the support plane).
- Turn ON the EHP-50G and you will see the led flashing red and green for about one minute.
- Go away from the analyzer in order not to influence the measurement.
- Wait 24 hours for the completion of the one-day measurement. The led of EHP-50G will flash every second to inform that it is ON with red light. After every minute (or 30 sec) the led will become green for the time requested by the analyzer to perform one measurement. The time that the led remain green will depend on the selected SPAN. Lower Spans require longer measurement time. The acquisition can be terminated earlier than 24 hours. Just turn off the EHP-50G and run the application to download the data to the PC.
Document EHP50GEN-80106-1.69 - © NARDA 2018
5-2 EHP-50G Stand alone mode
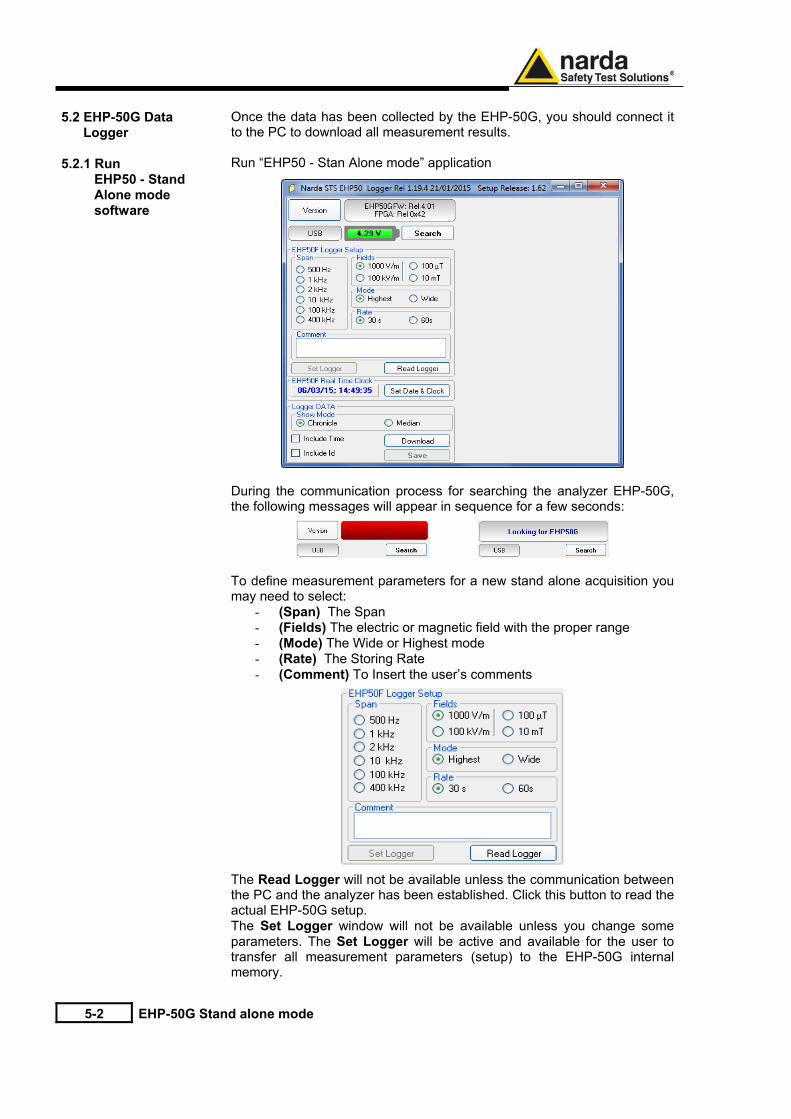
5.2 EHP-50G Data Logger 5.2.1 Run EHP50 - Stand Alone mode software
Once the data has been collected by the EHP-50G, you should connect it to the PC to download all measurement results. Run “EHP50 - Stan Alone mode” application
During the communication process for searching the analyzer EHP-50G, the following messages will appear in sequence for a few seconds:
To define measurement parameters for a new stand alone acquisition you may need to select:
- (Span) The Span - (Fields) The electric or magnetic field with the proper range - (Mode) The Wide or Highest mode - (Rate) The Storing Rate - (Comment) To Insert the user’s comments
The Read Logger will not be available unless the communication between the PC and the analyzer has been established. Click this button to read the actual EHP-50G setup. The Set Logger window will not be available unless you change some parameters. The Set Logger will be active and available for the user to transfer all measurement parameters (setup) to the EHP-50G internal memory.
EHP-50G Stand alone mode 5-3
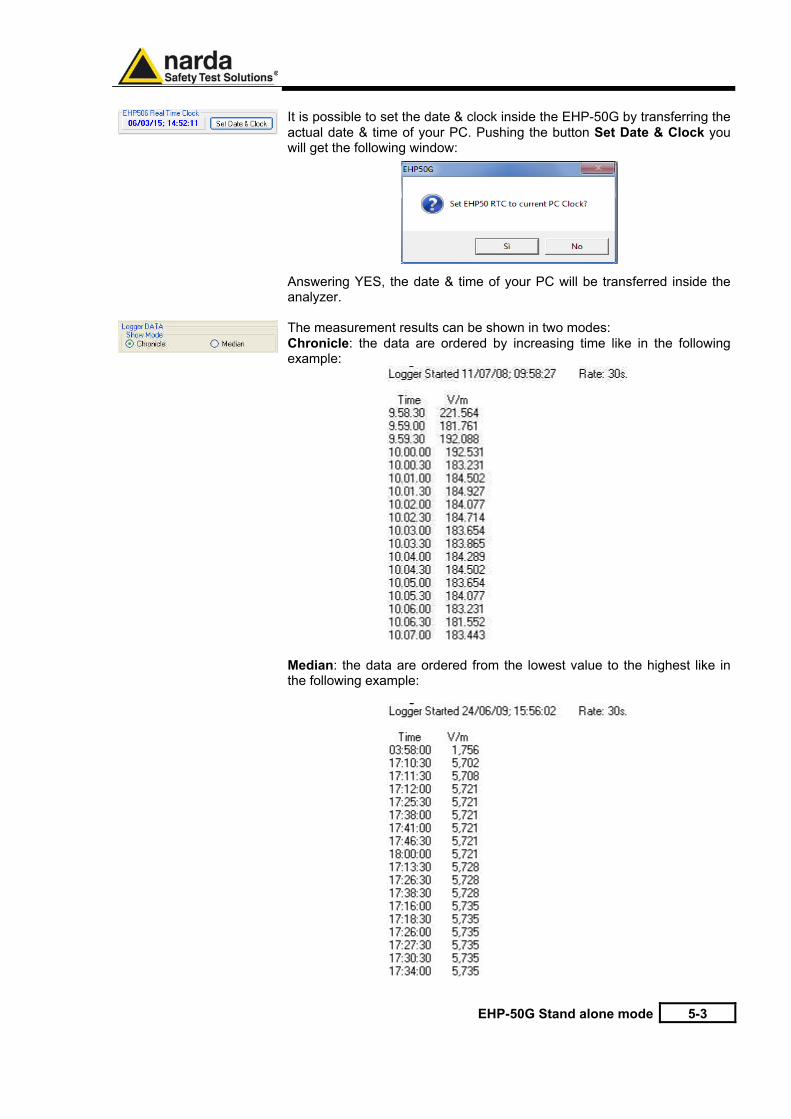
It is possible to set the date & clock inside the EHP-50G by transferring the actual date & time of your PC. Pushing the button Set Date & Clock you will get the following window:
Answering YES, the date & time of your PC will be transferred inside the analyzer.
The measurement results can be shown in two modes: Chronicle: the data are ordered by increasing time like in the following example:
Median: the data are ordered from the lowest value to the highest like in the following example:
5-4 EHP-50G Stand alone mode
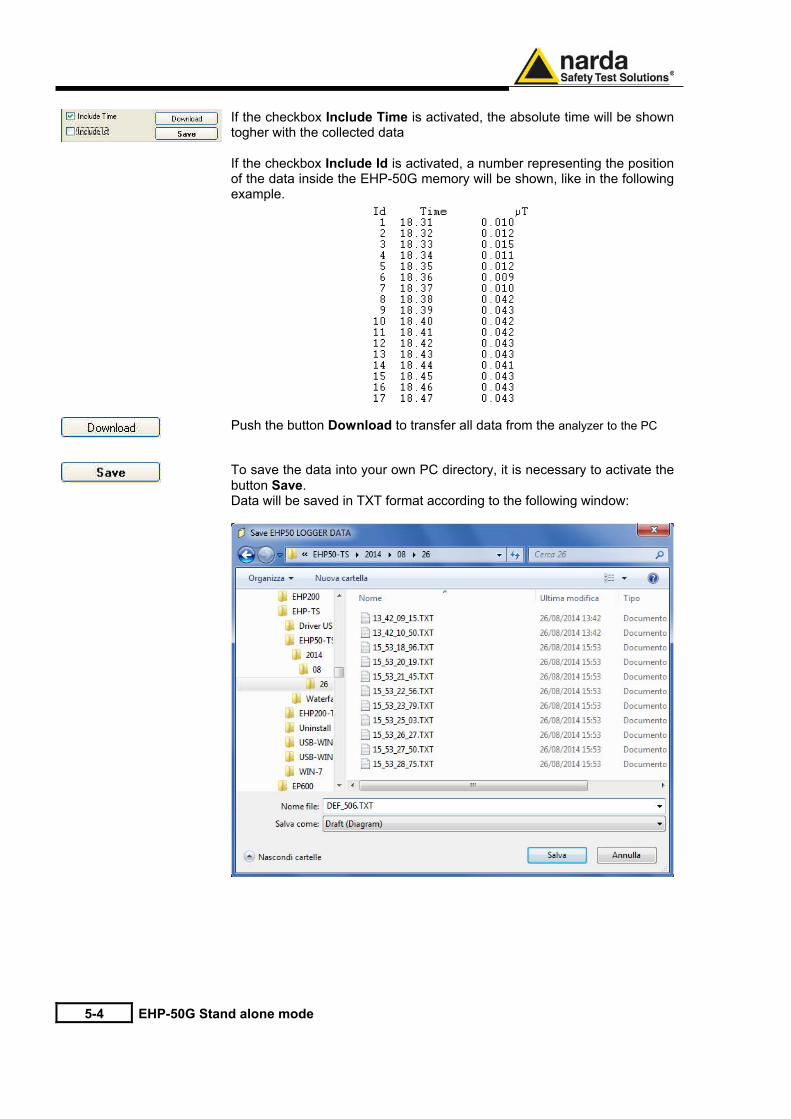
If the checkbox Include Time is activated, the absolute time will be shown togher with the collected data If the checkbox Include Id is activated, a number representing the position of the data inside the EHP-50G memory will be shown, like in the following example.
Push the button Download to transfer all data from the analyzer to the PC
To save the data into your own PC directory, it is necessary to activate the button Save. Data will be saved in TXT format according to the following window:
EHP-50G Stand alone mode 5-5
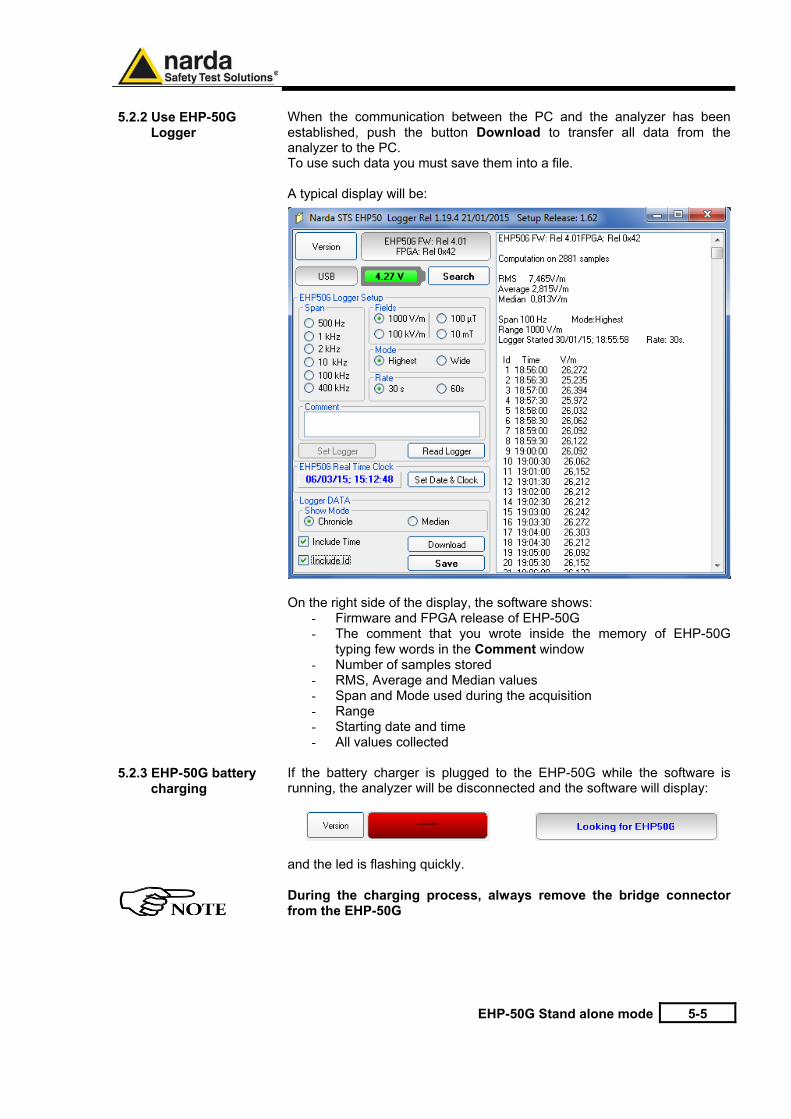
5.2.2 Use EHP-50G Logger
When the communication between the PC and the analyzer has been established, push the button Download to transfer all data from the analyzer to the PC. To use such data you must save them into a file.
A typical display will be:
On the right side of the display, the software shows:
- Firmware and FPGA release of EHP-50G - The comment that you wrote inside the memory of EHP-50G
typing few words in the Comment window - Number of samples stored - RMS, Average and Median values - Span and Mode used during the acquisition - Range - Starting date and time - All values collected
5.2.3 EHP-50G battery charging
If the battery charger is plugged to the EHP-50G while the software is running, the analyzer will be disconnected and the software will display:
and the led is flashing quickly. During the charging process, always remove the bridge connector from the EHP-50G

5-6 EHP-50G Stand alone mode
This page has been left blank intentionally
Update Firmware 6-1
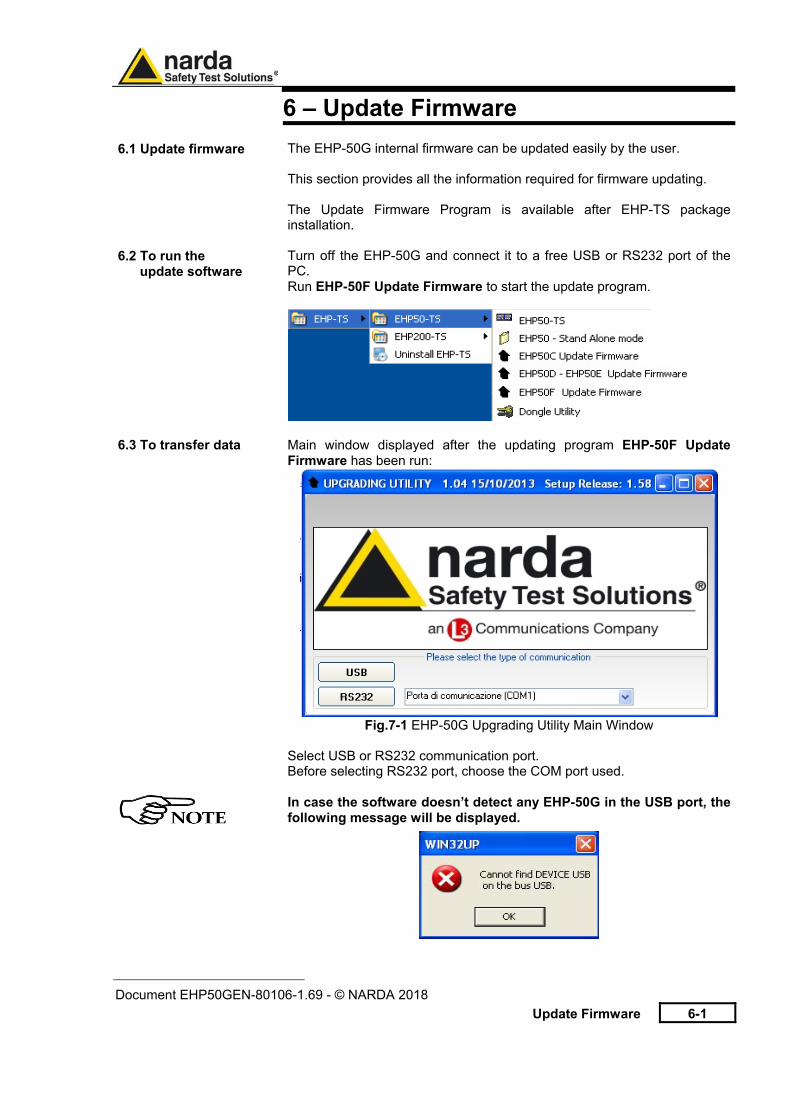
6 – Update Firmware 6.1 Update firmware
The EHP-50G internal firmware can be updated easily by the user. This section provides all the information required for firmware updating.
The Update Firmware Program is available after EHP-TS package installation.
6.2 To run the update software
Turn off the EHP-50G and connect it to a free USB or RS232 port of the PC. Run EHP-50F Update Firmware to start the update program.
6.3 To transfer data
Main window displayed after the updating program EHP-50F Update Firmware has been run:
Fig.7-1 EHP-50G Upgrading Utility Main Window
Select USB or RS232 communication port. Before selecting RS232 port, choose the COM port used.
In case the software doesn’t detect any EHP-50G in the USB port, the following message will be displayed.
1
Document EHP50GEN-80106-1.69 - © NARDA 2018
6-2 Firmware Update
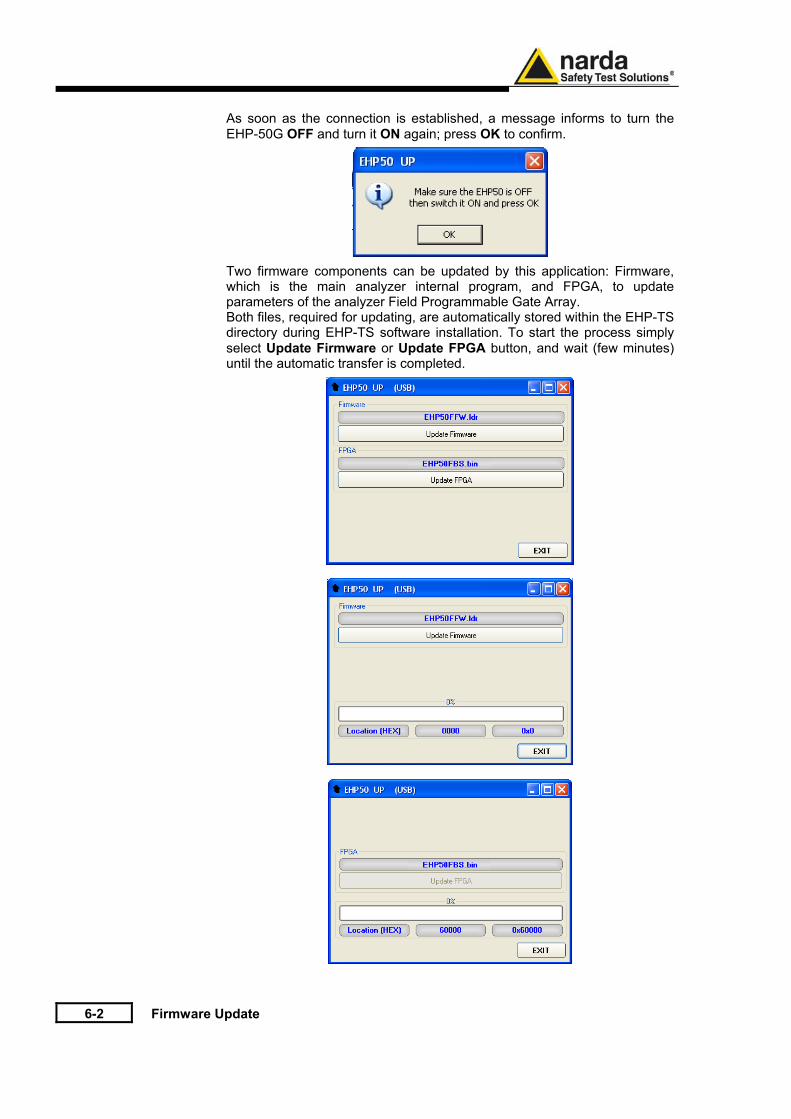
As soon as the connection is established, a message informs to turn the
EHP-50G OFF and turn it ON again; press OK to confirm.
Two firmware components can be updated by this application: Firmware, which is the main analyzer internal program, and FPGA, to update parameters of the analyzer Field Programmable Gate Array. Both files, required for updating, are automatically stored within the EHP-TS directory during EHP-TS software installation. To start the process simply select Update Firmware or Update FPGA button, and wait (few minutes) until the automatic transfer is completed.

Update Firmware 6-3
At the end, a message informs if the update has been successfully
performed. Turn the EHP-50G OFF (it could seem to be already OFF but it is not) and turn it ON again. The EHP-50G is now updated with the new version of the internal firmware or FPGA. It is now possible to disconnect the cable connected to the PC, with the EHP-50G meter either switched on or off. Subsequently, when the meter is switched on again, the new version will be displayed on the 8053 DISPLAY, EHP50-TS or EHP-50G Stand Alone Mode application software.
To obtain firmware or FPGA or programs updates for EHP-50G, please contact your NARDA distributor or download it directly from the NARDA Web site: www.narda-sts.it

6-4 Firmware Update
This page has been intentionally left blank
Uninstalling Software 7-1
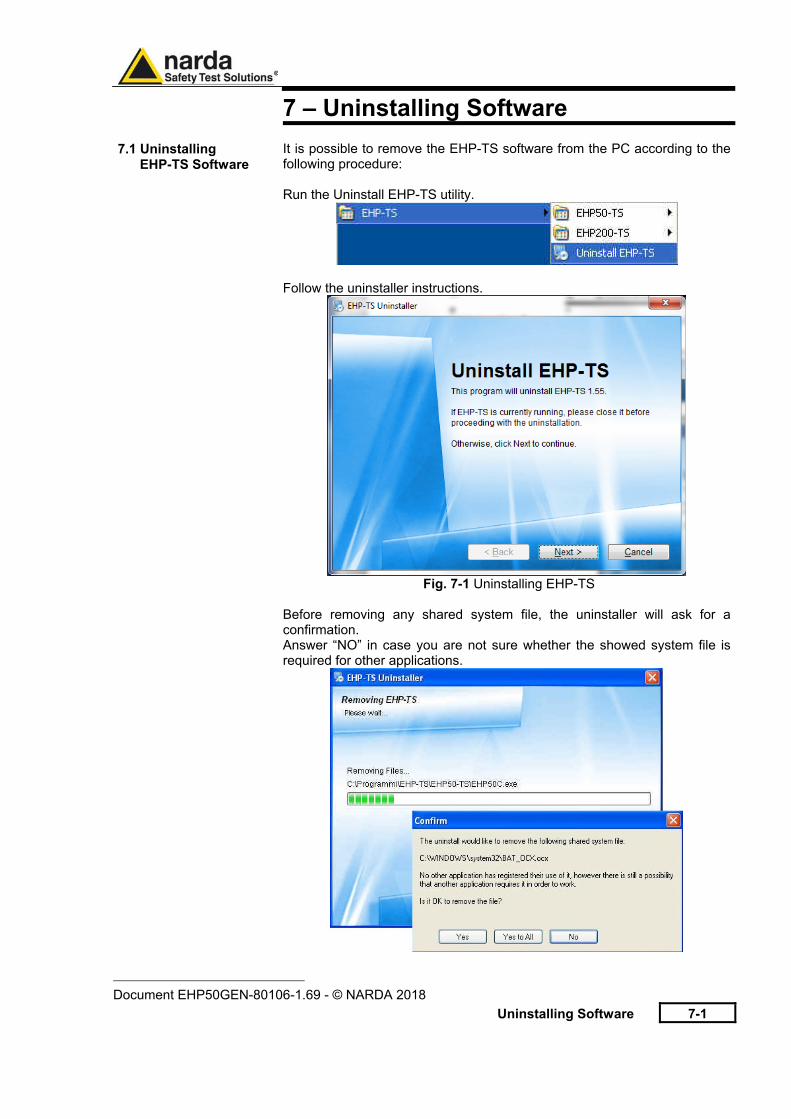
7 – Uninstalling Software 7.1 Uninstalling EHP-TS Software
It is possible to remove the EHP-TS software from the PC according to the following procedure: Run the Uninstall EHP-TS utility.
Follow the uninstaller instructions.
Fig. 7-1 Uninstalling EHP-TS
Before removing any shared system file, the uninstaller will ask for a confirmation. Answer “NO” in case you are not sure whether the showed system file is required for other applications.
1
Document EHP50GEN-80106-1.69 - © NARDA 2018
7-2 Uninstalling Software
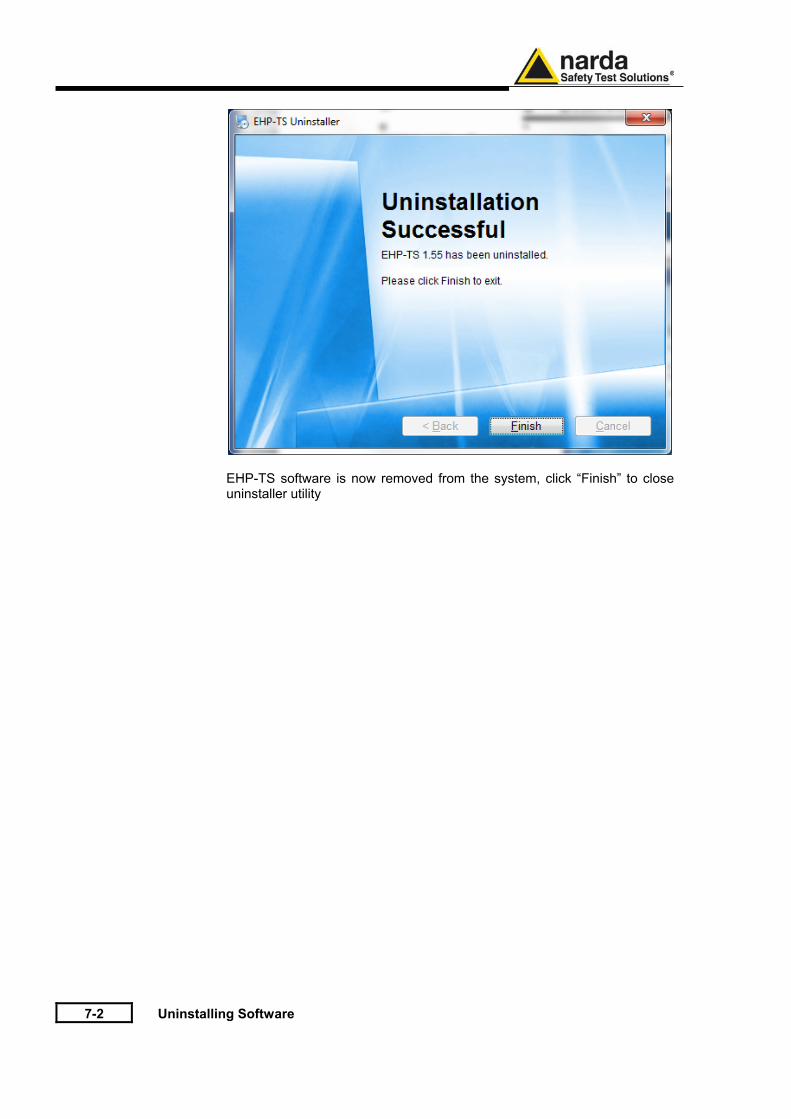
EHP-TS software is now removed from the system, click “Finish” to close uninstaller utility
Uninstalling USB-OC 8-1
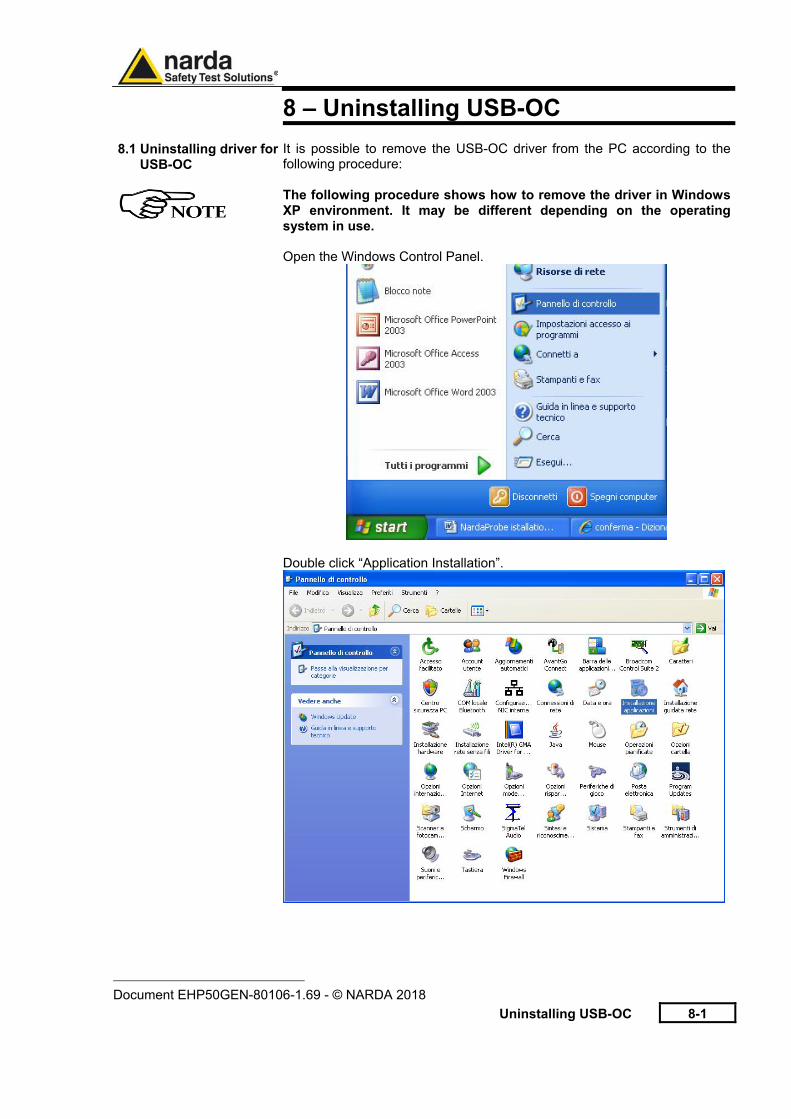
8 – Uninstalling USB-OC 8.1 Uninstalling driver for USB-OC
It is possible to remove the USB-OC driver from the PC according to the following procedure: The following procedure shows how to remove the driver in Windows XP environment. It may be different depending on the operating system in use. Open the Windows Control Panel.
Double click “Application Installation”.
1
Document EHP50GEN-80106-1.69 - © NARDA 2018
8-2 Uninstalling USB-OC
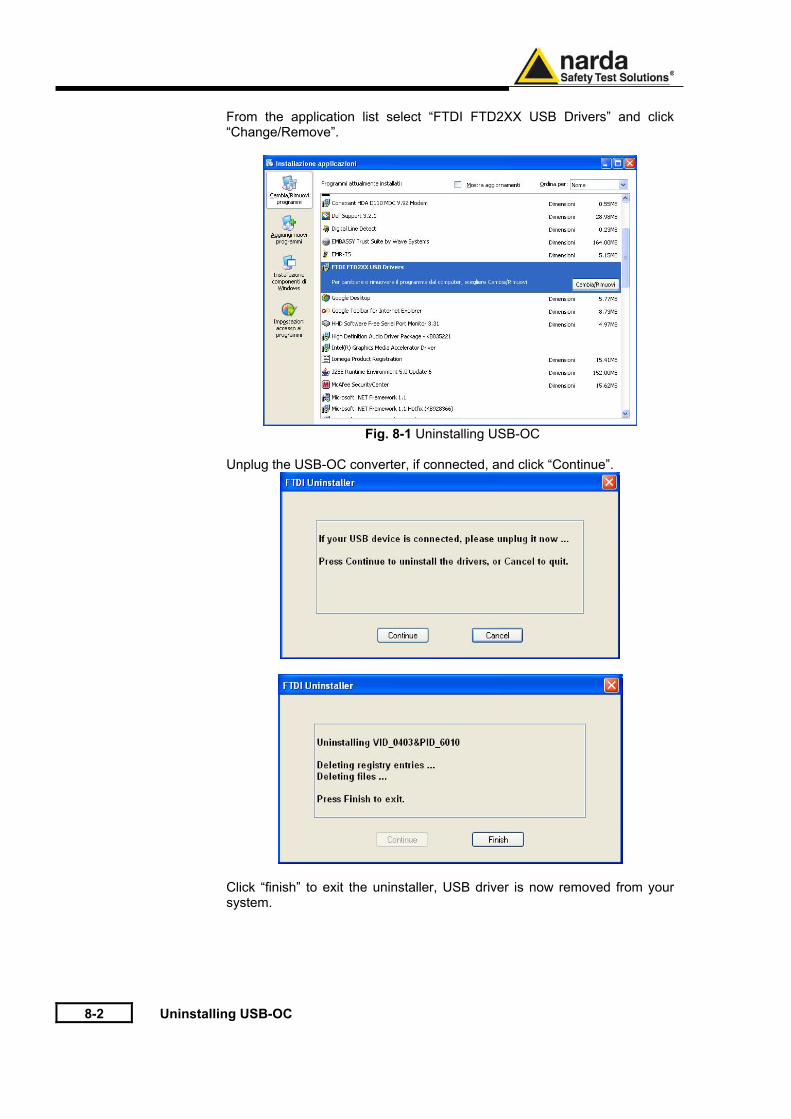
From the application list select “FTDI FTD2XX USB Drivers” and click
“Change/Remove”.
Fig. 8-1 Uninstalling USB-OC
Unplug the USB-OC converter, if connected, and click “Continue”.
Click “finish” to exit the uninstaller, USB driver is now removed from your system.
Accessories 9-1
9 - Accessories
9.1 Introduction
This section provides information required for installing and using accessories for EHP-50G Analyzer. Information is included regarding initial inspection, power requirements, interconnections, work environment, assembly, cleaning, storage and shipment. The following general information is applicable to all accessories.
9.1.1 Preliminary inspection
Inspect the packaging for any damage. If the packaging or anti-shock material have been damaged, check that the contents are complete and that the product has not suffered electric or mechanical damage. Check that all the Accessories are there against the checklist found with the apparatus. Inform the carrier and NARDA of any damage that has occurred.
9.1.2 Work environment Unless otherwise specified, the work environment of the Accessories, must come within the following conditions:
• Temperature • Humidity
From -10°C to +50° C (0°C to 40°C for Battery Charger) < 90% relative
The Accessories must be stored in a clean and dry environment, free from dust, acids and humidity. The storage environment must come within the range of the following conditions:
• Temperature • Humidity
From -30°C to + 70°C (-20°C to 60°C for Battery Charger)< 95% relative
9.1.3 Return for repair When the Accessories need to be returned to NARDA for repair, please complete the questionnaire appended to this User’s Manual, filling in all the data that will be useful for the service you have requested. For reducing the period of time required for the repairs, it is necessary to be as specific as possible in describing the problem. If the problem only occurs in certain circumstances, please describe in detail how it happens. If possible it is better to reuse the original packaging; making sure that the apparatus is wrapped in thick paper or plastic. Otherwise, use strong packaging by using a sufficient quantity of shock absorbent material around all sides of the product to ensure that it is compact and does not move around inside the package. In particular, take every precaution to protect the front panels. Finish the package by sealing it up tightly. Apply a FRAGILE label to the package to encourage greater care in its handling.
9.1.4 Cleaning
Use a dry, clean and non-abrasive cloth for cleaning the instruments. Do not use solvents, acids, turpentine, acetone or other similar products for cleaning the devices in order to avoid damaging them.
Document EHP50GEN-80106-1.69 - © NARDA 2018
9-2 Accessories
9.1.5 Power supply and battery chargers
EHP-50G accessories are powered by either internal rechargeable batteries or directly from other devices to which they are connected. The AC/DC battery charger (650.000.036) can be used with a power frequency at either 50 Hz or 60 Hz with a supply voltage between 100 and 240 AC Volt. International AC plug adapters are provided according to the various national standards. AC plug adapter can be easily removed from the battery charger to be replaced by a different one.
To have the greatest autonomy, a full recharging cycle should be carried out before using the Accessories.
ALWAYS connect the battery charger to the mains BEFORE connecting to the charge input of the accessories. The battery charger has an internal protective circuit that will break the output if any load is detected while connecting to the mains.
Battery charger: output: DC, 10 - 15 V, ~ 500 mA
Connector:
+-
In order to preserve battery efficiency a complete recharge cycle is required before storing them for periods longer than 4 months. Therefore, it is warmly suggested recharging the batteries at least every 4 months even though the device has not been used.
Software and Firmware updates for Accessories can be downloaded from the Web site http://narda-sts.it or requested directly from NARDA Sales Centres.
9.1.6 Weighted Peak Option
The Weighted Peak is a payment, special function, implemented in the EHP-50G to perform test to comply to the latest standards (i.e. appendix “Determination of the weighted peak exposure”). Please contact your local Narda distributor for details. The instructions concerning how to operate the WP function can be found in chapter 5 of this manual.
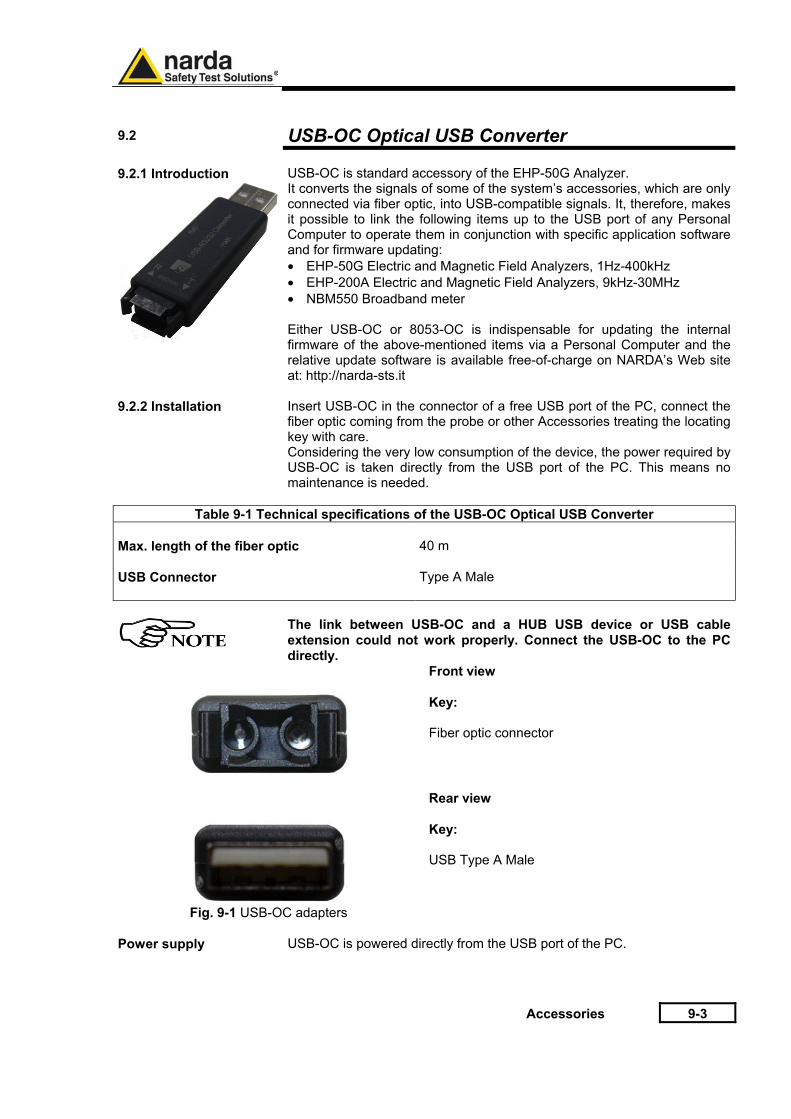
Accessories 9-3
9.2 USB-OC Optical USB Converter 9.2.1 Introduction
USB-OC is standard accessory of the EHP-50G Analyzer. It converts the signals of some of the system’s accessories, which are only connected via fiber optic, into USB-compatible signals. It, therefore, makes it possible to link the following items up to the USB port of any Personal Computer to operate them in conjunction with specific application software and for firmware updating: • EHP-50G Electric and Magnetic Field Analyzers, 1Hz-400kHz • EHP-200A Electric and Magnetic Field Analyzers, 9kHz-30MHz • NBM550 Broadband meter Either USB-OC or 8053-OC is indispensable for updating the internal firmware of the above-mentioned items via a Personal Computer and the relative update software is available free-of-charge on NARDA’s Web site at: http://narda-sts.it
9.2.2 Installation
Insert USB-OC in the connector of a free USB port of the PC, connect the fiber optic coming from the probe or other Accessories treating the locating key with care. Considering the very low consumption of the device, the power required by USB-OC is taken directly from the USB port of the PC. This means no maintenance is needed.
Table 9-1 Technical specifications of the USB-OC Optical USB Converter Max. length of the fiber optic
40 m
USB Connector
Type A Male
The link between USB-OC and a HUB USB device or USB cable extension could not work properly. Connect the USB-OC to the PC directly.
Front view Key: Fiber optic connector
Rear view Key: USB Type A Male
Fig. 9-1 USB-OC adapters
Power supply USB-OC is powered directly from the USB port of the PC.
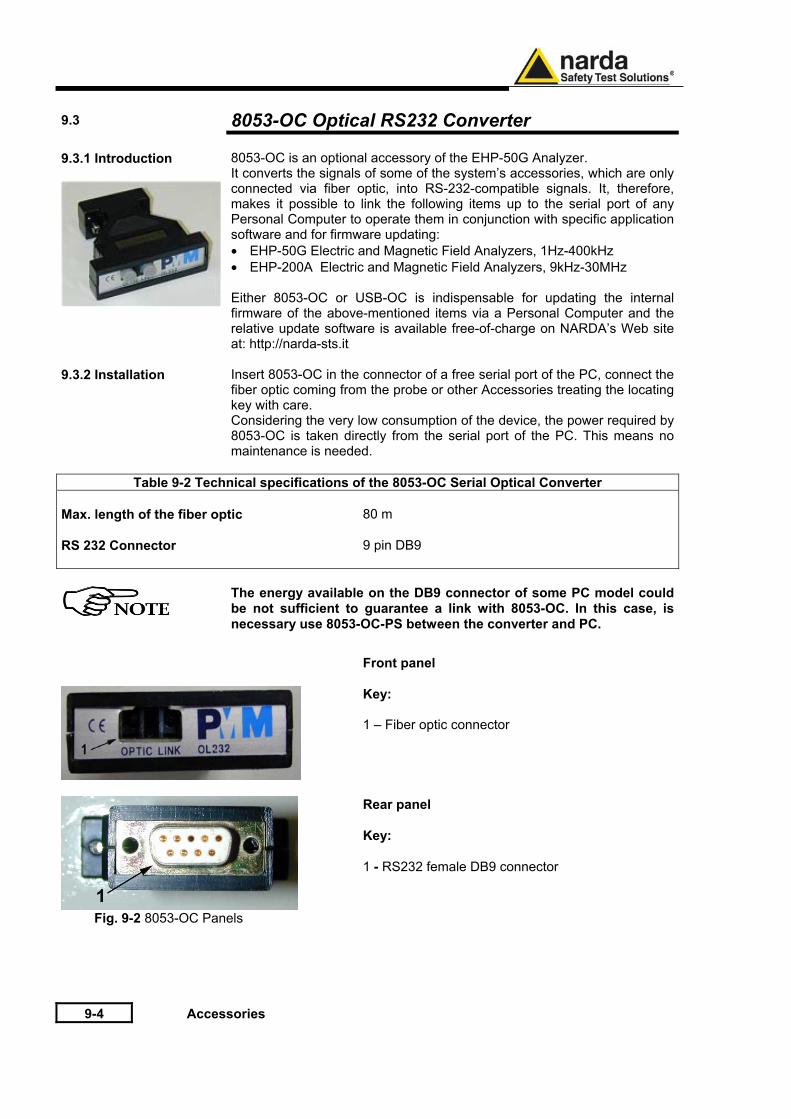
9-4 Accessories
9.3 8053-OC Optical RS232 Converter 9.3.1 Introduction
8053-OC is an optional accessory of the EHP-50G Analyzer. It converts the signals of some of the system’s accessories, which are only connected via fiber optic, into RS-232-compatible signals. It, therefore, makes it possible to link the following items up to the serial port of any Personal Computer to operate them in conjunction with specific application software and for firmware updating: • EHP-50G Electric and Magnetic Field Analyzers, 1Hz-400kHz • EHP-200A Electric and Magnetic Field Analyzers, 9kHz-30MHz Either 8053-OC or USB-OC is indispensable for updating the internal firmware of the above-mentioned items via a Personal Computer and the relative update software is available free-of-charge on NARDA’s Web site at: http://narda-sts.it
9.3.2 Installation
Insert 8053-OC in the connector of a free serial port of the PC, connect the fiber optic coming from the probe or other Accessories treating the locating key with care. Considering the very low consumption of the device, the power required by 8053-OC is taken directly from the serial port of the PC. This means no maintenance is needed.
Table 9-2 Technical specifications of the 8053-OC Serial Optical Converter Max. length of the fiber optic
80 m
RS 232 Connector
9 pin DB9
The energy available on the DB9 connector of some PC model could be not sufficient to guarantee a link with 8053-OC. In this case, is necessary use 8053-OC-PS between the converter and PC.
Front panel
Key: 1 – Fiber optic connector
Rear panel Key: 1 - RS232 female DB9 connector
Fig. 9-2 8053-OC Panels
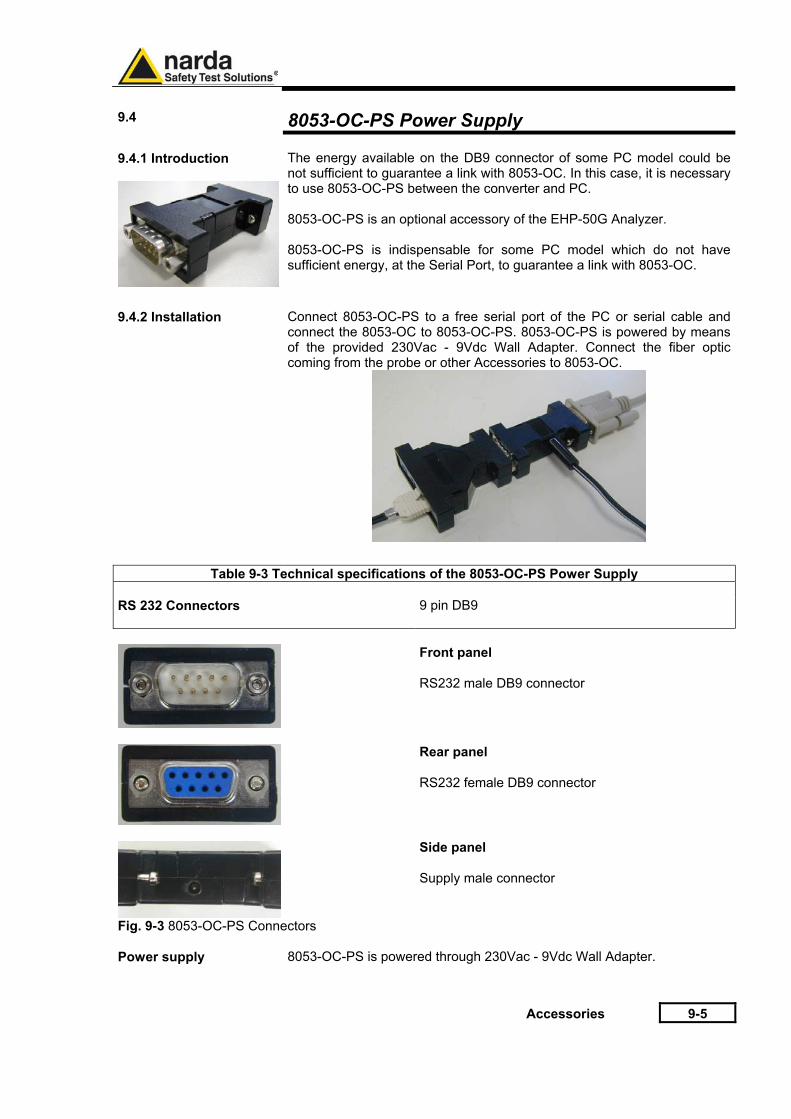
Accessories 9-5
9.4 8053-OC-PS Power Supply 9.4.1 Introduction
The energy available on the DB9 connector of some PC model could be not sufficient to guarantee a link with 8053-OC. In this case, it is necessary to use 8053-OC-PS between the converter and PC. 8053-OC-PS is an optional accessory of the EHP-50G Analyzer. 8053-OC-PS is indispensable for some PC model which do not have sufficient energy, at the Serial Port, to guarantee a link with 8053-OC.
9.4.2 Installation
Connect 8053-OC-PS to a free serial port of the PC or serial cable and connect the 8053-OC to 8053-OC-PS. 8053-OC-PS is powered by means of the provided 230Vac - 9Vdc Wall Adapter. Connect the fiber optic coming from the probe or other Accessories to 8053-OC.
Table 9-3 Technical specifications of the 8053-OC-PS Power Supply RS 232 Connectors 9 pin DB9
Front panel RS232 male DB9 connector
Fig. 9-3 8053-OC-PS Connectors
Rear panel RS232 female DB9 connector Side panel Supply male connector
Power supply 8053-OC-PS is powered through 230Vac - 9Vdc Wall Adapter.
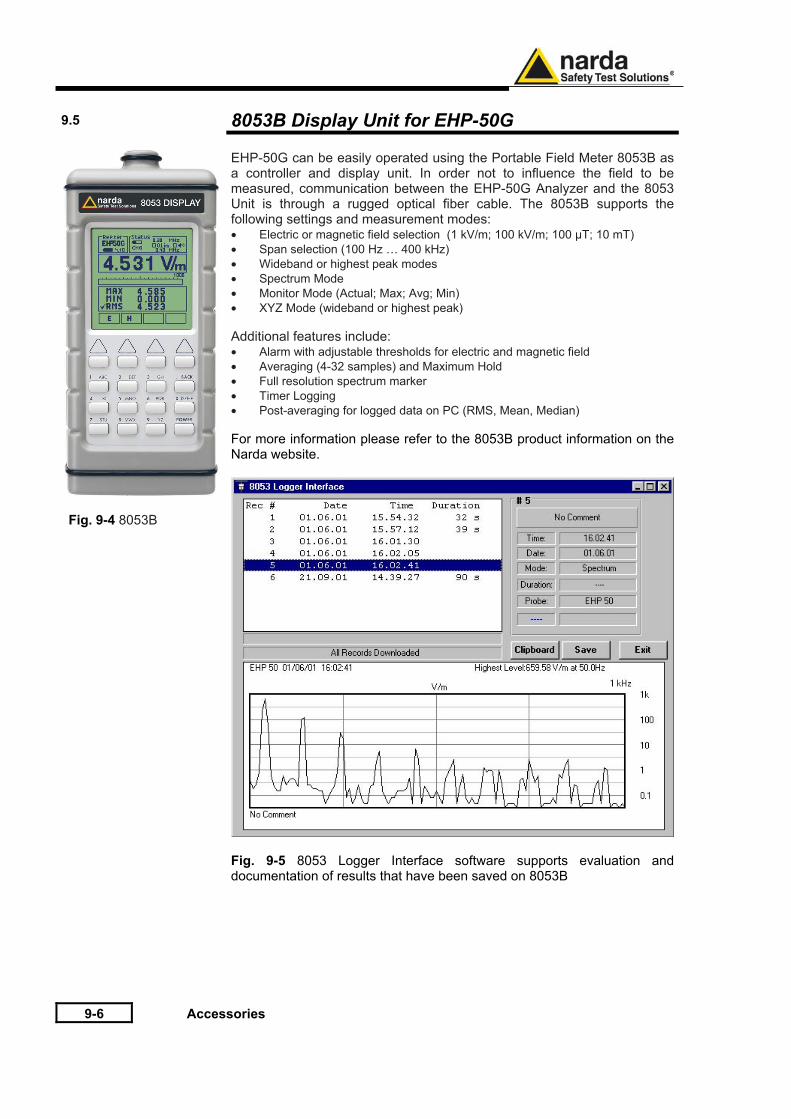
9-6 Accessories
9.5 8053B Display Unit for EHP-50G
Fig. 9-4 8053B
EHP-50G can be easily operated using the Portable Field Meter 8053B as a controller and display unit. In order not to influence the field to be measured, communication between the EHP-50G Analyzer and the 8053 Unit is through a rugged optical fiber cable. The 8053B supports the following settings and measurement modes: • Electric or magnetic field selection (1 kV/m; 100 kV/m; 100 µT; 10 mT) • Span selection (100 Hz … 400 kHz) • Wideband or highest peak modes • Spectrum Mode • Monitor Mode (Actual; Max; Avg; Min) • XYZ Mode (wideband or highest peak) Additional features include: • Alarm with adjustable thresholds for electric and magnetic field • Averaging (4-32 samples) and Maximum Hold • Full resolution spectrum marker • Timer Logging • Post-averaging for logged data on PC (RMS, Mean, Median) For more information please refer to the 8053B product information on the Narda website.
Fig. 9-5 8053 Logger Interface software supports evaluation and documentation of results that have been saved on 8053B
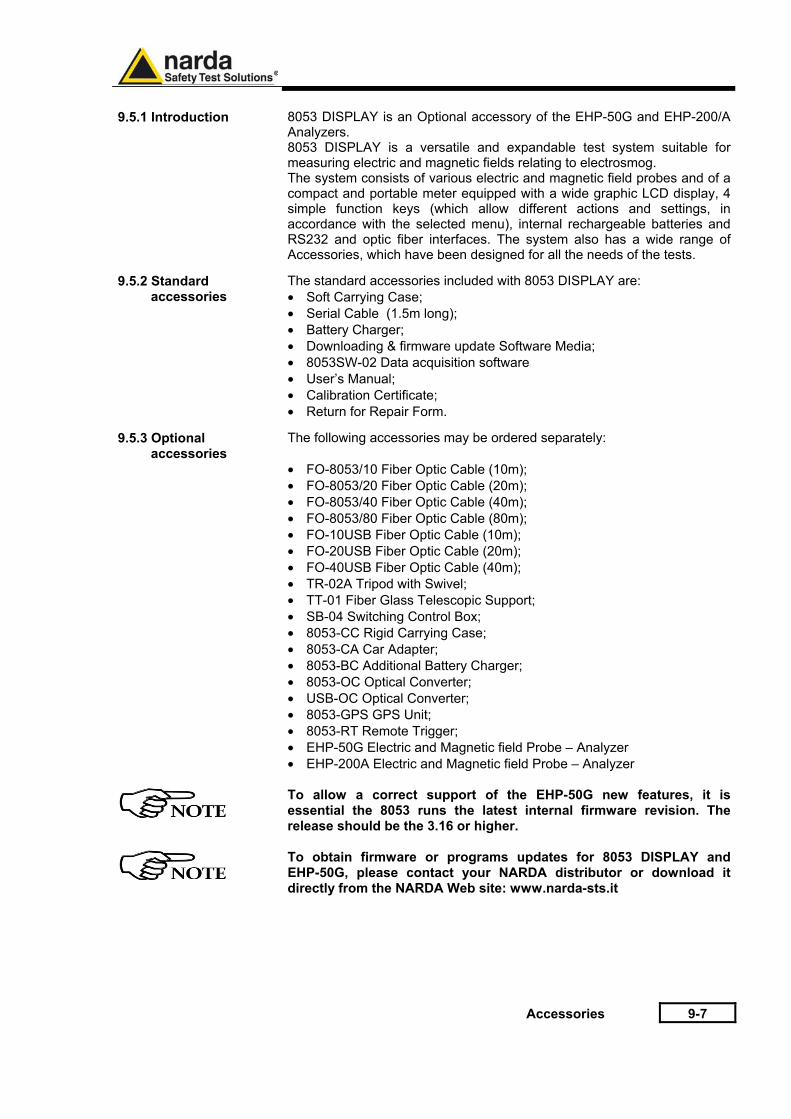
Accessories 9-7
9.5.1 Introduction
8053 DISPLAY is an Optional accessory of the EHP-50G and EHP-200/A Analyzers. 8053 DISPLAY is a versatile and expandable test system suitable for measuring electric and magnetic fields relating to electrosmog. The system consists of various electric and magnetic field probes and of a compact and portable meter equipped with a wide graphic LCD display, 4 simple function keys (which allow different actions and settings, in accordance with the selected menu), internal rechargeable batteries and RS232 and optic fiber interfaces. The system also has a wide range of Accessories, which have been designed for all the needs of the tests.
9.5.2 Standard accessories
The standard accessories included with 8053 DISPLAY are: • Soft Carrying Case; • Serial Cable (1.5m long); • Battery Charger; • Downloading & firmware update Software Media; • 8053SW-02 Data acquisition software • User’s Manual; • Calibration Certificate; • Return for Repair Form.
9.5.3 Optional accessories
The following accessories may be ordered separately: • FO-8053/10 Fiber Optic Cable (10m); • FO-8053/20 Fiber Optic Cable (20m); • FO-8053/40 Fiber Optic Cable (40m); • FO-8053/80 Fiber Optic Cable (80m); • FO-10USB Fiber Optic Cable (10m); • FO-20USB Fiber Optic Cable (20m); • FO-40USB Fiber Optic Cable (40m); • TR-02A Tripod with Swivel; • TT-01 Fiber Glass Telescopic Support; • SB-04 Switching Control Box; • 8053-CC Rigid Carrying Case; • 8053-CA Car Adapter; • 8053-BC Additional Battery Charger; • 8053-OC Optical Converter; • USB-OC Optical Converter; • 8053-GPS GPS Unit; • 8053-RT Remote Trigger; • EHP-50G Electric and Magnetic field Probe – Analyzer • EHP-200A Electric and Magnetic field Probe – Analyzer
To allow a correct support of the EHP-50G new features, it is essential the 8053 runs the latest internal firmware revision. The release should be the 3.16 or higher.
To obtain firmware or programs updates for 8053 DISPLAY and EHP-50G, please contact your NARDA distributor or download it directly from the NARDA Web site: www.narda-sts.it
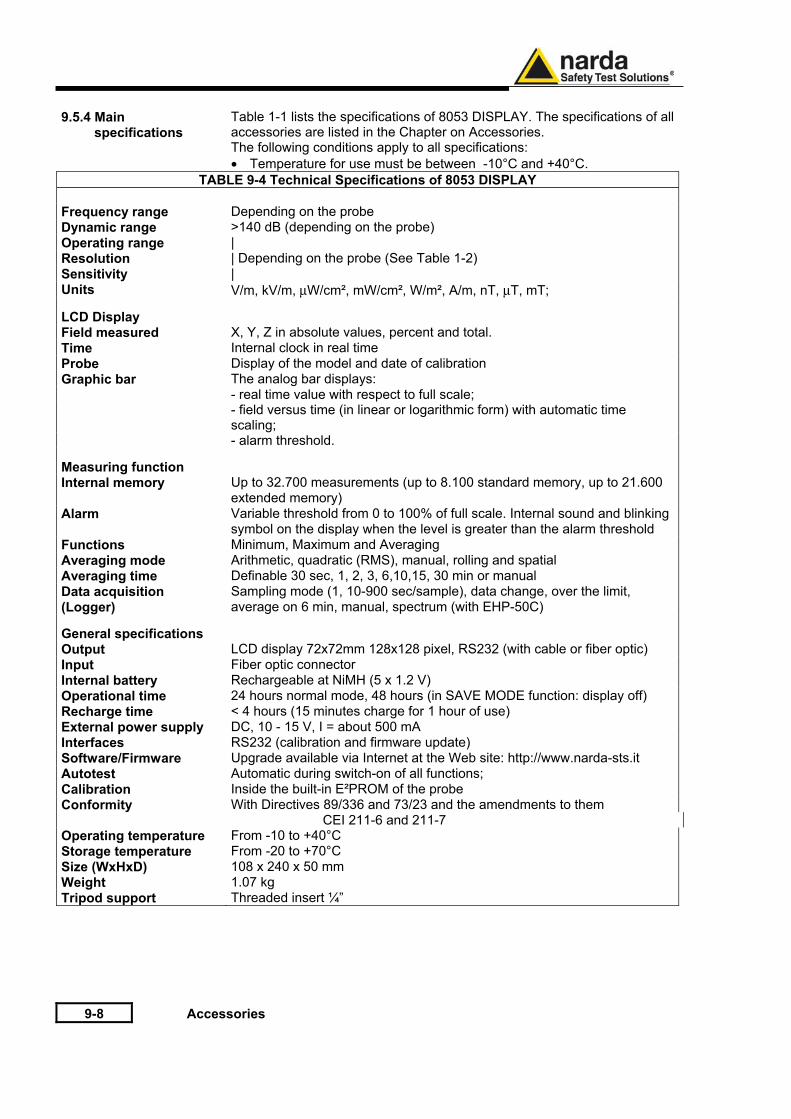
9-8 Accessories
9.5.4 Main specifications
Table 1-1 lists the specifications of 8053 DISPLAY. The specifications of all accessories are listed in the Chapter on Accessories. The following conditions apply to all specifications: • Temperature for use must be between -10°C and +40°C.
TABLE 9-4 Technical Specifications of 8053 DISPLAY Frequency range Depending on the probe Dynamic range >140 dB (depending on the probe) Operating range | Resolution | Depending on the probe (See Table 1-2) Sensitivity | Units V/m, kV/m, μW/cm², mW/cm², W/m², A/m, nT, μT, mT;
LCD Display
Field measured X, Y, Z in absolute values, percent and total. Time Internal clock in real time Probe Display of the model and date of calibration Graphic bar The analog bar displays: - real time value with respect to full scale; - field versus time (in linear or logarithmic form) with automatic time
scaling; - alarm threshold.
Measuring function
Internal memory Up to 32.700 measurements (up to 8.100 standard memory, up to 21.600 extended memory) Alarm Variable threshold from 0 to 100% of full scale. Internal sound and blinking symbol on the display when the level is greater than the alarm threshold Functions Minimum, Maximum and Averaging Averaging mode Arithmetic, quadratic (RMS), manual, rolling and spatial Averaging time Definable 30 sec, 1, 2, 3, 6,10,15, 30 min or manual Data acquisition Sampling mode (1, 10-900 sec/sample), data change, over the limit, (Logger) average on 6 min, manual, spectrum (with EHP-50C)
General specifications
Output LCD display 72x72mm 128x128 pixel, RS232 (with cable or fiber optic) Input Fiber optic connector Internal battery Rechargeable at NiMH (5 x 1.2 V) Operational time 24 hours normal mode, 48 hours (in SAVE MODE function: display off) Recharge time < 4 hours (15 minutes charge for 1 hour of use) External power supply DC, 10 - 15 V, I = about 500 mA Interfaces RS232 (calibration and firmware update) Software/Firmware Upgrade available via Internet at the Web site: http://www.narda-sts.it Autotest Automatic during switch-on of all functions; Calibration Inside the built-in E²PROM of the probe Conformity With Directives 89/336 and 73/23 and the amendments to them CEI 211-6 and 211-7 Operating temperature From -10 to +40°C Storage temperature From -20 to +70°C Size (WxHxD) 108 x 240 x 50 mm Weight 1.07 kg Tripod support Threaded insert ¼”
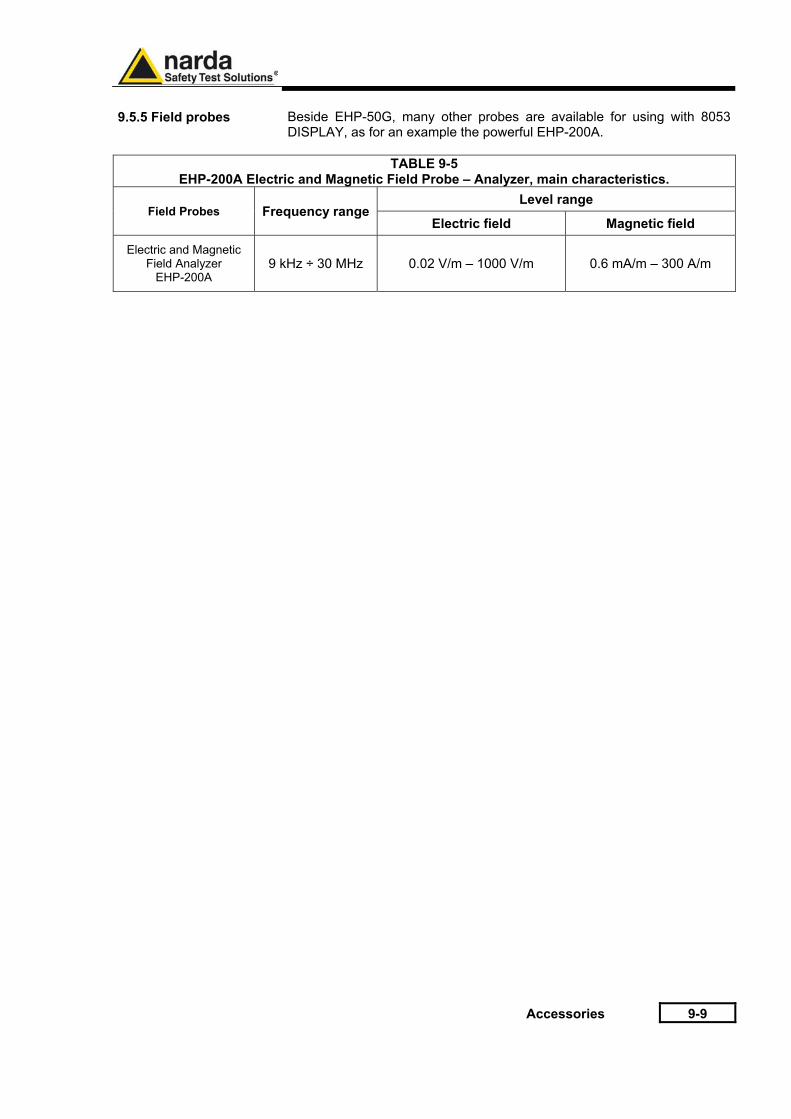
Accessories 9-9
9.5.5 Field probes Beside EHP-50G, many other probes are available for using with 8053
DISPLAY, as for an example the powerful EHP-200A.
TABLE 9-5 EHP-200A Electric and Magnetic Field Probe – Analyzer, main characteristics.
Field Probes Frequency range Level range
Electric field Magnetic field
Electric and Magnetic Field Analyzer
EHP-200A 9 kHz ÷ 30 MHz 0.02 V/m – 1000 V/m 0.6 mA/m – 300 A/m
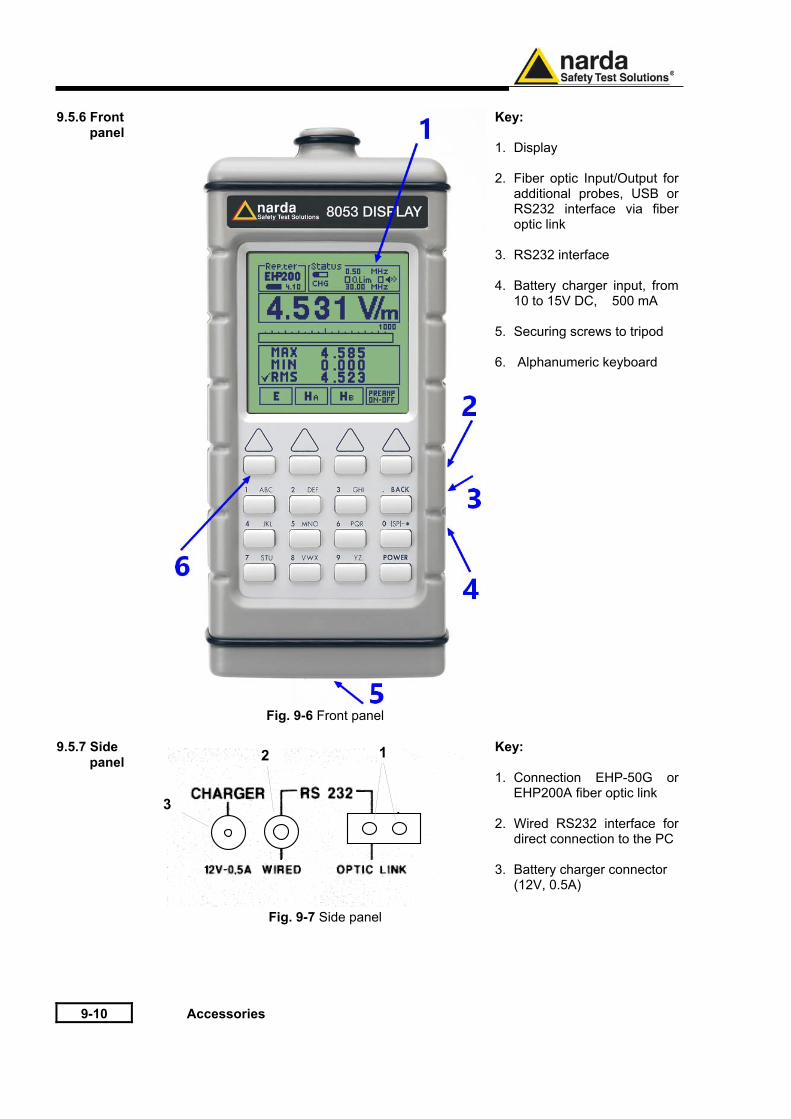
9-10 Accessories
9.5.6 Front panel
Fig. 9-6 Front panel
Key: 1. Display 2. Fiber optic Input/Output for
additional probes, USB or RS232 interface via fiber optic link
3. RS232 interface 4. Battery charger input, from
10 to 15V DC, 500 mA 5. Securing screws to tripod 6. Alphanumeric keyboard
9.5.7 Side panel
Fig. 9-7 Side panel
Key: 1. Connection EHP-50G or
EHP200A fiber optic link 2. Wired RS232 interface for
direct connection to the PC 3. Battery charger connector
(12V, 0.5A)
3
2 1
Accessories 9-11
9.5.8 Battery charger
The battery charger supplied with the meter can work at either 50 Hz or 60 Hz with a supply voltage range between 100 and 240 Volt. It is supplied with different connectors to the supply mains in accordance with the various national standards.
9.5.9 To substitute the mains connector
To substitute the mains connector, simply remove the one installed on the battery charger and replace it with the one that is in compliance with its use.
9.5.10 To check the internal batteries
If the internal batteries are to have the greatest autonomy, we recommend that a full recharging cycle be carried out before using the meter. To do this, go through the following procedure: • Connect the battery charger to the power socket • Link the output connector of the battery charger to the input
CHARGER on the side panel of the meter • 8053 DISPLAY will switch on automatically, after making a sound
produced by the internal buzzer, the display will be activated and the meter will start its auto-check and begin the procedure for recognising the probes.
• The main window will therefore be activated and the status of the charge (CHG) of the battery will be displayed in the STATUS box
Indications of the battery in the STATUS box:
The status of the charge of the battery is displayed in the top left-hand corner of the STATUS box. The symbol of a small battery will be filled up proportion to the status of the battery charge. The battery charger will be automatically stopped when one of the following occurs and a small connector will be displayed relating to a letter indicating the end of the recharging cycle. Display of the following letters means: V – The voltage of the batteries has reached 1.45 V/element (7.25 total),
and therefore the recharging cycle is complete. H – The recharging cycles has lasted for more than 4 hours. T – The temperature of the batteries, compared to the temperature stored
after ten minutes recharging, has increased more than 10 °C, or the temperature of the battery has reached 65 °C.
When the recharging cycle is finished, the 8053 DISPLAY is ready for use.
To avoid damage to the batteries, when the T symbol appears, the recharging cycle is stopped automatically. To finish the recharging cycle wait for about ten minutes for the batteries to cool down then reconnect the battery charger.
Battery charger: DC, 10 - 15 V, ~ 500 mA
Connector:+-
ALWAYS connect the battery charger to the mains power BEFORE connecting the DC output to 8053 DISPLAY. The battery charger has an internal protective circuit that will not let it work if there is a load connected to the battery charger before the connection to the mains is activated.
In order to safeguard the features of the batteries, it is crucial to have a complete recharge before storing them for periods longer than 4 months. Therefore, it is warmly suggested recharging the batteries at least every 4 months even though the device has not been used.
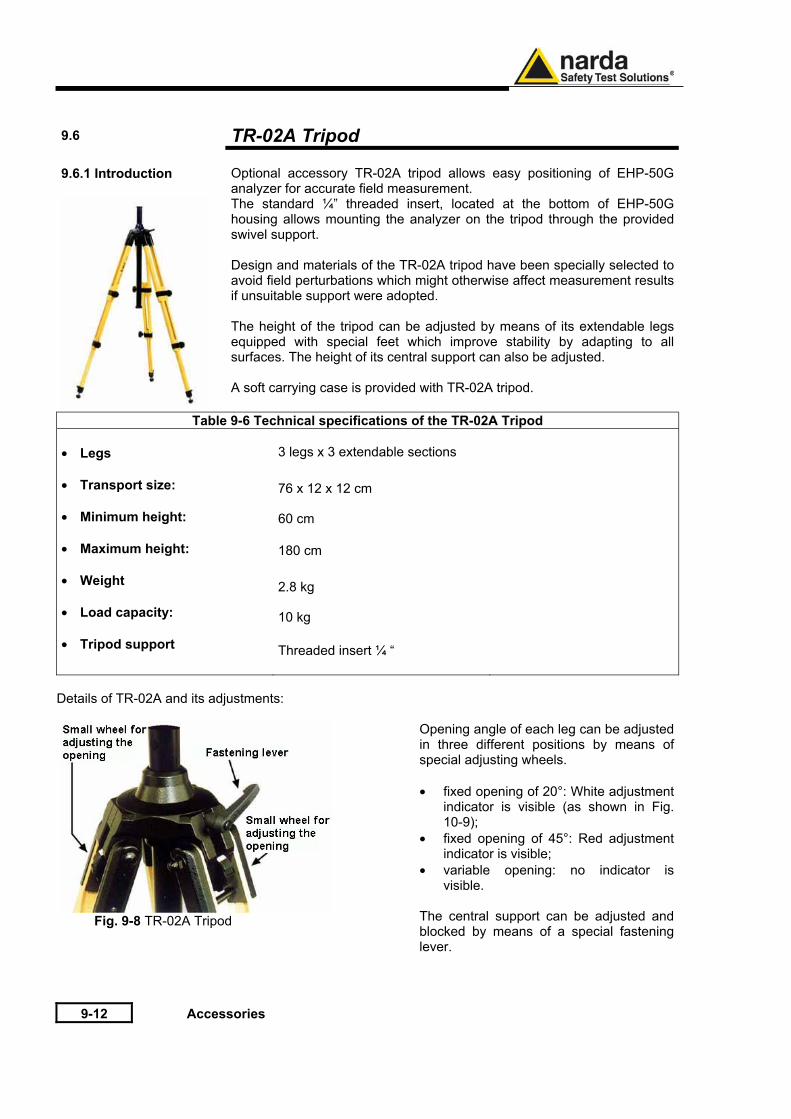
9-12 Accessories
9.6 TR-02A Tripod 9.6.1 Introduction
Optional accessory TR-02A tripod allows easy positioning of EHP-50G analyzer for accurate field measurement. The standard ¼” threaded insert, located at the bottom of EHP-50G housing allows mounting the analyzer on the tripod through the provided swivel support. Design and materials of the TR-02A tripod have been specially selected to avoid field perturbations which might otherwise affect measurement results if unsuitable support were adopted. The height of the tripod can be adjusted by means of its extendable legs equipped with special feet which improve stability by adapting to all surfaces. The height of its central support can also be adjusted. A soft carrying case is provided with TR-02A tripod.
Table 9-6 Technical specifications of the TR-02A Tripod • Legs • Transport size: • Minimum height: • Maximum height: • Weight • Load capacity: • Tripod support
3 legs x 3 extendable sections
76 x 12 x 12 cm
60 cm 180 cm
2.8 kg
10 kg Threaded insert ¼ “
Details of TR-02A and its adjustments:
Fig. 9-8 TR-02A Tripod
Opening angle of each leg can be adjusted in three different positions by means of special adjusting wheels. • fixed opening of 20°: White adjustment
indicator is visible (as shown in Fig. 10-9);
• fixed opening of 45°: Red adjustment indicator is visible;
• variable opening: no indicator is visible.
The central support can be adjusted and blocked by means of a special fastening lever.
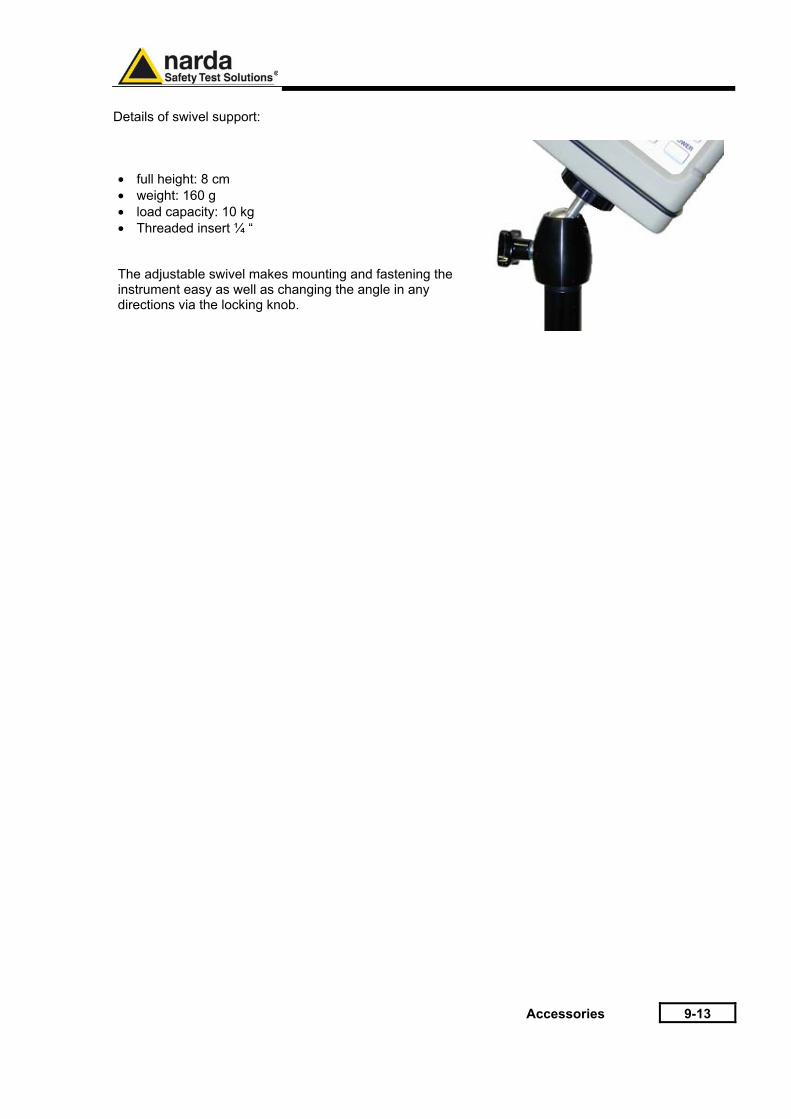
Accessories 9-13
Details of swivel support: • full height: 8 cm • weight: 160 g • load capacity: 10 kg • Threaded insert ¼ “ The adjustable swivel makes mounting and fastening the instrument easy as well as changing the angle in any directions via the locking knob.
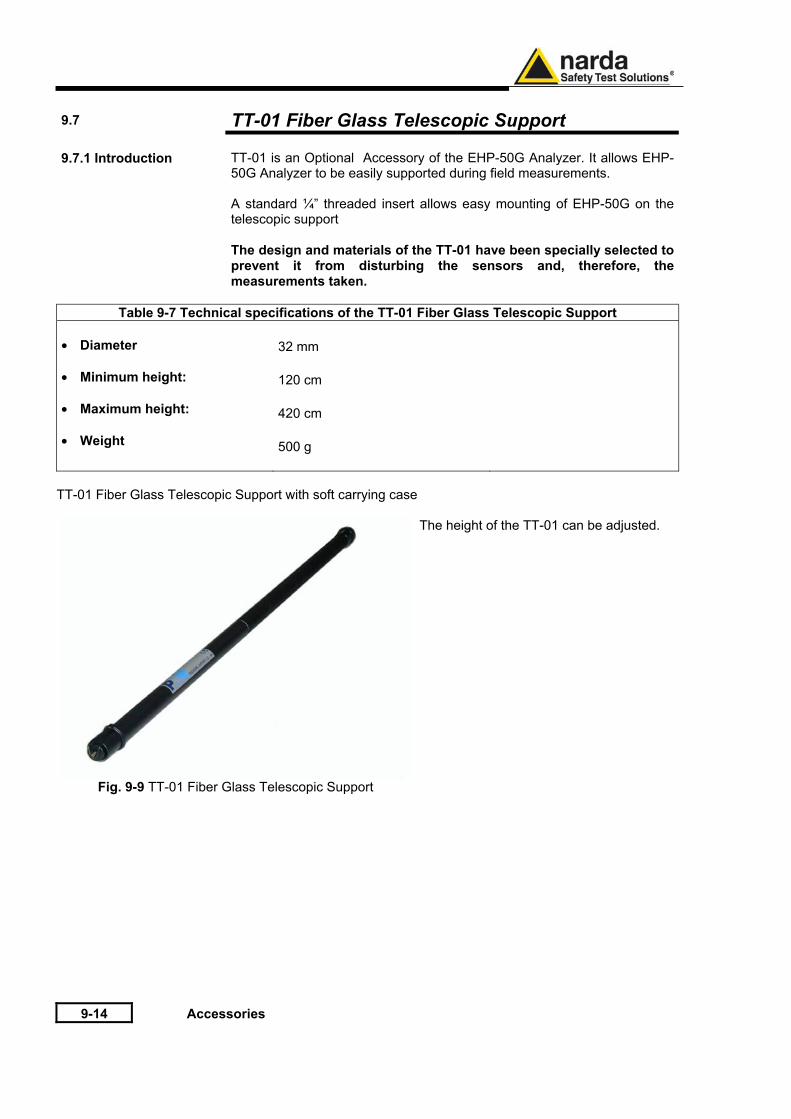
9-14 Accessories
9.7 TT-01 Fiber Glass Telescopic Support 9.7.1 Introduction
TT-01 is an Optional Accessory of the EHP-50G Analyzer. It allows EHP-50G Analyzer to be easily supported during field measurements. A standard ¼” threaded insert allows easy mounting of EHP-50G on the telescopic support The design and materials of the TT-01 have been specially selected to prevent it from disturbing the sensors and, therefore, the measurements taken.
Table 9-7 Technical specifications of the TT-01 Fiber Glass Telescopic Support • Diameter • Minimum height: • Maximum height: • Weight
32 mm 120 cm 420 cm 500 g
TT-01 Fiber Glass Telescopic Support with soft carrying case
Fig. 9-9 TT-01 Fiber Glass Telescopic Support
The height of the TT-01 can be adjusted.

Accessories 9-15
9.8 Other Accessories
Other Accessories are available on request with the EHP50G, such as: car adapter, 12 V battery charger and Internal AC Plug Adapter.

9-16 Accessories
This page has been left blank intentionally

NARDA Safety Test Solutions S.r.l. Socio Unico
Sales & Support: Via Leonardo da Vinci, 21/23 20090 Segrate (MI) - ITALY Tel.: +39 02 2699871 Fax: +39 02 26998700
Manufacturing Plant: Via Benessea, 29/B 17035 Cisano sul Neva (SV) Tel.: +39 0182 58641 Fax: +39 0182 586400
http://www.narda-sts.it Mod. 18-1
Caro cliente grazie per aver acquistato un prodotto NARDA! Sei in possesso di uno strumento che per molti anni ti garantirà un’alta qualità di servizio. NARDA riconosce l'importanza del Cliente come ragione di esistenza; ciascun commento e suggerimento, sottoposto all'attenzione della nostra organizzazione, è tenuto in grande considerazione. La nostra qualità è alla ricerca del miglioramento continuo. Se uno dei Suoi strumenti NARDA necessita di riparazione o calibrazione, può aiutarci a servirla più efficacemente compilando questa scheda e accludendola all’apparecchio. Tuttavia, anche questo prodotto diventerà obsoleto. In questo caso, ti ricordiamo che lo smaltimento dell'apparecchiatura deve essere fatto in conformità con i regolamenti locali. Questo prodotto è conforme alle direttive WEEE dell’Unione Europea (2002/96/EC) ed appartiene alla categoria 9 (strumenti di controllo). Lo smaltimento, in un ambiente adeguato, può avvenire anche attraverso la restituzione del prodotto alla NARDA senza sostenere alcuna spesa. Può ottenere ulteriori informazioni contattando i venditori NARDA o visitando il nostro sito Web www.narda-sts.it. Dear Customer thank you for purchasing a NARDA product! You now own a high-quality instrument that will give you many years of reliable service. NARDA recognizes the importance of the Customer as reason of existence; in this view, any comment and suggestion you would like to submit to the attention of our service organization is kept in great consideration. Moreover, we are continuously improving our quality, but we know this is a never ending process. We would be glad if our present efforts are pleasing you. Should one of your pieces of NARDA equipment need servicing you can help us serve you more effectively filling out this card and enclosing it with the product. Nevertheless, even this product will become obsolete. When that time comes, please remember that electronic equipment must be disposed of in accordance with local regulations. This product conforms to the WEEE Directive of the European Union (2002/96/EC) and belongs to Category 9 (Monitoring and Control Instruments). You can return the instrument to us free of charge for proper environment friendly disposal. You can obtain further information from your local NARDA Sales Partner or by visiting our website at www.narda-sts.it.
Servizio richiesto: Service needed:
Solo taratura Riparazione Riparazione & Taratura Taratura SIT Altro: Calibration only Repair Repair & Calibration Certified Calibration Other:
Ditta: Company:
Indirizzo: Address:
Persona da contattare: Telefono: Technical contact person: Phone n.
Modello: Numero di serie: Equipment model: Serial n.
Accessori ritornati con l’apparecchiatura: Nessuno Cavo(i) Cavo di alimentazione Altro: Accessories returned with unit: None Cable(s) Power cable Other:
Sintomi o problemi osservati: Observed symptoms / problems:
Guasto: Fisso Intermittente Sensibile a : Freddo Caldo Vibrazioni Altro Failure: Continuous Intermittent Sensitive to: Cold Heat Vibration Other
Descrizione del guasto/condizioni di funzionamento: Failure symptoms/special control settings description:
Se l’unità è parte di un sistema descriverne la configurazione: If unit is part of system please list other interconnected equipment and system set up:

Suggerimenti / Commenti / Note: Suggestions / Comments / Note: