Use of Well Logs for Petrophysical Evaluation of Abu Madi ... · Oil Company) achieved the first...
9
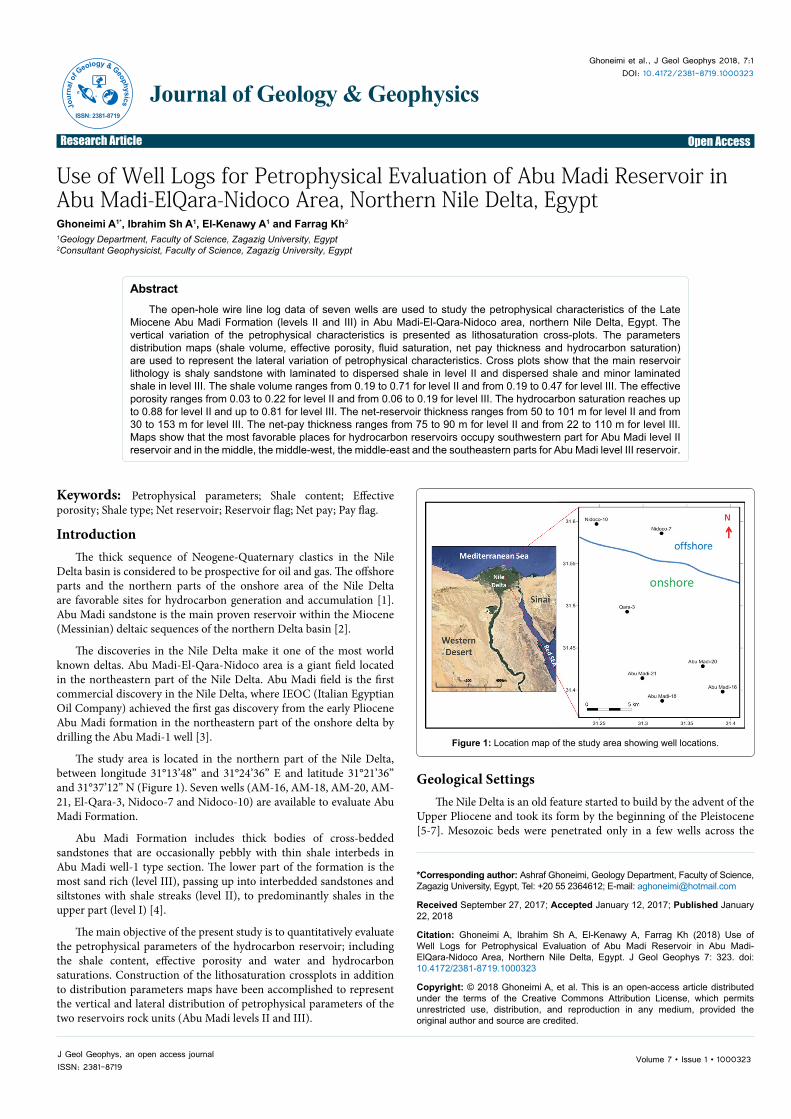
Ghoneimi et al., J Geol Geophys 2018, 7:1 DOI: 10.4172/2381-8719.1000323 Open Access Research Article J o u r n a l o f G e o l o g y & G e o p h y s i c s ISSN: 2381-8719 Journal of Geology & Geophysics Volume 7 • Issue 1 • 1000323 J Geol Geophys, an open access journal ISSN: 2381-8719 *Corresponding author: Ashraf Ghoneimi, Geology Department, Faculty of Science, Zagazig University, Egypt, Tel: +20 55 2364612; E-mail: [email protected] Received September 27, 2017; Accepted January 12, 2017; Published January 22, 2018 Citation: Ghoneimi A, Ibrahim Sh A, El-Kenawy A, Farrag Kh (2018) Use of Well Logs for Petrophysical Evaluation of Abu Madi Reservoir in Abu Madi- ElQara-Nidoco Area, Northern Nile Delta, Egypt. J Geol Geophys 7: 323. doi: 10.4172/2381-8719.1000323 Copyright: © 2018 Ghoneimi A, et al. This is an open-access article distributed under the terms of the Creative Commons Attribution License, which permits unrestricted use, distribution, and reproduction in any medium, provided the original author and source are credited. Keywords: Petrophysical parameters; Shale content; Effective porosity; Shale type; Net reservoir; Reservoir flag; Net pay; Pay flag. Introduction e thick sequence of Neogene-Quaternary clastics in the Nile Delta basin is considered to be prospective for oil and gas. e offshore parts and the northern parts of the onshore area of the Nile Delta are favorable sites for hydrocarbon generation and accumulation [1]. Abu Madi sandstone is the main proven reservoir within the Miocene (Messinian) deltaic sequences of the northern Delta basin [2]. e discoveries in the Nile Delta make it one of the most world known deltas. Abu Madi-El-Qara-Nidoco area is a giant field located in the northeastern part of the Nile Delta. Abu Madi field is the first commercial discovery in the Nile Delta, where IEOC (Italian Egyptian Oil Company) achieved the first gas discovery from the early Pliocene Abu Madi formation in the northeastern part of the onshore delta by drilling the Abu Madi-1 well [3]. e study area is located in the northern part of the Nile Delta, between longitude 31°13’48” and 31°24’36” E and latitude 31°21’36” and 31°37’12” N (Figure 1). Seven wells (AM-16, AM-18, AM-20, AM- 21, El-Qara-3, Nidoco-7 and Nidoco-10) are available to evaluate Abu Madi Formation. Abu Madi Formation includes thick bodies of cross-bedded sandstones that are occasionally pebbly with thin shale interbeds in Abu Madi well-1 type section. e lower part of the formation is the most sand rich (level III), passing up into interbedded sandstones and siltstones with shale streaks (level II), to predominantly shales in the upper part (level I) [4]. e main objective of the present study is to quantitatively evaluate the petrophysical parameters of the hydrocarbon reservoir; including the shale content, effective porosity and water and hydrocarbon saturations. Construction of the lithosaturation crossplots in addition to distribution parameters maps have been accomplished to represent the vertical and lateral distribution of petrophysical parameters of the two reservoirs rock units (Abu Madi levels II and III). Abstract The open-hole wire line log data of seven wells are used to study the petrophysical characteristics of the Late Miocene Abu Madi Formation (levels II and III) in Abu Madi-El-Qara-Nidoco area, northern Nile Delta, Egypt. The vertical variation of the petrophysical characteristics is presented as lithosaturation cross-plots. The parameters distribution maps (shale volume, effective porosity, fluid saturation, net pay thickness and hydrocarbon saturation) are used to represent the lateral variation of petrophysical characteristics. Cross plots show that the main reservoir lithology is shaly sandstone with laminated to dispersed shale in level II and dispersed shale and minor laminated shale in level III. The shale volume ranges from 0.19 to 0.71 for level II and from 0.19 to 0.47 for level III. The effective porosity ranges from 0.03 to 0.22 for level II and from 0.06 to 0.19 for level III. The hydrocarbon saturation reaches up to 0.88 for level II and up to 0.81 for level III. The net-reservoir thickness ranges from 50 to 101 m for level II and from 30 to 153 m for level III. The net-pay thickness ranges from 75 to 90 m for level II and from 22 to 110 m for level III. Maps show that the most favorable places for hydrocarbon reservoirs occupy southwestern part for Abu Madi level II reservoir and in the middle, the middle-west, the middle-east and the southeastern parts for Abu Madi level III reservoir. Use of Well Logs for Petrophysical Evaluation of Abu Madi Reservoir in Abu Madi-ElQara-Nidoco Area, Northern Nile Delta, Egypt Ghoneimi A 1* , Ibrahim Sh A 1 , El-Kenawy A 1 and Farrag Kh 2 1 Geology Department, Faculty of Science, Zagazig University, Egypt 2 Consultant Geophysicist, Faculty of Science, Zagazig University, Egypt Geological Settings e Nile Delta is an old feature started to build by the advent of the Upper Pliocene and took its form by the beginning of the Pleistocene [5-7]. Mesozoic beds were penetrated only in a few wells across the Figure 1: Location map of the study area showing well locations.
Transcript of Use of Well Logs for Petrophysical Evaluation of Abu Madi ... · Oil Company) achieved the first...
Ghoneimi et al., J Geol Geophys 2018, 7:1DOI: 10.4172/2381-8719.1000323
Open AccessResearch Article
Jour
nal o
f Geology & Geophysics
ISSN: 2381-8719
Journal of Geology & Geophysics
Volume 7 • Issue 1 • 1000323J Geol Geophys, an open access journalISSN: 2381-8719
*Corresponding author: Ashraf Ghoneimi, Geology Department, Faculty of Science, Zagazig University, Egypt, Tel: +20 55 2364612; E-mail: [email protected]
Received September 27, 2017; Accepted January 12, 2017; Published January 22, 2018
Citation: Ghoneimi A, Ibrahim Sh A, El-Kenawy A, Farrag Kh (2018) Use of Well Logs for Petrophysical Evaluation of Abu Madi Reservoir in Abu Madi-ElQara-Nidoco Area, Northern Nile Delta, Egypt. J Geol Geophys 7: 323. doi: 10.4172/2381-8719.1000323
Copyright: © 2018 Ghoneimi A, et al. This is an open-access article distributed under the terms of the Creative Commons Attribution License, which permits unrestricted use, distribution, and reproduction in any medium, provided the original author and source are credited.
Keywords: Petrophysical parameters; Shale content; Effective porosity; Shale type; Net reservoir; Reservoir flag; Net pay; Pay flag.
IntroductionThe thick sequence of Neogene-Quaternary clastics in the Nile
Delta basin is considered to be prospective for oil and gas. The offshore parts and the northern parts of the onshore area of the Nile Delta are favorable sites for hydrocarbon generation and accumulation [1]. Abu Madi sandstone is the main proven reservoir within the Miocene (Messinian) deltaic sequences of the northern Delta basin [2].
The discoveries in the Nile Delta make it one of the most world known deltas. Abu Madi-El-Qara-Nidoco area is a giant field located in the northeastern part of the Nile Delta. Abu Madi field is the first commercial discovery in the Nile Delta, where IEOC (Italian Egyptian Oil Company) achieved the first gas discovery from the early Pliocene Abu Madi formation in the northeastern part of the onshore delta by drilling the Abu Madi-1 well [3].
The study area is located in the northern part of the Nile Delta, between longitude 31°13’48” and 31°24’36” E and latitude 31°21’36” and 31°37’12” N (Figure 1). Seven wells (AM-16, AM-18, AM-20, AM-21, El-Qara-3, Nidoco-7 and Nidoco-10) are available to evaluate Abu Madi Formation.
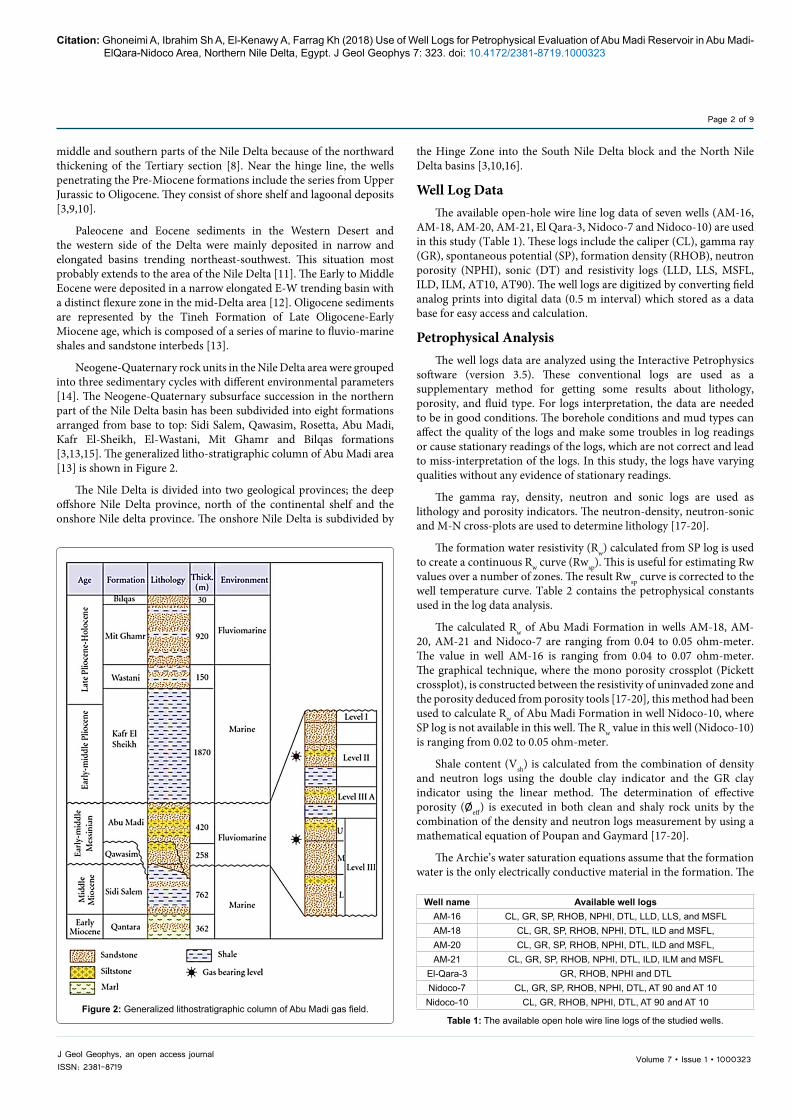
Abu Madi Formation includes thick bodies of cross-bedded sandstones that are occasionally pebbly with thin shale interbeds in Abu Madi well-1 type section. The lower part of the formation is the most sand rich (level III), passing up into interbedded sandstones and siltstones with shale streaks (level II), to predominantly shales in the upper part (level I) [4].
The main objective of the present study is to quantitatively evaluate the petrophysical parameters of the hydrocarbon reservoir; including the shale content, effective porosity and water and hydrocarbon saturations. Construction of the lithosaturation crossplots in addition to distribution parameters maps have been accomplished to represent the vertical and lateral distribution of petrophysical parameters of the two reservoirs rock units (Abu Madi levels II and III).
Abstract The open-hole wire line log data of seven wells are used to study the petrophysical characteristics of the Late
Miocene Abu Madi Formation (levels II and III) in Abu Madi-El-Qara-Nidoco area, northern Nile Delta, Egypt. The vertical variation of the petrophysical characteristics is presented as lithosaturation cross-plots. The parameters distribution maps (shale volume, effective porosity, fluid saturation, net pay thickness and hydrocarbon saturation) are used to represent the lateral variation of petrophysical characteristics. Cross plots show that the main reservoir lithology is shaly sandstone with laminated to dispersed shale in level II and dispersed shale and minor laminated shale in level III. The shale volume ranges from 0.19 to 0.71 for level II and from 0.19 to 0.47 for level III. The effective porosity ranges from 0.03 to 0.22 for level II and from 0.06 to 0.19 for level III. The hydrocarbon saturation reaches up to 0.88 for level II and up to 0.81 for level III. The net-reservoir thickness ranges from 50 to 101 m for level II and from 30 to 153 m for level III. The net-pay thickness ranges from 75 to 90 m for level II and from 22 to 110 m for level III. Maps show that the most favorable places for hydrocarbon reservoirs occupy southwestern part for Abu Madi level II reservoir and in the middle, the middle-west, the middle-east and the southeastern parts for Abu Madi level III reservoir.
Use of Well Logs for Petrophysical Evaluation of Abu Madi Reservoir in Abu Madi-ElQara-Nidoco Area, Northern Nile Delta, EgyptGhoneimi A1*, Ibrahim Sh A1, El-Kenawy A1 and Farrag Kh2
1Geology Department, Faculty of Science, Zagazig University, Egypt2Consultant Geophysicist, Faculty of Science, Zagazig University, Egypt
Geological SettingsThe Nile Delta is an old feature started to build by the advent of the
Upper Pliocene and took its form by the beginning of the Pleistocene [5-7]. Mesozoic beds were penetrated only in a few wells across the
Figure 1: Location map of the study area showing well locations.
Citation: Ghoneimi A, Ibrahim Sh A, El-Kenawy A, Farrag Kh (2018) Use of Well Logs for Petrophysical Evaluation of Abu Madi Reservoir in Abu Madi-ElQara-Nidoco Area, Northern Nile Delta, Egypt. J Geol Geophys 7: 323. doi: 10.4172/2381-8719.1000323
Page 2 of 9
Volume 7 • Issue 1 • 1000323J Geol Geophys, an open access journalISSN: 2381-8719
the Hinge Zone into the South Nile Delta block and the North Nile Delta basins [3,10,16].
Well Log DataThe available open-hole wire line log data of seven wells (AM-16,
AM-18, AM-20, AM-21, El Qara-3, Nidoco-7 and Nidoco-10) are used in this study (Table 1). These logs include the caliper (CL), gamma ray (GR), spontaneous potential (SP), formation density (RHOB), neutron porosity (NPHI), sonic (DT) and resistivity logs (LLD, LLS, MSFL, ILD, ILM, AT10, AT90). The well logs are digitized by converting field analog prints into digital data (0.5 m interval) which stored as a data base for easy access and calculation.
Petrophysical Analysis The well logs data are analyzed using the Interactive Petrophysics
software (version 3.5). These conventional logs are used as a supplementary method for getting some results about lithology, porosity, and fluid type. For logs interpretation, the data are needed to be in good conditions. The borehole conditions and mud types can affect the quality of the logs and make some troubles in log readings or cause stationary readings of the logs, which are not correct and lead to miss-interpretation of the logs. In this study, the logs have varying qualities without any evidence of stationary readings.
The gamma ray, density, neutron and sonic logs are used as lithology and porosity indicators. The neutron-density, neutron-sonic and M-N cross-plots are used to determine lithology [17-20].
The formation water resistivity (Rw) calculated from SP log is used to create a continuous Rw curve (Rwsp). This is useful for estimating Rw values over a number of zones. The result Rwsp curve is corrected to the well temperature curve. Table 2 contains the petrophysical constants used in the log data analysis.
The calculated Rw of Abu Madi Formation in wells AM-18, AM-20, AM-21 and Nidoco-7 are ranging from 0.04 to 0.05 ohm-meter. The value in well AM-16 is ranging from 0.04 to 0.07 ohm-meter. The graphical technique, where the mono porosity crossplot (Pickett crossplot), is constructed between the resistivity of uninvaded zone and the porosity deduced from porosity tools [17-20], this method had been used to calculate Rw of Abu Madi Formation in well Nidoco-10, where SP log is not available in this well. The Rw value in this well (Nidoco-10) is ranging from 0.02 to 0.05 ohm-meter.
Shale content (Vsh) is calculated from the combination of density and neutron logs using the double clay indicator and the GR clay indicator using the linear method. The determination of effective porosity (Øeff) is executed in both clean and shaly rock units by the combination of the density and neutron logs measurement by using a mathematical equation of Poupan and Gaymard [17-20].
The Archie’s water saturation equations assume that the formation water is the only electrically conductive material in the formation. The
middle and southern parts of the Nile Delta because of the northward thickening of the Tertiary section [8]. Near the hinge line, the wells penetrating the Pre-Miocene formations include the series from Upper Jurassic to Oligocene. They consist of shore shelf and lagoonal deposits [3,9,10].
Paleocene and Eocene sediments in the Western Desert and the western side of the Delta were mainly deposited in narrow and elongated basins trending northeast-southwest. This situation most probably extends to the area of the Nile Delta [11]. The Early to Middle Eocene were deposited in a narrow elongated E-W trending basin with a distinct flexure zone in the mid-Delta area [12]. Oligocene sediments are represented by the Tineh Formation of Late Oligocene-Early Miocene age, which is composed of a series of marine to fluvio-marine shales and sandstone interbeds [13].
Neogene-Quaternary rock units in the Nile Delta area were grouped into three sedimentary cycles with different environmental parameters [14]. The Neogene-Quaternary subsurface succession in the northern part of the Nile Delta basin has been subdivided into eight formations arranged from base to top: Sidi Salem, Qawasim, Rosetta, Abu Madi, Kafr El-Sheikh, El-Wastani, Mit Ghamr and Bilqas formations [3,13,15]. The generalized litho-stratigraphic column of Abu Madi area [13] is shown in Figure 2.
The Nile Delta is divided into two geological provinces; the deep offshore Nile Delta province, north of the continental shelf and the onshore Nile delta province. The onshore Nile Delta is subdivided by
Figure 2: Generalized lithostratigraphic column of Abu Madi gas field.
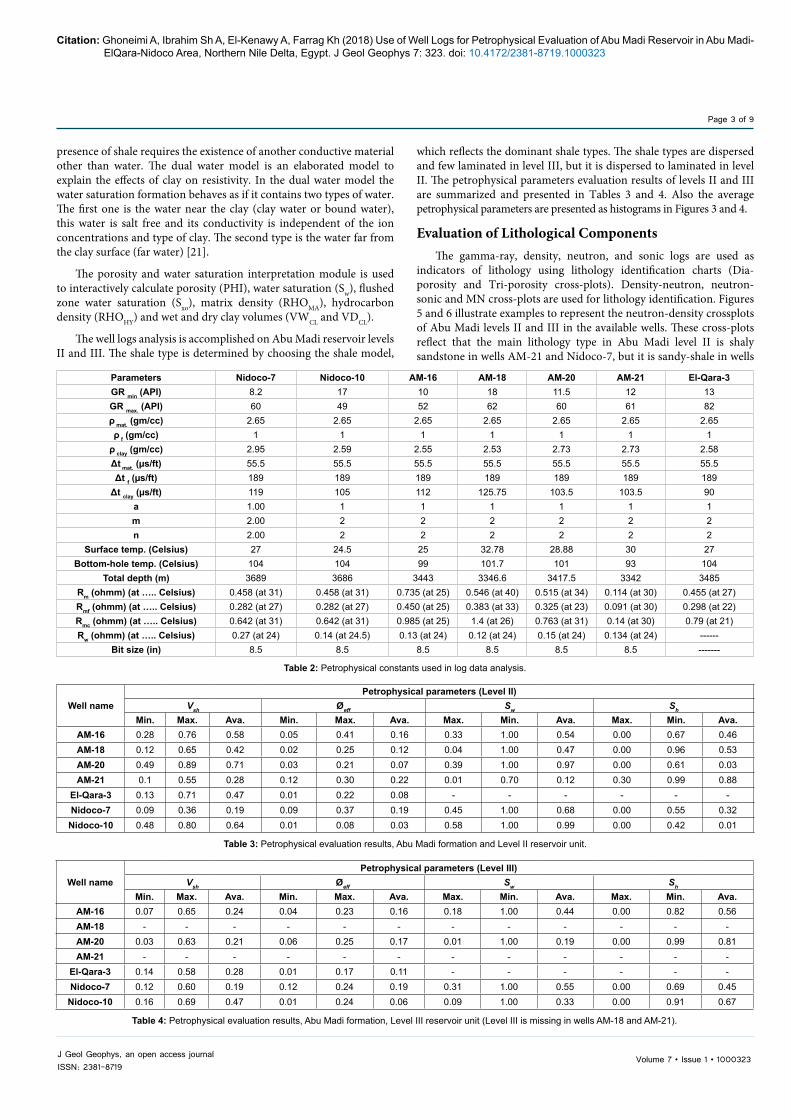
Well name Available well logsAM-16 CL, GR, SP, RHOB, NPHI, DTL, LLD, LLS, and MSFL AM-18 CL, GR, SP, RHOB, NPHI, DTL, ILD and MSFL, AM-20 CL, GR, SP, RHOB, NPHI, DTL, ILD and MSFL, AM-21 CL, GR, SP, RHOB, NPHI, DTL, ILD, ILM and MSFL
El-Qara-3 GR, RHOB, NPHI and DTLNidoco-7 CL, GR, SP, RHOB, NPHI, DTL, AT 90 and AT 10 Nidoco-10 CL, GR, RHOB, NPHI, DTL, AT 90 and AT 10
Table 1: The available open hole wire line logs of the studied wells.
Citation: Ghoneimi A, Ibrahim Sh A, El-Kenawy A, Farrag Kh (2018) Use of Well Logs for Petrophysical Evaluation of Abu Madi Reservoir in Abu Madi-ElQara-Nidoco Area, Northern Nile Delta, Egypt. J Geol Geophys 7: 323. doi: 10.4172/2381-8719.1000323
Page 3 of 9
Volume 7 • Issue 1 • 1000323J Geol Geophys, an open access journalISSN: 2381-8719
presence of shale requires the existence of another conductive material other than water. The dual water model is an elaborated model to explain the effects of clay on resistivity. In the dual water model the water saturation formation behaves as if it contains two types of water. The first one is the water near the clay (clay water or bound water), this water is salt free and its conductivity is independent of the ion concentrations and type of clay. The second type is the water far from the clay surface (far water) [21].
The porosity and water saturation interpretation module is used to interactively calculate porosity (PHI), water saturation (Sw), flushed zone water saturation (Sxo), matrix density (RHOMA), hydrocarbon density (RHOHY) and wet and dry clay volumes (VWCL and VDCL).
The well logs analysis is accomplished on Abu Madi reservoir levels II and III. The shale type is determined by choosing the shale model,
which reflects the dominant shale types. The shale types are dispersed and few laminated in level III, but it is dispersed to laminated in level II. The petrophysical parameters evaluation results of levels II and III are summarized and presented in Tables 3 and 4. Also the average petrophysical parameters are presented as histograms in Figures 3 and 4.
Evaluation of Lithological ComponentsThe gamma-ray, density, neutron, and sonic logs are used as
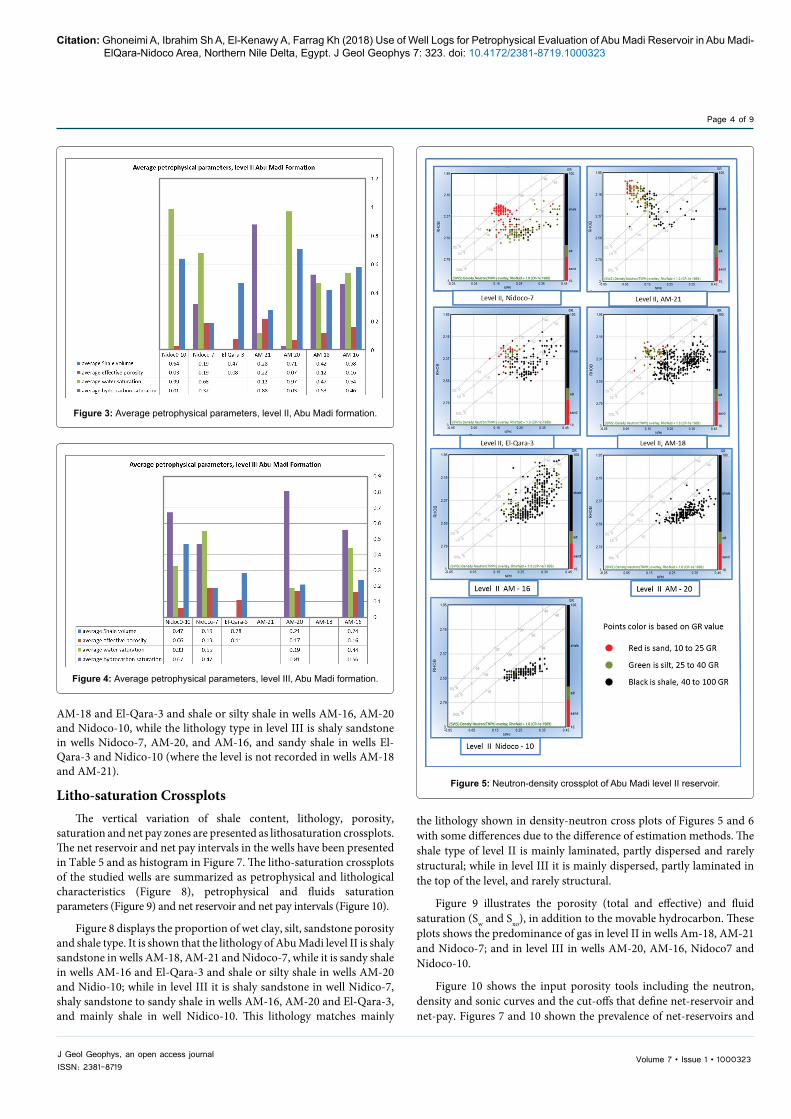
indicators of lithology using lithology identification charts (Dia-porosity and Tri-porosity cross-plots). Density-neutron, neutron-sonic and MN cross-plots are used for lithology identification. Figures 5 and 6 illustrate examples to represent the neutron-density crossplots of Abu Madi levels II and III in the available wells. These cross-plots reflect that the main lithology type in Abu Madi level II is shaly sandstone in wells AM-21 and Nidoco-7, but it is sandy-shale in wells
Parameters Nidoco-7 Nidoco-10 AM-16 AM-18 AM-20 AM-21 El-Qara-3GR min (API) 8.2 17 10 18 11.5 12 13GR max. (API) 60 49 52 62 60 61 82ρ mat. (gm/cc) 2.65 2.65 2.65 2.65 2.65 2.65 2.65ρ f (gm/cc) 1 1 1 1 1 1 1
ρ clay (gm/cc) 2.95 2.59 2.55 2.53 2.73 2.73 2.58Δt mat. (µs/ft) 55.5 55.5 55.5 55.5 55.5 55.5 55.5Δt f (µs/ft) 189 189 189 189 189 189 189
Δt clay (µs/ft) 119 105 112 125.75 103.5 103.5 90a 1.00 1 1 1 1 1 1m 2.00 2 2 2 2 2 2n 2.00 2 2 2 2 2 2
Surface temp. (Celsius) 27 24.5 25 32.78 28.88 30 27Bottom-hole temp. (Celsius) 104 104 99 101.7 101 93 104
Total depth (m) 3689 3686 3443 3346.6 3417.5 3342 3485Rm (ohmm) (at ….. Celsius) 0.458 (at 31) 0.458 (at 31) 0.735 (at 25) 0.546 (at 40) 0.515 (at 34) 0.114 (at 30) 0.455 (at 27)Rmf (ohmm) (at ….. Celsius) 0.282 (at 27) 0.282 (at 27) 0.450 (at 25) 0.383 (at 33) 0.325 (at 23) 0.091 (at 30) 0.298 (at 22)Rmc (ohmm) (at ….. Celsius) 0.642 (at 31) 0.642 (at 31) 0.985 (at 25) 1.4 (at 26) 0.763 (at 31) 0.14 (at 30) 0.79 (at 21)Rw (ohmm) (at ….. Celsius) 0.27 (at 24) 0.14 (at 24.5) 0.13 (at 24) 0.12 (at 24) 0.15 (at 24) 0.134 (at 24) ------
Bit size (in) 8.5 8.5 8.5 8.5 8.5 8.5 -------
Table 2: Petrophysical constants used in log data analysis.
Well namePetrophysical parameters (Level II)
Vsh Øeff Sw Sh
Min. Max. Ava. Min. Max. Ava. Max. Min. Ava. Max. Min. Ava.AM-16 0.28 0.76 0.58 0.05 0.41 0.16 0.33 1.00 0.54 0.00 0.67 0.46AM-18 0.12 0.65 0.42 0.02 0.25 0.12 0.04 1.00 0.47 0.00 0.96 0.53AM-20 0.49 0.89 0.71 0.03 0.21 0.07 0.39 1.00 0.97 0.00 0.61 0.03AM-21 0.1 0.55 0.28 0.12 0.30 0.22 0.01 0.70 0.12 0.30 0.99 0.88
El-Qara-3 0.13 0.71 0.47 0.01 0.22 0.08 - - - - - -Nidoco-7 0.09 0.36 0.19 0.09 0.37 0.19 0.45 1.00 0.68 0.00 0.55 0.32
Nidoco-10 0.48 0.80 0.64 0.01 0.08 0.03 0.58 1.00 0.99 0.00 0.42 0.01
Table 3: Petrophysical evaluation results, Abu Madi formation and Level II reservoir unit.
Well namePetrophysical parameters (Level III)
Vsh Øeff Sw Sh
Min. Max. Ava. Min. Max. Ava. Max. Min. Ava. Max. Min. Ava.AM-16 0.07 0.65 0.24 0.04 0.23 0.16 0.18 1.00 0.44 0.00 0.82 0.56AM-18 - - - - - - - - - - - -AM-20 0.03 0.63 0.21 0.06 0.25 0.17 0.01 1.00 0.19 0.00 0.99 0.81AM-21 - - - - - - - - - - - -
El-Qara-3 0.14 0.58 0.28 0.01 0.17 0.11 - - - - - -Nidoco-7 0.12 0.60 0.19 0.12 0.24 0.19 0.31 1.00 0.55 0.00 0.69 0.45
Nidoco-10 0.16 0.69 0.47 0.01 0.24 0.06 0.09 1.00 0.33 0.00 0.91 0.67
Table 4: Petrophysical evaluation results, Abu Madi formation, Level III reservoir unit (Level III is missing in wells AM-18 and AM-21).
Citation: Ghoneimi A, Ibrahim Sh A, El-Kenawy A, Farrag Kh (2018) Use of Well Logs for Petrophysical Evaluation of Abu Madi Reservoir in Abu Madi-ElQara-Nidoco Area, Northern Nile Delta, Egypt. J Geol Geophys 7: 323. doi: 10.4172/2381-8719.1000323
Page 4 of 9
Volume 7 • Issue 1 • 1000323J Geol Geophys, an open access journalISSN: 2381-8719
the lithology shown in density-neutron cross plots of Figures 5 and 6 with some differences due to the difference of estimation methods. The shale type of level II is mainly laminated, partly dispersed and rarely structural; while in level III it is mainly dispersed, partly laminated in the top of the level, and rarely structural.
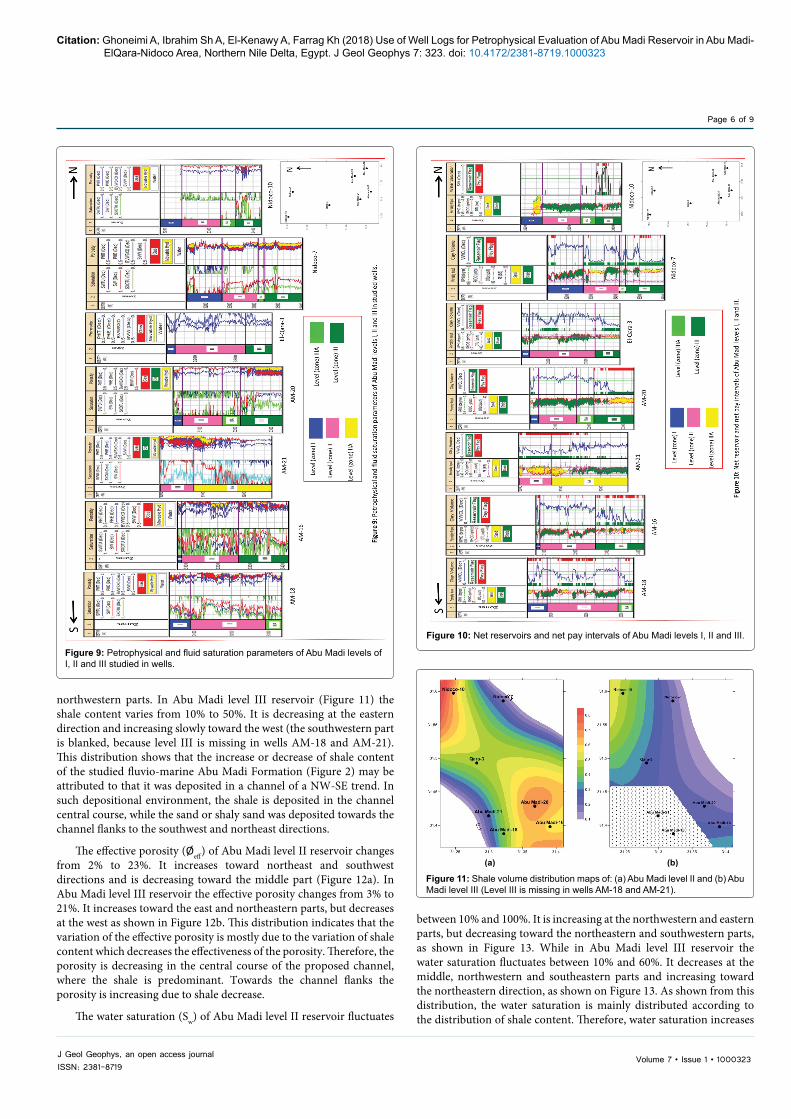
Figure 9 illustrates the porosity (total and effective) and fluid saturation (Sw and Sxo), in addition to the movable hydrocarbon. These plots shows the predominance of gas in level II in wells Am-18, AM-21 and Nidoco-7; and in level III in wells AM-20, AM-16, Nidoco7 and Nidoco-10.
Figure 10 shows the input porosity tools including the neutron, density and sonic curves and the cut-offs that define net-reservoir and net-pay. Figures 7 and 10 shown the prevalence of net-reservoirs and
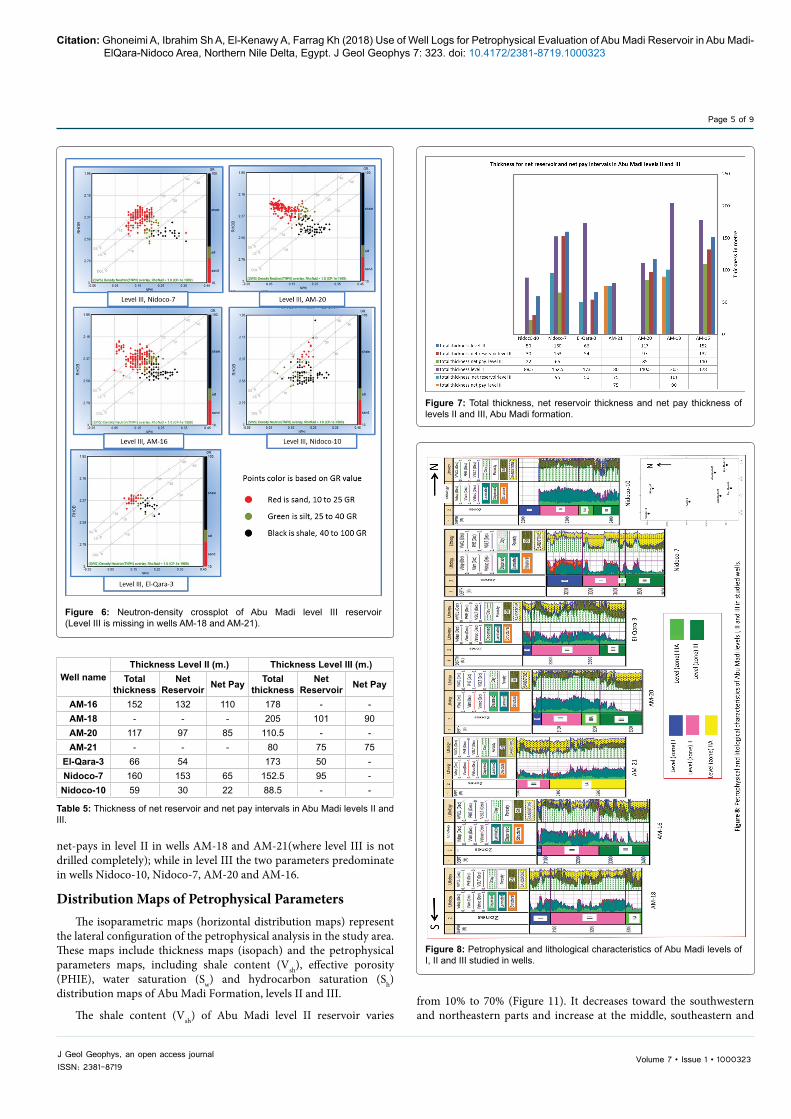
AM-18 and El-Qara-3 and shale or silty shale in wells AM-16, AM-20 and Nidoco-10, while the lithology type in level III is shaly sandstone in wells Nidoco-7, AM-20, and AM-16, and sandy shale in wells El-Qara-3 and Nidico-10 (where the level is not recorded in wells AM-18 and AM-21).
Litho-saturation CrossplotsThe vertical variation of shale content, lithology, porosity,
saturation and net pay zones are presented as lithosaturation crossplots. The net reservoir and net pay intervals in the wells have been presented in Table 5 and as histogram in Figure 7. The litho-saturation crossplots of the studied wells are summarized as petrophysical and lithological characteristics (Figure 8), petrophysical and fluids saturation parameters (Figure 9) and net reservoir and net pay intervals (Figure 10).
Figure 8 displays the proportion of wet clay, silt, sandstone porosity and shale type. It is shown that the lithology of Abu Madi level II is shaly sandstone in wells AM-18, AM-21 and Nidoco-7, while it is sandy shale in wells AM-16 and El-Qara-3 and shale or silty shale in wells AM-20 and Nidio-10; while in level III it is shaly sandstone in well Nidico-7, shaly sandstone to sandy shale in wells AM-16, AM-20 and El-Qara-3, and mainly shale in well Nidico-10. This lithology matches mainly
Figure 3: Average petrophysical parameters, level II, Abu Madi formation.
Figure 4: Average petrophysical parameters, level III, Abu Madi formation.
Figure 5: Neutron-density crossplot of Abu Madi level II reservoir.
Citation: Ghoneimi A, Ibrahim Sh A, El-Kenawy A, Farrag Kh (2018) Use of Well Logs for Petrophysical Evaluation of Abu Madi Reservoir in Abu Madi-ElQara-Nidoco Area, Northern Nile Delta, Egypt. J Geol Geophys 7: 323. doi: 10.4172/2381-8719.1000323
Page 5 of 9
Volume 7 • Issue 1 • 1000323J Geol Geophys, an open access journalISSN: 2381-8719
net-pays in level II in wells AM-18 and AM-21(where level III is not drilled completely); while in level III the two parameters predominate in wells Nidoco-10, Nidoco-7, AM-20 and AM-16.
Distribution Maps of Petrophysical ParametersThe isoparametric maps (horizontal distribution maps) represent
the lateral configuration of the petrophysical analysis in the study area. These maps include thickness maps (isopach) and the petrophysical parameters maps, including shale content (Vsh), effective porosity (PHIE), water saturation (Sw) and hydrocarbon saturation (Sh) distribution maps of Abu Madi Formation, levels II and III.
The shale content (Vsh) of Abu Madi level II reservoir varies from 10% to 70% (Figure 11). It decreases toward the southwestern and northeastern parts and increase at the middle, southeastern and
Figure 6: Neutron-density crossplot of Abu Madi level III reservoir (Level III is missing in wells AM-18 and AM-21).
Figure 7: Total thickness, net reservoir thickness and net pay thickness of levels II and III, Abu Madi formation.
Figure 8: Petrophysical and lithological characteristics of Abu Madi levels of I, II and III studied in wells.
Well nameThickness Level II (m.) Thickness Level III (m.)
Total thickness
Net Reservoir Net Pay Total
thicknessNet
Reservoir Net Pay
AM-16 152 132 110 178 - -AM-18 - - - 205 101 90AM-20 117 97 85 110.5 - -AM-21 - - - 80 75 75
El-Qara-3 66 54 173 50 -Nidoco-7 160 153 65 152.5 95 -Nidoco-10 59 30 22 88.5 - -
Table 5: Thickness of net reservoir and net pay intervals in Abu Madi levels II and III.
Citation: Ghoneimi A, Ibrahim Sh A, El-Kenawy A, Farrag Kh (2018) Use of Well Logs for Petrophysical Evaluation of Abu Madi Reservoir in Abu Madi-ElQara-Nidoco Area, Northern Nile Delta, Egypt. J Geol Geophys 7: 323. doi: 10.4172/2381-8719.1000323
Page 6 of 9
Volume 7 • Issue 1 • 1000323J Geol Geophys, an open access journalISSN: 2381-8719
northwestern parts. In Abu Madi level III reservoir (Figure 11) the shale content varies from 10% to 50%. It is decreasing at the eastern direction and increasing slowly toward the west (the southwestern part is blanked, because level III is missing in wells AM-18 and AM-21). This distribution shows that the increase or decrease of shale content of the studied fluvio-marine Abu Madi Formation (Figure 2) may be attributed to that it was deposited in a channel of a NW-SE trend. In such depositional environment, the shale is deposited in the channel central course, while the sand or shaly sand was deposited towards the channel flanks to the southwest and northeast directions.
The effective porosity (Øeff) of Abu Madi level II reservoir changes from 2% to 23%. It increases toward northeast and southwest directions and is decreasing toward the middle part (Figure 12a). In Abu Madi level III reservoir the effective porosity changes from 3% to 21%. It increases toward the east and northeastern parts, but decreases at the west as shown in Figure 12b. This distribution indicates that the variation of the effective porosity is mostly due to the variation of shale content which decreases the effectiveness of the porosity. Therefore, the porosity is decreasing in the central course of the proposed channel, where the shale is predominant. Towards the channel flanks the porosity is increasing due to shale decrease.
The water saturation (Sw) of Abu Madi level II reservoir fluctuates
between 10% and 100%. It is increasing at the northwestern and eastern parts, but decreasing toward the northeastern and southwestern parts, as shown in Figure 13. While in Abu Madi level III reservoir the water saturation fluctuates between 10% and 60%. It decreases at the middle, northwestern and southeastern parts and increasing toward the northeastern direction, as shown on Figure 13. As shown from this distribution, the water saturation is mainly distributed according to the distribution of shale content. Therefore, water saturation increases
Figure 9: Petrophysical and fluid saturation parameters of Abu Madi levels of I, II and III studied in wells.
Figure 10: Net reservoirs and net pay intervals of Abu Madi levels I, II and III.
(a) (b)
Figure 11: Shale volume distribution maps of: (a) Abu Madi level II and (b) Abu Madi level III (Level III is missing in wells AM-18 and AM-21).

Citation: Ghoneimi A, Ibrahim Sh A, El-Kenawy A, Farrag Kh (2018) Use of Well Logs for Petrophysical Evaluation of Abu Madi Reservoir in Abu Madi-ElQara-Nidoco Area, Northern Nile Delta, Egypt. J Geol Geophys 7: 323. doi: 10.4172/2381-8719.1000323
Page 7 of 9
Volume 7 • Issue 1 • 1000323J Geol Geophys, an open access journalISSN: 2381-8719
at locations where the shale content increases at the channel central course.
The hydrocarbon saturation (Sh) of Abu Madi level II reservoir varies from 1% to 90%. It is decreasing at eastern and northwestern parts and is increasing toward northeastern and southwestern parts, as shown in Figure 14a. In Abu Madi level III reservoir varies from 4% to 90%. It increases at southeastern, middle and northwestern parts, but it is decreasing in the northeastern direction, as shown in Figure 14b. The predominance of hydrocarbon largely distributed at the flanks of the proposed channel where both the shale content and water saturation decrease and the effective porosity increases.
The total thickness of Abu Madi level II (Figure 15a) varies from about 105 m to 270 m. It increases toward the southwestern and northeastern directions (reaches 270 m in well AM-21 and 155 m in well Nidoco-7), then it is decreasing toward the middle, northwestern and southeastern directions (reaches 90 m in well Nidoco-10 and 110 m in well AM-20, but it is increasing again in that direction, reaching to 175 m in well AM-16). The total thickness of Abu Madi level III varies from 0 to 160 m. It is decreasing toward the southwestern direction (where it is missing in wells AM-18 and AM-21), then the thickness increases gradually toward the middle, southeastern, northwestern and northeastern directions (Figure 15b). It is noteworthy that the total thickness of Abu Madi Formation decreases at places where it must increase (in the channel course), but this may be attributed to erosion
of sediments, which may be proven by the unconformity surface at the top of Abu Madi Formation (Figure 2).
The net reservoir (reservoir flag) thickness of level II (Figure 16a) varies from 0 to 150 m. It increases at northeastern and southwestern directions (reaching 140 m in well AM-21 and 100 m in well Ndoco-7) and at the middle part the thickness reaches 35 m in well El-Qara-3. In the northwestern and southeastern direction the thickness of the net reservoir reaches to zero m, where the lithology of level II in wells Nidoco-10, AM-16 and AM-20 is sandy shale. The net reservoir (reservoir flag) thickness of level III (Figure 16b) varies from 0 to 160 m. It is decreasing toward the southwestern direction (where it is missing in wells AM-18 and AM-21), then it is increasing gradually toward the middle, southeastern, western, northwestern and northeastern directions.
The net pay (net flag) thickness of level II (Figure 17a) varies from 0 to 140 m. It decreases to zero in the middle, northwestern and southeastern parts, where the lithology of level II is sandy shale in the available drilled wells in these parts. Then, it increases in the northeastern and southwestern directions. The net pay (net flag) thickness of Abu Madi level III (Figure 17b) varies from 0 to 120 m. It decreases to zero in the southwestern direction, where level III is missing in wells AM-18 and AM-21. Then, the thickness increases gradually toward the middle, southeastern, northwestern and northeastern directions.
(a) (b)
Figure 12: Effective porosity distribution maps of: (a) Abu Madi level II and (b) Abu Madi level III.
(a) (b)
Figure 13: Water saturation distribution maps of: (a) Abu Madi level II and (b) Abu Madi level III.
(a) (b)
Figure 14: Hydrocarbon saturation maps of: (a) Abu Madi level II and (b) Abu Madi level III.
(a) (b)
Figure 15: Total thickness distribution maps of Levels II and III reservoirs, Abu Madi formation.

Citation: Ghoneimi A, Ibrahim Sh A, El-Kenawy A, Farrag Kh (2018) Use of Well Logs for Petrophysical Evaluation of Abu Madi Reservoir in Abu Madi-ElQara-Nidoco Area, Northern Nile Delta, Egypt. J Geol Geophys 7: 323. doi: 10.4172/2381-8719.1000323
Page 8 of 9
Volume 7 • Issue 1 • 1000323J Geol Geophys, an open access journalISSN: 2381-8719
Conclusions The petrophysical analysis carried out in this study is achieved on
the most favorable two levels II and III of Abu Madi reservoir. Different cross-plots are constructed (neutron-density, neutron-sonic and M-N crossplots) to display the reservoir lithology. These cross-plots reflect that the lithology in level II and level III varies in the available wells from shaly sandstone to sandy shale to shale or silty shale. The shale type varies from mainly laminated and partly dispersed in level II to mainly dispersed and partly laminated in level III; in addition, it is rarely structural in both levels.
The shale content of Abu Madi level II increases to 60% in the middle, northwestern and southeastern parts of the study area, while in level III, it increases to 50% in the northwestern part. On the other hand, the effective porosity of level II increases to 23% toward the northeastern and southwestern parts, while in level III it increases to 21% toward the east and northeastern parts. This variation may be attributed to the presence of a NW-SE trending channel favoring the deposition of the fluvio-marine Abu Madi Formation.
The hydrocarbon saturation of level II increases to more than 90% in the northeastern and southwestern parts, while in level III it increases to 90% in the middle, northwestern and southeastern parts.
(a) (b)
Figure 16: Net reservoir (reservoir flag) thickness distribution map of Levels II and III reservoirs, Abu Madi formation.
(a) (b)
Figure 17: Net pay (pay flag) thickness distribution map, Levels II and III reservoirs, Abu Madi formation.
The effective thickness of level II, net reservoir and net pay, increase to 160 m toward the northeastern and southwestern parts, while level III the net reservoir and net pay thickness increase to 160 and 120, respectively, in the northeastern and eastern parts.
The lateral distribution of the petrophysical parameters indicate that the most favorable places for hydrocarbon reservoirs occupy the northeastern and southwestern parts for Abu Madi level II reservoir and in the middle, the middle-west, the middle-east and the southeastern parts for Abu Madi level III reservoir.
Acknowledgement
Authors wish to express sincere gratitude and appreciation to the Egyptian General Petroleum Corporation (EGPC) and the authority of PETROBEL Company (Cairo, Egypt) for permitting and providing the required well log data used in this study.
References
1. Zaghloul ZM, Taha AA, Hegab O, El-Fawal F (1977b) The Neogene-Quaternary sedimentary basins of the Nile Delta Egypt. Journal of Geology 21: 1-19.
2. Barakat M, Dominik W (2010) Seismic studies on the Messinian rocks in the onshore Nile Delta, Egypt. EAGE, June 2010 14–17.
3. Egyptian General Petroleum Corporation (1994) Nile Delta and north Sinai fields, discoveries and hydrocarbon potentialities (as comprehensive overview). EGPC-Cairo, Egypt 387 P.
4. El-Heiny I, Morsi S (1992) Stratigraphic correlation of Neogene sediments in the eastern Nile Delta and Gulf of Suez, Egypt. 11th Exploration International Conference, EGPC, Cairo 166-193.
5. Said R (1973) Evaluation of Eocene-Miocene sedimentation patterns in parts of northern Egypt. AAPG Bulletin 60: 34-64.
6. Kostandi AB (1959) Facies maps for the study of the Palaeozoic and Mesozoic sedimentary basins in the Egypt region. 1st Arab Pet. Cong., Egypt 12 P.
7. El-Gezeery MN, Mohsen SM, Farid MI (1972) Sedimentary basins in Egypt and their Petroleum prospects. 8th Arab Pet. Cong., Algiers, 2: 1-13.
8. Said R (1990) The Geology of Egypt. A. Balkema Publishers, USA P: 734.
9. Schlumberger (1984) Well Evaluation Conference of Egypt, Schlumberger, Cairo.
10. Kamel H, Eita T, Sarhan M (1998) Nile Delta hydrocarbon potentialities. 14th Exploration and Production Conference, EGPC, Cairo pp.485-503.
11. Salem M (1976) Evolution of the Eocene-Miocene sedimentation pattern in northern Egypt. AAPG Bulletin 60: 34-64.
12. Zaghloul MZ, Shaaban FF, Yousef AF (1999) Mesozoic and Cenozoic sedimentary basins, Nile Delta, Egypt. Proc. of the 1st International Symp. Mansoura. Univ. Egypt 13-20.
13. El-Heiny I, Enani H (1996) Regional stratigraphic interpretation pattern of Neogene sediments, Northern Nile Delta, Egypt. EGPC, Cairo, Egypt pp.14-38.
14. Zaghloul ZM, Taha AA, Gheith AM (1977a) Microfacies studies and paleoenvironmental trends on the subsurface sediments of Kafr El Sheikh well No. 1, Nile Delta area. Bull. Mansoura University 5: 113-138.
15. Rizzini A, Vezzani F, Cococcetta V, Milad G (1978) Stratigraphy and sedimentation of Neogene- Qaternary section in the Nile Delta area. Marine Geology 27: 327-348.
16. Shata A, El-Fayoumy I (1970) Remarks on the regional geological structure of the Nile Delta. In: Hydrology of Deltas. IANSHIUNESCO Bucharest Symposium. UNESECO, Paris pp.189-197.
17. Schlumberger (1972) Log interpretation, Volume I, Principles. Park Avenue, New York.
18. Schlumberger (1974) Log interpretation, Volume II, Applications. Schlum-berger Limited.
19. Asquith GB, Gibson CR (1982) Basic well log analysis for Geologists, Published by the AAPG, Tulsa, Oklohoma, USA.

Citation: Ghoneimi A, Ibrahim Sh A, El-Kenawy A, Farrag Kh (2018) Use of Well Logs for Petrophysical Evaluation of Abu Madi Reservoir in Abu Madi-ElQara-Nidoco Area, Northern Nile Delta, Egypt. J Geol Geophys 7: 323. doi: 10.4172/2381-8719.1000323
Page 9 of 9
Volume 7 • Issue 1 • 1000323J Geol Geophys, an open access journalISSN: 2381-8719
20. Rider MH (1986) Geological interpretation of well logs. Blakie, Glasgow, and London-John Wiley and Sons, New York.
21. Clavier C, Coates G, Dumanoir J (1977) The theoretical and experimental bases for the dual water model for interpretation of shaly sands. 24: 35.