Understanding Power Losses in Vacuum Furnacessolaratm.com/uploads/2015/06/48_PowerLoss-5.pdf ·...
16
Understanding Power Losses in Vacuum Furnaces VACUUM FURNACE REFERENCE SERIES 5 NUMBER
Transcript of Understanding Power Losses in Vacuum Furnacessolaratm.com/uploads/2015/06/48_PowerLoss-5.pdf ·...
ATMOSPHERES ATMOSPHERES
Understanding Power Losses in Vacuum Furnaces
Vacuum FurnacereFerence S e r i e S5
nUMBER

2
Understanding Power Losses In Vacuum Furnaces
Since the early development of the vacuum furnace, engineers and thermal experts have
continually tried to improve the insulating characteristics of the furnace hot zone. Several
materials have been used for different applications with varying success. However, all designs
must still deal with the heat losses penetrating through the insulation materials and the need to
minimize these losses. This is especially important today with the continual escalation of
electrical power cost.
This paper will review the different types of hot zone insulation materials used, the projected
losses of the different designs, the impact relating to furnace cycle heating rates and cycle
times, and the projected cost advantages of one design over another.
A) Hot Zone Designs
Most of the early designs of vacuum furnaces used an all-metal shielded approach for the hot
zone. This consisted of a stack of thin metallic sheets spaced approximately .25” apart. Usually,
the first two or three layers consisted of a high temperature material (molybdenum, tantalum,
or tungsten – depending on the upper temperature requirement) backed by additional layers of
stainless steel sheet. Over the years, furnace manufacturers began to realize that as vacuum
furnaces became an important production tool, other types of hot zone designs must be
developed. This led to the use of fiber type material such as ceramic fiber, graphite felt,
graphite board, and graphite foil. All of these materials have been tried in various combinations
with significant advantages and disadvantages of each different structure.
Considerations in selecting a particular type of hot zone include maximum temperature range
of operation, types of cycles to be performed, expected holding times at elevated
temperatures, peak power concerns and overall operating power costs. All of these factors
relate to hot zone construction and its related power losses.
1) All-Metal Designs
Although the insulated type hot zone is now used in most vacuum furnaces, the all metal design
is still used on specific applications where the use of Carbon components is unacceptable to the
process. This is especially true in the aircraft engine manufacturing industry where an extremely
clean processing system is required to negate the possibility of product contamination.
However, all-metal design hot zones are the most inefficient when considering power losses
and should only be considered when absolutely necessary.

3
2) Ceramic Fiber Included Designs
Early versions of insulated hot zones included the use of ceramic fiber board or blanket.
Ceramic fiber definitely proved to be an excellent insulator in terms of minimizing power losses,
but introduced the distinct disadvantage of moisture absorption when applied to the vacuum
furnace. This resulted in greatly extended vacuum pump down times which caused
dissatisfaction to the furnace end user. In addition, at elevated temperatures, ceramic fiber did
demonstrate a shrinkage problem over short time use, which proved to be detrimental to most
furnace applications. Although some users have tried to use ceramic fiber as a backing material
to graphite felt and board where it would mainly see lower temperatures, moisture absorption
continued to be a negative factor. Therefore, its use is basically restricted to soft vacuum and
lower temperature types of furnaces.
3) Graphite Type Insulated Hot Zones
The most acceptable types of hot zones manufactured today use graphite in the form of sheets,
felt, and board in varying combinations and thicknesses. These combinations offer the end user
a wide selection of what would be best for a particular vacuum furnace application.
Some of the most widely used graphite combination hot zones incorporate laminated graphite
sheet like graphite foil backed by layers of graphite felt in varying thicknesses. Others include a
front facing of graphite board backed by layers of graphite felt. This combination is more
widely used in furnaces incorporating high pressure type quenching where gas velocity and
turbulence might cause problems to designs not capable of withstanding these violent
dynamics.
B) Defining Hot Zone Losses For Different Hot Zone Configurations
Many studies and tests have established a baseline for losses using different combinations of
all-metal and insulated designs. Figure 1 below defines these losses that can be expected from
different designs as watts per square inch of the hot zone surface area. These graphical values
can be extended to calculate projected power requirements for a given furnace size. Figure 1
compares the losses for an all-metal design using (2) molybdenum and (3) stainless steel
shields, an insulated design using 2” of graphite felt with a graphite foil hot face, an insulated
design using 1.5” graphite felt with a graphite foil hot face, and an insulated design using 4
inches of ceramic fiber faced with a molybdenum sheet. As is reflected in the graph, a
significant difference in losses is revealed between each design.
• Please note that the 1.5” graphite felt design equates in losses to an insulated design
consisting of 1” of graphite board backed by 1” of graphite felt.

4
As illustrated in Figure 1, a significant difference exists for each design consideration. However,
as stated previously, unless absolutely required, we prefer not to use the less efficient all-metal
design or the moisture absorbing ceramic fiber configuration due to vacuum pumping concerns.
Therefore, most of our following data will be concentrating on various graphite combinations.
1) Calculating Power Losses For A Given Size Furnace
One of the most popular size vacuum furnaces used in the heat treating industry is a horizontal
loading furnace with a work zone measuring 36” wide x 36” high x 48” deep. The furnace is
defined as a Solar Model HFL-5748 horizontal type and we will use this model going forward in
our analysis. This furnace will be used as a basis for most of the following discussion. However,
any size furnace could be used by simply calculating its appropriate hot zone surface area.
The internal hot zone surface area of this furnace amounts to approximately 17,350 in2.
Multiplying this figure by the projected losses at various temperatures shown in Figure 1,
makes it possible to plot Figure 2. As stated above, we are primarily interested in the graphite
designs but have included the all-metal design on this chart to demonstrate its true inefficiency.

5
As is illustrated in Figure 2, there is a significant difference in losses per hour for the three
designs at the various temperatures. These losses are continually increasing as the
temperature rises and become especially important when holding the furnace at temperature
for an extended time. Putting the values into a chart for better analysis, we have the following:
Losses - KW /HR
Temperature HZ – Graphite 2.0 HZ – Graphite 1.5 HZ – All-Metal*
1000F 52 KW 69 KW 102 KW
1500F 73 KW 102 KW 140 KW
2000F 104 KW 139 KW 192 KW
2500F 149 KW 220 KW 312 KW
Chart 1
* All-metal design will become even more inefficient as the reflective shields become oxidized
and dirty over time and long term use.
Chart 1 demonstrates the significant difference of holding for one hour at a given temperature.
At 2000oF, the Graphite 2.0 construction uses 35 less KW than the Graphite 1.5 and 88 less KW
than the all-metal design. Converting this into dollars, this becomes very important and will be
discussed in greater detail later in this paper.
6
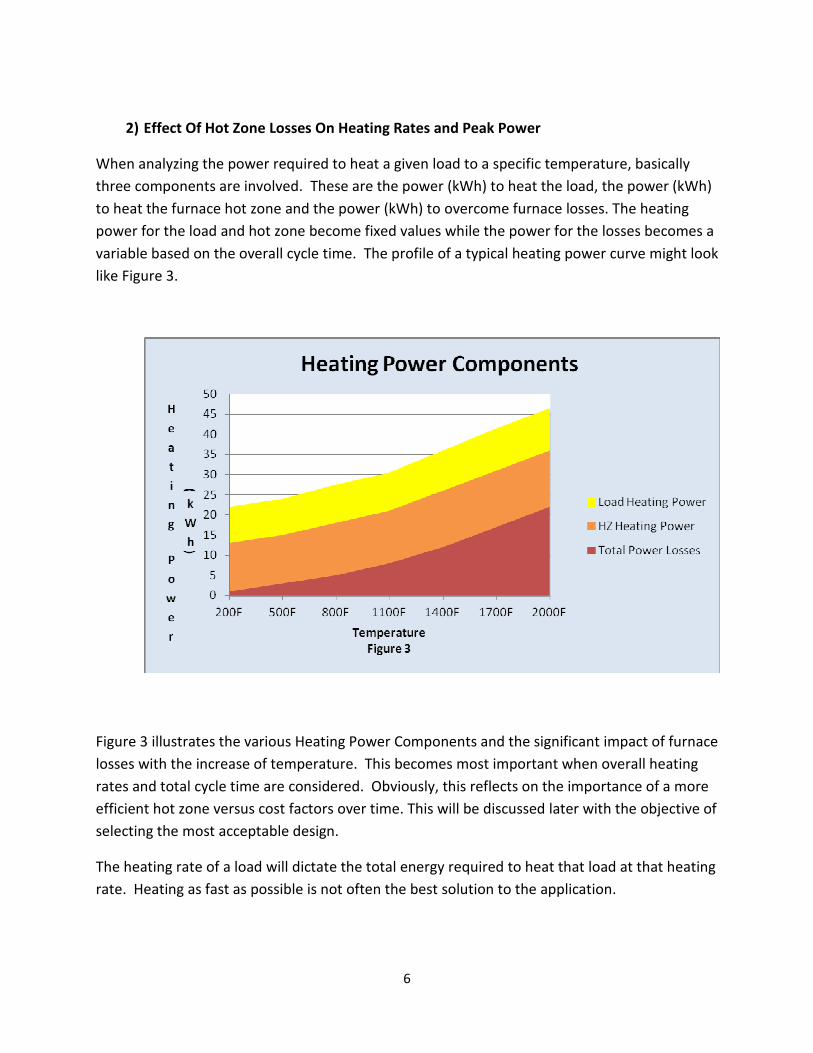
2) Effect Of Hot Zone Losses On Heating Rates and Peak Power
When analyzing the power required to heat a given load to a specific temperature, basically
three components are involved. These are the power (kWh) to heat the load, the power (kWh)
to heat the furnace hot zone and the power (kWh) to overcome furnace losses. The heating
power for the load and hot zone become fixed values while the power for the losses becomes a
variable based on the overall cycle time. The profile of a typical heating power curve might look
like Figure 3.
Figure 3 illustrates the various Heating Power Components and the significant impact of furnace
losses with the increase of temperature. This becomes most important when overall heating
rates and total cycle time are considered. Obviously, this reflects on the importance of a more
efficient hot zone versus cost factors over time. This will be discussed later with the objective of
selecting the most acceptable design.
The heating rate of a load will dictate the total energy required to heat that load at that heating
rate. Heating as fast as possible is not often the best solution to the application.

7
Another area of heating concern has to do with Peak Power demands. Generally, all electrical
power companies now charge a supplemental amount based on peak usage over a given time
frame adding even greater cost to the furnace operation.
The faster a load is heated, the greater the peak demand to reach desired final temperature.
Prior tests (Figures 4 & 5) were performed in our Model HFL-5748 furnace heating a 1000
pound load show total energy needed and peak power demand for different heating rates.
Furnace Hot Zone Demand Power
0
50
100
150
200
1:00 1:10 1:20 1:30 1:40 1:50 2:00 2:10 2:20 2:30 2:40 2:50 3:00 3:10 3:20
Time (Hours:Minutes)
Power (kW)
10°F per Minute 15°F per Minute 20°F per Minute
Furnace Hot Zone Energy Usage
0
50
100
150
200
250
0:00 0:10 0:20 0:30 0:40 0:50 1:00 1:10 1:20 1:30 1:40 1:50 2:00 2:10 2:20 2:30 2:40 2:50 3:00 3:10 3:20
Time (Hours:Minutes)
Energy (kWh)
10°F per Minute 15°F per Minute 20°F per Minute
Figure 4
Figure 5

8
The results from Figures 4 & 5 are summarized in Chart 2.
Heating Rate Heating kWh Average KW/HR Peak Demand KW
10 Degrees/Min 247 77 140
15 Degrees/Min 225 105 174
20 Degrees/Min 212 132 200
Chart 2
By using the above chart to calculate the KW required to heat a 1000 pound load and the
furnace hot zone to 2000oF, we reach the following conclusions regarding furnace losses:
a) Heating a load of steel materials to 2000oF requires approximately 72 kWh of power.
b) Heating the hot zone and its various components and materials to their respective
temperatures (these vary based on the component location) requires approximately
97 kWh of power.
c) Extending these calculations against the time required to achieve the final results, we
can calculate the cycle losses for the given furnace as reflected in chart 3. Notice that
the losses do increase in total value the slower the heating rate.
Heating Rate Total kWh Used Load & Hot Zone kWh Loss kWh
10 Degrees/Min 247 169 78
15 Degrees/Min 225 169 56
20 Degrees/Min 212 169 43
Chart 3
Reflecting on Charts 2 & 3, we can see the relationship of hot zone losses as they relate to peak
demand and cycle heating time. The end user must determine whether a faster heating rate,
allotting for added peak demand costs, is better than a longer cycle with lower peak costs but
more overall total power consumed due to increased hot zone losses. All furnace users should
base the final decision on their particular application. Also, most important to a furnace user is
hold time at elevated temperatures which will greatly impact total losses. The best solution to
many of these various situations hopefully will be answered by what follows regarding
insulation thicknesses and designs.
9
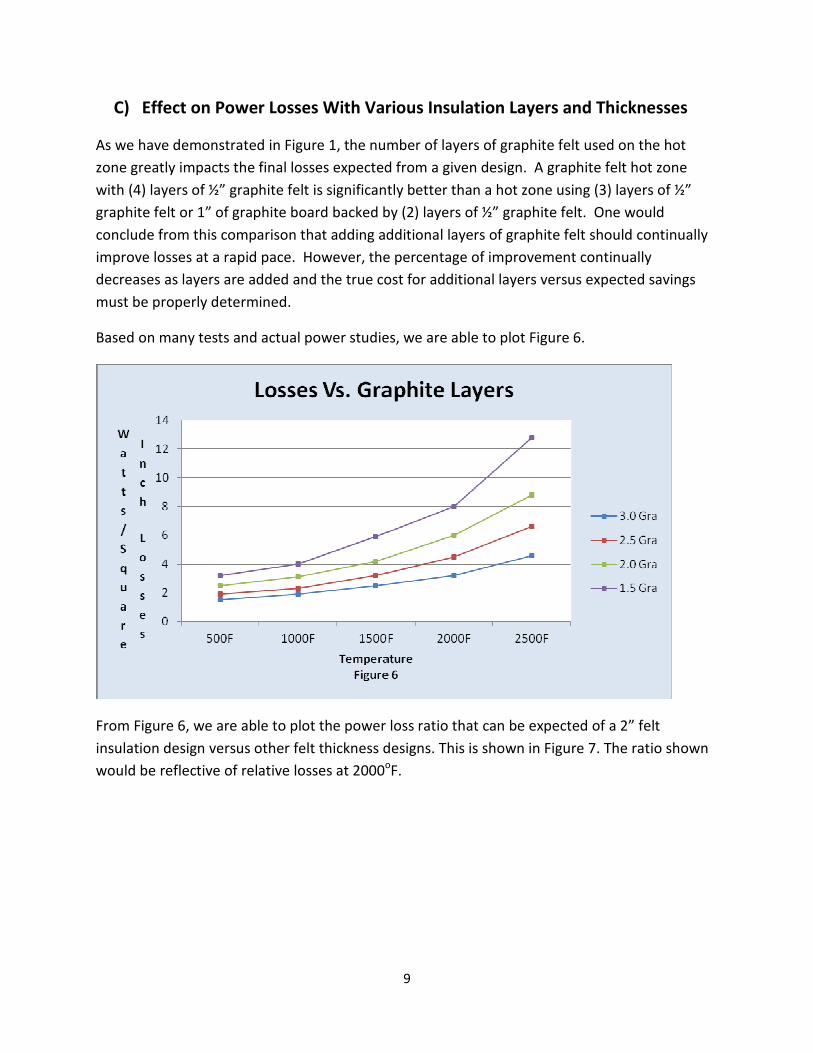
C) Effect on Power Losses With Various Insulation Layers and Thicknesses
As we have demonstrated in Figure 1, the number of layers of graphite felt used on the hot
zone greatly impacts the final losses expected from a given design. A graphite felt hot zone
with (4) layers of ½” graphite felt is significantly better than a hot zone using (3) layers of ½”
graphite felt or 1” of graphite board backed by (2) layers of ½” graphite felt. One would
conclude from this comparison that adding additional layers of graphite felt should continually
improve losses at a rapid pace. However, the percentage of improvement continually
decreases as layers are added and the true cost for additional layers versus expected savings
must be properly determined.
Based on many tests and actual power studies, we are able to plot Figure 6.
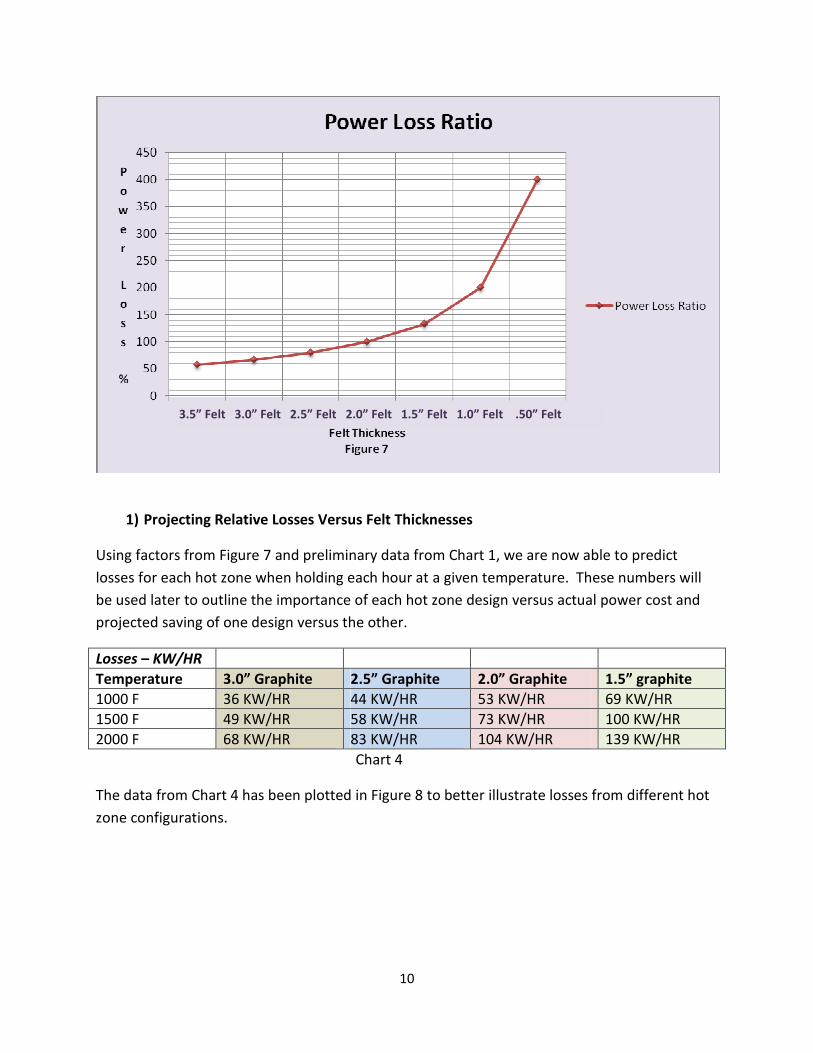
From Figure 6, we are able to plot the power loss ratio that can be expected of a 2” felt
insulation design versus other felt thickness designs. This is shown in Figure 7. The ratio shown
would be reflective of relative losses at 2000oF.
10
1) Projecting Relative Losses Versus Felt Thicknesses
Using factors from Figure 7 and preliminary data from Chart 1, we are now able to predict
losses for each hot zone when holding each hour at a given temperature. These numbers will
be used later to outline the importance of each hot zone design versus actual power cost and
projected saving of one design versus the other.
Losses – KW/HR
Temperature 3.0” Graphite 2.5” Graphite 2.0” Graphite 1.5” graphite
1000 F 36 KW/HR 44 KW/HR 53 KW/HR 69 KW/HR
1500 F 49 KW/HR 58 KW/HR 73 KW/HR 100 KW/HR
2000 F 68 KW/HR 83 KW/HR 104 KW/HR 139 KW/HR
Chart 4
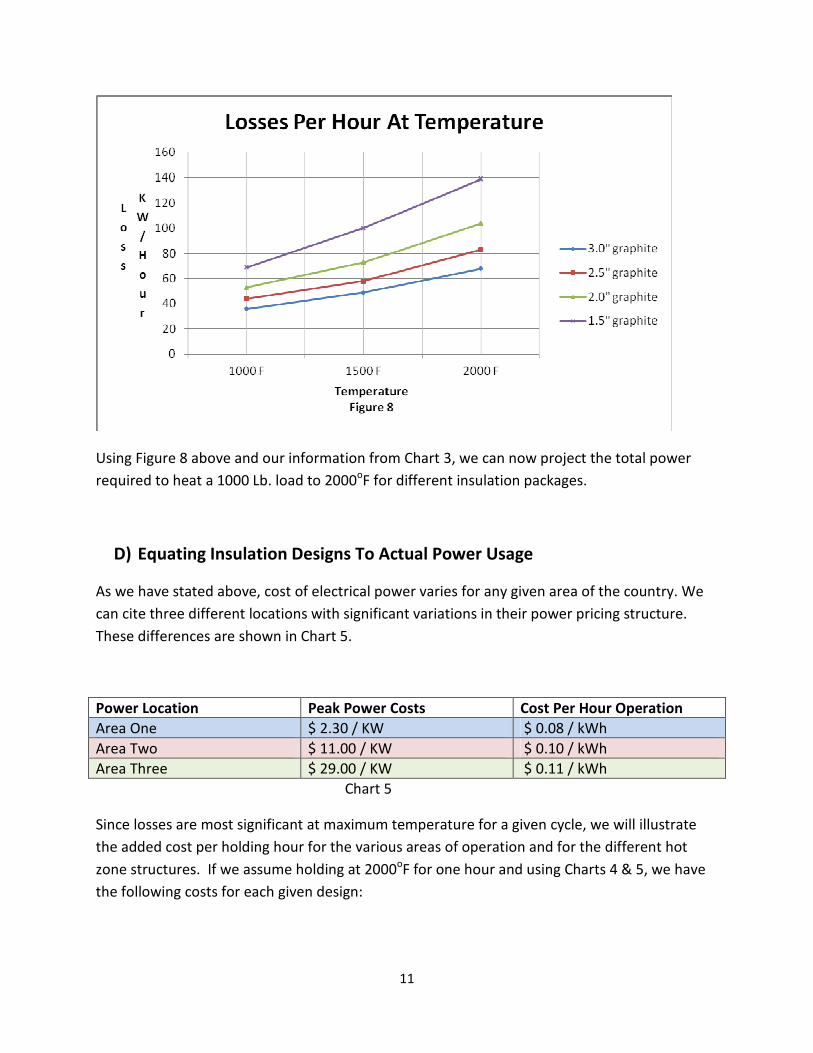
The data from Chart 4 has been plotted in Figure 8 to better illustrate losses from different hot
zone configurations.
3.5” Felt 3.0” Felt 2.5” Felt 2.0” Felt 1.5” Felt 1.0” Felt .50” Felt
11
Using Figure 8 above and our information from Chart 3, we can now project the total power
required to heat a 1000 Lb. load to 2000oF for different insulation packages.
D) Equating Insulation Designs To Actual Power Usage
As we have stated above, cost of electrical power varies for any given area of the country. We
can cite three different locations with significant variations in their power pricing structure.
These differences are shown in Chart 5.
Power Location Peak Power Costs Cost Per Hour Operation
Area One $ 2.30 / KW $ 0.08 / kWh
Area Two $ 11.00 / KW $ 0.10 / kWh
Area Three $ 29.00 / KW $ 0.11 / kWh
Chart 5
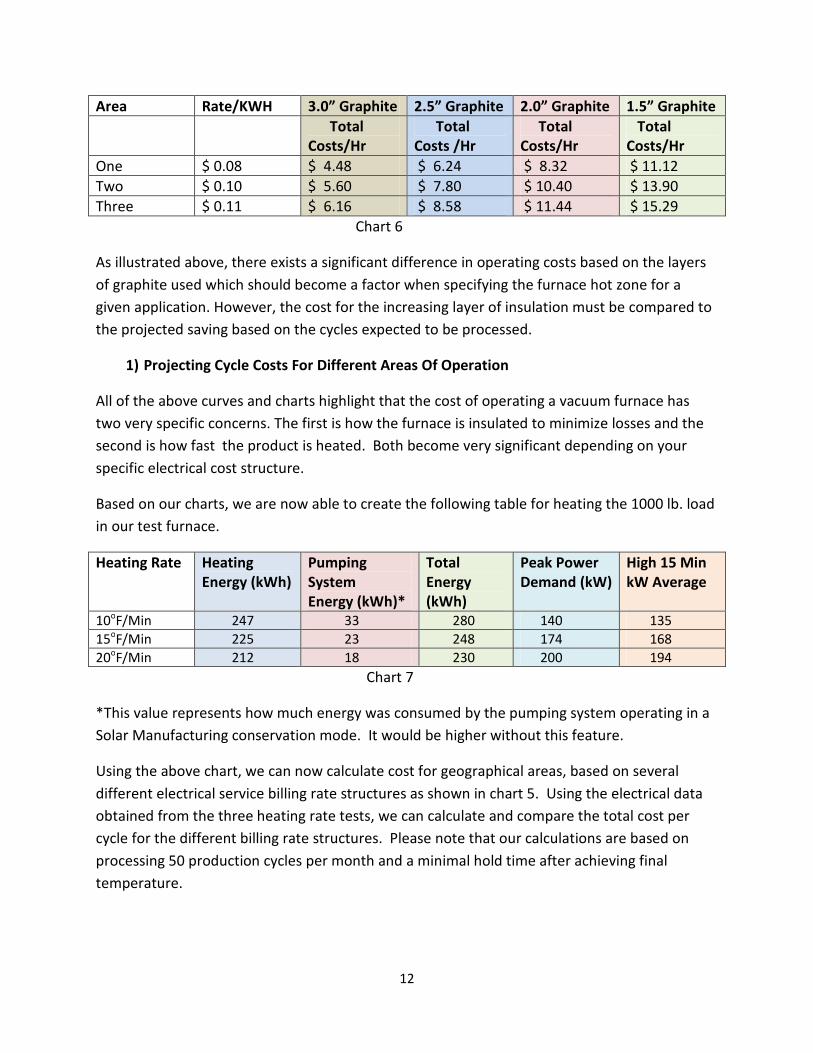
Since losses are most significant at maximum temperature for a given cycle, we will illustrate
the added cost per holding hour for the various areas of operation and for the different hot
zone structures. If we assume holding at 2000oF for one hour and using Charts 4 & 5, we have
the following costs for each given design:
12
Area Rate/KWH 3.0” Graphite 2.5” Graphite 2.0” Graphite 1.5” Graphite
Total
Costs/Hr
Total
Costs /Hr
Total
Costs/Hr
Total
Costs/Hr
One $ 0.08 $ 4.48 $ 6.24 $ 8.32 $ 11.12
Two $ 0.10 $ 5.60 $ 7.80 $ 10.40 $ 13.90
Three $ 0.11 $ 6.16 $ 8.58 $ 11.44 $ 15.29
Chart 6
As illustrated above, there exists a significant difference in operating costs based on the layers
of graphite used which should become a factor when specifying the furnace hot zone for a
given application. However, the cost for the increasing layer of insulation must be compared to
the projected saving based on the cycles expected to be processed.
1) Projecting Cycle Costs For Different Areas Of Operation
All of the above curves and charts highlight that the cost of operating a vacuum furnace has
two very specific concerns. The first is how the furnace is insulated to minimize losses and the
second is how fast the product is heated. Both become very significant depending on your
specific electrical cost structure.
Based on our charts, we are now able to create the following table for heating the 1000 lb. load
in our test furnace.
Heating Rate Heating
Energy (kWh)
Pumping
System
Energy (kWh)*
Total
Energy
(kWh)
Peak Power
Demand (kW)
High 15 Min
kW Average
10oF/Min 247 33 280 140 135
15oF/Min 225 23 248 174 168
20oF/Min 212 18 230 200 194
Chart 7
*This value represents how much energy was consumed by the pumping system operating in a
Solar Manufacturing conservation mode. It would be higher without this feature.
Using the above chart, we can now calculate cost for geographical areas, based on several
different electrical service billing rate structures as shown in chart 5. Using the electrical data
obtained from the three heating rate tests, we can calculate and compare the total cost per
cycle for the different billing rate structures. Please note that our calculations are based on
processing 50 production cycles per month and a minimal hold time after achieving final
temperature.
13
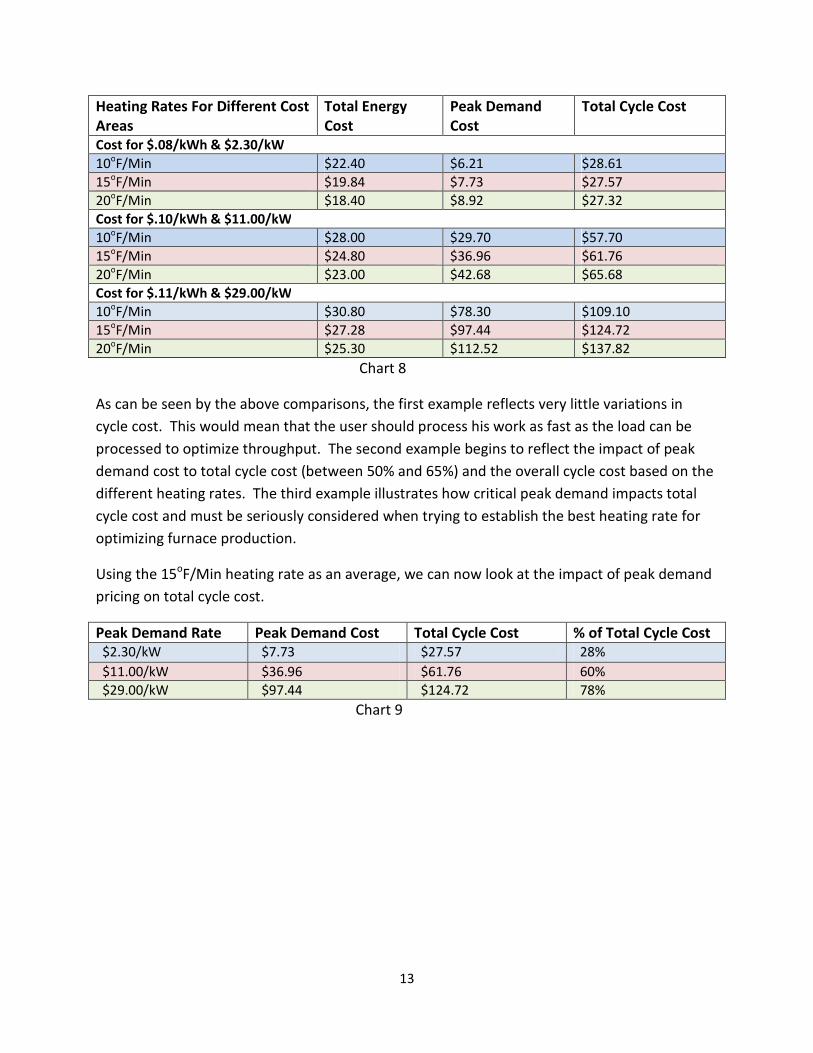
Heating Rates For Different Cost
Areas
Total Energy
Cost
Peak Demand
Cost
Total Cycle Cost
Cost for $.08/kWh & $2.30/kW
10oF/Min $22.40 $6.21 $28.61
15oF/Min $19.84 $7.73 $27.57
20oF/Min $18.40 $8.92 $27.32
Cost for $.10/kWh & $11.00/kW
10oF/Min $28.00 $29.70 $57.70
15oF/Min $24.80 $36.96 $61.76
20oF/Min $23.00 $42.68 $65.68
Cost for $.11/kWh & $29.00/kW
10oF/Min $30.80 $78.30 $109.10
15oF/Min $27.28 $97.44 $124.72
20oF/Min $25.30 $112.52 $137.82
Chart 8
As can be seen by the above comparisons, the first example reflects very little variations in
cycle cost. This would mean that the user should process his work as fast as the load can be
processed to optimize throughput. The second example begins to reflect the impact of peak
demand cost to total cycle cost (between 50% and 65%) and the overall cycle cost based on the
different heating rates. The third example illustrates how critical peak demand impacts total
cycle cost and must be seriously considered when trying to establish the best heating rate for
optimizing furnace production.
Using the 15oF/Min heating rate as an average, we can now look at the impact of peak demand
pricing on total cycle cost.
Peak Demand Rate Peak Demand Cost Total Cycle Cost % of Total Cycle Cost
$2.30/kW $7.73 $27.57 28%
$11.00/kW $36.96 $61.76 60%
$29.00/kW $97.44 $124.72 78%
Chart 9

14
2) Impact of Hot Zone Type on Total Cycle Cost
If we select a nominal heating rate of 15 degrees per minute, we can project the relative cost of
operating a furnace for different insulation types. Based on the above data and assuming a one
hour hold at temperature, we can create Chart 10.
Hot Zone Type Cycle Heating
Energy (kWh)
Pumping
System Energy
(kWh)
Holding
Energy for
one hour
(kWh)
Total Cycle
Energy (kWh)
1.5 “ Graphite 244 23 139 406
2.0” Graphite 225 23 104 352
2.5” Graphite 214 23 83 320
3.0” Graphite 207 23 68 298
Chart 10
Using our data from Chart 10 and the given rates for the different areas, we are able to
compare total cycle cost for the different hot zones excluding peak demand.
Cost Area 1.5” Graphite 2.0” Graphite 2.5” Graphite 3.0” Graphite
Area 1 $ 32.48 $ 28.16 $ 25.60 $ 23.84
Area 2 $ 40.60 $ 35.20 $ 32.00 $ 29.80
Area 3 $ 44.66 $ 38.72 $ 35.20 $ 32.78
Chart 11
If we now assume roughly 50 cycles per month and extend that to one year usage, we can
demonstrate the various year cost for the different hot zones excluding the added cost of peak
demand.
Cost Area 1.5”Graphite 2.0”Graphite 2.5”Graphite 3.0”Graphite
Area 1 $ 19,488 $ 16,896 $ 15,360 $ 14,304
Area 2 $ 24,360 $ 21,120 $ 19,200 $ 17,880
Area 3 $ 26,796 $ 23,232 $ 21,120 $ 19,668
Chart 12
Although Chart 12 does not include added peak demand cost, it does illustrate the yearly cost
difference that can be expected on the various graphite layer thicknesses. Also please
remember that this is based on our test furnace size and will certainly change for other sizes.
However, it does illustrate a significant difference in the different designs and the impact of hot
zone losses.
15
E) Summary And Conclusions
1) How a Vacuum Furnace is insulated has a major effect on furnace losses and resulting
operating costs.
2) When focusing on optimizing production in vacuum furnace operations while trying to
minimize electrical power costs, it is essential to review and understand your current
electrical power billing structure.
3) Peak power demand costs represent a substantial part of electrical billing.
4) Hot zone losses can be projected and reduced by considering more efficient designs.
Initial capital investment may be quickly recovered based on the resulting electrical cost
savings.
5) Peak power demand costs are mainly dictated by furnace heating rates but more
efficient hot zones will also impact final peak demand costs.
6) Overall peak demand costs will normally help to establish the best heating rates for
different size work-loads.
7) Graphite felt insulation with 4-5 layers of ½” blankets appears to be the most
economical and best performing hot zone based on losses and overall power costs.
Additional layers might be considered for furnace applications requiring long hold times
at elevated temperatures.
8) Hot zone designs and internal supports and hardware need to be designed with
consideration to low mass and specific heat wherever possible to avoid hot zone energy
absorption.
9) Maintaining a furnace hot zone in good operating condition will continue to minimize
hot zone losses during processing.
Author: Real J. Fradette – Senior Technical Consultant – Solar Atmospheres, Inc., Souderton, Pa.
Major Contributor: Nicholas R. Cordisco – Electrical Engineer/Service Manager – Solar
Manufacturing, Inc.
Overview Contributors:
William R. Jones – CEO – Solar Atmospheres, Inc.
James L. Watters – President – Delaware Valley Utility Advisors – Lansdale, Pa.
October 11, 2011
ATMOSPHERES ATMOSPHERES
ATMOSPHERES ATMOSPHERES
Solar Atmospheres Eastern PA Plant A 1969 clearview road, Souderton, Pa 18964 p. 800.347.3236
Solar Atmospheres Eastern PA Plant B 255 Township Line road, Hatfield, Pa 19440 p. 800.347.3236
Solar Atmospheres Western PA 30 industrial road, Hermitage, Pa 16148 p. 866.982.0660
Solar Atmospheres CA 8606 Live Oak avenue, Fontana, ca 92335 p. 866.559.5994
www.solaratm.com
1983 clearview road, Souderton, Pa 18964 p. 267.384 .5040
www.solarmfg.com©Copyright 2012 3/19