
Tropical Storm Ana
22
NATIONAL HURRICANE CENTER TROPICAL CYCLONE REPORT TROPICAL STORM ANA (AL012015) 08 – 11 May 2015 Stacy R. Stewart National Hurricane Center 15 September 2015 NOAA GOES-15 VISIBLE SATELLITE IMAGE SHOWING ANA AT ITS PEAK INTENSITY ON 9 MAY 2015 AS IT MOVED TOWARD THE COAST OF THE SOUTHEASTERN UNITED STATES. Ana originated from a non-tropical low and made landfall along the northeastern coast of South Carolina, causing minor wind damage, some beach erosion, and one direct death in North Carolina.
Transcript of Tropical Storm Ana

NATIONAL HURRICANE CENTER TROPICAL CYCLONE REPORT
TROPICAL STORM ANA (AL012015) 08 – 11 May 2015
Stacy R. Stewart National Hurricane Center
15 September 2015
NOAA GOES-15 VISIBLE SATELLITE IMAGE SHOWING ANA AT ITS PEAK INTENSITY ON 9 MAY 2015 AS IT MOVED TOWARD
THE COAST OF THE SOUTHEASTERN UNITED STATES.
Ana originated from a non-tropical low and made landfall along the northeastern
coast of South Carolina, causing minor wind damage, some beach erosion, and one direct death in North Carolina.
Tropical Storm Ana 2
Tropical Storm Ana 08 – 11 MAY 2015
SYNOPTIC HISTORY Ana originated from the interaction of an old frontal system and the divergence associated with a sharp mid- to upper-level trough. An unusually strong late-spring cold front pushed across Florida and into the southwestern Atlantic Ocean, becoming stationary north of the Greater Antilles on 3 May. The warm waters beneath the frontal system caused the temperature gradient to dissipate, with the western portion of the front becoming a surface trough that moved slowly westward into the Bahamas by 5 May. The surface trough reached the northwestern Bahamas and Straits of Florida on 6 May, where it began to interact with the strong diffluent flow and subtropical jetstream located on the east side of the mid- to upper-level trough. Surface pressures slowly decreased, and a non-tropical low pressure system with a well-defined center of circulation formed early on 6 May just offshore of the southeastern coast of Florida. The low moved slowly northward over the next two days and developed an associated area of gales. By 0000 UTC 8 May, the low had acquired sufficient organized deep convection for the system to be designated a subtropical storm when it was located about 150 n mi south-southeast of Myrtle Beach, South Carolina – the subtropical designation being based on the cyclone’s association with an upper trough and a large (~100 n mi) radius of maximum wind. The “best track” chart of the cyclone’s path is given in Fig. 1, with the wind and pressure histories shown in Figs. 2 and 3, respectively. The best track positions and intensities are listed in Table 11.
During the next 24 h, Ana moved slowly north-northwestward over the warmer waters of the Gulf Stream. Deep convection steadily developed closer to the surface center along with upper-level anticyclonic outflow, marking Ana’s transition to a tropical storm by 0600 UTC 9 May when the cyclone was located about 115 n mi southeast of Myrtle Beach. Ana’s intensity remained steady near 50 kt while the cyclone was over the warm waters of the Gulf Stream. However, by 1800 UTC that day, the tropical storm began a weakening trend as it moved off of the Gulf Stream and over the coastal shelf waters, where sea-surface temperatures were as low as 20O C. Northerly 850-200 mb vertical wind shear of at least 20 kt enhanced the weakening process, and Ana made landfall around 1000 UTC 10 May just southwest of North Myrtle Beach, South Carolina with an intensity of 40 kt (Fig. 4); the 10 May landfall makes Ana the earliest U.S.-landfalling tropical cyclone on record.
Shortly after making landfall, Ana slowed and turned northward and weakened to a tropical depression. On 11 May the cyclone turned northeastward and moved across eastern North Carolina, degenerating to a remnant low pressure area before emerging off of the United States mid-Atlantic coast near the Delmarva Peninsula around 0000 UTC 12 May. The low became
1 A digital record of the complete best track, including wind radii, can be found on line at ftp://ftp.nhc.noaa.gov/atcf. Data for the current year’s storms are located in the btk directory, while previous years’ data are located in the archive directory.
Tropical Storm Ana 3
embedded in the flow ahead of a mid-latitude trough and accelerated northeastward off of the New England coast, merging with a frontal system south of Nova Scotia by 0000 UTC 13 May.
METEOROLOGICAL STATISTICS
Observations in Ana (Figs. 2 and 3) include subjective satellite-based Dvorak technique intensity estimates from the Tropical Analysis and Forecast Branch (TAFB) and the Satellite Analysis Branch (SAB), and objective Advanced Dvorak Technique (ADT) estimates from the Cooperative Institute for Meteorological Satellite Studies/University of Wisconsin-Madison. Data and imagery from NOAA polar-orbiting satellites including the Advanced Microwave Sounding Unit (AMSU), the NASA Global Precipitation Mission (GPM), the European Space Agency’s Advanced Scatterometer (ASCAT), and Defense Meteorological Satellite Program (DMSP) satellites, among others, were also useful in constructing the best track of Ana.
Observations also include flight-level, stepped frequency microwave radiometer (SFMR), and dropwindsonde observations obtained from six flights by the 53rd Weather Reconnaissance Squadron of the U. S. Air Force Reserve Command, who provided twelve position fixes.
National Weather Service WSR-88D Doppler radar data from the Miami, Melbourne, Jacksonville, Charleston, Wilmington, Morehead City and Wakefield Weather Forecast Offices (WFO) were used to make center fixes and obtain velocity data while Ana and its precursor low were near and inland of the U. S. east coast.
Ship reports of tropical-storm-force winds associated with Ana are given in Table 3, and selected surface observations from land stations and nearby buoys are given in Table 4.
Winds and Pressure Although Ana was monitored by reconnaissance aircraft, there is unusually high uncertainty regarding the cyclone’s peak intensity. The estimated maximum intensity of 50 kt is based on a blend of surface-adjusted peak 850-mb flight-level winds of 58 kt and 54 kt, a dropwindsonde boundary layer surface-adjusted value of 43 kt, and a surface wind measurement of 38 kt. The much larger flight-level surface-adjusted wind values have been mostly discounted due to the stable boundary layer conditions that were present along the cooler east and west walls of the Gulf Stream where these flight-level winds speed were observed.
Although a peak SFMR surface wind of 67 kt was also measured, the validity of that observation is questionable since it was acquired in a region of significant currents and breaking waves associated with the Gulf Stream. Such measurements near continental coastlines and over the Gulf Stream are likely inflated due to shoaling and current effects, (Ulhorn and Black 2003).
Ana’s estimated minimum central pressure of 998 mb at 0000 UTC and 0600 UTC 9 May is based on a pressure of 999 mb measured by a dropwindsonde, concurrent with a surface wind of 12 kt.
Tropical Storm Ana 4
Storm Surge2 Ana produced minor storm surge flooding along portions of the coasts of South Carolina and North Carolina. The highest storm surge values measured by NOS tide gauges were approximately 2.5 ft above normal tide levels at Oyster Landing South Carolina and Springmaid Pier, South Carolina, respectively. Storm surges between 1.5 and 2.0 ft were measured by the NOS gauges were measured along the coasts of northeastern Florida, Georgia, and southeastern North Carolina.
Ana’s storm surge produced inundations less than 2 ft above ground level along the coastal areas from northeastern Florida to southeastern North Carolina, and most values were around 1 ft.
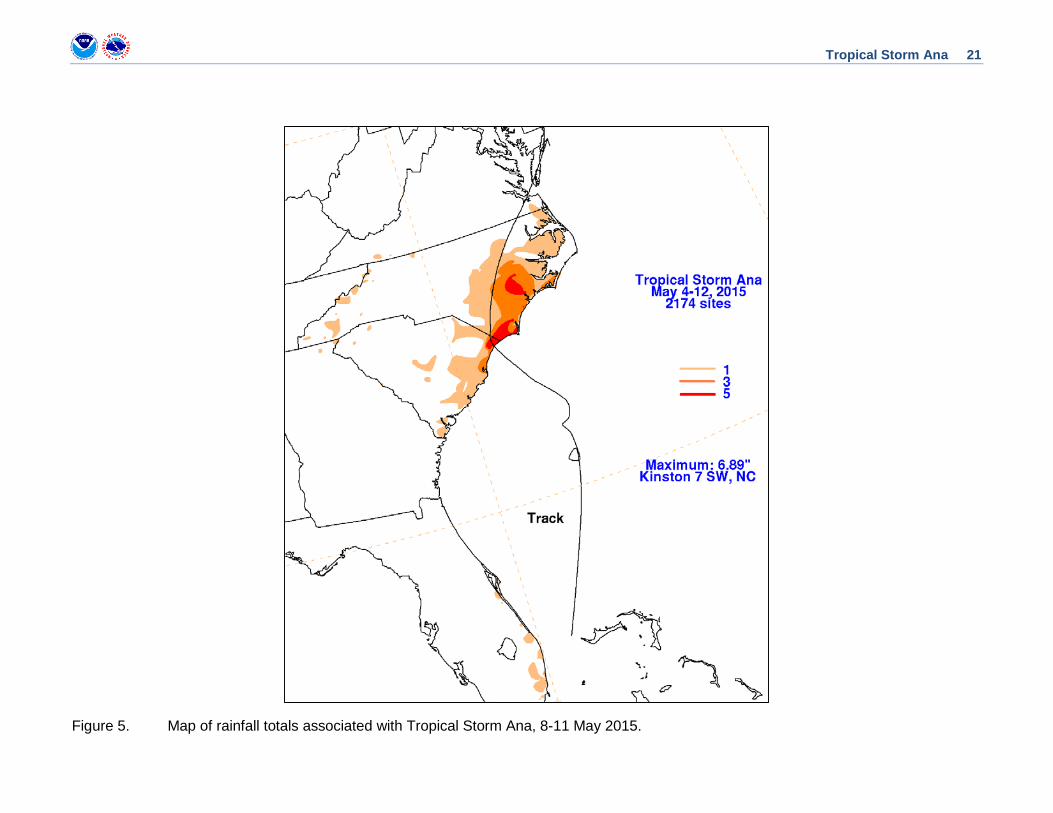
Rainfall and Flooding Ana generally produced storm-total rainfall of 3 to 6 inches across portions of eastern North Carolina, with much lesser amounts over South Carolina (Fig. 5). The highest rainfall reports were 6.89 inches and 6.87 inches near Kinston, North Carolina. Significantly lower amounts of rainfall occurred across South Carolina where Ana made landfall due to southwesterly vertical wind shear, which displaced the associated could pattern and rain shield primarily across eastern North Carolina well to the northeast of the center.
Locally heavy rainfall caused some inland freshwater flooding in Lenoir County, North Carolina near the border with Jones County. The heavy rains caused the waters in Southwest Creek to rise quickly, cutting off 10 homes with water levels of 4 to 5 ft in some places. On 11 May, The Southwood Volunteer Fire Department used their boat to rescue some of the stranded residents. No fatalities or injuries resulted from the flooding.
Tornadoes A waterspout formed over the Croatan Sound during the afternoon of 11 May, moved northeastward and inland over Roanoke Island near Manteo, North Carolina, where it became an EF0 tornado. Some tree damage along with minor damage to one home resulted. No fatalities or injuries were reported in association with the waterspout or tornado.
2 Several terms are used to describe water levels due to a storm. Storm surge is defined as the abnormal rise of water generated by a storm, over and above the predicted astronomical tide, and is expressed in terms of height above normal tide levels. Because storm surge represents the deviation from normal water levels, it is not referenced to a vertical datum. Storm tide is defined as the water level due to the combination of storm surge and the astronomical tide, and is expressed in terms of height above a vertical datum, i.e. the North American Vertical Datum of 1988 (NAVD88) or Mean Lower Low Water (MLLW). Inundation is the total water level that occurs on normally dry ground as a result of the storm tide, and is expressed in terms of height above ground level. At the coast, normally dry land is roughly defined as areas higher than the normal high tide line, or Mean Higher High Water (MHHW).
Tropical Storm Ana 5
CASUALTY AND DAMAGE STATISTICS There was one direct death3 associated with Ana. Media reports indicate that a 25-year old Ohio man was pulled under water for more than ten minutes in strong rip currents off of the coast of Oak Island, North Carolina on 11 May. The man died the next day due to anoxic injury.
Well before Ana made landfall, large swells moved into Charleston Harbor and drove a sailboat aground on 7 May, piercing the vessel’s hull and filling it with water, forcing a Coast Guard mission to rescue the two sailors onboard. No one was injured.
Abnormally high tides in combination with Ana’s storm surge resulted in minor beach erosion along the coasts of northeastern South Carolina and southeastern North Carolina. Roads were washed out in North Myrtle Beach, South Carolina, and a long-term beach erosion condition along Cherry Grove Beach was exacerbated.
Farther north in Surf City, North Carolina, portions of the sunken schooner William H. Sumner, which was wrecked in 1919, became visible along the beach front. There was also minor damage to sand dunes along the North Carolina coast.
Although Tropical Storm Ana caused some property damage in the United States, the insured amounts were less than the $25 million dollar threshold used by the Property Claims Service to declare a catastrophe. Therefore, a specific damage figure is not available.
FORECAST AND WARNING CRITIQUE
The genesis of Ana was well predicted (Table 2). Special Tropical Weather Outlooks on the out-of-season disturbance were first issued on 3 May, at which time the potential system was given a “low” chance (<30 %) of development during the next 120 hours even though no surface circulation existed at that time. On 5 May, after an area of showers and thunderstorms had formed near the Bahamas, genesis probabilities were increased to a ‘low’ chance of development during the next 48 hours and a “medium” chance (40% - 60%) during the ensuing 5-day period. By early on 7 May, both the 48- and 120-hour probabilities of genesis were increased to a “high” chance (>70%) of formation, which was 18 h before Ana developed into a subtropical cyclone. Ana was given a “low” chance of genesis in the 48-h Special Tropical Weather Outlook 58 h before it formed, which is more than double the average lead time of 27 h for systems of non-tropical origin (Kimberlain 2014). The global models were generally in good agreement on some type of low pressure development occurring off of the southeastern United States coast several days before Ana formed, although there were noticeable differences on the exact location and timing of the
3 Deaths occurring as a direct result of the forces of the tropical cyclone are referred to as “direct” deaths. These would include those persons who drowned in storm surge, rough seas, rip currents, and freshwater floods. Direct deaths also include casualties resulting from lightning and wind-related events (e.g., collapsing structures). Deaths occurring from such factors as heart attacks, house fires, electrocutions from downed power lines, vehicle accidents on wet roads, etc., are considered indirect” deaths.

Tropical Storm Ana 6
cyclone’s development. The GFS and ECMWF models were the best performers and predicted the approximate genesis location at least five days in advance.
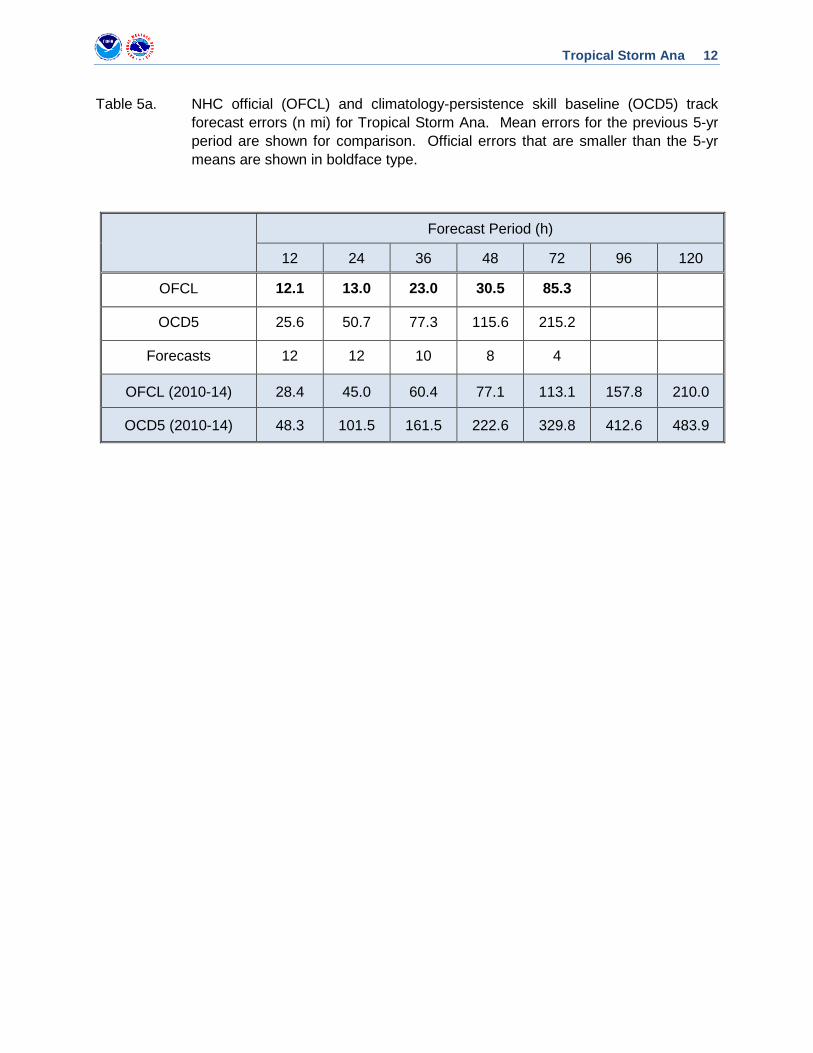
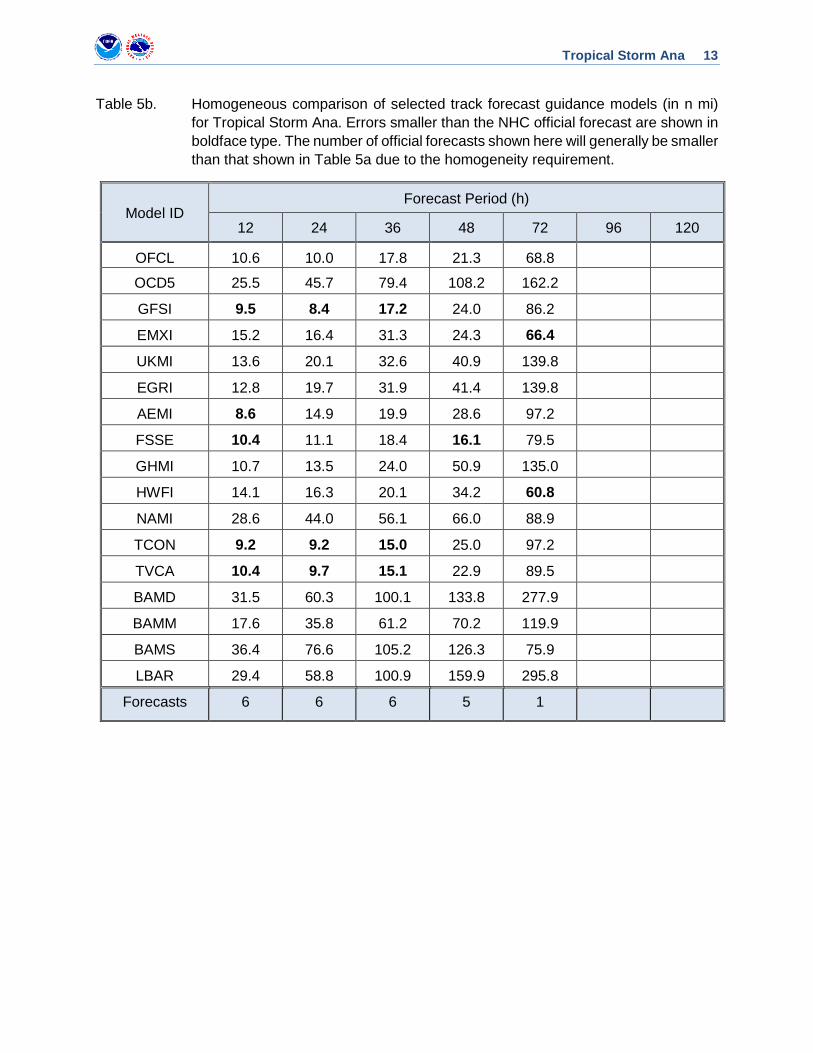
A verification of NHC official track forecasts (OFCL) for Ana is given in Table 5a. Official forecast track errors were much lower than the mean official errors for the previous 5-yr period at all forecast times. At a few forecast periods, OFCL errors were 50% to 70% lower than average. A homogeneous comparison of the official track errors with selected guidance models is given in Table 5b. Although the number of forecasts is small, OFCL track errors were essentially comparable to or better than all available model guidance. Overall, the NHC track forecasts showed little cross-track deviation prior to and after landfall (Fig. 6).
A verification of NHC official intensity forecasts for Ana is given in Table 6a. Similar to the track errors, official forecast intensity errors were much lower than the mean official errors for the previous 5-yr period at all forecast times. At a few forecast periods, OFCL errors were 45% to 70% lower than average. A homogeneous comparison of the official intensity errors with selected guidance models is given in Table 6b.
Watches and warnings associated with Ana are given in Table 7.
REFERENCES
Kimberlain, T., 17 December 2014: Hurricane Fay Tropical Cyclone Report. NOAA National Hurricane Center. [Available online at http://www.nhc.noaa.gov/data/tcr/AL072014_Fay.pdf]
Ulhorn, E.L. and P.G. Black, 2003: Verification of Remotely Sensed Sea Surface Winds in Hurricanes. J. Atmos. Oceanic Technology, 20, 99-116. [Available online at http://www.aoml.noaa.gov/hrd/project2005/sfmr.html]
Man pulled from Oak Island waters – WWAYTV3 http://www.wwaytv3.com/2015/05/11/man-pulled-from-oak-island-waters/
ACKNOWLEDGEMENTS
The National Weather Service Forecast Offices in Charleston, South Carolina, Wilmington, North Carolina, and Morehead City, North Carolina, provided many of the surface observations and tornado data. David Roth of the Weather Prediction Center in Washington, D.C. provided the U. S. rainfall map. The National Data Buoy Center and the NOAA Chesapeake Bay Interpretive Buoy System (CBIBS) provided data for their stations. The National Ocean Service provided the meteorological and tide gauge data for its stations. WeatherFlow and the Coastal Ocean Research and Monitoring Program (CORMP), the Carolinas Coastal Ocean Observing and Prediction System (CaroCoops), and the Weather Underground provided data for their stations. John Cangialosi of the NHC Hurricane Specialist Unit created the best track map.
Tropical Storm Ana 7
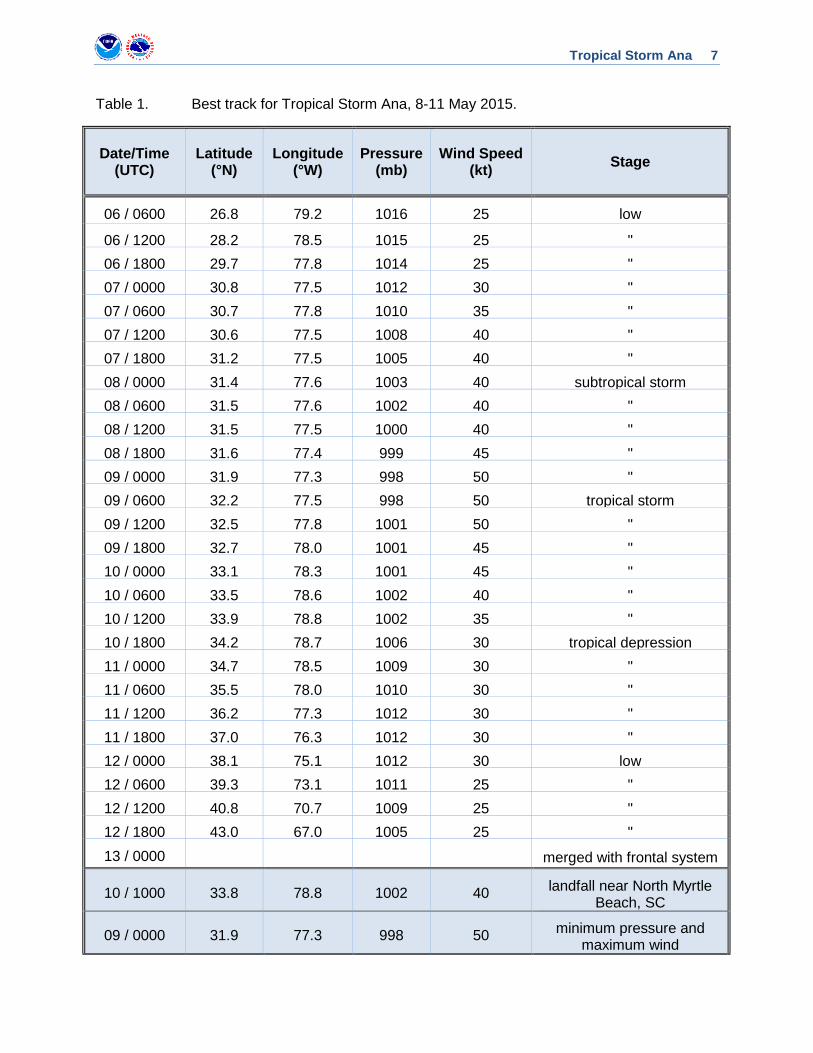
Table 1. Best track for Tropical Storm Ana, 8-11 May 2015.
Date/Time (UTC)
Latitude (°N)
Longitude (°W)
Pressure (mb)
Wind Speed (kt) Stage
06 / 0600 26.8 79.2 1016 25 low
06 / 1200 28.2 78.5 1015 25 " 06 / 1800 29.7 77.8 1014 25 " 07 / 0000 30.8 77.5 1012 30 " 07 / 0600 30.7 77.8 1010 35 " 07 / 1200 30.6 77.5 1008 40 " 07 / 1800 31.2 77.5 1005 40 " 08 / 0000 31.4 77.6 1003 40 subtropical storm 08 / 0600 31.5 77.6 1002 40 " 08 / 1200 31.5 77.5 1000 40 " 08 / 1800 31.6 77.4 999 45 " 09 / 0000 31.9 77.3 998 50 " 09 / 0600 32.2 77.5 998 50 tropical storm 09 / 1200 32.5 77.8 1001 50 " 09 / 1800 32.7 78.0 1001 45 " 10 / 0000 33.1 78.3 1001 45 " 10 / 0600 33.5 78.6 1002 40 " 10 / 1200 33.9 78.8 1002 35 " 10 / 1800 34.2 78.7 1006 30 tropical depression 11 / 0000 34.7 78.5 1009 30 " 11 / 0600 35.5 78.0 1010 30 " 11 / 1200 36.2 77.3 1012 30 " 11 / 1800 37.0 76.3 1012 30 " 12 / 0000 38.1 75.1 1012 30 low 12 / 0600 39.3 73.1 1011 25 " 12 / 1200 40.8 70.7 1009 25 " 12 / 1800 43.0 67.0 1005 25 " 13 / 0000 merged with frontal system
10 / 1000 33.8 78.8 1002 40 landfall near North Myrtle Beach, SC
09 / 0000 31.9 77.3 998 50 minimum pressure and maximum wind

Tropical Storm Ana 8
Table 2. Number of hours in advance of formation of Ana associated with the first NHC Special Tropical Weather Outlook forecast in the indicated likelihood category. Note that the timings for the “Low” category do not include forecasts of a 0% chance of genesis.
Hours Before Genesis
48-Hour Outlook 120-Hour Outlook
Low (<30%) 58 106
Medium (40%-60%) 36 58
High (>70%) 18 18
Table 3. Selected ship reports with winds of at least 34 kt for Tropical Storm Ana, 8-11 May 2015.
Date/Time (UTC)
Ship/Buoy call sign
Latitude (°N)
Longitude (°W)
Wind dir/speed (kt)
Pressure (mb)
08 / 0000 WCDP 32.9 73.1 080 / 35 1016.5
09 / 1800 WGJT 26.9 76.4 310 / 38 1015.1
09 / 1800 WCAH 30.9 72.7 360 / 38 1021.1
10 / 0000 3EFD9 32.7 76.1 140 / 37 1016.7
10 / 0600 3EFD9 32.2 78.1 200 / 38 1014.2
10 / 0600 MMER9 30.2 77.5 080 / 35 1018.9
10 / 0600 WGAX 32.1 76.8 140 / 40 1016.3
10 / 1200 C6VG8 35.3 74.7 140 / 35 1021.0
Tropical Storm Ana 9
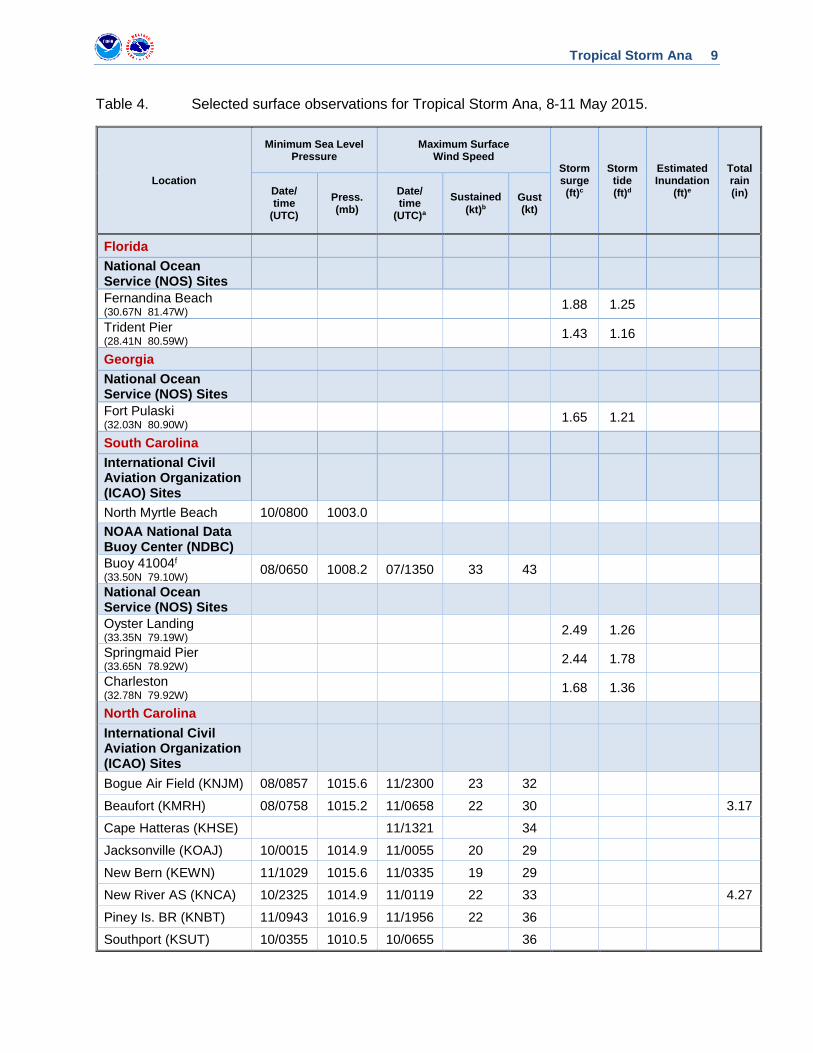
Table 4. Selected surface observations for Tropical Storm Ana, 8-11 May 2015.
Location
Minimum Sea Level Pressure
Maximum Surface Wind Speed
Storm surge (ft)c
Storm tide (ft)d
Estimated Inundation
(ft)e
Total rain (in) Date/
time (UTC)
Press. (mb)
Date/ time
(UTC)a
Sustained (kt)b
Gust (kt)
Florida National Ocean Service (NOS) Sites Fernandina Beach (30.67N 81.47W) 1.88 1.25 Trident Pier (28.41N 80.59W) 1.43 1.16
Georgia National Ocean Service (NOS) Sites Fort Pulaski (32.03N 80.90W) 1.65 1.21
South Carolina International Civil Aviation Organization (ICAO) Sites
North Myrtle Beach 10/0800 1003.0 NOAA National Data Buoy Center (NDBC)
Buoy 41004f (33.50N 79.10W) 08/0650 1008.2 07/1350 33 43
National Ocean Service (NOS) Sites
Oyster Landing (33.35N 79.19W) 2.49 1.26
Springmaid Pier (33.65N 78.92W) 2.44 1.78
Charleston (32.78N 79.92W) 1.68 1.36
North Carolina International Civil Aviation Organization (ICAO) Sites
Bogue Air Field (KNJM) 08/0857 1015.6 11/2300 23 32 Beaufort (KMRH) 08/0758 1015.2 11/0658 22 30 3.17
Cape Hatteras (KHSE) 11/1321 34
Jacksonville (KOAJ) 10/0015 1014.9 11/0055 20 29
New Bern (KEWN) 11/1029 1015.6 11/0335 19 29
New River AS (KNCA) 10/2325 1014.9 11/0119 22 33 4.27
Piney Is. BR (KNBT) 11/0943 1016.9 11/1956 22 36 Southport (KSUT) 10/0355 1010.5 10/0655 36

Tropical Storm Ana 10
Location
Minimum Sea Level Pressure
Maximum Surface Wind Speed
Storm surge (ft)c
Storm tide (ft)d
Estimated Inundation
(ft)e
Total rain (in) Date/
time (UTC)
Press. (mb)
Date/ time
(UTC)a
Sustained (kt)b
Gust (kt)
Wilmington (KILM) 10/2113 1013.2 10/2129 35 C-MAN sites Beaufort Tide (BFTN7)g 08/0800 1014.2 11/0400 28 32 Cape Lookout (CLKN7)h 08/0800 1014.6 10/1330 26 35 Coastal Ocean Research and Monitoring Program (CORMP)
Ocean Crest Pier (OCP1 – 33.91N 78.15W) 10/0402 1008.0 10/0417 35 52 Sunset Beach Near Shore (SSBN7 – 33.83N 78.48W)
10/0808 1002.4 10/0508 36 51
Weather Underground Kure Beach (KNCKUREB2 – 34.00N 77.91W)
10/0324 1010.2 10/0925 39 45
Weatherflow Alligator River Bridge (35.90N 76.01W) 11/1416 1014.1 11/1546 30 37 Fort Macon (34.70N 76.71W) 08/0758 1012.2 09/1028 27 38 Ocracoke (35.13N 76.00W) 11/0705 1016.4 11/0615 29 38 Pamlico Sound (35.42N 75.83W) 11/0815 1015.0 11/1325 32 41 National Ocean Service (NOS) Sites Oregon Inlet Marina (35.80N 75.55W) 1.56 0.98 Wilmington (34.23N 77.95W) 2.27 1.52 Wrightsville Beach (34.21N 77.79W) 1.52 1.48 NWS Cooperative Observer Program (COOP) Sites
7 SE Kinston (35.20N 77.50W) 6.87
Jacksonville EOC (34.76N 77.40W) 4.13
Snow Hill (35.45N 77.67W) 3.64
Perrytown (35.05N 77.09W) 3.63
2.0 WNW Morehead City (34.73N 76.76W) 3.16

Tropical Storm Ana 11
Location
Minimum Sea Level Pressure
Maximum Surface Wind Speed
Storm surge (ft)c
Storm tide (ft)d
Estimated Inundation
(ft)e
Total rain (in) Date/
time (UTC)
Press. (mb)
Date/ time
(UTC)a
Sustained (kt)b
Gust (kt)
Atlantic Beach (34.70N 76.74W) 3.08
Automated Weather Observing System (AWOS)
Kenansville (34.96N 77.97W) 3.87
CoCoRaHS Sites 7 SW Kinston (35.20N 77.68W) 6.89
2.8 NW Richlands (34.92N 77.58W) 6.03
1 NW Jacksonville (34.77N 77.42W) 5.80
1.2 NE Jacksonville (34.77N 77.39W) 5.15
Gurganus (34.75N 77.65W) 4.79
3.3 NW Swansboro (34.72N 77.17W) 4.47
4.9 SE Hubert (34.67N 77.18W) 4.04
0.5 E Emerald Island (34.66N 77.02W) 3.92
0.4 SW Marshallberg (34.71N 76.52W) 3.51
2.5 WNW Manteo (35.91N 75.71W) 3.01
Virginia
C-MAN sites Chesapeake Bay Light (CHLV2)i 11/1900 1013.0 11/1830 34 37
a Date/time is for sustained wind when both sustained and gust are listed. b Except as noted, sustained wind averaging periods for C-MAN and land-based reports are 2 min; buoy averaging periods
are 8 min. c Storm surge is water height above normal astronomical tide level. d For most locations, storm tide is water height above the North American Vertical Datum of 1988 (NAVD88). Storm tide is
water height above Mean Lower Low Water (MLLW) for NOS stations in Puerto Rico, the U.S. Virgin Islands, and Barbados. e Estimated inundation is the maximum height of water above ground. For some USGS storm tide pressure sensors,
inundation is estimated by subtracting the elevation of the sensor from the recorded storm tide. For other USGS storm tide sensors and USGS high-water marks, inundation is estimated by subtracting the elevation of the land derived from a Digital Elevation Model (DEM) from the recorded and measured storm tide. For NOS tide gauges, the height of the water above Mean Higher High Water (MHHW) is used as a proxy for inundation.
f Anemometer height 5 meters. g Anemometer height 7 meters. h Anemometer height 9.8 meters. I Anemometer height 43 meters.
Tropical Storm Ana 12
Table 5a. NHC official (OFCL) and climatology-persistence skill baseline (OCD5) track forecast errors (n mi) for Tropical Storm Ana. Mean errors for the previous 5-yr period are shown for comparison. Official errors that are smaller than the 5-yr means are shown in boldface type.
Forecast Period (h)
12 24 36 48 72 96 120
OFCL 12.1 13.0 23.0 30.5 85.3
OCD5 25.6 50.7 77.3 115.6 215.2
Forecasts 12 12 10 8 4
OFCL (2010-14) 28.4 45.0 60.4 77.1 113.1 157.8 210.0
OCD5 (2010-14) 48.3 101.5 161.5 222.6 329.8 412.6 483.9
Tropical Storm Ana 13
Table 5b. Homogeneous comparison of selected track forecast guidance models (in n mi) for Tropical Storm Ana. Errors smaller than the NHC official forecast are shown in boldface type. The number of official forecasts shown here will generally be smaller than that shown in Table 5a due to the homogeneity requirement.
Model ID Forecast Period (h)
12 24 36 48 72 96 120
OFCL 10.6 10.0 17.8 21.3 68.8
OCD5 25.5 45.7 79.4 108.2 162.2
GFSI 9.5 8.4 17.2 24.0 86.2
EMXI 15.2 16.4 31.3 24.3 66.4
UKMI 13.6 20.1 32.6 40.9 139.8
EGRI 12.8 19.7 31.9 41.4 139.8
AEMI 8.6 14.9 19.9 28.6 97.2
FSSE 10.4 11.1 18.4 16.1 79.5
GHMI 10.7 13.5 24.0 50.9 135.0
HWFI 14.1 16.3 20.1 34.2 60.8
NAMI 28.6 44.0 56.1 66.0 88.9
TCON 9.2 9.2 15.0 25.0 97.2
TVCA 10.4 9.7 15.1 22.9 89.5
BAMD 31.5 60.3 100.1 133.8 277.9
BAMM 17.6 35.8 61.2 70.2 119.9
BAMS 36.4 76.6 105.2 126.3 75.9
LBAR 29.4 58.8 100.9 159.9 295.8
Forecasts 6 6 6 5 1

Tropical Storm Ana 14
Table 6a. NHC official (OFCL) and climatology-persistence skill baseline (OCD5) intensity forecast errors (kt) for Tropical Storm Ana. Mean errors for the previous 5-yr period are shown for comparison. Official errors that are smaller than the 5-yr means are shown in boldface type.
Forecast Period (h)
12 24 36 48 72 96 120
OFCL 3.3 2.5 3.0 3.8 0.0
OCD5 5.6 7.5 8.3 7.4 4.3
Forecasts 12 12 10 8 4
OFCL (2010-14) 6.2 9.4 11.5 13.3 14.6 14.6 15.8
OCD5 (2010-14) 7.3 10.8 13.3 15.3 17.7 17.8 17.6

Tropical Storm Ana 15
Table 6b. Homogeneous comparison of selected intensity forecast guidance models (in kt) for Tropical Storm Ana. Errors smaller than the NHC official forecast are shown in boldface type. The number of official forecasts shown here will generally be smaller than that shown in Table 6a due to the homogeneity requirement.
Model ID Forecast Period (h)
12 24 36 48 72 96 120
OFCL 3.3 1.7 2.5 2.0 0.0
OCD5 7.2 5.8 5.3 4.6 5.0
GHMI 6.0 5.3 6.8 5.8 2.0
HWFI 3.0 3.0 3.3 2.2 4.0
FSSE 3.7 2.8 3.0 3.0 6.0
DSHP 5.5 4.0 3.0 3.4 2.0
LGEM 6.7 5.2 4.5 5.2 1.0
ICON 5.5 4.5 3.5 3.0 1.0
IVCN 5.5 4.5 3.5 3.0 1.0
GFSI 6.5 6.5 7.2 7.6 8.0
UKMI 4.8 5.2 7.0 8.8 1.0
EMXI 5.7 9.2 10.5 11.4 4.0
NAMI 5.2 8.7 11.2 11.2 2.0
Forecasts 6 6 6 5 1

Tropical Storm Ana 16
Table 7. Watch and warning summary for Tropical Storm Ana, 8-11 May 2015.
Date/Time (UTC) Action Location
8 / 0300 Tropical Storm Watch issued Edisto Beach, SC to Cape Lookout, NC
8 / 1500 Tropical Storm Watch modified to north of Surf City, NC to Cape Lookout, NC
8 / 1500 Tropical Storm Warning issued South Santee River, SC to Surf City, NC
8 / 2100 Tropical Storm Watch modified Edisto Beach, SC to south of South Santee River, SC
8 / 2100 Tropical Storm Warning modified to South Santee River, SC to Cape Lookout, NC
10 / 0000 Tropical Storm Watch discontinued All
10 / 1500 Tropical Storm Warning discontinued
north of Surf City, NC to Cape Lookout, NC
10 / 1500 Tropical Storm Warning discontinued
south of Little River Inlet, SC to South Santee River, SC
10 / 1800 Tropical Storm Warning discontinued All
Tropical Storm Ana 17
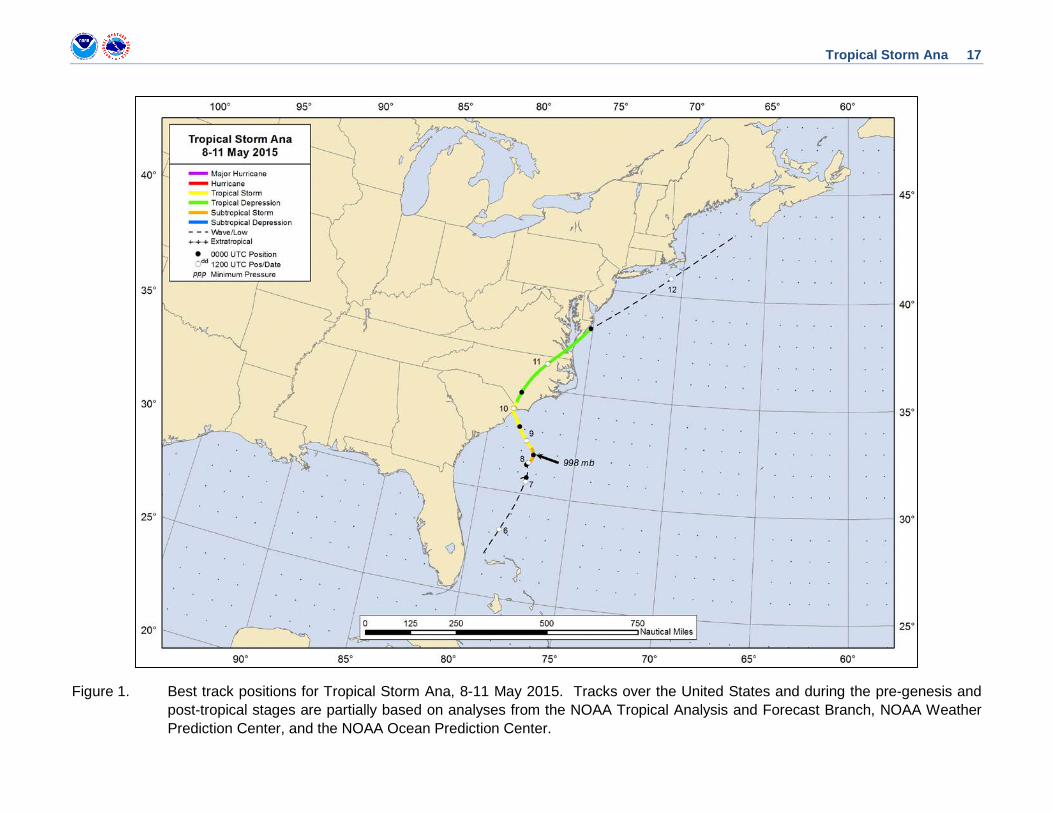
Figure 1. Best track positions for Tropical Storm Ana, 8-11 May 2015. Tracks over the United States and during the pre-genesis and post-tropical stages are partially based on analyses from the NOAA Tropical Analysis and Forecast Branch, NOAA Weather Prediction Center, and the NOAA Ocean Prediction Center.

Tropical Storm Ana 18
Figure 2. Selected wind observations and best track maximum sustained surface wind speed curve for Tropical Storm Ana, 8-11 May 2015. Aircraft observations have been adjusted for elevation using an 80% adjustment factor for observations from both the 850 mb level and 1000 ft altitude. Dropwindsonde observations include actual 10 m winds (sfc), as well as surface estimates derived from the mean wind over the lowest 150 m of the wind sounding (LLM). Advanced Dvorak Technique estimates represent the Current Intensity at the nominal observation time. AMSU intensity estimates are from the Cooperative Institute for Meteorological Satellite Studies technique. Dashed vertical lines correspond to 0000 UTC, and the solid vertical line corresponds to landfall.
20
30
40
50
60
70
5/5 5/7 5/9 5/11 5/13
BEST TRACKSat (TAFB)Sat (SAB)ADTAC (sfc)AC (flt->sfc)AC (DVK P->W)ScatterometerSurfaceDrop (sfc)Drop (LLM xtrp)AMSUAnalysis
Win
d Sp
eed
(kt)
Date (Month/Day)
Tropical Storm Ana8 - 11 May 2015
Tropical Storm Ana 19
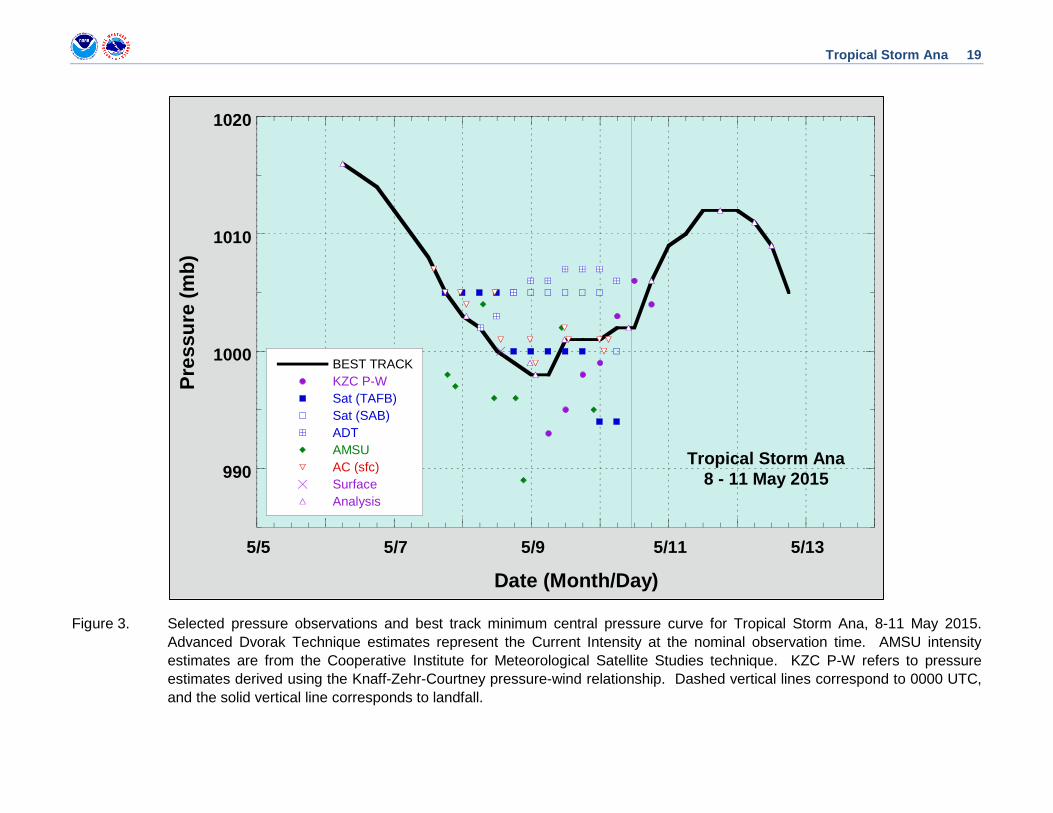
Figure 3. Selected pressure observations and best track minimum central pressure curve for Tropical Storm Ana, 8-11 May 2015. Advanced Dvorak Technique estimates represent the Current Intensity at the nominal observation time. AMSU intensity estimates are from the Cooperative Institute for Meteorological Satellite Studies technique. KZC P-W refers to pressure estimates derived using the Knaff-Zehr-Courtney pressure-wind relationship. Dashed vertical lines correspond to 0000 UTC, and the solid vertical line corresponds to landfall.
990
1000
1010
1020
5/5 5/7 5/9 5/11 5/13
BEST TRACKKZC P-WSat (TAFB)Sat (SAB)ADTAMSUAC (sfc)SurfaceAnalysis
Pres
sure
(mb)
Date (Month/Day)
Tropical Storm Ana8 - 11 May 2015
Tropical Storm Ana 20
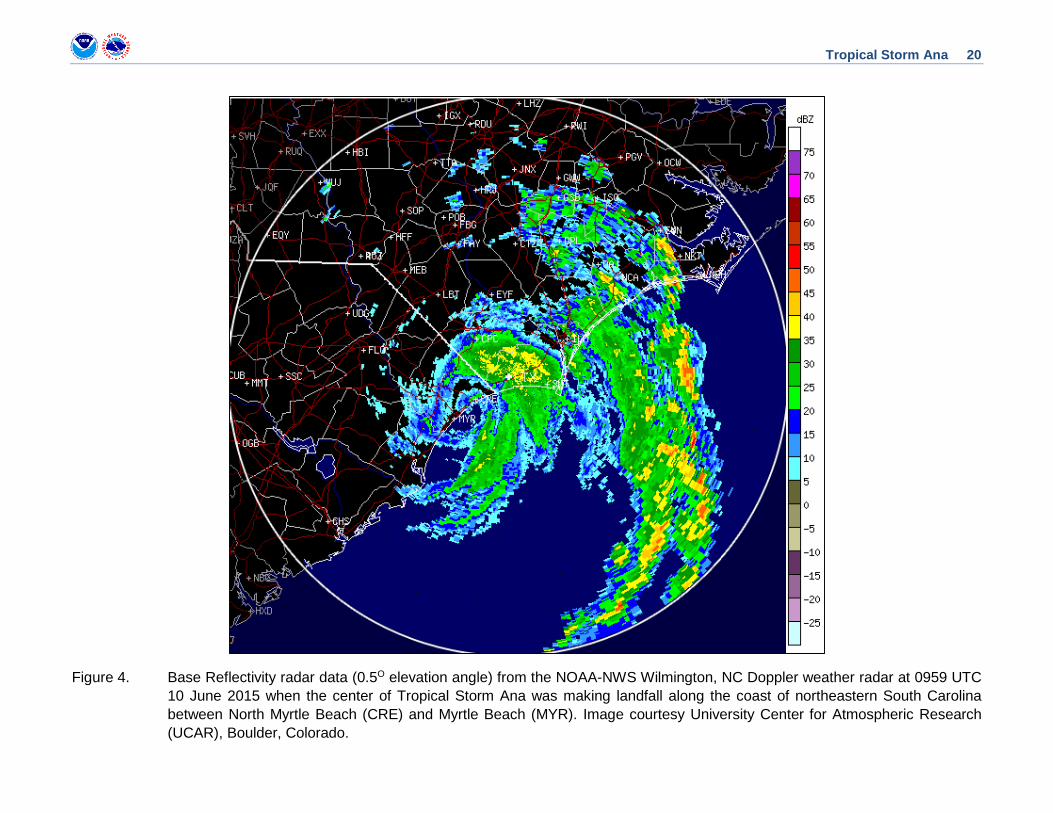
Figure 4. Base Reflectivity radar data (0.5O elevation angle) from the NOAA-NWS Wilmington, NC Doppler weather radar at 0959 UTC 10 June 2015 when the center of Tropical Storm Ana was making landfall along the coast of northeastern South Carolina between North Myrtle Beach (CRE) and Myrtle Beach (MYR). Image courtesy University Center for Atmospheric Research (UCAR), Boulder, Colorado.
Tropical Storm Ana 21
Figure 5. Map of rainfall totals associated with Tropical Storm Ana, 8-11 May 2015.

Tropical Storm Ana 22
Figure 6. Selected official track forecasts (dashed light blue lines, with 0, 12, 24, 36, 48, and 72 h positions indicated) for (Sub)Tropical Storm Ana, 8-11 May 2015. The best track is given by the solid and dashed white line with positions given at 6 h interval. Pre-genesis and post-tropical stages are indicated with white “L” symbols. Only small cross-track differences occurred between forecast cycles prior to and after Ana’s landfall.