TROPICAL STORM ALVIN - National Hurricane Center · · 2016-01-20TROPICAL CYCLONE REPORT TROPICAL...
12
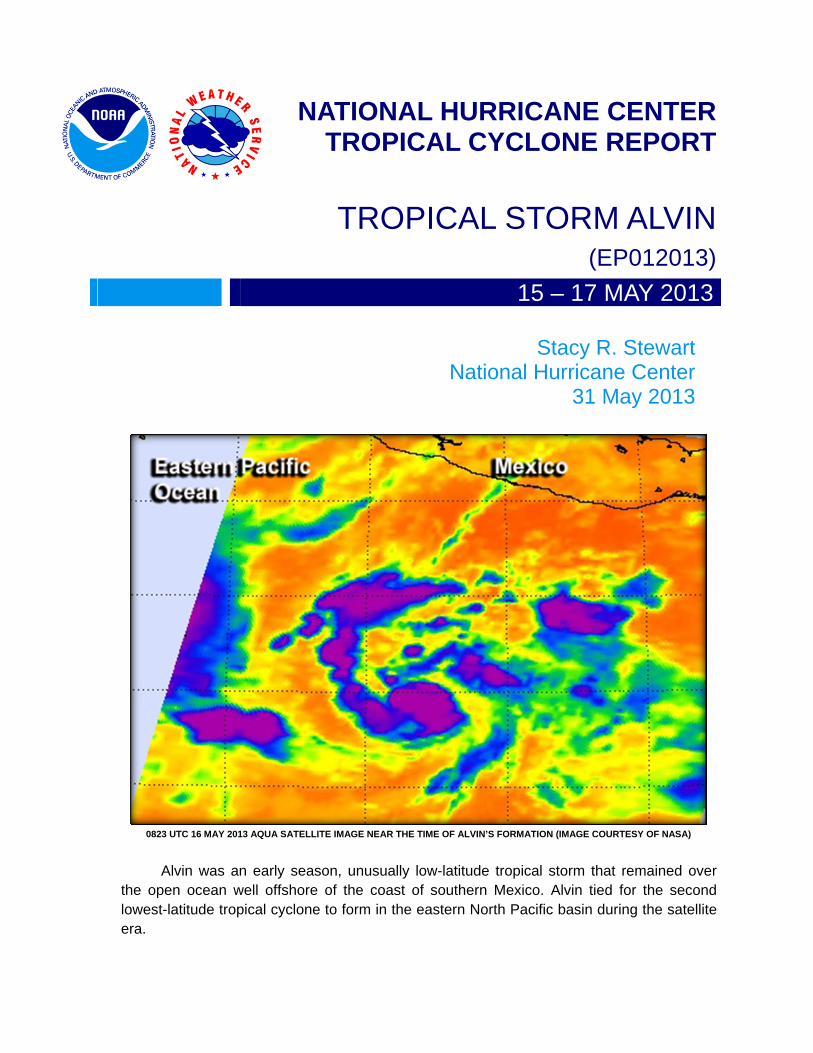
NATIONAL HURRICANE CENTER TROPICAL CYCLONE REPORT TROPICAL STORM ALVIN (EP012013) 15 – 17 MAY 2013 Stacy R. Stewart National Hurricane Center 31 May 2013 0823 UTC 16 MAY 2013 AQUA SATELLITE IMAGE NEAR THE TIME OF ALVIN’S FORMATION (IMAGE COURTESY OF NASA) Alvin was an early season, unusually low-latitude tropical storm that remained over the open ocean well offshore of the coast of southern Mexico. Alvin tied for the second lowest-latitude tropical cyclone to form in the eastern North Pacific basin during the satellite era.
-
Upload
trinhkhanh -
Category
Documents
-
view
218 -
download
3
Transcript of TROPICAL STORM ALVIN - National Hurricane Center · · 2016-01-20TROPICAL CYCLONE REPORT TROPICAL...
NATIONAL HURRICANE CENTERTROPICAL CYCLONE REPORT
TROPICAL STORM ALVIN (EP012013)
15 – 17 MAY 2013
Stacy R. Stewart National Hurricane Center
31 May 2013
0823 UTC 16 MAY 2013 AQUA SATELLITE IMAGE NEAR THE TIME OF ALVIN’S FORMATION (IMAGE COURTESY OF NASA)
Alvin was an early season, unusually low-latitude tropical storm that remained over
the open ocean well offshore of the coast of southern Mexico. Alvin tied for the second lowest-latitude tropical cyclone to form in the eastern North Pacific basin during the satellite era.
Tropical Storm Alvin 2
Tropical Storm Alvin 1 5 – 1 7 M AY 2 0 1 3
SYNOPTIC HISTORY
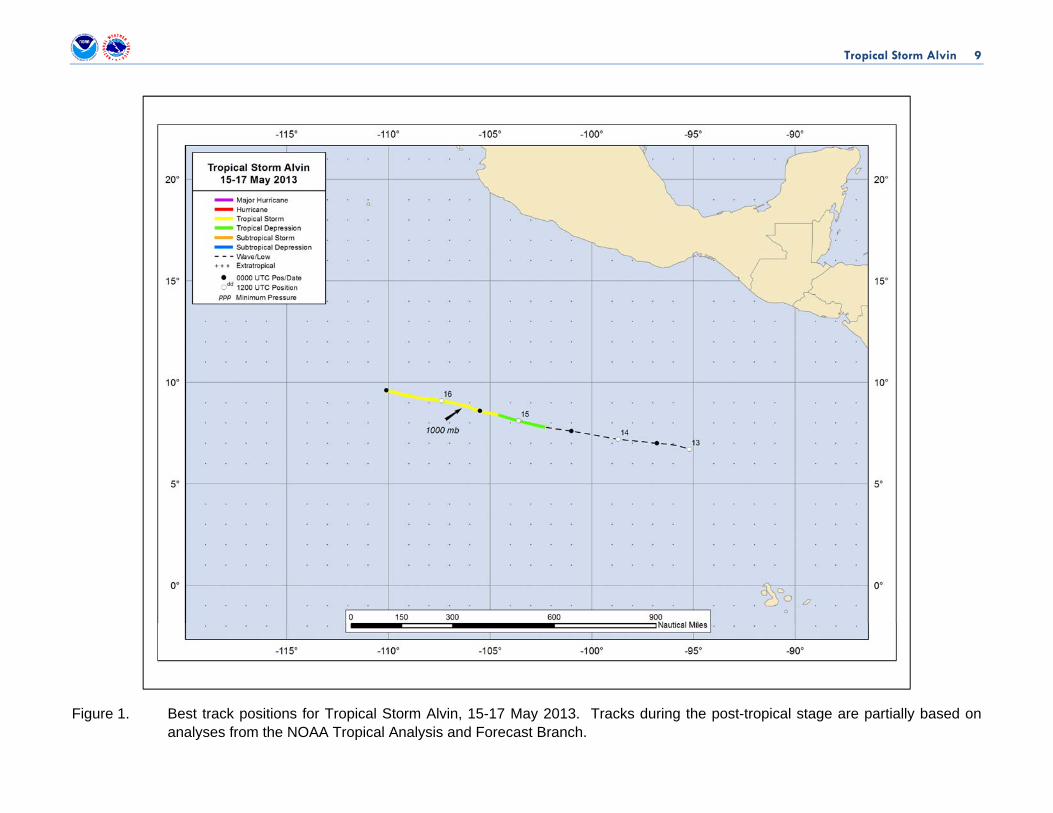
Alvin formed from a tropical wave that was first noted on 4 May over northeastern South America and the southeastern Caribbean Sea. The wave moved westward across northern South America and gradually became better defined while associated deep convection steadily increased. By 9 May, the low-latitude tropical wave had crossed Colombia and Central America, and moved into the eastern North Pacific Ocean. The wave continued its westward motion and a broad surface low developed along the wave axis by 13 May about 500 n mi south of the Gulf of Tehuantepec. Convection steadily increased over the next 48 h while the low gradually became better defined. Small curved bands of thunderstorms developed around a well-defined low-level center early on 15 May, and a tropical depression formed around 0600 UTC that day about 565 n mi south-southwest of Acapulco, Mexico. Over the next 12 h, convection increased and became better organized, and a scatterometer overpass indicated that the depression had strengthened into a tropical storm. The “best track” chart of Alvin’s path is given in Fig. 1, with the wind and pressure histories shown in Figs. 2 and 3, respectively. The best track positions and intensities are listed in Table 11.
Alvin turned toward the west-northwest as it moved around the southern periphery of a subtropical ridge over central Mexico. Weak vertical shear and very warm sea-surface temperatures helped induce a period of strengthening, and Alvin reached its peak intensity of 50 kt around 0600 UTC 16 May when the cyclone was located about 625 n mi south-southwest of Manzanillo, Mexico (Fig. 4). However, the intensification trend was short-lived, most likely due to a combination of increasing westerly vertical wind shear and some dry air entrainment in the middle levels of the troposphere. These conditions resulted in erosion of the inner-core convection, which caused the storm to weaken almost as quickly as it had strengthened.
By 0000 UTC 17 May, the vertical wind shear increased sharply and the shear direction also backed around from westerly to southwesterly, further disrupting the convective pattern and causing the Alvin’s circulation to become elongated in a northeast-to-southwest orientation and opening up into a surface trough. The lack of a closed low-level circulation resulted in Alvin quickly dissipating just 6 h later about 675 n mi southwest of Manzanillo.
METEOROLOGICAL STATISTICS 1 A digital record of the complete best track, including wind radii, can be found on line at ftp://ftp.nhc.noaa.gov/atcf. Data for the current year’s storms are located in the btk directory, while previous years’ data are located in the archive directory.
Tropical Storm Alvin 3
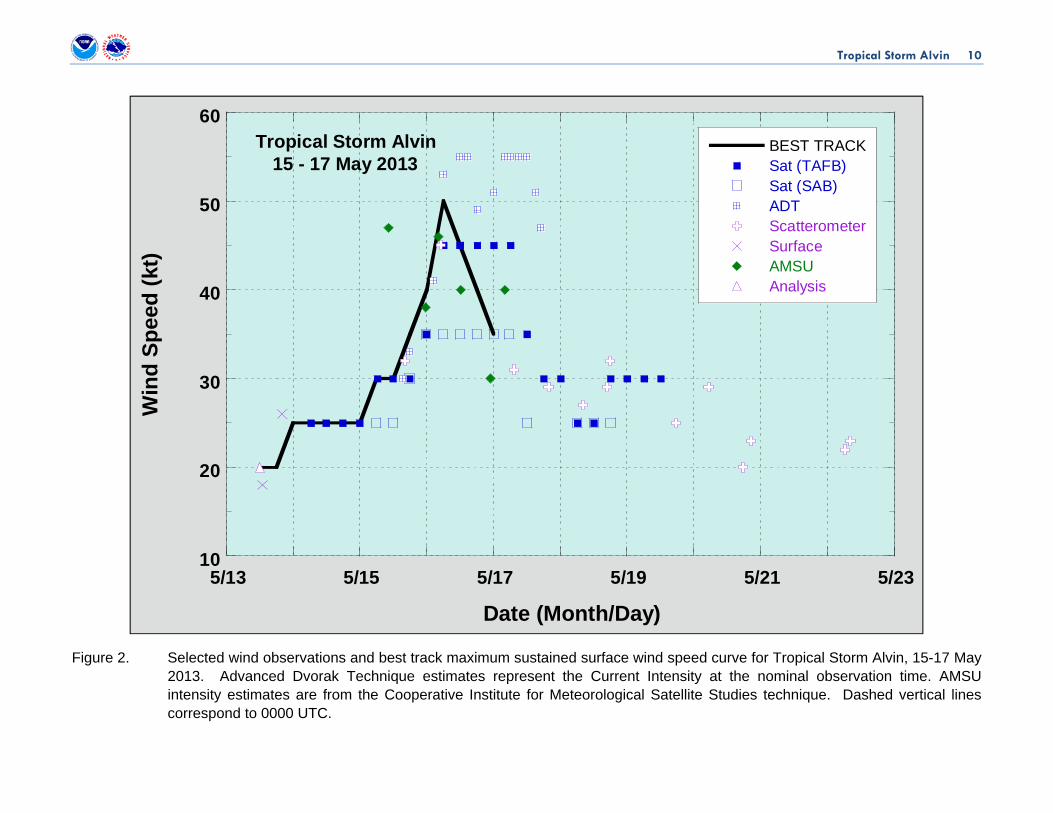
Observations in Alvin (Figs. 2 and 3) include subjective satellite-based Dvorak technique intensity estimates from the Tropical Analysis and Forecast Branch (TAFB) and the Satellite Analysis Branch (SAB), and objective Advanced Dvorak Technique (ADT) estimates from the Cooperative Institute for Meteorological Satellite Studies/University of Wisconsin-Madison. Data and imagery from NOAA polar-orbiting satellites including the Advanced Microwave Sounding Unit (AMSU), the NASA Tropical Rainfall Measuring Mission (TRMM) and Aqua satellites, the European Space Agency’s Advanced Scatterometer (ASCAT), and Defense Meteorological Satellite Program (DMSP) satellites, among others, were also useful in constructing the best track of Alvin.
Alvin’s genesis latitude of 7.8O N tied it with Hurricane Annette in June 1976 as the second lowest-latitude tropical cyclone to form in the eastern North Pacific basin. Only Hurricane Adolph in May 1983 developed at a lower latitude (7.1O N).
There were no ship reports of tropical-storm-force winds associated with Alvin.
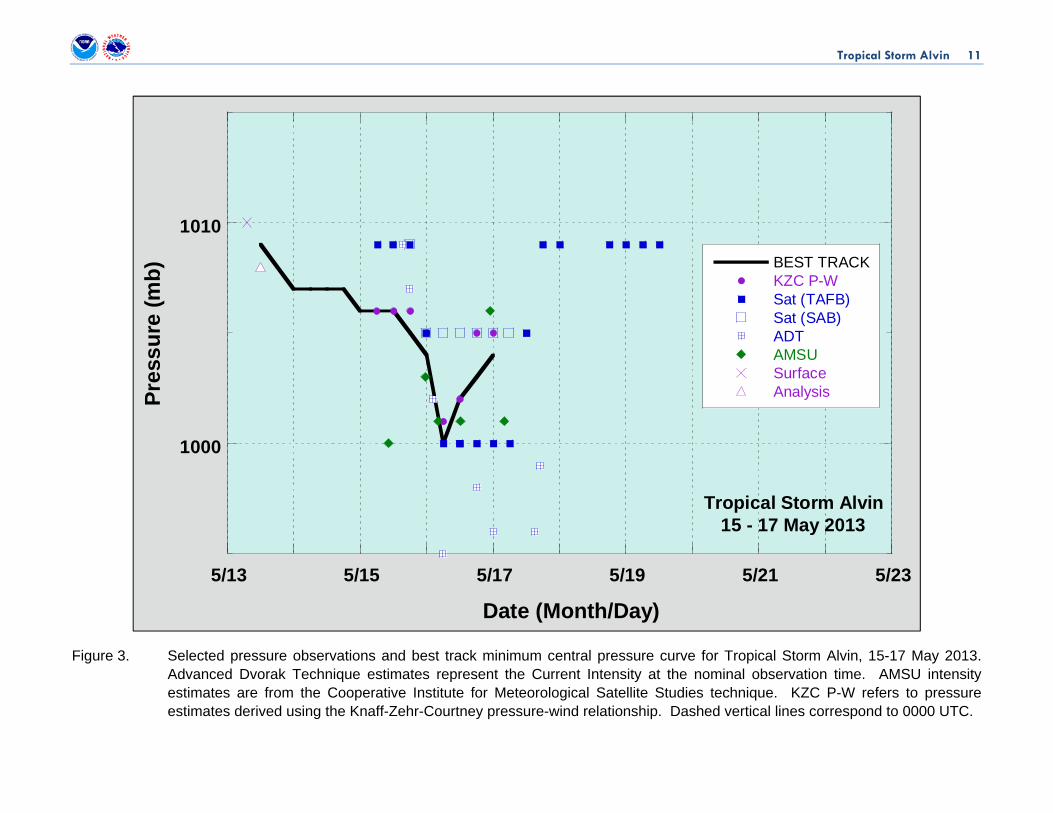
The 50-kt analyzed peak intensity of Alvin at 0600 UTC 16 May is based on a blend of Dvorak T-numbers of 3.0/45 kt from TAFB and 3.5/55 kt from UW-CIMSS, and a 45-kt ASCAT surface wind measured. The estimated minimum pressure of 1000 mb, which was coincident with the peak intensity, is based on a Dvorak pressure estimate of 1000 mb from TAFB; the Knaff-Zehr-Courtney (KZC) pressure-wind relationship yielded a comparative estimate of 1001 mb.
CASUALTY AND DAMAGE STATISTICS There were no reports of damage or casualties associated with Alvin.
FORECAST AND WARNING CRITIQUE
The genesis of Alvin was somewhat well forecast, especially given its early season development. The system that became Alvin was occurring before the official 15 May start of the eastern North Pacific tropical cyclone season. A special Tropical Weather Outlook (TWO) was issued at 1600 UTC 14 May, indicating a medium chance (30-50%) of development during the next 48 h.
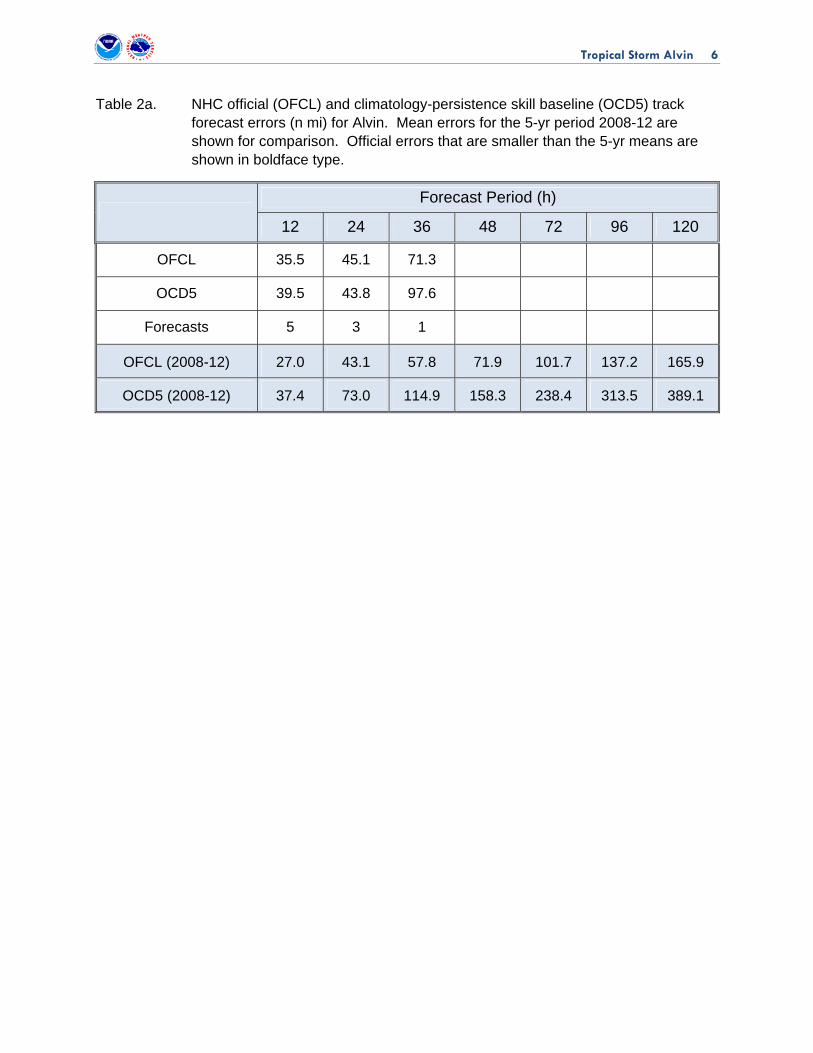
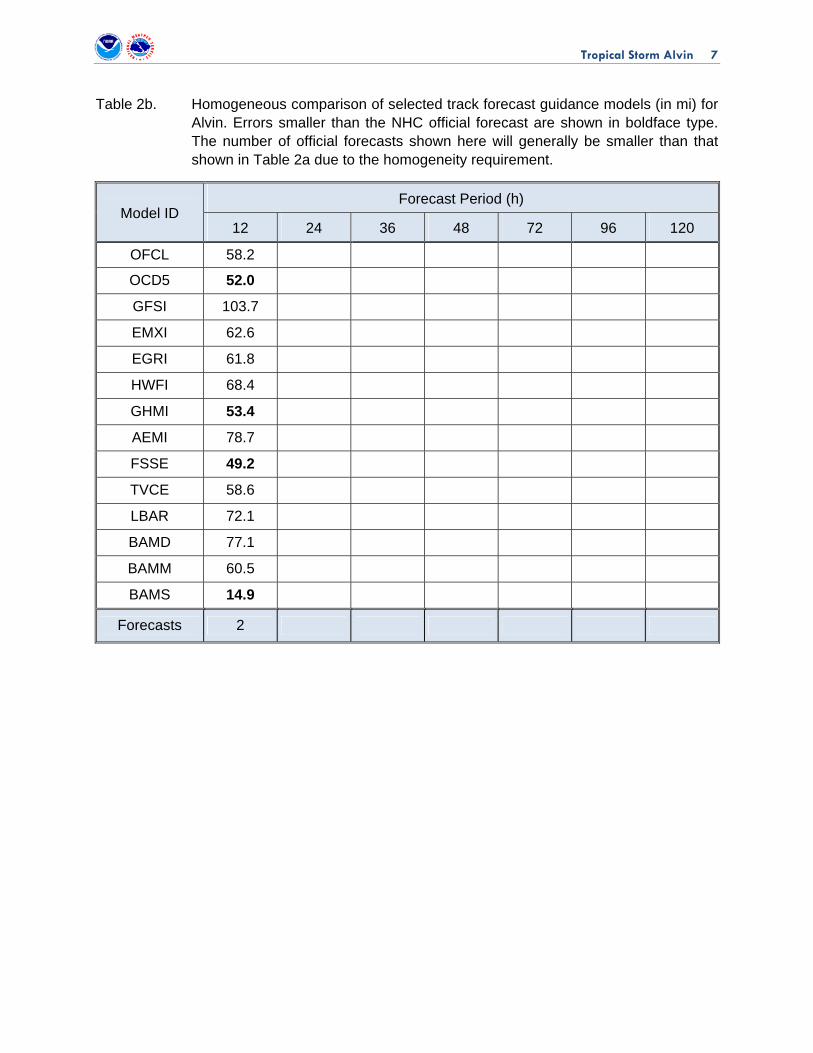
A verification of NHC official track forecasts for Alvin is given in Table 2a. Official forecast track errors were greater than the mean official errors for the previous 5-yr period. A homogeneous comparison of the official track errors with selected guidance models is given in Table 2b. Due to the small number of forecasts, a meaningful comparison of the official forecast with the various track models is not possible.
Tropical Storm Alvin 4
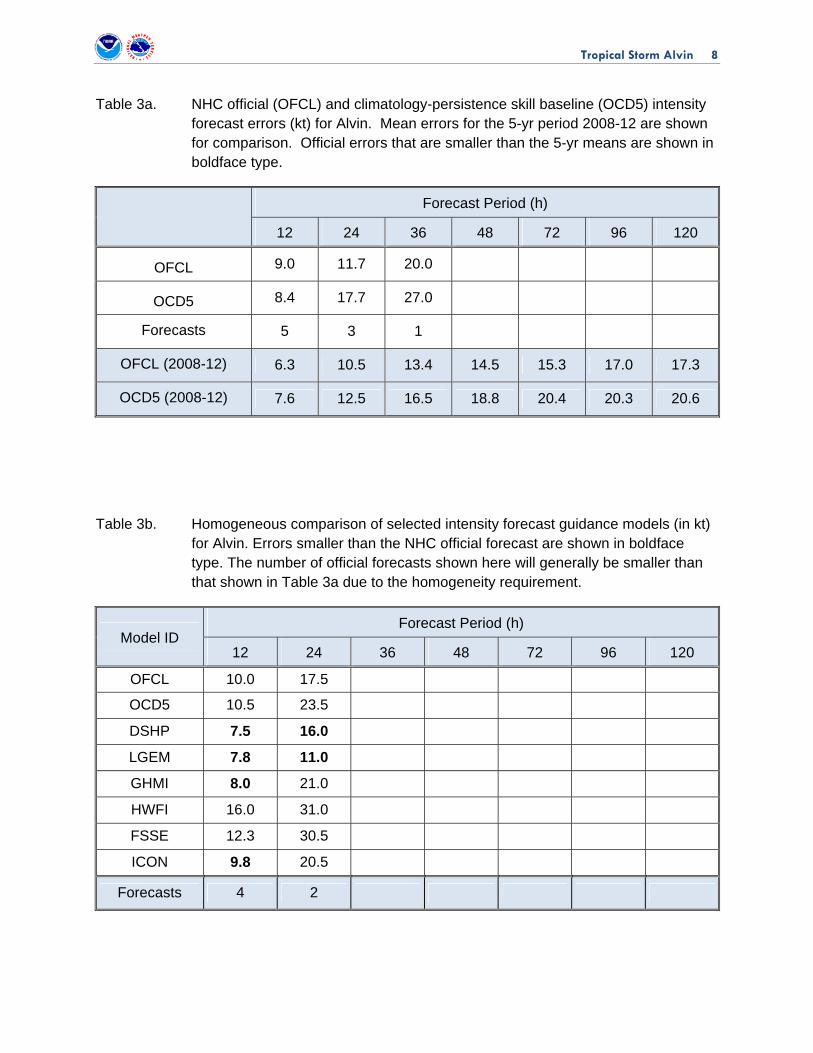
A verification of NHC official intensity forecasts for Alvin is given in Table 3a. Similar to the track errors, a meaningful comparison of the official forecast with the various intensity models is not possible due to the small number of forecasts available. A homogeneous comparison of the official intensity errors with selected guidance models is given in Table 3b.
No coastal watches or warnings were associated with Alvin.
Acknowledgements
Special thanks are offered to John Cangialosi from the National Hurricane Center for his preparation of the Tropical Storm Alvin track map.
Tropical Storm Alvin 5
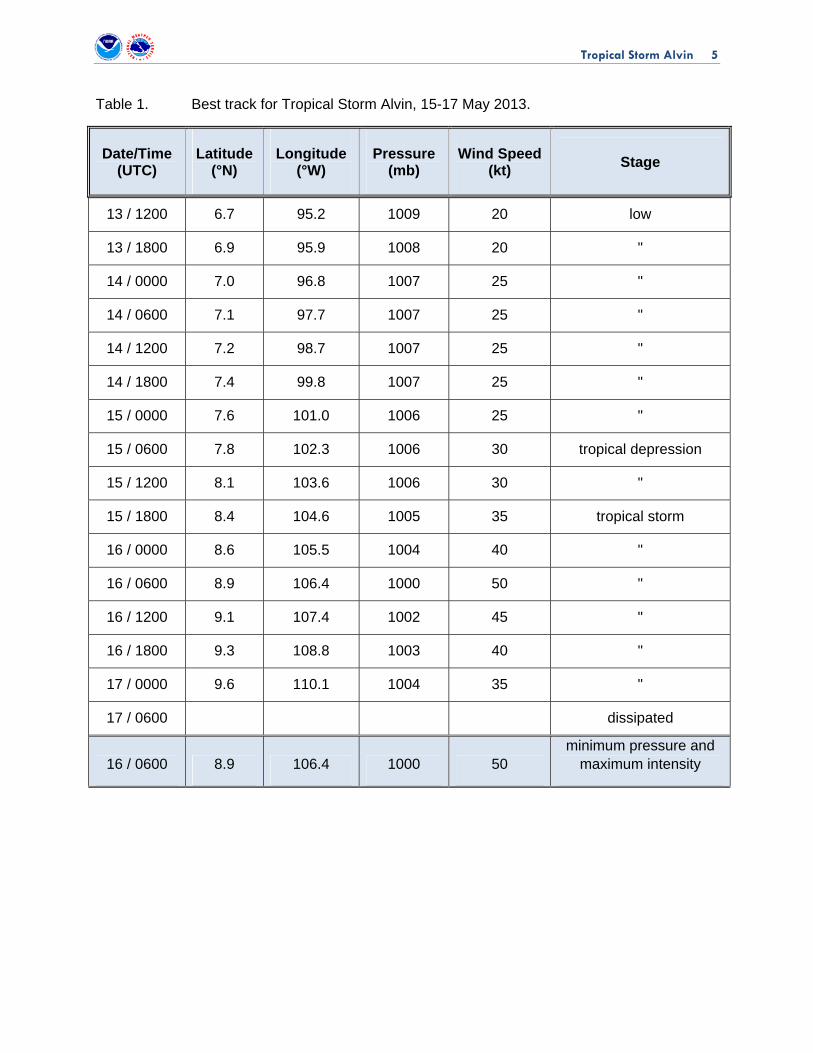
Table 1. Best track for Tropical Storm Alvin, 15-17 May 2013.
Date/Time (UTC)
Latitude (°N)
Longitude (°W)
Pressure (mb)
Wind Speed (kt)
Stage
13 / 1200 6.7 95.2 1009 20 low
13 / 1800 6.9 95.9 1008 20 "
14 / 0000 7.0 96.8 1007 25 "
14 / 0600 7.1 97.7 1007 25 "
14 / 1200 7.2 98.7 1007 25 "
14 / 1800 7.4 99.8 1007 25 "
15 / 0000 7.6 101.0 1006 25 "
15 / 0600 7.8 102.3 1006 30 tropical depression
15 / 1200 8.1 103.6 1006 30 "
15 / 1800 8.4 104.6 1005 35 tropical storm
16 / 0000 8.6 105.5 1004 40 "
16 / 0600 8.9 106.4 1000 50 "
16 / 1200 9.1 107.4 1002 45 "
16 / 1800 9.3 108.8 1003 40 "
17 / 0000 9.6 110.1 1004 35 "
17 / 0600 dissipated
16 / 0600 8.9 106.4 1000 50 minimum pressure and
maximum intensity
Tropical Storm Alvin 6
Table 2a. NHC official (OFCL) and climatology-persistence skill baseline (OCD5) track forecast errors (n mi) for Alvin. Mean errors for the 5-yr period 2008-12 are shown for comparison. Official errors that are smaller than the 5-yr means are shown in boldface type.
Forecast Period (h)
12 24 36 48 72 96 120
OFCL 35.5 45.1 71.3
OCD5 39.5 43.8 97.6
Forecasts 5 3 1
OFCL (2008-12) 27.0 43.1 57.8 71.9 101.7 137.2 165.9
OCD5 (2008-12) 37.4 73.0 114.9 158.3 238.4 313.5 389.1
Tropical Storm Alvin 7
Table 2b. Homogeneous comparison of selected track forecast guidance models (in mi) for Alvin. Errors smaller than the NHC official forecast are shown in boldface type. The number of official forecasts shown here will generally be smaller than that shown in Table 2a due to the homogeneity requirement.
Model ID Forecast Period (h)
12 24 36 48 72 96 120
OFCL 58.2
OCD5 52.0
GFSI 103.7
EMXI 62.6
EGRI 61.8
HWFI 68.4
GHMI 53.4
AEMI 78.7
FSSE 49.2
TVCE 58.6
LBAR 72.1
BAMD 77.1
BAMM 60.5
BAMS 14.9
Forecasts 2
Tropical Storm Alvin 8
Table 3a. NHC official (OFCL) and climatology-persistence skill baseline (OCD5) intensity forecast errors (kt) for Alvin. Mean errors for the 5-yr period 2008-12 are shown for comparison. Official errors that are smaller than the 5-yr means are shown in boldface type.
Forecast Period (h)
12 24 36 48 72 96 120
OFCL 9.0 11.7 20.0
OCD5 8.4 17.7 27.0
Forecasts 5 3 1
OFCL (2008-12) 6.3 10.5 13.4 14.5 15.3 17.0 17.3
OCD5 (2008-12) 7.6 12.5 16.5 18.8 20.4 20.3 20.6
Table 3b. Homogeneous comparison of selected intensity forecast guidance models (in kt) for Alvin. Errors smaller than the NHC official forecast are shown in boldface type. The number of official forecasts shown here will generally be smaller than that shown in Table 3a due to the homogeneity requirement.
Model ID Forecast Period (h)
12 24 36 48 72 96 120
OFCL 10.0 17.5
OCD5 10.5 23.5
DSHP 7.5 16.0
LGEM 7.8 11.0
GHMI 8.0 21.0
HWFI 16.0 31.0
FSSE 12.3 30.5
ICON 9.8 20.5
Forecasts 4 2
Tropical Storm Alvin 9
Figure 1. Best track positions for Tropical Storm Alvin, 15-17 May 2013. Tracks during the post-tropical stage are partially based on analyses from the NOAA Tropical Analysis and Forecast Branch.
Tropical Storm Alvin 10
Figure 2. Selected wind observations and best track maximum sustained surface wind speed curve for Tropical Storm Alvin, 15-17 May 2013. Advanced Dvorak Technique estimates represent the Current Intensity at the nominal observation time. AMSU intensity estimates are from the Cooperative Institute for Meteorological Satellite Studies technique. Dashed vertical lines correspond to 0000 UTC.
10
20
30
40
50
60
5/13 5/15 5/17 5/19 5/21 5/23
BEST TRACKSat (TAFB)Sat (SAB)ADTScatterometerSurfaceAMSUAnalysis
Win
d S
pee
d (
kt)
Date (Month/Day)
Tropical Storm Alvin15 - 17 May 2013
Tropical Storm Alvin 11
Figure 3. Selected pressure observations and best track minimum central pressure curve for Tropical Storm Alvin, 15-17 May 2013. Advanced Dvorak Technique estimates represent the Current Intensity at the nominal observation time. AMSU intensity estimates are from the Cooperative Institute for Meteorological Satellite Studies technique. KZC P-W refers to pressure estimates derived using the Knaff-Zehr-Courtney pressure-wind relationship. Dashed vertical lines correspond to 0000 UTC.
1000
1010
5/13 5/15 5/17 5/19 5/21 5/23
BEST TRACKKZC P-WSat (TAFB)Sat (SAB)ADTAMSUSurfaceAnalysisP
ress
ure
(m
b)
Date (Month/Day)
Tropical Storm Alvin15 - 17 May 2013
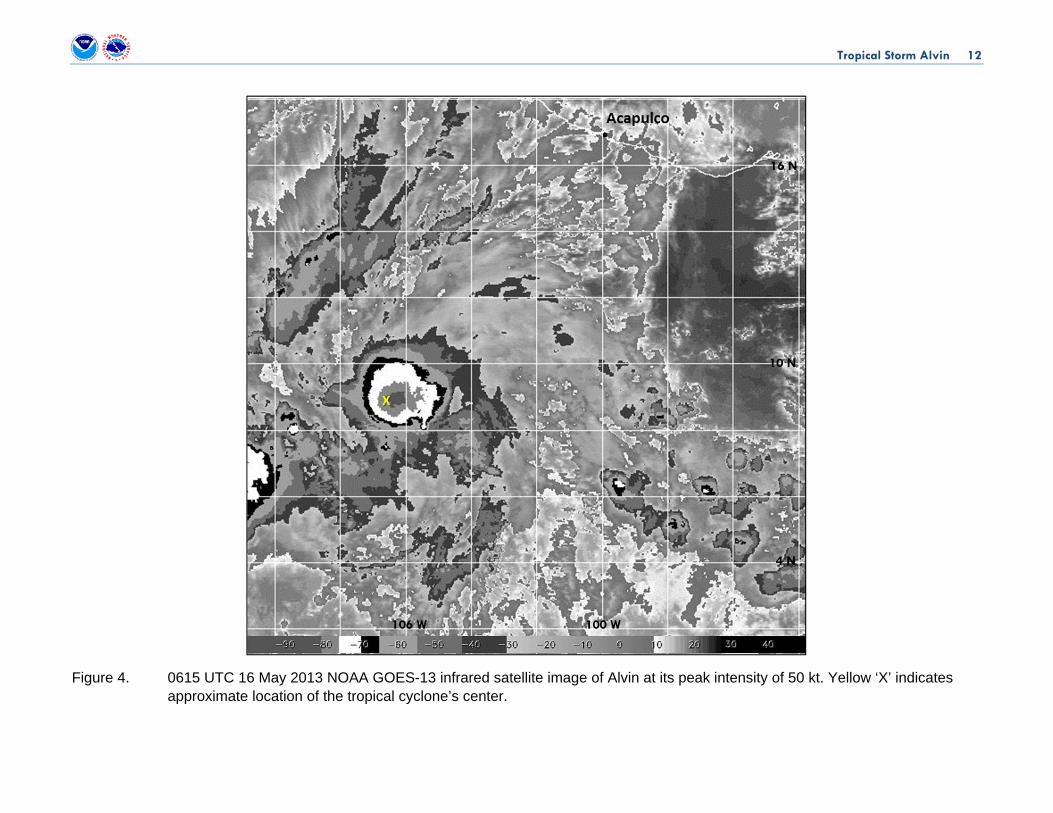
Tropical Storm Alvin 12
Figure 4. 0615 UTC 16 May 2013 NOAA GOES-13 infrared satellite image of Alvin at its peak intensity of 50 kt. Yellow ‘X’ indicates approximate location of the tropical cyclone’s center.
100 W
10 N
106 W
4 N
16 N