Trends in genetic diversity for all Kennel Club … in genetic diversity for all Kennel ... for...
10
RESEARCH Open Access Trends in genetic diversity for all Kennel Club registered pedigree dog breeds T. W. Lewis 1,2* , B.M. Abhayaratne 1 and S. C. Blott 2 Abstract Background: Inbreeding is inevitable in closed populations with a finite number of ancestors and where there is selection. Therefore, management of the rate of inbreeding at sustainable levels is required to avoid the associated detrimental effects of inbreeding. Studies have shown some pedigree dog breeds to have high levels of inbreeding and a high burden of inherited disease unrelated to selection objectives, implying loss of genetic diversity may be a particular problem for pedigree dogs. Pedigree analysis of all 215 breeds currently recognised by the UK Kennel Club over the period 1980–2014 was undertaken to ascertain parameters describing the rate of loss of genetic diversity due to inbreeding, and the presence of any general trend across all breeds. Results: The trend over all breeds was for the rate of inbreeding to be highest in the 1980s and 1990s, tending to decline after 2000. The trend was comparable in very common and rarer breeds, although was more pronounced in rarer breeds. Rates of inbreeding over the entire period 1980–2014 were not correlated with census population size. The existence of popular sires was apparent in all breeds. Conclusion: The trends detected over 1980–2014 imply an initial excessive loss of genetic diversity which has latterly fallen to sustainable levels, even with modest restoration in some cases. The theory of genetic contributions, which demonstrates the fundamental relationship of inbreeding and selection, implies that popular sires are the major contributor to high rate of inbreeding. Keywords: Dogs, Population genetics, Inbreeding, Effective population size Lay Summary Inbreeding’ is widely viewed as being harmful to the wellbeing of individuals and populations. In populations of a limited size, complete avoidance of breeding be- tween individuals with a shared ancestry quickly be- comes impossible. Furthermore, selection within dog breeds for desirable traits will inevitably result in the breeding of individuals that resemble each other with re- spect to the traits under selection. The resemblance of relatives is a fundamental principle of genetics, and means that selected individuals will on average be more closely related than a random pair taken from across the population. Therefore some degree of inbreeding is inev- itable in all populations; it is how quickly this changes that is informative. The rate of inbreeding in a popula- tion relates to the risk of detrimental effects associated with inbreeding (such as loss of genetic diversity, in- breeding depression and the spread of deleterious gen- etic variants). Therefore the rate of inbreeding is a measure of the sustainability of a population. This study reports the general trends in the rate of inbreeding ob- served through population analyses of all 215 pedigree dog breeds currently recognised by the UK Kennel Club, over the period 1980 to 2014. For all breeds, the trend was for the rate of inbreeding to be highest in the 1980s and 1990s, representing a major contraction in genetic diversity. Since 2000 how- ever, the general trend has been for the rate of inbreed- ing to decline to sustainable levels, with some modest restoration of genetic diversity in some cases. It is inter- esting that this coincides with the relaxation of the UK’ s quarantine laws, and is possibly due to the more wide- spread use of non-UK animals for breeding. The rate of inbreeding (or effective population size) showed no rela- tionship with the actual population size, as judged by mean number of KC registrations. Evidence of popular * Correspondence: [email protected] 1 The Kennel Club, 1-5 Clarges Street, Piccadilly, London W1J 8AB, UK 2 School of Veterinary Medicine and Science, The University of Nottingham, Sutton Bonington Campus, Sutton Bonington, Leicestershire LE12 5RD, UK © 2015 Lewis et al. Open Access This article is distributed under the terms of the Creative Commons Attribution 4.0 International License (http://creativecommons.org/licenses/by/4.0/), which permits unrestricted use, distribution, and reproduction in any medium, provided you give appropriate credit to the original author(s) and the source, provide a link to the Creative Commons license, and indicate if changes were made. The Creative Commons Public Domain Dedication waiver (http://creativecommons.org/publicdomain/zero/1.0/) applies to the data made available in this article, unless otherwise stated. Lewis et al. Canine Genetics and Epidemiology (2015) 2:13 DOI 10.1186/s40575-015-0027-4
Transcript of Trends in genetic diversity for all Kennel Club … in genetic diversity for all Kennel ... for...
RESEARCH Open Access
Trends in genetic diversity for all KennelClub registered pedigree dog breedsT. W. Lewis1,2* , B.M. Abhayaratne1 and S. C. Blott2
Abstract
Background: Inbreeding is inevitable in closed populations with a finite number of ancestors and where there isselection. Therefore, management of the rate of inbreeding at sustainable levels is required to avoid the associateddetrimental effects of inbreeding. Studies have shown some pedigree dog breeds to have high levels of inbreedingand a high burden of inherited disease unrelated to selection objectives, implying loss of genetic diversity may bea particular problem for pedigree dogs. Pedigree analysis of all 215 breeds currently recognised by the UK KennelClub over the period 1980–2014 was undertaken to ascertain parameters describing the rate of loss of genetic diversitydue to inbreeding, and the presence of any general trend across all breeds.
Results: The trend over all breeds was for the rate of inbreeding to be highest in the 1980s and 1990s, tending todecline after 2000. The trend was comparable in very common and rarer breeds, although was more pronouncedin rarer breeds. Rates of inbreeding over the entire period 1980–2014 were not correlated with census populationsize. The existence of popular sires was apparent in all breeds.
Conclusion: The trends detected over 1980–2014 imply an initial excessive loss of genetic diversity which has latterlyfallen to sustainable levels, even with modest restoration in some cases. The theory of genetic contributions, whichdemonstrates the fundamental relationship of inbreeding and selection, implies that popular sires are the majorcontributor to high rate of inbreeding.
Keywords: Dogs, Population genetics, Inbreeding, Effective population size
Lay SummaryInbreeding’ is widely viewed as being harmful to thewellbeing of individuals and populations. In populationsof a limited size, complete avoidance of breeding be-tween individuals with a shared ancestry quickly be-comes impossible. Furthermore, selection within dogbreeds for desirable traits will inevitably result in thebreeding of individuals that resemble each other with re-spect to the traits under selection. The resemblance ofrelatives is a fundamental principle of genetics, andmeans that selected individuals will on average be moreclosely related than a random pair taken from across thepopulation. Therefore some degree of inbreeding is inev-itable in all populations; it is how quickly this changesthat is informative. The rate of inbreeding in a popula-tion relates to the risk of detrimental effects associated
with inbreeding (such as loss of genetic diversity, in-breeding depression and the spread of deleterious gen-etic variants). Therefore the rate of inbreeding is ameasure of the sustainability of a population. This studyreports the general trends in the rate of inbreeding ob-served through population analyses of all 215 pedigreedog breeds currently recognised by the UK Kennel Club,over the period 1980 to 2014.For all breeds, the trend was for the rate of inbreeding
to be highest in the 1980s and 1990s, representing amajor contraction in genetic diversity. Since 2000 how-ever, the general trend has been for the rate of inbreed-ing to decline to sustainable levels, with some modestrestoration of genetic diversity in some cases. It is inter-esting that this coincides with the relaxation of the UK’squarantine laws, and is possibly due to the more wide-spread use of non-UK animals for breeding. The rate ofinbreeding (or effective population size) showed no rela-tionship with the actual population size, as judged bymean number of KC registrations. Evidence of popular
* Correspondence: [email protected] Kennel Club, 1-5 Clarges Street, Piccadilly, London W1J 8AB, UK2School of Veterinary Medicine and Science, The University of Nottingham,Sutton Bonington Campus, Sutton Bonington, Leicestershire LE12 5RD, UK
© 2015 Lewis et al. Open Access This article is distributed under the terms of the Creative Commons Attribution 4.0International License (http://creativecommons.org/licenses/by/4.0/), which permits unrestricted use, distribution, andreproduction in any medium, provided you give appropriate credit to the original author(s) and the source, provide alink to the Creative Commons license, and indicate if changes were made. The Creative Commons Public DomainDedication waiver (http://creativecommons.org/publicdomain/zero/1.0/) applies to the data made available in thisarticle, unless otherwise stated.
Lewis et al. Canine Genetics and Epidemiology (2015) 2:13 DOI 10.1186/s40575-015-0027-4

sires was common in all breeds. Popular sires make largegenetic contributions to subsequent generations and arethe biggest influence on the rate of inbreeding. Therewas variation among breeds in the trend of rate of in-breeding over the period 1980-2014. Reports detailingresults of the population analysis for each individual breedare publically available at: http://www.thekennelclub.or-g.uk/vets-researchers/publications,-statistics-and-health-results/breedpopulation-analyses.
BackgroundIt is widely believed that pedigree dogs are very inbred,due to closed registries and breeding practices, and thatthis has had a detrimental effect on the health and wel-fare of many pedigree breeds. Indeed studies have empir-ically determined a large depletion in genetic diversity insome pedigree dogs breeds [1–3], and many breeds dosuffer a high burden of genetic disease [4].Inbreeding is unavoidable in finite populations, since the
number of ancestors increases exponentially per generation(2n, where n is the generation, i.e. 2 parents, 4 grand-parents, 8 great-grand-parents, and so on). This veryquickly leads to an unfeasible number of unrelated ances-tors at the nth generation, implying common ancestry andso inbreeding. Where there is common ancestry the prob-ability that both alleles inherited by an individual are copiesof a single allele from a common ancestor to both parentsis >0. The coefficient of inbreeding (F) is this probability,and F for an individual will be higher if there are morecommon ancestors and in more recent generations. Giventhat all individuals carry mutant deleterious alleles, many ofwhich when inherited in duplicate can result in loss offunction, F describes the risk to an individual. A high levelof inbreeding also has detrimental effects on the widerpopulation, resulting in the loss of genetic variation, loss ofheterozygosity, possible effects of inbreeding depression,and a higher rate of spread of deleterious alleles [5].However, what is less widely understood is the fundamen-
tal relationship between inbreeding and selection. The rateof inbreeding (ΔF, how quickly F rises over generations) andgenetic gain (the change in mean genetic liability across gen-erations in response to selection) have been shown to be re-lated by the theory of genetic contributions [6–8]. Thisintrinsic relationship means that a response to selection,elicited by a departure from random mating, cannot beachieved without concomitant ΔF being >0, indicatingsome loss of genetic diversity. Therefore, given that avoid-ance of co-ancestry in finite populations is impossible andthe necessity of selection to provide a widespread and last-ing improvement in welfare where there is inherited dis-ease, management of ΔF at sustainable levels is key.While F may be considered to describe the risk to an
individual from the detrimental effects of inbreeding, ef-fective management of ΔF goes beyond simply seeking
to minimise F of future offspring [5]. An apposite, al-though extreme, hypothetical example would be the re-peated use of an unrelated sire to all females in a smallbreeding population. While the progeny of such matingswould all have F = 0, they would all be half siblings, andthe subsequent generation produced from them wouldall have F = 0.125. ΔF over the generation from progenyto grand-progeny of the unrelated sire would also be0.125. This example also demonstrates how popularsires, those making a large genetic contribution to thepopulation, have a major influence on ΔF.ΔF is often expressed as the effective population size, Ne
(see Methods), which is defined by Hill and Zhang [9] as“the size of an idealised population with the same incre-ment in drift or inbreeding per generation [as is ob-served]”. The rate of loss of genetic diversity within abreed or population increases dramatically when Ne <100[10], while a population with Ne <50 is considered to be athigh risk of the detrimental effects of inbreeding [11].Therefore, ΔF and Ne can be used to determine the his-tory and sustainability of populations and inform appro-priate breeding strategies where the aims are geneticimprovement and the conservation of genetic resources.The objective of this study was to report the results of
population analyses determining genetic parameters (ΔFand Ne) and population dynamics, such as number of regis-trations and the extent of popular sire usage, over the period1980–2014 for all 215 breeds currently recognised by theUK Kennel Club. Statistics are reported for the wholeperiod, and over seven 5-year blocks (1980–1984, 1985–1989, 1990–1994, 1995–1999, 2000–2004, 2005–2009,2010–2014) to determine variations within an overall trend.
ResultsReports of available results for all 215 breeds recognised bythe Kennel Club are publically available at http://www.thekennelclub.org.uk/vets-researchers/publications,-statistics-and-health-results/breed-population-analyses.Where registrations for a breed have consistently beensmall (e.g. Komondor) or have recently risen from zeroover the majority of the period 1980–2014 (e.g. TurkishKangal Dog), partial reports are given.
OverviewRegistrationsWhile identification of the causes of large changes inthe number of registrations in a breed over 1980–2014is beyond the remit of this investigation, these unknowndrivers of breed popularity may also have had an impacton breeding strategies and so may be of interest. A plotof number of registrations per year of birth over theperiod 1980–2014 is included in reports for all breeds.Notable breeds with large increases in popularity, as
Lewis et al. Canine Genetics and Epidemiology (2015) 2:13 Page 2 of 10
determined by number of registered animals per year ofbirth, include the Pug (regression coefficient of numberregistered on year = 194.8, s.e. 24.24), Dogue de Bor-deaux (94.8, s.e. 9.44) and French Bulldog (127.4, s.e.28.07); while those exhibiting large decreases in regis-trations include the Yorkshire Terrier (−381.8, s.e.75.80), Rough Collie (−131.6, s.e. 12.70) and Dobermann(−149.8, s.e. 31.77). However, examination of individualbreed plots of registrations on year of birth reveal dis-tinct trends within the period 1980–2014 in many cases.
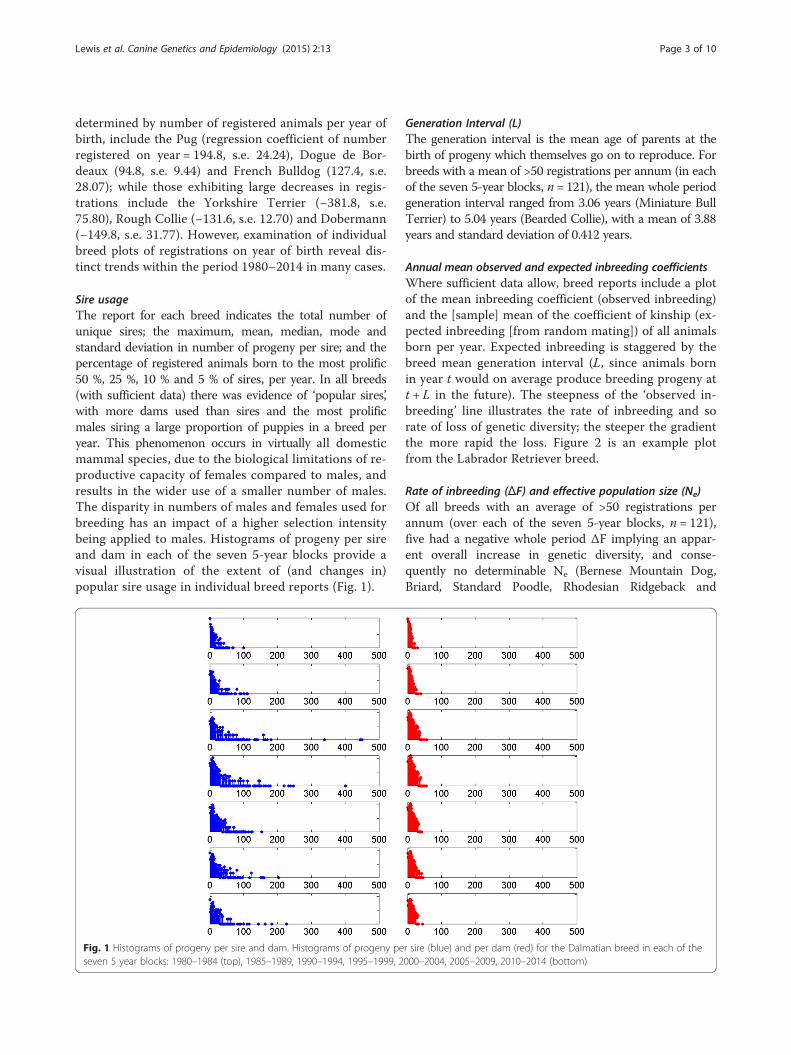
Sire usageThe report for each breed indicates the total number ofunique sires; the maximum, mean, median, mode andstandard deviation in number of progeny per sire; and thepercentage of registered animals born to the most prolific50 %, 25 %, 10 % and 5 % of sires, per year. In all breeds(with sufficient data) there was evidence of ‘popular sires’,with more dams used than sires and the most prolificmales siring a large proportion of puppies in a breed peryear. This phenomenon occurs in virtually all domesticmammal species, due to the biological limitations of re-productive capacity of females compared to males, andresults in the wider use of a smaller number of males.The disparity in numbers of males and females used forbreeding has an impact of a higher selection intensitybeing applied to males. Histograms of progeny per sireand dam in each of the seven 5-year blocks provide avisual illustration of the extent of (and changes in)popular sire usage in individual breed reports (Fig. 1).
Generation Interval (L)The generation interval is the mean age of parents at thebirth of progeny which themselves go on to reproduce. Forbreeds with a mean of >50 registrations per annum (in eachof the seven 5-year blocks, n = 121), the mean whole periodgeneration interval ranged from 3.06 years (Miniature BullTerrier) to 5.04 years (Bearded Collie), with a mean of 3.88years and standard deviation of 0.412 years.
Annual mean observed and expected inbreeding coefficientsWhere sufficient data allow, breed reports include a plotof the mean inbreeding coefficient (observed inbreeding)and the [sample] mean of the coefficient of kinship (ex-pected inbreeding [from random mating]) of all animalsborn per year. Expected inbreeding is staggered by thebreed mean generation interval (L, since animals bornin year t would on average produce breeding progeny att + L in the future). The steepness of the ‘observed in-breeding’ line illustrates the rate of inbreeding and sorate of loss of genetic diversity; the steeper the gradientthe more rapid the loss. Figure 2 is an example plotfrom the Labrador Retriever breed.
Rate of inbreeding (ΔF) and effective population size (Ne)Of all breeds with an average of >50 registrations perannum (over each of the seven 5-year blocks, n = 121),five had a negative whole period ΔF implying an appar-ent overall increase in genetic diversity, and conse-quently no determinable Ne (Bernese Mountain Dog,Briard, Standard Poodle, Rhodesian Ridgeback and
Fig. 1 Histograms of progeny per sire and dam. Histograms of progeny per sire (blue) and per dam (red) for the Dalmatian breed in each of theseven 5 year blocks: 1980–1984 (top), 1985–1989, 1990–1994, 1995–1999, 2000–2004, 2005–2009, 2010–2014 (bottom)
Lewis et al. Canine Genetics and Epidemiology (2015) 2:13 Page 3 of 10

Tibetan Terrier). Of the 116 remaining breeds, the Ne
calculated over the period 1980–2014 ranged from 23.8(Manchester Terrier) to 918.8 (Borzoi). Of these 116breeds, 68 had Ne of <100, with 29 having Ne of <50. Ascatter plot of Ne calculated over the period 1980–2014on mean annual registrations over the same period for
the 116 breeds where Ne was determinable is shown inFig. 3. There was no statistically significant associationbetween Ne and census population size as measured bymean registrations.A table detailing the whole period rate of inbreeding
per annum, L and Ne for the 121 breeds with an average
Fig. 2 Observed and expected inbreeding coefficient. Plot of observed mean inbreeding coefficient (blue) and mean inbreeding coefficientexpected from random mating (red) on year of birth for the Labrador Retriever breed. The ‘bleeding’ around the expected inbreeding lineindicates the standard deviation of 10 sample mean kinship coefficients of 50 individuals (see methods)
Fig. 3 Scatter plot of effective population size on mean registrations per year. Scatter plot of whole period (1980–2014) effective population size (Ne) onmean annual number of registrations for all 116 breeds with an average of >50 registrations in each of the seven 5-year blocks (1980–1984 to 2010–2014)and determinable Ne. The black dashed line indicates Ne of 100, and the red dashed line Ne of 50. Note both axes are on a logarithmic scale
Lewis et al. Canine Genetics and Epidemiology (2015) 2:13 Page 4 of 10

of >50 registrations per annum over each of the seven5-year blocks is shown in Additional file 1. The samestatistics, where meaningful due to sufficient data, andthe average number of registrations per year over eachof the seven 5-year blocks for the remaining 94 breedsis shown in Additional file 2.
Across breed general trends between 5-year blocksWhere there are sufficient data a table displaying sireand dam usage statistics and genetic parameters overeach of the seven 5-year blocks is included in breed re-ports. The mean rate of inbreeding (per generation, ΔF)over all breeds with an average of >50 registrations perannum in each of the seven 5-year blocks differed sig-nificantly over the blocks (P < 0.001, ANOVA). Fig. 4shows a clear declining trend in across breed mean ΔFover successive 5-year blocks, revealing that the greatestdecline in genetic diversity (when ΔF is largest) acrossbreeds occurred in the 1980s and 1990s. Since 2000 thegeneral trend in ΔF has been negative, implying an ap-parent increase in genetic diversity.A general increase in the generation interval (L)
from the 1980s to the 1990s onwards was observed(Fig. 5, P < 0.001, ANOVA). This may partially ac-count for the declining general trend in mean ΔF inthe periods 1980–1984 and 1985–1989, where the differ-ence in L is greatest. Mean L is not significantly differentover blocks 1990–1994 to 2010–2014 (P = 0.42, ANOVA).This observation implies that the continued decliningtrend in mean ΔF is not solely due to changes in L, and sois in part due to additional changes in breeding practice.
Contrast between numerically small and large breedsComparison of the mean rate of inbreeding (per gener-ation, ΔF) for 28 vulnerable native breeds (VNBs, ≤300registrations in 2014, http://www.thekennelclub.org.uk/getting-a-dog-or-puppy/finding-the-right-dog/vulnerable-native-breeds/) and the 20 most common breeds (listedin Additional file 3) over the period 1980–2014 (Figs. 6and 7 respectively) show the same trend of generally de-clining mean ΔF over the seven 5-year blocks. However,the magnitude of the change in mean ΔF is greater forthe VNBs, with higher mean ΔF in block 1980–1984 andlower in 2010–2014 than the across breed average(Fig. 4), with the reverse occurring for the 20 most com-mon breeds.
DiscussionIt is hoped that the public availability of population ana-lysis reports for all 215 breeds currently recognised bythe Kennel Club will enable breeders and other stake-holders to achieve a better understanding of the uniquesituation facing each breed. Both the descriptors ofpopulation dynamics (i.e. number of registrations, num-ber of sires used etc.) and the genetic parameters (i.e. ΔFand Ne) inform of the recent breed history and of thenecessary considerations framing potential breedingstrategies in the future. Different breeds with varyingdynamics and levels of genetic diversity will have dif-ferent options available in balancing meeting selectionobjectives and maintaining a sustainable ΔF. The breed re-ports are intended to provide a backdrop to discussionsover the best approaches.
Fig. 4 Mean rate of inbreeding per 5 year block. Mean rate of inbreeding per generation (ΔF) for breeds with an average of >50 registrations peryear per 5 year block (n = 121), for each of the 5 year periods from 1980–2014. Error bars indicate the standard error of the mean
Lewis et al. Canine Genetics and Epidemiology (2015) 2:13 Page 5 of 10

The plot of observed inbreeding for Labrador Re-trievers (Fig. 2) is fairly typical of the profile of mostbreeds, with a steep incline in the 1980s gradually flat-tening to present, and in some breeds even recently de-clining. This corresponds to the general trend detectedacross all breeds (with sufficient numbers registered) ofa high ΔF in the 1980s and 1990s, followed by a generaldecline to a negative ΔF latterly (Fig. 4, where the magni-tude of the bars relates to the gradient of ‘observed
inbreeding’ in Fig. 2). The across breeds mean ΔF in theblocks 1980–1984, 1985–1989, 1990–1994 and 1995–1999all far exceed the recommended maximum of 0.01 per gen-eration, above which the detrimental consequences of in-breeding are expected to be observed (i.e. Ne < 50; [11]).Thus, general breeding practices in the 1980s and 1990sappear to have resulted in a major contraction of withinbreed genetic diversity, while practices latterly have, tosome extent, ameliorated this. The UK quarantine laws
Fig. 5 Mean generation interval per 5 year block. Mean generation interval (L) for breeds with an average of >50 registrations per year per 5 yearblock (n = 121), for each of the 5 year blocks from 1980–2014. Error bars indicate the standard error of the mean
Fig. 6 Mean rate of inbreeding per 5 year block of vulnerable native breeds. Mean rate of inbreeding per generation for vulnerable native breeds,for each of the 5 year periods from 1980–2014. Error bars indicate the standard error of the mean
Lewis et al. Canine Genetics and Epidemiology (2015) 2:13 Page 6 of 10
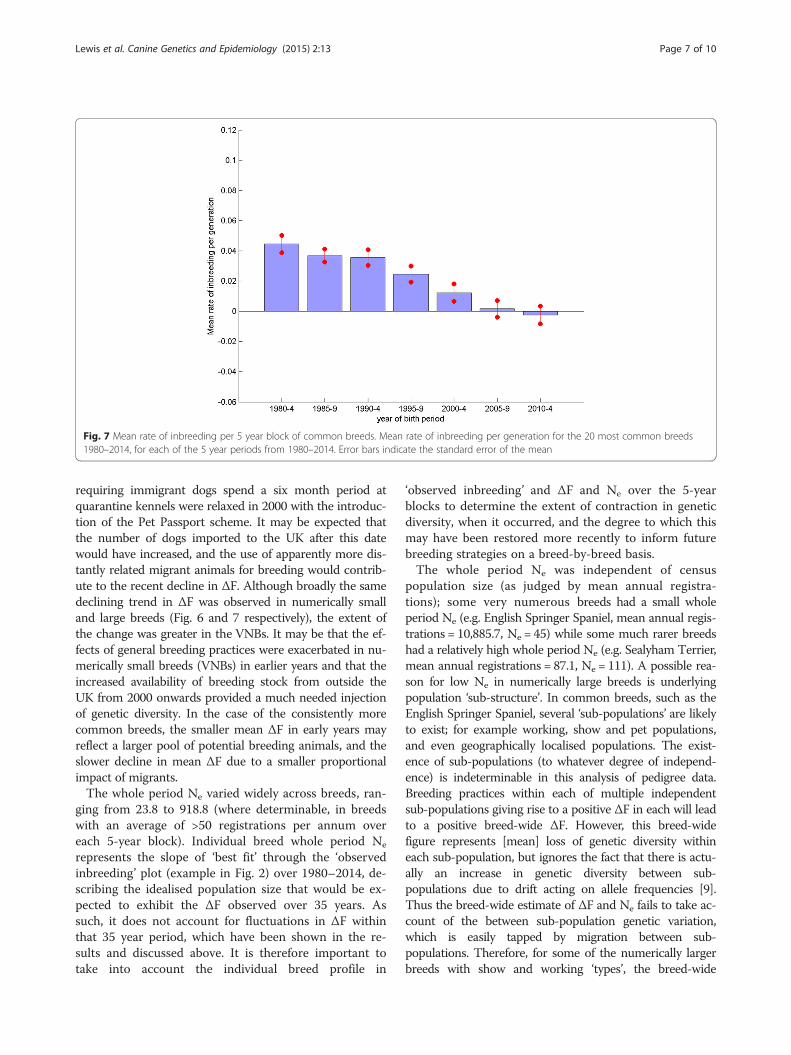
requiring immigrant dogs spend a six month period atquarantine kennels were relaxed in 2000 with the introduc-tion of the Pet Passport scheme. It may be expected thatthe number of dogs imported to the UK after this datewould have increased, and the use of apparently more dis-tantly related migrant animals for breeding would contrib-ute to the recent decline in ΔF. Although broadly the samedeclining trend in ΔF was observed in numerically smalland large breeds (Fig. 6 and 7 respectively), the extent ofthe change was greater in the VNBs. It may be that the ef-fects of general breeding practices were exacerbated in nu-merically small breeds (VNBs) in earlier years and that theincreased availability of breeding stock from outside theUK from 2000 onwards provided a much needed injectionof genetic diversity. In the case of the consistently morecommon breeds, the smaller mean ΔF in early years mayreflect a larger pool of potential breeding animals, and theslower decline in mean ΔF due to a smaller proportionalimpact of migrants.The whole period Ne varied widely across breeds, ran-
ging from 23.8 to 918.8 (where determinable, in breedswith an average of >50 registrations per annum overeach 5-year block). Individual breed whole period Ne
represents the slope of ‘best fit’ through the ‘observedinbreeding’ plot (example in Fig. 2) over 1980–2014, de-scribing the idealised population size that would be ex-pected to exhibit the ΔF observed over 35 years. Assuch, it does not account for fluctuations in ΔF withinthat 35 year period, which have been shown in the re-sults and discussed above. It is therefore important totake into account the individual breed profile in
‘observed inbreeding’ and ΔF and Ne over the 5-yearblocks to determine the extent of contraction in geneticdiversity, when it occurred, and the degree to which thismay have been restored more recently to inform futurebreeding strategies on a breed-by-breed basis.The whole period Ne was independent of census
population size (as judged by mean annual registra-tions); some very numerous breeds had a small wholeperiod Ne (e.g. English Springer Spaniel, mean annual regis-trations = 10,885.7, Ne = 45) while some much rarer breedshad a relatively high whole period Ne (e.g. Sealyham Terrier,mean annual registrations = 87.1, Ne = 111). A possible rea-son for low Ne in numerically large breeds is underlyingpopulation ‘sub-structure’. In common breeds, such as theEnglish Springer Spaniel, several ‘sub-populations’ are likelyto exist; for example working, show and pet populations,and even geographically localised populations. The exist-ence of sub-populations (to whatever degree of independ-ence) is indeterminable in this analysis of pedigree data.Breeding practices within each of multiple independentsub-populations giving rise to a positive ΔF in each will leadto a positive breed-wide ΔF. However, this breed-widefigure represents [mean] loss of genetic diversity withineach sub-population, but ignores the fact that there is actu-ally an increase in genetic diversity between sub-populations due to drift acting on allele frequencies [9].Thus the breed-wide estimate of ΔF and Ne fails to take ac-count of the between sub-population genetic variation,which is easily tapped by migration between sub-populations. Therefore, for some of the numerically largerbreeds with show and working ‘types’, the breed-wide
Fig. 7 Mean rate of inbreeding per 5 year block of common breeds. Mean rate of inbreeding per generation for the 20 most common breeds1980–2014, for each of the 5 year periods from 1980–2014. Error bars indicate the standard error of the mean
Lewis et al. Canine Genetics and Epidemiology (2015) 2:13 Page 7 of 10

whole period Ne may belie the amount of true within breedgenetic diversity.Although the lack of complete pedigree data beyond a
certain number of generations for migrant animals ham-pers the ability to fully determine co-ancestry where itdoes exist (therefore potentially underestimating ΔF andNe for breeds making wide use of imported animals), theprinciple outlined above also applies to breed popula-tions in different countries. Even where such migrantanimals originally trace back to the UK (for example theEnglish Setter), populations which have existed in semi-isolation in different countries will be subject to theeffects of drift, potentially increasing genetic diversitybetween sub-populations while it simultaneously de-clines within each. However, to what degree the increasein between sub-population diversity counteracts the po-tential underestimation of ΔF and Ne due to incompletepedigree information is unknown.The sustainable ΔF and Ne observed in some numeric-
ally smaller breeds (e.g. Dandie Dinmont Terrier, CardiganWelsh Corgi, Sealyham Terrier, Bloodhound) would ap-pear to be related to the effective management of geneticdiversity. The plots of observed and expected inbreedingin these breeds show small divergence between the two,implying only a slight departure from random mating(Additional file 4: Figure S1). This may be due to height-ened breeder awareness of the importance of conservinggenetic diversity in numerically small populations. How-ever, in some cases where the breed is numerically small,effective management of genetic diversity may not beenough. Otterhound breeders appear to have been man-aging genetic diversity as effectively as possible over1980–2014 (judged by the conformity of the plots of ob-served and expected inbreeding), and so the high ΔF andlow Ne observed may be due to small actual populationsize (Additional file 5: Figure S2). There are methodswhich achieve lower ΔF than predicted via random matingwhich may be useful in the preservation of genetic diver-sity, for example negative assortative mating and optimumselection techniques where weighting is only placed onminimising ΔF [12, 13]. However, these methods rely ontightly co-ordinated decisions being made on breeding an-imals, which is unlikely even in the rarest of breeds.Furthermore, preserving genetic diversity (via a sustain-
able ΔF) is a single, albeit important, objective amongmany in the promotion of health and welfare in dogbreeds. Many breeds face significant welfare problems dueto a high burden of inherited disease [4] and extreme con-formation [14], for which a lasting and widespread im-provement can only be achieved via selection. Selectionrequires genetic variation to be present within the popula-tion meaning that the desired response will be more diffi-cult to achieve in populations with a high ΔF. Partialrestoration of genetic variation will occur via mutation,
but the rate is of mutation is small, the genomic locationrandom and there is strong selection pressure against mu-tations in coding regions of the genome, where mutationslead to malfunction or loss of function. Therefore, wheregenetic variation is depleted in a population, migration ofbreeding animals from a different population is the onlypractical means of regeneration to enable selection. Selec-tion and inbreeding have been demonstrated to be funda-mentally related via genetic contributions [6–8], meaningthat balancing the competing objectives of genetic gainand sustainable ΔF is vital to the welfare and sustainabilityof many breeds. The intrinsic relationship between selec-tion and inbreeding means that in numerically largerbreeds the ΔF observed in these analyses could be consid-ered to be a ‘signature’ of selection, although the objectivesand traits under selection remain unknown. Therefore,breeds with very low Ne despite moderate to high meanregistrations per year (e.g. Airedale Terrier, Bearded Collie,Irish Setter, Yorkshire Terrier; Additional file 6: Figure S3)might be considered to have been subject to relatively in-tense selection over the past 35 years.While the use of inbreeding coefficients to derive ΔF
in a breed or population provides a useful indication ofpast practice, they remain a retrospective measure ofco-ancestry. Well-intentioned but widespread use ofunrelated animals in breeding programmes in an at-tempt to increase genetic diversity, while reducing meanF in the next generation, can lead to such individualsbecoming popular sires. Popular sires make a large gen-etic contribution to future generations of the breed, andare therefore the major contributor to a high ΔF oversubsequent generations [15]. Breeders of pedigreebreeds making particular use of migrant animals mustbe aware of this. Using a greater proportion of males forbreeding will help mitigate the effect popular sires haveon ΔF, but the common practice of substituting aknown popular sire with a close male relative in a po-tential mating will have limited impact on minimisingrises in future ΔF, due to shared genetics. The monitor-ing of genetic contributions may allow prospective iden-tification of potential over-popular sires and relatives,and research into how such a strategy may be tailoredto dog breeding is ongoing [16].
ConclusionsThe general trend detected across breeds was that ΔFwas highest in the 1980s and 1990s, implying a high rateof loss of genetic diversity within most breeds. However,since 2000 ΔF tends to have decreased, even becomingnegative in some cases, indicating a slowing of the rateof loss or even some moderate restoration of geneticvariation. This change in trend may have been influ-enced by the increased availability of migrants sincechanges to UK quarantine laws in 2000.
Lewis et al. Canine Genetics and Epidemiology (2015) 2:13 Page 8 of 10
Most breeds show extensive use of popular sires. Thetheory of genetic contributions, which demonstrates thefundamental relationship of inbreeding and selection,implies that popular sires are the major contributor tohigh ΔF. Breeders should guard against the over-use ofsires as a strategy to maintain sustainable ΔF in thebreed.
MethodsAll electronically recorded pedigree data held by theKennel Club was used to determine population statisticsper year from 1980–2014 for each of the 215 recognisedbreeds (data extracted 9th February 2015).
Number of registrationsThe number of registered animals born per year was re-corded, and (where sufficient numbers justified) regressedon year of birth, the regression coefficient describing theoverall trend in breed registrations over the 35 year period.
Variation in sire usageOver each year 1980–2014 the total number of uniquesires used was determined, and the maximum, mean,median, mode and standard deviation in number of pro-geny per sire computed. The percentage of registeredanimals born per year to the most prolific 50 %, 25 %,10 % and 5 % of sires was calculated to describe the ex-tent of ‘popular sire’ usage in each breed.
Generation intervalThe generation interval is the mean age of parents at thebirth of progeny which themselves go on to reproduce[17]. The mean age in days of sires and of dams at the birthof breeding progeny born in each year 1980–2014 was cal-culated. The overall breed mean generation interval (L)was computed as the mean of generation intervals calcu-lated per year from 1980–2014, and is quoted in years.
Genetic diversityInbreeding coefficients for all animals in each breed pedi-gree were calculated using the algorithm of Meuwissenand Luo [18]. Mean inbreeding coefficients for all animalsborn in each year were computed, and plotted against yearof birth. The rate of inbreeding per annum was calculatedas the regression coefficient of ln(1-Ft) on year of birth,where Ft is the mean inbreeding coefficient of animalsborn in year t. The rate of inbreeding per annum wasmultiplied by the breed mean generation interval (L) toobtain the rate of inbreeding per generation (ΔF). The ef-fective population size (Ne) was calculated for each breedover the period 1980–2014 as (2 ΔF)−1 [5].The coefficient of kinship between two animals is
equal to the inbreeding coefficient of offspring of thosetwo animals [19]. Thus, mean kinship coefficient of all
or a random sample of animals yields an estimate ofmean inbreeding coefficient from random mating. An-nual estimates of mean kinship coefficient (1980–2014)were termed ‘expected inbreeding’ and plotted alongside‘observed inbreeding’, staggered by breed generationinterval (L, since animals born in year t would on aver-age produce breeding progeny at t + L in the future).Calculation of coefficient of kinship per year of birth iscomputationally intensive for large populations, sincethe number of calculations is ½(n2-n) (where n is thenumber of animals in the sample) and so the methodused was dependent on the number of animals born in aparticular year. Where ≤500 animals were born in a par-ticular year, all kinships were calculated and the meancomputed. Where >500 and ≤2000 animals were bornin a year, kinships of a single, random sample of 500animals were calculated and the mean computed.Where >2000 animals were born in a year, kinshipswere calculated for 10 samples of 50 randomly selectedanimals. The overall mean and standard deviation ofthe 10 sample means were calculated. In this final sce-nario, the standard deviation of samples mean kinshipsis indicated by the ‘bleeding’ of the line denoting ex-pected inbreeding.
Differences between 5-year blocks within the period1980–2014The statistics described above were also calculated overseven 5-year blocks (1980–1984, 1985–1989, 1990–1994,1995–1999, 2000–2004, 2005–2009, 2010–2014) to pro-vide more detail of changing trends within the overall 35year period. Where the numerical size of the breed suf-ficed (mean of >50 registrations per annum in each ofthe seven 5-year blocks), differences in across breedsmean ΔF and L between the 5-year blocks were testedfor statistical significance using ANOVA, which wouldindicate a change in general (across breed) trends.
Additional files
Additional file 1: Whole period (1980–2014) rate of inbreeding perannum (multiply by 100 for percentage), mean generation interval (L)and effective population size (Ne) for the 121 breeds with an averageof >50 registrations in each of the seven 5-year blocks 1980–1984,1985–1989, 1990–1994, 1995–1999, 2000–2004, 2005–2009,2010–2014. ‘n/a’ indicates a declining rate of inbreeding (increasinggenetic diversity), meaning effective population size is incalculable.(DOCX 22 kb)
Additional file 2: Whole period (1980–2014) rate of inbreeding perannum (dF, multiply by 100 for percentage), mean generationinterval (L), effective population size (Ne) and mean registrationsover the seven 5-year blocks (1980–1984, 1985–1989, 1990–1994,1995–1999, 2000–2004, 2005–2009, 2010–2014) for the 94 breedswith an average of <50 registrations in at least one of those blocks.‘n/a’ in columns dF, L and Ne indicates too few data to yield meaningfulresults. ‘n/a’ in the Ne column only indicates a negative rate of
Lewis et al. Canine Genetics and Epidemiology (2015) 2:13 Page 9 of 10
inbreeding over the whole period, meaning Ne is indeterminable.(DOCX 32 kb)
Additional file 3: List of Vulnerable Native Breeds (VNBs) as of 2014and the 20 most common breeds over the period 1980–2014.(DOCX 19 kb)
Additional file 4: Figure S1. The plots of observed and expectedinbreeding for four breeds showingsmall divergence between the two.(PNG 204 kb)
Additional file 5: Figure S2. Plot of observed and expected inbreedingfor the Otterhound breed, showingsmall divergence but a rise in both.(PNG 25 kb)
Additional file 6: Figure S3. The plots of observed and expectedinbreeding for four breeds showing a steeprise in observed inbreeding,and therefore a low effective population size (Ne). (PNG 183 kb)
Competing interestsTL and B-MA are employed by the Kennel Club. Part of the work towards thispaper was conducted while TL and SB were employed at the Animal HealthTrust and funded by the Kennel Club Charitable Trust.
Authors’ contributionsTL and SB first conceived the idea for the study. The analyses were designedby TL and SB, and executed by TL and B-MA. The paper was written by TLand B-MA. All authors have approved the final article.
Received: 18 June 2015 Accepted: 12 August 2015
References1. Leroy G, Rognon X, Varlet A, Joffrin C, Verrier E. Genetic variability in French
dog breeds assessed by pedigree data. J Anim Breed Genet. 2006;123:1–9.2. Calboli FCF, Sampson J, Fretwell N, Balding DJ. Population structure and
inbreeding from pedigree analysis of purebred dogs. Genetics. 2008;179:593–601.3. Maki K. Population structure and genetic diversity of worldwide Nova Scotia
Duck Tolling Retriever and Lancashire Heeler dog populations. J AnimBreed Genet. 2010;127:318–26.
4. Summers JF, Diesel G, Asher L, McGreevy PD, Collins LM. Inherited defectsin pedigree dogs. Part 2: Disorders that are not related to breed standards.Vet J. 2010;183:39–45.
5. Woolliams JA, Berg P, Dagnachew BS, Meuwissen THE. Genetic contributionsand their optimization. J Anim Breed Genet. 2015;132:89–99.
6. Wray NR, Thompson R. Prediction of rates of inbreeding in selectedpopulations. Genet Res. 1990;55:41–54.
7. Woolliams JA, Thompson R. A theory of genetic contributions. Proceedings5th World Congress Genet Appl Livestock Production. 1994;19:127–34.
8. Woolliams JA, Bijma P, Villanueva B. Expected genetic contributions andtheir impact on gene flow and genetic gain. Genetics. 1999;153:1009–20.
9. Hill WG, Zhang X-S. Genetic variation within and among animal populations.In: Simm G, Villanueva B, Sinclair KD, Townsend S, editors. Farm animal geneticresources. Nottingham: Nottingham University Press; 2004. p. 67–84.
10. Maijala K. Monitoring animal genetic resources and criteria for prioritizationof breeds. In: Hodges J, editor. The management of global animal geneticresources, Proceedings of an FAO expert consultation. Rome: AnimalProduction and Health Paper No. 104; 1992.
11. Woolliams JA, Gwaze DP, Meuwissen TH, Planchenault D, Renard JP, ThibierM, et al. Secondary guidelines for the development of national farm animalgenetic resources management plans – management of small populationsat risk, Food and agriculture organization of the United Nations. 1998.
12. Meuwissen TH. Maximizing the response of selection with a pre-definedrate of inbreeding. J Anim Sci. 1997;75:934–40.
13. Kinghorn BP. Mate selection by groups. J Dairy Sci. 1998;81:55–63.14. Asher L, Diesel G, Summers JF, McGreevy PD, Collins LM. Inherited defects
in pedigree dogs. Part 1: Disorders related to breed standards. Vet J.2009;182:402–11.
15. Leroy G, Baumung R. Mating practices and the dissemination of geneticdisorders in domestic animals, based on the example of dog breeding.Anim Genet. 2011;42:66–74.
16. Lewis TW, Blott SC, Howard DM, Woolliams JA. Building effective systems tomanage inbreeding in pedigree dog breeds. 10th World Congress on Genetics
Applied to Livestock Production. 2014; https://asas.org/docs/default-source/wcgalp-proceedings-oral/281_paper_9615_manuscript_777_0.pdf?sfvrsn=2
17. Falconer DS, Mackay TFC. Introduction to quantitative genetics. Harlow:Longman Group; 1996.
18. Meuwissen THE, Luo Z. Computing inbreeding coefficients in largepopulations. Genet Sel Evol. 1992;24:305–13.
19. Lynch M, Walsh B. Genetics and analysis of quantitative traits. Sunderland:Sinaur Associates; 1998.
Submit your next manuscript to BioMed Centraland take full advantage of:
• Convenient online submission
• Thorough peer review
• No space constraints or color figure charges
• Immediate publication on acceptance
• Inclusion in PubMed, CAS, Scopus and Google Scholar
• Research which is freely available for redistribution
Submit your manuscript at www.biomedcentral.com/submit
Lewis et al. Canine Genetics and Epidemiology (2015) 2:13 Page 10 of 10